Elmont, NY Map & Demographics
Elmont Map
Elmont Overview
$40,400
PER CAPITA INCOME
$122,617
AVG FAMILY INCOME
$115,691
AVG HOUSEHOLD INCOME
15.7%
WAGE / INCOME GAP [ % ]
84.3¢/ $1
WAGE / INCOME GAP [ $ ]
0.39
INEQUALITY / GINI INDEX
37,866
TOTAL POPULATION
19,080
MALE POPULATION
18,786
FEMALE POPULATION
101.56
MALES / 100 FEMALES
98.46
FEMALES / 100 MALES
38.2
MEDIAN AGE
3.9
AVG FAMILY SIZE
3.7
AVG HOUSEHOLD SIZE
21,670
LABOR FORCE [ PEOPLE ]
68.4%
PERCENT IN LABOR FORCE
7.6%
UNEMPLOYMENT RATE
Elmont Zip Codes
Elmont Area Codes
Income in Elmont
Income Overview in Elmont
Per Capita Income in Elmont is $40,400, while median incomes of families and households are $122,617 and $115,691 respectively.
| Characteristic | Number | Measure |
| Per Capita Income | 37,866 | $40,400 |
| Median Family Income | 8,737 | $122,617 |
| Mean Family Income | 8,737 | $151,277 |
| Median Household Income | 10,260 | $115,691 |
| Mean Household Income | 10,260 | $143,842 |
| Income Deficit | 8,737 | $0 |
| Wage / Income Gap (%) | 37,866 | 15.66% |
| Wage / Income Gap ($) | 37,866 | 84.34¢ per $1 |
| Gini / Inequality Index | 37,866 | 0.39 |
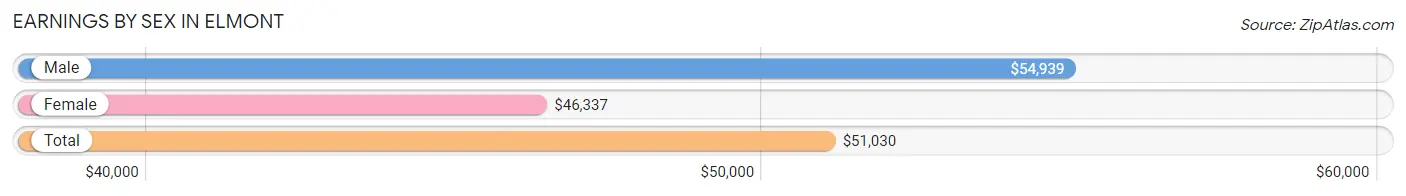
Earnings by Sex in Elmont
Average Earnings in Elmont are $51,030, $54,939 for men and $46,337 for women, a difference of 15.7%.
| Sex | Number | Average Earnings |
| Male | 11,572 (53.7%) | $54,939 |
| Female | 9,959 (46.3%) | $46,337 |
| Total | 21,531 (100.0%) | $51,030 |
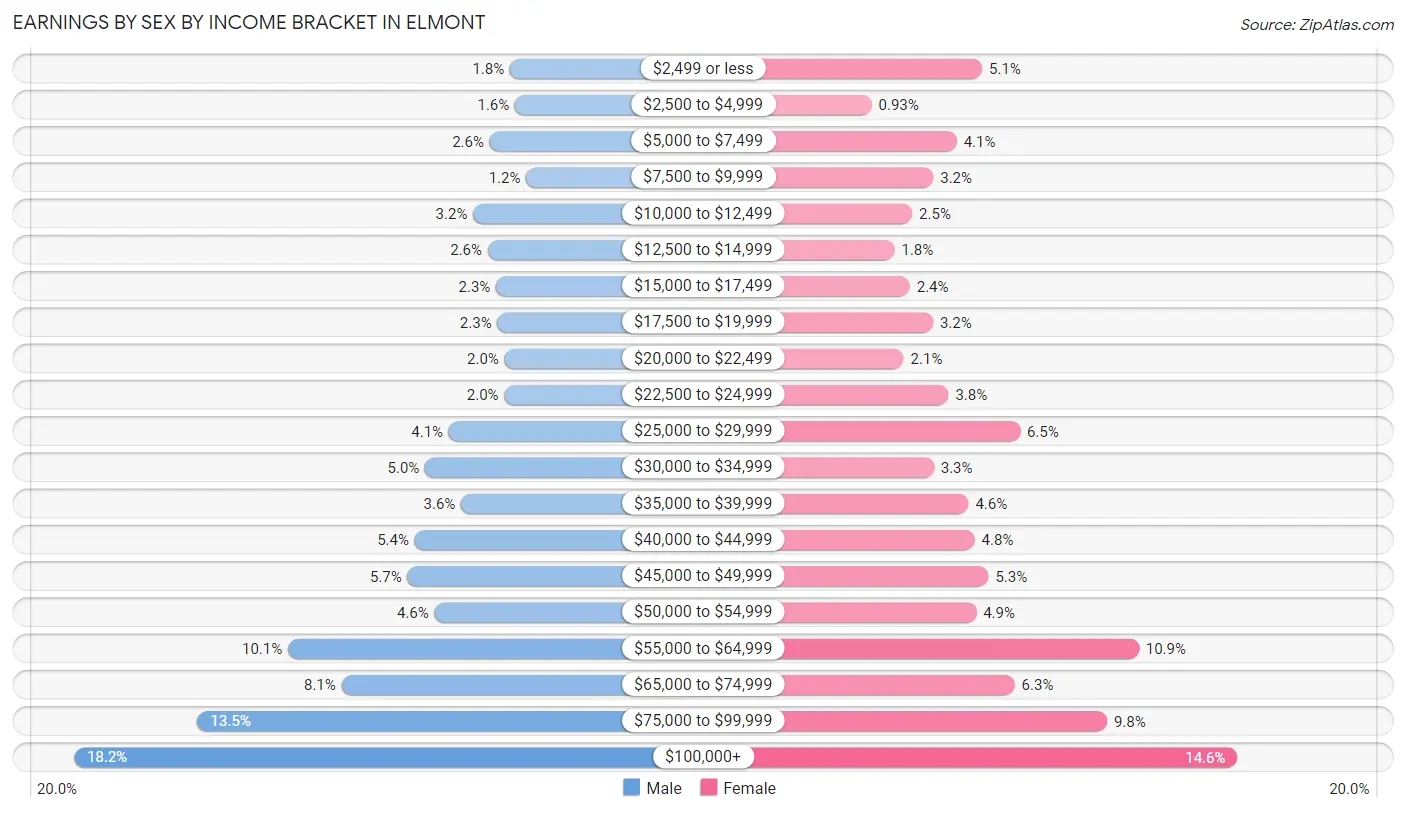
Earnings by Sex by Income Bracket in Elmont
The most common earnings brackets in Elmont are $100,000+ for men (2,100 | 18.1%) and $100,000+ for women (1,457 | 14.6%).
| Income | Male | Female |
| $2,499 or less | 210 (1.8%) | 505 (5.1%) |
| $2,500 to $4,999 | 187 (1.6%) | 93 (0.9%) |
| $5,000 to $7,499 | 297 (2.6%) | 410 (4.1%) |
| $7,500 to $9,999 | 139 (1.2%) | 323 (3.2%) |
| $10,000 to $12,499 | 369 (3.2%) | 244 (2.5%) |
| $12,500 to $14,999 | 306 (2.6%) | 178 (1.8%) |
| $15,000 to $17,499 | 270 (2.3%) | 235 (2.4%) |
| $17,500 to $19,999 | 264 (2.3%) | 322 (3.2%) |
| $20,000 to $22,499 | 233 (2.0%) | 212 (2.1%) |
| $22,500 to $24,999 | 234 (2.0%) | 379 (3.8%) |
| $25,000 to $29,999 | 474 (4.1%) | 646 (6.5%) |
| $30,000 to $34,999 | 577 (5.0%) | 325 (3.3%) |
| $35,000 to $39,999 | 421 (3.6%) | 454 (4.6%) |
| $40,000 to $44,999 | 623 (5.4%) | 477 (4.8%) |
| $45,000 to $49,999 | 654 (5.7%) | 529 (5.3%) |
| $50,000 to $54,999 | 537 (4.6%) | 483 (4.9%) |
| $55,000 to $64,999 | 1,172 (10.1%) | 1,090 (10.9%) |
| $65,000 to $74,999 | 940 (8.1%) | 626 (6.3%) |
| $75,000 to $99,999 | 1,565 (13.5%) | 971 (9.8%) |
| $100,000+ | 2,100 (18.1%) | 1,457 (14.6%) |
| Total | 11,572 (100.0%) | 9,959 (100.0%) |
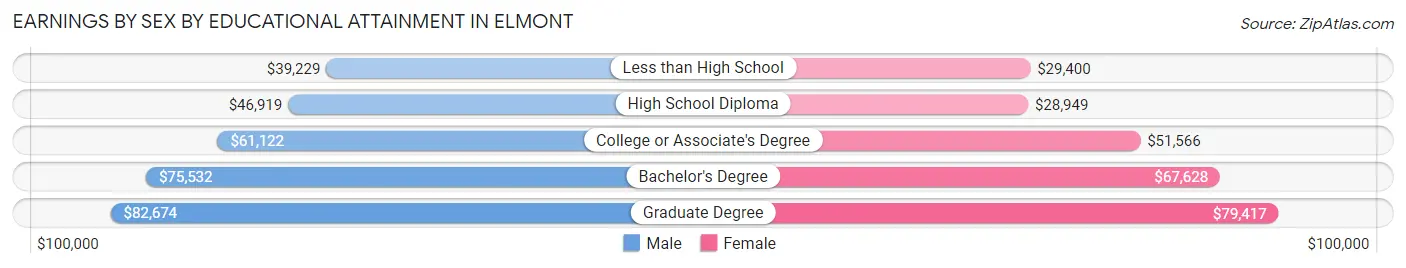
Earnings by Sex by Educational Attainment in Elmont
Average earnings in Elmont are $58,276 for men and $51,987 for women, a difference of 10.8%. Men with an educational attainment of graduate degree enjoy the highest average annual earnings of $82,674, while those with less than high school education earn the least with $39,229. Women with an educational attainment of graduate degree earn the most with the average annual earnings of $79,417, while those with high school diploma education have the smallest earnings of $28,949.
| Educational Attainment | Male Income | Female Income |
| Less than High School | $39,229 | $29,400 |
| High School Diploma | $46,919 | $28,949 |
| College or Associate's Degree | $61,122 | $51,566 |
| Bachelor's Degree | $75,532 | $67,628 |
| Graduate Degree | $82,674 | $79,417 |
| Total | $58,276 | $51,987 |
Family Income in Elmont
Family Income Brackets in Elmont
According to the Elmont family income data, there are 2,010 families falling into the $200,000+ income range, which is the most common income bracket and makes up 23.0% of all families. Conversely, the $10,000 to $14,999 income bracket is the least frequent group with only 26 families (0.3%) belonging to this category.
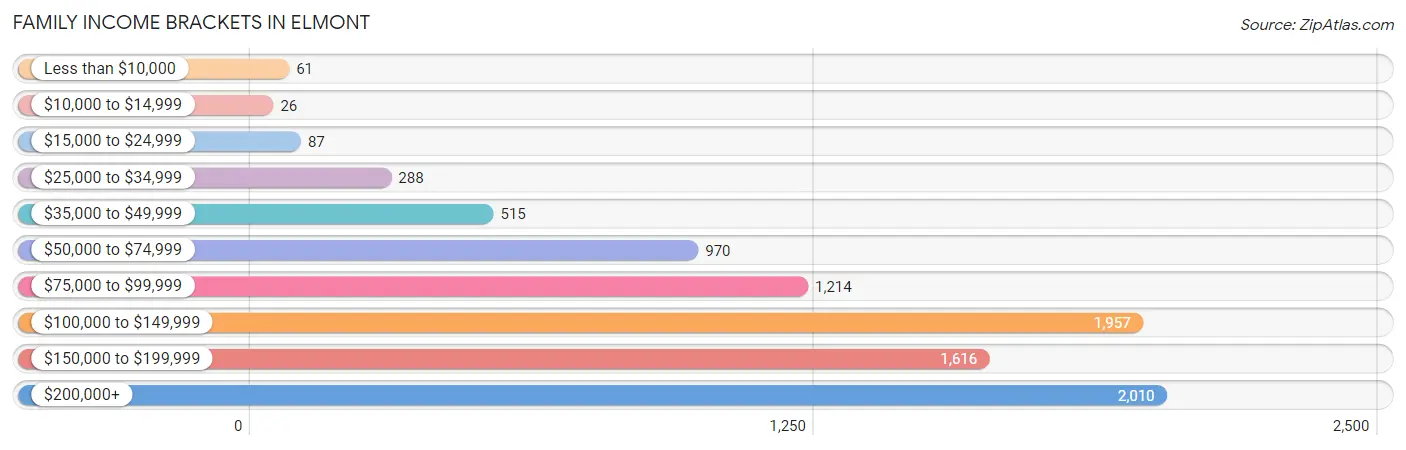
| Income Bracket | # Families | % Families |
| Less than $10,000 | 61 | 0.7% |
| $10,000 to $14,999 | 26 | 0.3% |
| $15,000 to $24,999 | 87 | 1.0% |
| $25,000 to $34,999 | 288 | 3.3% |
| $35,000 to $49,999 | 515 | 5.9% |
| $50,000 to $74,999 | 970 | 11.1% |
| $75,000 to $99,999 | 1,214 | 13.9% |
| $100,000 to $149,999 | 1,957 | 22.4% |
| $150,000 to $199,999 | 1,616 | 18.5% |
| $200,000+ | 2,010 | 23.0% |
Family Income by Famaliy Size in Elmont
7+ person families (466 | 5.3%) account for the highest median family income in Elmont with $193,293 per family, while 2-person families (1,925 | 22.0%) have the highest median income of $46,300 per family member.
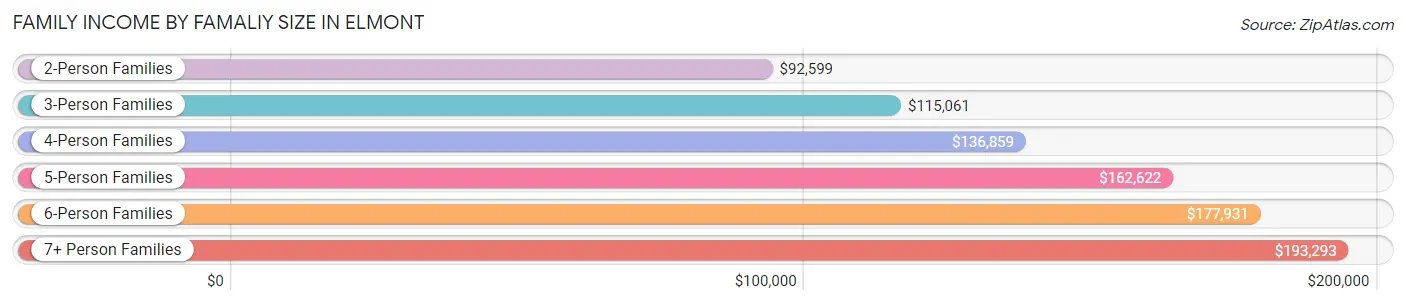
| Income Bracket | # Families | Median Income |
| 2-Person Families | 1,925 (22.0%) | $92,599 |
| 3-Person Families | 2,264 (25.9%) | $115,061 |
| 4-Person Families | 2,084 (23.8%) | $136,859 |
| 5-Person Families | 1,140 (13.1%) | $162,622 |
| 6-Person Families | 858 (9.8%) | $177,931 |
| 7+ Person Families | 466 (5.3%) | $193,293 |
| Total | 8,737 (100.0%) | $122,617 |
Family Income by Number of Earners in Elmont
The median family income in Elmont is $122,617, with families comprising 3+ earners (2,727) having the highest median family income of $190,785, while families with no earners (627) have the lowest median family income of $65,223, accounting for 31.2% and 7.2% of families, respectively.
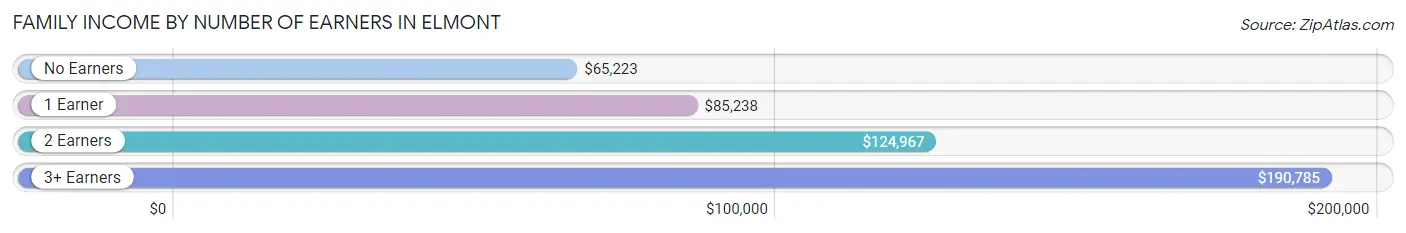
| Number of Earners | # Families | Median Income |
| No Earners | 627 (7.2%) | $65,223 |
| 1 Earner | 1,984 (22.7%) | $85,238 |
| 2 Earners | 3,399 (38.9%) | $124,967 |
| 3+ Earners | 2,727 (31.2%) | $190,785 |
| Total | 8,737 (100.0%) | $122,617 |
Household Income in Elmont
Household Income Brackets in Elmont
With 2,380 households falling in the category, the $200,000+ income range is the most frequent in Elmont, accounting for 23.2% of all households. In contrast, only 154 households (1.5%) fall into the $10,000 to $14,999 income bracket, making it the least populous group.
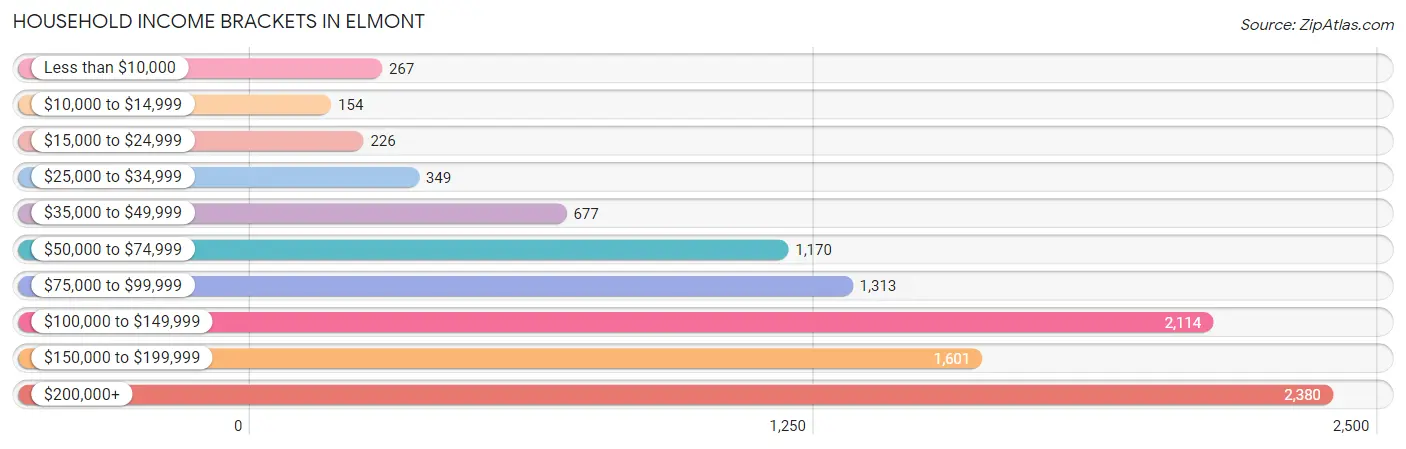
| Income Bracket | # Households | % Households |
| Less than $10,000 | 267 | 2.6% |
| $10,000 to $14,999 | 154 | 1.5% |
| $15,000 to $24,999 | 226 | 2.2% |
| $25,000 to $34,999 | 349 | 3.4% |
| $35,000 to $49,999 | 677 | 6.6% |
| $50,000 to $74,999 | 1,170 | 11.4% |
| $75,000 to $99,999 | 1,313 | 12.8% |
| $100,000 to $149,999 | 2,114 | 20.6% |
| $150,000 to $199,999 | 1,601 | 15.6% |
| $200,000+ | 2,380 | 23.2% |
Household Income by Householder Age in Elmont
The median household income in Elmont is $115,691, with the highest median household income of $125,433 found in the 25 to 44 years age bracket for the primary householder. A total of 2,685 households (26.2%) fall into this category. Meanwhile, the 65+ years age bracket for the primary householder has the lowest median household income of $87,532, with 2,668 households (26.0%) in this group.
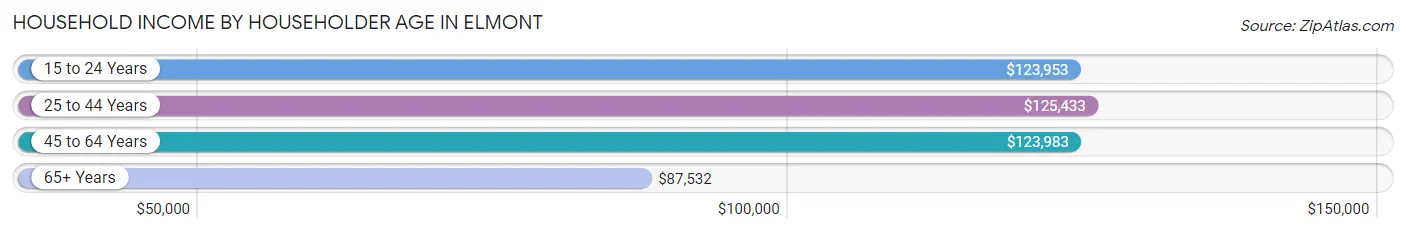
| Income Bracket | # Households | Median Income |
| 15 to 24 Years | 145 (1.4%) | $123,953 |
| 25 to 44 Years | 2,685 (26.2%) | $125,433 |
| 45 to 64 Years | 4,762 (46.4%) | $123,983 |
| 65+ Years | 2,668 (26.0%) | $87,532 |
| Total | 10,260 (100.0%) | $115,691 |
Poverty in Elmont
Income Below Poverty by Sex and Age in Elmont
With 3.5% poverty level for males and 5.2% for females among the residents of Elmont, 5 year old males and 75 year old and over females are the most vulnerable to poverty, with 42 males (15.9%) and 106 females (8.3%) in their respective age groups living below the poverty level.
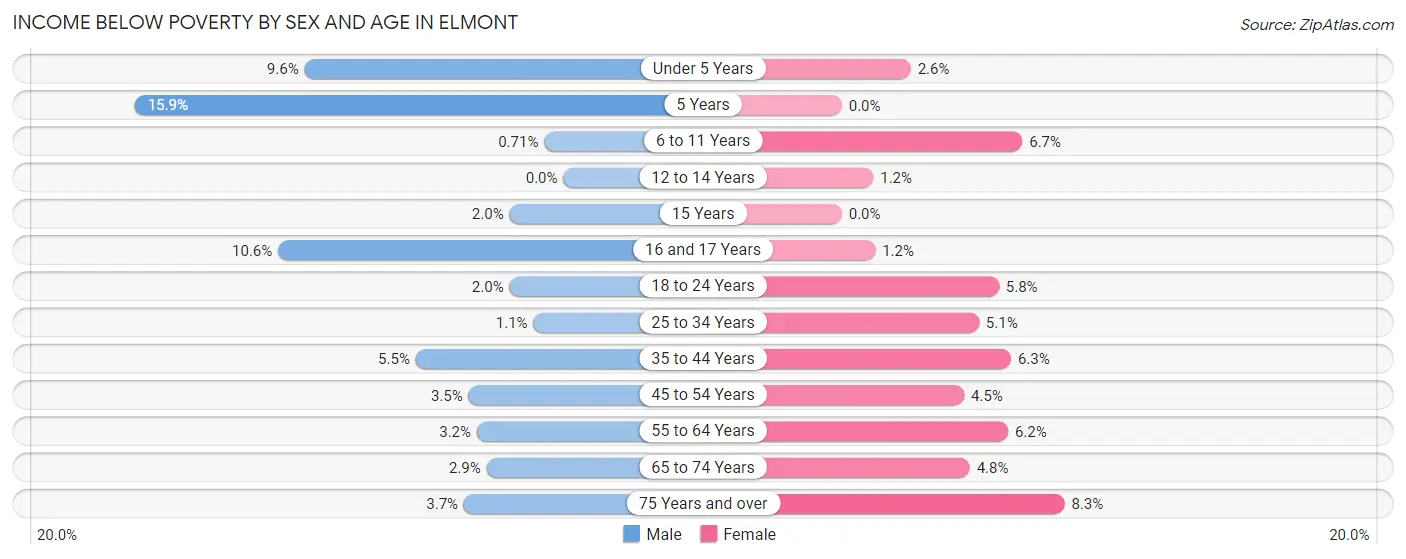
| Age Bracket | Male | Female |
| Under 5 Years | 93 (9.6%) | 27 (2.6%) |
| 5 Years | 42 (15.9%) | 0 (0.0%) |
| 6 to 11 Years | 7 (0.7%) | 50 (6.7%) |
| 12 to 14 Years | 0 (0.0%) | 8 (1.2%) |
| 15 Years | 2 (2.0%) | 0 (0.0%) |
| 16 and 17 Years | 72 (10.6%) | 3 (1.2%) |
| 18 to 24 Years | 37 (2.0%) | 107 (5.8%) |
| 25 to 34 Years | 37 (1.1%) | 156 (5.1%) |
| 35 to 44 Years | 133 (5.5%) | 155 (6.3%) |
| 45 to 54 Years | 85 (3.5%) | 128 (4.5%) |
| 55 to 64 Years | 74 (3.2%) | 157 (6.2%) |
| 65 to 74 Years | 53 (2.9%) | 85 (4.8%) |
| 75 Years and over | 28 (3.7%) | 106 (8.3%) |
| Total | 663 (3.5%) | 982 (5.2%) |
Income Above Poverty by Sex and Age in Elmont
According to the poverty statistics in Elmont, males aged 12 to 14 years and females aged 5 years are the age groups that are most secure financially, with 100.0% of males and 100.0% of females in these age groups living above the poverty line.
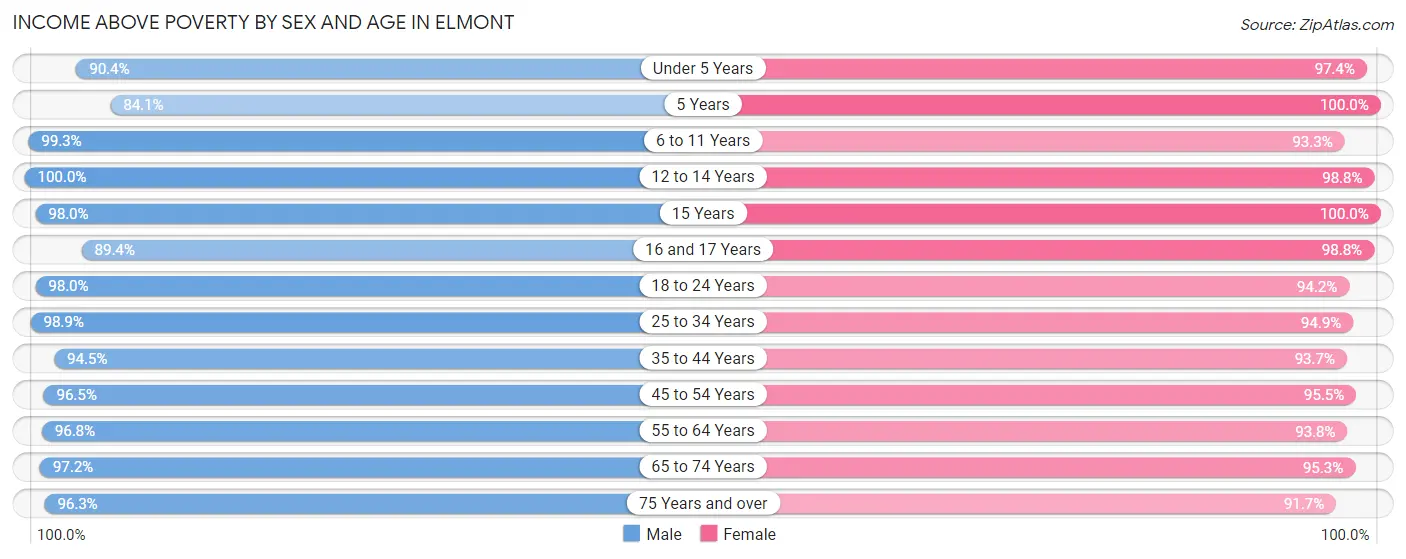
| Age Bracket | Male | Female |
| Under 5 Years | 875 (90.4%) | 1,029 (97.4%) |
| 5 Years | 222 (84.1%) | 74 (100.0%) |
| 6 to 11 Years | 984 (99.3%) | 696 (93.3%) |
| 12 to 14 Years | 1,016 (100.0%) | 676 (98.8%) |
| 15 Years | 98 (98.0%) | 124 (100.0%) |
| 16 and 17 Years | 608 (89.4%) | 239 (98.8%) |
| 18 to 24 Years | 1,815 (98.0%) | 1,727 (94.2%) |
| 25 to 34 Years | 3,301 (98.9%) | 2,907 (94.9%) |
| 35 to 44 Years | 2,295 (94.5%) | 2,313 (93.7%) |
| 45 to 54 Years | 2,332 (96.5%) | 2,693 (95.5%) |
| 55 to 64 Years | 2,232 (96.8%) | 2,387 (93.8%) |
| 65 to 74 Years | 1,805 (97.2%) | 1,706 (95.3%) |
| 75 Years and over | 730 (96.3%) | 1,175 (91.7%) |
| Total | 18,313 (96.5%) | 17,746 (94.8%) |
Income Below Poverty Among Married-Couple Families in Elmont
The poverty statistics for married-couple families in Elmont show that 1.9% or 112 of the total 6,003 families live below the poverty line. Families with 1 or 2 children have the highest poverty rate of 3.3%, comprising of 87 families. On the other hand, families with 3 or 4 children have the lowest poverty rate of 0.0%, which includes 0 families.
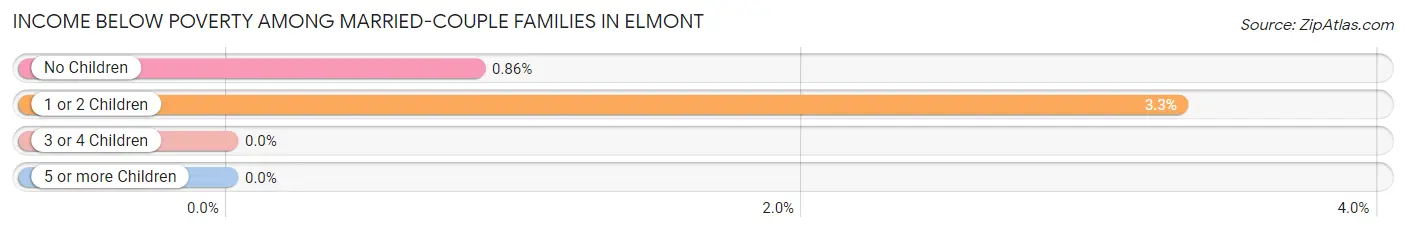
| Children | Above Poverty | Below Poverty |
| No Children | 2,875 (99.1%) | 25 (0.9%) |
| 1 or 2 Children | 2,538 (96.7%) | 87 (3.3%) |
| 3 or 4 Children | 478 (100.0%) | 0 (0.0%) |
| 5 or more Children | 0 (0.0%) | 0 (0.0%) |
| Total | 5,891 (98.1%) | 112 (1.9%) |
Income Below Poverty Among Single-Parent Households in Elmont
According to the poverty data in Elmont, 5.2% or 45 single-father households and 1.4% or 26 single-mother households are living below the poverty line. Among single-father households, those with 3 or 4 children have the highest poverty rate, with 35 households (42.2%) experiencing poverty. Likewise, among single-mother households, those with no children have the highest poverty rate, with 22 households (2.1%) falling below the poverty line.
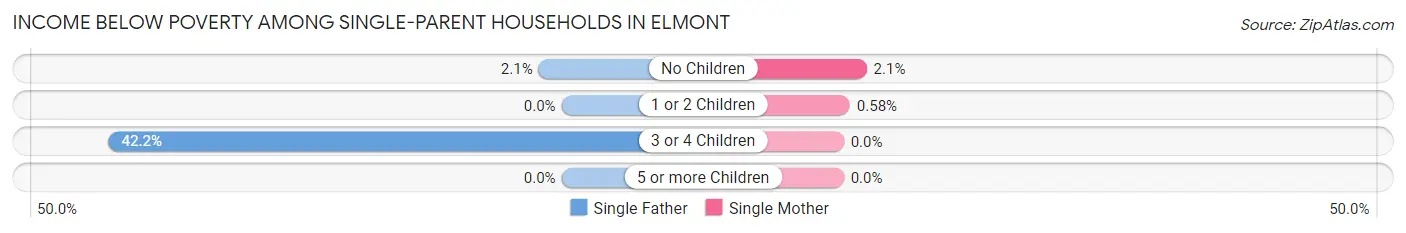
| Children | Single Father | Single Mother |
| No Children | 10 (2.1%) | 22 (2.1%) |
| 1 or 2 Children | 0 (0.0%) | 4 (0.6%) |
| 3 or 4 Children | 35 (42.2%) | 0 (0.0%) |
| 5 or more Children | 0 (0.0%) | 0 (0.0%) |
| Total | 45 (5.2%) | 26 (1.4%) |
Income Below Poverty Among Married-Couple vs Single-Parent Households in Elmont
The poverty data for Elmont shows that 112 of the married-couple family households (1.9%) and 71 of the single-parent households (2.6%) are living below the poverty level. Within the married-couple family households, those with 1 or 2 children have the highest poverty rate, with 87 households (3.3%) falling below the poverty line. Among the single-parent households, those with 3 or 4 children have the highest poverty rate, with 35 household (15.5%) living below poverty.
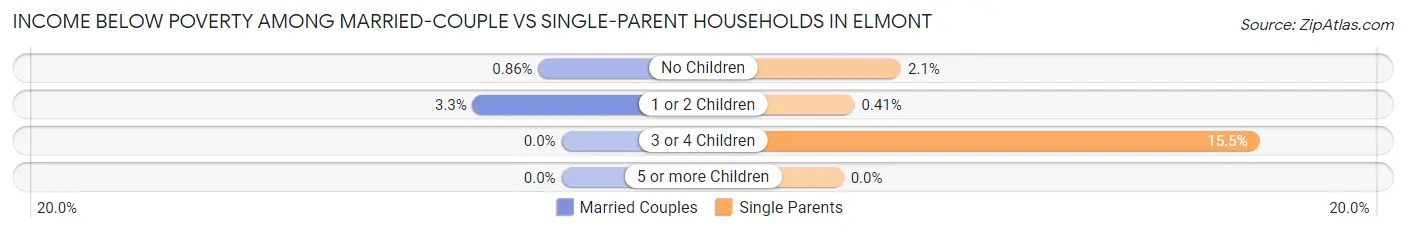
| Children | Married-Couple Families | Single-Parent Households |
| No Children | 25 (0.9%) | 32 (2.1%) |
| 1 or 2 Children | 87 (3.3%) | 4 (0.4%) |
| 3 or 4 Children | 0 (0.0%) | 35 (15.5%) |
| 5 or more Children | 0 (0.0%) | 0 (0.0%) |
| Total | 112 (1.9%) | 71 (2.6%) |
Race in Elmont
The most populous races in Elmont are Black / African American (16,788 | 44.3%), Hispanic or Latino (8,651 | 22.9%), and White / Caucasian (6,669 | 17.6%).
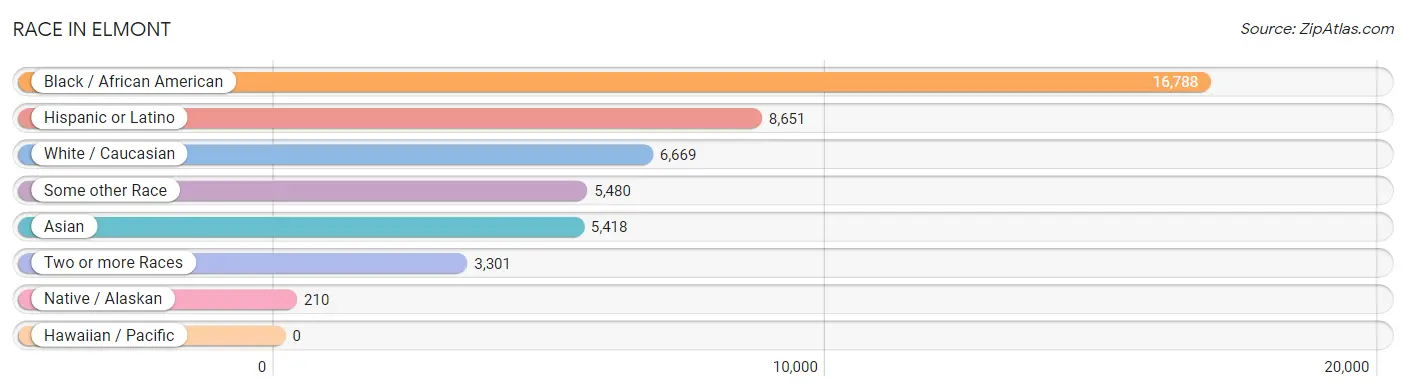
| Race | # Population | % Population |
| Asian | 5,418 | 14.3% |
| Black / African American | 16,788 | 44.3% |
| Hawaiian / Pacific | 0 | 0.0% |
| Hispanic or Latino | 8,651 | 22.9% |
| Native / Alaskan | 210 | 0.5% |
| White / Caucasian | 6,669 | 17.6% |
| Two or more Races | 3,301 | 8.7% |
| Some other Race | 5,480 | 14.5% |
| Total | 37,866 | 100.0% |
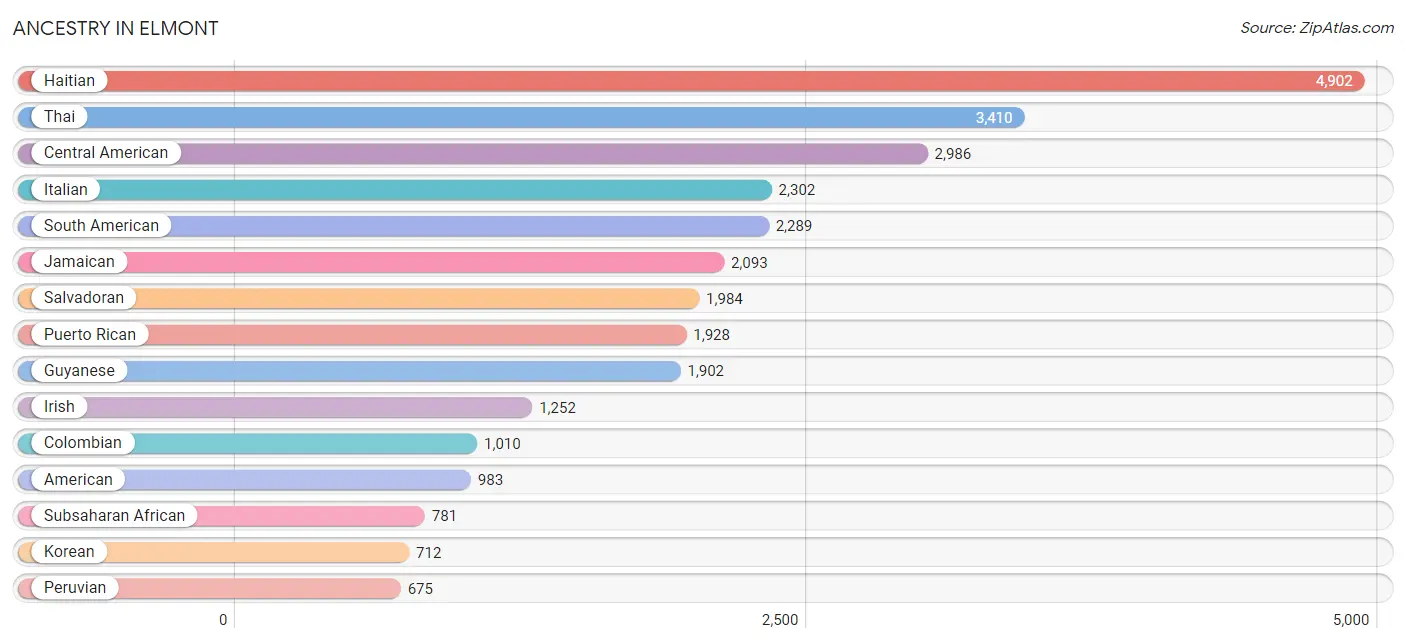
Ancestry in Elmont
The most populous ancestries reported in Elmont are Haitian (4,902 | 13.0%), Thai (3,410 | 9.0%), Central American (2,986 | 7.9%), Italian (2,302 | 6.1%), and South American (2,289 | 6.0%), together accounting for 42.0% of all Elmont residents.
| Ancestry | # Population | % Population |
| African | 287 | 0.8% |
| American | 983 | 2.6% |
| Arab | 45 | 0.1% |
| Argentinean | 7 | 0.0% |
| Austrian | 9 | 0.0% |
| Barbadian | 284 | 0.7% |
| Belizean | 35 | 0.1% |
| Bhutanese | 111 | 0.3% |
| Brazilian | 31 | 0.1% |
| British | 8 | 0.0% |
| British West Indian | 481 | 1.3% |
| Burmese | 18 | 0.1% |
| Canadian | 9 | 0.0% |
| Central American | 2,986 | 7.9% |
| Central American Indian | 224 | 0.6% |
| Cherokee | 8 | 0.0% |
| Chilean | 159 | 0.4% |
| Colombian | 1,010 | 2.7% |
| Costa Rican | 21 | 0.1% |
| Croatian | 11 | 0.0% |
| Czech | 109 | 0.3% |
| Danish | 3 | 0.0% |
| Dominican | 656 | 1.7% |
| Dutch | 35 | 0.1% |
| Eastern European | 9 | 0.0% |
| Ecuadorian | 309 | 0.8% |
| Egyptian | 15 | 0.0% |
| English | 125 | 0.3% |
| European | 27 | 0.1% |
| French | 132 | 0.4% |
| German | 549 | 1.5% |
| Greek | 21 | 0.1% |
| Guatemalan | 166 | 0.4% |
| Guyanese | 1,902 | 5.0% |
| Haitian | 4,902 | 13.0% |
| Honduran | 628 | 1.7% |
| Hungarian | 31 | 0.1% |
| Indian (Asian) | 467 | 1.2% |
| Irish | 1,252 | 3.3% |
| Italian | 2,302 | 6.1% |
| Jamaican | 2,093 | 5.5% |
| Korean | 712 | 1.9% |
| Lebanese | 23 | 0.1% |
| Mexican | 436 | 1.1% |
| Mexican American Indian | 70 | 0.2% |
| Nigerian | 399 | 1.1% |
| Norwegian | 14 | 0.0% |
| Pakistani | 38 | 0.1% |
| Panamanian | 187 | 0.5% |
| Paraguayan | 33 | 0.1% |
| Peruvian | 675 | 1.8% |
| Polish | 388 | 1.0% |
| Portuguese | 58 | 0.2% |
| Puerto Rican | 1,928 | 5.1% |
| Romanian | 28 | 0.1% |
| Russian | 45 | 0.1% |
| Salvadoran | 1,984 | 5.2% |
| Scotch-Irish | 43 | 0.1% |
| Scottish | 7 | 0.0% |
| Slovak | 73 | 0.2% |
| South American | 2,289 | 6.0% |
| Spaniard | 34 | 0.1% |
| Spanish | 13 | 0.0% |
| Subsaharan African | 781 | 2.1% |
| Swedish | 50 | 0.1% |
| Thai | 3,410 | 9.0% |
| Trinidadian and Tobagonian | 482 | 1.3% |
| Turkish | 300 | 0.8% |
| U.S. Virgin Islander | 9 | 0.0% |
| Ukrainian | 20 | 0.1% |
| Uruguayan | 35 | 0.1% |
| Venezuelan | 61 | 0.2% |
| Vietnamese | 192 | 0.5% |
| Welsh | 9 | 0.0% |
| West Indian | 301 | 0.8% |
| Zimbabwean | 11 | 0.0% | View All 76 Rows |
Immigrants in Elmont
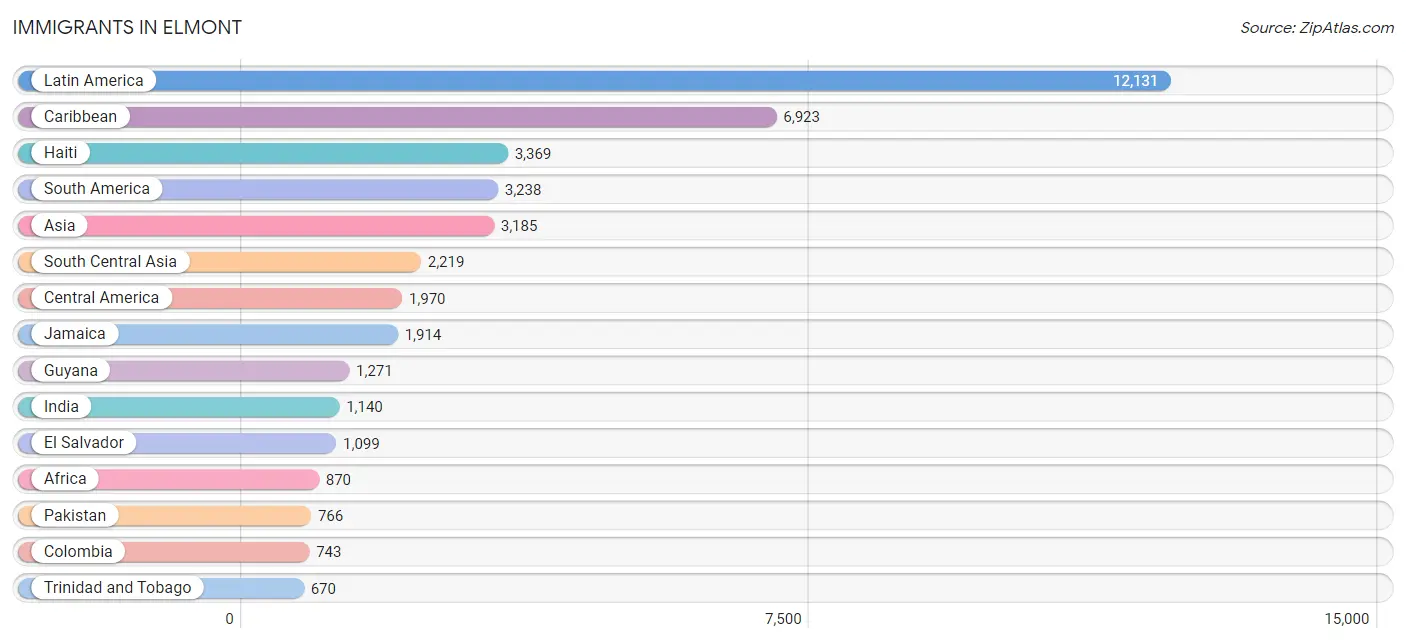
The most numerous immigrant groups reported in Elmont came from Latin America (12,131 | 32.0%), Caribbean (6,923 | 18.3%), Haiti (3,369 | 8.9%), South America (3,238 | 8.6%), and Asia (3,185 | 8.4%), together accounting for 76.2% of all Elmont residents.
| Immigration Origin | # Population | % Population |
| Afghanistan | 29 | 0.1% |
| Africa | 870 | 2.3% |
| Argentina | 85 | 0.2% |
| Asia | 3,185 | 8.4% |
| Bahamas | 109 | 0.3% |
| Bangladesh | 215 | 0.6% |
| Barbados | 166 | 0.4% |
| Canada | 71 | 0.2% |
| Caribbean | 6,923 | 18.3% |
| Central America | 1,970 | 5.2% |
| Chile | 119 | 0.3% |
| China | 204 | 0.5% |
| Colombia | 743 | 2.0% |
| Costa Rica | 21 | 0.1% |
| Cuba | 6 | 0.0% |
| Czechoslovakia | 157 | 0.4% |
| Dominican Republic | 178 | 0.5% |
| Eastern Africa | 353 | 0.9% |
| Eastern Asia | 237 | 0.6% |
| Eastern Europe | 310 | 0.8% |
| Ecuador | 211 | 0.6% |
| Egypt | 7 | 0.0% |
| El Salvador | 1,099 | 2.9% |
| England | 27 | 0.1% |
| Europe | 476 | 1.3% |
| Germany | 6 | 0.0% |
| Ghana | 39 | 0.1% |
| Grenada | 322 | 0.9% |
| Guatemala | 109 | 0.3% |
| Guyana | 1,271 | 3.4% |
| Haiti | 3,369 | 8.9% |
| Honduras | 438 | 1.2% |
| Hungary | 11 | 0.0% |
| India | 1,140 | 3.0% |
| Indonesia | 12 | 0.0% |
| Italy | 93 | 0.3% |
| Jamaica | 1,914 | 5.1% |
| Korea | 33 | 0.1% |
| Latin America | 12,131 | 32.0% |
| Mexico | 272 | 0.7% |
| Nepal | 26 | 0.1% |
| Nigeria | 340 | 0.9% |
| Northern Africa | 7 | 0.0% |
| Northern Europe | 53 | 0.1% |
| Pakistan | 766 | 2.0% |
| Panama | 31 | 0.1% |
| Peru | 602 | 1.6% |
| Philippines | 466 | 1.2% |
| Poland | 86 | 0.2% |
| Romania | 50 | 0.1% |
| Saudi Arabia | 40 | 0.1% |
| Senegal | 16 | 0.0% |
| South America | 3,238 | 8.6% |
| South Central Asia | 2,219 | 5.9% |
| South Eastern Asia | 478 | 1.3% |
| Southern Europe | 107 | 0.3% |
| Spain | 14 | 0.0% |
| Sri Lanka | 43 | 0.1% |
| St. Vincent and the Grenadines | 105 | 0.3% |
| Trinidad and Tobago | 670 | 1.8% |
| Turkey | 185 | 0.5% |
| Ukraine | 6 | 0.0% |
| Uruguay | 53 | 0.1% |
| Venezuela | 87 | 0.2% |
| Western Africa | 461 | 1.2% |
| Western Asia | 251 | 0.7% |
| Western Europe | 6 | 0.0% |
| Zimbabwe | 292 | 0.8% | View All 68 Rows |
Sex and Age in Elmont
Sex and Age in Elmont
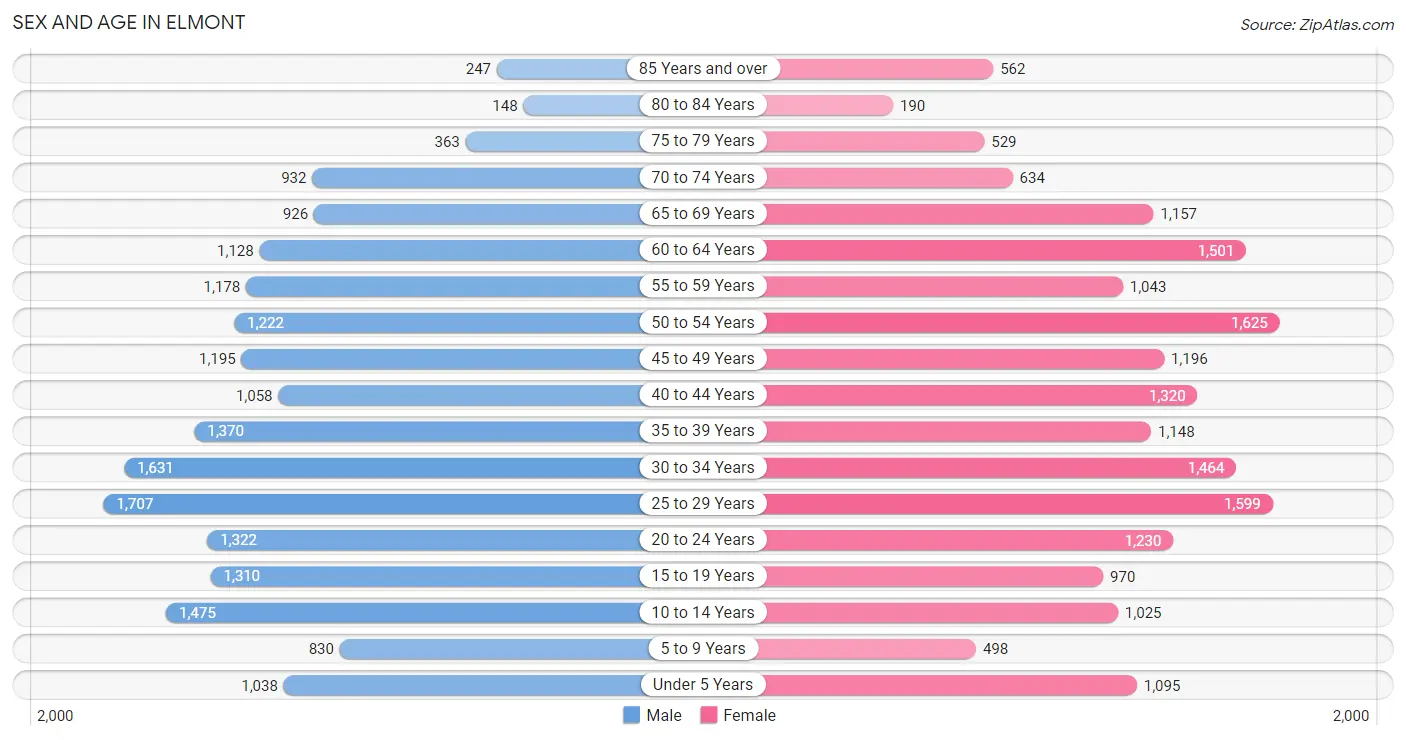
The most populous age groups in Elmont are 25 to 29 Years (1,707 | 8.9%) for men and 50 to 54 Years (1,625 | 8.6%) for women.
| Age Bracket | Male | Female |
| Under 5 Years | 1,038 (5.4%) | 1,095 (5.8%) |
| 5 to 9 Years | 830 (4.3%) | 498 (2.6%) |
| 10 to 14 Years | 1,475 (7.7%) | 1,025 (5.5%) |
| 15 to 19 Years | 1,310 (6.9%) | 970 (5.2%) |
| 20 to 24 Years | 1,322 (6.9%) | 1,230 (6.6%) |
| 25 to 29 Years | 1,707 (8.9%) | 1,599 (8.5%) |
| 30 to 34 Years | 1,631 (8.6%) | 1,464 (7.8%) |
| 35 to 39 Years | 1,370 (7.2%) | 1,148 (6.1%) |
| 40 to 44 Years | 1,058 (5.6%) | 1,320 (7.0%) |
| 45 to 49 Years | 1,195 (6.3%) | 1,196 (6.4%) |
| 50 to 54 Years | 1,222 (6.4%) | 1,625 (8.6%) |
| 55 to 59 Years | 1,178 (6.2%) | 1,043 (5.6%) |
| 60 to 64 Years | 1,128 (5.9%) | 1,501 (8.0%) |
| 65 to 69 Years | 926 (4.9%) | 1,157 (6.2%) |
| 70 to 74 Years | 932 (4.9%) | 634 (3.4%) |
| 75 to 79 Years | 363 (1.9%) | 529 (2.8%) |
| 80 to 84 Years | 148 (0.8%) | 190 (1.0%) |
| 85 Years and over | 247 (1.3%) | 562 (3.0%) |
| Total | 19,080 (100.0%) | 18,786 (100.0%) |
Families and Households in Elmont
Median Family Size in Elmont
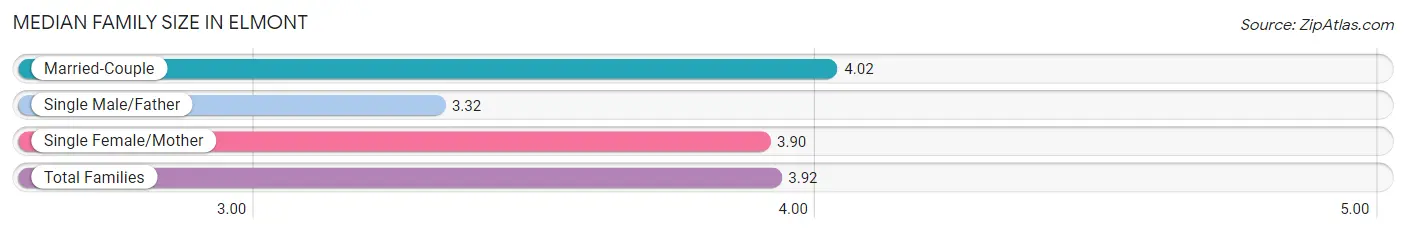
The median family size in Elmont is 3.92 persons per family, with married-couple families (6,003 | 68.7%) accounting for the largest median family size of 4.02 persons per family. On the other hand, single male/father families (872 | 10.0%) represent the smallest median family size with 3.32 persons per family.
| Family Type | # Families | Family Size |
| Married-Couple | 6,003 (68.7%) | 4.02 |
| Single Male/Father | 872 (10.0%) | 3.32 |
| Single Female/Mother | 1,862 (21.3%) | 3.90 |
| Total Families | 8,737 (100.0%) | 3.92 |
Median Household Size in Elmont
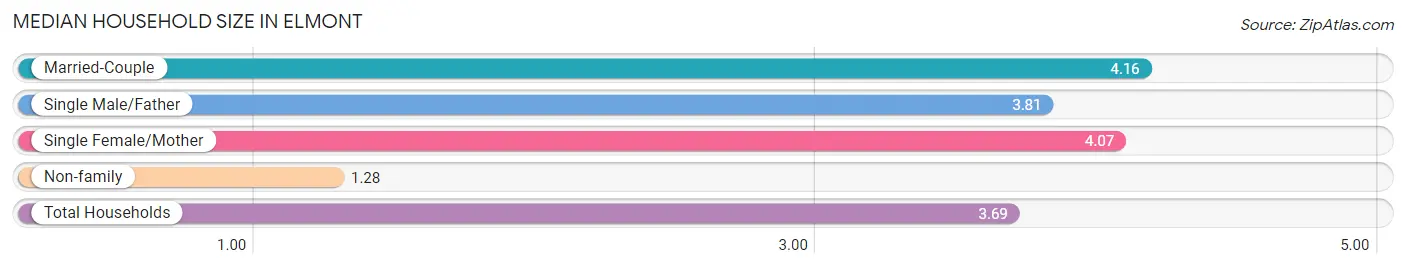
The median household size in Elmont is 3.69 persons per household, with married-couple households (6,003 | 58.5%) accounting for the largest median household size of 4.16 persons per household. non-family households (1,523 | 14.8%) represent the smallest median household size with 1.28 persons per household.
| Household Type | # Households | Household Size |
| Married-Couple | 6,003 (58.5%) | 4.16 |
| Single Male/Father | 872 (8.5%) | 3.81 |
| Single Female/Mother | 1,862 (18.1%) | 4.07 |
| Non-family | 1,523 (14.8%) | 1.28 |
| Total Households | 10,260 (100.0%) | 3.69 |
Household Size by Marriage Status in Elmont
Out of a total of 10,260 households in Elmont, 8,737 (85.2%) are family households, while 1,523 (14.8%) are nonfamily households. The most numerous type of family households are 3-person households, comprising 2,358, and the most common type of nonfamily households are 1-person households, comprising 1,386.
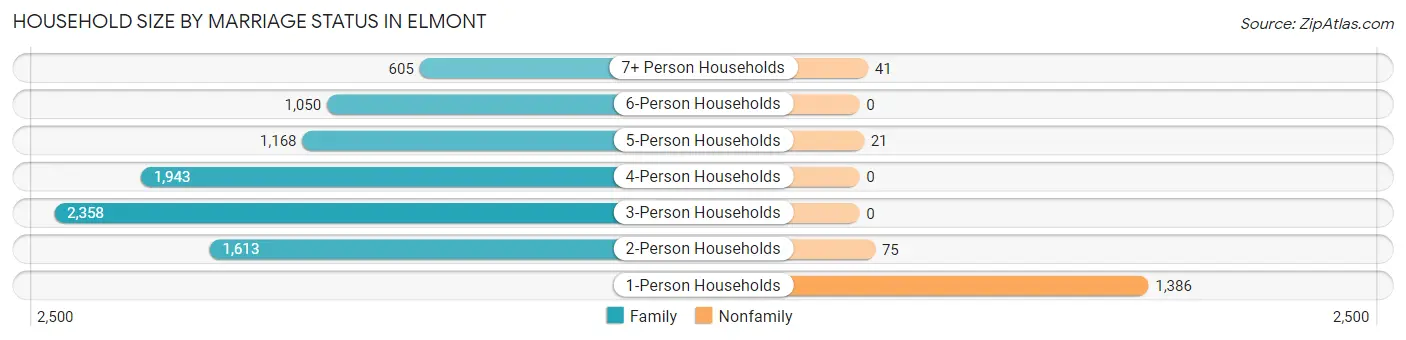
| Household Size | Family Households | Nonfamily Households |
| 1-Person Households | - | 1,386 (13.5%) |
| 2-Person Households | 1,613 (15.7%) | 75 (0.7%) |
| 3-Person Households | 2,358 (23.0%) | 0 (0.0%) |
| 4-Person Households | 1,943 (18.9%) | 0 (0.0%) |
| 5-Person Households | 1,168 (11.4%) | 21 (0.2%) |
| 6-Person Households | 1,050 (10.2%) | 0 (0.0%) |
| 7+ Person Households | 605 (5.9%) | 41 (0.4%) |
| Total | 8,737 (85.2%) | 1,523 (14.8%) |
Female Fertility in Elmont
Fertility by Age in Elmont
Average fertility rate in Elmont is 77.0 births per 1,000 women. Women in the age bracket of 20 to 34 years have the highest fertility rate with 101.0 births per 1,000 women. Women in the age bracket of 20 to 34 years acount for 61.0% of all women with births.
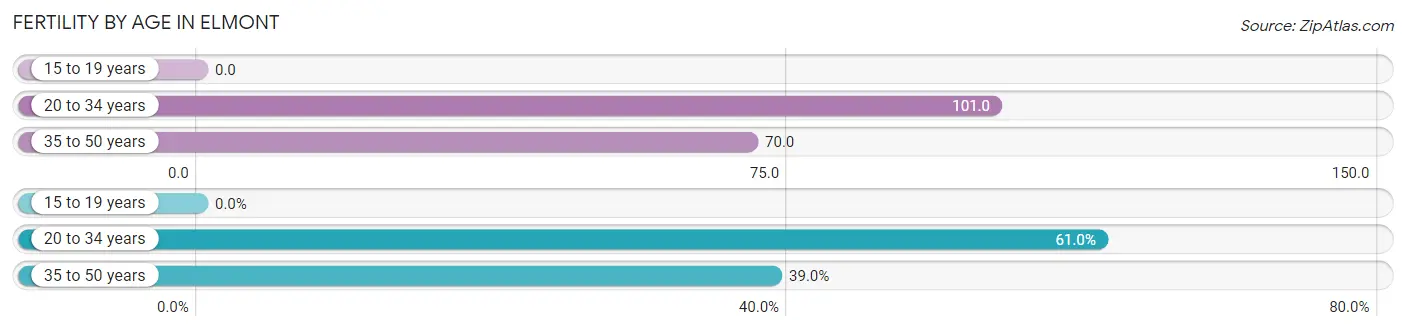
| Age Bracket | Women with Births | Births / 1,000 Women |
| 15 to 19 years | 0 (0.0%) | 0.0 |
| 20 to 34 years | 434 (61.0%) | 101.0 |
| 35 to 50 years | 277 (39.0%) | 70.0 |
| Total | 711 (100.0%) | 77.0 |
Fertility by Age by Marriage Status in Elmont
96.6% of women with births (711) in Elmont are married. The highest percentage of unmarried women with births falls into 20 to 34 years age bracket with 5.5% of them unmarried at the time of birth, while the lowest percentage of unmarried women with births belong to 35 to 50 years age bracket with 0.0% of them unmarried.
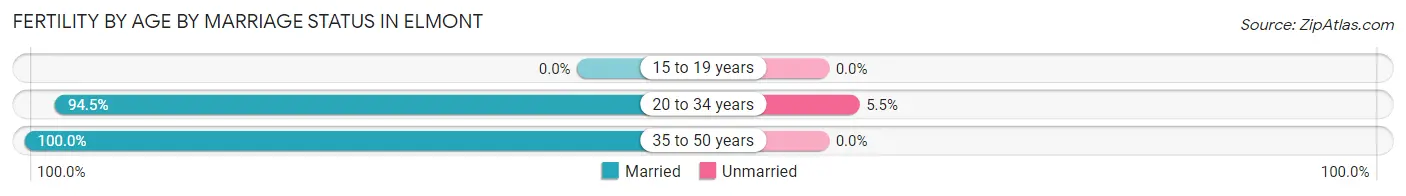
| Age Bracket | Married | Unmarried |
| 15 to 19 years | 0 (0.0%) | 0 (0.0%) |
| 20 to 34 years | 410 (94.5%) | 24 (5.5%) |
| 35 to 50 years | 277 (100.0%) | 0 (0.0%) |
| Total | 687 (96.6%) | 24 (3.4%) |
Fertility by Education in Elmont
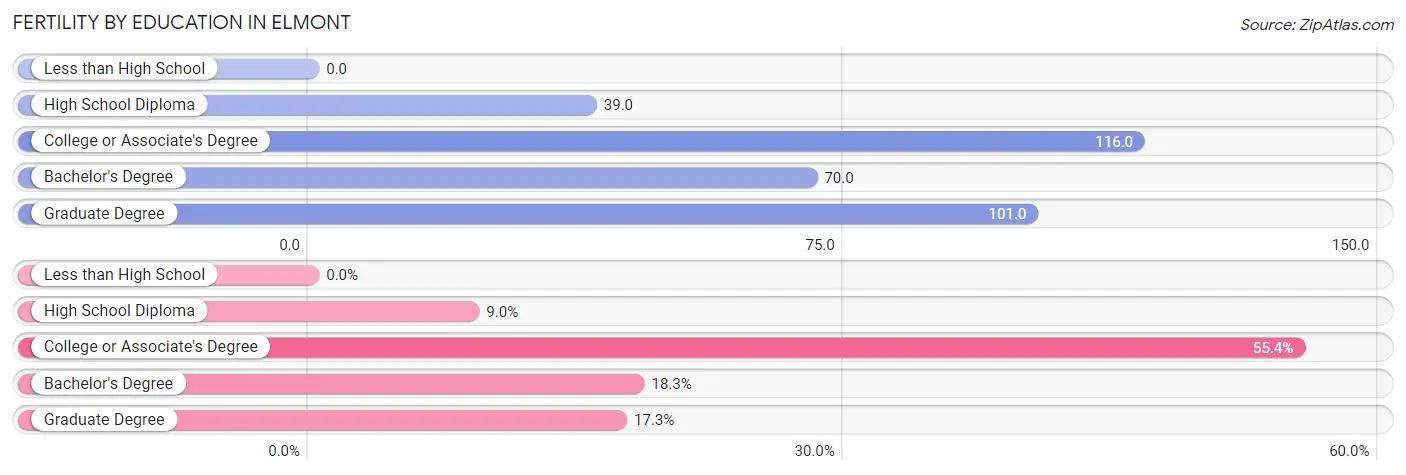
| Educational Attainment | Women with Births | Births / 1,000 Women |
| Less than High School | 0 (0.0%) | 0.0 |
| High School Diploma | 64 (9.0%) | 39.0 |
| College or Associate's Degree | 394 (55.4%) | 116.0 |
| Bachelor's Degree | 130 (18.3%) | 70.0 |
| Graduate Degree | 123 (17.3%) | 101.0 |
| Total | 711 (100.0%) | 77.0 |
Fertility by Education by Marriage Status in Elmont
3.4% of women with births in Elmont are unmarried. Women with the educational attainment of college or associate's degree are most likely to be married with 100.0% of them married at childbirth, while women with the educational attainment of high school diploma are least likely to be married with 28.1% of them unmarried at childbirth.
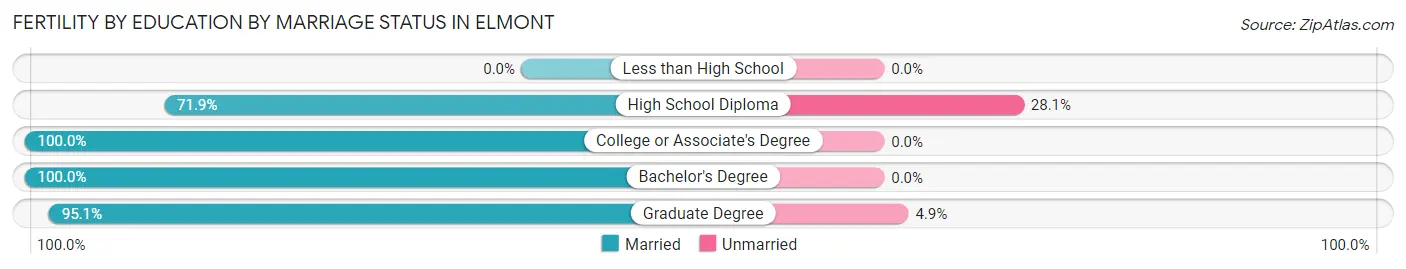
| Educational Attainment | Married | Unmarried |
| Less than High School | 0 (0.0%) | 0 (0.0%) |
| High School Diploma | 46 (71.9%) | 18 (28.1%) |
| College or Associate's Degree | 394 (100.0%) | 0 (0.0%) |
| Bachelor's Degree | 130 (100.0%) | 0 (0.0%) |
| Graduate Degree | 117 (95.1%) | 6 (4.9%) |
| Total | 687 (96.6%) | 24 (3.4%) |
Employment Characteristics in Elmont
Employment by Class of Employer in Elmont
Among the 19,425 employed individuals in Elmont, private company employees (12,197 | 62.8%), local government employees (2,810 | 14.5%), and not-for-profit organizations (1,873 | 9.6%) make up the most common classes of employment.
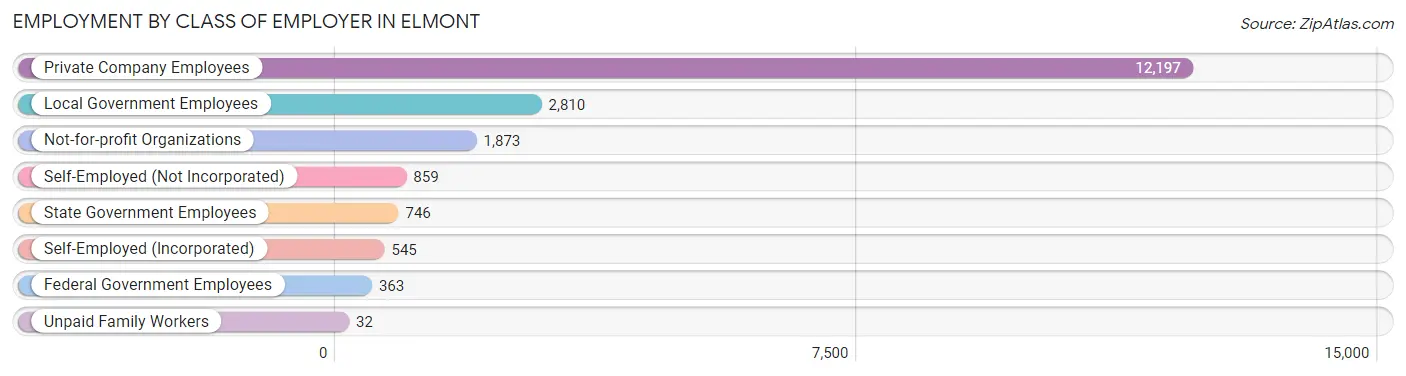
| Employer Class | # Employees | % Employees |
| Private Company Employees | 12,197 | 62.8% |
| Self-Employed (Incorporated) | 545 | 2.8% |
| Self-Employed (Not Incorporated) | 859 | 4.4% |
| Not-for-profit Organizations | 1,873 | 9.6% |
| Local Government Employees | 2,810 | 14.5% |
| State Government Employees | 746 | 3.8% |
| Federal Government Employees | 363 | 1.9% |
| Unpaid Family Workers | 32 | 0.2% |
| Total | 19,425 | 100.0% |
Employment Status by Age in Elmont
According to the labor force statistics for Elmont, out of the total population over 16 years of age (31,681), 68.4% or 21,670 individuals are in the labor force, with 7.6% or 1,647 of them unemployed. The age group with the highest labor force participation rate is 35 to 44 years, with 94.3% or 4,617 individuals in the labor force. Within the labor force, the 16 to 19 years age range has the highest percentage of unemployed individuals, with 25.4% or 136 of them being unemployed.
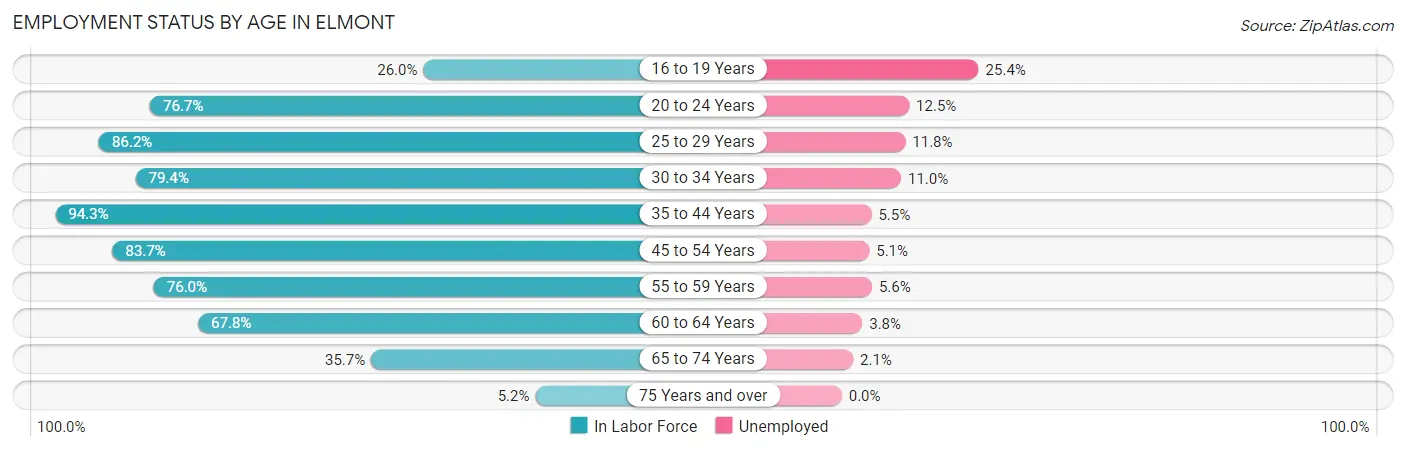
| Age Bracket | In Labor Force | Unemployed |
| 16 to 19 Years | 535 (26.0%) | 136 (25.4%) |
| 20 to 24 Years | 1,957 (76.7%) | 245 (12.5%) |
| 25 to 29 Years | 2,850 (86.2%) | 336 (11.8%) |
| 30 to 34 Years | 2,457 (79.4%) | 270 (11.0%) |
| 35 to 44 Years | 4,617 (94.3%) | 254 (5.5%) |
| 45 to 54 Years | 4,384 (83.7%) | 224 (5.1%) |
| 55 to 59 Years | 1,688 (76.0%) | 95 (5.6%) |
| 60 to 64 Years | 1,782 (67.8%) | 68 (3.8%) |
| 65 to 74 Years | 1,303 (35.7%) | 27 (2.1%) |
| 75 Years and over | 106 (5.2%) | 0 (0.0%) |
| Total | 21,670 (68.4%) | 1,647 (7.6%) |
Employment Status by Educational Attainment in Elmont
According to labor force statistics for Elmont, 83.1% of individuals (17,771) out of the total population between 25 and 64 years of age (21,385) are in the labor force, with 7.0% or 1,244 of them being unemployed. The group with the highest labor force participation rate are those with the educational attainment of bachelor's degree or higher, with 89.3% or 6,470 individuals in the labor force. Within the labor force, individuals with high school diploma education have the highest percentage of unemployment, with 9.5% or 381 of them being unemployed.
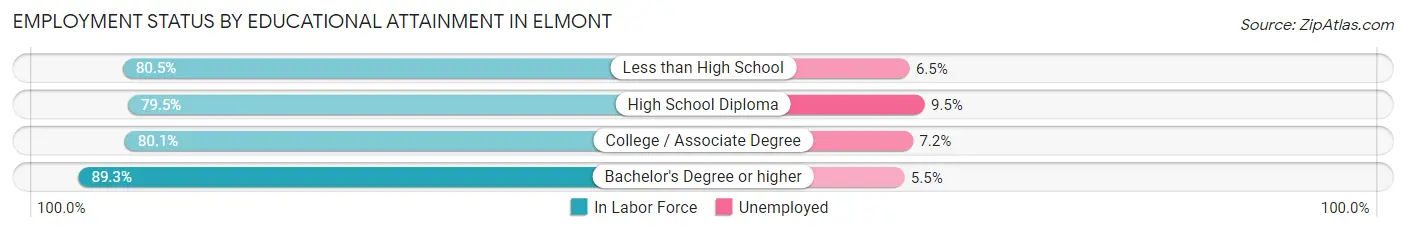
| Educational Attainment | In Labor Force | Unemployed |
| Less than High School | 2,078 (80.5%) | 168 (6.5%) |
| High School Diploma | 4,015 (79.5%) | 480 (9.5%) |
| College / Associate Degree | 5,214 (80.1%) | 469 (7.2%) |
| Bachelor's Degree or higher | 6,470 (89.3%) | 398 (5.5%) |
| Total | 17,771 (83.1%) | 1,497 (7.0%) |
Employment Occupations by Sex in Elmont
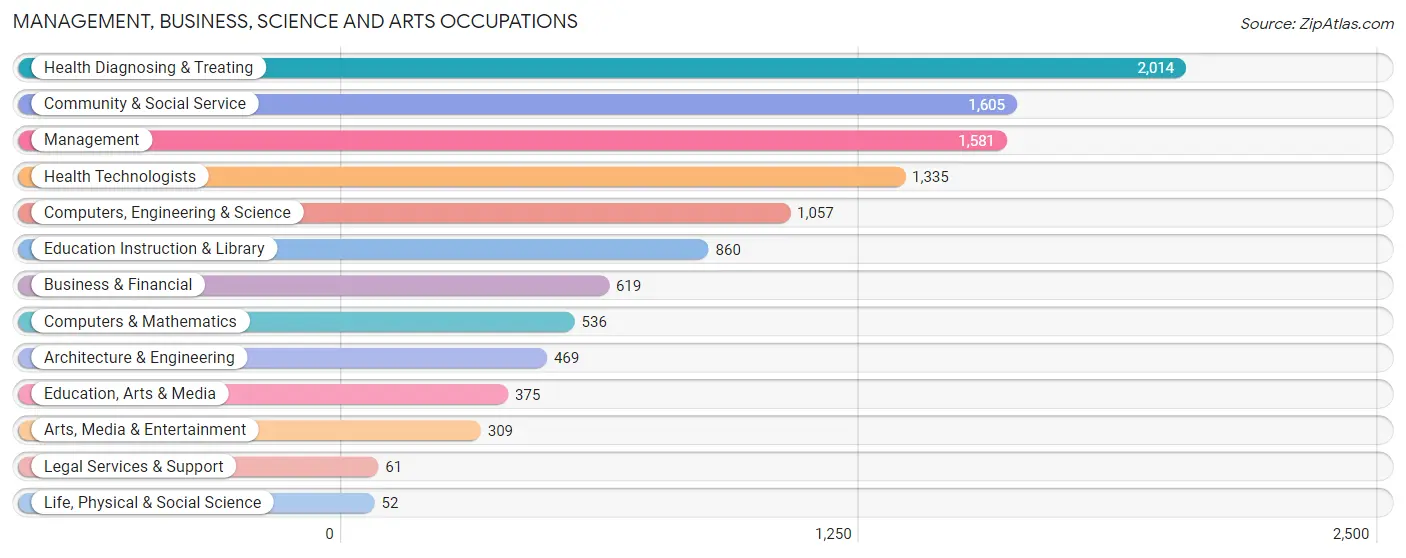
Management, Business, Science and Arts Occupations
The most common Management, Business, Science and Arts occupations in Elmont are Health Diagnosing & Treating (2,014 | 10.1%), Community & Social Service (1,605 | 8.0%), Management (1,581 | 7.9%), Health Technologists (1,335 | 6.7%), and Computers, Engineering & Science (1,057 | 5.3%).
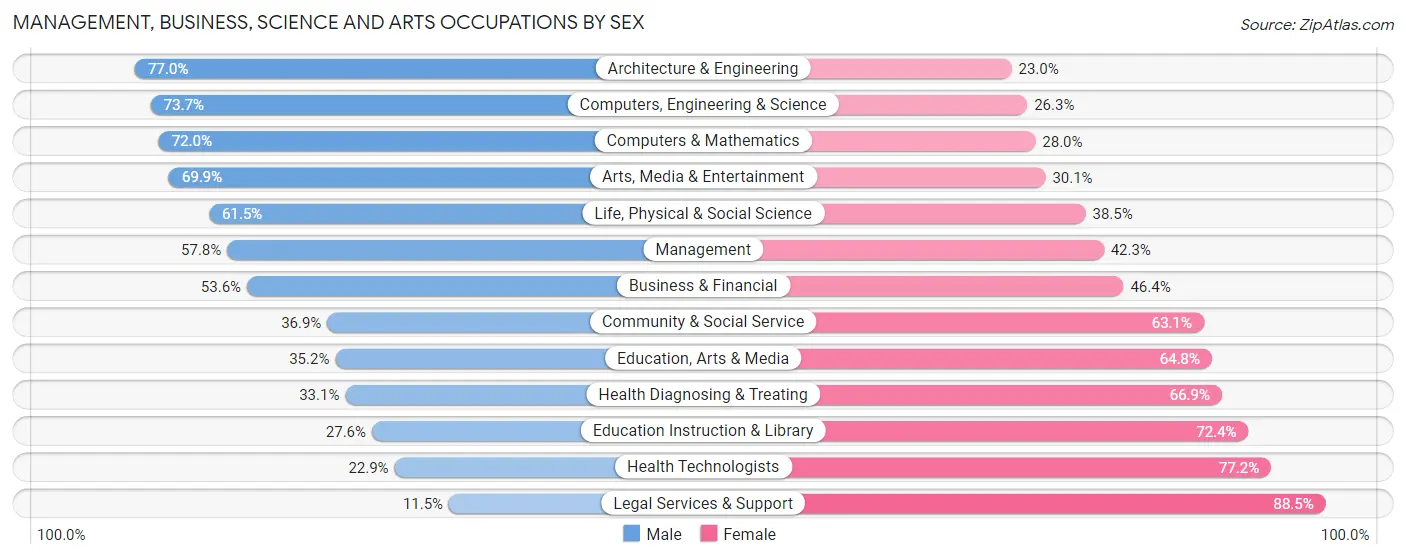
Management, Business, Science and Arts Occupations by Sex
Within the Management, Business, Science and Arts occupations in Elmont, the most male-oriented occupations are Architecture & Engineering (77.0%), Computers, Engineering & Science (73.7%), and Computers & Mathematics (72.0%), while the most female-oriented occupations are Legal Services & Support (88.5%), Health Technologists (77.1%), and Education Instruction & Library (72.4%).
| Occupation | Male | Female |
| Management | 913 (57.8%) | 668 (42.2%) |
| Business & Financial | 332 (53.6%) | 287 (46.4%) |
| Computers, Engineering & Science | 779 (73.7%) | 278 (26.3%) |
| Computers & Mathematics | 386 (72.0%) | 150 (28.0%) |
| Architecture & Engineering | 361 (77.0%) | 108 (23.0%) |
| Life, Physical & Social Science | 32 (61.5%) | 20 (38.5%) |
| Community & Social Service | 592 (36.9%) | 1,013 (63.1%) |
| Education, Arts & Media | 132 (35.2%) | 243 (64.8%) |
| Legal Services & Support | 7 (11.5%) | 54 (88.5%) |
| Education Instruction & Library | 237 (27.6%) | 623 (72.4%) |
| Arts, Media & Entertainment | 216 (69.9%) | 93 (30.1%) |
| Health Diagnosing & Treating | 667 (33.1%) | 1,347 (66.9%) |
| Health Technologists | 305 (22.9%) | 1,030 (77.1%) |
| Total (Category) | 3,283 (47.7%) | 3,593 (52.2%) |
| Total (Overall) | 10,714 (53.5%) | 9,310 (46.5%) |
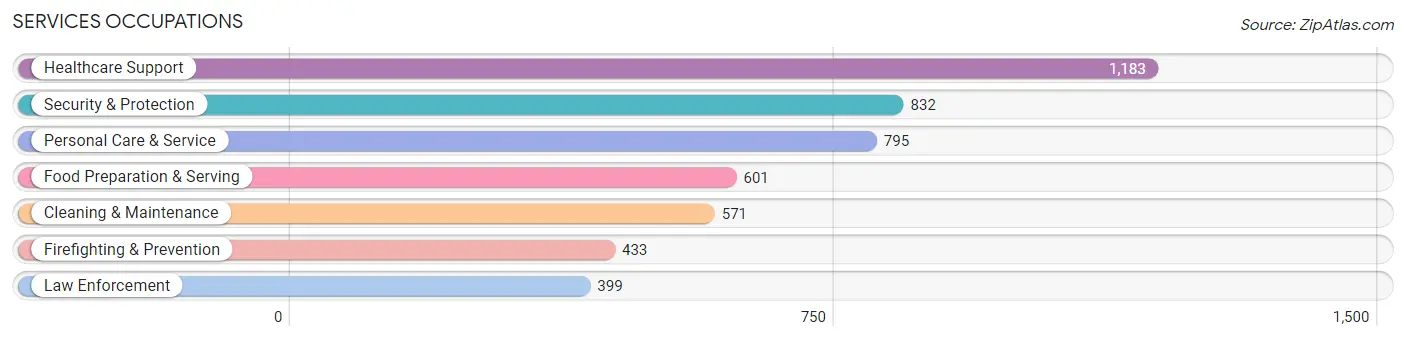
Services Occupations
The most common Services occupations in Elmont are Healthcare Support (1,183 | 5.9%), Security & Protection (832 | 4.2%), Personal Care & Service (795 | 4.0%), Food Preparation & Serving (601 | 3.0%), and Cleaning & Maintenance (571 | 2.9%).
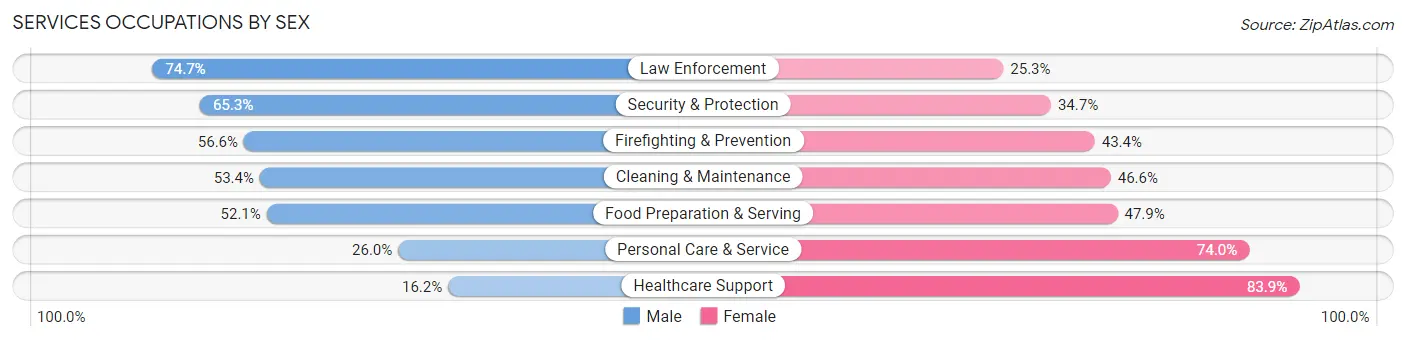
Services Occupations by Sex
Within the Services occupations in Elmont, the most male-oriented occupations are Law Enforcement (74.7%), Security & Protection (65.3%), and Firefighting & Prevention (56.6%), while the most female-oriented occupations are Healthcare Support (83.9%), Personal Care & Service (74.0%), and Food Preparation & Serving (47.9%).
| Occupation | Male | Female |
| Healthcare Support | 191 (16.2%) | 992 (83.9%) |
| Security & Protection | 543 (65.3%) | 289 (34.7%) |
| Firefighting & Prevention | 245 (56.6%) | 188 (43.4%) |
| Law Enforcement | 298 (74.7%) | 101 (25.3%) |
| Food Preparation & Serving | 313 (52.1%) | 288 (47.9%) |
| Cleaning & Maintenance | 305 (53.4%) | 266 (46.6%) |
| Personal Care & Service | 207 (26.0%) | 588 (74.0%) |
| Total (Category) | 1,559 (39.2%) | 2,423 (60.9%) |
| Total (Overall) | 10,714 (53.5%) | 9,310 (46.5%) |
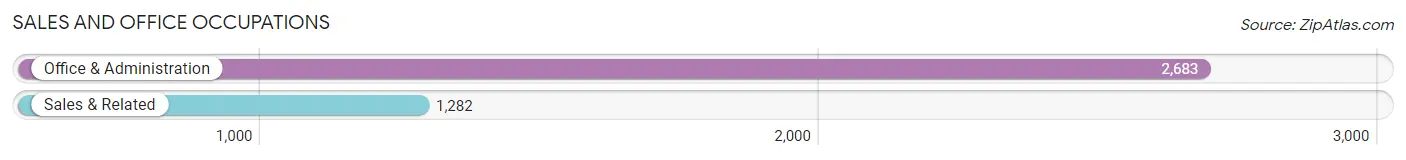
Sales and Office Occupations
The most common Sales and Office occupations in Elmont are Office & Administration (2,683 | 13.4%), and Sales & Related (1,282 | 6.4%).
Sales and Office Occupations by Sex
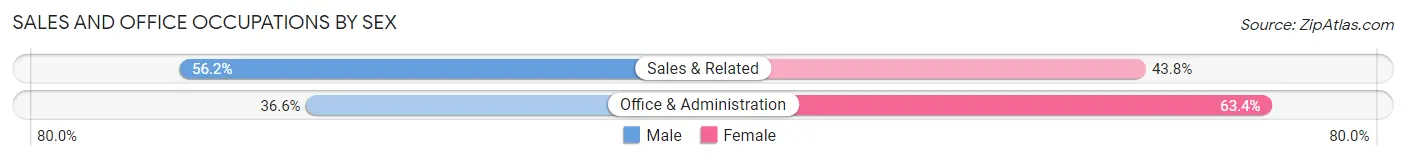
| Occupation | Male | Female |
| Sales & Related | 721 (56.2%) | 561 (43.8%) |
| Office & Administration | 983 (36.6%) | 1,700 (63.4%) |
| Total (Category) | 1,704 (43.0%) | 2,261 (57.0%) |
| Total (Overall) | 10,714 (53.5%) | 9,310 (46.5%) |
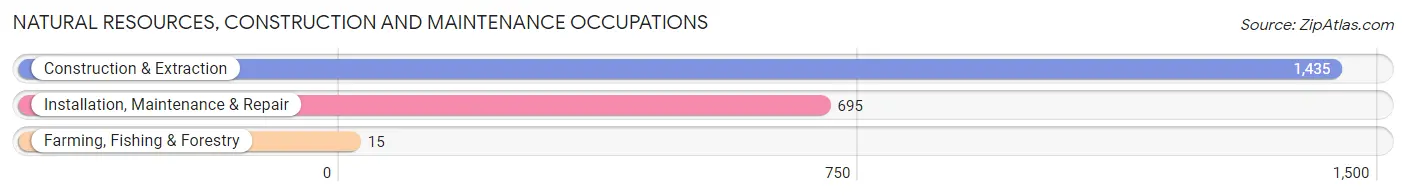
Natural Resources, Construction and Maintenance Occupations
The most common Natural Resources, Construction and Maintenance occupations in Elmont are Construction & Extraction (1,435 | 7.2%), Installation, Maintenance & Repair (695 | 3.5%), and Farming, Fishing & Forestry (15 | 0.1%).
Natural Resources, Construction and Maintenance Occupations by Sex
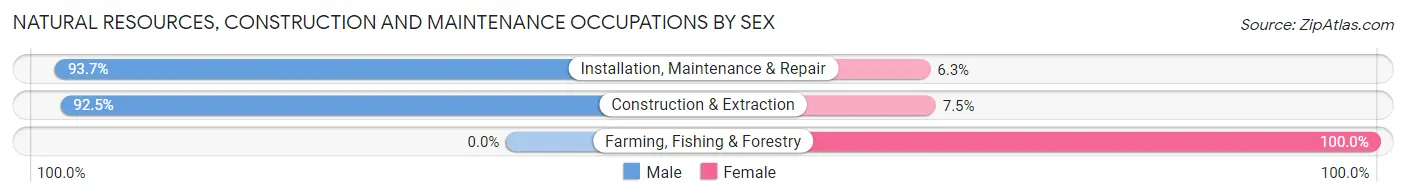
| Occupation | Male | Female |
| Farming, Fishing & Forestry | 0 (0.0%) | 15 (100.0%) |
| Construction & Extraction | 1,328 (92.5%) | 107 (7.5%) |
| Installation, Maintenance & Repair | 651 (93.7%) | 44 (6.3%) |
| Total (Category) | 1,979 (92.3%) | 166 (7.7%) |
| Total (Overall) | 10,714 (53.5%) | 9,310 (46.5%) |
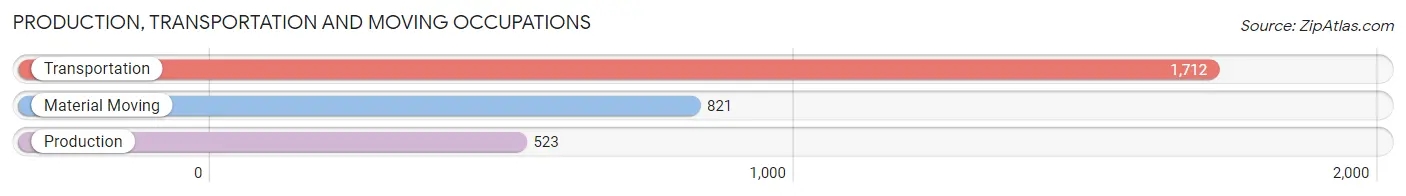
Production, Transportation and Moving Occupations
The most common Production, Transportation and Moving occupations in Elmont are Transportation (1,712 | 8.6%), Material Moving (821 | 4.1%), and Production (523 | 2.6%).
Production, Transportation and Moving Occupations by Sex
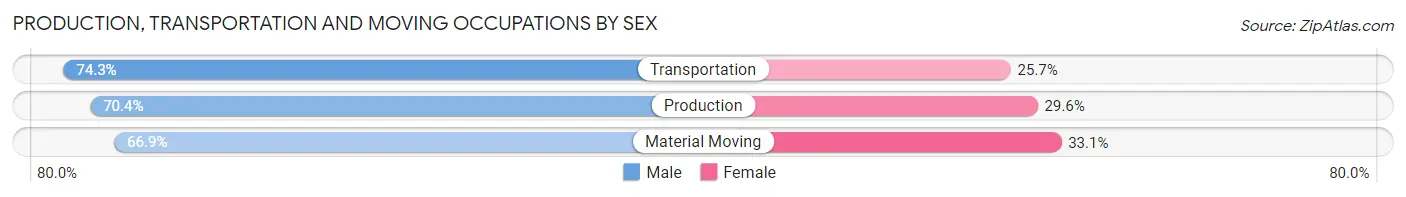
| Occupation | Male | Female |
| Production | 368 (70.4%) | 155 (29.6%) |
| Transportation | 1,272 (74.3%) | 440 (25.7%) |
| Material Moving | 549 (66.9%) | 272 (33.1%) |
| Total (Category) | 2,189 (71.6%) | 867 (28.4%) |
| Total (Overall) | 10,714 (53.5%) | 9,310 (46.5%) |
Employment Industries by Sex in Elmont
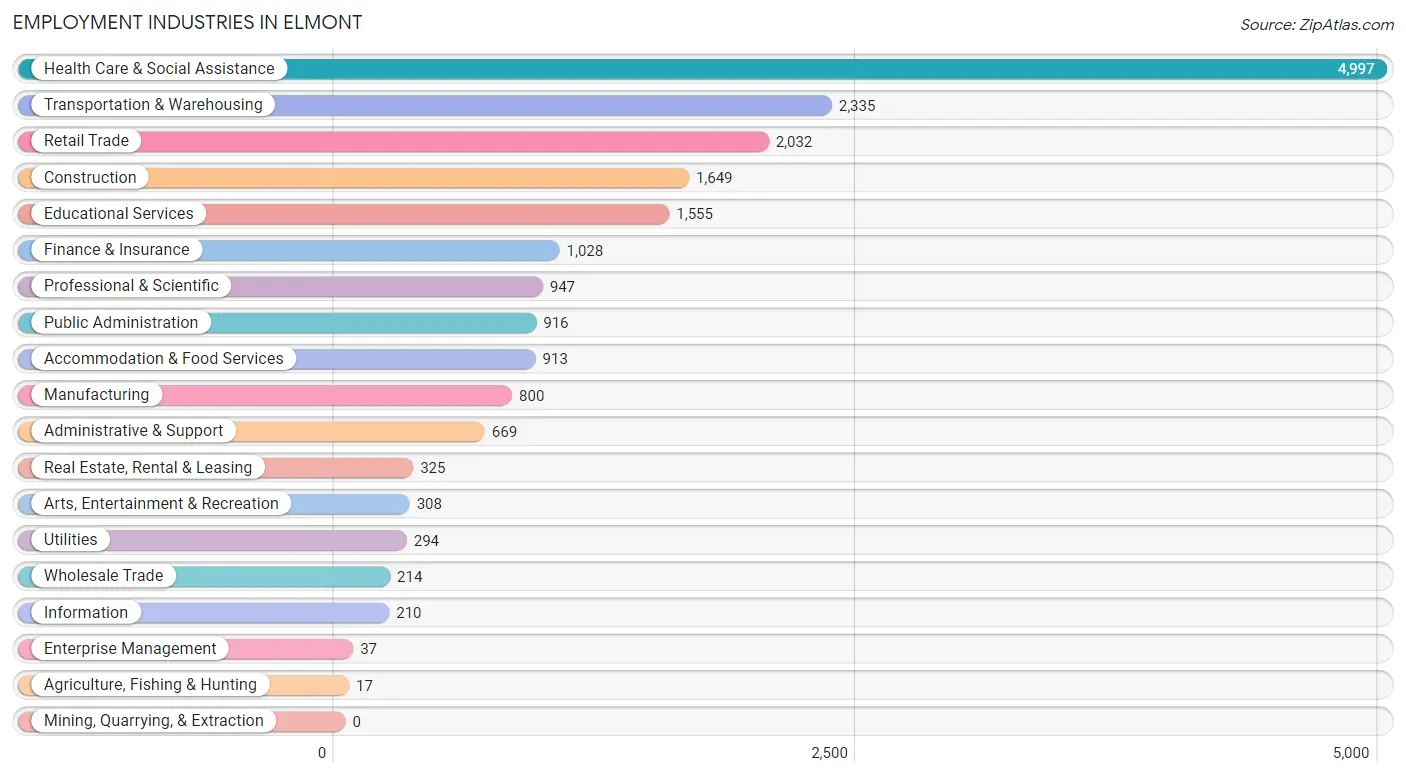
Employment Industries in Elmont
The major employment industries in Elmont include Health Care & Social Assistance (4,997 | 25.0%), Transportation & Warehousing (2,335 | 11.7%), Retail Trade (2,032 | 10.2%), Construction (1,649 | 8.2%), and Educational Services (1,555 | 7.8%).
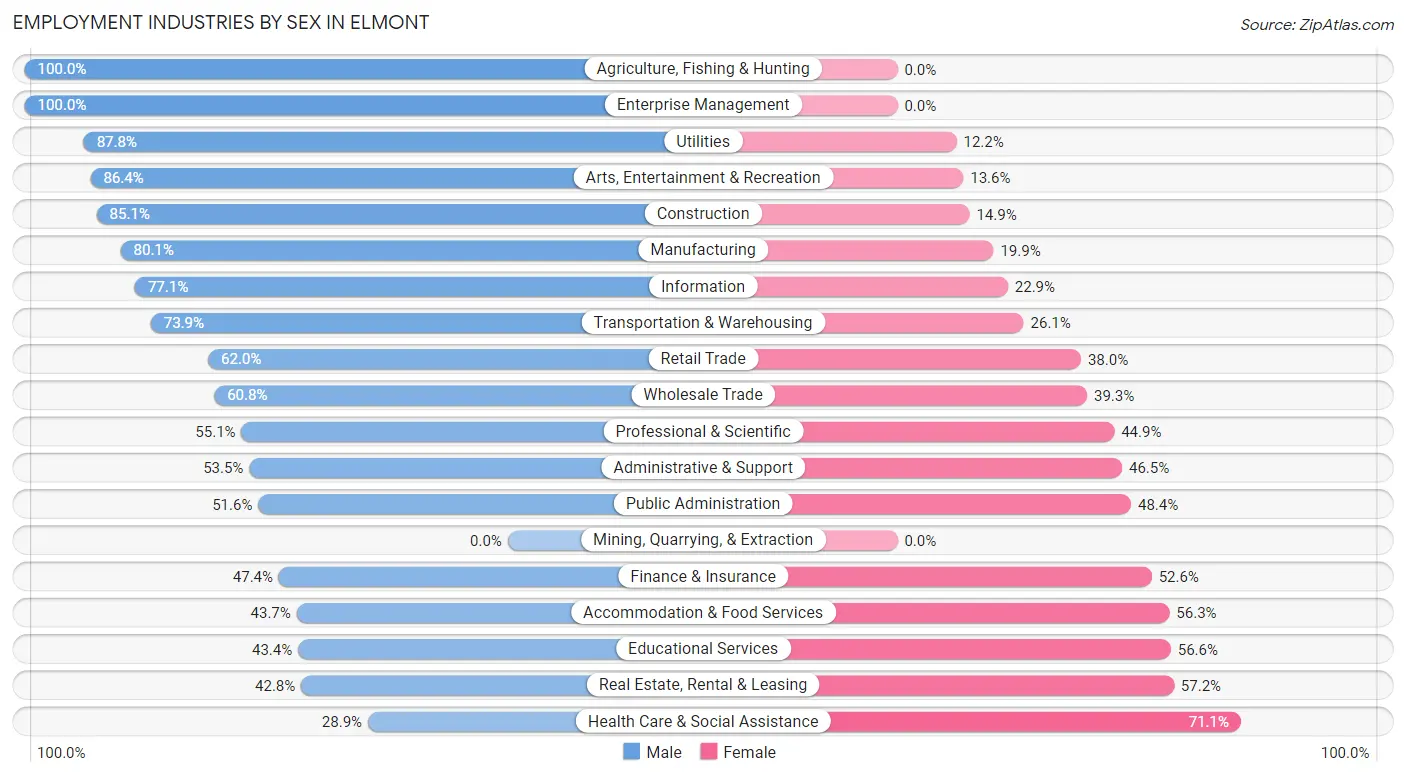
Employment Industries by Sex in Elmont
The Elmont industries that see more men than women are Agriculture, Fishing & Hunting (100.0%), Enterprise Management (100.0%), and Utilities (87.8%), whereas the industries that tend to have a higher number of women are Health Care & Social Assistance (71.1%), Real Estate, Rental & Leasing (57.2%), and Educational Services (56.6%).
| Industry | Male | Female |
| Agriculture, Fishing & Hunting | 17 (100.0%) | 0 (0.0%) |
| Mining, Quarrying, & Extraction | 0 (0.0%) | 0 (0.0%) |
| Construction | 1,403 (85.1%) | 246 (14.9%) |
| Manufacturing | 641 (80.1%) | 159 (19.9%) |
| Wholesale Trade | 130 (60.8%) | 84 (39.3%) |
| Retail Trade | 1,260 (62.0%) | 772 (38.0%) |
| Transportation & Warehousing | 1,725 (73.9%) | 610 (26.1%) |
| Utilities | 258 (87.8%) | 36 (12.2%) |
| Information | 162 (77.1%) | 48 (22.9%) |
| Finance & Insurance | 487 (47.4%) | 541 (52.6%) |
| Real Estate, Rental & Leasing | 139 (42.8%) | 186 (57.2%) |
| Professional & Scientific | 522 (55.1%) | 425 (44.9%) |
| Enterprise Management | 37 (100.0%) | 0 (0.0%) |
| Administrative & Support | 358 (53.5%) | 311 (46.5%) |
| Educational Services | 675 (43.4%) | 880 (56.6%) |
| Health Care & Social Assistance | 1,446 (28.9%) | 3,551 (71.1%) |
| Arts, Entertainment & Recreation | 266 (86.4%) | 42 (13.6%) |
| Accommodation & Food Services | 399 (43.7%) | 514 (56.3%) |
| Public Administration | 473 (51.6%) | 443 (48.4%) |
| Total | 10,714 (53.5%) | 9,310 (46.5%) |
Education in Elmont
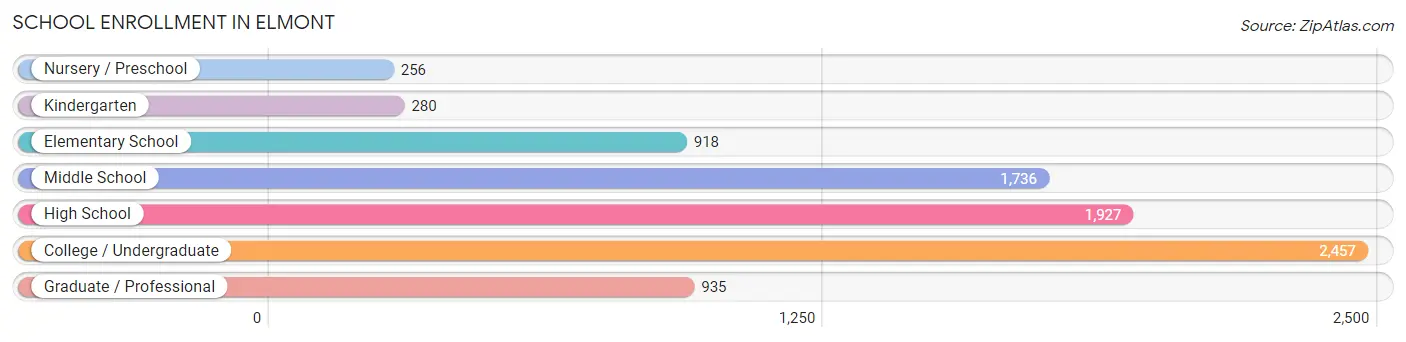
School Enrollment in Elmont
The most common levels of schooling among the 8,509 students in Elmont are college / undergraduate (2,457 | 28.9%), high school (1,927 | 22.7%), and middle school (1,736 | 20.4%).
| School Level | # Students | % Students |
| Nursery / Preschool | 256 | 3.0% |
| Kindergarten | 280 | 3.3% |
| Elementary School | 918 | 10.8% |
| Middle School | 1,736 | 20.4% |
| High School | 1,927 | 22.7% |
| College / Undergraduate | 2,457 | 28.9% |
| Graduate / Professional | 935 | 11.0% |
| Total | 8,509 | 100.0% |
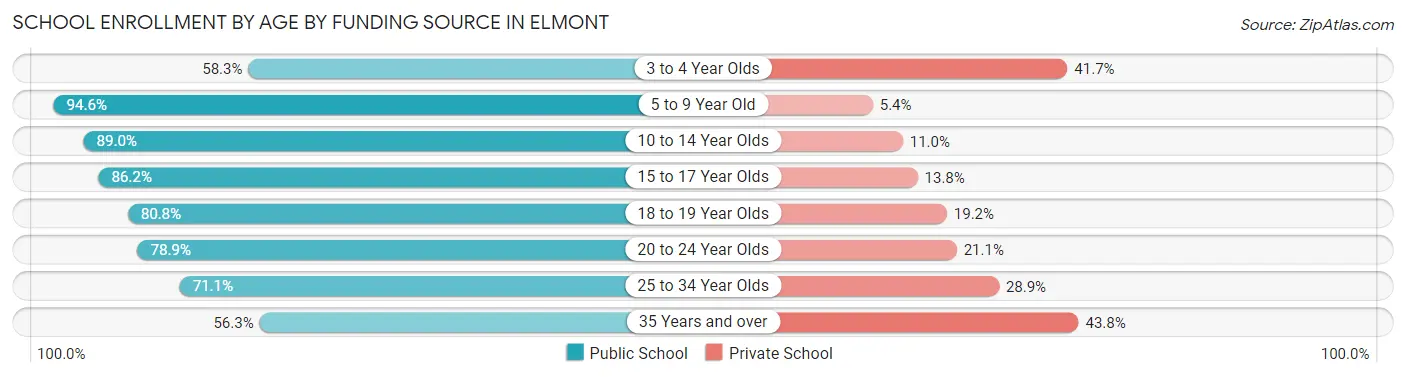
School Enrollment by Age by Funding Source in Elmont
Out of a total of 8,509 students who are enrolled in schools in Elmont, 1,549 (18.2%) attend a private institution, while the remaining 6,960 (81.8%) are enrolled in public schools. The age group of 35 years and over has the highest likelihood of being enrolled in private schools, with 301 (43.8% in the age bracket) enrolled. Conversely, the age group of 5 to 9 year old has the lowest likelihood of being enrolled in a private school, with 1,047 (94.6% in the age bracket) attending a public institution.
| Age Bracket | Public School | Private School |
| 3 to 4 Year Olds | 147 (58.3%) | 105 (41.7%) |
| 5 to 9 Year Old | 1,047 (94.6%) | 60 (5.4%) |
| 10 to 14 Year Olds | 2,157 (89.0%) | 267 (11.0%) |
| 15 to 17 Year Olds | 952 (86.2%) | 152 (13.8%) |
| 18 to 19 Year Olds | 727 (80.8%) | 173 (19.2%) |
| 20 to 24 Year Olds | 997 (78.9%) | 266 (21.1%) |
| 25 to 34 Year Olds | 548 (71.1%) | 223 (28.9%) |
| 35 Years and over | 387 (56.2%) | 301 (43.8%) |
| Total | 6,960 (81.8%) | 1,549 (18.2%) |
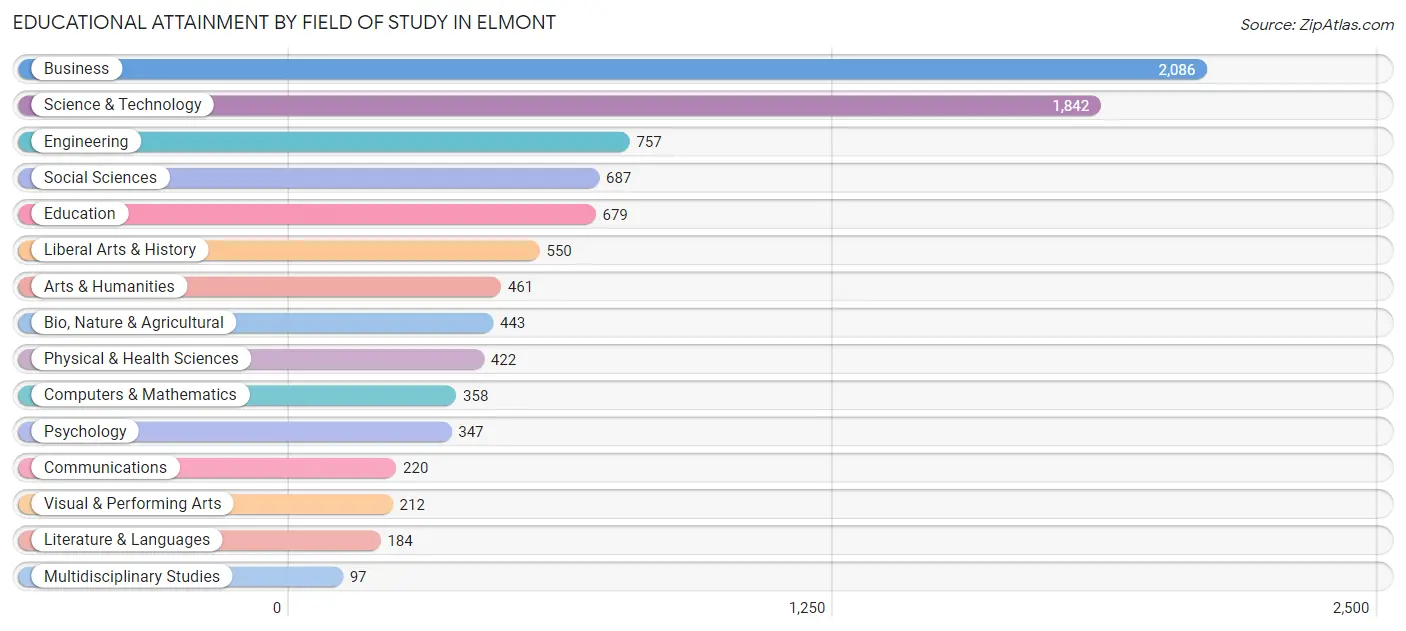
Educational Attainment by Field of Study in Elmont
Business (2,086 | 22.3%), science & technology (1,842 | 19.7%), engineering (757 | 8.1%), social sciences (687 | 7.3%), and education (679 | 7.3%) are the most common fields of study among 9,345 individuals in Elmont who have obtained a bachelor's degree or higher.
| Field of Study | # Graduates | % Graduates |
| Computers & Mathematics | 358 | 3.8% |
| Bio, Nature & Agricultural | 443 | 4.7% |
| Physical & Health Sciences | 422 | 4.5% |
| Psychology | 347 | 3.7% |
| Social Sciences | 687 | 7.3% |
| Engineering | 757 | 8.1% |
| Multidisciplinary Studies | 97 | 1.0% |
| Science & Technology | 1,842 | 19.7% |
| Business | 2,086 | 22.3% |
| Education | 679 | 7.3% |
| Literature & Languages | 184 | 2.0% |
| Liberal Arts & History | 550 | 5.9% |
| Visual & Performing Arts | 212 | 2.3% |
| Communications | 220 | 2.4% |
| Arts & Humanities | 461 | 4.9% |
| Total | 9,345 | 100.0% |
Transportation & Commute in Elmont
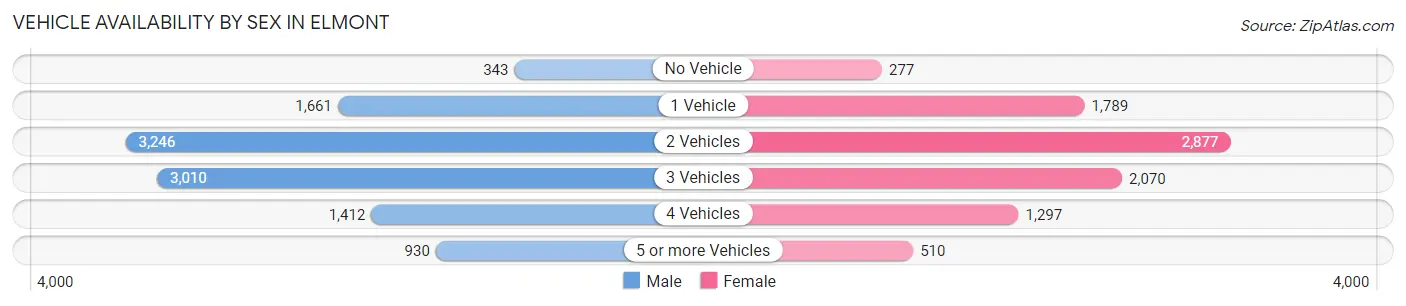
Vehicle Availability by Sex in Elmont
The most prevalent vehicle ownership categories in Elmont are males with 2 vehicles (3,246, accounting for 30.6%) and females with 2 vehicles (2,877, making up 36.8%).
| Vehicles Available | Male | Female |
| No Vehicle | 343 (3.2%) | 277 (3.1%) |
| 1 Vehicle | 1,661 (15.7%) | 1,789 (20.3%) |
| 2 Vehicles | 3,246 (30.6%) | 2,877 (32.6%) |
| 3 Vehicles | 3,010 (28.4%) | 2,070 (23.5%) |
| 4 Vehicles | 1,412 (13.3%) | 1,297 (14.7%) |
| 5 or more Vehicles | 930 (8.8%) | 510 (5.8%) |
| Total | 10,602 (100.0%) | 8,820 (100.0%) |
Commute Time in Elmont
The most frequently occuring commute durations in Elmont are 30 to 34 minutes (3,432 commuters, 18.5%), 60 to 89 minutes (3,204 commuters, 17.2%), and 20 to 24 minutes (2,469 commuters, 13.3%).
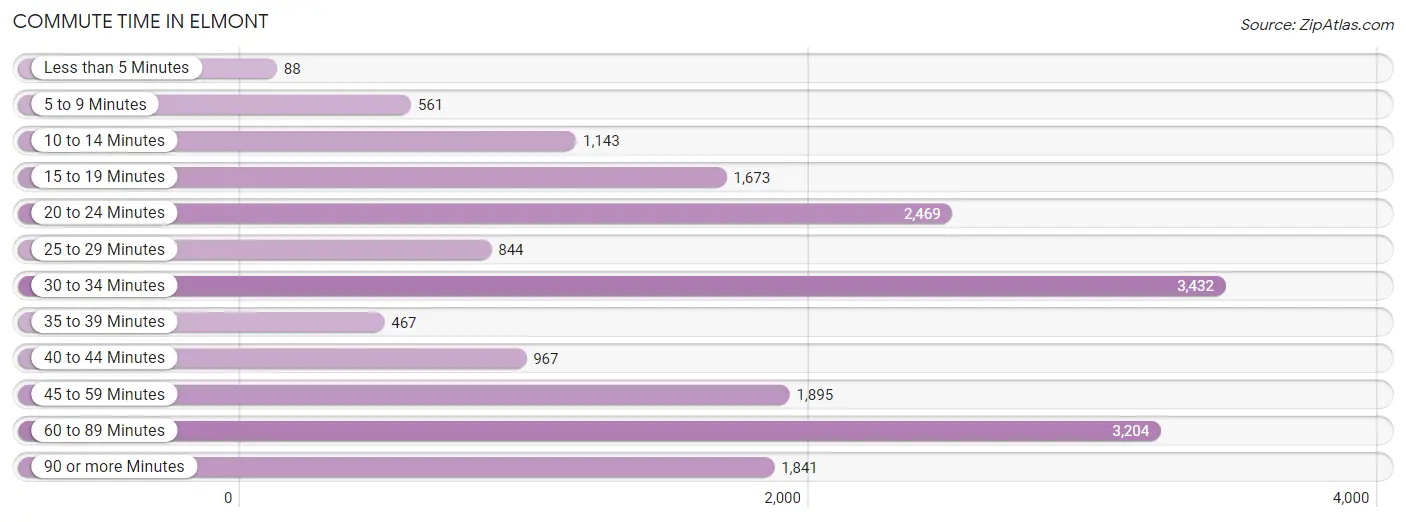
| Commute Time | # Commuters | % Commuters |
| Less than 5 Minutes | 88 | 0.5% |
| 5 to 9 Minutes | 561 | 3.0% |
| 10 to 14 Minutes | 1,143 | 6.1% |
| 15 to 19 Minutes | 1,673 | 9.0% |
| 20 to 24 Minutes | 2,469 | 13.3% |
| 25 to 29 Minutes | 844 | 4.5% |
| 30 to 34 Minutes | 3,432 | 18.5% |
| 35 to 39 Minutes | 467 | 2.5% |
| 40 to 44 Minutes | 967 | 5.2% |
| 45 to 59 Minutes | 1,895 | 10.2% |
| 60 to 89 Minutes | 3,204 | 17.2% |
| 90 or more Minutes | 1,841 | 9.9% |
Commute Time by Sex in Elmont
The most common commute times in Elmont are 60 to 89 minutes (1,901 commuters, 18.7%) for males and 30 to 34 minutes (1,770 commuters, 21.0%) for females.
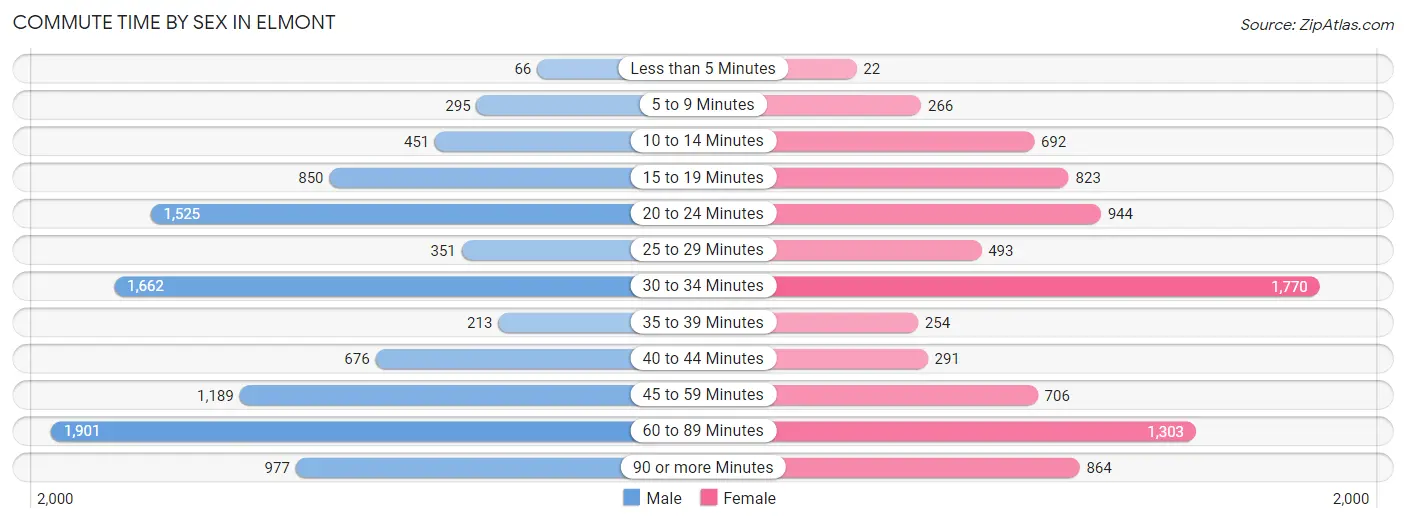
| Commute Time | Male | Female |
| Less than 5 Minutes | 66 (0.6%) | 22 (0.3%) |
| 5 to 9 Minutes | 295 (2.9%) | 266 (3.2%) |
| 10 to 14 Minutes | 451 (4.4%) | 692 (8.2%) |
| 15 to 19 Minutes | 850 (8.4%) | 823 (9.8%) |
| 20 to 24 Minutes | 1,525 (15.0%) | 944 (11.2%) |
| 25 to 29 Minutes | 351 (3.5%) | 493 (5.9%) |
| 30 to 34 Minutes | 1,662 (16.4%) | 1,770 (21.0%) |
| 35 to 39 Minutes | 213 (2.1%) | 254 (3.0%) |
| 40 to 44 Minutes | 676 (6.7%) | 291 (3.5%) |
| 45 to 59 Minutes | 1,189 (11.7%) | 706 (8.4%) |
| 60 to 89 Minutes | 1,901 (18.7%) | 1,303 (15.5%) |
| 90 or more Minutes | 977 (9.6%) | 864 (10.2%) |
Time of Departure to Work by Sex in Elmont
The most frequent times of departure to work in Elmont are 7:00 AM to 7:29 AM (1,412, 13.9%) for males and 7:00 AM to 7:29 AM (1,495, 17.7%) for females.
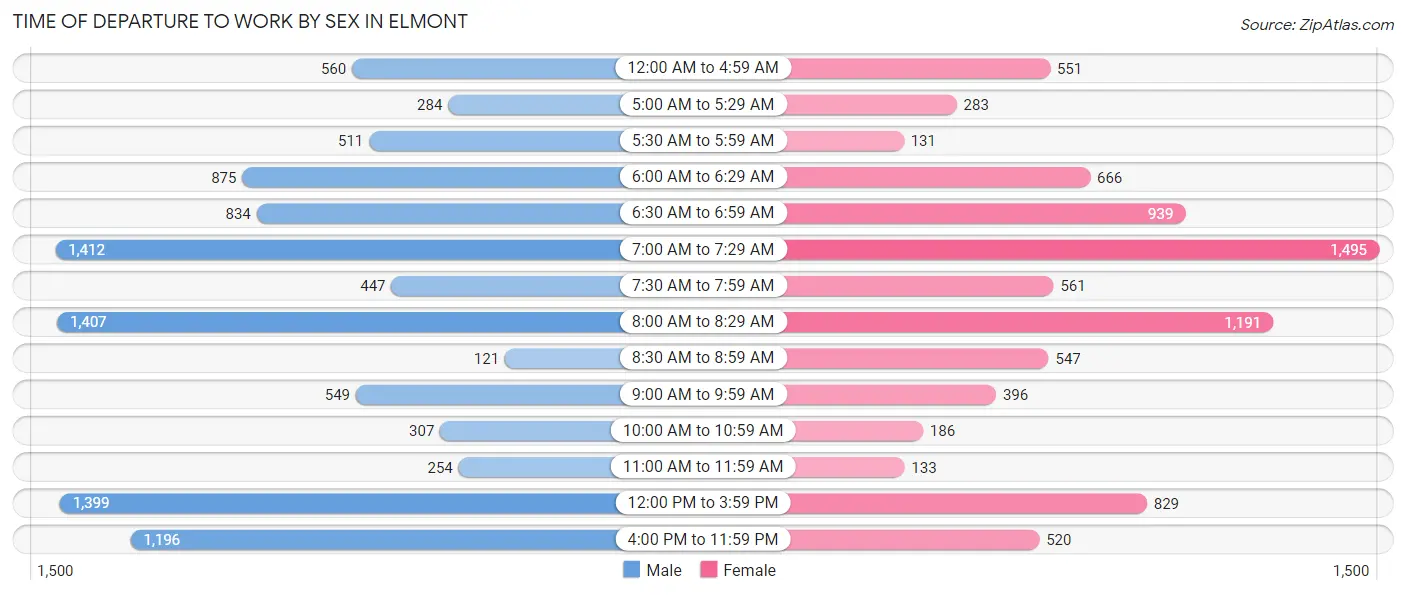
| Time of Departure | Male | Female |
| 12:00 AM to 4:59 AM | 560 (5.5%) | 551 (6.5%) |
| 5:00 AM to 5:29 AM | 284 (2.8%) | 283 (3.4%) |
| 5:30 AM to 5:59 AM | 511 (5.0%) | 131 (1.5%) |
| 6:00 AM to 6:29 AM | 875 (8.6%) | 666 (7.9%) |
| 6:30 AM to 6:59 AM | 834 (8.2%) | 939 (11.1%) |
| 7:00 AM to 7:29 AM | 1,412 (13.9%) | 1,495 (17.7%) |
| 7:30 AM to 7:59 AM | 447 (4.4%) | 561 (6.7%) |
| 8:00 AM to 8:29 AM | 1,407 (13.9%) | 1,191 (14.1%) |
| 8:30 AM to 8:59 AM | 121 (1.2%) | 547 (6.5%) |
| 9:00 AM to 9:59 AM | 549 (5.4%) | 396 (4.7%) |
| 10:00 AM to 10:59 AM | 307 (3.0%) | 186 (2.2%) |
| 11:00 AM to 11:59 AM | 254 (2.5%) | 133 (1.6%) |
| 12:00 PM to 3:59 PM | 1,399 (13.8%) | 829 (9.8%) |
| 4:00 PM to 11:59 PM | 1,196 (11.8%) | 520 (6.2%) |
| Total | 10,156 (100.0%) | 8,428 (100.0%) |
Housing Occupancy in Elmont
Occupancy by Ownership in Elmont
Of the total 10,260 dwellings in Elmont, owner-occupied units account for 8,086 (78.8%), while renter-occupied units make up 2,174 (21.2%).
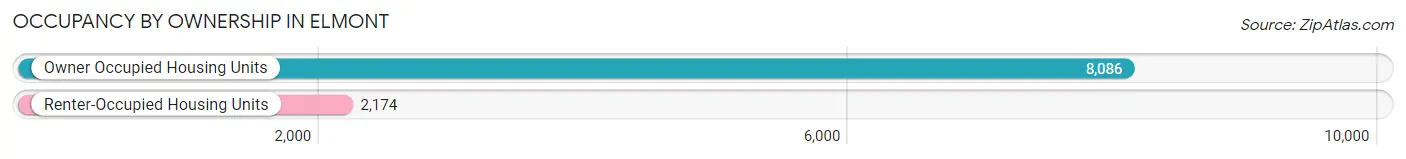
| Occupancy | # Housing Units | % Housing Units |
| Owner Occupied Housing Units | 8,086 | 78.8% |
| Renter-Occupied Housing Units | 2,174 | 21.2% |
| Total Occupied Housing Units | 10,260 | 100.0% |
Occupancy by Household Size in Elmont
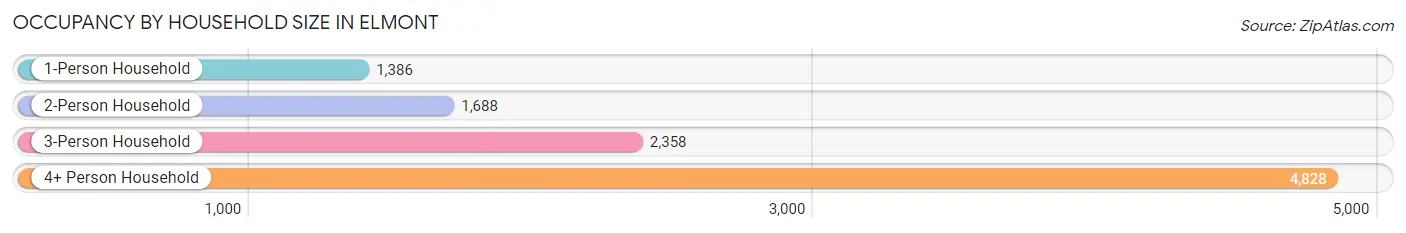
| Household Size | # Housing Units | % Housing Units |
| 1-Person Household | 1,386 | 13.5% |
| 2-Person Household | 1,688 | 16.5% |
| 3-Person Household | 2,358 | 23.0% |
| 4+ Person Household | 4,828 | 47.1% |
| Total Housing Units | 10,260 | 100.0% |
Occupancy by Ownership by Household Size in Elmont
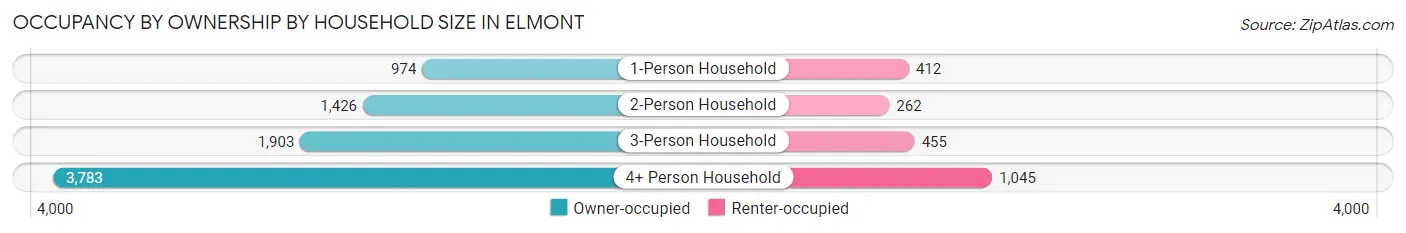
| Household Size | Owner-occupied | Renter-occupied |
| 1-Person Household | 974 (70.3%) | 412 (29.7%) |
| 2-Person Household | 1,426 (84.5%) | 262 (15.5%) |
| 3-Person Household | 1,903 (80.7%) | 455 (19.3%) |
| 4+ Person Household | 3,783 (78.4%) | 1,045 (21.6%) |
| Total Housing Units | 8,086 (78.8%) | 2,174 (21.2%) |
Occupancy by Educational Attainment in Elmont
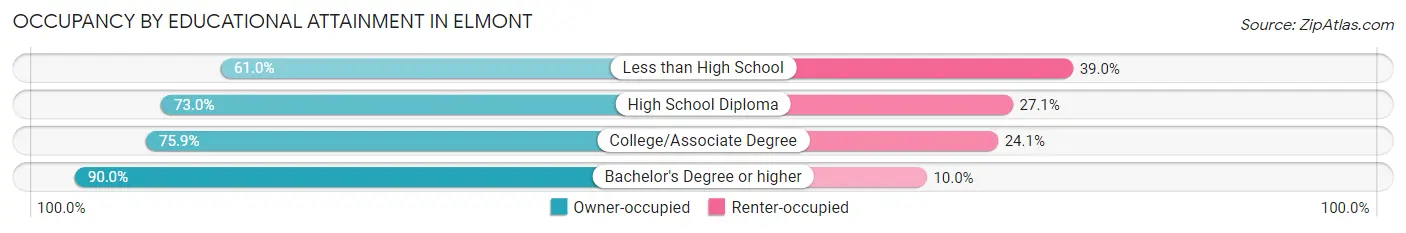
| Household Size | Owner-occupied | Renter-occupied |
| Less than High School | 727 (61.0%) | 464 (39.0%) |
| High School Diploma | 1,548 (73.0%) | 574 (27.1%) |
| College/Associate Degree | 2,381 (75.9%) | 756 (24.1%) |
| Bachelor's Degree or higher | 3,430 (90.0%) | 380 (10.0%) |
Occupancy by Age of Householder in Elmont
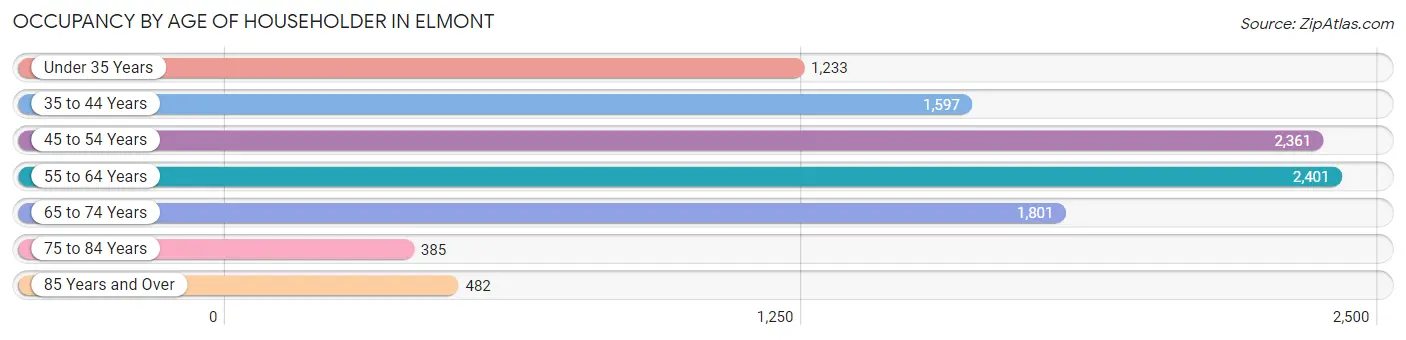
| Age Bracket | # Households | % Households |
| Under 35 Years | 1,233 | 12.0% |
| 35 to 44 Years | 1,597 | 15.6% |
| 45 to 54 Years | 2,361 | 23.0% |
| 55 to 64 Years | 2,401 | 23.4% |
| 65 to 74 Years | 1,801 | 17.5% |
| 75 to 84 Years | 385 | 3.7% |
| 85 Years and Over | 482 | 4.7% |
| Total | 10,260 | 100.0% |
Housing Finances in Elmont
Median Income by Occupancy in Elmont
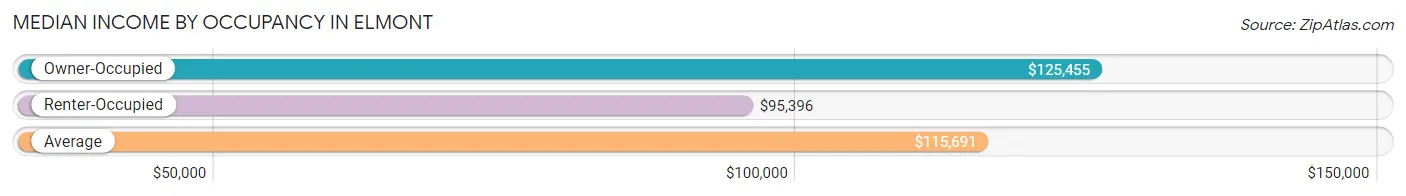
| Occupancy Type | # Households | Median Income |
| Owner-Occupied | 8,086 (78.8%) | $125,455 |
| Renter-Occupied | 2,174 (21.2%) | $95,396 |
| Average | 10,260 (100.0%) | $115,691 |
Occupancy by Householder Income Bracket in Elmont
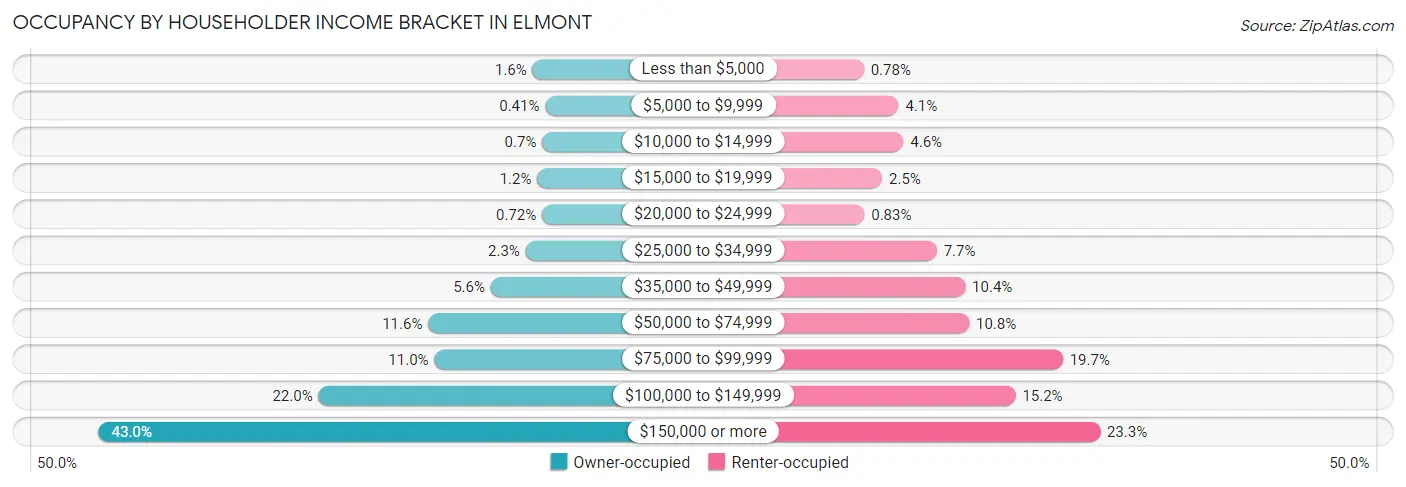
| Income Bracket | Owner-occupied | Renter-occupied |
| Less than $5,000 | 131 (1.6%) | 17 (0.8%) |
| $5,000 to $9,999 | 33 (0.4%) | 89 (4.1%) |
| $10,000 to $14,999 | 57 (0.7%) | 99 (4.5%) |
| $15,000 to $19,999 | 95 (1.2%) | 55 (2.5%) |
| $20,000 to $24,999 | 58 (0.7%) | 18 (0.8%) |
| $25,000 to $34,999 | 184 (2.3%) | 168 (7.7%) |
| $35,000 to $49,999 | 453 (5.6%) | 227 (10.4%) |
| $50,000 to $74,999 | 935 (11.6%) | 235 (10.8%) |
| $75,000 to $99,999 | 887 (11.0%) | 429 (19.7%) |
| $100,000 to $149,999 | 1,780 (22.0%) | 331 (15.2%) |
| $150,000 or more | 3,473 (42.9%) | 506 (23.3%) |
| Total | 8,086 (100.0%) | 2,174 (100.0%) |
Monthly Housing Cost Tiers in Elmont
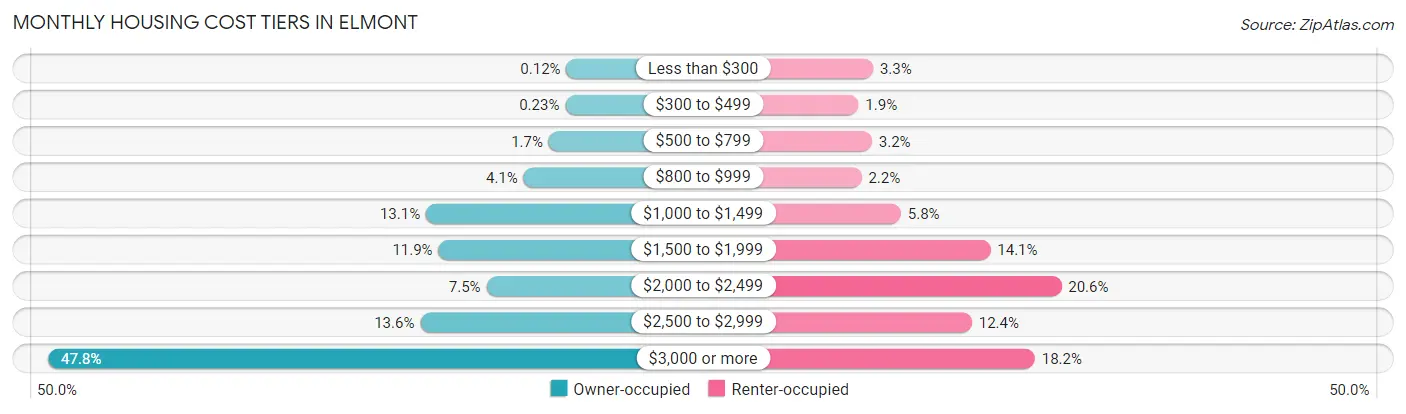
| Monthly Cost | Owner-occupied | Renter-occupied |
| Less than $300 | 10 (0.1%) | 71 (3.3%) |
| $300 to $499 | 19 (0.2%) | 42 (1.9%) |
| $500 to $799 | 141 (1.7%) | 69 (3.2%) |
| $800 to $999 | 328 (4.1%) | 48 (2.2%) |
| $1,000 to $1,499 | 1,055 (13.1%) | 127 (5.8%) |
| $1,500 to $1,999 | 962 (11.9%) | 306 (14.1%) |
| $2,000 to $2,499 | 605 (7.5%) | 448 (20.6%) |
| $2,500 to $2,999 | 1,098 (13.6%) | 269 (12.4%) |
| $3,000 or more | 3,868 (47.8%) | 395 (18.2%) |
| Total | 8,086 (100.0%) | 2,174 (100.0%) |
Physical Housing Characteristics in Elmont
Housing Structures in Elmont
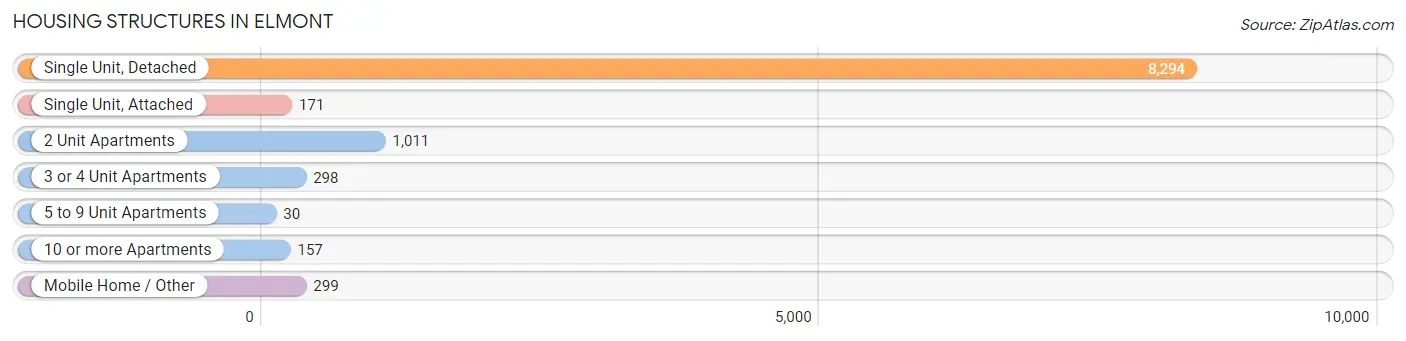
| Structure Type | # Housing Units | % Housing Units |
| Single Unit, Detached | 8,294 | 80.8% |
| Single Unit, Attached | 171 | 1.7% |
| 2 Unit Apartments | 1,011 | 9.9% |
| 3 or 4 Unit Apartments | 298 | 2.9% |
| 5 to 9 Unit Apartments | 30 | 0.3% |
| 10 or more Apartments | 157 | 1.5% |
| Mobile Home / Other | 299 | 2.9% |
| Total | 10,260 | 100.0% |
Housing Structures by Occupancy in Elmont
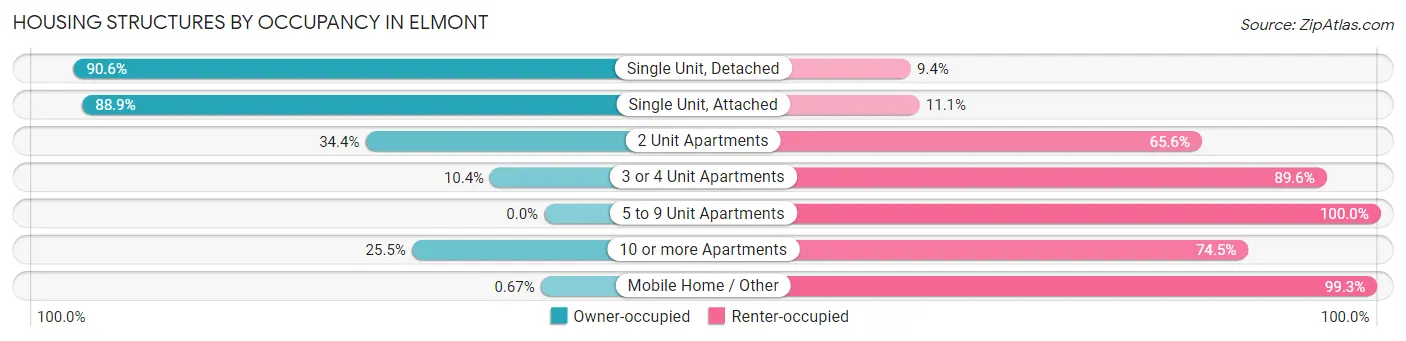
| Structure Type | Owner-occupied | Renter-occupied |
| Single Unit, Detached | 7,513 (90.6%) | 781 (9.4%) |
| Single Unit, Attached | 152 (88.9%) | 19 (11.1%) |
| 2 Unit Apartments | 348 (34.4%) | 663 (65.6%) |
| 3 or 4 Unit Apartments | 31 (10.4%) | 267 (89.6%) |
| 5 to 9 Unit Apartments | 0 (0.0%) | 30 (100.0%) |
| 10 or more Apartments | 40 (25.5%) | 117 (74.5%) |
| Mobile Home / Other | 2 (0.7%) | 297 (99.3%) |
| Total | 8,086 (78.8%) | 2,174 (21.2%) |
Housing Structures by Number of Rooms in Elmont
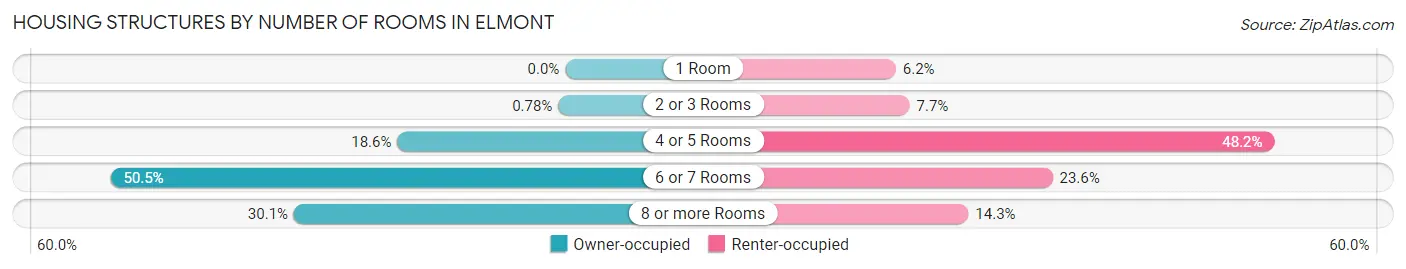
| Number of Rooms | Owner-occupied | Renter-occupied |
| 1 Room | 0 (0.0%) | 135 (6.2%) |
| 2 or 3 Rooms | 63 (0.8%) | 168 (7.7%) |
| 4 or 5 Rooms | 1,507 (18.6%) | 1,048 (48.2%) |
| 6 or 7 Rooms | 4,081 (50.5%) | 513 (23.6%) |
| 8 or more Rooms | 2,435 (30.1%) | 310 (14.3%) |
| Total | 8,086 (100.0%) | 2,174 (100.0%) |
Housing Structure by Heating Type in Elmont
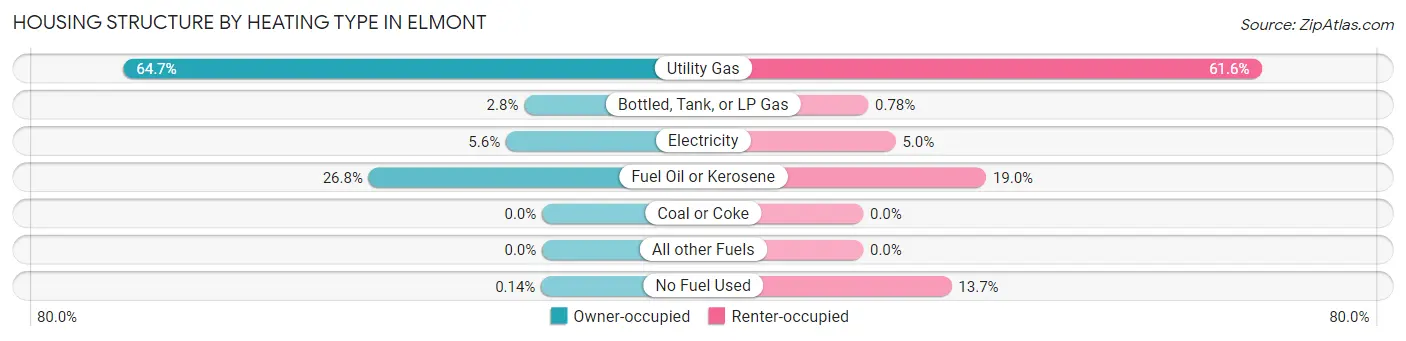
| Heating Type | Owner-occupied | Renter-occupied |
| Utility Gas | 5,234 (64.7%) | 1,338 (61.6%) |
| Bottled, Tank, or LP Gas | 223 (2.8%) | 17 (0.8%) |
| Electricity | 451 (5.6%) | 109 (5.0%) |
| Fuel Oil or Kerosene | 2,167 (26.8%) | 413 (19.0%) |
| Coal or Coke | 0 (0.0%) | 0 (0.0%) |
| All other Fuels | 0 (0.0%) | 0 (0.0%) |
| No Fuel Used | 11 (0.1%) | 297 (13.7%) |
| Total | 8,086 (100.0%) | 2,174 (100.0%) |
Household Vehicle Usage in Elmont
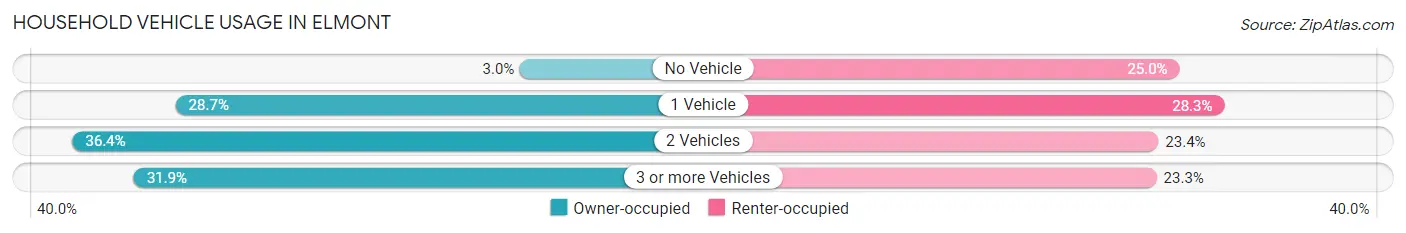
| Vehicles per Household | Owner-occupied | Renter-occupied |
| No Vehicle | 242 (3.0%) | 543 (25.0%) |
| 1 Vehicle | 2,323 (28.7%) | 616 (28.3%) |
| 2 Vehicles | 2,946 (36.4%) | 509 (23.4%) |
| 3 or more Vehicles | 2,575 (31.9%) | 506 (23.3%) |
| Total | 8,086 (100.0%) | 2,174 (100.0%) |
Real Estate & Mortgages in Elmont
Real Estate and Mortgage Overview in Elmont
| Characteristic | Without Mortgage | With Mortgage |
| Housing Units | 2,245 | 5,841 |
| Median Property Value | $488,100 | $552,100 |
| Median Household Income | $101,509 | $2,901 |
| Monthly Housing Costs | $1,358 | $3,868 |
| Real Estate Taxes | $10,001 | $42 |
Property Value by Mortgage Status in Elmont
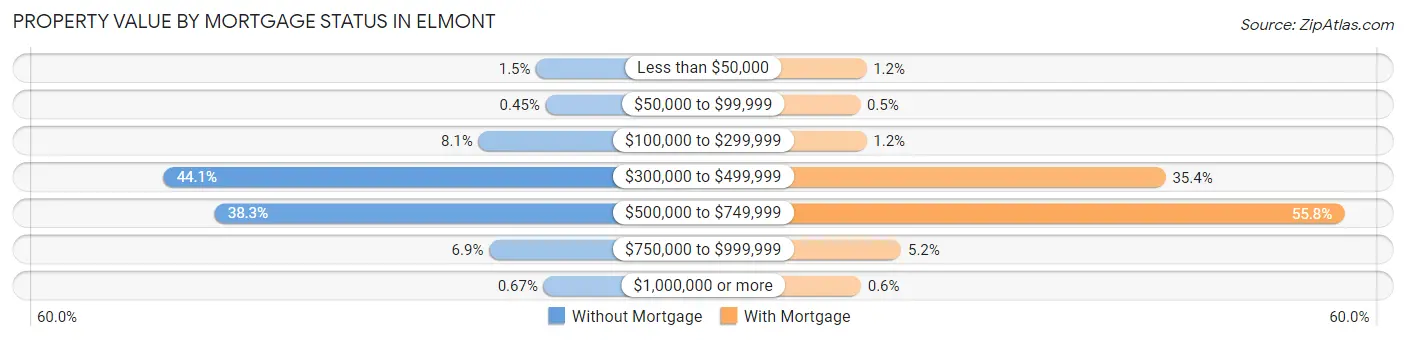
| Property Value | Without Mortgage | With Mortgage |
| Less than $50,000 | 34 (1.5%) | 71 (1.2%) |
| $50,000 to $99,999 | 10 (0.4%) | 29 (0.5%) |
| $100,000 to $299,999 | 182 (8.1%) | 72 (1.2%) |
| $300,000 to $499,999 | 990 (44.1%) | 2,069 (35.4%) |
| $500,000 to $749,999 | 859 (38.3%) | 3,261 (55.8%) |
| $750,000 to $999,999 | 155 (6.9%) | 304 (5.2%) |
| $1,000,000 or more | 15 (0.7%) | 35 (0.6%) |
| Total | 2,245 (100.0%) | 5,841 (100.0%) |
Household Income by Mortgage Status in Elmont
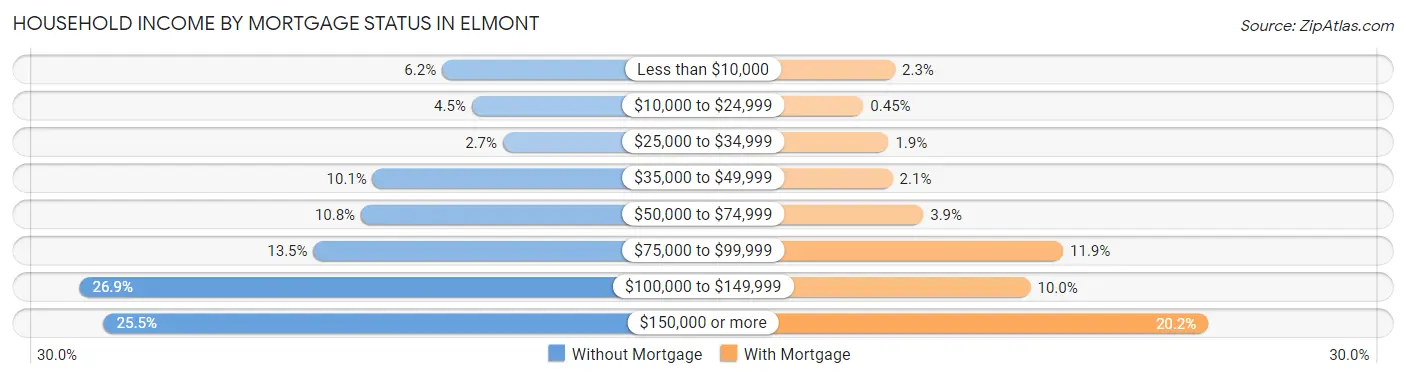
| Household Income | Without Mortgage | With Mortgage |
| Less than $10,000 | 138 (6.1%) | 132 (2.3%) |
| $10,000 to $24,999 | 100 (4.4%) | 26 (0.4%) |
| $25,000 to $34,999 | 60 (2.7%) | 110 (1.9%) |
| $35,000 to $49,999 | 227 (10.1%) | 124 (2.1%) |
| $50,000 to $74,999 | 242 (10.8%) | 226 (3.9%) |
| $75,000 to $99,999 | 303 (13.5%) | 693 (11.9%) |
| $100,000 to $149,999 | 603 (26.9%) | 584 (10.0%) |
| $150,000 or more | 572 (25.5%) | 1,177 (20.2%) |
| Total | 2,245 (100.0%) | 5,841 (100.0%) |
Property Value to Household Income Ratio in Elmont
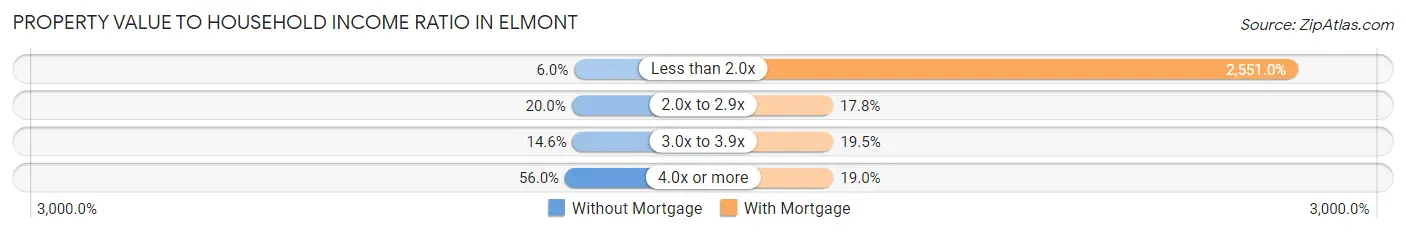
| Value-to-Income Ratio | Without Mortgage | With Mortgage |
| Less than 2.0x | 134 (6.0%) | 149,005 (2,551.0%) |
| 2.0x to 2.9x | 448 (20.0%) | 1,037 (17.7%) |
| 3.0x to 3.9x | 328 (14.6%) | 1,139 (19.5%) |
| 4.0x or more | 1,257 (56.0%) | 1,110 (19.0%) |
| Total | 2,245 (100.0%) | 5,841 (100.0%) |
Real Estate Taxes by Mortgage Status in Elmont
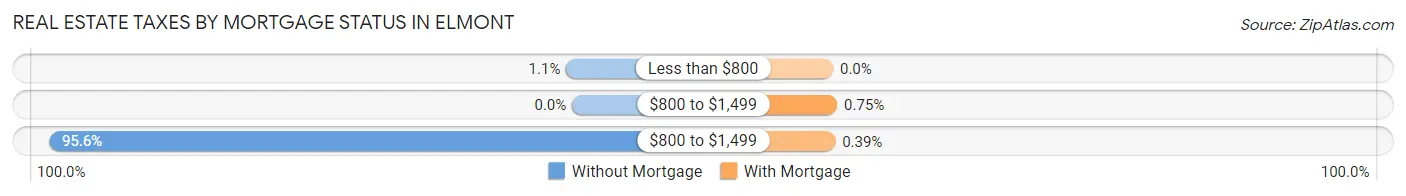
| Property Taxes | Without Mortgage | With Mortgage |
| Less than $800 | 24 (1.1%) | 0 (0.0%) |
| $800 to $1,499 | 0 (0.0%) | 44 (0.7%) |
| $800 to $1,499 | 2,145 (95.6%) | 23 (0.4%) |
| Total | 2,245 (100.0%) | 5,841 (100.0%) |
Health & Disability in Elmont
Health Insurance Coverage by Age in Elmont
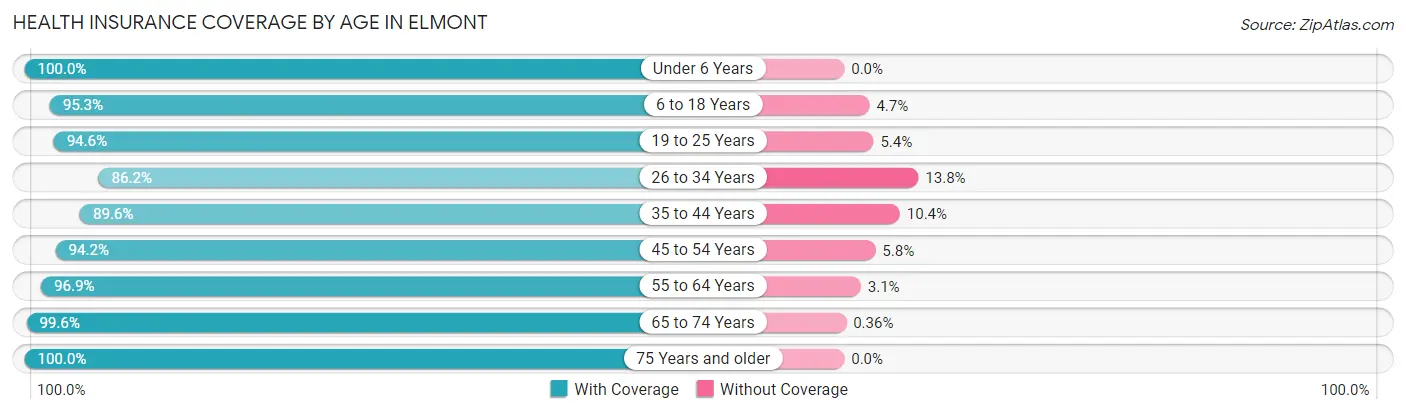
| Age Bracket | With Coverage | Without Coverage |
| Under 6 Years | 2,471 (100.0%) | 0 (0.0%) |
| 6 to 18 Years | 4,909 (95.3%) | 242 (4.7%) |
| 19 to 25 Years | 3,531 (94.6%) | 203 (5.4%) |
| 26 to 34 Years | 5,031 (86.2%) | 807 (13.8%) |
| 35 to 44 Years | 4,389 (89.6%) | 507 (10.4%) |
| 45 to 54 Years | 4,934 (94.2%) | 304 (5.8%) |
| 55 to 64 Years | 4,700 (96.9%) | 150 (3.1%) |
| 65 to 74 Years | 3,636 (99.6%) | 13 (0.4%) |
| 75 Years and older | 2,039 (100.0%) | 0 (0.0%) |
| Total | 35,640 (94.1%) | 2,226 (5.9%) |
Health Insurance Coverage by Citizenship Status in Elmont
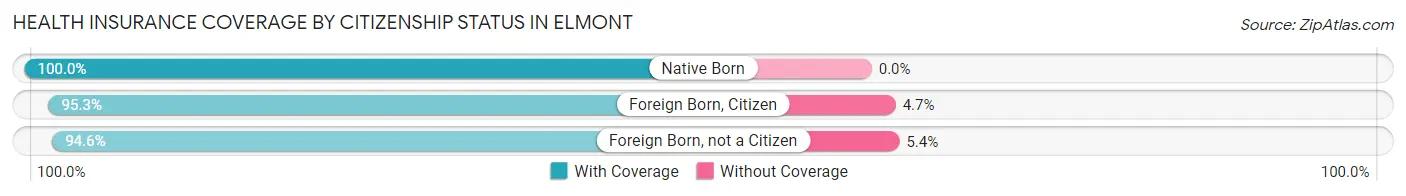
| Citizenship Status | With Coverage | Without Coverage |
| Native Born | 2,471 (100.0%) | 0 (0.0%) |
| Foreign Born, Citizen | 4,909 (95.3%) | 242 (4.7%) |
| Foreign Born, not a Citizen | 3,531 (94.6%) | 203 (5.4%) |
Health Insurance Coverage by Household Income in Elmont
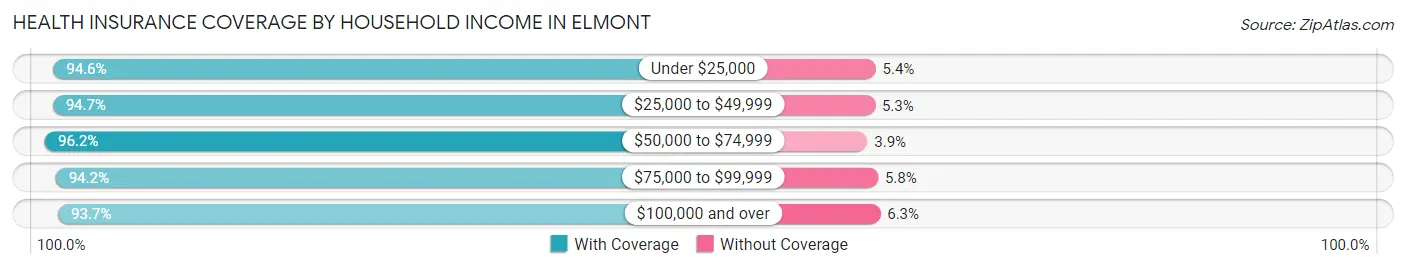
| Household Income | With Coverage | Without Coverage |
| Under $25,000 | 981 (94.6%) | 56 (5.4%) |
| $25,000 to $49,999 | 2,590 (94.7%) | 144 (5.3%) |
| $50,000 to $74,999 | 3,549 (96.2%) | 142 (3.8%) |
| $75,000 to $99,999 | 4,400 (94.2%) | 273 (5.8%) |
| $100,000 and over | 24,085 (93.7%) | 1,610 (6.3%) |
Public vs Private Health Insurance Coverage by Age in Elmont
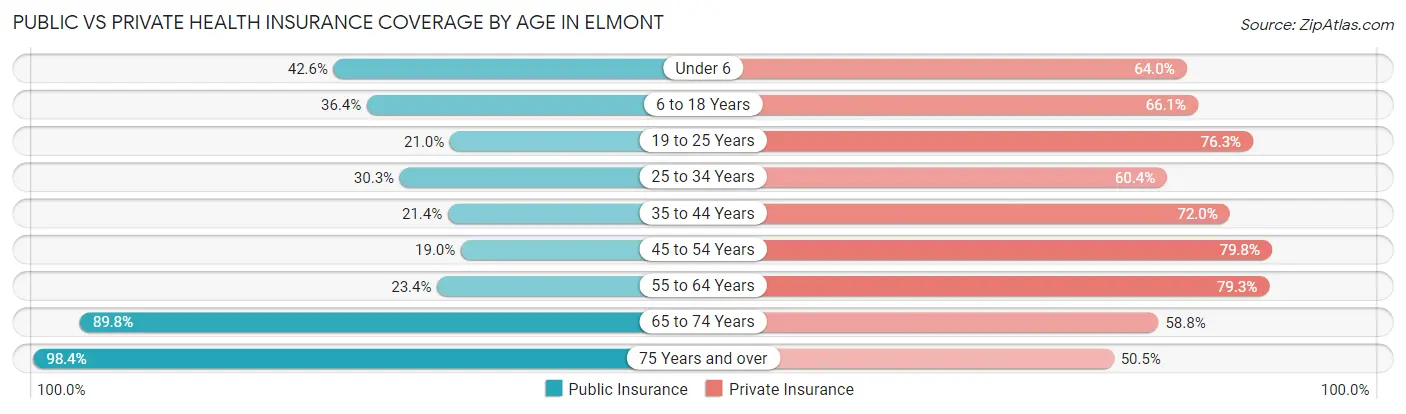
| Age Bracket | Public Insurance | Private Insurance |
| Under 6 | 1,053 (42.6%) | 1,581 (64.0%) |
| 6 to 18 Years | 1,876 (36.4%) | 3,404 (66.1%) |
| 19 to 25 Years | 785 (21.0%) | 2,849 (76.3%) |
| 25 to 34 Years | 1,771 (30.3%) | 3,525 (60.4%) |
| 35 to 44 Years | 1,048 (21.4%) | 3,523 (72.0%) |
| 45 to 54 Years | 994 (19.0%) | 4,180 (79.8%) |
| 55 to 64 Years | 1,135 (23.4%) | 3,847 (79.3%) |
| 65 to 74 Years | 3,275 (89.7%) | 2,145 (58.8%) |
| 75 Years and over | 2,006 (98.4%) | 1,029 (50.5%) |
| Total | 13,943 (36.8%) | 26,083 (68.9%) |
Disability Status by Sex by Age in Elmont
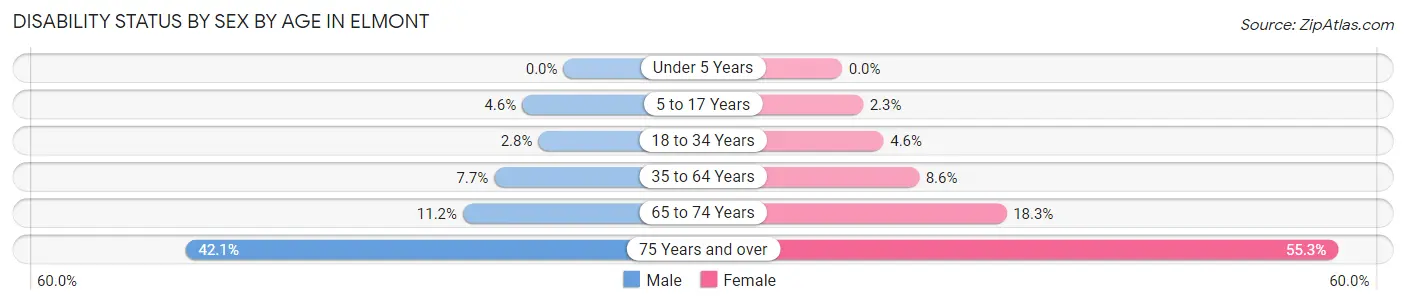
| Age Bracket | Male | Female |
| Under 5 Years | 0 (0.0%) | 0 (0.0%) |
| 5 to 17 Years | 142 (4.6%) | 44 (2.3%) |
| 18 to 34 Years | 145 (2.8%) | 226 (4.6%) |
| 35 to 64 Years | 552 (7.7%) | 671 (8.6%) |
| 65 to 74 Years | 208 (11.2%) | 328 (18.3%) |
| 75 Years and over | 319 (42.1%) | 708 (55.3%) |
Disability Class by Sex by Age in Elmont
Disability Class: Hearing Difficulty
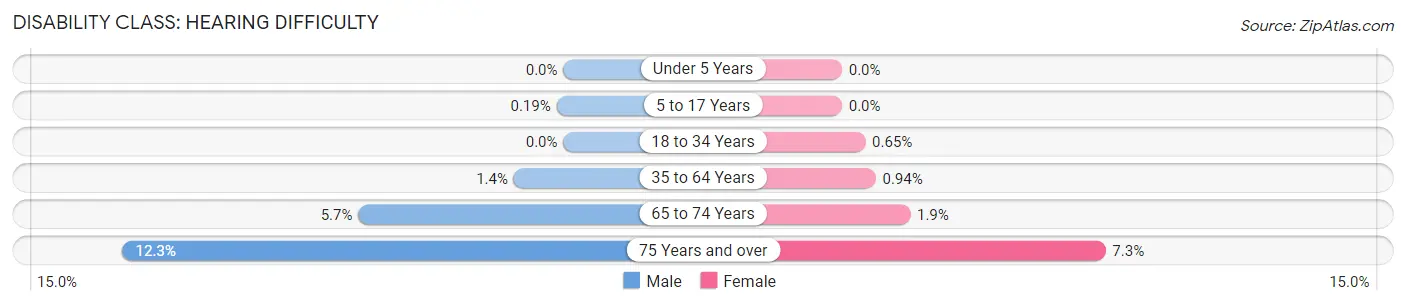
| Age Bracket | Male | Female |
| Under 5 Years | 0 (0.0%) | 0 (0.0%) |
| 5 to 17 Years | 6 (0.2%) | 0 (0.0%) |
| 18 to 34 Years | 0 (0.0%) | 32 (0.6%) |
| 35 to 64 Years | 99 (1.4%) | 74 (0.9%) |
| 65 to 74 Years | 106 (5.7%) | 34 (1.9%) |
| 75 Years and over | 93 (12.3%) | 94 (7.3%) |
Disability Class: Vision Difficulty
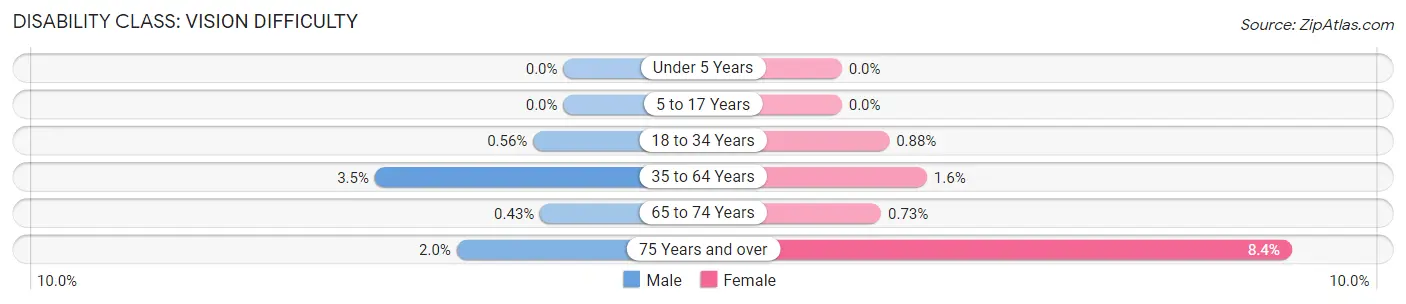
| Age Bracket | Male | Female |
| Under 5 Years | 0 (0.0%) | 0 (0.0%) |
| 5 to 17 Years | 0 (0.0%) | 0 (0.0%) |
| 18 to 34 Years | 29 (0.6%) | 43 (0.9%) |
| 35 to 64 Years | 250 (3.5%) | 124 (1.6%) |
| 65 to 74 Years | 8 (0.4%) | 13 (0.7%) |
| 75 Years and over | 15 (2.0%) | 107 (8.4%) |
Disability Class: Cognitive Difficulty
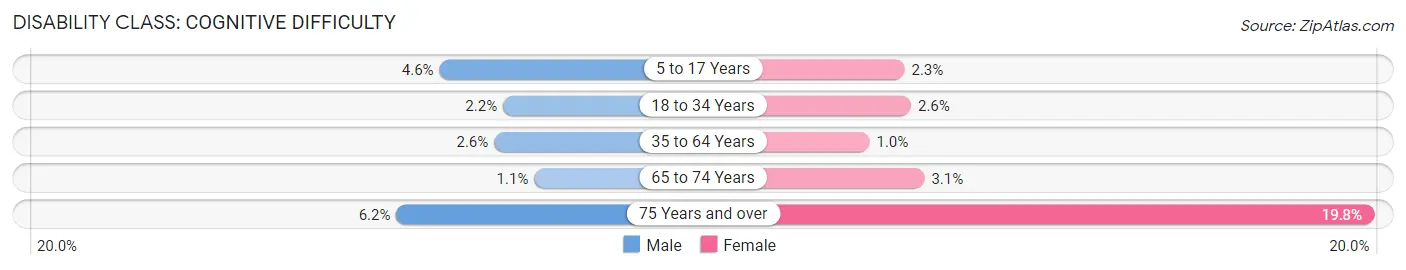
| Age Bracket | Male | Female |
| 5 to 17 Years | 142 (4.6%) | 44 (2.3%) |
| 18 to 34 Years | 116 (2.2%) | 126 (2.6%) |
| 35 to 64 Years | 184 (2.6%) | 81 (1.0%) |
| 65 to 74 Years | 20 (1.1%) | 55 (3.1%) |
| 75 Years and over | 47 (6.2%) | 253 (19.8%) |
Disability Class: Ambulatory Difficulty
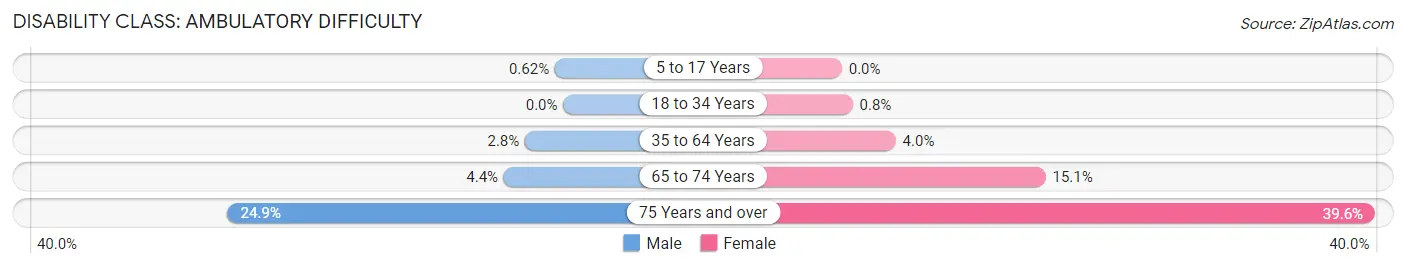
| Age Bracket | Male | Female |
| 5 to 17 Years | 19 (0.6%) | 0 (0.0%) |
| 18 to 34 Years | 0 (0.0%) | 39 (0.8%) |
| 35 to 64 Years | 203 (2.8%) | 313 (4.0%) |
| 65 to 74 Years | 82 (4.4%) | 271 (15.1%) |
| 75 Years and over | 189 (24.9%) | 507 (39.6%) |
Disability Class: Self-Care Difficulty
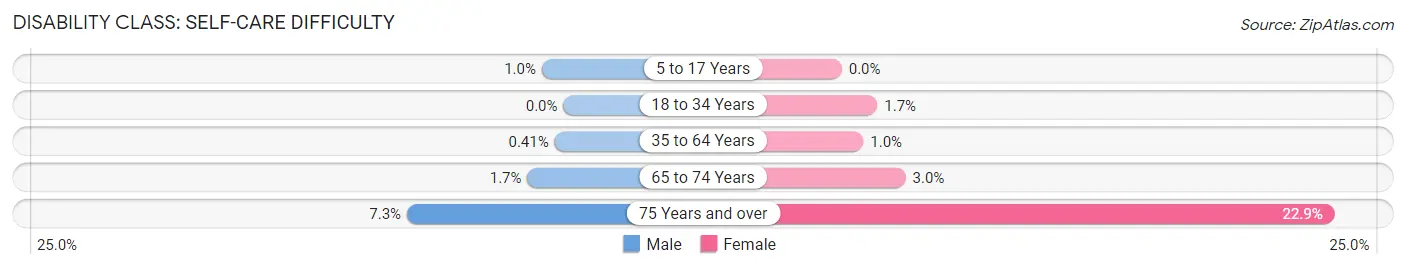
| Age Bracket | Male | Female |
| 5 to 17 Years | 31 (1.0%) | 0 (0.0%) |
| 18 to 34 Years | 0 (0.0%) | 81 (1.7%) |
| 35 to 64 Years | 29 (0.4%) | 78 (1.0%) |
| 65 to 74 Years | 31 (1.7%) | 53 (3.0%) |
| 75 Years and over | 55 (7.3%) | 293 (22.9%) |
Technology Access in Elmont
Computing Device Access in Elmont
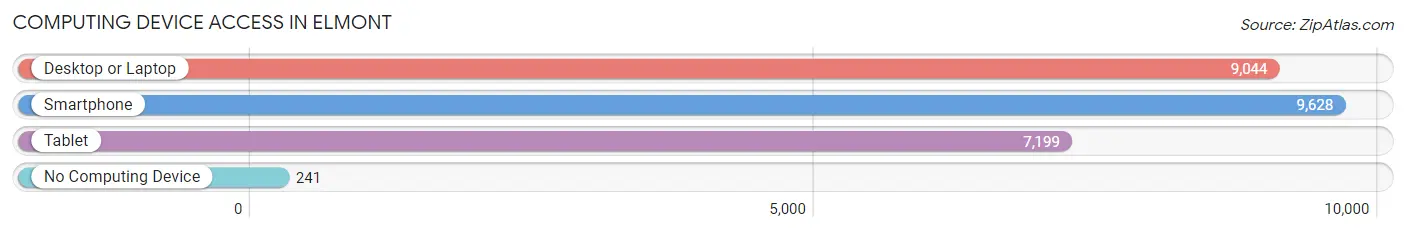
| Device Type | # Households | % Households |
| Desktop or Laptop | 9,044 | 88.1% |
| Smartphone | 9,628 | 93.8% |
| Tablet | 7,199 | 70.2% |
| No Computing Device | 241 | 2.4% |
| Total | 10,260 | 100.0% |
Internet Access in Elmont
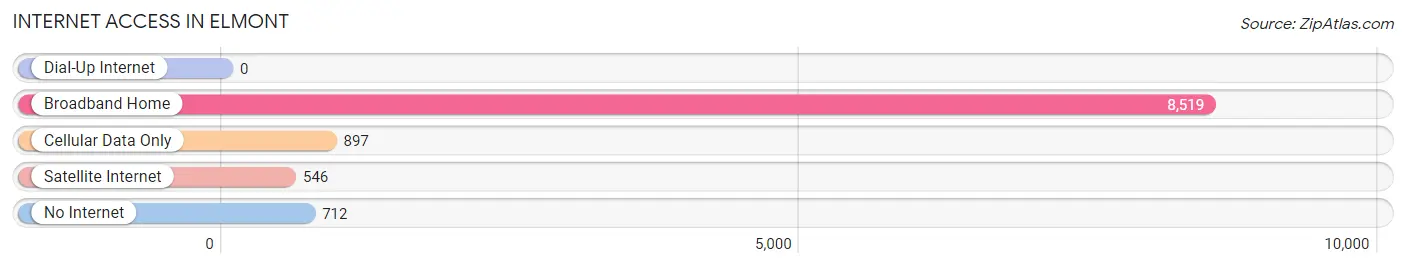
| Internet Type | # Households | % Households |
| Dial-Up Internet | 0 | 0.0% |
| Broadband Home | 8,519 | 83.0% |
| Cellular Data Only | 897 | 8.7% |
| Satellite Internet | 546 | 5.3% |
| No Internet | 712 | 6.9% |
| Total | 10,260 | 100.0% |
Elmont Summary
Elmont is a hamlet and census-designated place (CDP) located in Nassau County, New York, United States, along the border of the borough of Queens in New York City. It is a suburban bedroom community located on Long Island. The population was 33,198 at the 2010 census. Elmont is located in the Town of Hempstead and is home to Belmont Park, which is famous for its annual hosting of the Belmont Stakes, the third leg of the Triple Crown of thoroughbred racing.
History
The area now known as Elmont was first settled by Europeans in 1650. The Dutch West India Company had purchased land in the area from the local Native Americans and divided it into plots. The area was originally known as "Fosters Meadow" and was part of the Town of Hempstead. In 1859, the Long Island Rail Road (LIRR) extended its service to the area, and the area was renamed Elmont after a station that was built there.
The area was largely rural until the early 20th century, when it began to be developed for residential use. The first housing development was built in 1910, and by the 1920s, the area had become a popular suburban community. In the 1930s, Belmont Park was built, and the area became known for its horse racing.
Geography
Elmont is located at 40°41'25" North, 73°41'17" West (40.690278, -73.688056). According to the United States Census Bureau, the CDP has a total area of 4.4 square miles (11.4 km2), all land.
Economy
Elmont is a primarily residential community, and the majority of its residents are employed in the service sector. The largest employers in the area are the Belmont Park racetrack, the Elmont Union Free School District, and the Nassau County government.
Demographics
As of the 2010 census, there were 33,198 people, 10,945 households, and 8,717 families residing in the CDP. The population density was 7,521.3 people per square mile (2,902.2/km2). There were 11,541 housing units at an average density of 2,619.3 per square mile (1,009.2/km2). The racial makeup of the CDP was 44.3% White, 33.2% African American, 0.3% Native American, 11.3% Asian, 0.3% Pacific Islander, 8.2% from other races, and 2.4% from two or more races. Hispanic or Latino of any race were 18.2% of the population.
There were 10,945 households, out of which 37.2% had children under the age of 18 living with them, 54.2% were married couples living together, 15.7% had a female householder with no husband present, and 24.2% were non-families. 19.2% of all households were made up of individuals, and 8.2% had someone living alone who was 65 years of age or older. The average household size was 3.02 and the average family size was 3.45.
In the CDP, the population was spread out, with 25.7% under the age of 18, 8.3% from 18 to 24, 30.2% from 25 to 44, 23.3% from 45 to 64, and 12.5% who were 65 years of age or older. The median age was 36 years. For every 100 females, there were 93.2 males. For every 100 females age 18 and over, there were 89.7 males.
The median income for a household in the CDP was $67,711, and the median income for a family was $76,945. Males had a median income of $45,845 versus $36,945 for females. The per capita income for the CDP was $25,845. About 4.2% of families and 5.7% of the population were below the poverty line, including 6.2% of those under age 18 and 8.2% of those age 65 or over.
Common Questions
What is Per Capita Income in Elmont?
Per Capita income in Elmont is $40,400.
What is the Median Family Income in Elmont?
Median Family Income in Elmont is $122,617.
What is the Median Household income in Elmont?
Median Household Income in Elmont is $115,691.
What is Income or Wage Gap in Elmont?
Income or Wage Gap in Elmont is 15.7%.
Women in Elmont earn 84.3 cents for every dollar earned by a man.
What is Inequality or Gini Index in Elmont?
Inequality or Gini Index in Elmont is 0.39.
What is the Total Population of Elmont?
Total Population of Elmont is 37,866.
What is the Total Male Population of Elmont?
Total Male Population of Elmont is 19,080.
What is the Total Female Population of Elmont?
Total Female Population of Elmont is 18,786.
What is the Ratio of Males per 100 Females in Elmont?
There are 101.56 Males per 100 Females in Elmont.
What is the Ratio of Females per 100 Males in Elmont?
There are 98.46 Females per 100 Males in Elmont.
What is the Median Population Age in Elmont?
Median Population Age in Elmont is 38.2 Years.
What is the Average Family Size in Elmont
Average Family Size in Elmont is 3.9 People.
What is the Average Household Size in Elmont
Average Household Size in Elmont is 3.7 People.
How Large is the Labor Force in Elmont?
There are 21,670 People in the Labor Forcein in Elmont.
What is the Percentage of People in the Labor Force in Elmont?
68.4% of People are in the Labor Force in Elmont.
What is the Unemployment Rate in Elmont?
Unemployment Rate in Elmont is 7.6%.