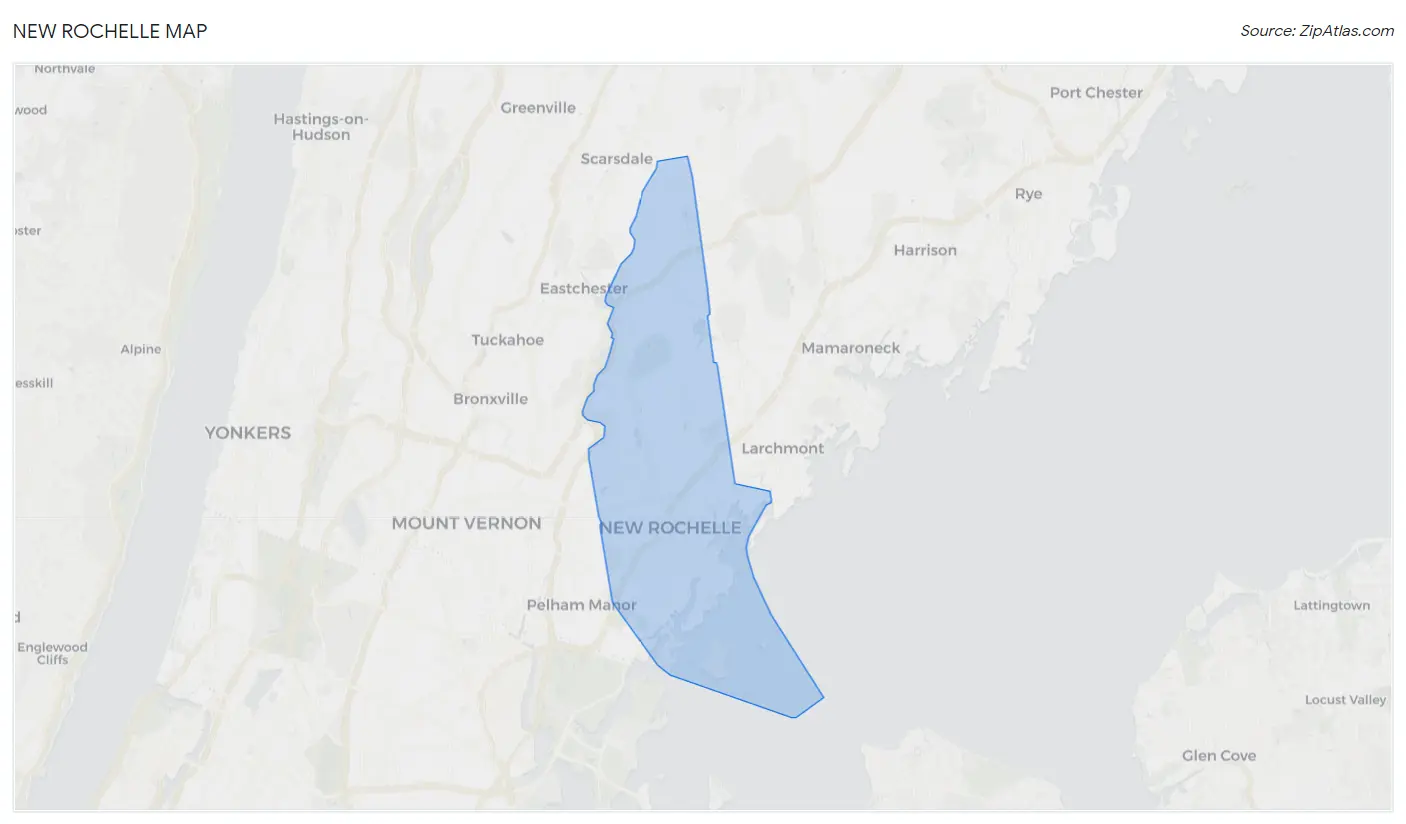
New Rochelle, NY Map & Demographics
New Rochelle Map
New Rochelle Overview
$62,145
PER CAPITA INCOME
$130,667
AVG FAMILY INCOME
$100,542
AVG HOUSEHOLD INCOME
21.9%
WAGE / INCOME GAP [ % ]
78.1¢/ $1
WAGE / INCOME GAP [ $ ]
$10,986
FAMILY INCOME DEFICIT
0.54
INEQUALITY / GINI INDEX
80,828
TOTAL POPULATION
39,247
MALE POPULATION
41,581
FEMALE POPULATION
94.39
MALES / 100 FEMALES
105.95
FEMALES / 100 MALES
40.8
MEDIAN AGE
3.3
AVG FAMILY SIZE
2.6
AVG HOUSEHOLD SIZE
43,431
LABOR FORCE [ PEOPLE ]
65.4%
PERCENT IN LABOR FORCE
7.0%
UNEMPLOYMENT RATE
New Rochelle Area Codes
Income in New Rochelle
Income Overview in New Rochelle
Per Capita Income in New Rochelle is $62,145, while median incomes of families and households are $130,667 and $100,542 respectively.
| Characteristic | Number | Measure |
| Per Capita Income | 80,828 | $62,145 |
| Median Family Income | 19,581 | $130,667 |
| Mean Family Income | 19,581 | $201,229 |
| Median Household Income | 29,905 | $100,542 |
| Mean Household Income | 29,905 | $162,720 |
| Income Deficit | 19,581 | $10,986 |
| Wage / Income Gap (%) | 80,828 | 21.89% |
| Wage / Income Gap ($) | 80,828 | 78.11¢ per $1 |
| Gini / Inequality Index | 80,828 | 0.54 |
Earnings by Sex in New Rochelle
Average Earnings in New Rochelle are $51,665, $59,368 for men and $46,374 for women, a difference of 21.9%.
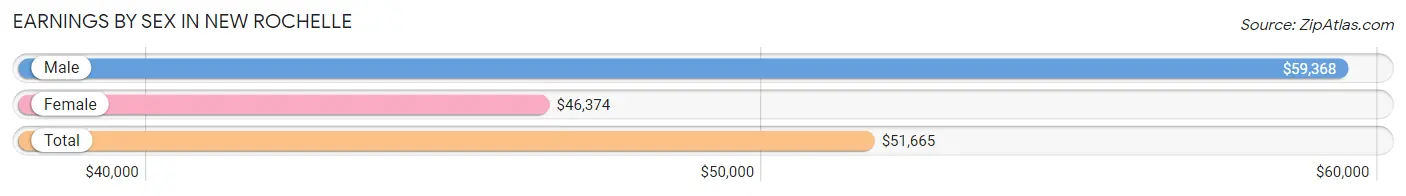
| Sex | Number | Average Earnings |
| Male | 23,443 (52.4%) | $59,368 |
| Female | 21,292 (47.6%) | $46,374 |
| Total | 44,735 (100.0%) | $51,665 |
Earnings by Sex by Income Bracket in New Rochelle
The most common earnings brackets in New Rochelle are $100,000+ for men (7,832 | 33.4%) and $100,000+ for women (5,040 | 23.7%).
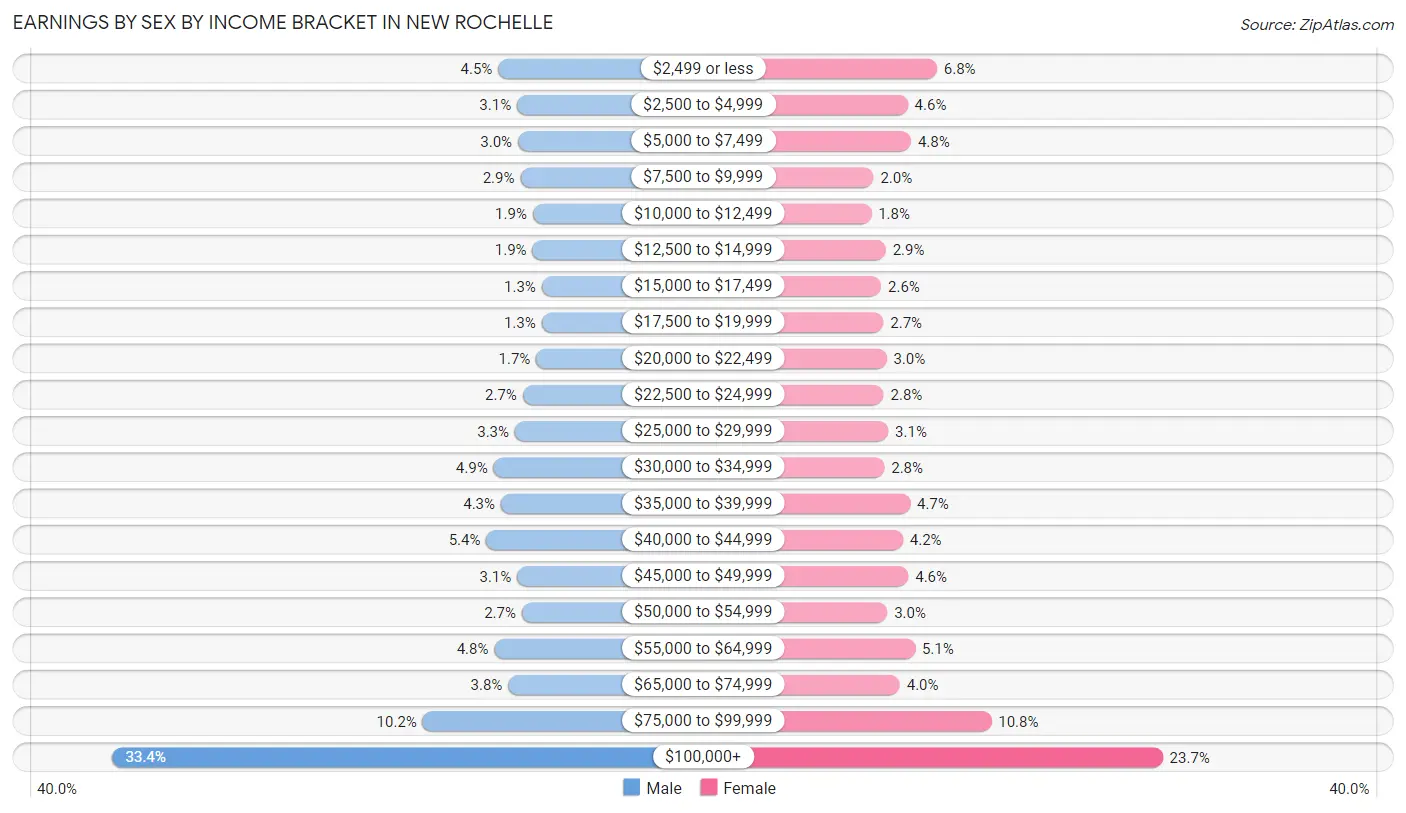
| Income | Male | Female |
| $2,499 or less | 1,058 (4.5%) | 1,438 (6.8%) |
| $2,500 to $4,999 | 727 (3.1%) | 971 (4.6%) |
| $5,000 to $7,499 | 710 (3.0%) | 1,025 (4.8%) |
| $7,500 to $9,999 | 668 (2.9%) | 425 (2.0%) |
| $10,000 to $12,499 | 451 (1.9%) | 390 (1.8%) |
| $12,500 to $14,999 | 454 (1.9%) | 621 (2.9%) |
| $15,000 to $17,499 | 293 (1.3%) | 548 (2.6%) |
| $17,500 to $19,999 | 295 (1.3%) | 584 (2.7%) |
| $20,000 to $22,499 | 390 (1.7%) | 632 (3.0%) |
| $22,500 to $24,999 | 626 (2.7%) | 588 (2.8%) |
| $25,000 to $29,999 | 765 (3.3%) | 661 (3.1%) |
| $30,000 to $34,999 | 1,139 (4.9%) | 598 (2.8%) |
| $35,000 to $39,999 | 1,011 (4.3%) | 1,009 (4.7%) |
| $40,000 to $44,999 | 1,266 (5.4%) | 895 (4.2%) |
| $45,000 to $49,999 | 724 (3.1%) | 982 (4.6%) |
| $50,000 to $54,999 | 643 (2.7%) | 646 (3.0%) |
| $55,000 to $64,999 | 1,125 (4.8%) | 1,088 (5.1%) |
| $65,000 to $74,999 | 882 (3.8%) | 845 (4.0%) |
| $75,000 to $99,999 | 2,384 (10.2%) | 2,306 (10.8%) |
| $100,000+ | 7,832 (33.4%) | 5,040 (23.7%) |
| Total | 23,443 (100.0%) | 21,292 (100.0%) |
Earnings by Sex by Educational Attainment in New Rochelle
Average earnings in New Rochelle are $75,185 for men and $56,782 for women, a difference of 24.5%. Men with an educational attainment of graduate degree enjoy the highest average annual earnings of $146,091, while those with less than high school education earn the least with $41,534. Women with an educational attainment of graduate degree earn the most with the average annual earnings of $96,535, while those with less than high school education have the smallest earnings of $23,727.
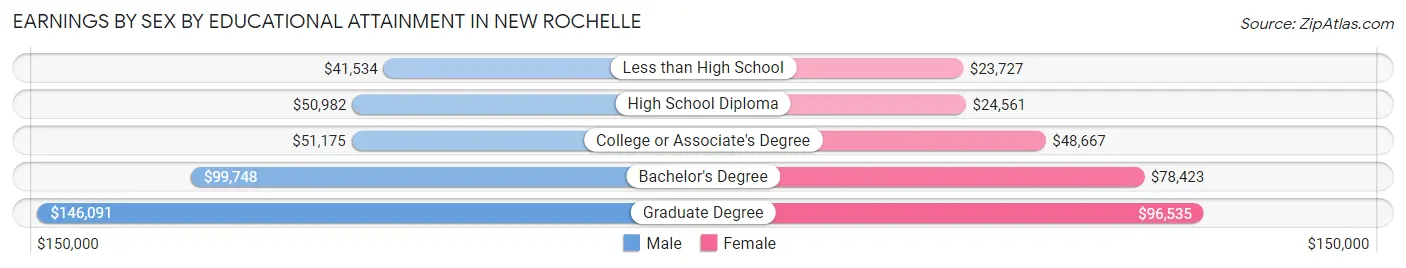
| Educational Attainment | Male Income | Female Income |
| Less than High School | $41,534 | $23,727 |
| High School Diploma | $50,982 | $24,561 |
| College or Associate's Degree | $51,175 | $48,667 |
| Bachelor's Degree | $99,748 | $78,423 |
| Graduate Degree | $146,091 | $96,535 |
| Total | $75,185 | $56,782 |
Family Income in New Rochelle
Family Income Brackets in New Rochelle
According to the New Rochelle family income data, there are 6,423 families falling into the $200,000+ income range, which is the most common income bracket and makes up 32.8% of all families. Conversely, the $10,000 to $14,999 income bracket is the least frequent group with only 176 families (0.9%) belonging to this category.
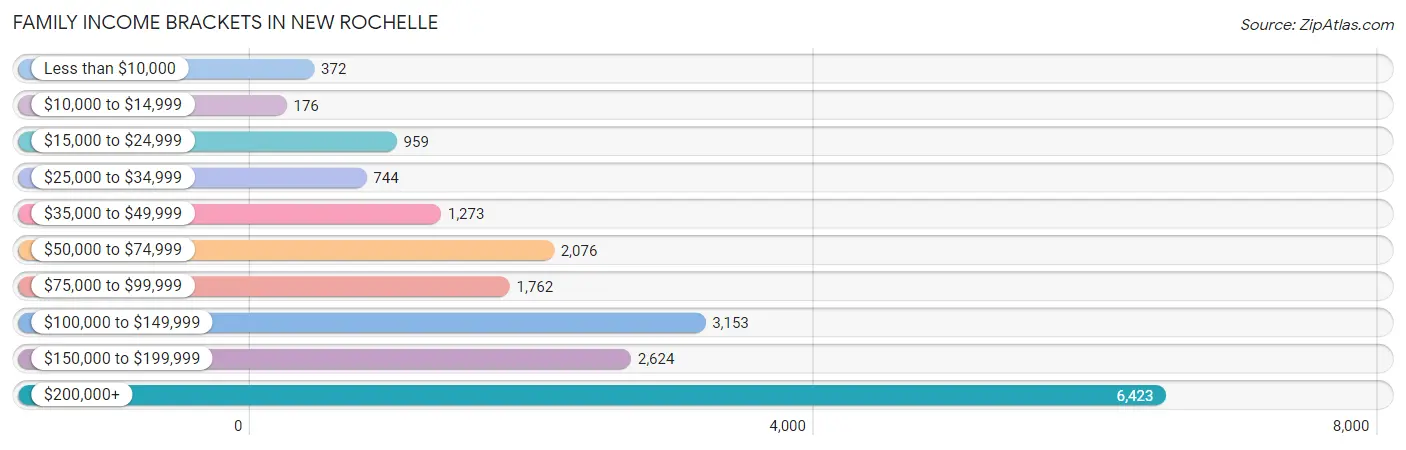
| Income Bracket | # Families | % Families |
| Less than $10,000 | 372 | 1.9% |
| $10,000 to $14,999 | 176 | 0.9% |
| $15,000 to $24,999 | 959 | 4.9% |
| $25,000 to $34,999 | 744 | 3.8% |
| $35,000 to $49,999 | 1,273 | 6.5% |
| $50,000 to $74,999 | 2,076 | 10.6% |
| $75,000 to $99,999 | 1,762 | 9.0% |
| $100,000 to $149,999 | 3,153 | 16.1% |
| $150,000 to $199,999 | 2,624 | 13.4% |
| $200,000+ | 6,423 | 32.8% |
Family Income by Famaliy Size in New Rochelle
4-person families (4,123 | 21.1%) account for the highest median family income in New Rochelle with $176,023 per family, while 3-person families (4,836 | 24.7%) have the highest median income of $48,405 per family member.
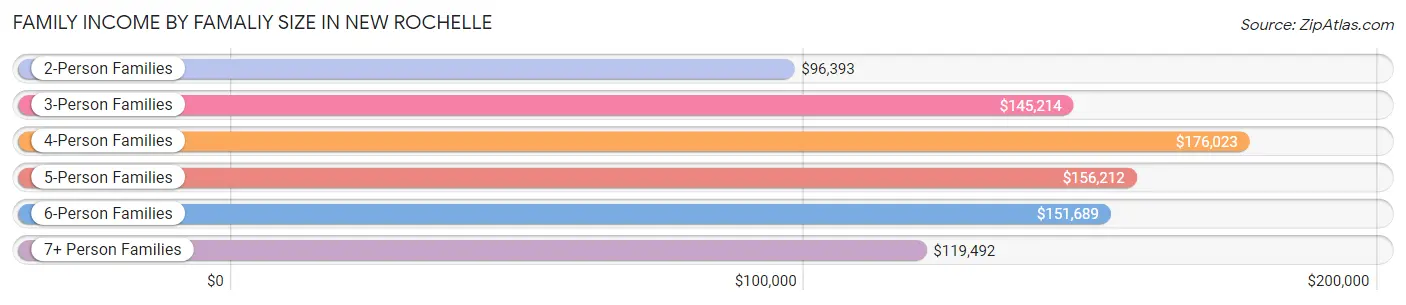
| Income Bracket | # Families | Median Income |
| 2-Person Families | 7,625 (38.9%) | $96,393 |
| 3-Person Families | 4,836 (24.7%) | $145,214 |
| 4-Person Families | 4,123 (21.1%) | $176,023 |
| 5-Person Families | 1,926 (9.8%) | $156,212 |
| 6-Person Families | 862 (4.4%) | $151,689 |
| 7+ Person Families | 209 (1.1%) | $119,492 |
| Total | 19,581 (100.0%) | $130,667 |
Family Income by Number of Earners in New Rochelle
The median family income in New Rochelle is $130,667, with families comprising 3+ earners (3,099) having the highest median family income of $198,347, while families with no earners (1,854) have the lowest median family income of $54,069, accounting for 15.8% and 9.5% of families, respectively.
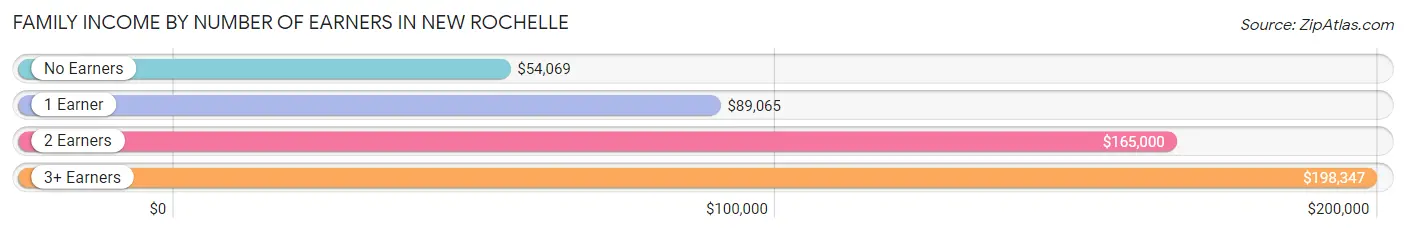
| Number of Earners | # Families | Median Income |
| No Earners | 1,854 (9.5%) | $54,069 |
| 1 Earner | 5,850 (29.9%) | $89,065 |
| 2 Earners | 8,778 (44.8%) | $165,000 |
| 3+ Earners | 3,099 (15.8%) | $198,347 |
| Total | 19,581 (100.0%) | $130,667 |
Household Income in New Rochelle
Household Income Brackets in New Rochelle
With 7,357 households falling in the category, the $200,000+ income range is the most frequent in New Rochelle, accounting for 24.6% of all households. In contrast, only 1,316 households (4.4%) fall into the less than $10,000 income bracket, making it the least populous group.
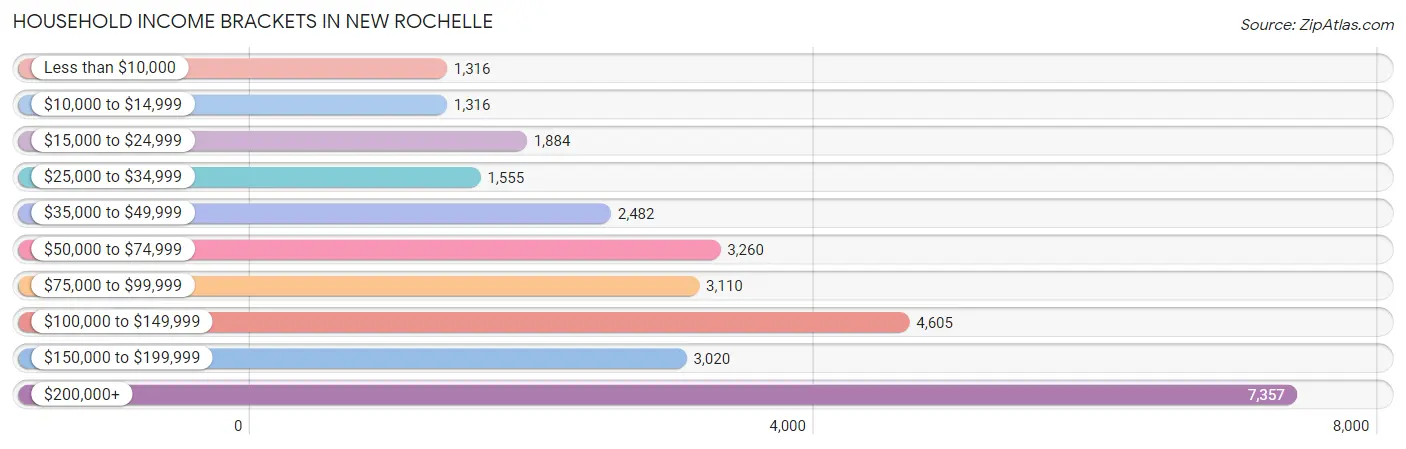
| Income Bracket | # Households | % Households |
| Less than $10,000 | 1,316 | 4.4% |
| $10,000 to $14,999 | 1,316 | 4.4% |
| $15,000 to $24,999 | 1,884 | 6.3% |
| $25,000 to $34,999 | 1,555 | 5.2% |
| $35,000 to $49,999 | 2,482 | 8.3% |
| $50,000 to $74,999 | 3,260 | 10.9% |
| $75,000 to $99,999 | 3,110 | 10.4% |
| $100,000 to $149,999 | 4,605 | 15.4% |
| $150,000 to $199,999 | 3,020 | 10.1% |
| $200,000+ | 7,357 | 24.6% |
Household Income by Householder Age in New Rochelle
The median household income in New Rochelle is $100,542, with the highest median household income of $130,898 found in the 45 to 64 years age bracket for the primary householder. A total of 11,727 households (39.2%) fall into this category. Meanwhile, the 65+ years age bracket for the primary householder has the lowest median household income of $56,732, with 9,063 households (30.3%) in this group.
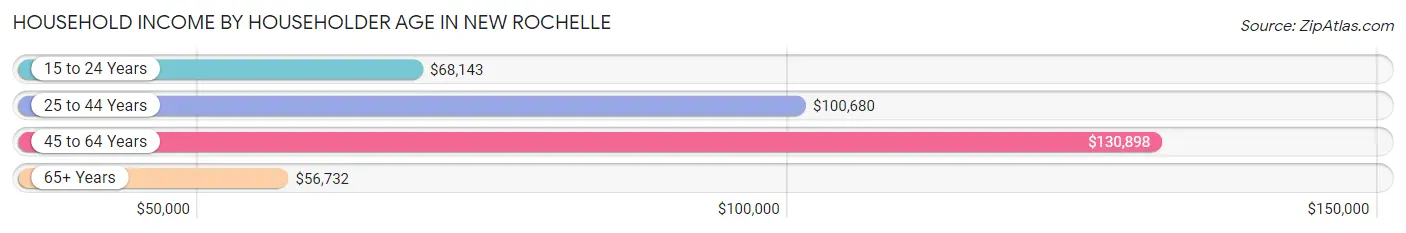
| Income Bracket | # Households | Median Income |
| 15 to 24 Years | 580 (1.9%) | $68,143 |
| 25 to 44 Years | 8,535 (28.5%) | $100,680 |
| 45 to 64 Years | 11,727 (39.2%) | $130,898 |
| 65+ Years | 9,063 (30.3%) | $56,732 |
| Total | 29,905 (100.0%) | $100,542 |
Poverty in New Rochelle
Income Below Poverty by Sex and Age in New Rochelle
With 9.3% poverty level for males and 11.8% for females among the residents of New Rochelle, 5 year old males and 75 year old and over females are the most vulnerable to poverty, with 96 males (19.6%) and 698 females (18.8%) in their respective age groups living below the poverty level.
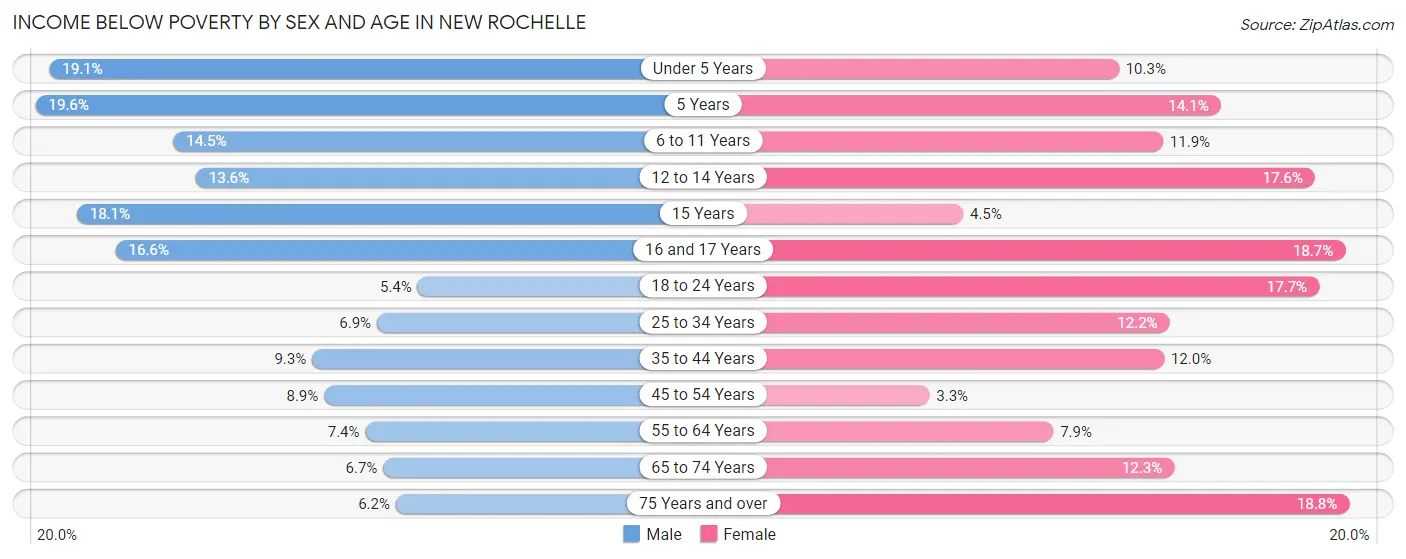
| Age Bracket | Male | Female |
| Under 5 Years | 374 (19.1%) | 195 (10.3%) |
| 5 Years | 96 (19.6%) | 53 (14.1%) |
| 6 to 11 Years | 409 (14.5%) | 361 (11.9%) |
| 12 to 14 Years | 211 (13.6%) | 222 (17.6%) |
| 15 Years | 91 (18.1%) | 21 (4.5%) |
| 16 and 17 Years | 165 (16.6%) | 229 (18.7%) |
| 18 to 24 Years | 188 (5.4%) | 677 (17.7%) |
| 25 to 34 Years | 361 (6.9%) | 533 (12.2%) |
| 35 to 44 Years | 450 (9.3%) | 619 (12.0%) |
| 45 to 54 Years | 436 (8.9%) | 169 (3.3%) |
| 55 to 64 Years | 420 (7.3%) | 405 (7.9%) |
| 65 to 74 Years | 245 (6.7%) | 499 (12.3%) |
| 75 Years and over | 137 (6.2%) | 698 (18.8%) |
| Total | 3,583 (9.3%) | 4,681 (11.8%) |
Income Above Poverty by Sex and Age in New Rochelle
According to the poverty statistics in New Rochelle, males aged 18 to 24 years and females aged 45 to 54 years are the age groups that are most secure financially, with 94.6% of males and 96.8% of females in these age groups living above the poverty line.
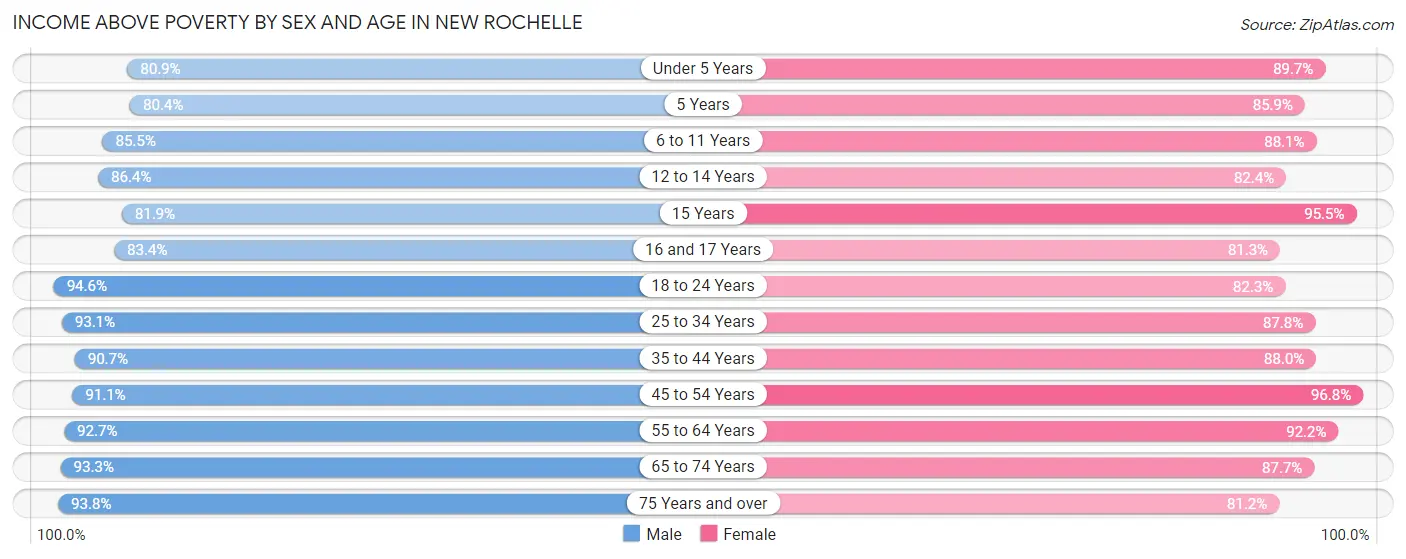
| Age Bracket | Male | Female |
| Under 5 Years | 1,586 (80.9%) | 1,701 (89.7%) |
| 5 Years | 394 (80.4%) | 324 (85.9%) |
| 6 to 11 Years | 2,415 (85.5%) | 2,668 (88.1%) |
| 12 to 14 Years | 1,336 (86.4%) | 1,042 (82.4%) |
| 15 Years | 413 (81.9%) | 446 (95.5%) |
| 16 and 17 Years | 828 (83.4%) | 997 (81.3%) |
| 18 to 24 Years | 3,289 (94.6%) | 3,146 (82.3%) |
| 25 to 34 Years | 4,854 (93.1%) | 3,851 (87.8%) |
| 35 to 44 Years | 4,373 (90.7%) | 4,557 (88.0%) |
| 45 to 54 Years | 4,473 (91.1%) | 5,027 (96.8%) |
| 55 to 64 Years | 5,291 (92.6%) | 4,755 (92.1%) |
| 65 to 74 Years | 3,416 (93.3%) | 3,548 (87.7%) |
| 75 Years and over | 2,065 (93.8%) | 3,008 (81.2%) |
| Total | 34,733 (90.6%) | 35,070 (88.2%) |
Income Below Poverty Among Married-Couple Families in New Rochelle
The poverty statistics for married-couple families in New Rochelle show that 3.3% or 469 of the total 14,071 families live below the poverty line. Families with 3 or 4 children have the highest poverty rate of 18.0%, comprising of 222 families. On the other hand, families with no children have the lowest poverty rate of 1.8%, which includes 132 families.
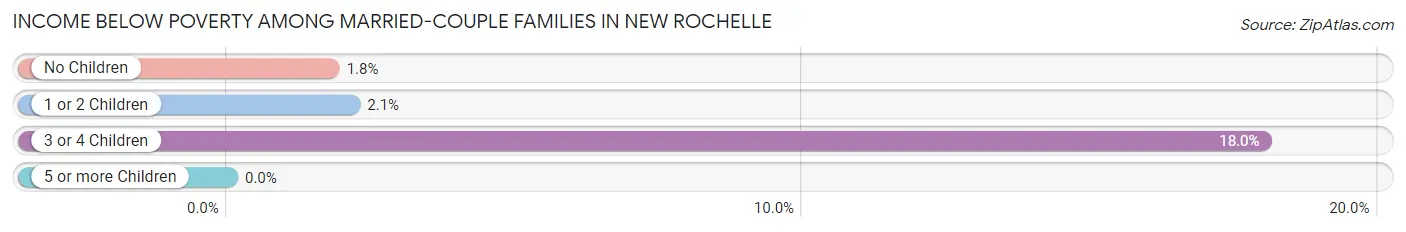
| Children | Above Poverty | Below Poverty |
| No Children | 7,318 (98.2%) | 132 (1.8%) |
| 1 or 2 Children | 5,272 (97.9%) | 115 (2.1%) |
| 3 or 4 Children | 1,012 (82.0%) | 222 (18.0%) |
| 5 or more Children | 0 (0.0%) | 0 (0.0%) |
| Total | 13,602 (96.7%) | 469 (3.3%) |
Income Below Poverty Among Single-Parent Households in New Rochelle
According to the poverty data in New Rochelle, 11.3% or 163 single-father households and 17.7% or 721 single-mother households are living below the poverty line. Among single-father households, those with 1 or 2 children have the highest poverty rate, with 151 households (56.6%) experiencing poverty. Likewise, among single-mother households, those with 3 or 4 children have the highest poverty rate, with 150 households (81.5%) falling below the poverty line.
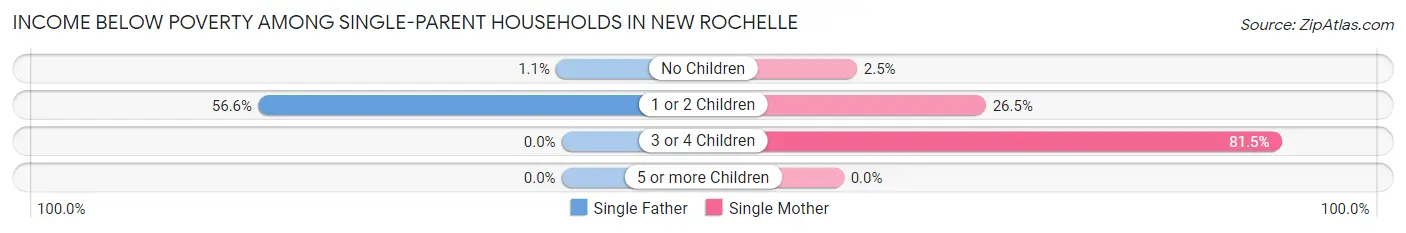
| Children | Single Father | Single Mother |
| No Children | 12 (1.1%) | 46 (2.5%) |
| 1 or 2 Children | 151 (56.6%) | 525 (26.5%) |
| 3 or 4 Children | 0 (0.0%) | 150 (81.5%) |
| 5 or more Children | 0 (0.0%) | 0 (0.0%) |
| Total | 163 (11.3%) | 721 (17.7%) |
Income Below Poverty Among Married-Couple vs Single-Parent Households in New Rochelle
The poverty data for New Rochelle shows that 469 of the married-couple family households (3.3%) and 884 of the single-parent households (16.0%) are living below the poverty level. Within the married-couple family households, those with 3 or 4 children have the highest poverty rate, with 222 households (18.0%) falling below the poverty line. Among the single-parent households, those with 3 or 4 children have the highest poverty rate, with 150 household (67.9%) living below poverty.
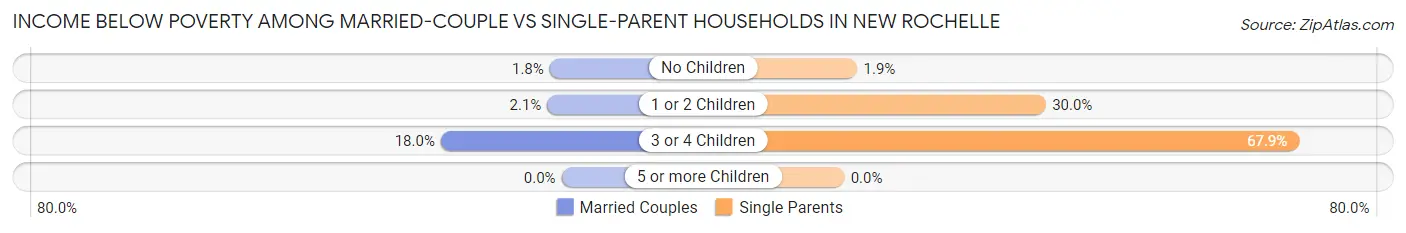
| Children | Married-Couple Families | Single-Parent Households |
| No Children | 132 (1.8%) | 58 (1.9%) |
| 1 or 2 Children | 115 (2.1%) | 676 (30.0%) |
| 3 or 4 Children | 222 (18.0%) | 150 (67.9%) |
| 5 or more Children | 0 (0.0%) | 0 (0.0%) |
| Total | 469 (3.3%) | 884 (16.0%) |
Race in New Rochelle
The most populous races in New Rochelle are White / Caucasian (40,535 | 50.1%), Hispanic or Latino (25,087 | 31.0%), and Black / African American (15,578 | 19.3%).
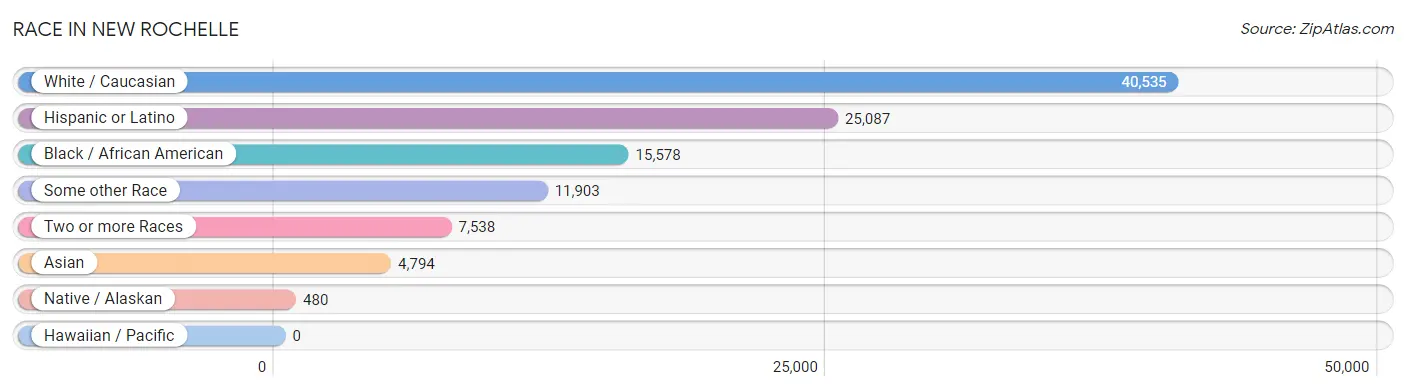
| Race | # Population | % Population |
| Asian | 4,794 | 5.9% |
| Black / African American | 15,578 | 19.3% |
| Hawaiian / Pacific | 0 | 0.0% |
| Hispanic or Latino | 25,087 | 31.0% |
| Native / Alaskan | 480 | 0.6% |
| White / Caucasian | 40,535 | 50.1% |
| Two or more Races | 7,538 | 9.3% |
| Some other Race | 11,903 | 14.7% |
| Total | 80,828 | 100.0% |
Ancestry in New Rochelle
The most populous ancestries reported in New Rochelle are Italian (11,565 | 14.3%), Mexican (10,457 | 12.9%), Irish (6,806 | 8.4%), Puerto Rican (4,588 | 5.7%), and American (4,457 | 5.5%), together accounting for 46.9% of all New Rochelle residents.
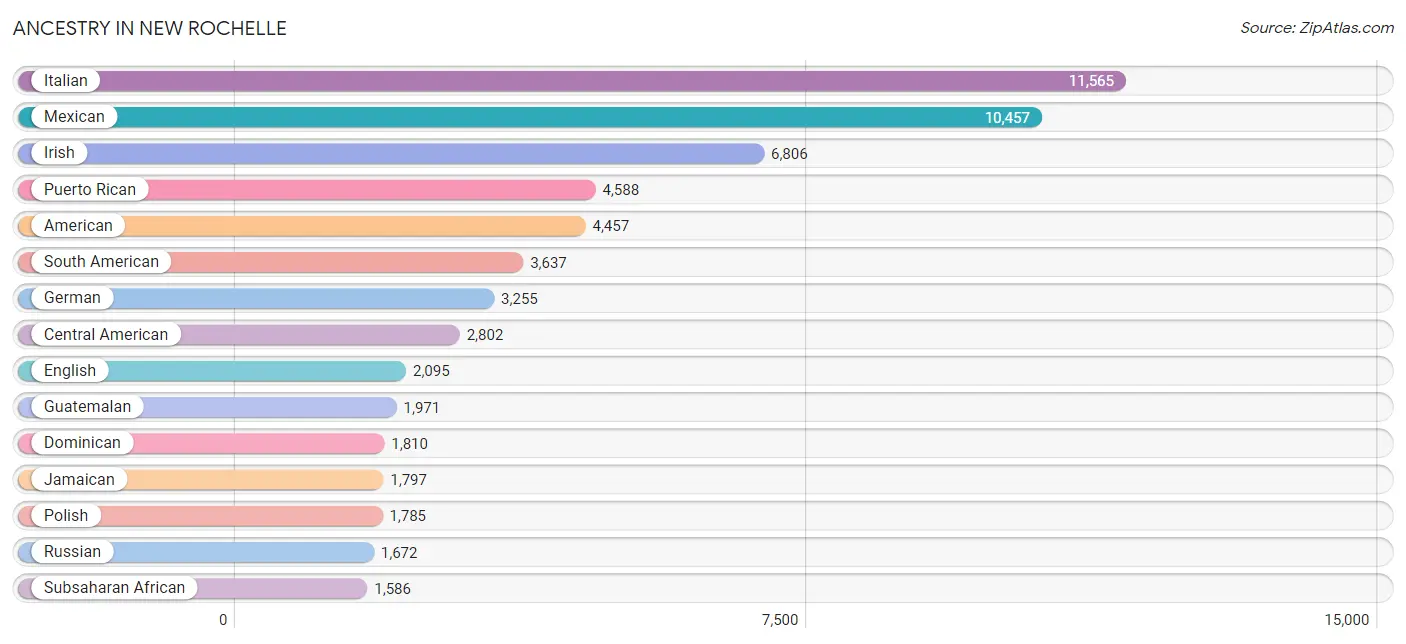
| Ancestry | # Population | % Population |
| African | 1,021 | 1.3% |
| Albanian | 261 | 0.3% |
| American | 4,457 | 5.5% |
| Arab | 504 | 0.6% |
| Argentinean | 144 | 0.2% |
| Armenian | 66 | 0.1% |
| Australian | 10 | 0.0% |
| Austrian | 201 | 0.3% |
| Barbadian | 247 | 0.3% |
| Belgian | 22 | 0.0% |
| Belizean | 27 | 0.0% |
| Bhutanese | 369 | 0.5% |
| Brazilian | 647 | 0.8% |
| British | 145 | 0.2% |
| British West Indian | 304 | 0.4% |
| Burmese | 732 | 0.9% |
| Canadian | 90 | 0.1% |
| Celtic | 10 | 0.0% |
| Central American | 2,802 | 3.5% |
| Central American Indian | 293 | 0.4% |
| Cherokee | 3 | 0.0% |
| Chilean | 194 | 0.2% |
| Chippewa | 20 | 0.0% |
| Colombian | 1,499 | 1.8% |
| Costa Rican | 58 | 0.1% |
| Croatian | 83 | 0.1% |
| Cuban | 415 | 0.5% |
| Czech | 344 | 0.4% |
| Czechoslovakian | 39 | 0.1% |
| Danish | 22 | 0.0% |
| Dominican | 1,810 | 2.2% |
| Dutch | 318 | 0.4% |
| Eastern European | 1,128 | 1.4% |
| Ecuadorian | 483 | 0.6% |
| English | 2,095 | 2.6% |
| Ethiopian | 49 | 0.1% |
| European | 1,041 | 1.3% |
| Finnish | 26 | 0.0% |
| French | 557 | 0.7% |
| French American Indian | 20 | 0.0% |
| French Canadian | 91 | 0.1% |
| German | 3,255 | 4.0% |
| Ghanaian | 58 | 0.1% |
| Greek | 408 | 0.5% |
| Guatemalan | 1,971 | 2.4% |
| Guyanese | 67 | 0.1% |
| Haitian | 1,082 | 1.3% |
| Honduran | 507 | 0.6% |
| Hungarian | 263 | 0.3% |
| Indian (Asian) | 844 | 1.0% |
| Iranian | 31 | 0.0% |
| Irish | 6,806 | 8.4% |
| Iroquois | 82 | 0.1% |
| Israeli | 106 | 0.1% |
| Italian | 11,565 | 14.3% |
| Jamaican | 1,797 | 2.2% |
| Korean | 1,157 | 1.4% |
| Lebanese | 196 | 0.2% |
| Liberian | 27 | 0.0% |
| Lithuanian | 57 | 0.1% |
| Macedonian | 47 | 0.1% |
| Mexican | 10,457 | 12.9% |
| Mexican American Indian | 260 | 0.3% |
| Moroccan | 242 | 0.3% |
| Native Hawaiian | 4 | 0.0% |
| Nicaraguan | 49 | 0.1% |
| Nigerian | 158 | 0.2% |
| Northern European | 66 | 0.1% |
| Norwegian | 172 | 0.2% |
| Pakistani | 138 | 0.2% |
| Palestinian | 44 | 0.1% |
| Panamanian | 36 | 0.0% |
| Peruvian | 898 | 1.1% |
| Polish | 1,785 | 2.2% |
| Portuguese | 509 | 0.6% |
| Pueblo | 6 | 0.0% |
| Puerto Rican | 4,588 | 5.7% |
| Romanian | 359 | 0.4% |
| Russian | 1,672 | 2.1% |
| Salvadoran | 181 | 0.2% |
| Scandinavian | 56 | 0.1% |
| Scotch-Irish | 198 | 0.2% |
| Scottish | 406 | 0.5% |
| Seminole | 9 | 0.0% |
| Senegalese | 10 | 0.0% |
| Serbian | 60 | 0.1% |
| Sioux | 11 | 0.0% |
| Slovak | 53 | 0.1% |
| Slovene | 11 | 0.0% |
| Somali | 23 | 0.0% |
| South African | 54 | 0.1% |
| South American | 3,637 | 4.5% |
| South American Indian | 103 | 0.1% |
| Spaniard | 281 | 0.4% |
| Spanish | 95 | 0.1% |
| Spanish American Indian | 19 | 0.0% |
| Sri Lankan | 40 | 0.1% |
| Subsaharan African | 1,586 | 2.0% |
| Swedish | 225 | 0.3% |
| Swiss | 42 | 0.1% |
| Thai | 1,489 | 1.8% |
| Trinidadian and Tobagonian | 229 | 0.3% |
| Turkish | 193 | 0.2% |
| U.S. Virgin Islander | 2 | 0.0% |
| Ukrainian | 185 | 0.2% |
| Uruguayan | 94 | 0.1% |
| Venezuelan | 325 | 0.4% |
| Vietnamese | 11 | 0.0% |
| Welsh | 35 | 0.0% |
| West Indian | 392 | 0.5% |
| Yugoslavian | 37 | 0.1% | View All 111 Rows |
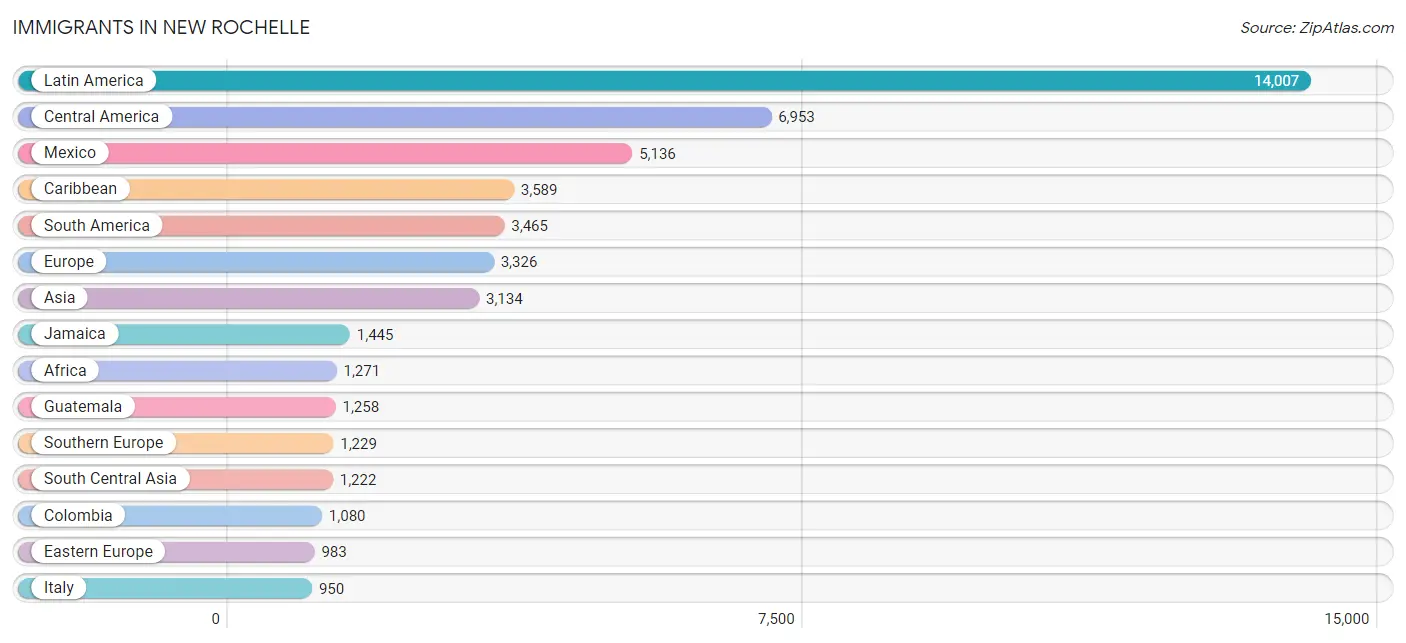
Immigrants in New Rochelle
The most numerous immigrant groups reported in New Rochelle came from Latin America (14,007 | 17.3%), Central America (6,953 | 8.6%), Mexico (5,136 | 6.4%), Caribbean (3,589 | 4.4%), and South America (3,465 | 4.3%), together accounting for 41.0% of all New Rochelle residents.
| Immigration Origin | # Population | % Population |
| Africa | 1,271 | 1.6% |
| Albania | 44 | 0.1% |
| Argentina | 201 | 0.3% |
| Asia | 3,134 | 3.9% |
| Australia | 60 | 0.1% |
| Austria | 20 | 0.0% |
| Bangladesh | 55 | 0.1% |
| Barbados | 123 | 0.2% |
| Belarus | 9 | 0.0% |
| Belgium | 15 | 0.0% |
| Belize | 61 | 0.1% |
| Brazil | 526 | 0.6% |
| Cameroon | 244 | 0.3% |
| Canada | 294 | 0.4% |
| Caribbean | 3,589 | 4.4% |
| Central America | 6,953 | 8.6% |
| Chile | 75 | 0.1% |
| China | 377 | 0.5% |
| Colombia | 1,080 | 1.3% |
| Costa Rica | 83 | 0.1% |
| Croatia | 77 | 0.1% |
| Cuba | 116 | 0.1% |
| Czechoslovakia | 104 | 0.1% |
| Denmark | 24 | 0.0% |
| Dominica | 27 | 0.0% |
| Dominican Republic | 686 | 0.9% |
| Eastern Africa | 310 | 0.4% |
| Eastern Asia | 886 | 1.1% |
| Eastern Europe | 983 | 1.2% |
| Ecuador | 424 | 0.5% |
| El Salvador | 130 | 0.2% |
| England | 204 | 0.3% |
| Eritrea | 3 | 0.0% |
| Ethiopia | 46 | 0.1% |
| Europe | 3,326 | 4.1% |
| France | 227 | 0.3% |
| Germany | 193 | 0.2% |
| Ghana | 128 | 0.2% |
| Greece | 77 | 0.1% |
| Grenada | 34 | 0.0% |
| Guatemala | 1,258 | 1.6% |
| Guyana | 79 | 0.1% |
| Haiti | 914 | 1.1% |
| Honduras | 189 | 0.2% |
| India | 633 | 0.8% |
| Iran | 31 | 0.0% |
| Ireland | 109 | 0.1% |
| Israel | 101 | 0.1% |
| Italy | 950 | 1.2% |
| Jamaica | 1,445 | 1.8% |
| Japan | 239 | 0.3% |
| Korea | 270 | 0.3% |
| Latin America | 14,007 | 17.3% |
| Lebanon | 55 | 0.1% |
| Liberia | 12 | 0.0% |
| Mexico | 5,136 | 6.4% |
| Middle Africa | 244 | 0.3% |
| Morocco | 61 | 0.1% |
| Nicaragua | 49 | 0.1% |
| Nigeria | 93 | 0.1% |
| North Macedonia | 48 | 0.1% |
| Northern Africa | 75 | 0.1% |
| Northern Europe | 625 | 0.8% |
| Norway | 4 | 0.0% |
| Oceania | 74 | 0.1% |
| Pakistan | 330 | 0.4% |
| Panama | 47 | 0.1% |
| Peru | 741 | 0.9% |
| Philippines | 617 | 0.8% |
| Poland | 128 | 0.2% |
| Portugal | 172 | 0.2% |
| Romania | 189 | 0.2% |
| Russia | 108 | 0.1% |
| Scotland | 18 | 0.0% |
| Senegal | 10 | 0.0% |
| Serbia | 25 | 0.0% |
| Sierra Leone | 78 | 0.1% |
| South Africa | 142 | 0.2% |
| South America | 3,465 | 4.3% |
| South Central Asia | 1,222 | 1.5% |
| South Eastern Asia | 739 | 0.9% |
| Southern Europe | 1,229 | 1.5% |
| Spain | 30 | 0.0% |
| Sri Lanka | 155 | 0.2% |
| Sweden | 30 | 0.0% |
| Switzerland | 34 | 0.0% |
| Syria | 31 | 0.0% |
| Taiwan | 66 | 0.1% |
| Thailand | 72 | 0.1% |
| Trinidad and Tobago | 51 | 0.1% |
| Turkey | 98 | 0.1% |
| Ukraine | 70 | 0.1% |
| Uruguay | 94 | 0.1% |
| Uzbekistan | 18 | 0.0% |
| Venezuela | 245 | 0.3% |
| Vietnam | 50 | 0.1% |
| West Indies | 30 | 0.0% |
| Western Africa | 445 | 0.5% |
| Western Asia | 285 | 0.4% |
| Western Europe | 489 | 0.6% |
| Zimbabwe | 221 | 0.3% | View All 101 Rows |
Sex and Age in New Rochelle
Sex and Age in New Rochelle
The most populous age groups in New Rochelle are 55 to 59 Years (3,276 | 8.4%) for men and 20 to 24 Years (3,363 | 8.1%) for women.
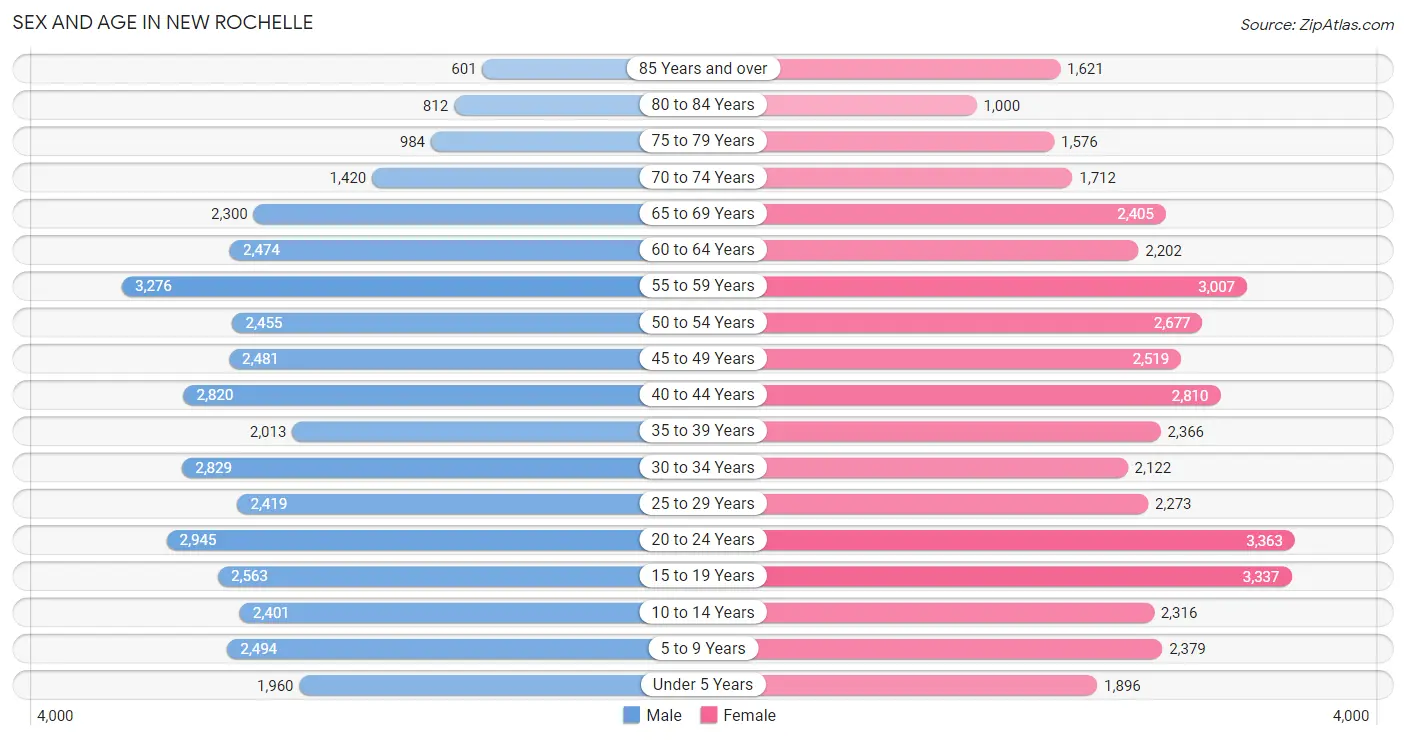
| Age Bracket | Male | Female |
| Under 5 Years | 1,960 (5.0%) | 1,896 (4.6%) |
| 5 to 9 Years | 2,494 (6.4%) | 2,379 (5.7%) |
| 10 to 14 Years | 2,401 (6.1%) | 2,316 (5.6%) |
| 15 to 19 Years | 2,563 (6.5%) | 3,337 (8.0%) |
| 20 to 24 Years | 2,945 (7.5%) | 3,363 (8.1%) |
| 25 to 29 Years | 2,419 (6.2%) | 2,273 (5.5%) |
| 30 to 34 Years | 2,829 (7.2%) | 2,122 (5.1%) |
| 35 to 39 Years | 2,013 (5.1%) | 2,366 (5.7%) |
| 40 to 44 Years | 2,820 (7.2%) | 2,810 (6.8%) |
| 45 to 49 Years | 2,481 (6.3%) | 2,519 (6.1%) |
| 50 to 54 Years | 2,455 (6.3%) | 2,677 (6.4%) |
| 55 to 59 Years | 3,276 (8.4%) | 3,007 (7.2%) |
| 60 to 64 Years | 2,474 (6.3%) | 2,202 (5.3%) |
| 65 to 69 Years | 2,300 (5.9%) | 2,405 (5.8%) |
| 70 to 74 Years | 1,420 (3.6%) | 1,712 (4.1%) |
| 75 to 79 Years | 984 (2.5%) | 1,576 (3.8%) |
| 80 to 84 Years | 812 (2.1%) | 1,000 (2.4%) |
| 85 Years and over | 601 (1.5%) | 1,621 (3.9%) |
| Total | 39,247 (100.0%) | 41,581 (100.0%) |
Families and Households in New Rochelle
Median Family Size in New Rochelle
The median family size in New Rochelle is 3.29 persons per family, with married-couple families (14,071 | 71.9%) accounting for the largest median family size of 3.48 persons per family. On the other hand, single male/father families (1,437 | 7.3%) represent the smallest median family size with 2.61 persons per family.
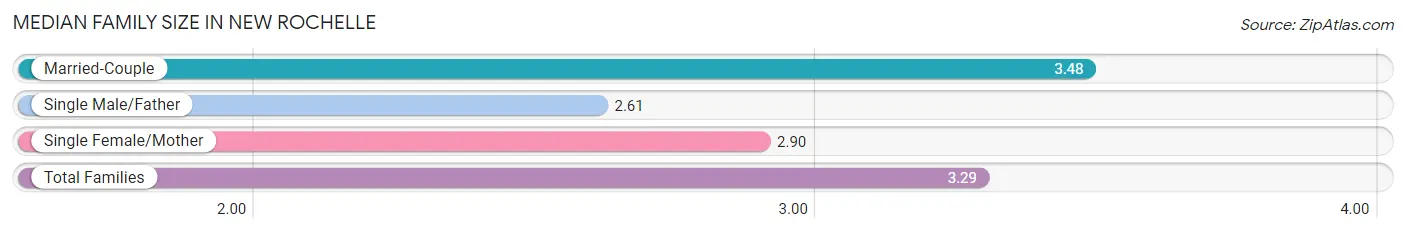
| Family Type | # Families | Family Size |
| Married-Couple | 14,071 (71.9%) | 3.48 |
| Single Male/Father | 1,437 (7.3%) | 2.61 |
| Single Female/Mother | 4,073 (20.8%) | 2.90 |
| Total Families | 19,581 (100.0%) | 3.29 |
Median Household Size in New Rochelle
The median household size in New Rochelle is 2.59 persons per household, with married-couple households (14,071 | 47.0%) accounting for the largest median household size of 3.49 persons per household. non-family households (10,324 | 34.5%) represent the smallest median household size with 1.14 persons per household.
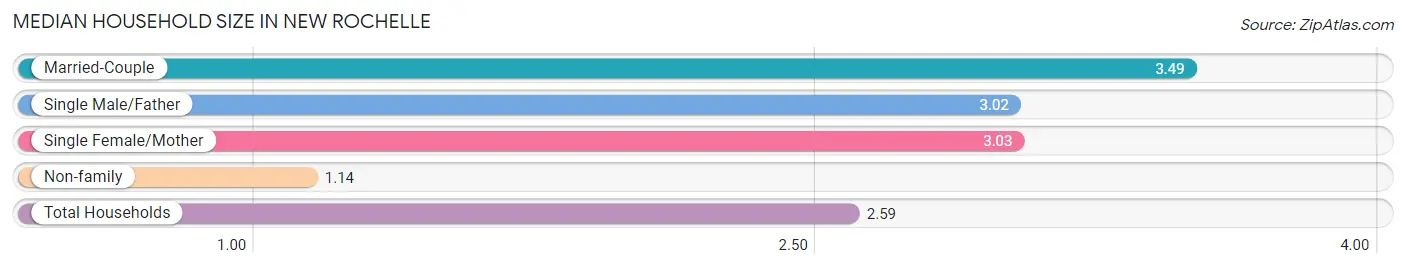
| Household Type | # Households | Household Size |
| Married-Couple | 14,071 (47.0%) | 3.49 |
| Single Male/Father | 1,437 (4.8%) | 3.02 |
| Single Female/Mother | 4,073 (13.6%) | 3.03 |
| Non-family | 10,324 (34.5%) | 1.14 |
| Total Households | 29,905 (100.0%) | 2.59 |
Household Size by Marriage Status in New Rochelle
Out of a total of 29,905 households in New Rochelle, 19,581 (65.5%) are family households, while 10,324 (34.5%) are nonfamily households. The most numerous type of family households are 2-person households, comprising 7,087, and the most common type of nonfamily households are 1-person households, comprising 9,113.
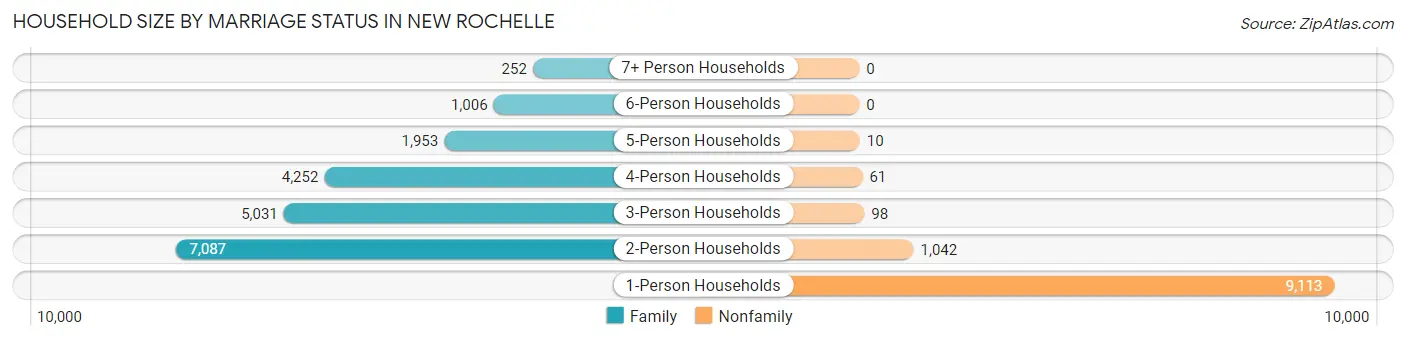
| Household Size | Family Households | Nonfamily Households |
| 1-Person Households | - | 9,113 (30.5%) |
| 2-Person Households | 7,087 (23.7%) | 1,042 (3.5%) |
| 3-Person Households | 5,031 (16.8%) | 98 (0.3%) |
| 4-Person Households | 4,252 (14.2%) | 61 (0.2%) |
| 5-Person Households | 1,953 (6.5%) | 10 (0.0%) |
| 6-Person Households | 1,006 (3.4%) | 0 (0.0%) |
| 7+ Person Households | 252 (0.8%) | 0 (0.0%) |
| Total | 19,581 (65.5%) | 10,324 (34.5%) |
Female Fertility in New Rochelle
Fertility by Age in New Rochelle
Average fertility rate in New Rochelle is 46.0 births per 1,000 women. Women in the age bracket of 20 to 34 years have the highest fertility rate with 69.0 births per 1,000 women. Women in the age bracket of 20 to 34 years acount for 61.0% of all women with births.
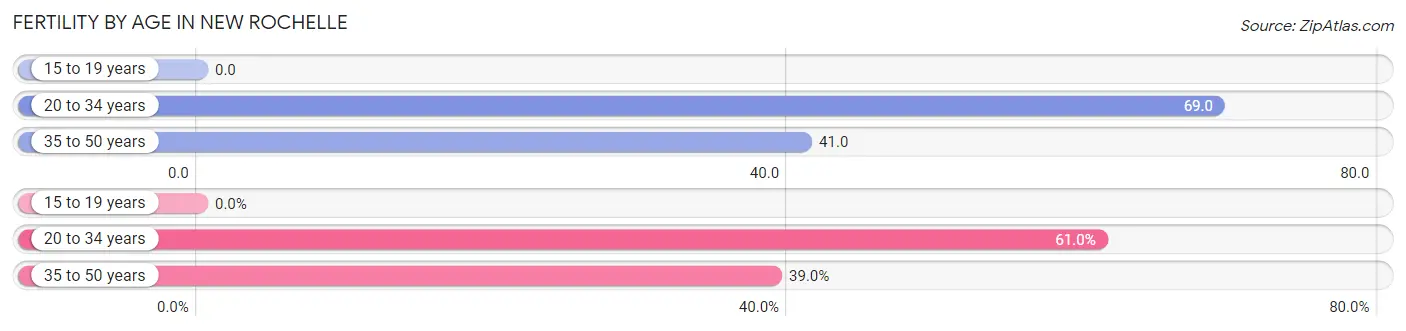
| Age Bracket | Women with Births | Births / 1,000 Women |
| 15 to 19 years | 0 (0.0%) | 0.0 |
| 20 to 34 years | 539 (61.0%) | 69.0 |
| 35 to 50 years | 344 (39.0%) | 41.0 |
| Total | 883 (100.0%) | 46.0 |
Fertility by Age by Marriage Status in New Rochelle
63.5% of women with births (883) in New Rochelle are married. The highest percentage of unmarried women with births falls into 35 to 50 years age bracket with 42.1% of them unmarried at the time of birth, while the lowest percentage of unmarried women with births belong to 20 to 34 years age bracket with 32.8% of them unmarried.
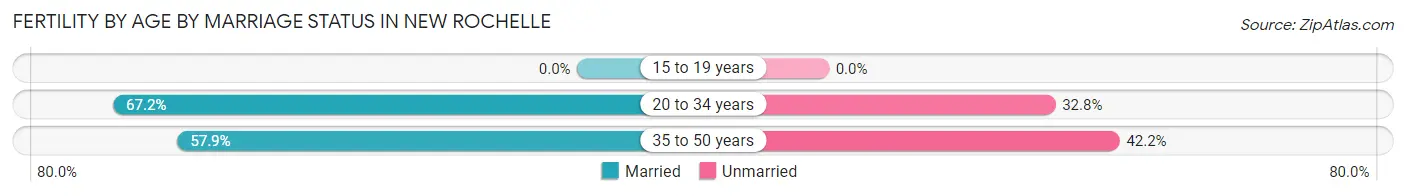
| Age Bracket | Married | Unmarried |
| 15 to 19 years | 0 (0.0%) | 0 (0.0%) |
| 20 to 34 years | 362 (67.2%) | 177 (32.8%) |
| 35 to 50 years | 199 (57.9%) | 145 (42.1%) |
| Total | 561 (63.5%) | 322 (36.5%) |
Fertility by Education in New Rochelle
Average fertility rate in New Rochelle is 46.0 births per 1,000 women. Women with the education attainment of college or associate's degree have the highest fertility rate of 78.0 births per 1,000 women, while women with the education attainment of bachelor's degree have the lowest fertility at 28.0 births per 1,000 women. Women with the education attainment of college or associate's degree represent 40.4% of all women with births.
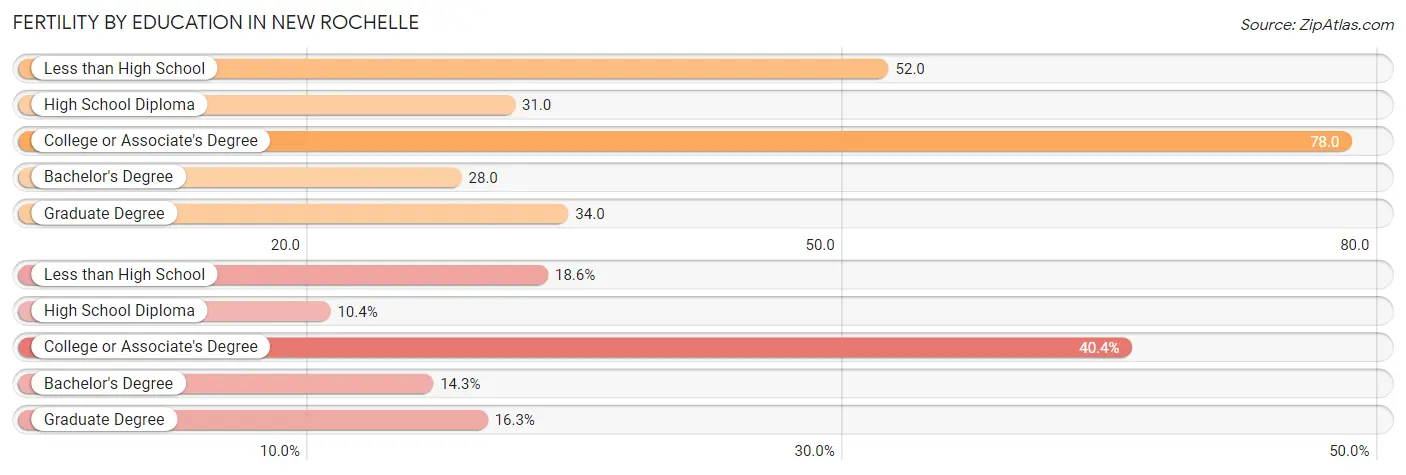
| Educational Attainment | Women with Births | Births / 1,000 Women |
| Less than High School | 164 (18.6%) | 52.0 |
| High School Diploma | 92 (10.4%) | 31.0 |
| College or Associate's Degree | 357 (40.4%) | 78.0 |
| Bachelor's Degree | 126 (14.3%) | 28.0 |
| Graduate Degree | 144 (16.3%) | 34.0 |
| Total | 883 (100.0%) | 46.0 |
Fertility by Education by Marriage Status in New Rochelle
36.5% of women with births in New Rochelle are unmarried. Women with the educational attainment of bachelor's degree are most likely to be married with 100.0% of them married at childbirth, while women with the educational attainment of college or associate's degree are least likely to be married with 58.5% of them unmarried at childbirth.
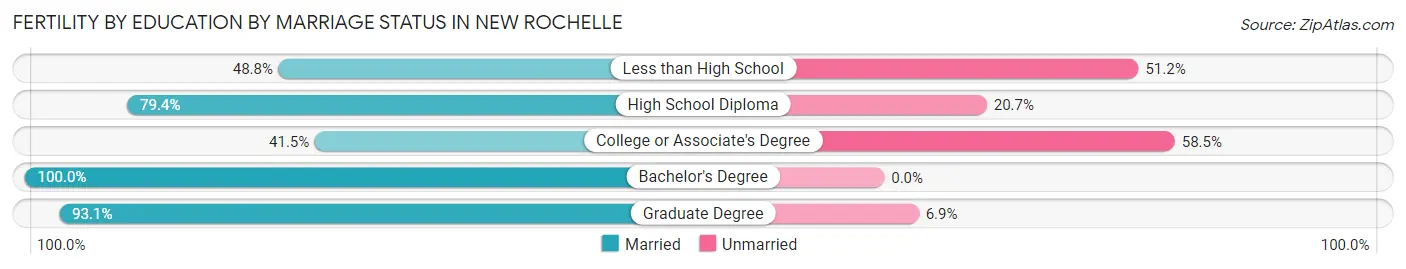
| Educational Attainment | Married | Unmarried |
| Less than High School | 80 (48.8%) | 84 (51.2%) |
| High School Diploma | 73 (79.3%) | 19 (20.6%) |
| College or Associate's Degree | 148 (41.5%) | 209 (58.5%) |
| Bachelor's Degree | 126 (100.0%) | 0 (0.0%) |
| Graduate Degree | 134 (93.1%) | 10 (6.9%) |
| Total | 561 (63.5%) | 322 (36.5%) |
Employment Characteristics in New Rochelle
Employment by Class of Employer in New Rochelle
Among the 39,539 employed individuals in New Rochelle, private company employees (24,485 | 61.9%), not-for-profit organizations (5,080 | 12.9%), and local government employees (3,705 | 9.4%) make up the most common classes of employment.
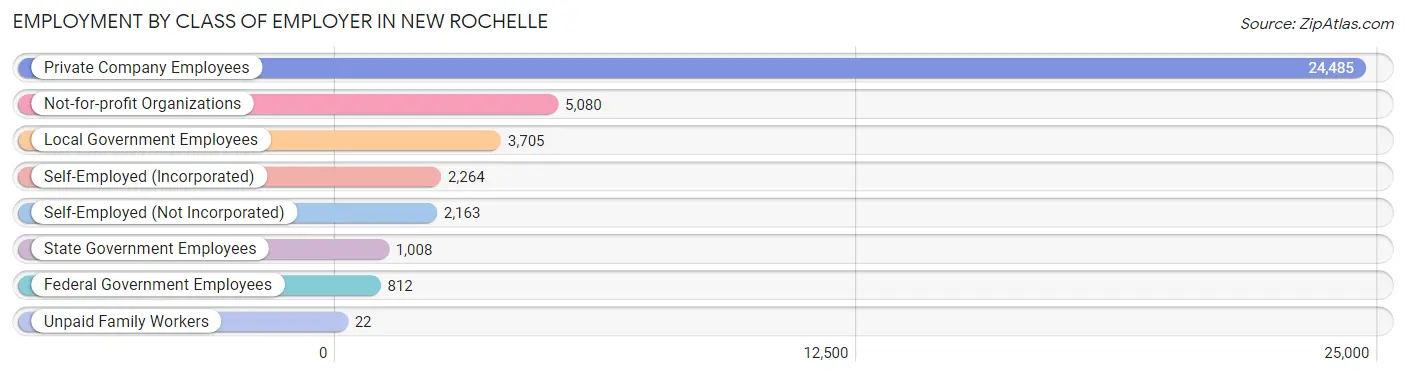
| Employer Class | # Employees | % Employees |
| Private Company Employees | 24,485 | 61.9% |
| Self-Employed (Incorporated) | 2,264 | 5.7% |
| Self-Employed (Not Incorporated) | 2,163 | 5.5% |
| Not-for-profit Organizations | 5,080 | 12.9% |
| Local Government Employees | 3,705 | 9.4% |
| State Government Employees | 1,008 | 2.5% |
| Federal Government Employees | 812 | 2.1% |
| Unpaid Family Workers | 22 | 0.1% |
| Total | 39,539 | 100.0% |
Employment Status by Age in New Rochelle
According to the labor force statistics for New Rochelle, out of the total population over 16 years of age (66,409), 65.4% or 43,431 individuals are in the labor force, with 7.0% or 3,040 of them unemployed. The age group with the highest labor force participation rate is 30 to 34 years, with 89.7% or 4,441 individuals in the labor force. Within the labor force, the 16 to 19 years age range has the highest percentage of unemployed individuals, with 18.2% or 310 of them being unemployed.
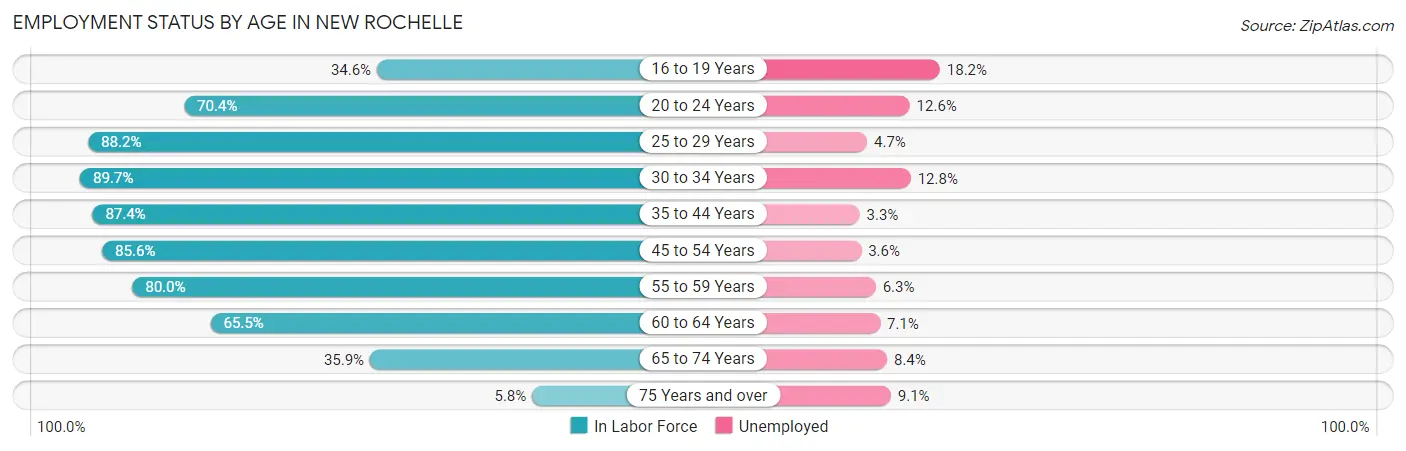
| Age Bracket | In Labor Force | Unemployed |
| 16 to 19 Years | 1,705 (34.6%) | 310 (18.2%) |
| 20 to 24 Years | 4,441 (70.4%) | 560 (12.6%) |
| 25 to 29 Years | 4,138 (88.2%) | 194 (4.7%) |
| 30 to 34 Years | 4,441 (89.7%) | 568 (12.8%) |
| 35 to 44 Years | 8,748 (87.4%) | 289 (3.3%) |
| 45 to 54 Years | 8,673 (85.6%) | 312 (3.6%) |
| 55 to 59 Years | 5,026 (80.0%) | 317 (6.3%) |
| 60 to 64 Years | 3,063 (65.5%) | 217 (7.1%) |
| 65 to 74 Years | 2,813 (35.9%) | 236 (8.4%) |
| 75 Years and over | 382 (5.8%) | 35 (9.1%) |
| Total | 43,431 (65.4%) | 3,040 (7.0%) |
Employment Status by Educational Attainment in New Rochelle
According to labor force statistics for New Rochelle, 83.6% of individuals (34,061) out of the total population between 25 and 64 years of age (40,743) are in the labor force, with 5.6% or 1,907 of them being unemployed. The group with the highest labor force participation rate are those with the educational attainment of bachelor's degree or higher, with 90.0% or 18,154 individuals in the labor force. Within the labor force, individuals with less than high school education have the highest percentage of unemployment, with 9.3% or 336 of them being unemployed.
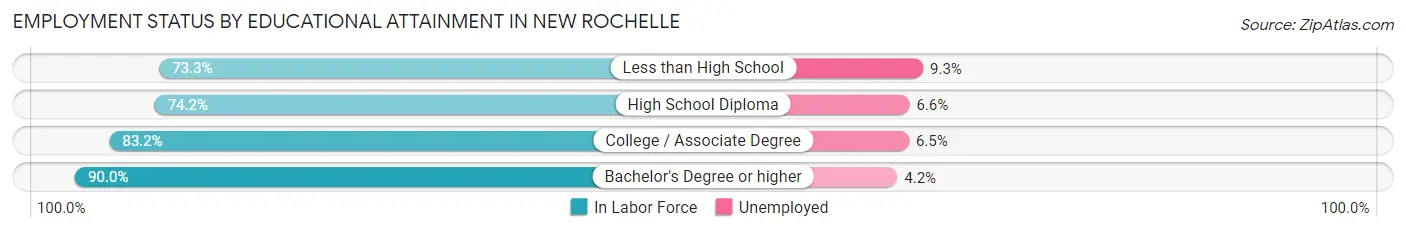
| Educational Attainment | In Labor Force | Unemployed |
| Less than High School | 3,617 (73.3%) | 459 (9.3%) |
| High School Diploma | 5,745 (74.2%) | 511 (6.6%) |
| College / Associate Degree | 6,568 (83.2%) | 513 (6.5%) |
| Bachelor's Degree or higher | 18,154 (90.0%) | 847 (4.2%) |
| Total | 34,061 (83.6%) | 2,282 (5.6%) |
Employment Occupations by Sex in New Rochelle
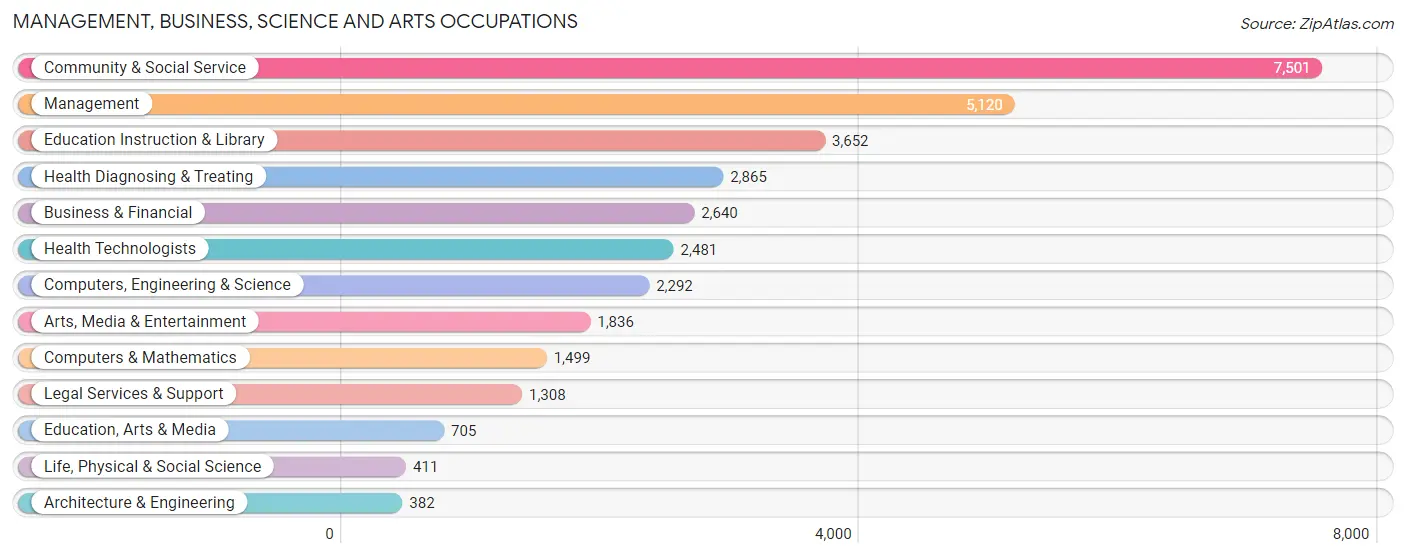
Management, Business, Science and Arts Occupations
The most common Management, Business, Science and Arts occupations in New Rochelle are Community & Social Service (7,501 | 18.6%), Management (5,120 | 12.7%), Education Instruction & Library (3,652 | 9.0%), Health Diagnosing & Treating (2,865 | 7.1%), and Business & Financial (2,640 | 6.5%).
Management, Business, Science and Arts Occupations by Sex
Within the Management, Business, Science and Arts occupations in New Rochelle, the most male-oriented occupations are Computers & Mathematics (78.0%), Architecture & Engineering (75.1%), and Computers, Engineering & Science (72.3%), while the most female-oriented occupations are Education, Arts & Media (78.2%), Education Instruction & Library (64.9%), and Community & Social Service (58.0%).
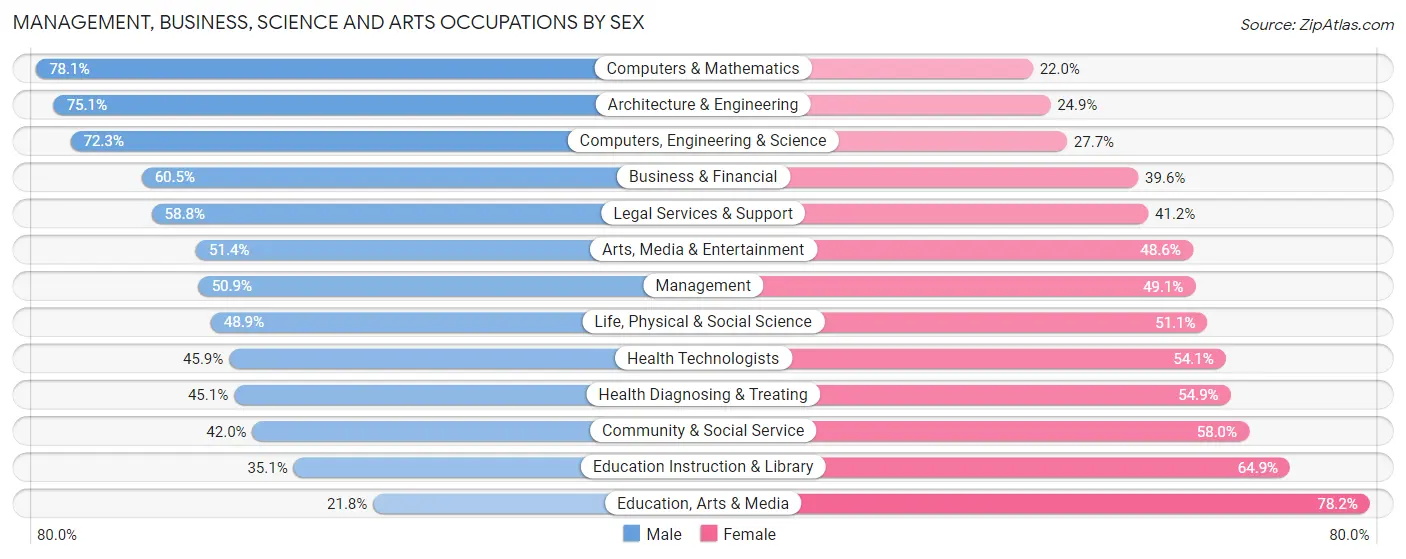
| Occupation | Male | Female |
| Management | 2,608 (50.9%) | 2,512 (49.1%) |
| Business & Financial | 1,596 (60.5%) | 1,044 (39.6%) |
| Computers, Engineering & Science | 1,658 (72.3%) | 634 (27.7%) |
| Computers & Mathematics | 1,170 (78.0%) | 329 (22.0%) |
| Architecture & Engineering | 287 (75.1%) | 95 (24.9%) |
| Life, Physical & Social Science | 201 (48.9%) | 210 (51.1%) |
| Community & Social Service | 3,149 (42.0%) | 4,352 (58.0%) |
| Education, Arts & Media | 154 (21.8%) | 551 (78.2%) |
| Legal Services & Support | 769 (58.8%) | 539 (41.2%) |
| Education Instruction & Library | 1,283 (35.1%) | 2,369 (64.9%) |
| Arts, Media & Entertainment | 943 (51.4%) | 893 (48.6%) |
| Health Diagnosing & Treating | 1,291 (45.1%) | 1,574 (54.9%) |
| Health Technologists | 1,138 (45.9%) | 1,343 (54.1%) |
| Total (Category) | 10,302 (50.5%) | 10,116 (49.5%) |
| Total (Overall) | 21,177 (52.5%) | 19,177 (47.5%) |
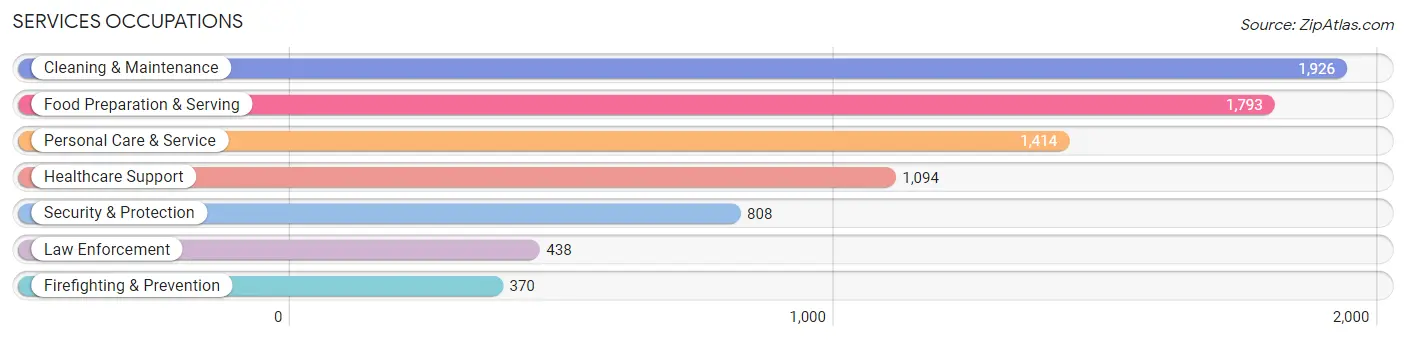
Services Occupations
The most common Services occupations in New Rochelle are Cleaning & Maintenance (1,926 | 4.8%), Food Preparation & Serving (1,793 | 4.4%), Personal Care & Service (1,414 | 3.5%), Healthcare Support (1,094 | 2.7%), and Security & Protection (808 | 2.0%).
Services Occupations by Sex
Within the Services occupations in New Rochelle, the most male-oriented occupations are Law Enforcement (67.1%), Cleaning & Maintenance (61.7%), and Food Preparation & Serving (60.0%), while the most female-oriented occupations are Healthcare Support (87.8%), Personal Care & Service (75.0%), and Firefighting & Prevention (52.2%).
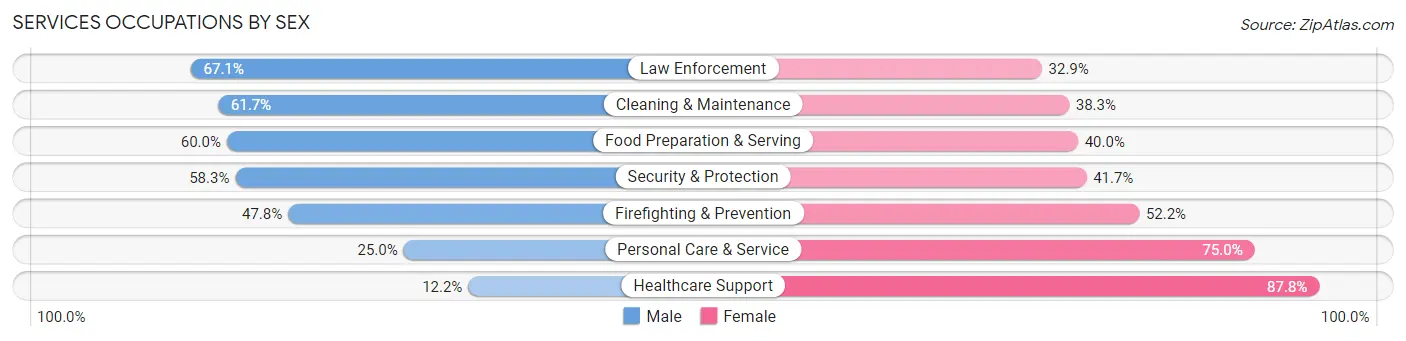
| Occupation | Male | Female |
| Healthcare Support | 133 (12.2%) | 961 (87.8%) |
| Security & Protection | 471 (58.3%) | 337 (41.7%) |
| Firefighting & Prevention | 177 (47.8%) | 193 (52.2%) |
| Law Enforcement | 294 (67.1%) | 144 (32.9%) |
| Food Preparation & Serving | 1,075 (60.0%) | 718 (40.0%) |
| Cleaning & Maintenance | 1,189 (61.7%) | 737 (38.3%) |
| Personal Care & Service | 353 (25.0%) | 1,061 (75.0%) |
| Total (Category) | 3,221 (45.8%) | 3,814 (54.2%) |
| Total (Overall) | 21,177 (52.5%) | 19,177 (47.5%) |
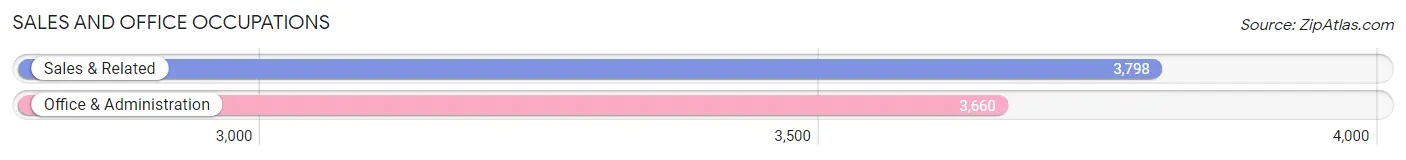
Sales and Office Occupations
The most common Sales and Office occupations in New Rochelle are Sales & Related (3,798 | 9.4%), and Office & Administration (3,660 | 9.1%).
Sales and Office Occupations by Sex
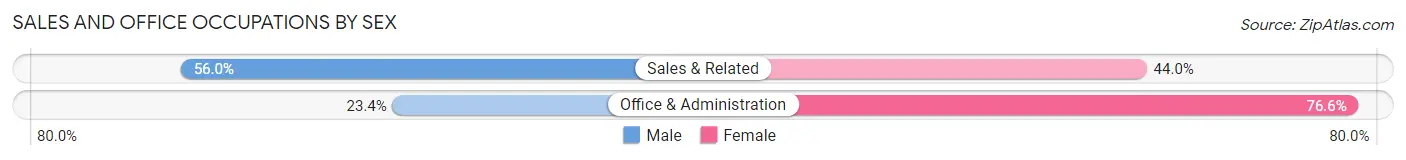
| Occupation | Male | Female |
| Sales & Related | 2,126 (56.0%) | 1,672 (44.0%) |
| Office & Administration | 856 (23.4%) | 2,804 (76.6%) |
| Total (Category) | 2,982 (40.0%) | 4,476 (60.0%) |
| Total (Overall) | 21,177 (52.5%) | 19,177 (47.5%) |
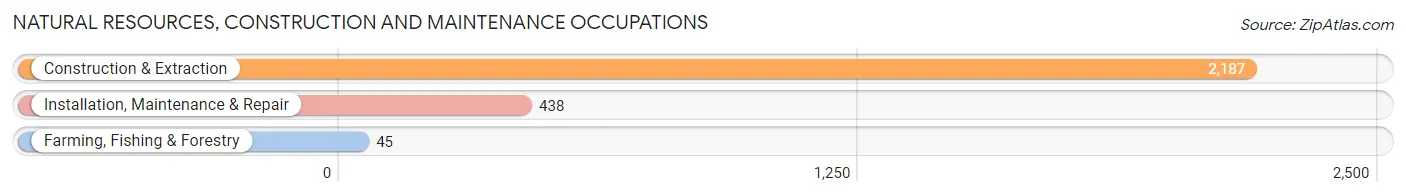
Natural Resources, Construction and Maintenance Occupations
The most common Natural Resources, Construction and Maintenance occupations in New Rochelle are Construction & Extraction (2,187 | 5.4%), Installation, Maintenance & Repair (438 | 1.1%), and Farming, Fishing & Forestry (45 | 0.1%).
Natural Resources, Construction and Maintenance Occupations by Sex
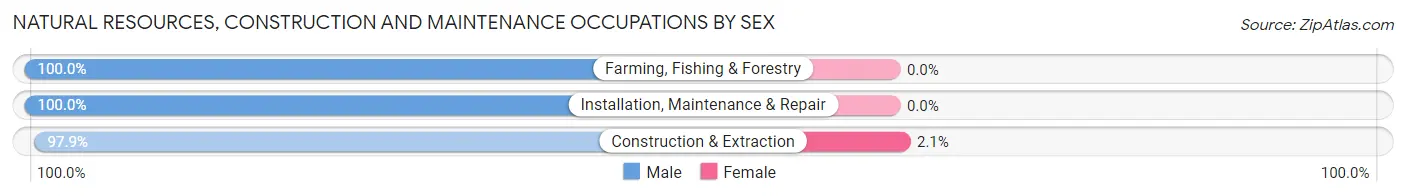
| Occupation | Male | Female |
| Farming, Fishing & Forestry | 45 (100.0%) | 0 (0.0%) |
| Construction & Extraction | 2,141 (97.9%) | 46 (2.1%) |
| Installation, Maintenance & Repair | 438 (100.0%) | 0 (0.0%) |
| Total (Category) | 2,624 (98.3%) | 46 (1.7%) |
| Total (Overall) | 21,177 (52.5%) | 19,177 (47.5%) |
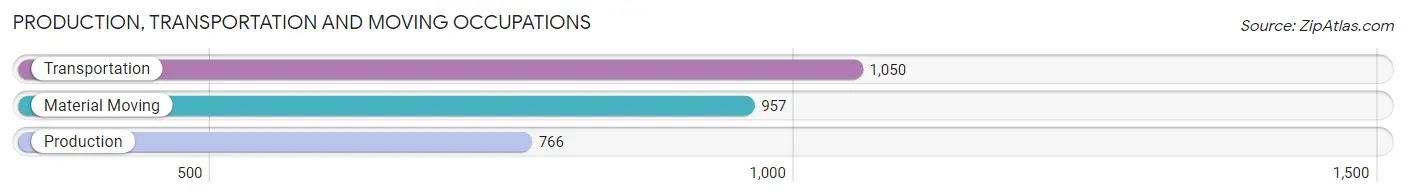
Production, Transportation and Moving Occupations
The most common Production, Transportation and Moving occupations in New Rochelle are Transportation (1,050 | 2.6%), Material Moving (957 | 2.4%), and Production (766 | 1.9%).
Production, Transportation and Moving Occupations by Sex
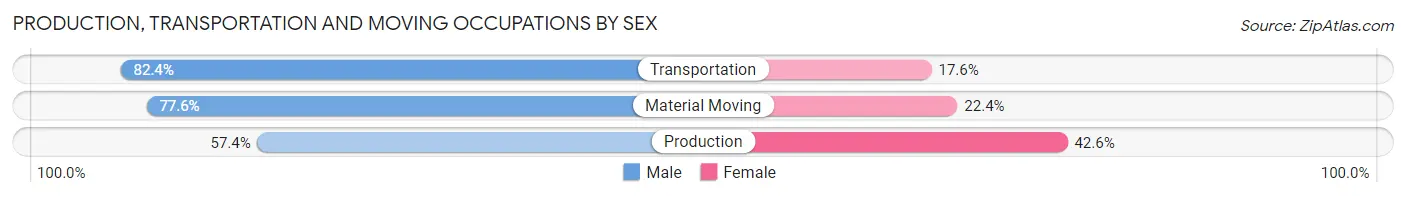
| Occupation | Male | Female |
| Production | 440 (57.4%) | 326 (42.6%) |
| Transportation | 865 (82.4%) | 185 (17.6%) |
| Material Moving | 743 (77.6%) | 214 (22.4%) |
| Total (Category) | 2,048 (73.9%) | 725 (26.1%) |
| Total (Overall) | 21,177 (52.5%) | 19,177 (47.5%) |
Employment Industries by Sex in New Rochelle
Employment Industries in New Rochelle
The major employment industries in New Rochelle include Health Care & Social Assistance (6,447 | 16.0%), Educational Services (5,861 | 14.5%), Professional & Scientific (4,688 | 11.6%), Retail Trade (3,389 | 8.4%), and Construction (2,639 | 6.5%).
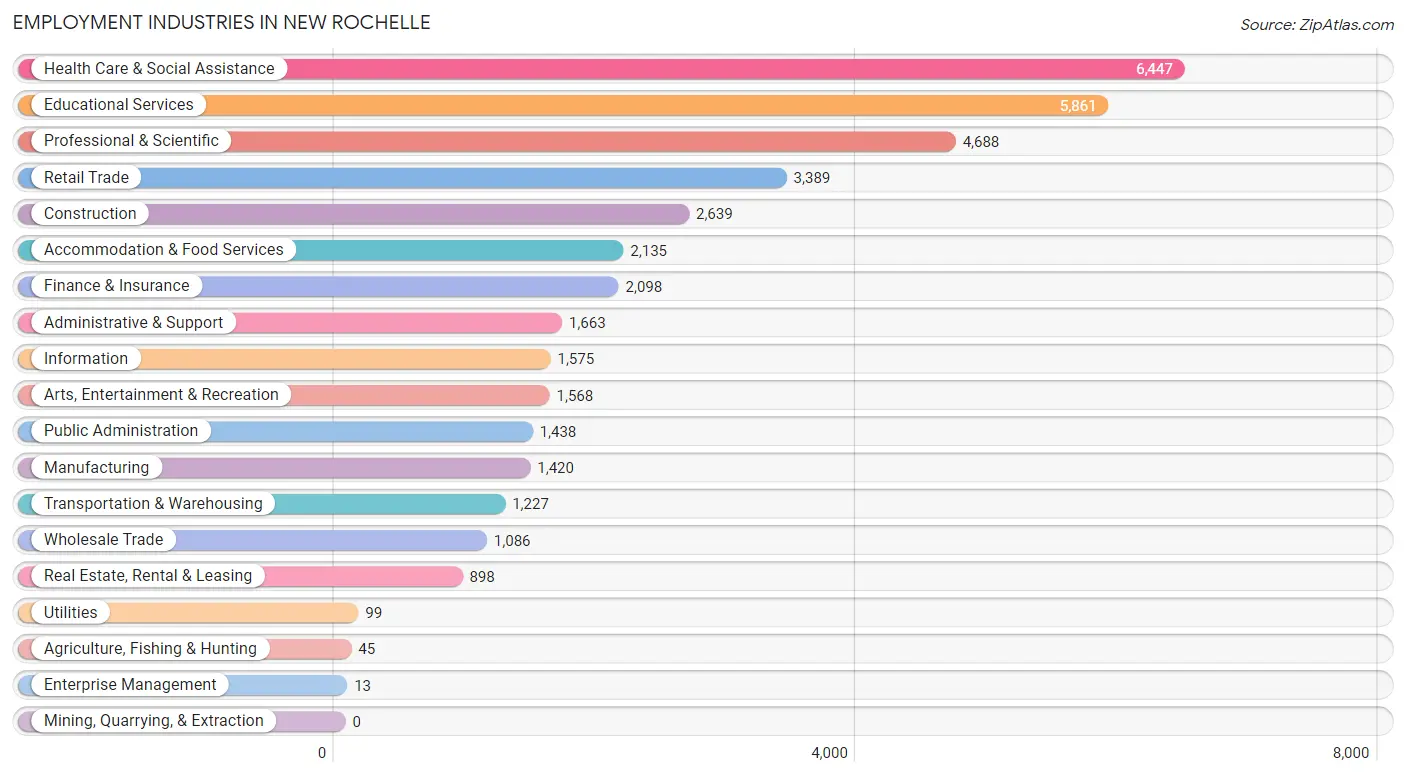
Employment Industries by Sex in New Rochelle
The New Rochelle industries that see more men than women are Agriculture, Fishing & Hunting (100.0%), Enterprise Management (100.0%), and Construction (92.0%), whereas the industries that tend to have a higher number of women are Health Care & Social Assistance (71.2%), Educational Services (63.3%), and Public Administration (52.9%).
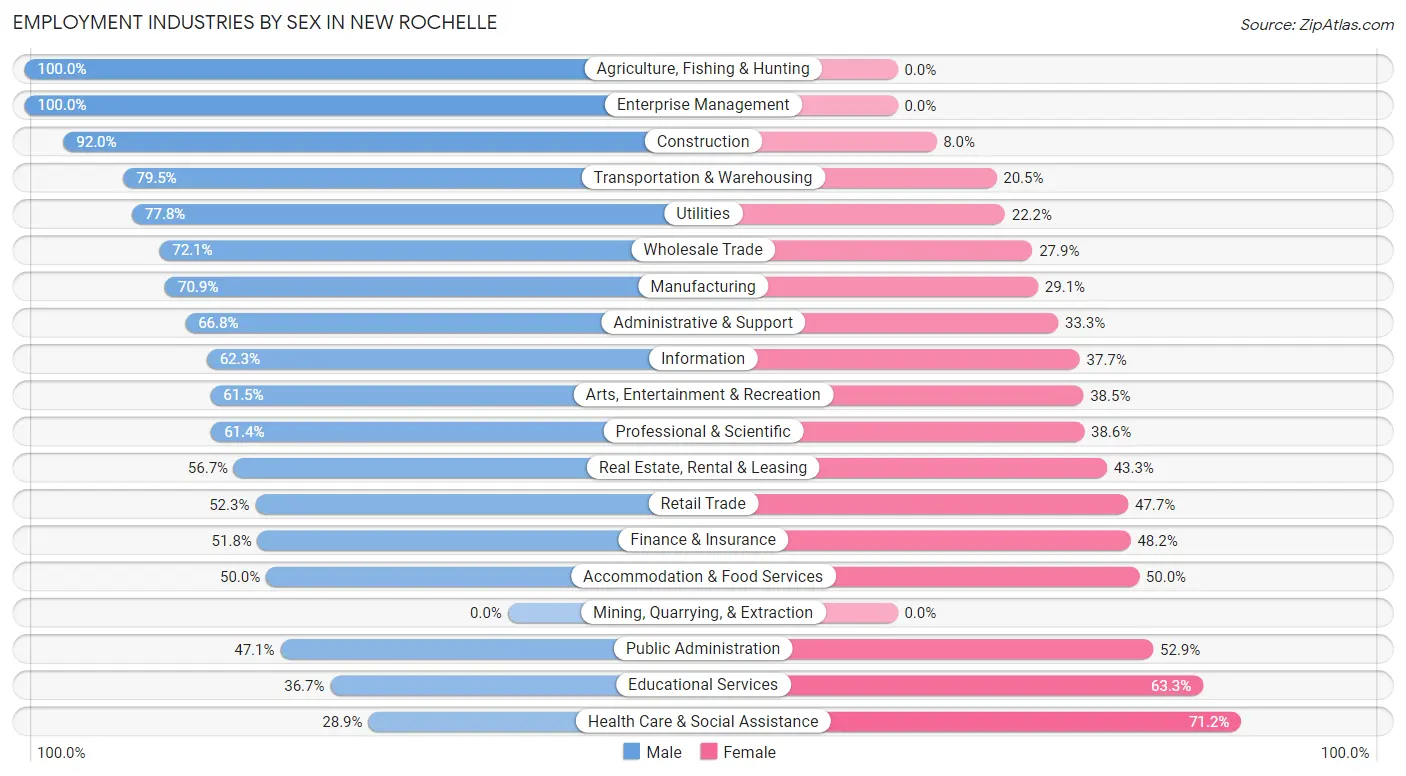
| Industry | Male | Female |
| Agriculture, Fishing & Hunting | 45 (100.0%) | 0 (0.0%) |
| Mining, Quarrying, & Extraction | 0 (0.0%) | 0 (0.0%) |
| Construction | 2,427 (92.0%) | 212 (8.0%) |
| Manufacturing | 1,007 (70.9%) | 413 (29.1%) |
| Wholesale Trade | 783 (72.1%) | 303 (27.9%) |
| Retail Trade | 1,771 (52.3%) | 1,618 (47.7%) |
| Transportation & Warehousing | 976 (79.5%) | 251 (20.5%) |
| Utilities | 77 (77.8%) | 22 (22.2%) |
| Information | 981 (62.3%) | 594 (37.7%) |
| Finance & Insurance | 1,086 (51.8%) | 1,012 (48.2%) |
| Real Estate, Rental & Leasing | 509 (56.7%) | 389 (43.3%) |
| Professional & Scientific | 2,877 (61.4%) | 1,811 (38.6%) |
| Enterprise Management | 13 (100.0%) | 0 (0.0%) |
| Administrative & Support | 1,110 (66.7%) | 553 (33.3%) |
| Educational Services | 2,153 (36.7%) | 3,708 (63.3%) |
| Health Care & Social Assistance | 1,860 (28.8%) | 4,587 (71.2%) |
| Arts, Entertainment & Recreation | 965 (61.5%) | 603 (38.5%) |
| Accommodation & Food Services | 1,068 (50.0%) | 1,067 (50.0%) |
| Public Administration | 677 (47.1%) | 761 (52.9%) |
| Total | 21,177 (52.5%) | 19,177 (47.5%) |
Education in New Rochelle
School Enrollment in New Rochelle
The most common levels of schooling among the 20,878 students in New Rochelle are college / undergraduate (5,212 | 25.0%), high school (4,372 | 20.9%), and elementary school (3,780 | 18.1%).
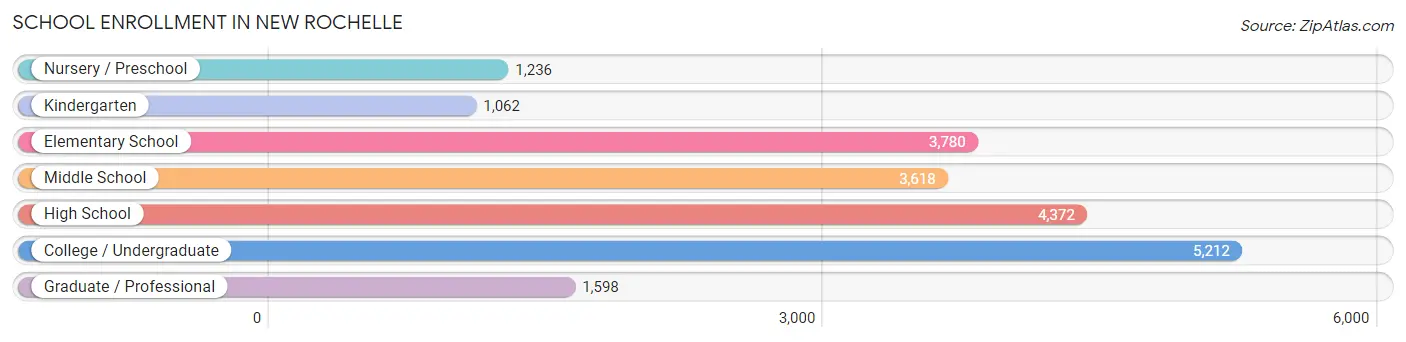
| School Level | # Students | % Students |
| Nursery / Preschool | 1,236 | 5.9% |
| Kindergarten | 1,062 | 5.1% |
| Elementary School | 3,780 | 18.1% |
| Middle School | 3,618 | 17.3% |
| High School | 4,372 | 20.9% |
| College / Undergraduate | 5,212 | 25.0% |
| Graduate / Professional | 1,598 | 7.6% |
| Total | 20,878 | 100.0% |
School Enrollment by Age by Funding Source in New Rochelle
Out of a total of 20,878 students who are enrolled in schools in New Rochelle, 7,245 (34.7%) attend a private institution, while the remaining 13,633 (65.3%) are enrolled in public schools. The age group of 20 to 24 year olds has the highest likelihood of being enrolled in private schools, with 2,021 (63.4% in the age bracket) enrolled. Conversely, the age group of 5 to 9 year old has the lowest likelihood of being enrolled in a private school, with 3,938 (82.5% in the age bracket) attending a public institution.
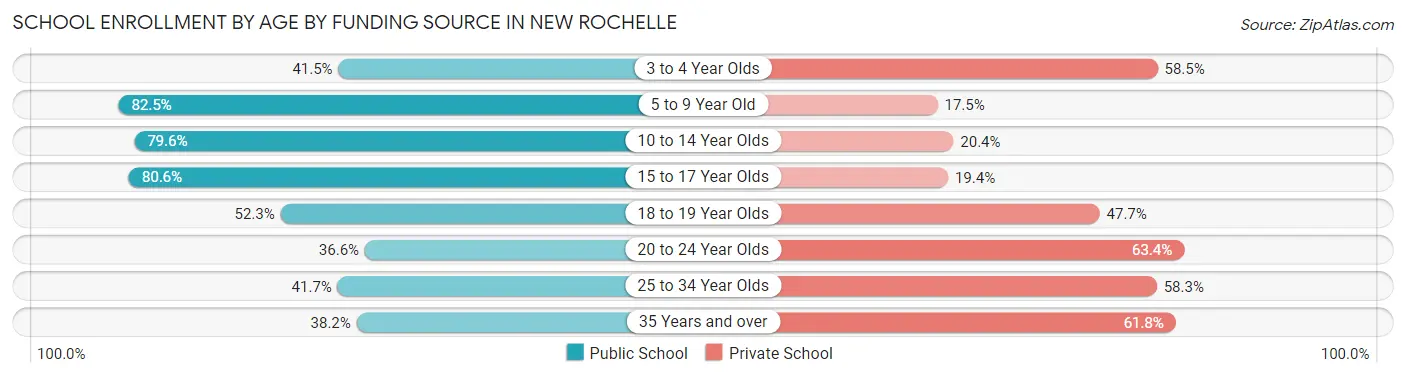
| Age Bracket | Public School | Private School |
| 3 to 4 Year Olds | 437 (41.5%) | 615 (58.5%) |
| 5 to 9 Year Old | 3,938 (82.5%) | 835 (17.5%) |
| 10 to 14 Year Olds | 3,532 (79.6%) | 907 (20.4%) |
| 15 to 17 Year Olds | 2,562 (80.6%) | 618 (19.4%) |
| 18 to 19 Year Olds | 1,268 (52.3%) | 1,155 (47.7%) |
| 20 to 24 Year Olds | 1,167 (36.6%) | 2,021 (63.4%) |
| 25 to 34 Year Olds | 371 (41.7%) | 519 (58.3%) |
| 35 Years and over | 356 (38.2%) | 577 (61.8%) |
| Total | 13,633 (65.3%) | 7,245 (34.7%) |
Educational Attainment by Field of Study in New Rochelle
Business (5,127 | 18.9%), social sciences (3,547 | 13.0%), science & technology (2,454 | 9.0%), education (2,033 | 7.5%), and literature & languages (1,998 | 7.3%) are the most common fields of study among 27,205 individuals in New Rochelle who have obtained a bachelor's degree or higher.
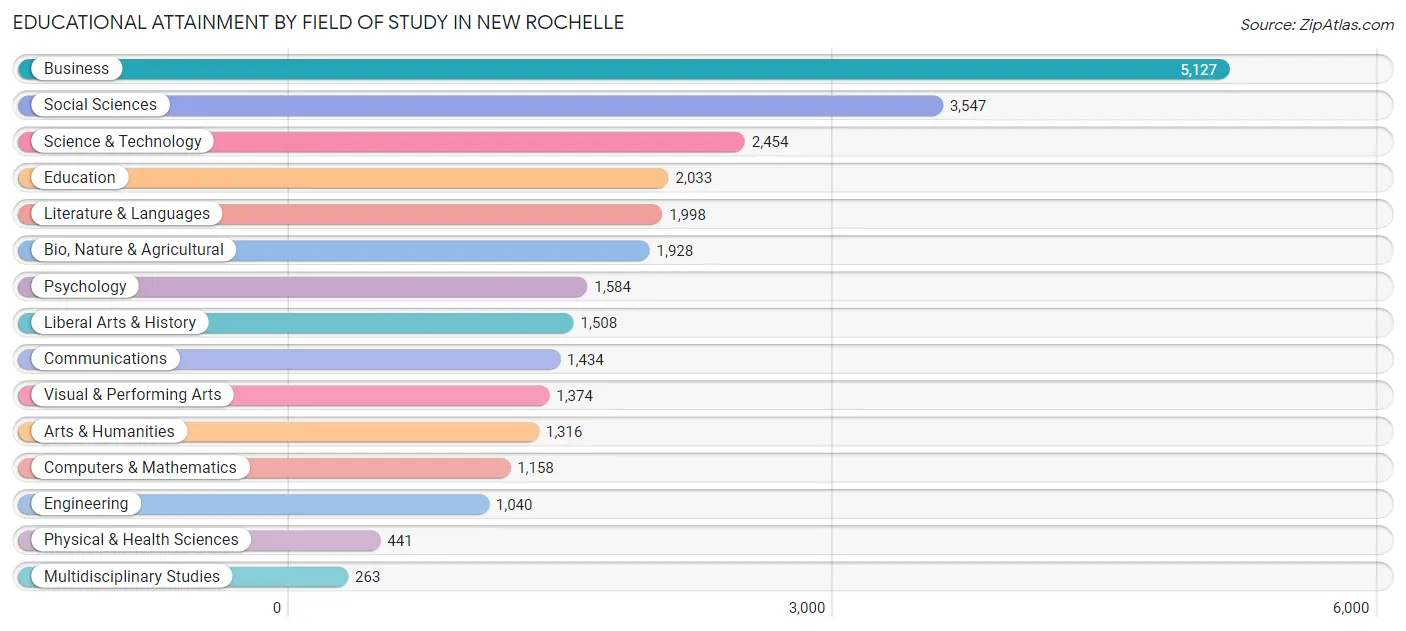
| Field of Study | # Graduates | % Graduates |
| Computers & Mathematics | 1,158 | 4.3% |
| Bio, Nature & Agricultural | 1,928 | 7.1% |
| Physical & Health Sciences | 441 | 1.6% |
| Psychology | 1,584 | 5.8% |
| Social Sciences | 3,547 | 13.0% |
| Engineering | 1,040 | 3.8% |
| Multidisciplinary Studies | 263 | 1.0% |
| Science & Technology | 2,454 | 9.0% |
| Business | 5,127 | 18.9% |
| Education | 2,033 | 7.5% |
| Literature & Languages | 1,998 | 7.3% |
| Liberal Arts & History | 1,508 | 5.5% |
| Visual & Performing Arts | 1,374 | 5.1% |
| Communications | 1,434 | 5.3% |
| Arts & Humanities | 1,316 | 4.8% |
| Total | 27,205 | 100.0% |
Transportation & Commute in New Rochelle
Vehicle Availability by Sex in New Rochelle
The most prevalent vehicle ownership categories in New Rochelle are males with 2 vehicles (8,560, accounting for 41.4%) and females with 2 vehicles (7,267, making up 47.2%).
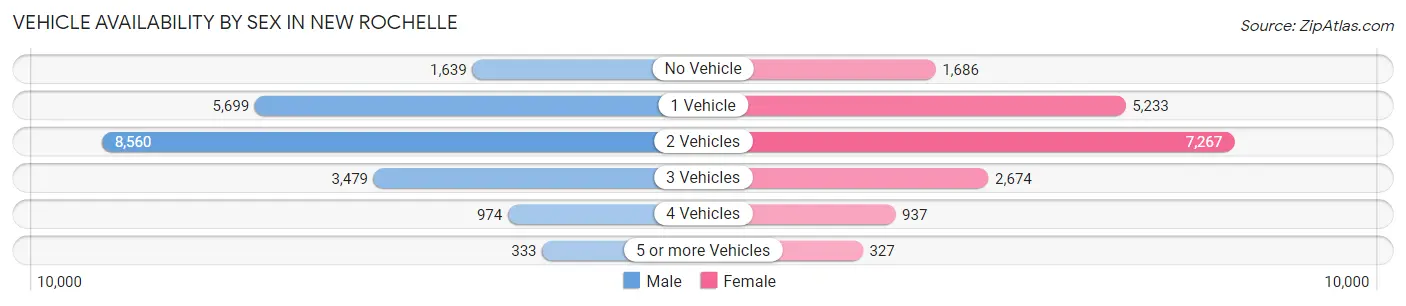
| Vehicles Available | Male | Female |
| No Vehicle | 1,639 (7.9%) | 1,686 (9.3%) |
| 1 Vehicle | 5,699 (27.6%) | 5,233 (28.9%) |
| 2 Vehicles | 8,560 (41.4%) | 7,267 (40.1%) |
| 3 Vehicles | 3,479 (16.8%) | 2,674 (14.7%) |
| 4 Vehicles | 974 (4.7%) | 937 (5.2%) |
| 5 or more Vehicles | 333 (1.6%) | 327 (1.8%) |
| Total | 20,684 (100.0%) | 18,124 (100.0%) |
Commute Time in New Rochelle
The most frequently occuring commute durations in New Rochelle are 20 to 24 minutes (4,743 commuters, 14.0%), 30 to 34 minutes (4,641 commuters, 13.7%), and 15 to 19 minutes (4,484 commuters, 13.2%).
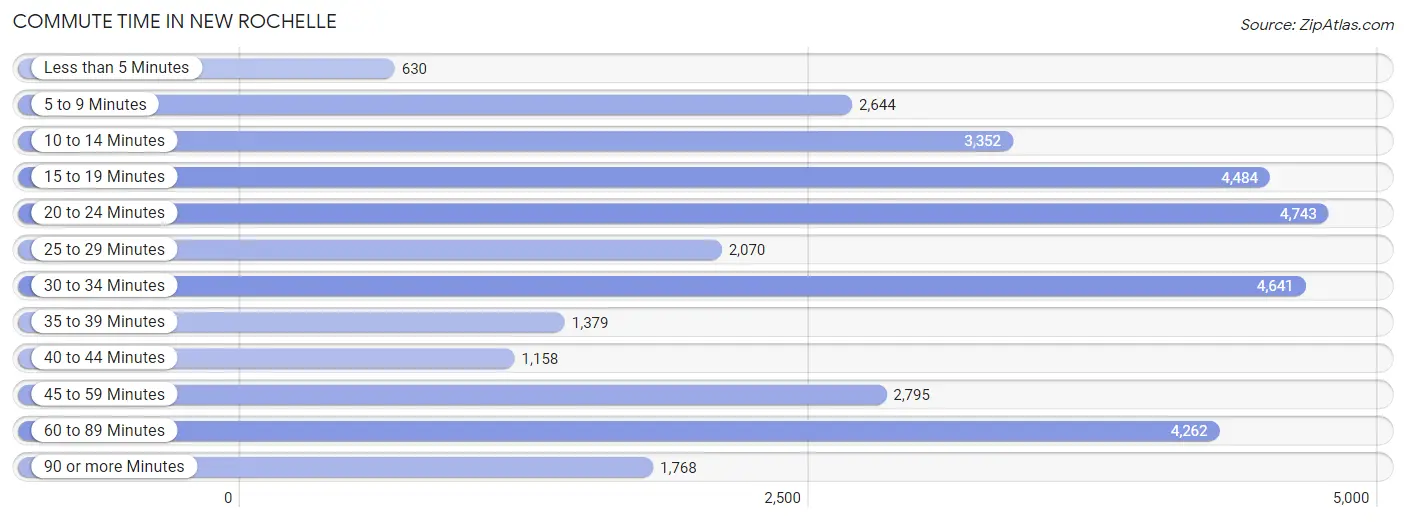
| Commute Time | # Commuters | % Commuters |
| Less than 5 Minutes | 630 | 1.9% |
| 5 to 9 Minutes | 2,644 | 7.8% |
| 10 to 14 Minutes | 3,352 | 9.9% |
| 15 to 19 Minutes | 4,484 | 13.2% |
| 20 to 24 Minutes | 4,743 | 14.0% |
| 25 to 29 Minutes | 2,070 | 6.1% |
| 30 to 34 Minutes | 4,641 | 13.7% |
| 35 to 39 Minutes | 1,379 | 4.1% |
| 40 to 44 Minutes | 1,158 | 3.4% |
| 45 to 59 Minutes | 2,795 | 8.2% |
| 60 to 89 Minutes | 4,262 | 12.6% |
| 90 or more Minutes | 1,768 | 5.2% |
Commute Time by Sex in New Rochelle
The most common commute times in New Rochelle are 30 to 34 minutes (2,641 commuters, 14.4%) for males and 20 to 24 minutes (2,533 commuters, 16.3%) for females.
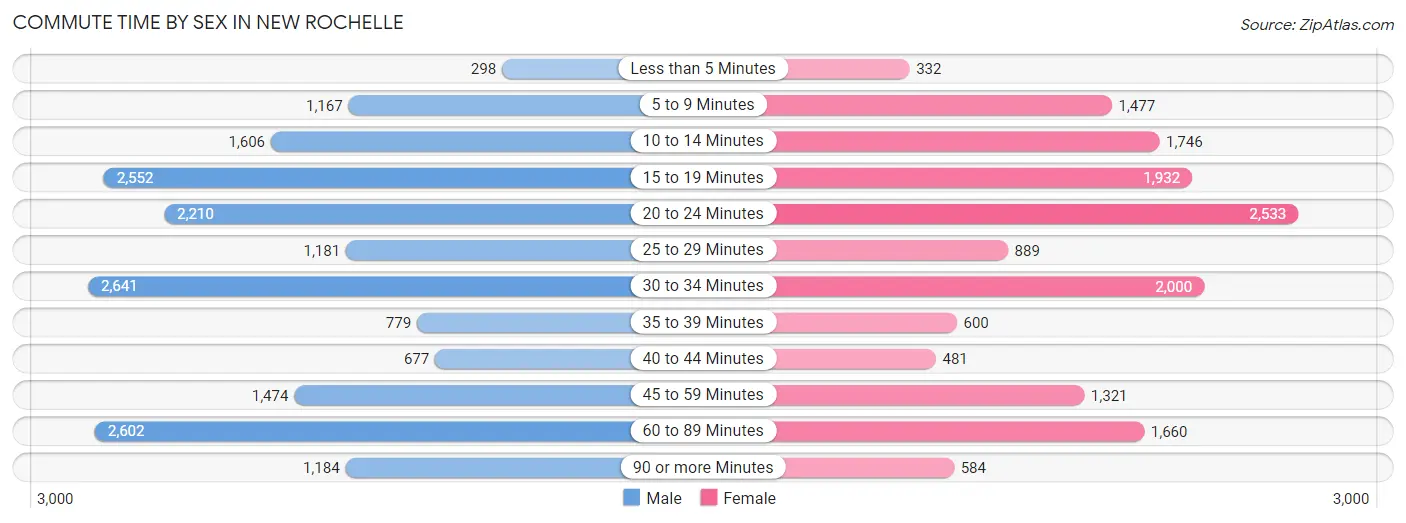
| Commute Time | Male | Female |
| Less than 5 Minutes | 298 (1.6%) | 332 (2.1%) |
| 5 to 9 Minutes | 1,167 (6.4%) | 1,477 (9.5%) |
| 10 to 14 Minutes | 1,606 (8.7%) | 1,746 (11.2%) |
| 15 to 19 Minutes | 2,552 (13.9%) | 1,932 (12.4%) |
| 20 to 24 Minutes | 2,210 (12.0%) | 2,533 (16.3%) |
| 25 to 29 Minutes | 1,181 (6.4%) | 889 (5.7%) |
| 30 to 34 Minutes | 2,641 (14.4%) | 2,000 (12.9%) |
| 35 to 39 Minutes | 779 (4.2%) | 600 (3.9%) |
| 40 to 44 Minutes | 677 (3.7%) | 481 (3.1%) |
| 45 to 59 Minutes | 1,474 (8.0%) | 1,321 (8.5%) |
| 60 to 89 Minutes | 2,602 (14.2%) | 1,660 (10.7%) |
| 90 or more Minutes | 1,184 (6.4%) | 584 (3.7%) |
Time of Departure to Work by Sex in New Rochelle
The most frequent times of departure to work in New Rochelle are 7:00 AM to 7:29 AM (3,661, 19.9%) for males and 8:00 AM to 8:29 AM (3,162, 20.3%) for females.
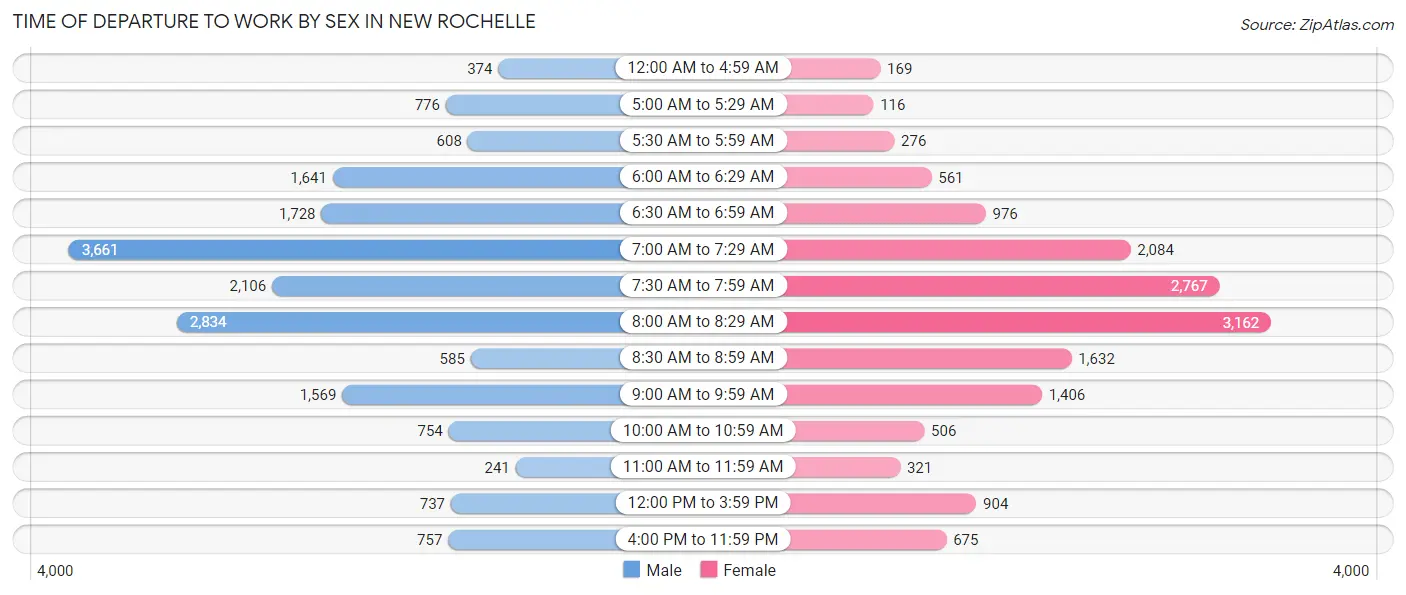
| Time of Departure | Male | Female |
| 12:00 AM to 4:59 AM | 374 (2.0%) | 169 (1.1%) |
| 5:00 AM to 5:29 AM | 776 (4.2%) | 116 (0.7%) |
| 5:30 AM to 5:59 AM | 608 (3.3%) | 276 (1.8%) |
| 6:00 AM to 6:29 AM | 1,641 (8.9%) | 561 (3.6%) |
| 6:30 AM to 6:59 AM | 1,728 (9.4%) | 976 (6.3%) |
| 7:00 AM to 7:29 AM | 3,661 (19.9%) | 2,084 (13.4%) |
| 7:30 AM to 7:59 AM | 2,106 (11.5%) | 2,767 (17.8%) |
| 8:00 AM to 8:29 AM | 2,834 (15.4%) | 3,162 (20.3%) |
| 8:30 AM to 8:59 AM | 585 (3.2%) | 1,632 (10.5%) |
| 9:00 AM to 9:59 AM | 1,569 (8.5%) | 1,406 (9.0%) |
| 10:00 AM to 10:59 AM | 754 (4.1%) | 506 (3.3%) |
| 11:00 AM to 11:59 AM | 241 (1.3%) | 321 (2.1%) |
| 12:00 PM to 3:59 PM | 737 (4.0%) | 904 (5.8%) |
| 4:00 PM to 11:59 PM | 757 (4.1%) | 675 (4.3%) |
| Total | 18,371 (100.0%) | 15,555 (100.0%) |
Housing Occupancy in New Rochelle
Occupancy by Ownership in New Rochelle
Of the total 29,905 dwellings in New Rochelle, owner-occupied units account for 15,574 (52.1%), while renter-occupied units make up 14,331 (47.9%).
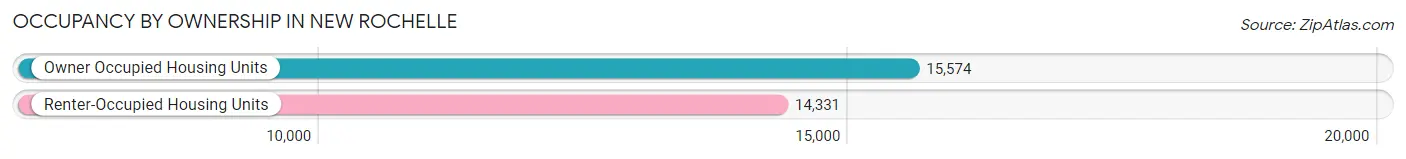
| Occupancy | # Housing Units | % Housing Units |
| Owner Occupied Housing Units | 15,574 | 52.1% |
| Renter-Occupied Housing Units | 14,331 | 47.9% |
| Total Occupied Housing Units | 29,905 | 100.0% |
Occupancy by Household Size in New Rochelle
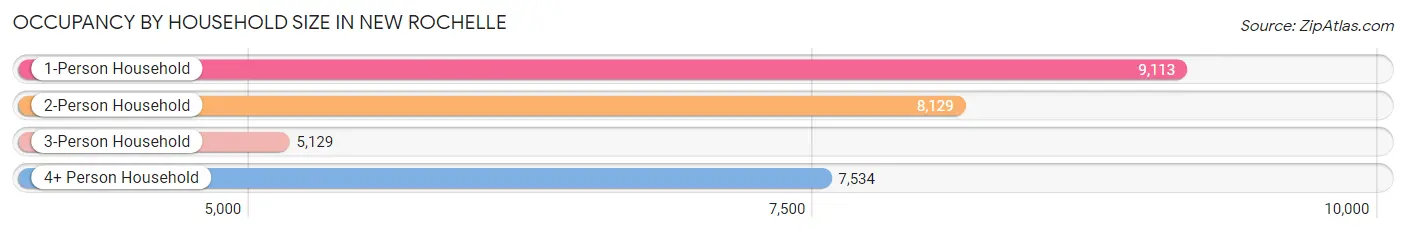
| Household Size | # Housing Units | % Housing Units |
| 1-Person Household | 9,113 | 30.5% |
| 2-Person Household | 8,129 | 27.2% |
| 3-Person Household | 5,129 | 17.2% |
| 4+ Person Household | 7,534 | 25.2% |
| Total Housing Units | 29,905 | 100.0% |
Occupancy by Ownership by Household Size in New Rochelle
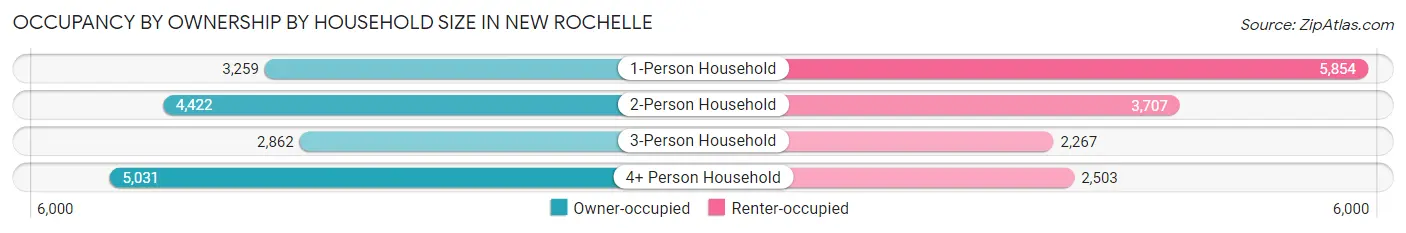
| Household Size | Owner-occupied | Renter-occupied |
| 1-Person Household | 3,259 (35.8%) | 5,854 (64.2%) |
| 2-Person Household | 4,422 (54.4%) | 3,707 (45.6%) |
| 3-Person Household | 2,862 (55.8%) | 2,267 (44.2%) |
| 4+ Person Household | 5,031 (66.8%) | 2,503 (33.2%) |
| Total Housing Units | 15,574 (52.1%) | 14,331 (47.9%) |
Occupancy by Educational Attainment in New Rochelle
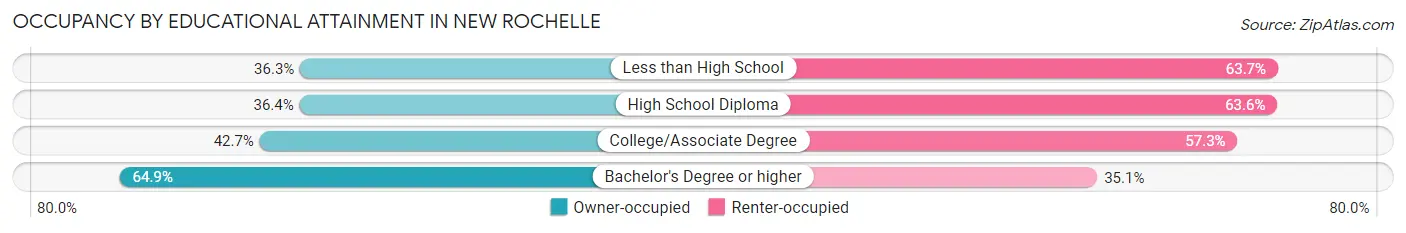
| Household Size | Owner-occupied | Renter-occupied |
| Less than High School | 1,331 (36.3%) | 2,337 (63.7%) |
| High School Diploma | 2,116 (36.4%) | 3,698 (63.6%) |
| College/Associate Degree | 2,182 (42.7%) | 2,927 (57.3%) |
| Bachelor's Degree or higher | 9,945 (64.9%) | 5,369 (35.1%) |
Occupancy by Age of Householder in New Rochelle
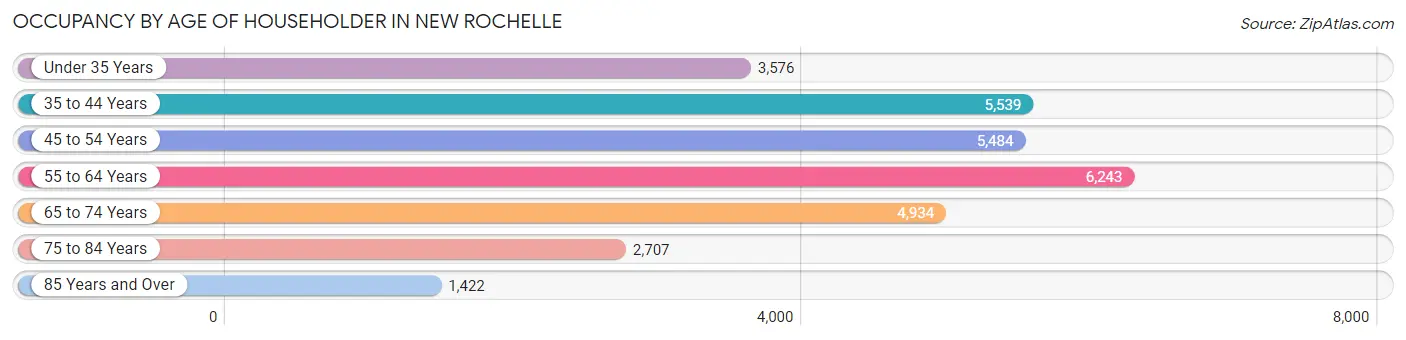
| Age Bracket | # Households | % Households |
| Under 35 Years | 3,576 | 12.0% |
| 35 to 44 Years | 5,539 | 18.5% |
| 45 to 54 Years | 5,484 | 18.3% |
| 55 to 64 Years | 6,243 | 20.9% |
| 65 to 74 Years | 4,934 | 16.5% |
| 75 to 84 Years | 2,707 | 9.0% |
| 85 Years and Over | 1,422 | 4.8% |
| Total | 29,905 | 100.0% |
Housing Finances in New Rochelle
Median Income by Occupancy in New Rochelle
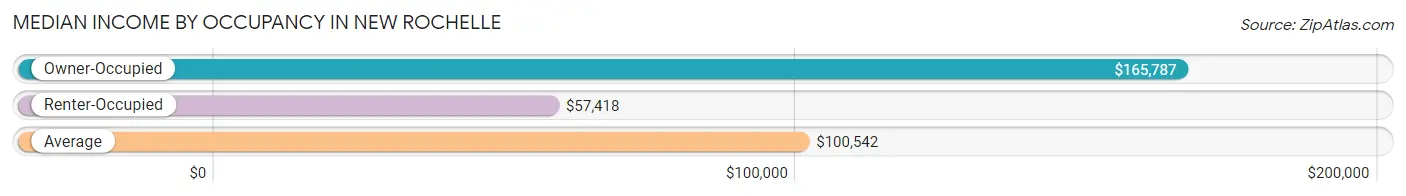
| Occupancy Type | # Households | Median Income |
| Owner-Occupied | 15,574 (52.1%) | $165,787 |
| Renter-Occupied | 14,331 (47.9%) | $57,418 |
| Average | 29,905 (100.0%) | $100,542 |
Occupancy by Householder Income Bracket in New Rochelle
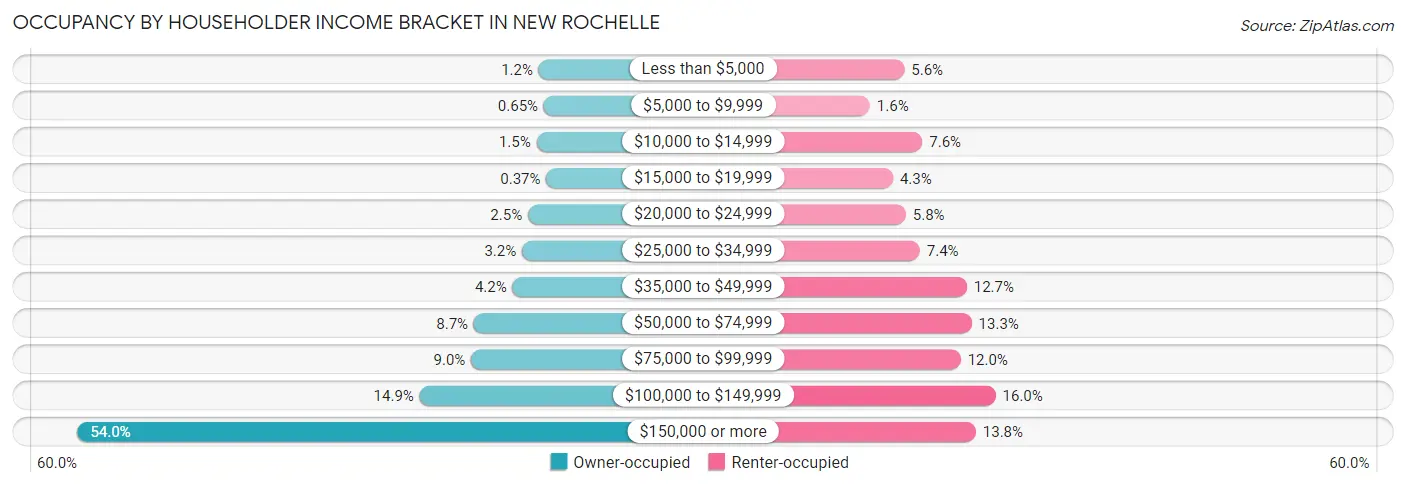
| Income Bracket | Owner-occupied | Renter-occupied |
| Less than $5,000 | 192 (1.2%) | 799 (5.6%) |
| $5,000 to $9,999 | 101 (0.6%) | 235 (1.6%) |
| $10,000 to $14,999 | 232 (1.5%) | 1,093 (7.6%) |
| $15,000 to $19,999 | 57 (0.4%) | 614 (4.3%) |
| $20,000 to $24,999 | 384 (2.5%) | 824 (5.8%) |
| $25,000 to $34,999 | 491 (3.2%) | 1,054 (7.3%) |
| $35,000 to $49,999 | 659 (4.2%) | 1,821 (12.7%) |
| $50,000 to $74,999 | 1,347 (8.6%) | 1,902 (13.3%) |
| $75,000 to $99,999 | 1,395 (9.0%) | 1,723 (12.0%) |
| $100,000 to $149,999 | 2,312 (14.8%) | 2,295 (16.0%) |
| $150,000 or more | 8,404 (54.0%) | 1,971 (13.8%) |
| Total | 15,574 (100.0%) | 14,331 (100.0%) |
Monthly Housing Cost Tiers in New Rochelle
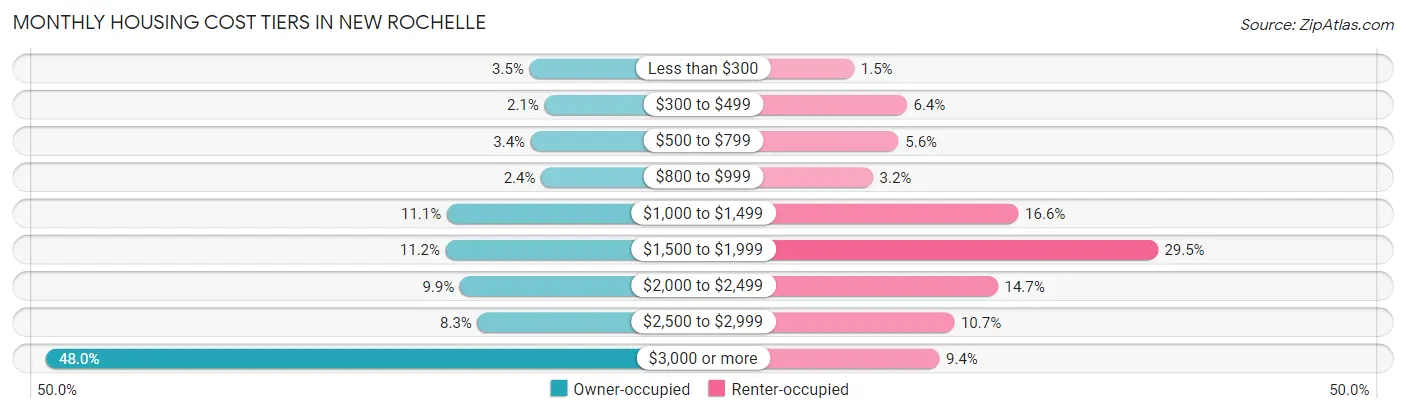
| Monthly Cost | Owner-occupied | Renter-occupied |
| Less than $300 | 545 (3.5%) | 217 (1.5%) |
| $300 to $499 | 332 (2.1%) | 911 (6.4%) |
| $500 to $799 | 528 (3.4%) | 804 (5.6%) |
| $800 to $999 | 378 (2.4%) | 464 (3.2%) |
| $1,000 to $1,499 | 1,730 (11.1%) | 2,384 (16.6%) |
| $1,500 to $1,999 | 1,748 (11.2%) | 4,222 (29.5%) |
| $2,000 to $2,499 | 1,543 (9.9%) | 2,113 (14.7%) |
| $2,500 to $2,999 | 1,291 (8.3%) | 1,537 (10.7%) |
| $3,000 or more | 7,479 (48.0%) | 1,342 (9.4%) |
| Total | 15,574 (100.0%) | 14,331 (100.0%) |
Physical Housing Characteristics in New Rochelle
Housing Structures in New Rochelle
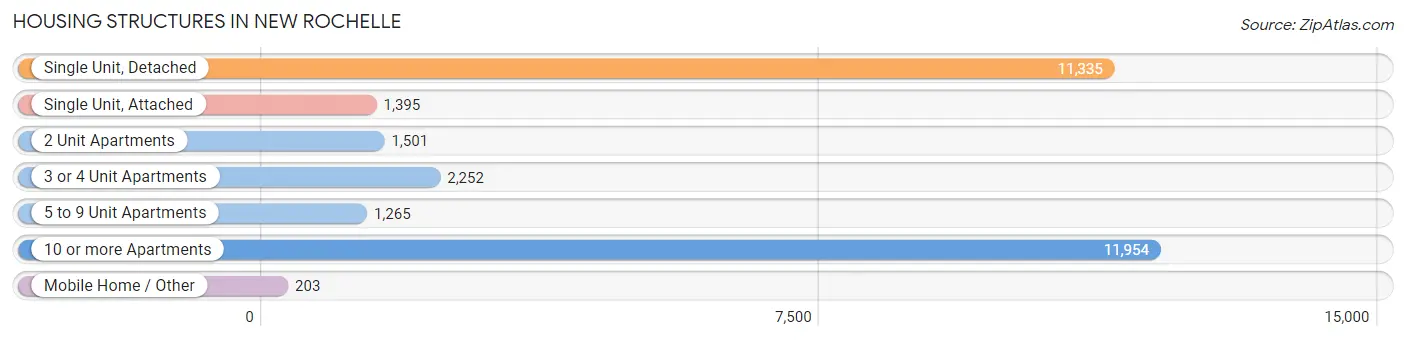
| Structure Type | # Housing Units | % Housing Units |
| Single Unit, Detached | 11,335 | 37.9% |
| Single Unit, Attached | 1,395 | 4.7% |
| 2 Unit Apartments | 1,501 | 5.0% |
| 3 or 4 Unit Apartments | 2,252 | 7.5% |
| 5 to 9 Unit Apartments | 1,265 | 4.2% |
| 10 or more Apartments | 11,954 | 40.0% |
| Mobile Home / Other | 203 | 0.7% |
| Total | 29,905 | 100.0% |
Housing Structures by Occupancy in New Rochelle
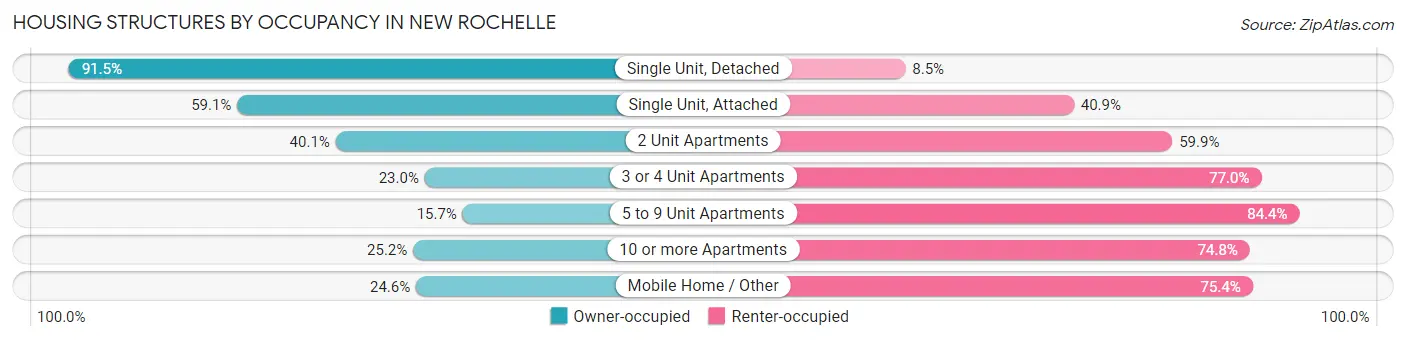
| Structure Type | Owner-occupied | Renter-occupied |
| Single Unit, Detached | 10,370 (91.5%) | 965 (8.5%) |
| Single Unit, Attached | 824 (59.1%) | 571 (40.9%) |
| 2 Unit Apartments | 602 (40.1%) | 899 (59.9%) |
| 3 or 4 Unit Apartments | 517 (23.0%) | 1,735 (77.0%) |
| 5 to 9 Unit Apartments | 198 (15.7%) | 1,067 (84.4%) |
| 10 or more Apartments | 3,013 (25.2%) | 8,941 (74.8%) |
| Mobile Home / Other | 50 (24.6%) | 153 (75.4%) |
| Total | 15,574 (52.1%) | 14,331 (47.9%) |
Housing Structures by Number of Rooms in New Rochelle
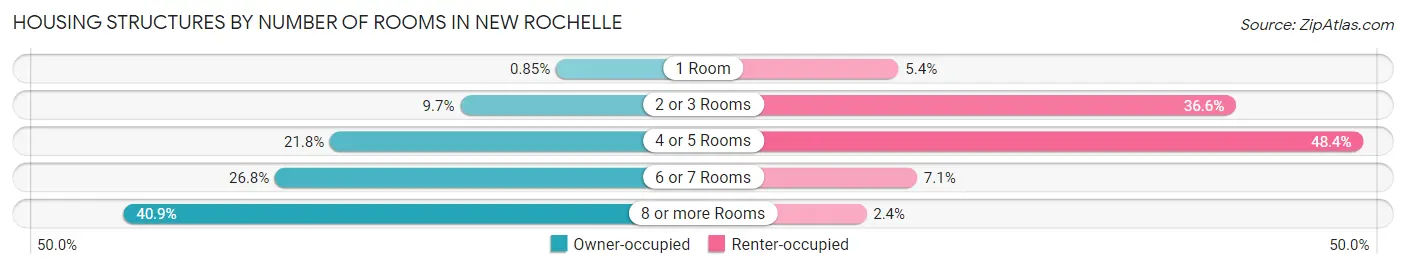
| Number of Rooms | Owner-occupied | Renter-occupied |
| 1 Room | 132 (0.9%) | 775 (5.4%) |
| 2 or 3 Rooms | 1,512 (9.7%) | 5,250 (36.6%) |
| 4 or 5 Rooms | 3,387 (21.7%) | 6,937 (48.4%) |
| 6 or 7 Rooms | 4,178 (26.8%) | 1,020 (7.1%) |
| 8 or more Rooms | 6,365 (40.9%) | 349 (2.4%) |
| Total | 15,574 (100.0%) | 14,331 (100.0%) |
Housing Structure by Heating Type in New Rochelle
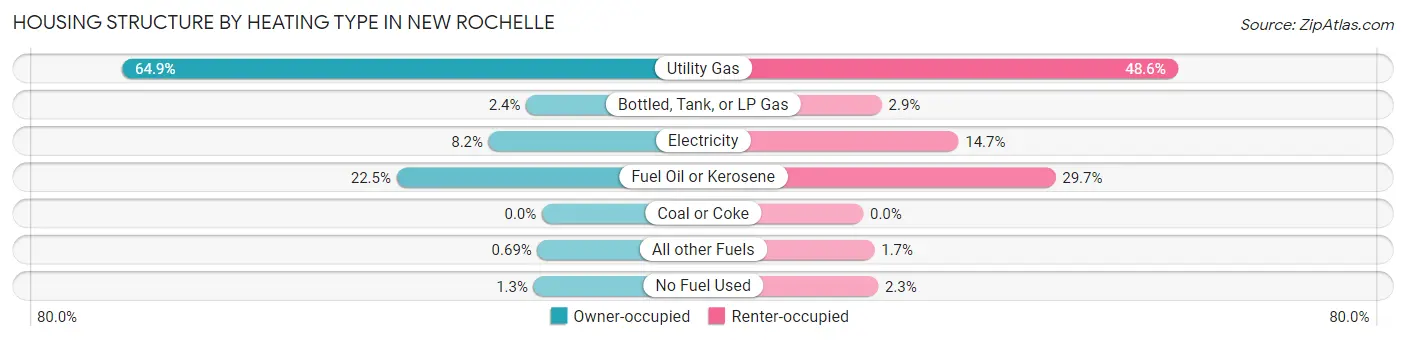
| Heating Type | Owner-occupied | Renter-occupied |
| Utility Gas | 10,110 (64.9%) | 6,968 (48.6%) |
| Bottled, Tank, or LP Gas | 379 (2.4%) | 412 (2.9%) |
| Electricity | 1,281 (8.2%) | 2,111 (14.7%) |
| Fuel Oil or Kerosene | 3,498 (22.5%) | 4,259 (29.7%) |
| Coal or Coke | 0 (0.0%) | 0 (0.0%) |
| All other Fuels | 107 (0.7%) | 250 (1.7%) |
| No Fuel Used | 199 (1.3%) | 331 (2.3%) |
| Total | 15,574 (100.0%) | 14,331 (100.0%) |
Household Vehicle Usage in New Rochelle
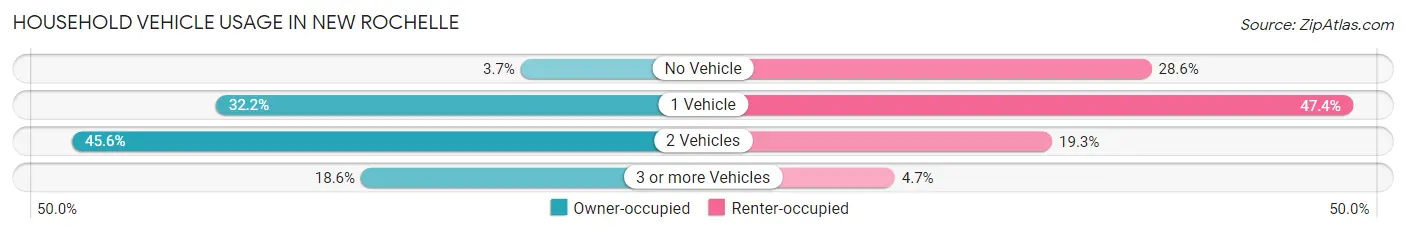
| Vehicles per Household | Owner-occupied | Renter-occupied |
| No Vehicle | 574 (3.7%) | 4,101 (28.6%) |
| 1 Vehicle | 5,007 (32.2%) | 6,791 (47.4%) |
| 2 Vehicles | 7,095 (45.6%) | 2,771 (19.3%) |
| 3 or more Vehicles | 2,898 (18.6%) | 668 (4.7%) |
| Total | 15,574 (100.0%) | 14,331 (100.0%) |
Real Estate & Mortgages in New Rochelle
Real Estate and Mortgage Overview in New Rochelle
| Characteristic | Without Mortgage | With Mortgage |
| Housing Units | 6,101 | 9,473 |
| Median Property Value | $588,800 | $668,900 |
| Median Household Income | $111,316 | $5,891 |
| Monthly Housing Costs | $1,501 | $6,551 |
| Real Estate Taxes | $10,001 | $757 |
Property Value by Mortgage Status in New Rochelle
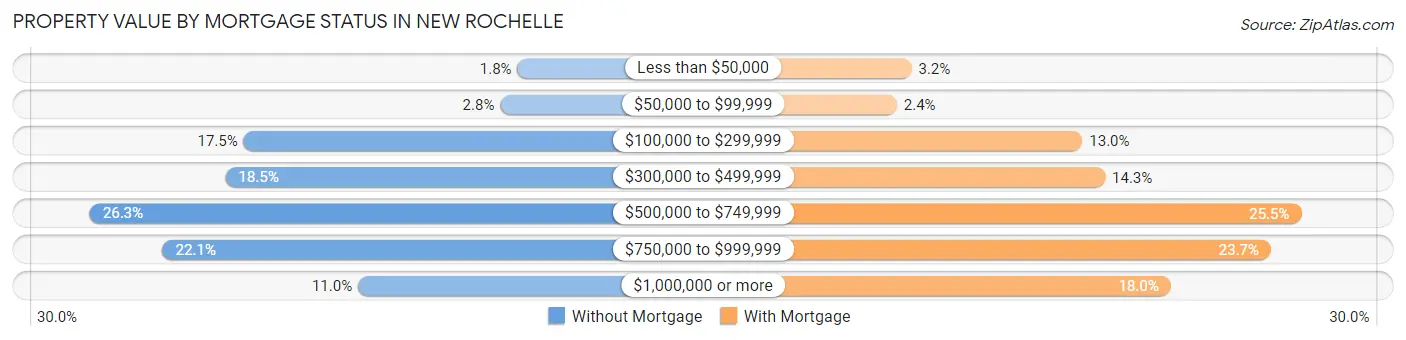
| Property Value | Without Mortgage | With Mortgage |
| Less than $50,000 | 112 (1.8%) | 303 (3.2%) |
| $50,000 to $99,999 | 172 (2.8%) | 224 (2.4%) |
| $100,000 to $299,999 | 1,067 (17.5%) | 1,228 (13.0%) |
| $300,000 to $499,999 | 1,130 (18.5%) | 1,351 (14.3%) |
| $500,000 to $749,999 | 1,603 (26.3%) | 2,413 (25.5%) |
| $750,000 to $999,999 | 1,349 (22.1%) | 2,248 (23.7%) |
| $1,000,000 or more | 668 (11.0%) | 1,706 (18.0%) |
| Total | 6,101 (100.0%) | 9,473 (100.0%) |
Household Income by Mortgage Status in New Rochelle
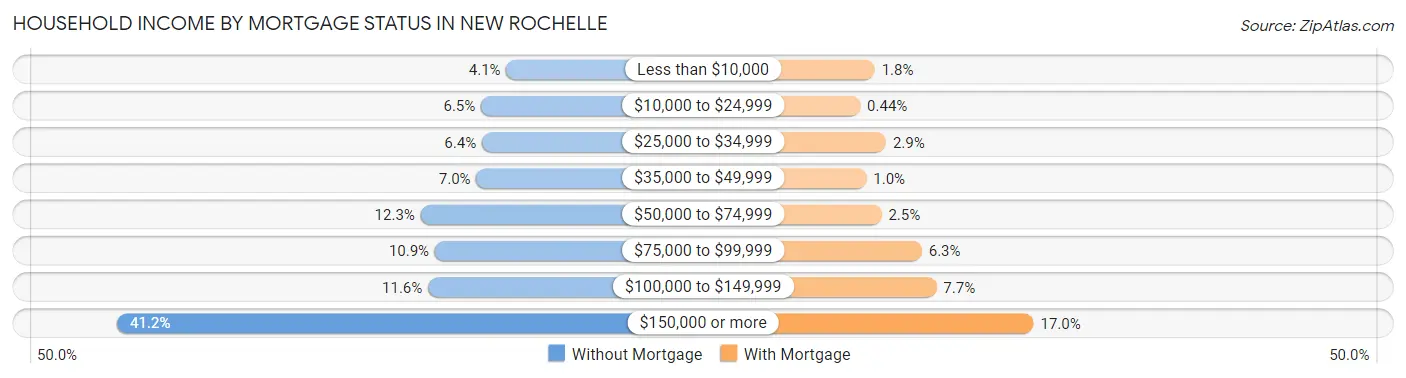
| Household Income | Without Mortgage | With Mortgage |
| Less than $10,000 | 251 (4.1%) | 173 (1.8%) |
| $10,000 to $24,999 | 398 (6.5%) | 42 (0.4%) |
| $25,000 to $34,999 | 393 (6.4%) | 275 (2.9%) |
| $35,000 to $49,999 | 425 (7.0%) | 98 (1.0%) |
| $50,000 to $74,999 | 749 (12.3%) | 234 (2.5%) |
| $75,000 to $99,999 | 666 (10.9%) | 598 (6.3%) |
| $100,000 to $149,999 | 706 (11.6%) | 729 (7.7%) |
| $150,000 or more | 2,513 (41.2%) | 1,606 (17.0%) |
| Total | 6,101 (100.0%) | 9,473 (100.0%) |
Property Value to Household Income Ratio in New Rochelle
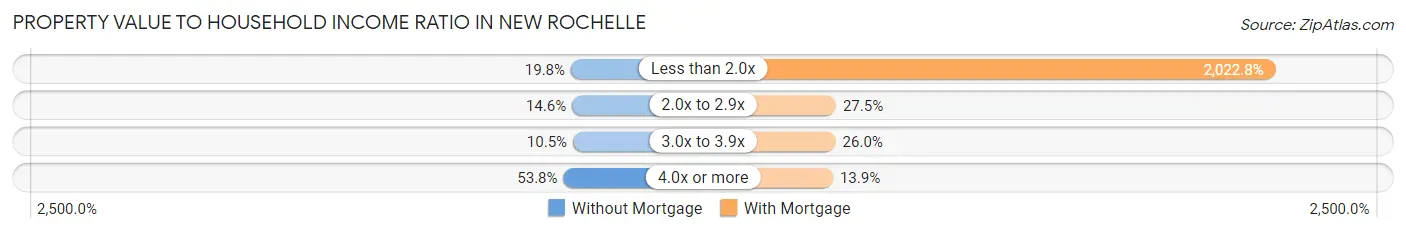
| Value-to-Income Ratio | Without Mortgage | With Mortgage |
| Less than 2.0x | 1,210 (19.8%) | 191,624 (2,022.8%) |
| 2.0x to 2.9x | 893 (14.6%) | 2,602 (27.5%) |
| 3.0x to 3.9x | 643 (10.5%) | 2,464 (26.0%) |
| 4.0x or more | 3,279 (53.7%) | 1,319 (13.9%) |
| Total | 6,101 (100.0%) | 9,473 (100.0%) |
Real Estate Taxes by Mortgage Status in New Rochelle
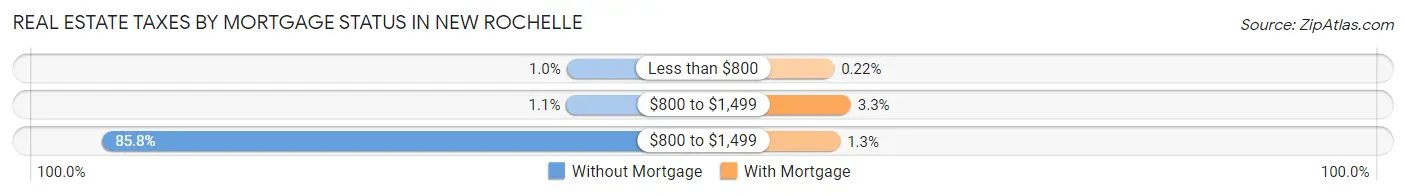
| Property Taxes | Without Mortgage | With Mortgage |
| Less than $800 | 62 (1.0%) | 21 (0.2%) |
| $800 to $1,499 | 65 (1.1%) | 308 (3.3%) |
| $800 to $1,499 | 5,236 (85.8%) | 124 (1.3%) |
| Total | 6,101 (100.0%) | 9,473 (100.0%) |
Health & Disability in New Rochelle
Health Insurance Coverage by Age in New Rochelle
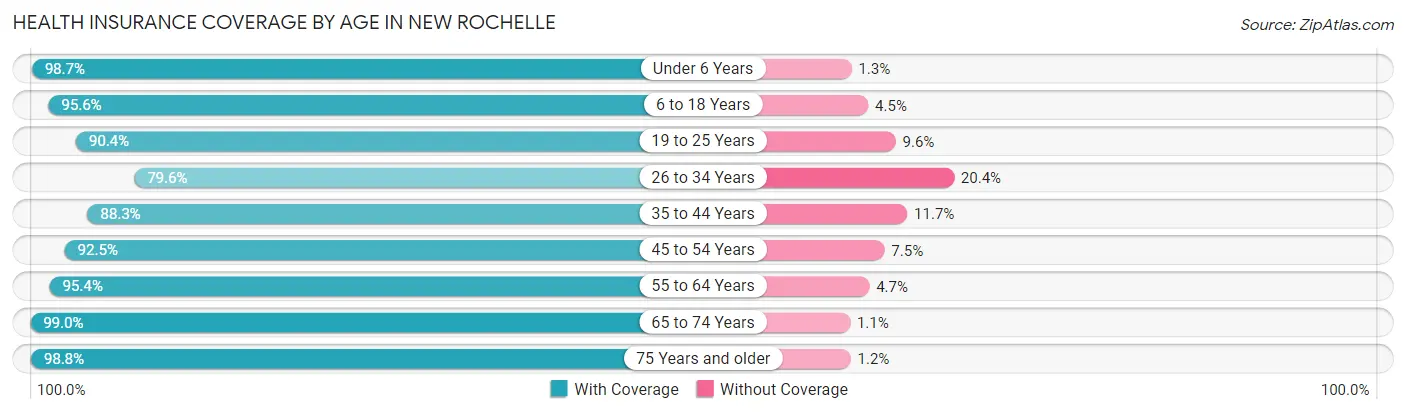
| Age Bracket | With Coverage | Without Coverage |
| Under 6 Years | 4,685 (98.7%) | 63 (1.3%) |
| 6 to 18 Years | 12,586 (95.6%) | 586 (4.4%) |
| 19 to 25 Years | 8,023 (90.4%) | 849 (9.6%) |
| 26 to 34 Years | 6,756 (79.6%) | 1,736 (20.4%) |
| 35 to 44 Years | 8,827 (88.3%) | 1,172 (11.7%) |
| 45 to 54 Years | 9,333 (92.5%) | 755 (7.5%) |
| 55 to 64 Years | 10,366 (95.4%) | 505 (4.6%) |
| 65 to 74 Years | 7,627 (99.0%) | 81 (1.1%) |
| 75 Years and older | 5,839 (98.8%) | 69 (1.2%) |
| Total | 74,042 (92.7%) | 5,816 (7.3%) |
Health Insurance Coverage by Citizenship Status in New Rochelle
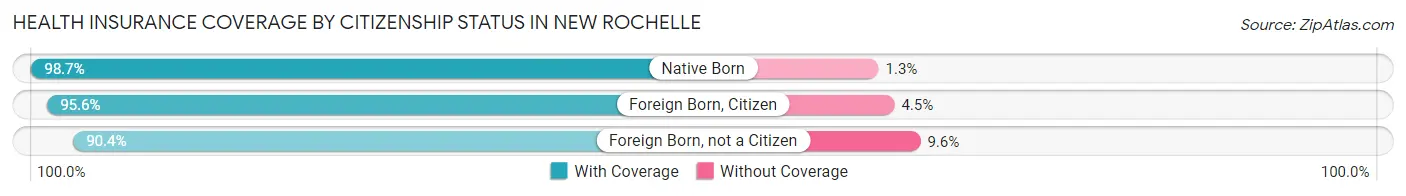
| Citizenship Status | With Coverage | Without Coverage |
| Native Born | 4,685 (98.7%) | 63 (1.3%) |
| Foreign Born, Citizen | 12,586 (95.6%) | 586 (4.4%) |
| Foreign Born, not a Citizen | 8,023 (90.4%) | 849 (9.6%) |
Health Insurance Coverage by Household Income in New Rochelle
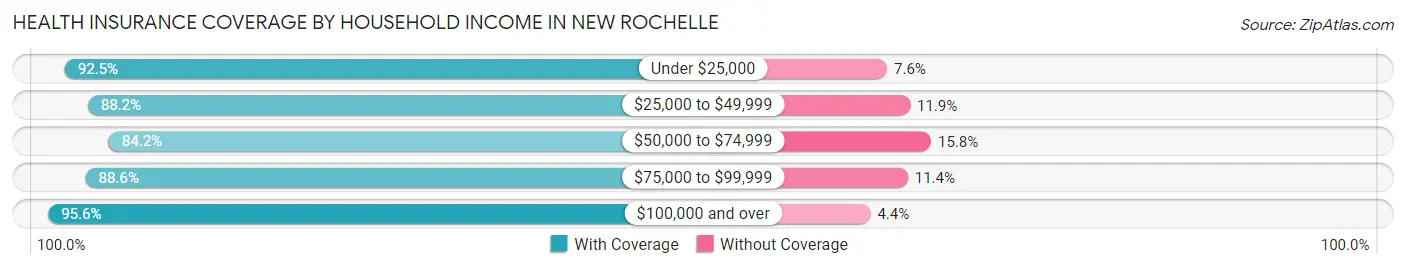
| Household Income | With Coverage | Without Coverage |
| Under $25,000 | 6,917 (92.4%) | 565 (7.5%) |
| $25,000 to $49,999 | 7,238 (88.1%) | 973 (11.8%) |
| $50,000 to $74,999 | 6,657 (84.2%) | 1,249 (15.8%) |
| $75,000 to $99,999 | 5,904 (88.6%) | 762 (11.4%) |
| $100,000 and over | 45,219 (95.6%) | 2,096 (4.4%) |
Public vs Private Health Insurance Coverage by Age in New Rochelle
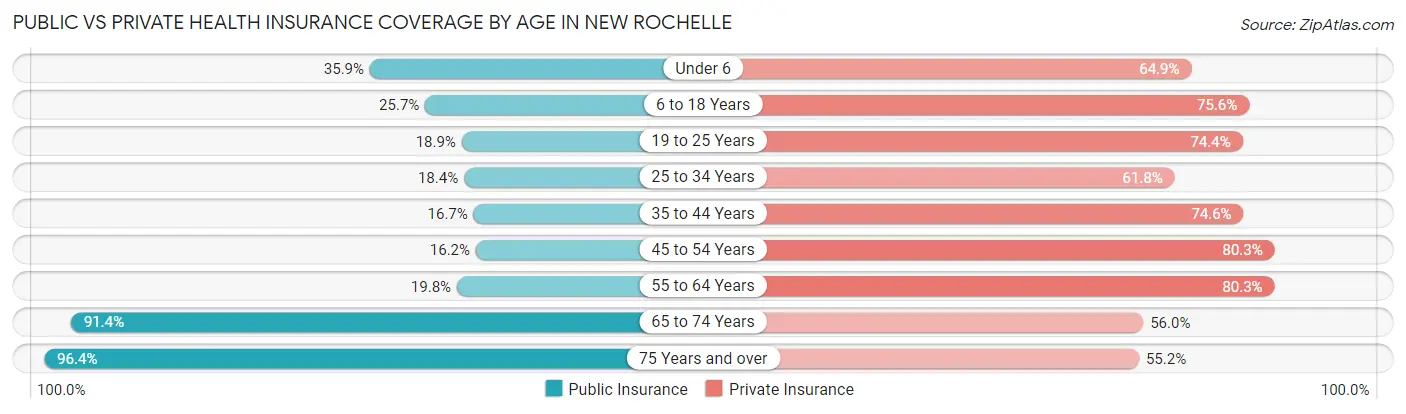
| Age Bracket | Public Insurance | Private Insurance |
| Under 6 | 1,705 (35.9%) | 3,080 (64.9%) |
| 6 to 18 Years | 3,379 (25.7%) | 9,955 (75.6%) |
| 19 to 25 Years | 1,674 (18.9%) | 6,598 (74.4%) |
| 25 to 34 Years | 1,566 (18.4%) | 5,246 (61.8%) |
| 35 to 44 Years | 1,666 (16.7%) | 7,454 (74.6%) |
| 45 to 54 Years | 1,638 (16.2%) | 8,103 (80.3%) |
| 55 to 64 Years | 2,148 (19.8%) | 8,729 (80.3%) |
| 65 to 74 Years | 7,047 (91.4%) | 4,313 (55.9%) |
| 75 Years and over | 5,694 (96.4%) | 3,259 (55.2%) |
| Total | 26,517 (33.2%) | 56,737 (71.1%) |
Disability Status by Sex by Age in New Rochelle
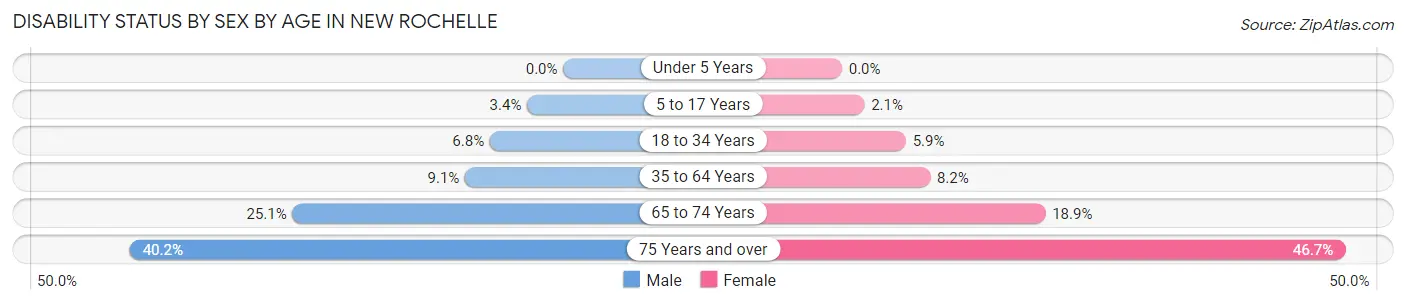
| Age Bracket | Male | Female |
| Under 5 Years | 0 (0.0%) | 0 (0.0%) |
| 5 to 17 Years | 214 (3.4%) | 134 (2.1%) |
| 18 to 34 Years | 629 (6.8%) | 555 (5.9%) |
| 35 to 64 Years | 1,405 (9.1%) | 1,270 (8.2%) |
| 65 to 74 Years | 920 (25.1%) | 764 (18.9%) |
| 75 Years and over | 886 (40.2%) | 1,731 (46.7%) |
Disability Class by Sex by Age in New Rochelle
Disability Class: Hearing Difficulty
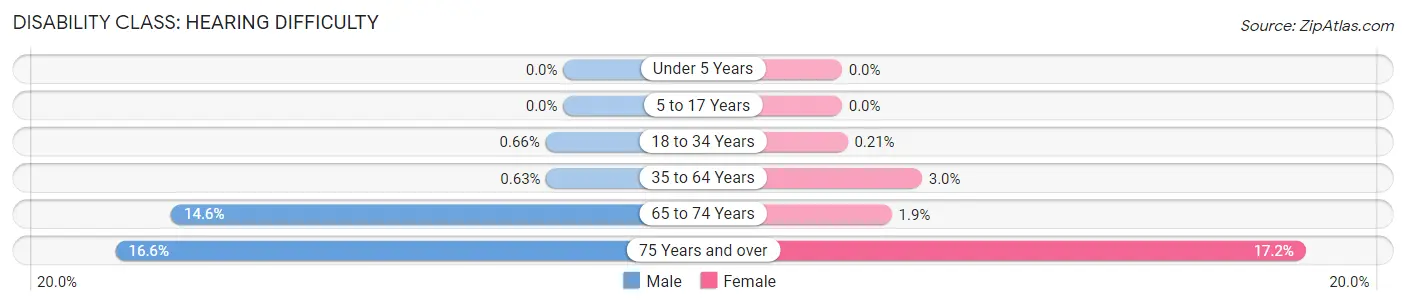
| Age Bracket | Male | Female |
| Under 5 Years | 0 (0.0%) | 0 (0.0%) |
| 5 to 17 Years | 0 (0.0%) | 0 (0.0%) |
| 18 to 34 Years | 61 (0.7%) | 20 (0.2%) |
| 35 to 64 Years | 97 (0.6%) | 462 (3.0%) |
| 65 to 74 Years | 533 (14.6%) | 75 (1.8%) |
| 75 Years and over | 366 (16.6%) | 638 (17.2%) |
Disability Class: Vision Difficulty
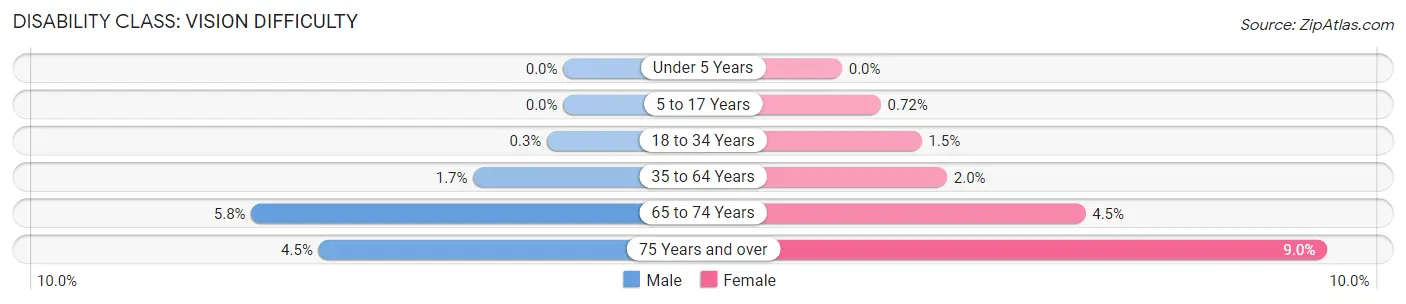
| Age Bracket | Male | Female |
| Under 5 Years | 0 (0.0%) | 0 (0.0%) |
| 5 to 17 Years | 0 (0.0%) | 46 (0.7%) |
| 18 to 34 Years | 28 (0.3%) | 139 (1.5%) |
| 35 to 64 Years | 257 (1.7%) | 303 (1.9%) |
| 65 to 74 Years | 212 (5.8%) | 183 (4.5%) |
| 75 Years and over | 100 (4.5%) | 334 (9.0%) |
Disability Class: Cognitive Difficulty
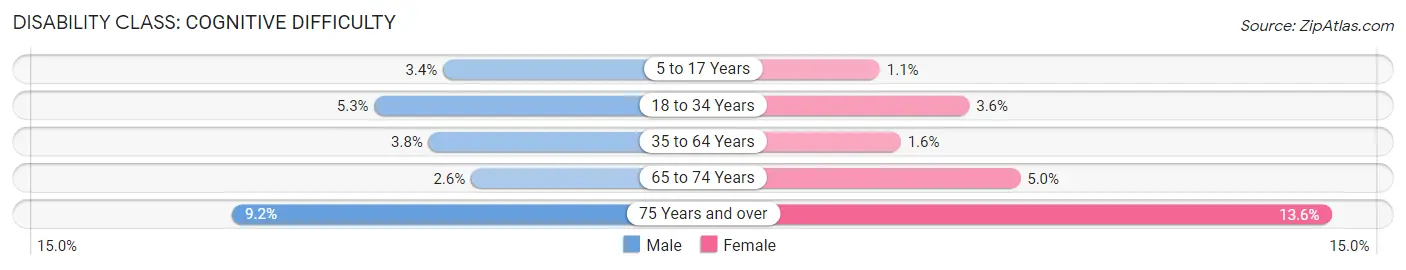
| Age Bracket | Male | Female |
| 5 to 17 Years | 214 (3.4%) | 68 (1.1%) |
| 18 to 34 Years | 486 (5.3%) | 332 (3.5%) |
| 35 to 64 Years | 579 (3.7%) | 255 (1.6%) |
| 65 to 74 Years | 94 (2.6%) | 201 (5.0%) |
| 75 Years and over | 203 (9.2%) | 505 (13.6%) |
Disability Class: Ambulatory Difficulty
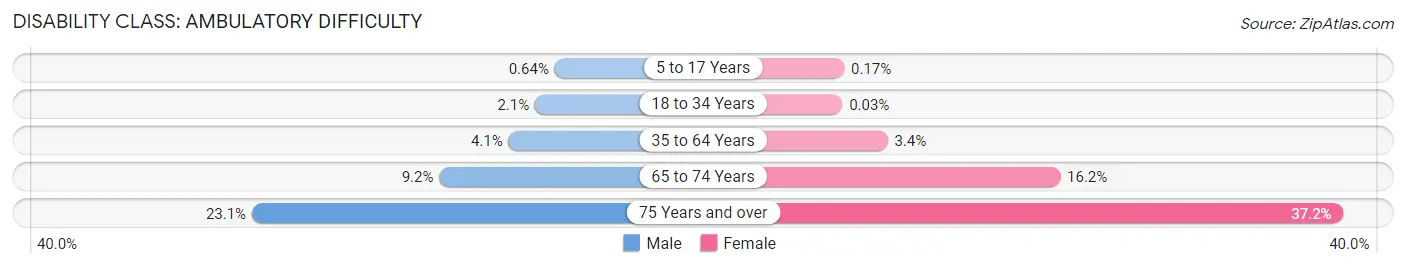
| Age Bracket | Male | Female |
| 5 to 17 Years | 41 (0.6%) | 11 (0.2%) |
| 18 to 34 Years | 194 (2.1%) | 3 (0.0%) |
| 35 to 64 Years | 628 (4.1%) | 527 (3.4%) |
| 65 to 74 Years | 337 (9.2%) | 656 (16.2%) |
| 75 Years and over | 509 (23.1%) | 1,380 (37.2%) |
Disability Class: Self-Care Difficulty
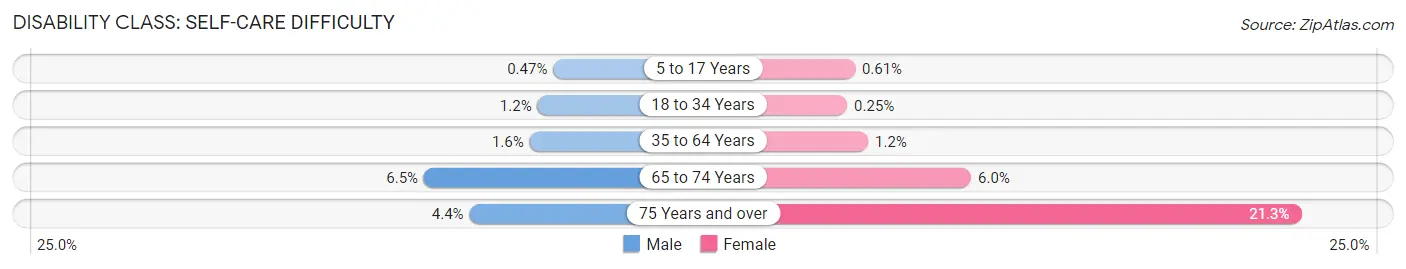
| Age Bracket | Male | Female |
| 5 to 17 Years | 30 (0.5%) | 39 (0.6%) |
| 18 to 34 Years | 111 (1.2%) | 23 (0.3%) |
| 35 to 64 Years | 242 (1.6%) | 190 (1.2%) |
| 65 to 74 Years | 237 (6.5%) | 243 (6.0%) |
| 75 Years and over | 96 (4.4%) | 790 (21.3%) |
Technology Access in New Rochelle
Computing Device Access in New Rochelle
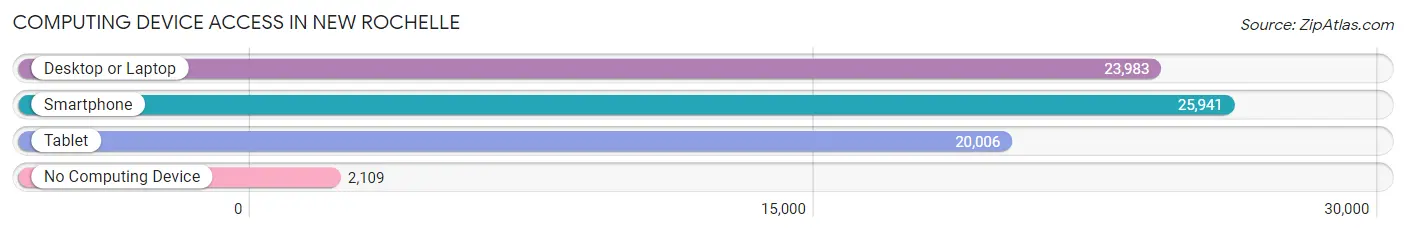
| Device Type | # Households | % Households |
| Desktop or Laptop | 23,983 | 80.2% |
| Smartphone | 25,941 | 86.7% |
| Tablet | 20,006 | 66.9% |
| No Computing Device | 2,109 | 7.0% |
| Total | 29,905 | 100.0% |
Internet Access in New Rochelle
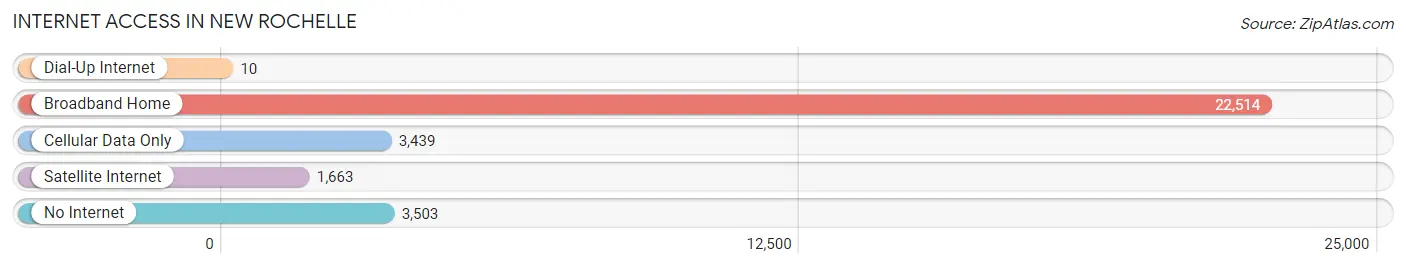
| Internet Type | # Households | % Households |
| Dial-Up Internet | 10 | 0.0% |
| Broadband Home | 22,514 | 75.3% |
| Cellular Data Only | 3,439 | 11.5% |
| Satellite Internet | 1,663 | 5.6% |
| No Internet | 3,503 | 11.7% |
| Total | 29,905 | 100.0% |
New Rochelle Summary
New Rochelle is a city located in Westchester County, New York, United States. It is situated on the Long Island Sound, just north of New York City. The city has a population of approximately 79,000 people, making it the seventh-largest city in the state. New Rochelle has a rich history, diverse geography, vibrant economy, and diverse demographics.
History
New Rochelle was first settled by the Siwanoy Native American tribe in the early 1600s. The area was then purchased by Thomas Pell in 1654, who named it after his hometown of La Rochelle, France. The city was officially incorporated in 1798. During the Revolutionary War, New Rochelle was a major port for the Continental Army.
In the 19th century, New Rochelle became a popular summer resort for wealthy New Yorkers. The city was also home to several prominent figures, including Alexander Hamilton, who lived in the city from 1797 to 1804.
In the 20th century, New Rochelle experienced a period of rapid growth and development. The city was home to several large factories, including the New Rochelle Knitting Mills, which produced uniforms for the U.S. military during World War II.
Geography
New Rochelle is located in southeastern Westchester County, approximately 25 miles north of New York City. The city is situated on the Long Island Sound, with a total area of 19.4 square miles. The city is bordered by the cities of Mount Vernon to the north, Pelham to the east, and Larchmont to the south.
The city is divided into several distinct neighborhoods, including the downtown area, the North End, and the East End. The downtown area is home to a variety of shops, restaurants, and other businesses. The North End is a residential area, while the East End is home to several parks and recreational areas.
Economy
New Rochelle has a vibrant economy, with a variety of businesses and industries. The city is home to several large corporations, including the New Rochelle Knitting Mills, which produces uniforms for the U.S. military. Other major employers include Montefiore Medical Center, the New Rochelle Public Library, and the New Rochelle School District.
The city is also home to a variety of small businesses, including restaurants, retail stores, and professional services. The city is also home to several colleges and universities, including Iona College, Monroe College, and the College of New Rochelle.
Demographics
As of the 2010 census, New Rochelle had a population of 79,000 people. The city is racially diverse, with a population that is approximately 55% White, 25% African American, 10% Hispanic, and 10% Asian. The median household income is approximately $60,000, and the median home value is approximately $400,000.
New Rochelle is also home to a variety of religious institutions, including several churches, synagogues, and mosques. The city is also home to a variety of cultural institutions, including the New Rochelle Public Library, the New Rochelle Opera House, and the New Rochelle Museum of Arts.
Conclusion
New Rochelle is a vibrant city located in Westchester County, New York. The city has a rich history, diverse geography, vibrant economy, and diverse demographics. New Rochelle is home to several large corporations, small businesses, and cultural institutions. The city is also home to a variety of religious institutions and is racially diverse. New Rochelle is an ideal place to live, work, and play.
Common Questions
What is Per Capita Income in New Rochelle?
Per Capita income in New Rochelle is $62,145.
What is the Median Family Income in New Rochelle?
Median Family Income in New Rochelle is $130,667.
What is the Median Household income in New Rochelle?
Median Household Income in New Rochelle is $100,542.
What is Income or Wage Gap in New Rochelle?
Income or Wage Gap in New Rochelle is 21.9%.
Women in New Rochelle earn 78.1 cents for every dollar earned by a man.
What is Family Income Deficit in New Rochelle?
Family Income Deficit in New Rochelle is $10,986.
Families that are below poverty line in New Rochelle earn $10,986 less on average than the poverty threshold level.
What is Inequality or Gini Index in New Rochelle?
Inequality or Gini Index in New Rochelle is 0.54.
What is the Total Population of New Rochelle?
Total Population of New Rochelle is 80,828.
What is the Total Male Population of New Rochelle?
Total Male Population of New Rochelle is 39,247.
What is the Total Female Population of New Rochelle?
Total Female Population of New Rochelle is 41,581.
What is the Ratio of Males per 100 Females in New Rochelle?
There are 94.39 Males per 100 Females in New Rochelle.
What is the Ratio of Females per 100 Males in New Rochelle?
There are 105.95 Females per 100 Males in New Rochelle.
What is the Median Population Age in New Rochelle?
Median Population Age in New Rochelle is 40.8 Years.
What is the Average Family Size in New Rochelle
Average Family Size in New Rochelle is 3.3 People.
What is the Average Household Size in New Rochelle
Average Household Size in New Rochelle is 2.6 People.
How Large is the Labor Force in New Rochelle?
There are 43,431 People in the Labor Forcein in New Rochelle.
What is the Percentage of People in the Labor Force in New Rochelle?
65.4% of People are in the Labor Force in New Rochelle.
What is the Unemployment Rate in New Rochelle?
Unemployment Rate in New Rochelle is 7.0%.