Pleasant Hill, CA Map & Demographics
Pleasant Hill Map
Pleasant Hill Overview
$64,672
PER CAPITA INCOME
$165,701
AVG FAMILY INCOME
$137,685
AVG HOUSEHOLD INCOME
26.9%
WAGE / INCOME GAP [ % ]
73.1¢/ $1
WAGE / INCOME GAP [ $ ]
0.40
INEQUALITY / GINI INDEX
34,504
TOTAL POPULATION
17,001
MALE POPULATION
17,503
FEMALE POPULATION
97.13
MALES / 100 FEMALES
102.95
FEMALES / 100 MALES
42.0
MEDIAN AGE
3.0
AVG FAMILY SIZE
2.5
AVG HOUSEHOLD SIZE
19,394
LABOR FORCE [ PEOPLE ]
67.4%
PERCENT IN LABOR FORCE
3.7%
UNEMPLOYMENT RATE
Pleasant Hill Zip Codes
Pleasant Hill Area Codes
Income in Pleasant Hill
Income Overview in Pleasant Hill
Per Capita Income in Pleasant Hill is $64,672, while median incomes of families and households are $165,701 and $137,685 respectively.
| Characteristic | Number | Measure |
| Per Capita Income | 34,504 | $64,672 |
| Median Family Income | 9,053 | $165,701 |
| Mean Family Income | 9,053 | $180,032 |
| Median Household Income | 13,818 | $137,685 |
| Mean Household Income | 13,818 | $159,493 |
| Income Deficit | 9,053 | $0 |
| Wage / Income Gap (%) | 34,504 | 26.92% |
| Wage / Income Gap ($) | 34,504 | 73.08¢ per $1 |
| Gini / Inequality Index | 34,504 | 0.40 |
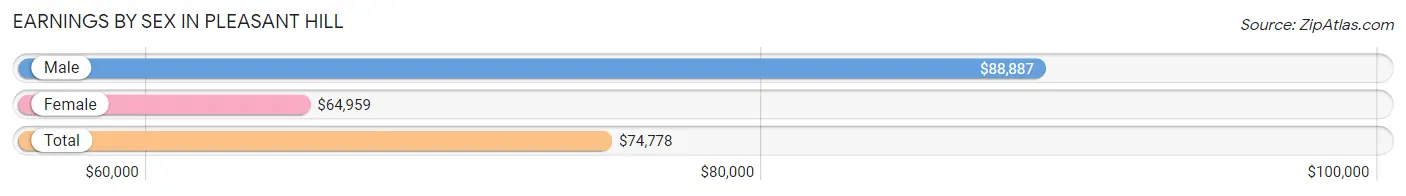
Earnings by Sex in Pleasant Hill
Average Earnings in Pleasant Hill are $74,778, $88,887 for men and $64,959 for women, a difference of 26.9%.
| Sex | Number | Average Earnings |
| Male | 10,630 (53.0%) | $88,887 |
| Female | 9,422 (47.0%) | $64,959 |
| Total | 20,052 (100.0%) | $74,778 |
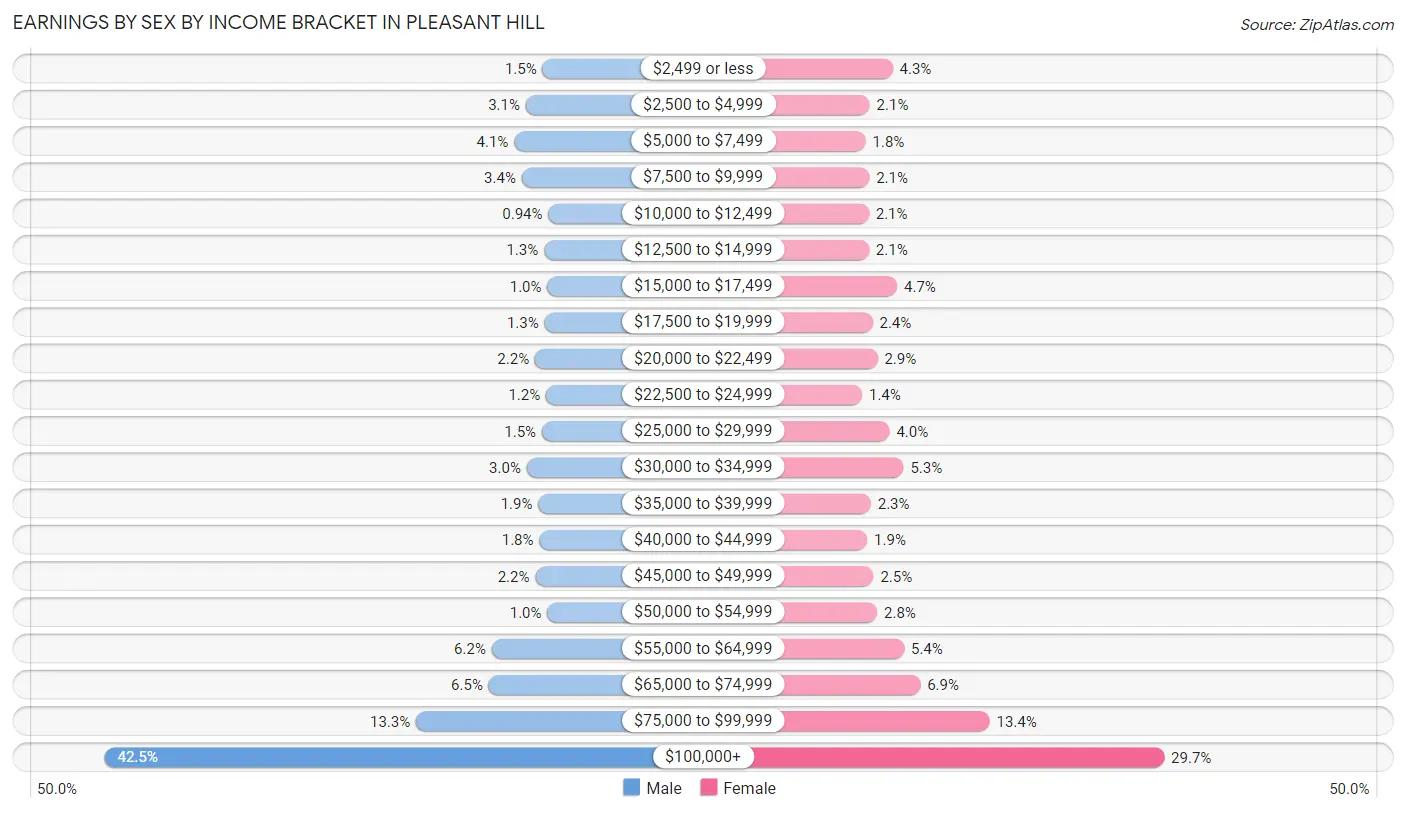
Earnings by Sex by Income Bracket in Pleasant Hill
The most common earnings brackets in Pleasant Hill are $100,000+ for men (4,519 | 42.5%) and $100,000+ for women (2,801 | 29.7%).
| Income | Male | Female |
| $2,499 or less | 157 (1.5%) | 404 (4.3%) |
| $2,500 to $4,999 | 324 (3.0%) | 202 (2.1%) |
| $5,000 to $7,499 | 440 (4.1%) | 166 (1.8%) |
| $7,500 to $9,999 | 365 (3.4%) | 198 (2.1%) |
| $10,000 to $12,499 | 100 (0.9%) | 194 (2.1%) |
| $12,500 to $14,999 | 142 (1.3%) | 195 (2.1%) |
| $15,000 to $17,499 | 110 (1.0%) | 444 (4.7%) |
| $17,500 to $19,999 | 137 (1.3%) | 227 (2.4%) |
| $20,000 to $22,499 | 233 (2.2%) | 270 (2.9%) |
| $22,500 to $24,999 | 122 (1.1%) | 135 (1.4%) |
| $25,000 to $29,999 | 164 (1.5%) | 377 (4.0%) |
| $30,000 to $34,999 | 315 (3.0%) | 500 (5.3%) |
| $35,000 to $39,999 | 200 (1.9%) | 212 (2.2%) |
| $40,000 to $44,999 | 189 (1.8%) | 180 (1.9%) |
| $45,000 to $49,999 | 230 (2.2%) | 236 (2.5%) |
| $50,000 to $54,999 | 110 (1.0%) | 268 (2.8%) |
| $55,000 to $64,999 | 663 (6.2%) | 505 (5.4%) |
| $65,000 to $74,999 | 693 (6.5%) | 648 (6.9%) |
| $75,000 to $99,999 | 1,417 (13.3%) | 1,260 (13.4%) |
| $100,000+ | 4,519 (42.5%) | 2,801 (29.7%) |
| Total | 10,630 (100.0%) | 9,422 (100.0%) |
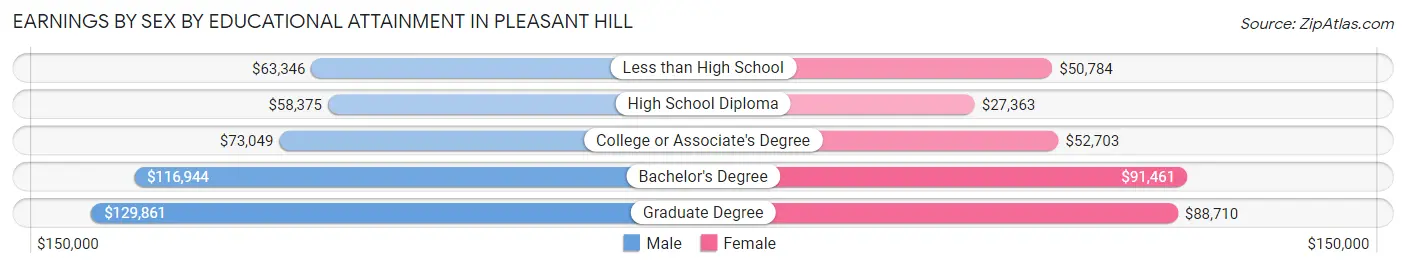
Earnings by Sex by Educational Attainment in Pleasant Hill
Average earnings in Pleasant Hill are $98,522 for men and $71,417 for women, a difference of 27.5%. Men with an educational attainment of graduate degree enjoy the highest average annual earnings of $129,861, while those with high school diploma education earn the least with $58,375. Women with an educational attainment of bachelor's degree earn the most with the average annual earnings of $91,461, while those with high school diploma education have the smallest earnings of $27,363.
| Educational Attainment | Male Income | Female Income |
| Less than High School | $63,346 | $50,784 |
| High School Diploma | $58,375 | $27,363 |
| College or Associate's Degree | $73,049 | $52,703 |
| Bachelor's Degree | $116,944 | $91,461 |
| Graduate Degree | $129,861 | $88,710 |
| Total | $98,522 | $71,417 |
Family Income in Pleasant Hill
Family Income Brackets in Pleasant Hill
According to the Pleasant Hill family income data, there are 3,377 families falling into the $200,000+ income range, which is the most common income bracket and makes up 37.3% of all families. Conversely, the $10,000 to $14,999 income bracket is the least frequent group with only 72 families (0.8%) belonging to this category.
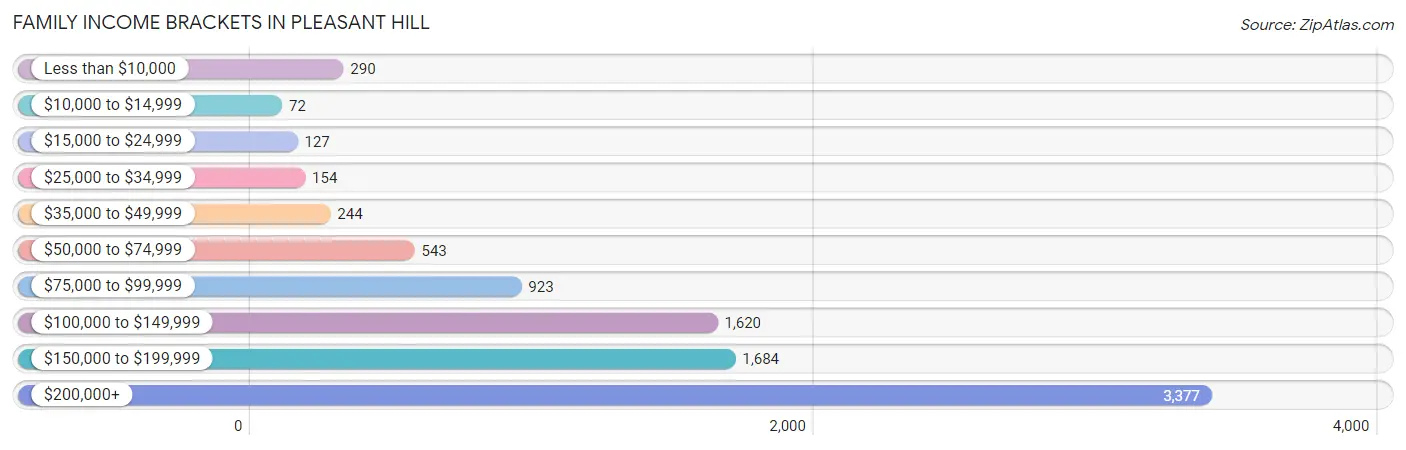
| Income Bracket | # Families | % Families |
| Less than $10,000 | 290 | 3.2% |
| $10,000 to $14,999 | 72 | 0.8% |
| $15,000 to $24,999 | 127 | 1.4% |
| $25,000 to $34,999 | 154 | 1.7% |
| $35,000 to $49,999 | 244 | 2.7% |
| $50,000 to $74,999 | 543 | 6.0% |
| $75,000 to $99,999 | 923 | 10.2% |
| $100,000 to $149,999 | 1,620 | 17.9% |
| $150,000 to $199,999 | 1,684 | 18.6% |
| $200,000+ | 3,377 | 37.3% |
Family Income by Famaliy Size in Pleasant Hill
6-person families (109 | 1.2%) account for the highest median family income in Pleasant Hill with $250,001 per family, while 2-person families (4,269 | 47.2%) have the highest median income of $61,200 per family member.
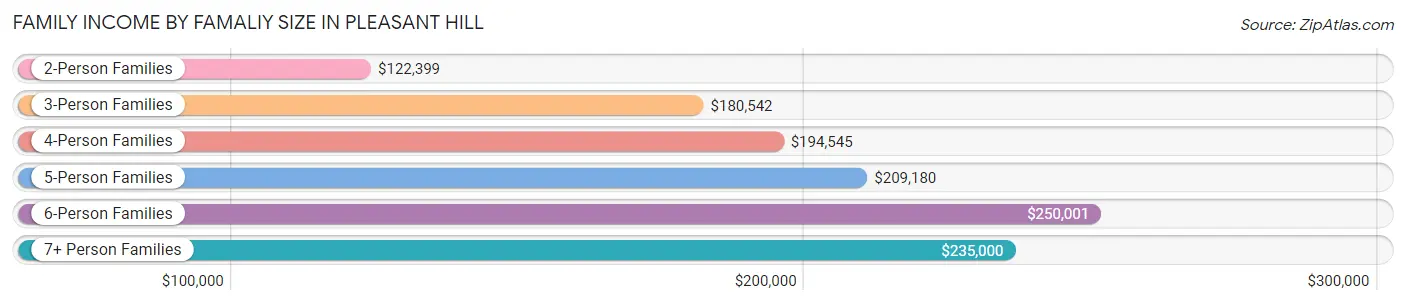
| Income Bracket | # Families | Median Income |
| 2-Person Families | 4,269 (47.2%) | $122,399 |
| 3-Person Families | 2,037 (22.5%) | $180,542 |
| 4-Person Families | 2,114 (23.4%) | $194,545 |
| 5-Person Families | 444 (4.9%) | $209,180 |
| 6-Person Families | 109 (1.2%) | $250,001 |
| 7+ Person Families | 80 (0.9%) | $235,000 |
| Total | 9,053 (100.0%) | $165,701 |
Family Income by Number of Earners in Pleasant Hill
The median family income in Pleasant Hill is $165,701, with families comprising 3+ earners (1,224) having the highest median family income of $219,048, while families with no earners (893) have the lowest median family income of $72,396, accounting for 13.5% and 9.9% of families, respectively.
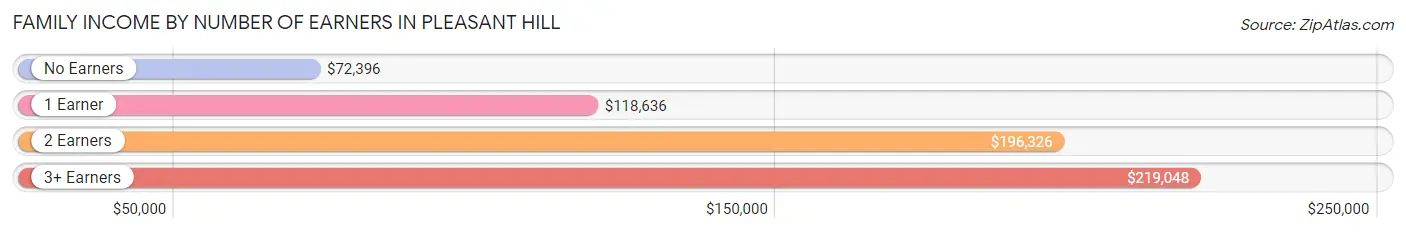
| Number of Earners | # Families | Median Income |
| No Earners | 893 (9.9%) | $72,396 |
| 1 Earner | 2,708 (29.9%) | $118,636 |
| 2 Earners | 4,228 (46.7%) | $196,326 |
| 3+ Earners | 1,224 (13.5%) | $219,048 |
| Total | 9,053 (100.0%) | $165,701 |
Household Income in Pleasant Hill
Household Income Brackets in Pleasant Hill
With 3,966 households falling in the category, the $200,000+ income range is the most frequent in Pleasant Hill, accounting for 28.7% of all households. In contrast, only 83 households (0.6%) fall into the $10,000 to $14,999 income bracket, making it the least populous group.
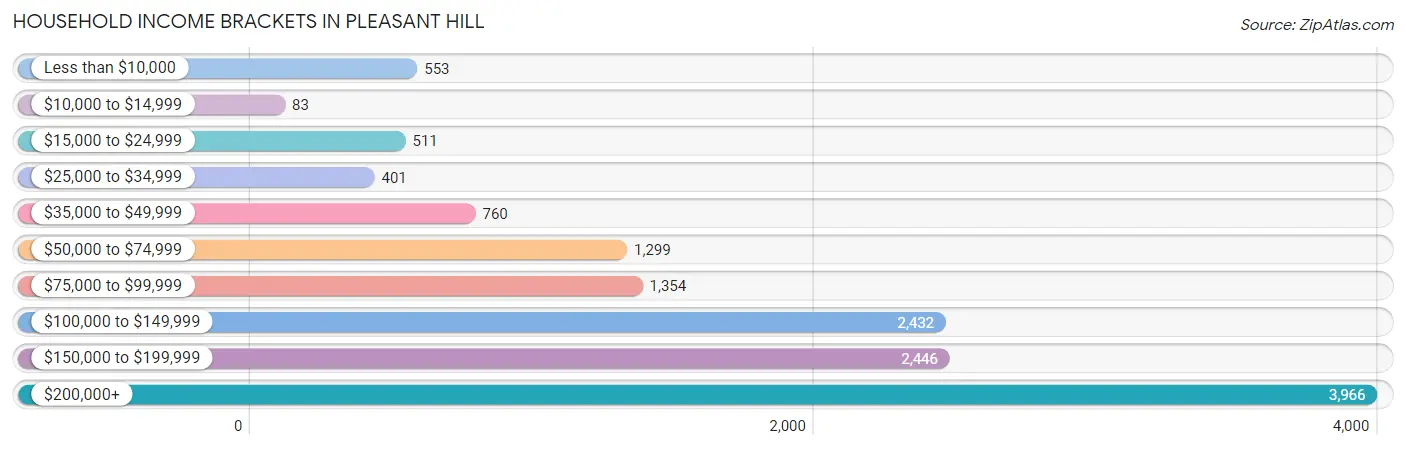
| Income Bracket | # Households | % Households |
| Less than $10,000 | 553 | 4.0% |
| $10,000 to $14,999 | 83 | 0.6% |
| $15,000 to $24,999 | 511 | 3.7% |
| $25,000 to $34,999 | 401 | 2.9% |
| $35,000 to $49,999 | 760 | 5.5% |
| $50,000 to $74,999 | 1,299 | 9.4% |
| $75,000 to $99,999 | 1,354 | 9.8% |
| $100,000 to $149,999 | 2,432 | 17.6% |
| $150,000 to $199,999 | 2,446 | 17.7% |
| $200,000+ | 3,966 | 28.7% |
Household Income by Householder Age in Pleasant Hill
The median household income in Pleasant Hill is $137,685, with the highest median household income of $173,246 found in the 45 to 64 years age bracket for the primary householder. A total of 5,674 households (41.1%) fall into this category. Meanwhile, the 15 to 24 years age bracket for the primary householder has the lowest median household income of $0, with 108 households (0.8%) in this group.
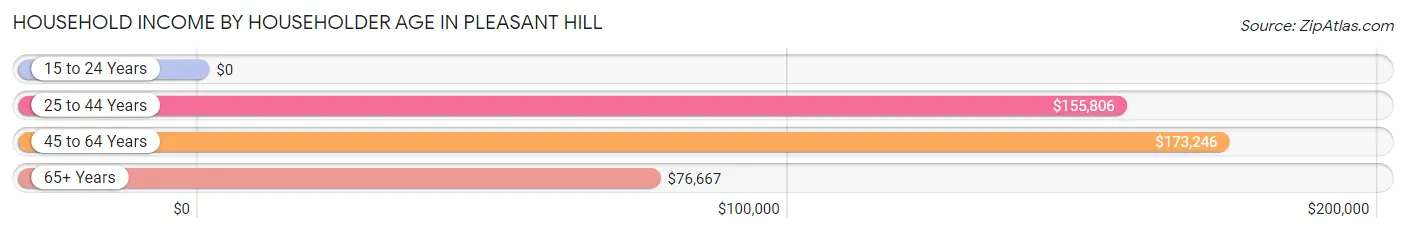
| Income Bracket | # Households | Median Income |
| 15 to 24 Years | 108 (0.8%) | $0 |
| 25 to 44 Years | 4,222 (30.5%) | $155,806 |
| 45 to 64 Years | 5,674 (41.1%) | $173,246 |
| 65+ Years | 3,814 (27.6%) | $76,667 |
| Total | 13,818 (100.0%) | $137,685 |
Poverty in Pleasant Hill
Income Below Poverty by Sex and Age in Pleasant Hill
With 6.2% poverty level for males and 6.6% for females among the residents of Pleasant Hill, 12 to 14 year old males and 16 and 17 year old females are the most vulnerable to poverty, with 156 males (25.1%) and 140 females (25.6%) in their respective age groups living below the poverty level.
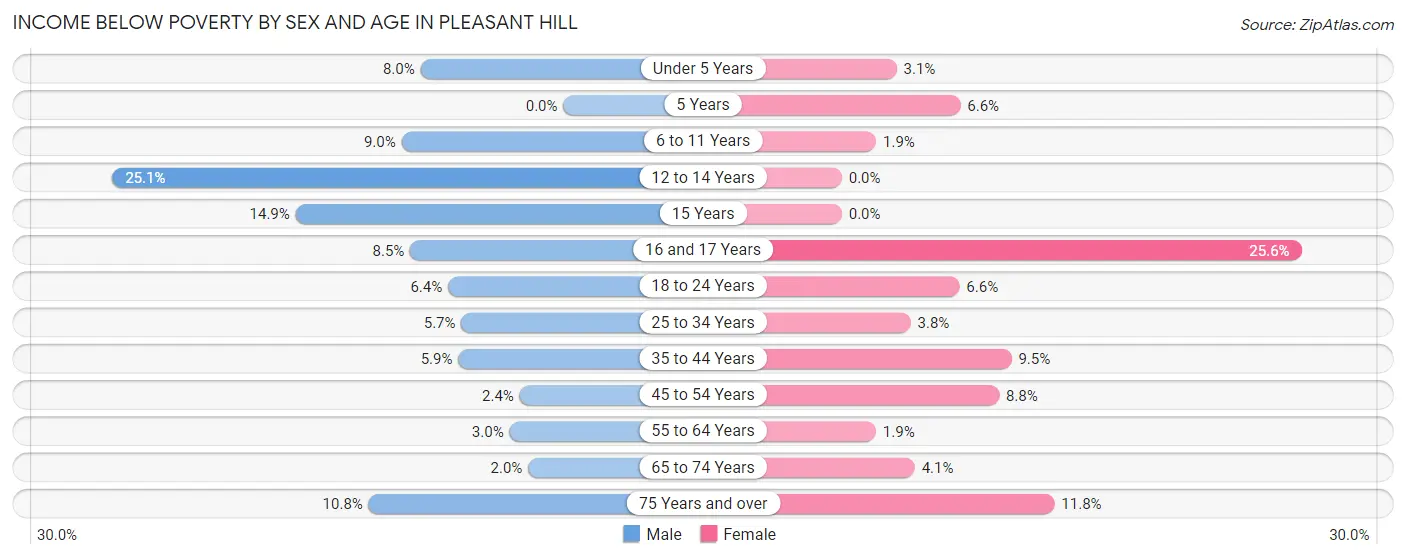
| Age Bracket | Male | Female |
| Under 5 Years | 68 (8.0%) | 26 (3.0%) |
| 5 Years | 0 (0.0%) | 13 (6.6%) |
| 6 to 11 Years | 105 (9.0%) | 16 (1.9%) |
| 12 to 14 Years | 156 (25.1%) | 0 (0.0%) |
| 15 Years | 41 (14.9%) | 0 (0.0%) |
| 16 and 17 Years | 46 (8.5%) | 140 (25.6%) |
| 18 to 24 Years | 98 (6.4%) | 91 (6.6%) |
| 25 to 34 Years | 109 (5.7%) | 75 (3.8%) |
| 35 to 44 Years | 158 (5.9%) | 246 (9.5%) |
| 45 to 54 Years | 56 (2.4%) | 239 (8.7%) |
| 55 to 64 Years | 67 (3.0%) | 42 (1.9%) |
| 65 to 74 Years | 30 (2.0%) | 79 (4.1%) |
| 75 Years and over | 107 (10.8%) | 167 (11.8%) |
| Total | 1,041 (6.2%) | 1,134 (6.6%) |
Income Above Poverty by Sex and Age in Pleasant Hill
According to the poverty statistics in Pleasant Hill, males aged 5 years and females aged 12 to 14 years are the age groups that are most secure financially, with 100.0% of males and 100.0% of females in these age groups living above the poverty line.
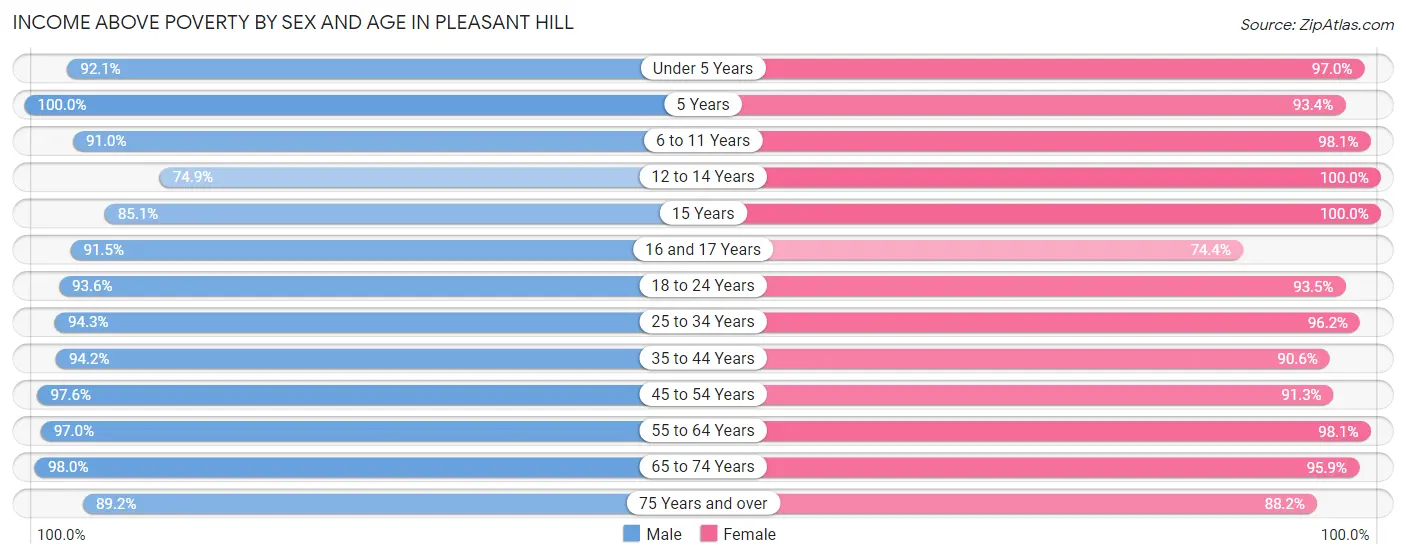
| Age Bracket | Male | Female |
| Under 5 Years | 787 (92.0%) | 827 (97.0%) |
| 5 Years | 160 (100.0%) | 184 (93.4%) |
| 6 to 11 Years | 1,061 (91.0%) | 822 (98.1%) |
| 12 to 14 Years | 465 (74.9%) | 506 (100.0%) |
| 15 Years | 234 (85.1%) | 113 (100.0%) |
| 16 and 17 Years | 493 (91.5%) | 407 (74.4%) |
| 18 to 24 Years | 1,428 (93.6%) | 1,298 (93.4%) |
| 25 to 34 Years | 1,811 (94.3%) | 1,881 (96.2%) |
| 35 to 44 Years | 2,544 (94.2%) | 2,358 (90.5%) |
| 45 to 54 Years | 2,253 (97.6%) | 2,492 (91.2%) |
| 55 to 64 Years | 2,167 (97.0%) | 2,169 (98.1%) |
| 65 to 74 Years | 1,497 (98.0%) | 1,868 (95.9%) |
| 75 Years and over | 880 (89.2%) | 1,243 (88.2%) |
| Total | 15,780 (93.8%) | 16,168 (93.4%) |
Income Below Poverty Among Married-Couple Families in Pleasant Hill
The poverty statistics for married-couple families in Pleasant Hill show that 2.3% or 154 of the total 6,775 families live below the poverty line. Families with 3 or 4 children have the highest poverty rate of 4.0%, comprising of 14 families. On the other hand, families with no children have the lowest poverty rate of 0.9%, which includes 34 families.
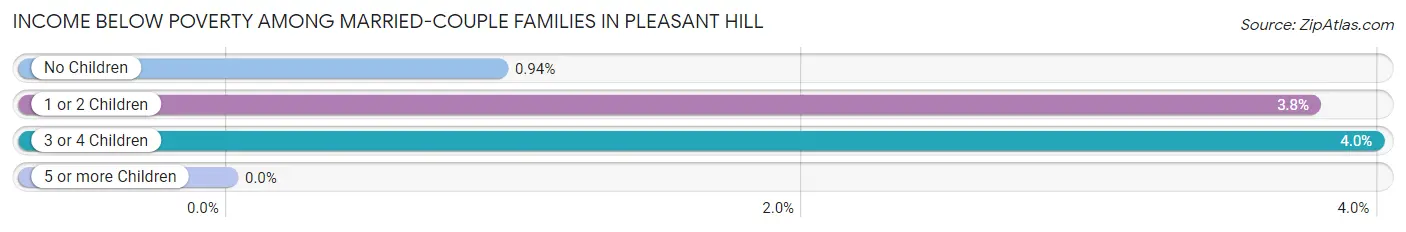
| Children | Above Poverty | Below Poverty |
| No Children | 3,582 (99.1%) | 34 (0.9%) |
| 1 or 2 Children | 2,702 (96.2%) | 106 (3.8%) |
| 3 or 4 Children | 337 (96.0%) | 14 (4.0%) |
| 5 or more Children | 0 (0.0%) | 0 (0.0%) |
| Total | 6,621 (97.7%) | 154 (2.3%) |
Income Below Poverty Among Single-Parent Households in Pleasant Hill
According to the poverty data in Pleasant Hill, 9.1% or 60 single-father households and 15.6% or 252 single-mother households are living below the poverty line. Among single-father households, those with 1 or 2 children have the highest poverty rate, with 49 households (15.8%) experiencing poverty. Likewise, among single-mother households, those with 3 or 4 children have the highest poverty rate, with 15 households (39.5%) falling below the poverty line.
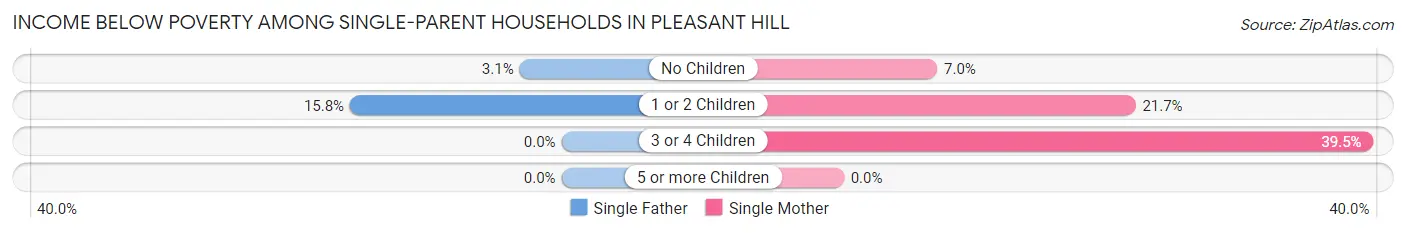
| Children | Single Father | Single Mother |
| No Children | 11 (3.1%) | 50 (7.0%) |
| 1 or 2 Children | 49 (15.8%) | 187 (21.7%) |
| 3 or 4 Children | 0 (0.0%) | 15 (39.5%) |
| 5 or more Children | 0 (0.0%) | 0 (0.0%) |
| Total | 60 (9.1%) | 252 (15.6%) |
Income Below Poverty Among Married-Couple vs Single-Parent Households in Pleasant Hill
The poverty data for Pleasant Hill shows that 154 of the married-couple family households (2.3%) and 312 of the single-parent households (13.7%) are living below the poverty level. Within the married-couple family households, those with 3 or 4 children have the highest poverty rate, with 14 households (4.0%) falling below the poverty line. Among the single-parent households, those with 3 or 4 children have the highest poverty rate, with 15 household (39.5%) living below poverty.
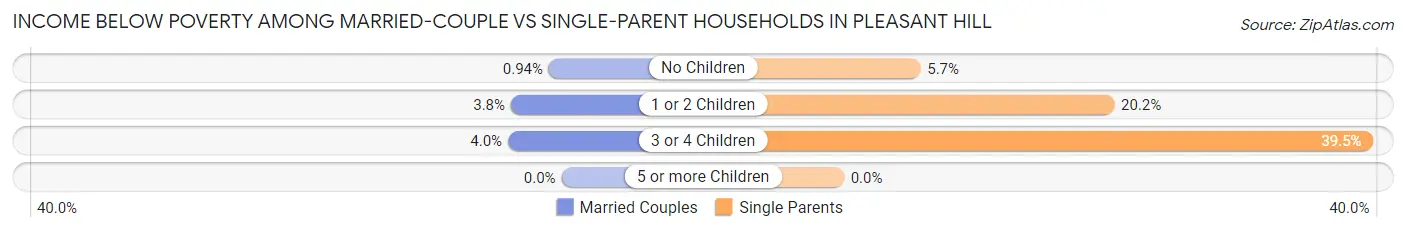
| Children | Married-Couple Families | Single-Parent Households |
| No Children | 34 (0.9%) | 61 (5.7%) |
| 1 or 2 Children | 106 (3.8%) | 236 (20.2%) |
| 3 or 4 Children | 14 (4.0%) | 15 (39.5%) |
| 5 or more Children | 0 (0.0%) | 0 (0.0%) |
| Total | 154 (2.3%) | 312 (13.7%) |
Race in Pleasant Hill
The most populous races in Pleasant Hill are White / Caucasian (21,948 | 63.6%), Asian (5,806 | 16.8%), and Hispanic or Latino (4,786 | 13.9%).

| Race | # Population | % Population |
| Asian | 5,806 | 16.8% |
| Black / African American | 1,505 | 4.4% |
| Hawaiian / Pacific | 239 | 0.7% |
| Hispanic or Latino | 4,786 | 13.9% |
| Native / Alaskan | 101 | 0.3% |
| White / Caucasian | 21,948 | 63.6% |
| Two or more Races | 3,876 | 11.2% |
| Some other Race | 1,029 | 3.0% |
| Total | 34,504 | 100.0% |
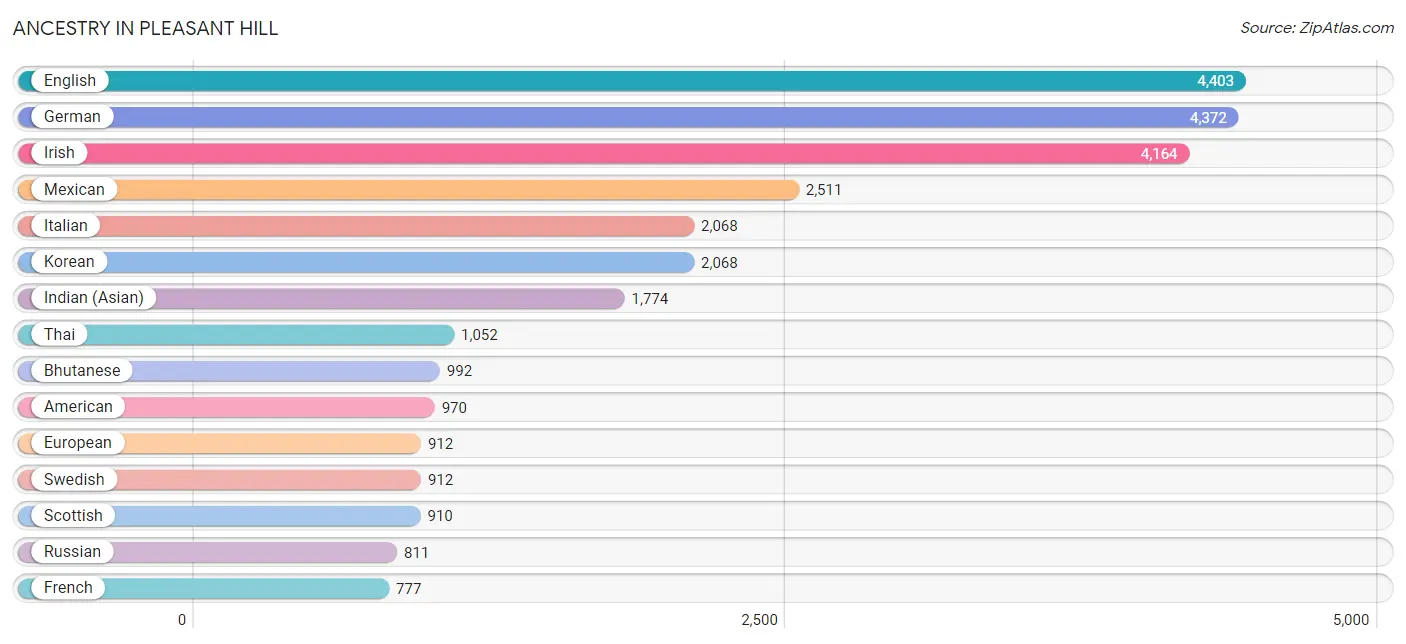
Ancestry in Pleasant Hill
The most populous ancestries reported in Pleasant Hill are English (4,403 | 12.8%), German (4,372 | 12.7%), Irish (4,164 | 12.1%), Mexican (2,511 | 7.3%), and Italian (2,068 | 6.0%), together accounting for 50.8% of all Pleasant Hill residents.
| Ancestry | # Population | % Population |
| Afghan | 280 | 0.8% |
| African | 549 | 1.6% |
| Alaska Native | 7 | 0.0% |
| Albanian | 66 | 0.2% |
| American | 970 | 2.8% |
| Apache | 49 | 0.1% |
| Arab | 380 | 1.1% |
| Argentinean | 10 | 0.0% |
| Armenian | 159 | 0.5% |
| Australian | 20 | 0.1% |
| Austrian | 74 | 0.2% |
| Bangladeshi | 70 | 0.2% |
| Basque | 6 | 0.0% |
| Belgian | 67 | 0.2% |
| Bhutanese | 992 | 2.9% |
| Brazilian | 94 | 0.3% |
| British | 326 | 0.9% |
| Bulgarian | 23 | 0.1% |
| Burmese | 175 | 0.5% |
| Cambodian | 224 | 0.6% |
| Canadian | 305 | 0.9% |
| Central American | 693 | 2.0% |
| Central American Indian | 110 | 0.3% |
| Cherokee | 137 | 0.4% |
| Chilean | 15 | 0.0% |
| Colombian | 104 | 0.3% |
| Costa Rican | 13 | 0.0% |
| Creek | 16 | 0.1% |
| Croatian | 25 | 0.1% |
| Cuban | 81 | 0.2% |
| Czech | 193 | 0.6% |
| Danish | 441 | 1.3% |
| Dutch | 238 | 0.7% |
| Eastern European | 87 | 0.3% |
| Ecuadorian | 54 | 0.2% |
| Egyptian | 19 | 0.1% |
| English | 4,403 | 12.8% |
| Estonian | 33 | 0.1% |
| Ethiopian | 3 | 0.0% |
| European | 912 | 2.6% |
| Filipino | 252 | 0.7% |
| Finnish | 25 | 0.1% |
| French | 777 | 2.2% |
| French Canadian | 253 | 0.7% |
| German | 4,372 | 12.7% |
| Greek | 225 | 0.6% |
| Guamanian / Chamorro | 1 | 0.0% |
| Guatemalan | 121 | 0.4% |
| Haitian | 45 | 0.1% |
| Hungarian | 173 | 0.5% |
| Icelander | 21 | 0.1% |
| Indian (Asian) | 1,774 | 5.1% |
| Iranian | 663 | 1.9% |
| Irish | 4,164 | 12.1% |
| Israeli | 31 | 0.1% |
| Italian | 2,068 | 6.0% |
| Japanese | 78 | 0.2% |
| Korean | 2,068 | 6.0% |
| Laotian | 110 | 0.3% |
| Latvian | 18 | 0.1% |
| Lebanese | 61 | 0.2% |
| Lithuanian | 96 | 0.3% |
| Macedonian | 19 | 0.1% |
| Maltese | 68 | 0.2% |
| Mexican | 2,511 | 7.3% |
| Mexican American Indian | 8 | 0.0% |
| Mongolian | 16 | 0.1% |
| Native Hawaiian | 85 | 0.3% |
| Nepalese | 13 | 0.0% |
| New Zealander | 11 | 0.0% |
| Nicaraguan | 165 | 0.5% |
| Northern European | 122 | 0.4% |
| Norwegian | 620 | 1.8% |
| Okinawan | 34 | 0.1% |
| Pakistani | 38 | 0.1% |
| Palestinian | 22 | 0.1% |
| Panamanian | 6 | 0.0% |
| Peruvian | 237 | 0.7% |
| Polish | 680 | 2.0% |
| Portuguese | 724 | 2.1% |
| Puerto Rican | 444 | 1.3% |
| Puget Sound Salish | 9 | 0.0% |
| Romanian | 134 | 0.4% |
| Russian | 811 | 2.4% |
| Salvadoran | 378 | 1.1% |
| Samoan | 208 | 0.6% |
| Scandinavian | 142 | 0.4% |
| Scotch-Irish | 387 | 1.1% |
| Scottish | 910 | 2.6% |
| Serbian | 159 | 0.5% |
| Slavic | 33 | 0.1% |
| Slovak | 24 | 0.1% |
| Slovene | 22 | 0.1% |
| South American | 601 | 1.7% |
| Spaniard | 208 | 0.6% |
| Spanish | 75 | 0.2% |
| Sri Lankan | 493 | 1.4% |
| Subsaharan African | 555 | 1.6% |
| Swedish | 912 | 2.6% |
| Swiss | 68 | 0.2% |
| Syrian | 40 | 0.1% |
| Thai | 1,052 | 3.0% |
| Tongan | 20 | 0.1% |
| Turkish | 23 | 0.1% |
| Ukrainian | 116 | 0.3% |
| Venezuelan | 55 | 0.2% |
| Welsh | 279 | 0.8% |
| West Indian | 62 | 0.2% |
| Yugoslavian | 63 | 0.2% | View All 109 Rows |
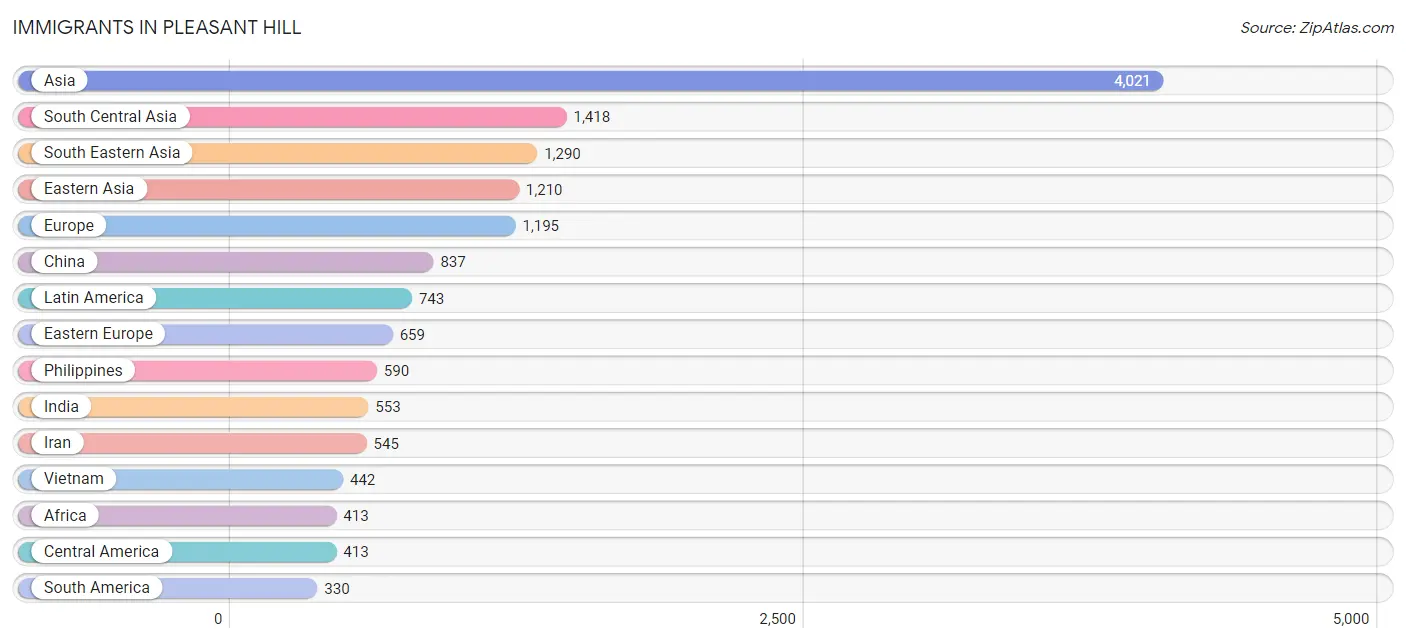
Immigrants in Pleasant Hill
The most numerous immigrant groups reported in Pleasant Hill came from Asia (4,021 | 11.7%), South Central Asia (1,418 | 4.1%), South Eastern Asia (1,290 | 3.7%), Eastern Asia (1,210 | 3.5%), and Europe (1,195 | 3.5%), together accounting for 26.5% of all Pleasant Hill residents.
| Immigration Origin | # Population | % Population |
| Afghanistan | 232 | 0.7% |
| Africa | 413 | 1.2% |
| Argentina | 10 | 0.0% |
| Asia | 4,021 | 11.7% |
| Australia | 19 | 0.1% |
| Belarus | 113 | 0.3% |
| Belgium | 54 | 0.2% |
| Bosnia and Herzegovina | 12 | 0.0% |
| Brazil | 115 | 0.3% |
| Bulgaria | 49 | 0.1% |
| Cambodia | 94 | 0.3% |
| Canada | 139 | 0.4% |
| Central America | 413 | 1.2% |
| Chile | 15 | 0.0% |
| China | 837 | 2.4% |
| Costa Rica | 13 | 0.0% |
| Czechoslovakia | 188 | 0.5% |
| Eastern Africa | 3 | 0.0% |
| Eastern Asia | 1,210 | 3.5% |
| Eastern Europe | 659 | 1.9% |
| Egypt | 19 | 0.1% |
| El Salvador | 175 | 0.5% |
| England | 23 | 0.1% |
| Ethiopia | 3 | 0.0% |
| Europe | 1,195 | 3.5% |
| Germany | 135 | 0.4% |
| Ghana | 69 | 0.2% |
| Greece | 40 | 0.1% |
| Guatemala | 36 | 0.1% |
| Hong Kong | 168 | 0.5% |
| Hungary | 3 | 0.0% |
| India | 553 | 1.6% |
| Indonesia | 70 | 0.2% |
| Iran | 545 | 1.6% |
| Ireland | 28 | 0.1% |
| Israel | 23 | 0.1% |
| Italy | 2 | 0.0% |
| Japan | 67 | 0.2% |
| Jordan | 44 | 0.1% |
| Kazakhstan | 65 | 0.2% |
| Korea | 62 | 0.2% |
| Latin America | 743 | 2.1% |
| Malaysia | 33 | 0.1% |
| Mexico | 169 | 0.5% |
| Micronesia | 1 | 0.0% |
| Middle Africa | 286 | 0.8% |
| Netherlands | 31 | 0.1% |
| Northern Africa | 19 | 0.1% |
| Northern Europe | 142 | 0.4% |
| Oceania | 130 | 0.4% |
| Panama | 20 | 0.1% |
| Peru | 135 | 0.4% |
| Philippines | 590 | 1.7% |
| Poland | 45 | 0.1% |
| Portugal | 17 | 0.1% |
| Romania | 35 | 0.1% |
| Russia | 92 | 0.3% |
| Serbia | 12 | 0.0% |
| Singapore | 61 | 0.2% |
| South America | 330 | 1.0% |
| South Central Asia | 1,418 | 4.1% |
| South Eastern Asia | 1,290 | 3.7% |
| Southern Europe | 122 | 0.4% |
| Spain | 41 | 0.1% |
| Switzerland | 11 | 0.0% |
| Taiwan | 243 | 0.7% |
| Turkey | 13 | 0.0% |
| Ukraine | 110 | 0.3% |
| Uzbekistan | 23 | 0.1% |
| Venezuela | 55 | 0.2% |
| Vietnam | 442 | 1.3% |
| Western Africa | 69 | 0.2% |
| Western Asia | 80 | 0.2% |
| Western Europe | 231 | 0.7% |
| Zaire | 29 | 0.1% | View All 75 Rows |
Sex and Age in Pleasant Hill
Sex and Age in Pleasant Hill
The most populous age groups in Pleasant Hill are 35 to 39 Years (1,429 | 8.4%) for men and 50 to 54 Years (1,415 | 8.1%) for women.
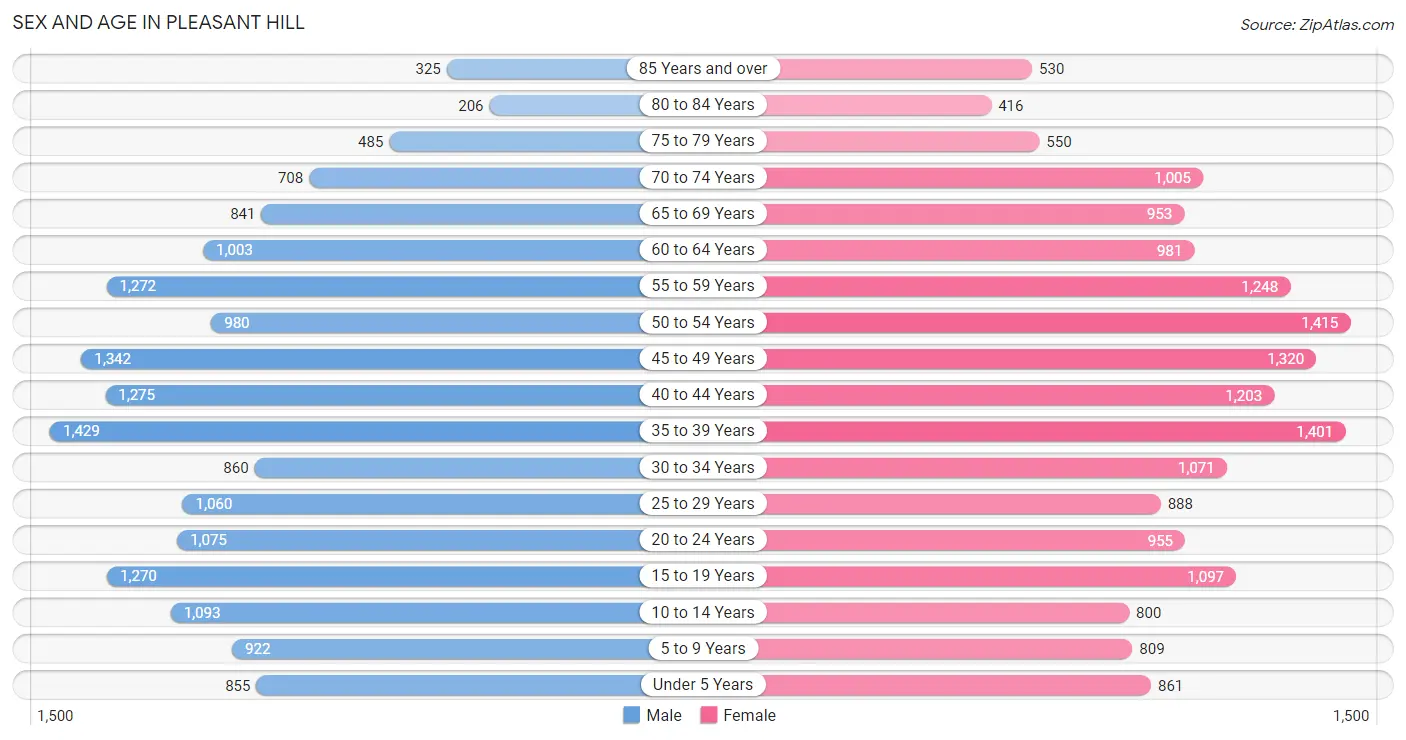
| Age Bracket | Male | Female |
| Under 5 Years | 855 (5.0%) | 861 (4.9%) |
| 5 to 9 Years | 922 (5.4%) | 809 (4.6%) |
| 10 to 14 Years | 1,093 (6.4%) | 800 (4.6%) |
| 15 to 19 Years | 1,270 (7.5%) | 1,097 (6.3%) |
| 20 to 24 Years | 1,075 (6.3%) | 955 (5.5%) |
| 25 to 29 Years | 1,060 (6.2%) | 888 (5.1%) |
| 30 to 34 Years | 860 (5.1%) | 1,071 (6.1%) |
| 35 to 39 Years | 1,429 (8.4%) | 1,401 (8.0%) |
| 40 to 44 Years | 1,275 (7.5%) | 1,203 (6.9%) |
| 45 to 49 Years | 1,342 (7.9%) | 1,320 (7.5%) |
| 50 to 54 Years | 980 (5.8%) | 1,415 (8.1%) |
| 55 to 59 Years | 1,272 (7.5%) | 1,248 (7.1%) |
| 60 to 64 Years | 1,003 (5.9%) | 981 (5.6%) |
| 65 to 69 Years | 841 (5.0%) | 953 (5.4%) |
| 70 to 74 Years | 708 (4.2%) | 1,005 (5.7%) |
| 75 to 79 Years | 485 (2.9%) | 550 (3.1%) |
| 80 to 84 Years | 206 (1.2%) | 416 (2.4%) |
| 85 Years and over | 325 (1.9%) | 530 (3.0%) |
| Total | 17,001 (100.0%) | 17,503 (100.0%) |
Families and Households in Pleasant Hill
Median Family Size in Pleasant Hill
The median family size in Pleasant Hill is 3.00 persons per family, with married-couple families (6,775 | 74.8%) accounting for the largest median family size of 3.07 persons per family. On the other hand, single male/father families (662 | 7.3%) represent the smallest median family size with 2.31 persons per family.
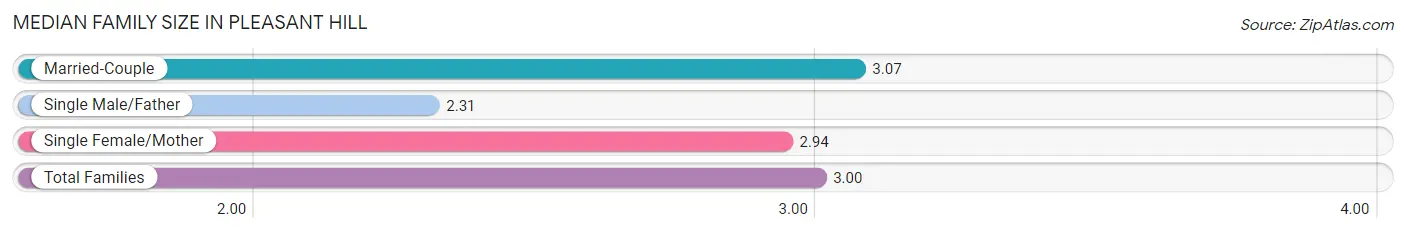
| Family Type | # Families | Family Size |
| Married-Couple | 6,775 (74.8%) | 3.07 |
| Single Male/Father | 662 (7.3%) | 2.31 |
| Single Female/Mother | 1,616 (17.8%) | 2.94 |
| Total Families | 9,053 (100.0%) | 3.00 |
Median Household Size in Pleasant Hill
The median household size in Pleasant Hill is 2.45 persons per household, with single female/mother households (1,616 | 11.7%) accounting for the largest median household size of 3.17 persons per household. non-family households (4,765 | 34.5%) represent the smallest median household size with 1.26 persons per household.
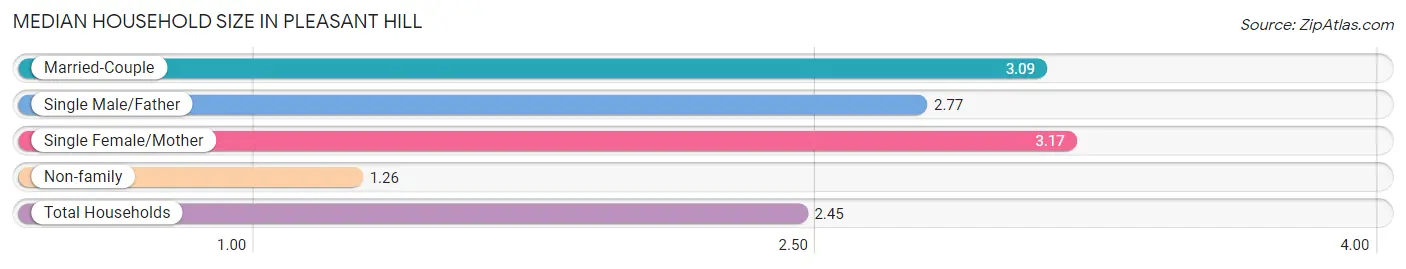
| Household Type | # Households | Household Size |
| Married-Couple | 6,775 (49.0%) | 3.09 |
| Single Male/Father | 662 (4.8%) | 2.77 |
| Single Female/Mother | 1,616 (11.7%) | 3.17 |
| Non-family | 4,765 (34.5%) | 1.26 |
| Total Households | 13,818 (100.0%) | 2.45 |
Household Size by Marriage Status in Pleasant Hill
Out of a total of 13,818 households in Pleasant Hill, 9,053 (65.5%) are family households, while 4,765 (34.5%) are nonfamily households. The most numerous type of family households are 2-person households, comprising 3,818, and the most common type of nonfamily households are 1-person households, comprising 3,827.
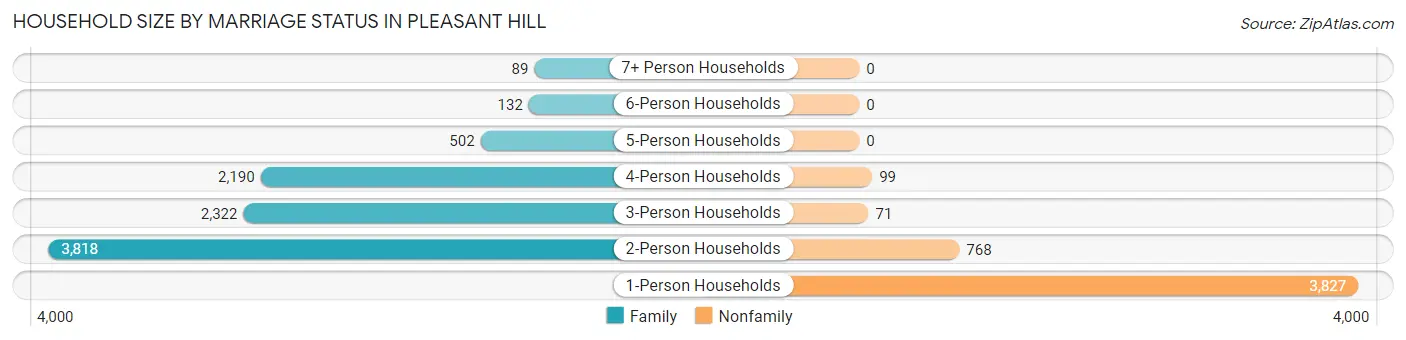
| Household Size | Family Households | Nonfamily Households |
| 1-Person Households | - | 3,827 (27.7%) |
| 2-Person Households | 3,818 (27.6%) | 768 (5.6%) |
| 3-Person Households | 2,322 (16.8%) | 71 (0.5%) |
| 4-Person Households | 2,190 (15.9%) | 99 (0.7%) |
| 5-Person Households | 502 (3.6%) | 0 (0.0%) |
| 6-Person Households | 132 (1.0%) | 0 (0.0%) |
| 7+ Person Households | 89 (0.6%) | 0 (0.0%) |
| Total | 9,053 (65.5%) | 4,765 (34.5%) |
Female Fertility in Pleasant Hill
Fertility by Age in Pleasant Hill
Average fertility rate in Pleasant Hill is 46.0 births per 1,000 women. Women in the age bracket of 20 to 34 years have the highest fertility rate with 66.0 births per 1,000 women. Women in the age bracket of 20 to 34 years acount for 51.5% of all women with births.
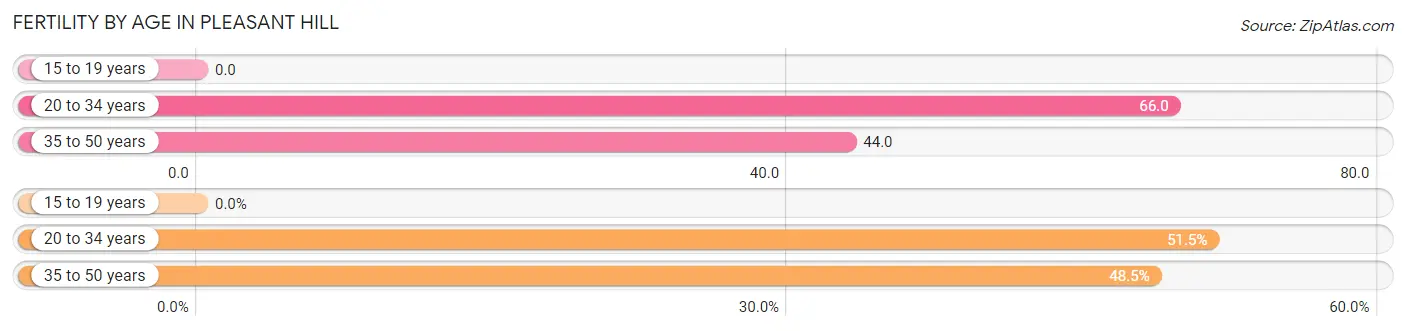
| Age Bracket | Women with Births | Births / 1,000 Women |
| 15 to 19 years | 0 (0.0%) | 0.0 |
| 20 to 34 years | 192 (51.5%) | 66.0 |
| 35 to 50 years | 181 (48.5%) | 44.0 |
| Total | 373 (100.0%) | 46.0 |
Fertility by Age by Marriage Status in Pleasant Hill
79.9% of women with births (373) in Pleasant Hill are married. The highest percentage of unmarried women with births falls into 20 to 34 years age bracket with 39.1% of them unmarried at the time of birth, while the lowest percentage of unmarried women with births belong to 35 to 50 years age bracket with 0.0% of them unmarried.
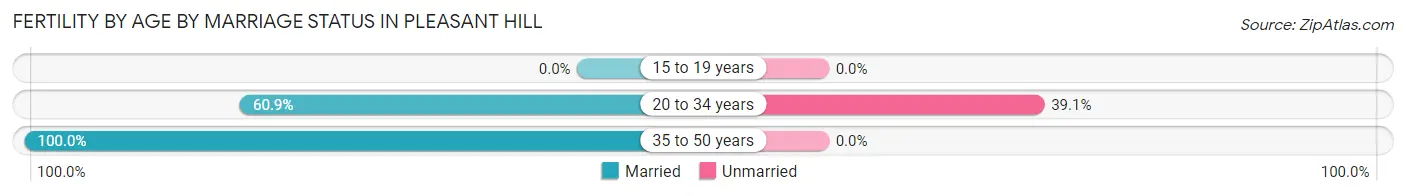
| Age Bracket | Married | Unmarried |
| 15 to 19 years | 0 (0.0%) | 0 (0.0%) |
| 20 to 34 years | 117 (60.9%) | 75 (39.1%) |
| 35 to 50 years | 181 (100.0%) | 0 (0.0%) |
| Total | 298 (79.9%) | 75 (20.1%) |
Fertility by Education in Pleasant Hill
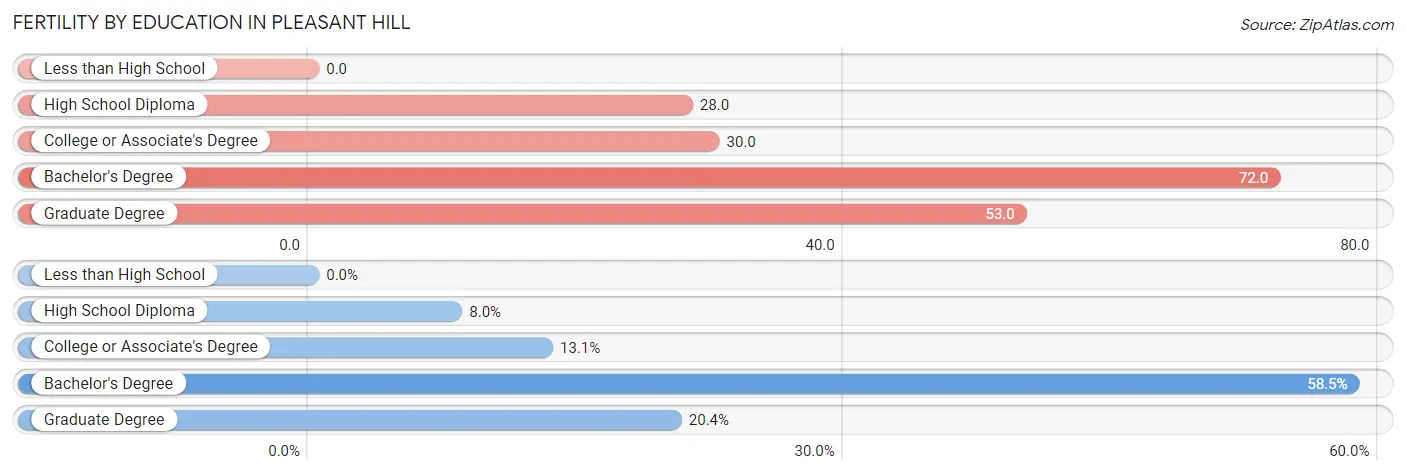
| Educational Attainment | Women with Births | Births / 1,000 Women |
| Less than High School | 0 (0.0%) | 0.0 |
| High School Diploma | 30 (8.0%) | 28.0 |
| College or Associate's Degree | 49 (13.1%) | 30.0 |
| Bachelor's Degree | 218 (58.5%) | 72.0 |
| Graduate Degree | 76 (20.4%) | 53.0 |
| Total | 373 (100.0%) | 46.0 |
Fertility by Education by Marriage Status in Pleasant Hill
20.1% of women with births in Pleasant Hill are unmarried. Women with the educational attainment of graduate degree are most likely to be married with 100.0% of them married at childbirth, while women with the educational attainment of high school diploma are least likely to be married with 46.7% of them unmarried at childbirth.
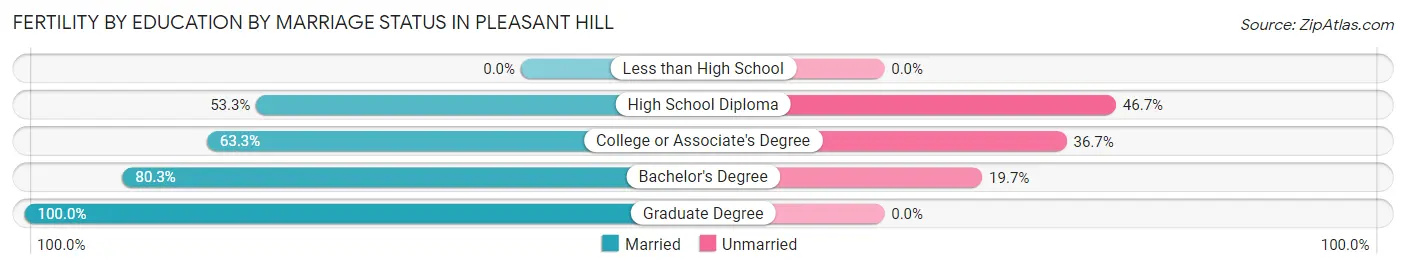
| Educational Attainment | Married | Unmarried |
| Less than High School | 0 (0.0%) | 0 (0.0%) |
| High School Diploma | 16 (53.3%) | 14 (46.7%) |
| College or Associate's Degree | 31 (63.3%) | 18 (36.7%) |
| Bachelor's Degree | 175 (80.3%) | 43 (19.7%) |
| Graduate Degree | 76 (100.0%) | 0 (0.0%) |
| Total | 298 (79.9%) | 75 (20.1%) |
Employment Characteristics in Pleasant Hill
Employment by Class of Employer in Pleasant Hill
Among the 18,297 employed individuals in Pleasant Hill, private company employees (12,104 | 66.1%), self-employed (not incorporated) (1,542 | 8.4%), and not-for-profit organizations (1,499 | 8.2%) make up the most common classes of employment.
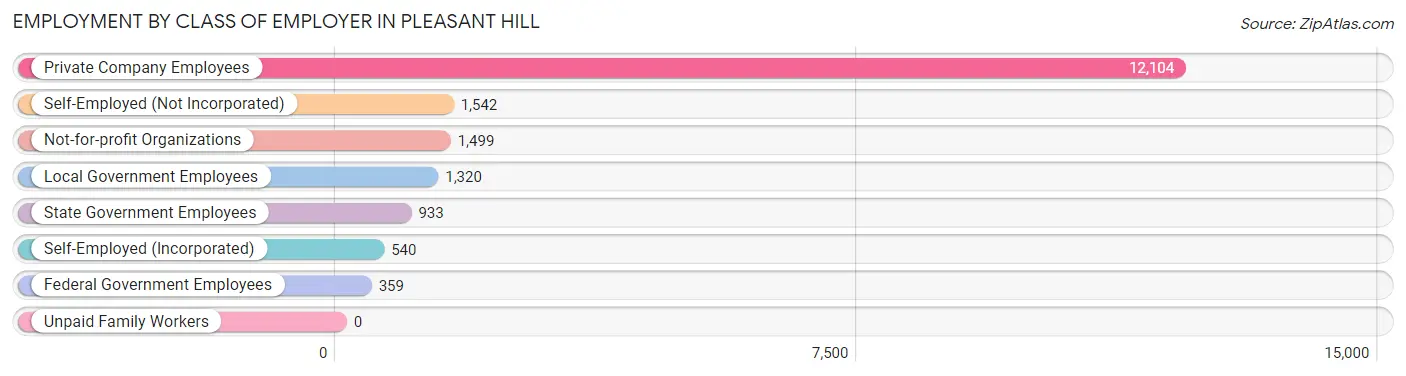
| Employer Class | # Employees | % Employees |
| Private Company Employees | 12,104 | 66.1% |
| Self-Employed (Incorporated) | 540 | 2.9% |
| Self-Employed (Not Incorporated) | 1,542 | 8.4% |
| Not-for-profit Organizations | 1,499 | 8.2% |
| Local Government Employees | 1,320 | 7.2% |
| State Government Employees | 933 | 5.1% |
| Federal Government Employees | 359 | 2.0% |
| Unpaid Family Workers | 0 | 0.0% |
| Total | 18,297 | 100.0% |
Employment Status by Age in Pleasant Hill
According to the labor force statistics for Pleasant Hill, out of the total population over 16 years of age (28,775), 67.4% or 19,394 individuals are in the labor force, with 3.7% or 718 of them unemployed. The age group with the highest labor force participation rate is 25 to 29 years, with 89.2% or 1,738 individuals in the labor force. Within the labor force, the 20 to 24 years age range has the highest percentage of unemployed individuals, with 5.6% or 88 of them being unemployed.
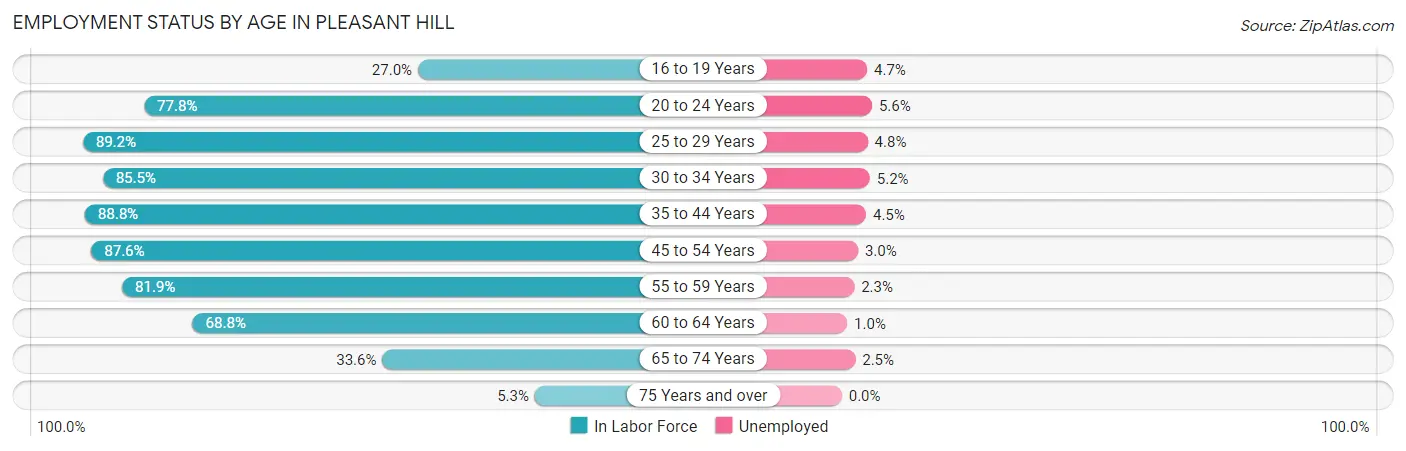
| Age Bracket | In Labor Force | Unemployed |
| 16 to 19 Years | 534 (27.0%) | 25 (4.7%) |
| 20 to 24 Years | 1,579 (77.8%) | 88 (5.6%) |
| 25 to 29 Years | 1,738 (89.2%) | 83 (4.8%) |
| 30 to 34 Years | 1,651 (85.5%) | 86 (5.2%) |
| 35 to 44 Years | 4,714 (88.8%) | 212 (4.5%) |
| 45 to 54 Years | 4,430 (87.6%) | 133 (3.0%) |
| 55 to 59 Years | 2,064 (81.9%) | 47 (2.3%) |
| 60 to 64 Years | 1,365 (68.8%) | 14 (1.0%) |
| 65 to 74 Years | 1,178 (33.6%) | 29 (2.5%) |
| 75 Years and over | 133 (5.3%) | 0 (0.0%) |
| Total | 19,394 (67.4%) | 718 (3.7%) |
Employment Status by Educational Attainment in Pleasant Hill
According to labor force statistics for Pleasant Hill, 85.1% of individuals (15,955) out of the total population between 25 and 64 years of age (18,748) are in the labor force, with 3.6% or 574 of them being unemployed. The group with the highest labor force participation rate are those with the educational attainment of bachelor's degree or higher, with 89.2% or 9,850 individuals in the labor force. Within the labor force, individuals with less than high school education have the highest percentage of unemployment, with 7.0% or 47 of them being unemployed.
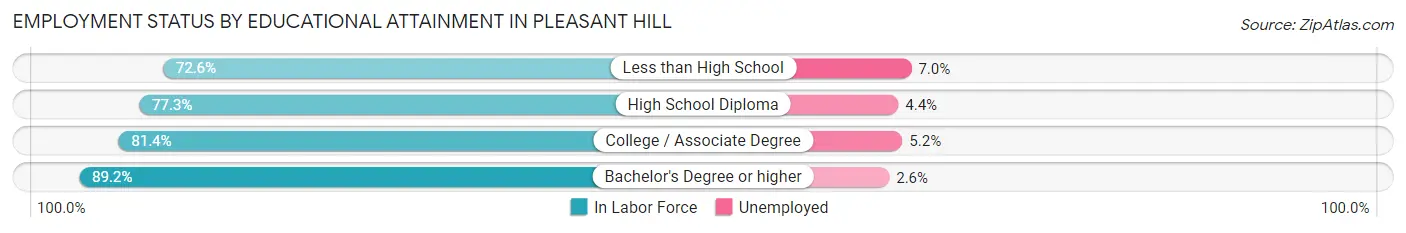
| Educational Attainment | In Labor Force | Unemployed |
| Less than High School | 670 (72.6%) | 65 (7.0%) |
| High School Diploma | 1,539 (77.3%) | 88 (4.4%) |
| College / Associate Degree | 3,900 (81.4%) | 249 (5.2%) |
| Bachelor's Degree or higher | 9,850 (89.2%) | 287 (2.6%) |
| Total | 15,955 (85.1%) | 675 (3.6%) |
Employment Occupations by Sex in Pleasant Hill
Management, Business, Science and Arts Occupations
The most common Management, Business, Science and Arts occupations in Pleasant Hill are Management (2,930 | 15.8%), Computers, Engineering & Science (2,270 | 12.2%), Community & Social Service (2,245 | 12.1%), Business & Financial (2,243 | 12.1%), and Education Instruction & Library (1,138 | 6.1%).
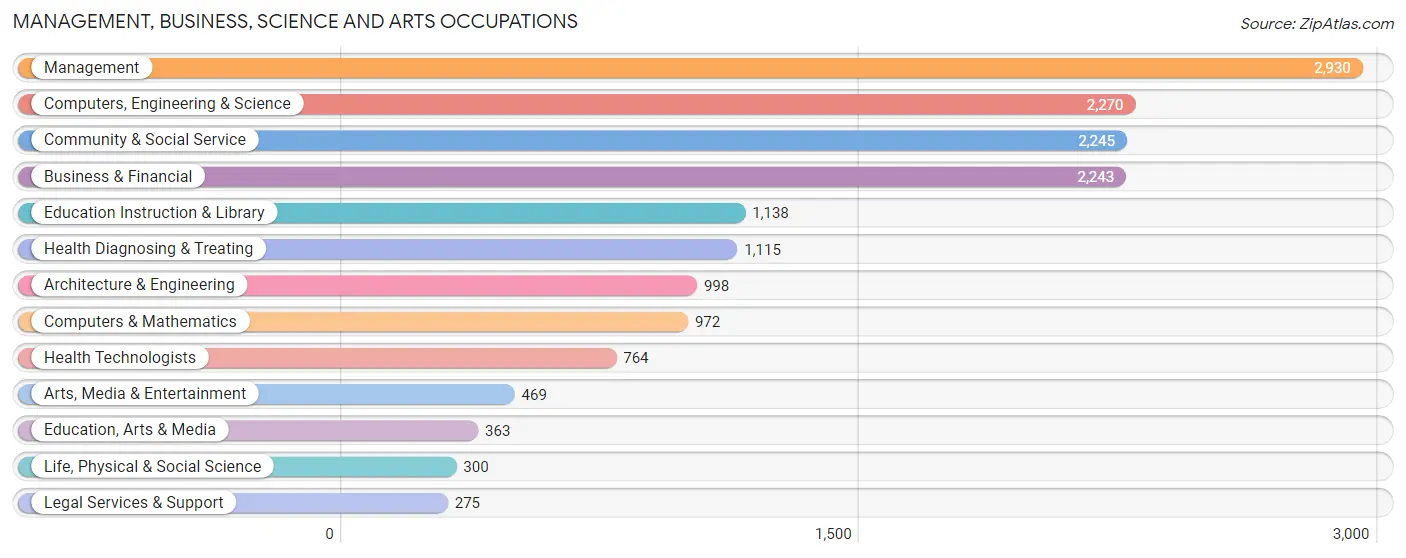
Management, Business, Science and Arts Occupations by Sex
Within the Management, Business, Science and Arts occupations in Pleasant Hill, the most male-oriented occupations are Computers & Mathematics (81.8%), Computers, Engineering & Science (78.3%), and Architecture & Engineering (77.2%), while the most female-oriented occupations are Health Technologists (83.8%), Education, Arts & Media (82.6%), and Health Diagnosing & Treating (78.3%).
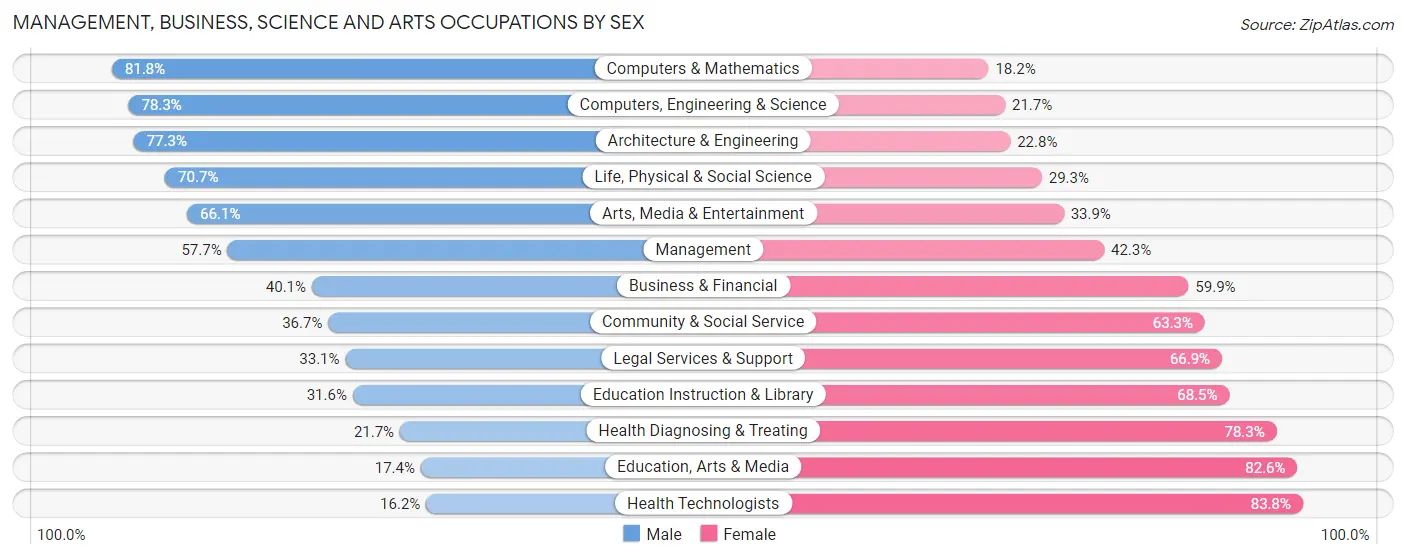
| Occupation | Male | Female |
| Management | 1,690 (57.7%) | 1,240 (42.3%) |
| Business & Financial | 899 (40.1%) | 1,344 (59.9%) |
| Computers, Engineering & Science | 1,778 (78.3%) | 492 (21.7%) |
| Computers & Mathematics | 795 (81.8%) | 177 (18.2%) |
| Architecture & Engineering | 771 (77.2%) | 227 (22.8%) |
| Life, Physical & Social Science | 212 (70.7%) | 88 (29.3%) |
| Community & Social Service | 823 (36.7%) | 1,422 (63.3%) |
| Education, Arts & Media | 63 (17.4%) | 300 (82.6%) |
| Legal Services & Support | 91 (33.1%) | 184 (66.9%) |
| Education Instruction & Library | 359 (31.6%) | 779 (68.4%) |
| Arts, Media & Entertainment | 310 (66.1%) | 159 (33.9%) |
| Health Diagnosing & Treating | 242 (21.7%) | 873 (78.3%) |
| Health Technologists | 124 (16.2%) | 640 (83.8%) |
| Total (Category) | 5,432 (50.3%) | 5,371 (49.7%) |
| Total (Overall) | 9,833 (52.9%) | 8,747 (47.1%) |
Services Occupations
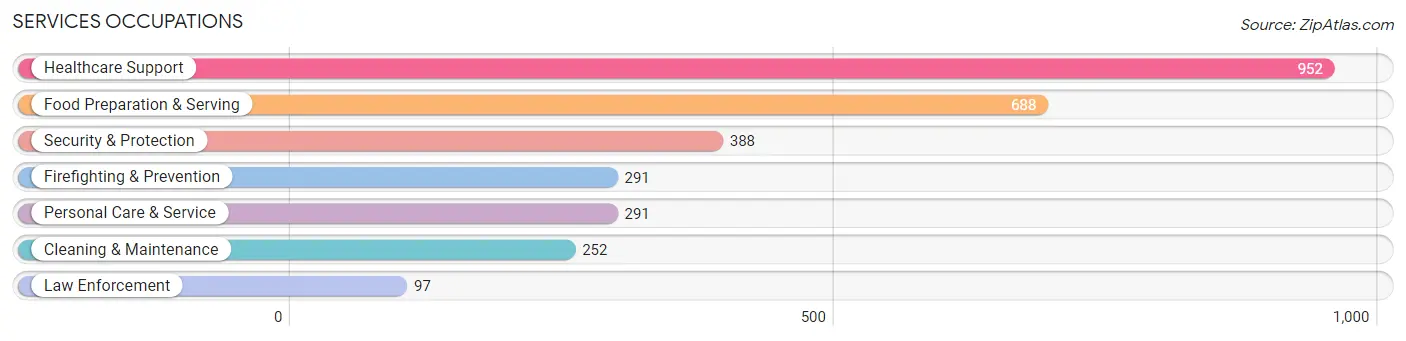
The most common Services occupations in Pleasant Hill are Healthcare Support (952 | 5.1%), Food Preparation & Serving (688 | 3.7%), Security & Protection (388 | 2.1%), Firefighting & Prevention (291 | 1.6%), and Personal Care & Service (291 | 1.6%).
Services Occupations by Sex
Within the Services occupations in Pleasant Hill, the most male-oriented occupations are Firefighting & Prevention (100.0%), Security & Protection (96.7%), and Law Enforcement (86.6%), while the most female-oriented occupations are Personal Care & Service (81.8%), Healthcare Support (55.9%), and Food Preparation & Serving (50.4%).
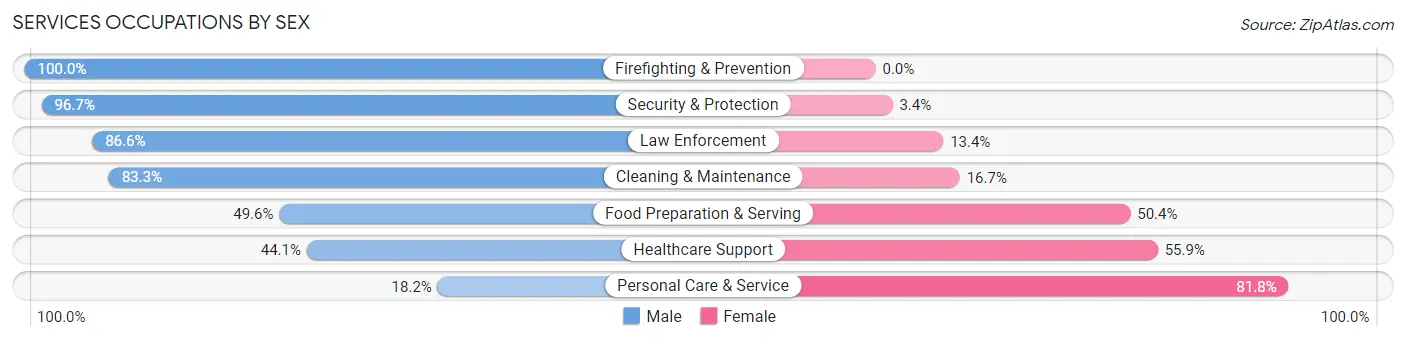
| Occupation | Male | Female |
| Healthcare Support | 420 (44.1%) | 532 (55.9%) |
| Security & Protection | 375 (96.7%) | 13 (3.4%) |
| Firefighting & Prevention | 291 (100.0%) | 0 (0.0%) |
| Law Enforcement | 84 (86.6%) | 13 (13.4%) |
| Food Preparation & Serving | 341 (49.6%) | 347 (50.4%) |
| Cleaning & Maintenance | 210 (83.3%) | 42 (16.7%) |
| Personal Care & Service | 53 (18.2%) | 238 (81.8%) |
| Total (Category) | 1,399 (54.4%) | 1,172 (45.6%) |
| Total (Overall) | 9,833 (52.9%) | 8,747 (47.1%) |
Sales and Office Occupations
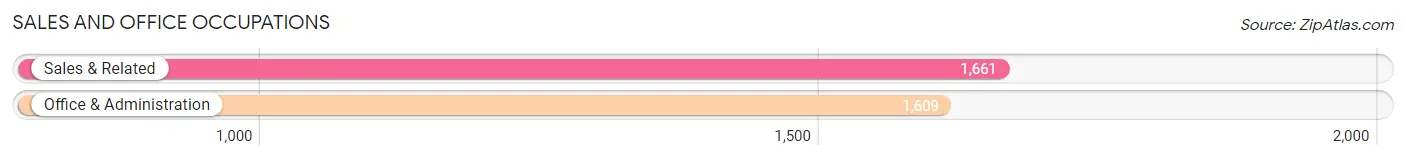
The most common Sales and Office occupations in Pleasant Hill are Sales & Related (1,661 | 8.9%), and Office & Administration (1,609 | 8.7%).
Sales and Office Occupations by Sex
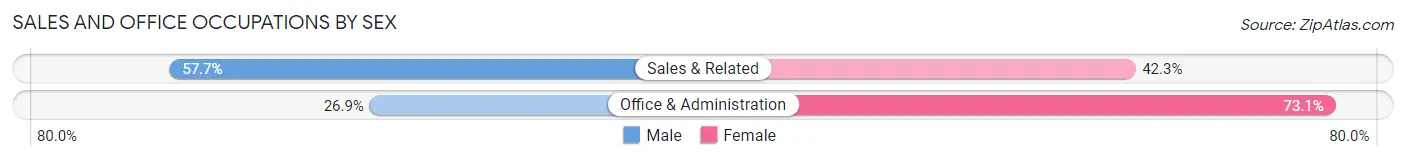
| Occupation | Male | Female |
| Sales & Related | 959 (57.7%) | 702 (42.3%) |
| Office & Administration | 433 (26.9%) | 1,176 (73.1%) |
| Total (Category) | 1,392 (42.6%) | 1,878 (57.4%) |
| Total (Overall) | 9,833 (52.9%) | 8,747 (47.1%) |
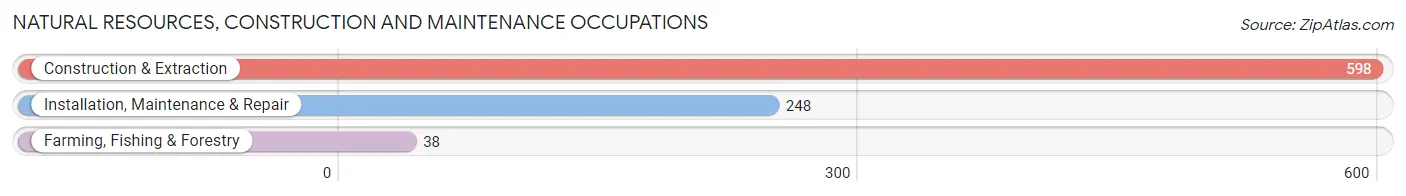
Natural Resources, Construction and Maintenance Occupations
The most common Natural Resources, Construction and Maintenance occupations in Pleasant Hill are Construction & Extraction (598 | 3.2%), Installation, Maintenance & Repair (248 | 1.3%), and Farming, Fishing & Forestry (38 | 0.2%).
Natural Resources, Construction and Maintenance Occupations by Sex
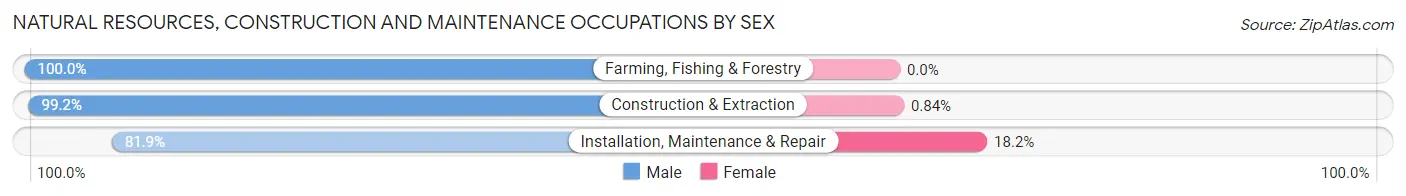
| Occupation | Male | Female |
| Farming, Fishing & Forestry | 38 (100.0%) | 0 (0.0%) |
| Construction & Extraction | 593 (99.2%) | 5 (0.8%) |
| Installation, Maintenance & Repair | 203 (81.9%) | 45 (18.1%) |
| Total (Category) | 834 (94.3%) | 50 (5.7%) |
| Total (Overall) | 9,833 (52.9%) | 8,747 (47.1%) |
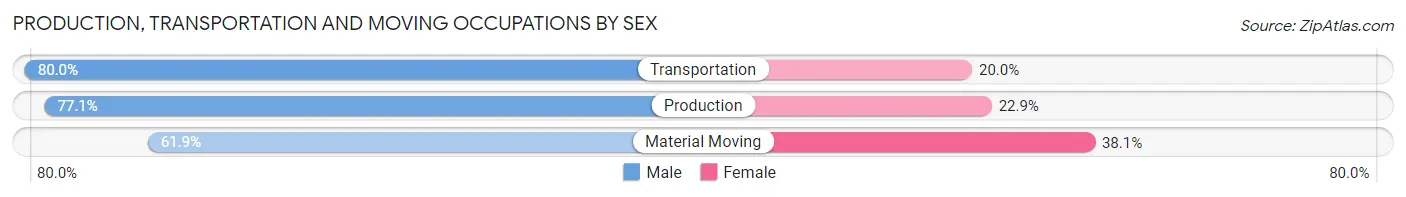
Production, Transportation and Moving Occupations
The most common Production, Transportation and Moving occupations in Pleasant Hill are Transportation (489 | 2.6%), Material Moving (323 | 1.7%), and Production (240 | 1.3%).
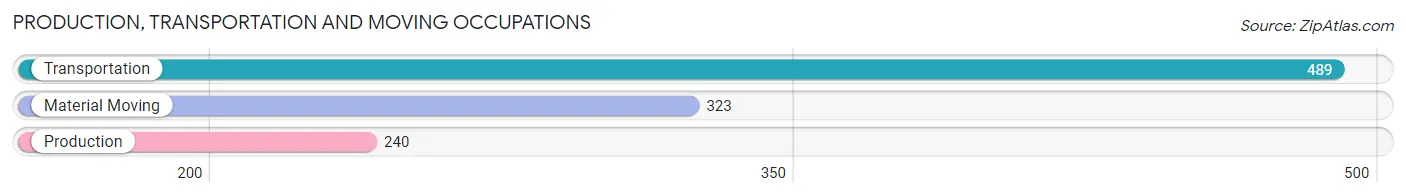
Production, Transportation and Moving Occupations by Sex
| Occupation | Male | Female |
| Production | 185 (77.1%) | 55 (22.9%) |
| Transportation | 391 (80.0%) | 98 (20.0%) |
| Material Moving | 200 (61.9%) | 123 (38.1%) |
| Total (Category) | 776 (73.8%) | 276 (26.2%) |
| Total (Overall) | 9,833 (52.9%) | 8,747 (47.1%) |
Employment Industries by Sex in Pleasant Hill
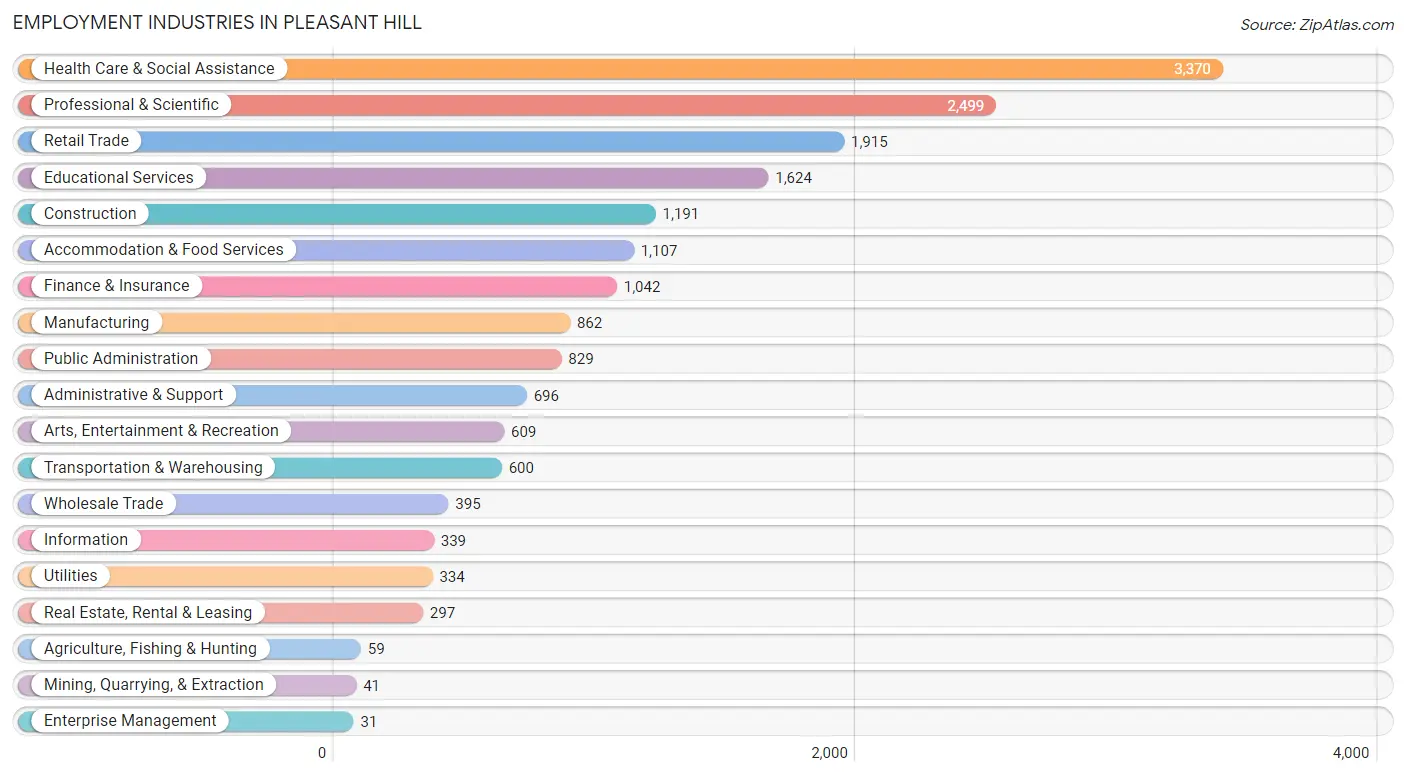
Employment Industries in Pleasant Hill
The major employment industries in Pleasant Hill include Health Care & Social Assistance (3,370 | 18.1%), Professional & Scientific (2,499 | 13.5%), Retail Trade (1,915 | 10.3%), Educational Services (1,624 | 8.7%), and Construction (1,191 | 6.4%).
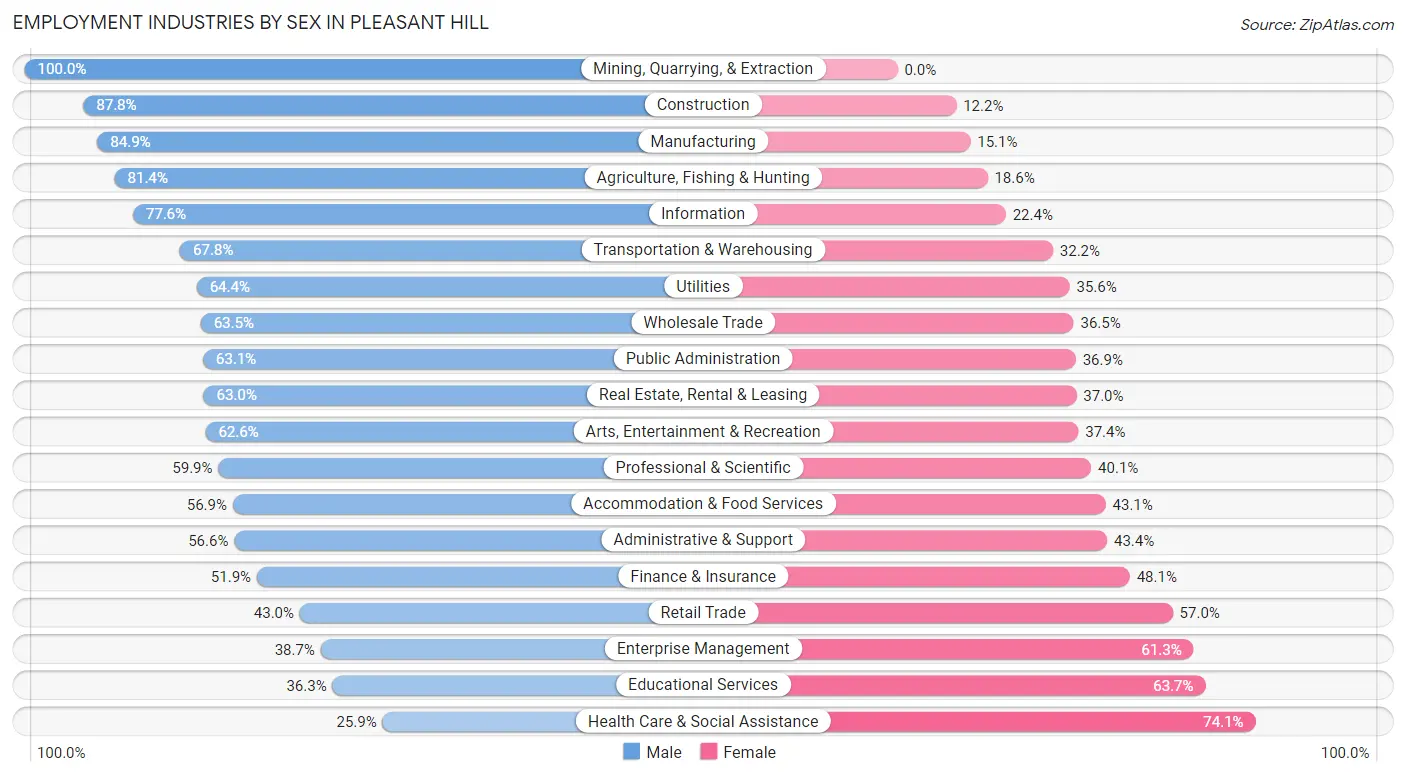
Employment Industries by Sex in Pleasant Hill
The Pleasant Hill industries that see more men than women are Mining, Quarrying, & Extraction (100.0%), Construction (87.8%), and Manufacturing (84.9%), whereas the industries that tend to have a higher number of women are Health Care & Social Assistance (74.1%), Educational Services (63.7%), and Enterprise Management (61.3%).
| Industry | Male | Female |
| Agriculture, Fishing & Hunting | 48 (81.4%) | 11 (18.6%) |
| Mining, Quarrying, & Extraction | 41 (100.0%) | 0 (0.0%) |
| Construction | 1,046 (87.8%) | 145 (12.2%) |
| Manufacturing | 732 (84.9%) | 130 (15.1%) |
| Wholesale Trade | 251 (63.5%) | 144 (36.5%) |
| Retail Trade | 824 (43.0%) | 1,091 (57.0%) |
| Transportation & Warehousing | 407 (67.8%) | 193 (32.2%) |
| Utilities | 215 (64.4%) | 119 (35.6%) |
| Information | 263 (77.6%) | 76 (22.4%) |
| Finance & Insurance | 541 (51.9%) | 501 (48.1%) |
| Real Estate, Rental & Leasing | 187 (63.0%) | 110 (37.0%) |
| Professional & Scientific | 1,497 (59.9%) | 1,002 (40.1%) |
| Enterprise Management | 12 (38.7%) | 19 (61.3%) |
| Administrative & Support | 394 (56.6%) | 302 (43.4%) |
| Educational Services | 589 (36.3%) | 1,035 (63.7%) |
| Health Care & Social Assistance | 873 (25.9%) | 2,497 (74.1%) |
| Arts, Entertainment & Recreation | 381 (62.6%) | 228 (37.4%) |
| Accommodation & Food Services | 630 (56.9%) | 477 (43.1%) |
| Public Administration | 523 (63.1%) | 306 (36.9%) |
| Total | 9,833 (52.9%) | 8,747 (47.1%) |
Education in Pleasant Hill
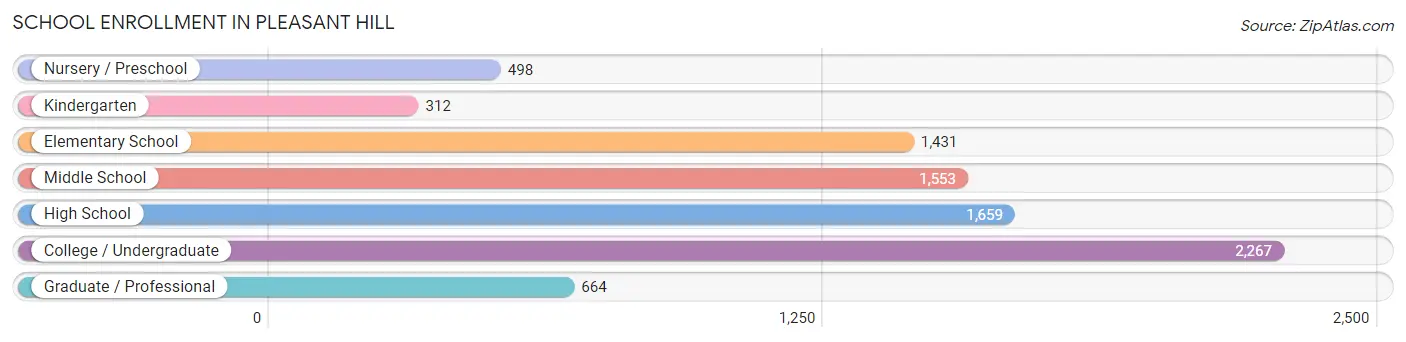
School Enrollment in Pleasant Hill
The most common levels of schooling among the 8,384 students in Pleasant Hill are college / undergraduate (2,267 | 27.0%), high school (1,659 | 19.8%), and middle school (1,553 | 18.5%).
| School Level | # Students | % Students |
| Nursery / Preschool | 498 | 5.9% |
| Kindergarten | 312 | 3.7% |
| Elementary School | 1,431 | 17.1% |
| Middle School | 1,553 | 18.5% |
| High School | 1,659 | 19.8% |
| College / Undergraduate | 2,267 | 27.0% |
| Graduate / Professional | 664 | 7.9% |
| Total | 8,384 | 100.0% |
School Enrollment by Age by Funding Source in Pleasant Hill
Out of a total of 8,384 students who are enrolled in schools in Pleasant Hill, 1,534 (18.3%) attend a private institution, while the remaining 6,850 (81.7%) are enrolled in public schools. The age group of 3 to 4 year olds has the highest likelihood of being enrolled in private schools, with 252 (64.3% in the age bracket) enrolled. Conversely, the age group of 20 to 24 year olds has the lowest likelihood of being enrolled in a private school, with 938 (91.2% in the age bracket) attending a public institution.
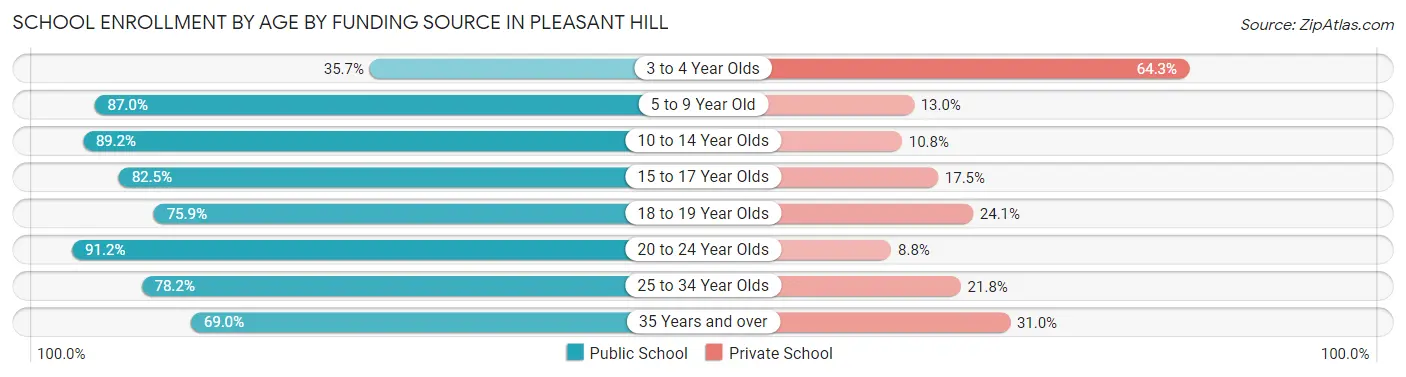
| Age Bracket | Public School | Private School |
| 3 to 4 Year Olds | 140 (35.7%) | 252 (64.3%) |
| 5 to 9 Year Old | 1,447 (87.0%) | 217 (13.0%) |
| 10 to 14 Year Olds | 1,679 (89.2%) | 204 (10.8%) |
| 15 to 17 Year Olds | 1,194 (82.5%) | 254 (17.5%) |
| 18 to 19 Year Olds | 543 (75.9%) | 172 (24.1%) |
| 20 to 24 Year Olds | 938 (91.2%) | 91 (8.8%) |
| 25 to 34 Year Olds | 384 (78.2%) | 107 (21.8%) |
| 35 Years and over | 526 (69.0%) | 236 (31.0%) |
| Total | 6,850 (81.7%) | 1,534 (18.3%) |
Educational Attainment by Field of Study in Pleasant Hill
Business (2,586 | 17.2%), social sciences (1,849 | 12.3%), engineering (1,567 | 10.4%), science & technology (1,215 | 8.1%), and bio, nature & agricultural (1,003 | 6.7%) are the most common fields of study among 15,064 individuals in Pleasant Hill who have obtained a bachelor's degree or higher.
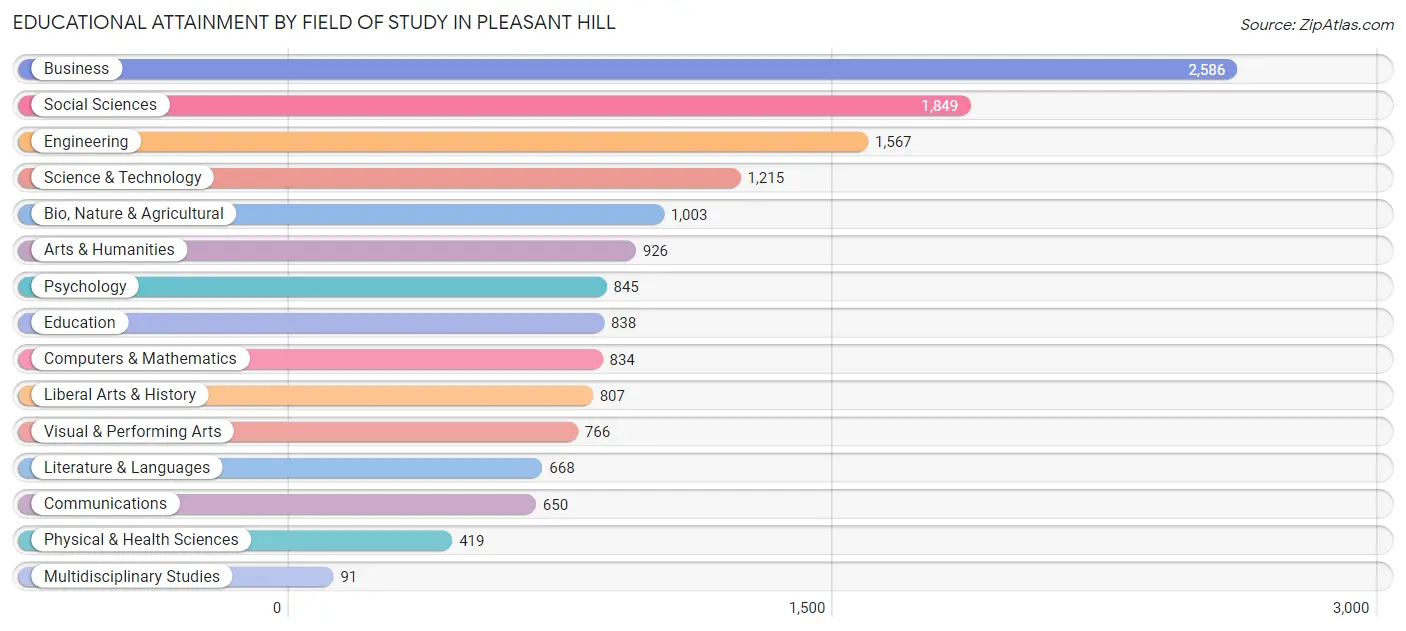
| Field of Study | # Graduates | % Graduates |
| Computers & Mathematics | 834 | 5.5% |
| Bio, Nature & Agricultural | 1,003 | 6.7% |
| Physical & Health Sciences | 419 | 2.8% |
| Psychology | 845 | 5.6% |
| Social Sciences | 1,849 | 12.3% |
| Engineering | 1,567 | 10.4% |
| Multidisciplinary Studies | 91 | 0.6% |
| Science & Technology | 1,215 | 8.1% |
| Business | 2,586 | 17.2% |
| Education | 838 | 5.6% |
| Literature & Languages | 668 | 4.4% |
| Liberal Arts & History | 807 | 5.4% |
| Visual & Performing Arts | 766 | 5.1% |
| Communications | 650 | 4.3% |
| Arts & Humanities | 926 | 6.1% |
| Total | 15,064 | 100.0% |
Transportation & Commute in Pleasant Hill
Vehicle Availability by Sex in Pleasant Hill
The most prevalent vehicle ownership categories in Pleasant Hill are males with 2 vehicles (4,036, accounting for 41.2%) and females with 2 vehicles (3,832, making up 47.7%).
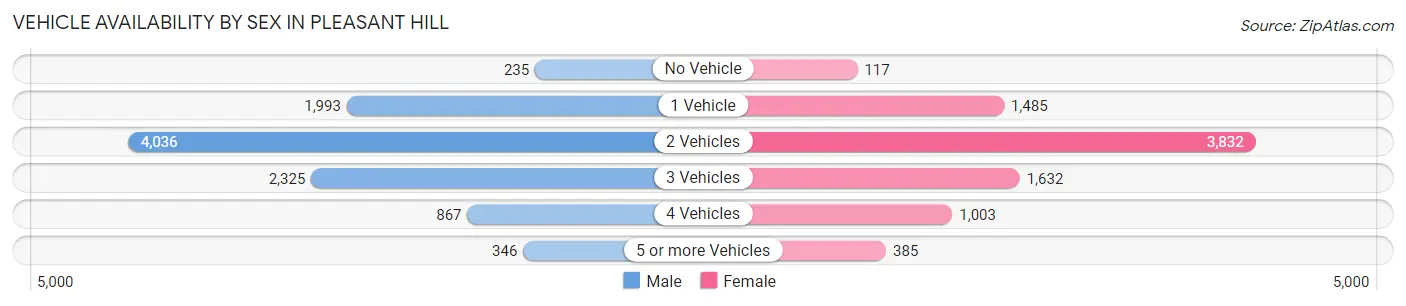
| Vehicles Available | Male | Female |
| No Vehicle | 235 (2.4%) | 117 (1.4%) |
| 1 Vehicle | 1,993 (20.3%) | 1,485 (17.6%) |
| 2 Vehicles | 4,036 (41.2%) | 3,832 (45.3%) |
| 3 Vehicles | 2,325 (23.7%) | 1,632 (19.3%) |
| 4 Vehicles | 867 (8.8%) | 1,003 (11.9%) |
| 5 or more Vehicles | 346 (3.5%) | 385 (4.5%) |
| Total | 9,802 (100.0%) | 8,454 (100.0%) |
Commute Time in Pleasant Hill
The most frequently occuring commute durations in Pleasant Hill are 15 to 19 minutes (2,224 commuters, 14.9%), 60 to 89 minutes (2,154 commuters, 14.5%), and 10 to 14 minutes (1,834 commuters, 12.3%).
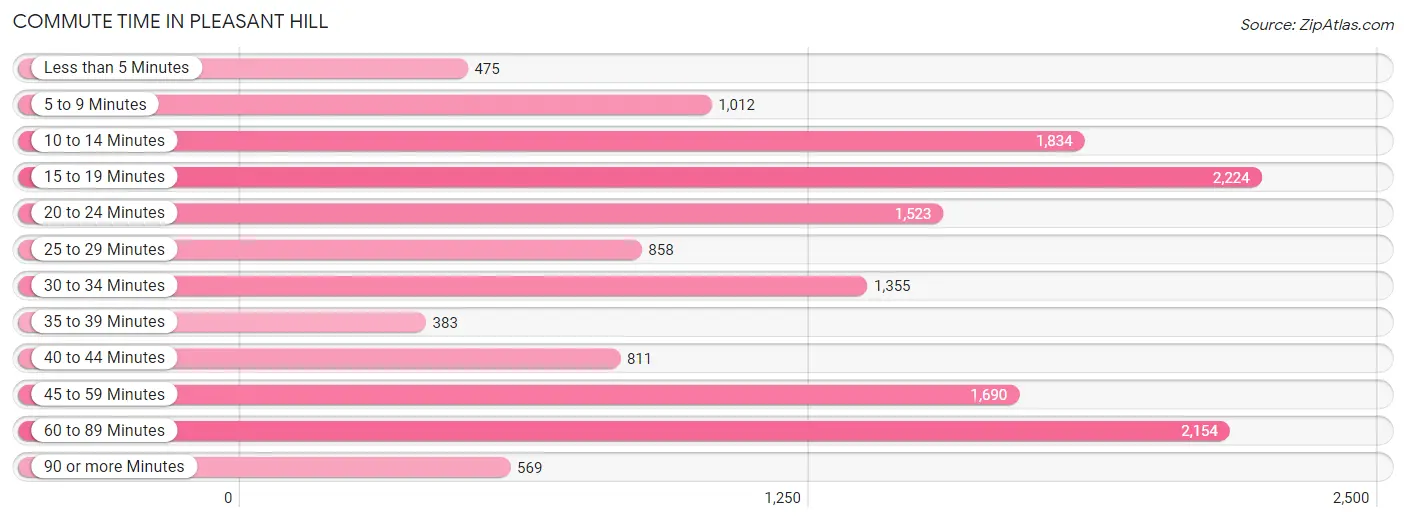
| Commute Time | # Commuters | % Commuters |
| Less than 5 Minutes | 475 | 3.2% |
| 5 to 9 Minutes | 1,012 | 6.8% |
| 10 to 14 Minutes | 1,834 | 12.3% |
| 15 to 19 Minutes | 2,224 | 14.9% |
| 20 to 24 Minutes | 1,523 | 10.2% |
| 25 to 29 Minutes | 858 | 5.8% |
| 30 to 34 Minutes | 1,355 | 9.1% |
| 35 to 39 Minutes | 383 | 2.6% |
| 40 to 44 Minutes | 811 | 5.4% |
| 45 to 59 Minutes | 1,690 | 11.4% |
| 60 to 89 Minutes | 2,154 | 14.5% |
| 90 or more Minutes | 569 | 3.8% |
Commute Time by Sex in Pleasant Hill
The most common commute times in Pleasant Hill are 15 to 19 minutes (1,238 commuters, 15.2%) for males and 10 to 14 minutes (1,031 commuters, 15.3%) for females.
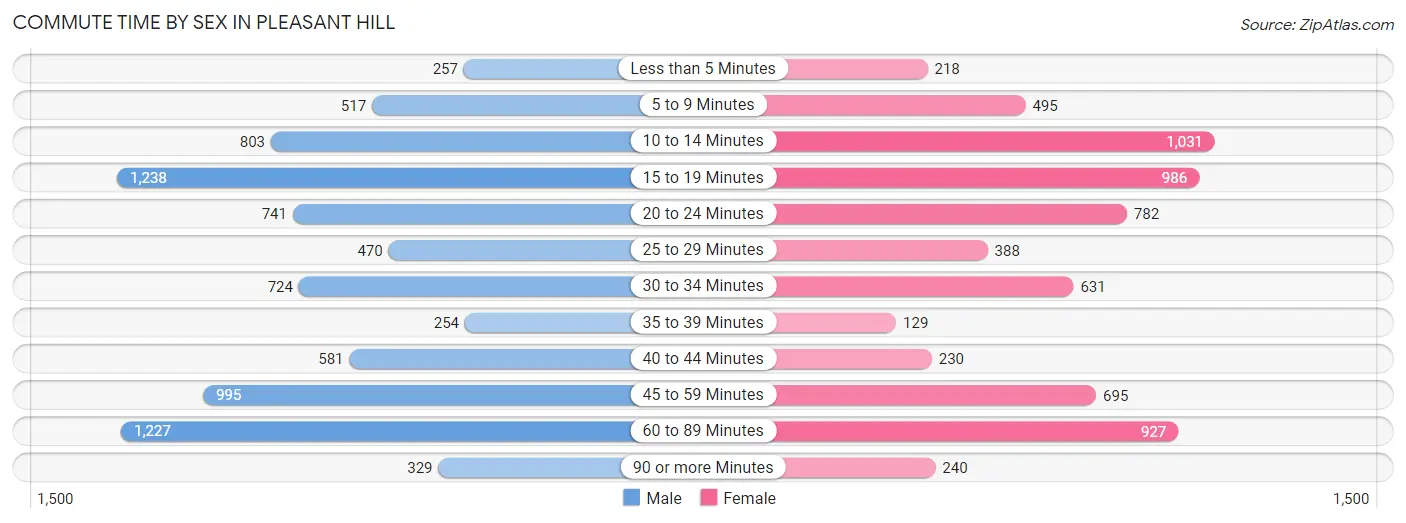
| Commute Time | Male | Female |
| Less than 5 Minutes | 257 (3.2%) | 218 (3.2%) |
| 5 to 9 Minutes | 517 (6.4%) | 495 (7.3%) |
| 10 to 14 Minutes | 803 (9.9%) | 1,031 (15.3%) |
| 15 to 19 Minutes | 1,238 (15.2%) | 986 (14.6%) |
| 20 to 24 Minutes | 741 (9.1%) | 782 (11.6%) |
| 25 to 29 Minutes | 470 (5.8%) | 388 (5.8%) |
| 30 to 34 Minutes | 724 (8.9%) | 631 (9.3%) |
| 35 to 39 Minutes | 254 (3.1%) | 129 (1.9%) |
| 40 to 44 Minutes | 581 (7.1%) | 230 (3.4%) |
| 45 to 59 Minutes | 995 (12.2%) | 695 (10.3%) |
| 60 to 89 Minutes | 1,227 (15.1%) | 927 (13.7%) |
| 90 or more Minutes | 329 (4.0%) | 240 (3.5%) |
Time of Departure to Work by Sex in Pleasant Hill
The most frequent times of departure to work in Pleasant Hill are 7:30 AM to 7:59 AM (1,249, 15.3%) for males and 7:30 AM to 7:59 AM (972, 14.4%) for females.
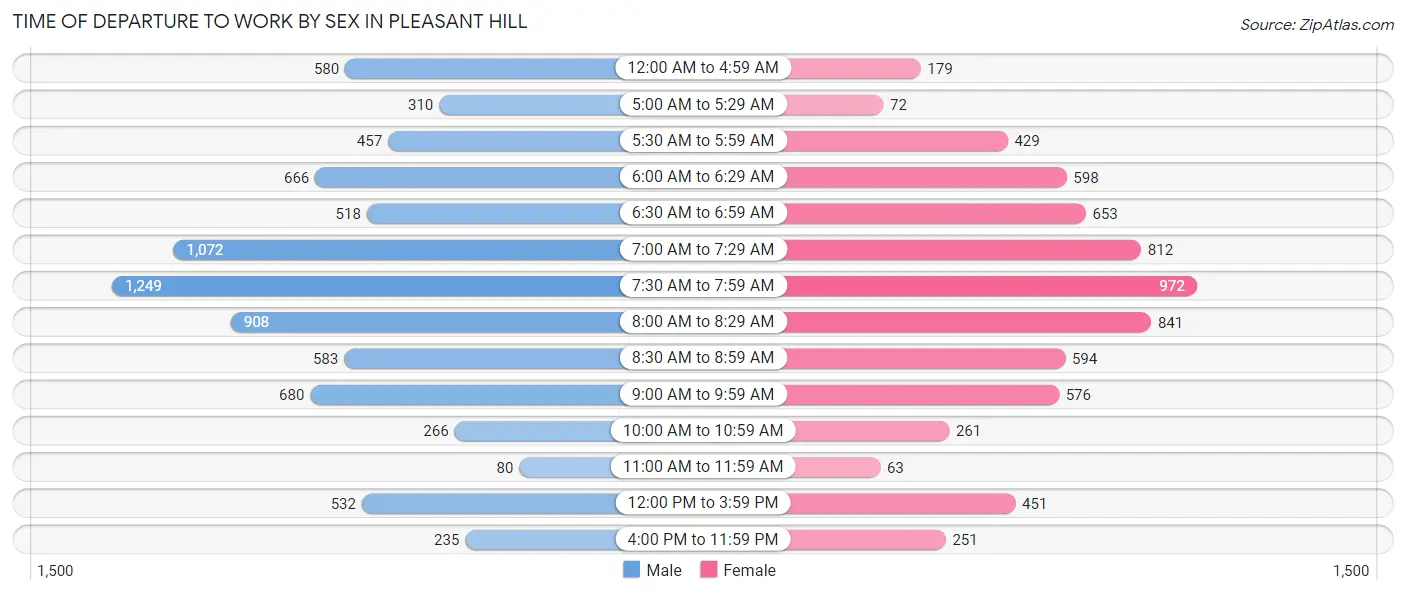
| Time of Departure | Male | Female |
| 12:00 AM to 4:59 AM | 580 (7.1%) | 179 (2.6%) |
| 5:00 AM to 5:29 AM | 310 (3.8%) | 72 (1.1%) |
| 5:30 AM to 5:59 AM | 457 (5.6%) | 429 (6.4%) |
| 6:00 AM to 6:29 AM | 666 (8.2%) | 598 (8.9%) |
| 6:30 AM to 6:59 AM | 518 (6.4%) | 653 (9.7%) |
| 7:00 AM to 7:29 AM | 1,072 (13.2%) | 812 (12.0%) |
| 7:30 AM to 7:59 AM | 1,249 (15.3%) | 972 (14.4%) |
| 8:00 AM to 8:29 AM | 908 (11.2%) | 841 (12.5%) |
| 8:30 AM to 8:59 AM | 583 (7.2%) | 594 (8.8%) |
| 9:00 AM to 9:59 AM | 680 (8.4%) | 576 (8.5%) |
| 10:00 AM to 10:59 AM | 266 (3.3%) | 261 (3.9%) |
| 11:00 AM to 11:59 AM | 80 (1.0%) | 63 (0.9%) |
| 12:00 PM to 3:59 PM | 532 (6.5%) | 451 (6.7%) |
| 4:00 PM to 11:59 PM | 235 (2.9%) | 251 (3.7%) |
| Total | 8,136 (100.0%) | 6,752 (100.0%) |
Housing Occupancy in Pleasant Hill
Occupancy by Ownership in Pleasant Hill
Of the total 13,818 dwellings in Pleasant Hill, owner-occupied units account for 8,773 (63.5%), while renter-occupied units make up 5,045 (36.5%).
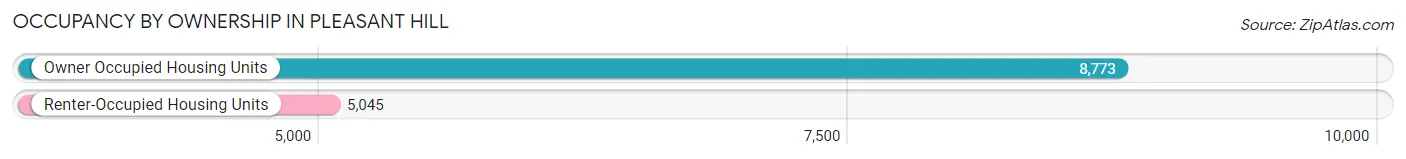
| Occupancy | # Housing Units | % Housing Units |
| Owner Occupied Housing Units | 8,773 | 63.5% |
| Renter-Occupied Housing Units | 5,045 | 36.5% |
| Total Occupied Housing Units | 13,818 | 100.0% |
Occupancy by Household Size in Pleasant Hill
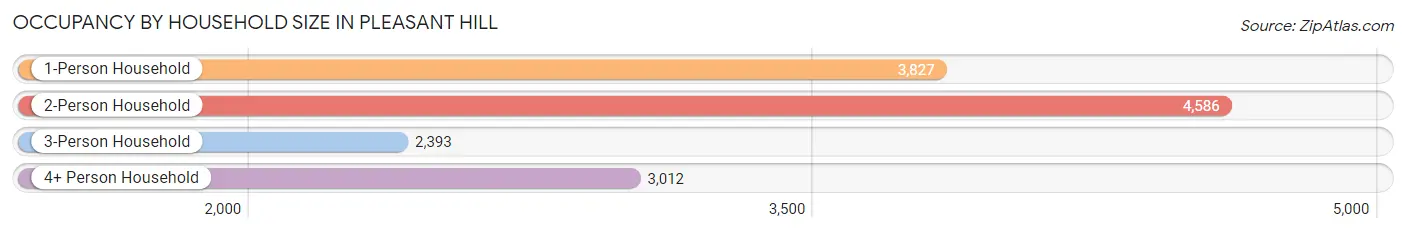
| Household Size | # Housing Units | % Housing Units |
| 1-Person Household | 3,827 | 27.7% |
| 2-Person Household | 4,586 | 33.2% |
| 3-Person Household | 2,393 | 17.3% |
| 4+ Person Household | 3,012 | 21.8% |
| Total Housing Units | 13,818 | 100.0% |
Occupancy by Ownership by Household Size in Pleasant Hill
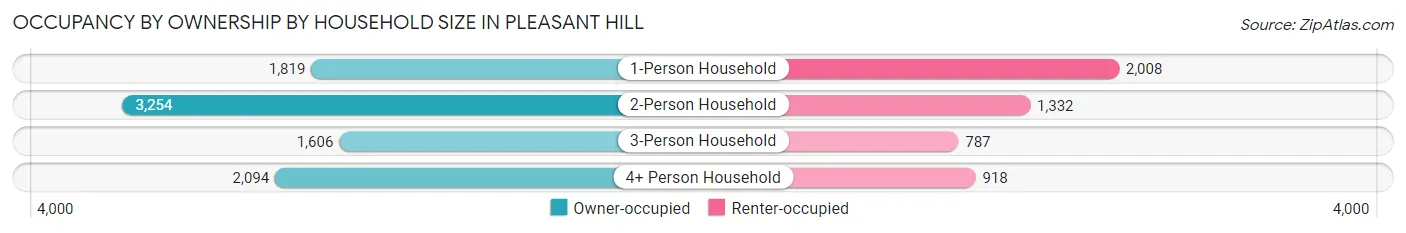
| Household Size | Owner-occupied | Renter-occupied |
| 1-Person Household | 1,819 (47.5%) | 2,008 (52.5%) |
| 2-Person Household | 3,254 (71.0%) | 1,332 (29.0%) |
| 3-Person Household | 1,606 (67.1%) | 787 (32.9%) |
| 4+ Person Household | 2,094 (69.5%) | 918 (30.5%) |
| Total Housing Units | 8,773 (63.5%) | 5,045 (36.5%) |
Occupancy by Educational Attainment in Pleasant Hill
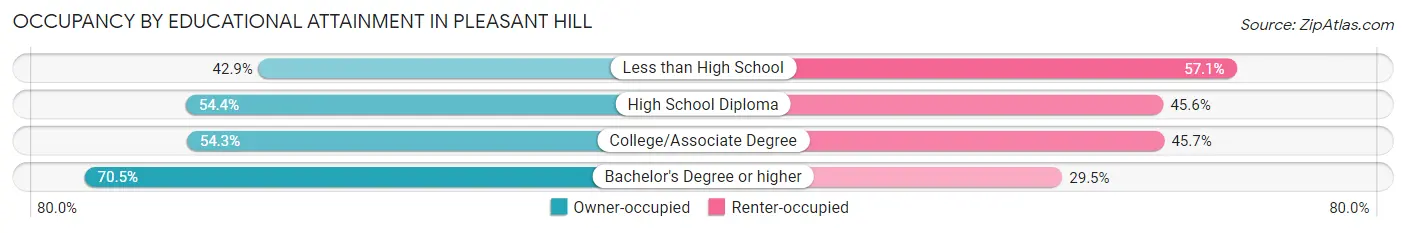
| Household Size | Owner-occupied | Renter-occupied |
| Less than High School | 235 (42.9%) | 313 (57.1%) |
| High School Diploma | 707 (54.4%) | 592 (45.6%) |
| College/Associate Degree | 2,026 (54.3%) | 1,707 (45.7%) |
| Bachelor's Degree or higher | 5,805 (70.5%) | 2,433 (29.5%) |
Occupancy by Age of Householder in Pleasant Hill
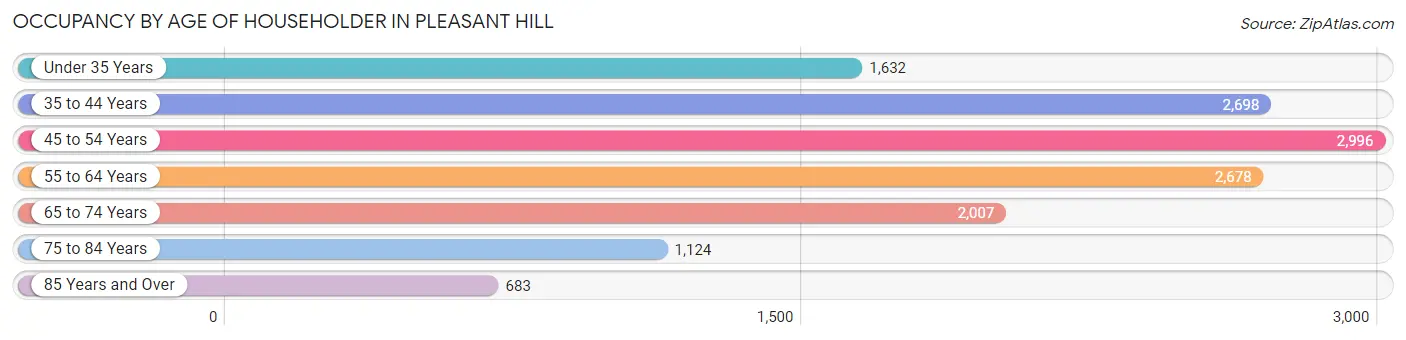
| Age Bracket | # Households | % Households |
| Under 35 Years | 1,632 | 11.8% |
| 35 to 44 Years | 2,698 | 19.5% |
| 45 to 54 Years | 2,996 | 21.7% |
| 55 to 64 Years | 2,678 | 19.4% |
| 65 to 74 Years | 2,007 | 14.5% |
| 75 to 84 Years | 1,124 | 8.1% |
| 85 Years and Over | 683 | 4.9% |
| Total | 13,818 | 100.0% |
Housing Finances in Pleasant Hill
Median Income by Occupancy in Pleasant Hill
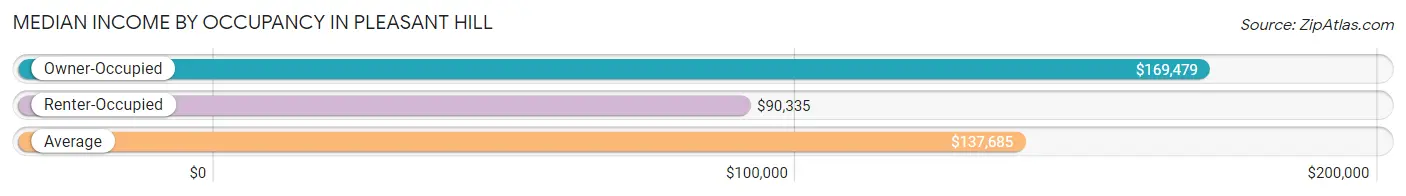
| Occupancy Type | # Households | Median Income |
| Owner-Occupied | 8,773 (63.5%) | $169,479 |
| Renter-Occupied | 5,045 (36.5%) | $90,335 |
| Average | 13,818 (100.0%) | $137,685 |
Occupancy by Householder Income Bracket in Pleasant Hill
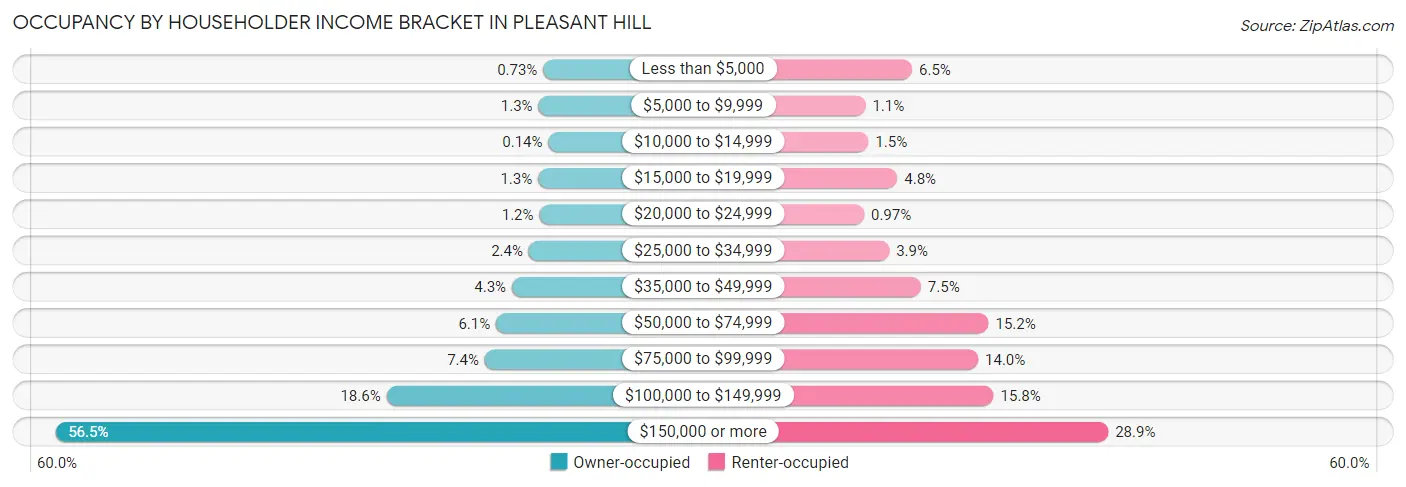
| Income Bracket | Owner-occupied | Renter-occupied |
| Less than $5,000 | 64 (0.7%) | 326 (6.5%) |
| $5,000 to $9,999 | 112 (1.3%) | 57 (1.1%) |
| $10,000 to $14,999 | 12 (0.1%) | 74 (1.5%) |
| $15,000 to $19,999 | 116 (1.3%) | 241 (4.8%) |
| $20,000 to $24,999 | 103 (1.2%) | 49 (1.0%) |
| $25,000 to $34,999 | 209 (2.4%) | 194 (3.8%) |
| $35,000 to $49,999 | 378 (4.3%) | 377 (7.5%) |
| $50,000 to $74,999 | 537 (6.1%) | 767 (15.2%) |
| $75,000 to $99,999 | 650 (7.4%) | 707 (14.0%) |
| $100,000 to $149,999 | 1,635 (18.6%) | 796 (15.8%) |
| $150,000 or more | 4,957 (56.5%) | 1,457 (28.9%) |
| Total | 8,773 (100.0%) | 5,045 (100.0%) |
Monthly Housing Cost Tiers in Pleasant Hill
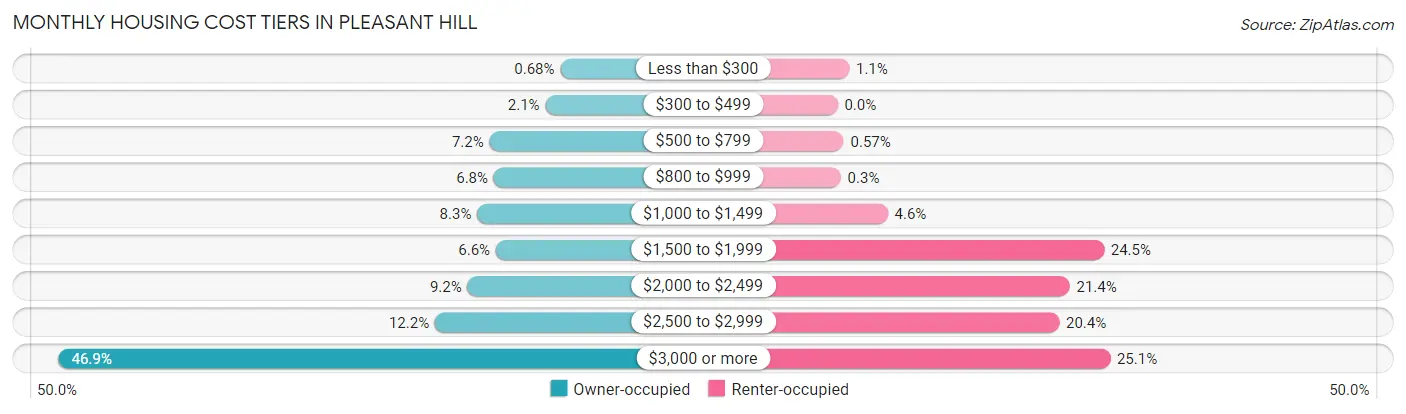
| Monthly Cost | Owner-occupied | Renter-occupied |
| Less than $300 | 60 (0.7%) | 54 (1.1%) |
| $300 to $499 | 180 (2.1%) | 0 (0.0%) |
| $500 to $799 | 632 (7.2%) | 29 (0.6%) |
| $800 to $999 | 597 (6.8%) | 15 (0.3%) |
| $1,000 to $1,499 | 731 (8.3%) | 233 (4.6%) |
| $1,500 to $1,999 | 580 (6.6%) | 1,237 (24.5%) |
| $2,000 to $2,499 | 809 (9.2%) | 1,078 (21.4%) |
| $2,500 to $2,999 | 1,072 (12.2%) | 1,029 (20.4%) |
| $3,000 or more | 4,112 (46.9%) | 1,266 (25.1%) |
| Total | 8,773 (100.0%) | 5,045 (100.0%) |
Physical Housing Characteristics in Pleasant Hill
Housing Structures in Pleasant Hill
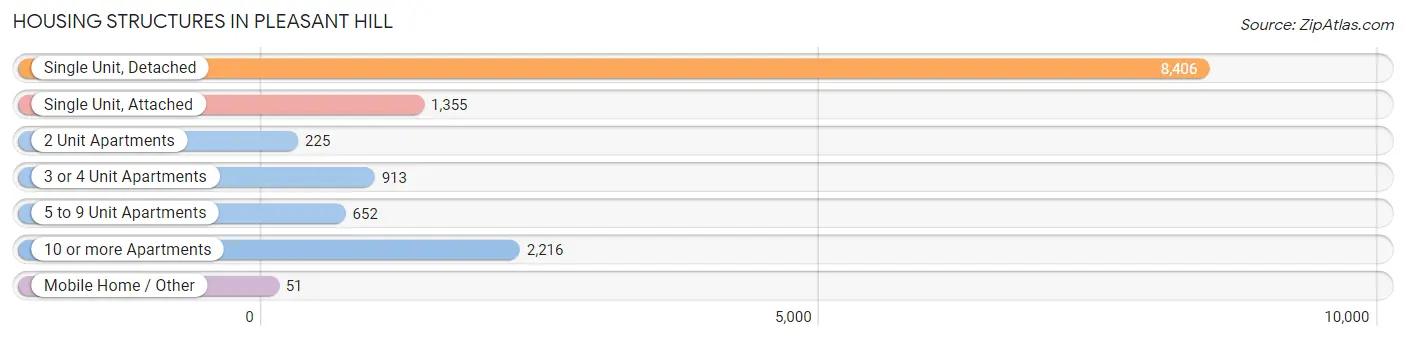
| Structure Type | # Housing Units | % Housing Units |
| Single Unit, Detached | 8,406 | 60.8% |
| Single Unit, Attached | 1,355 | 9.8% |
| 2 Unit Apartments | 225 | 1.6% |
| 3 or 4 Unit Apartments | 913 | 6.6% |
| 5 to 9 Unit Apartments | 652 | 4.7% |
| 10 or more Apartments | 2,216 | 16.0% |
| Mobile Home / Other | 51 | 0.4% |
| Total | 13,818 | 100.0% |
Housing Structures by Occupancy in Pleasant Hill
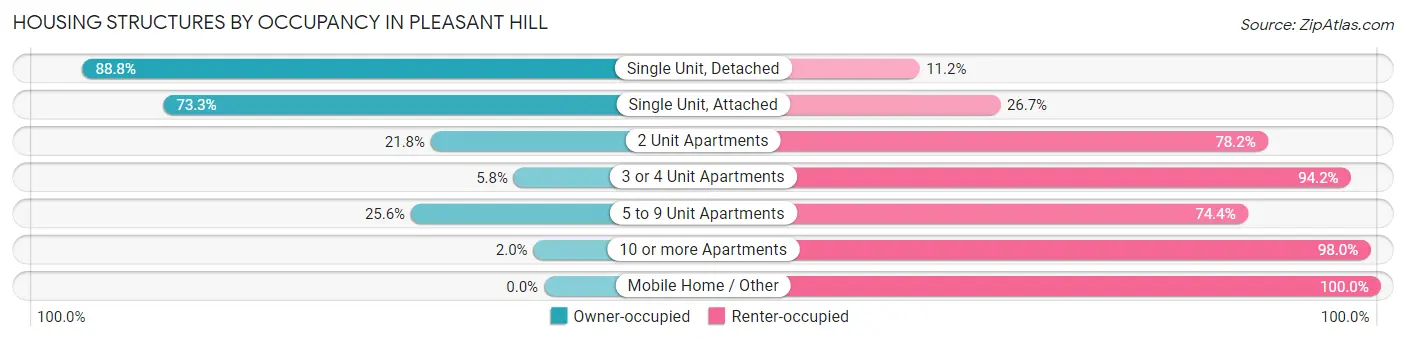
| Structure Type | Owner-occupied | Renter-occupied |
| Single Unit, Detached | 7,466 (88.8%) | 940 (11.2%) |
| Single Unit, Attached | 993 (73.3%) | 362 (26.7%) |
| 2 Unit Apartments | 49 (21.8%) | 176 (78.2%) |
| 3 or 4 Unit Apartments | 53 (5.8%) | 860 (94.2%) |
| 5 to 9 Unit Apartments | 167 (25.6%) | 485 (74.4%) |
| 10 or more Apartments | 45 (2.0%) | 2,171 (98.0%) |
| Mobile Home / Other | 0 (0.0%) | 51 (100.0%) |
| Total | 8,773 (63.5%) | 5,045 (36.5%) |
Housing Structures by Number of Rooms in Pleasant Hill
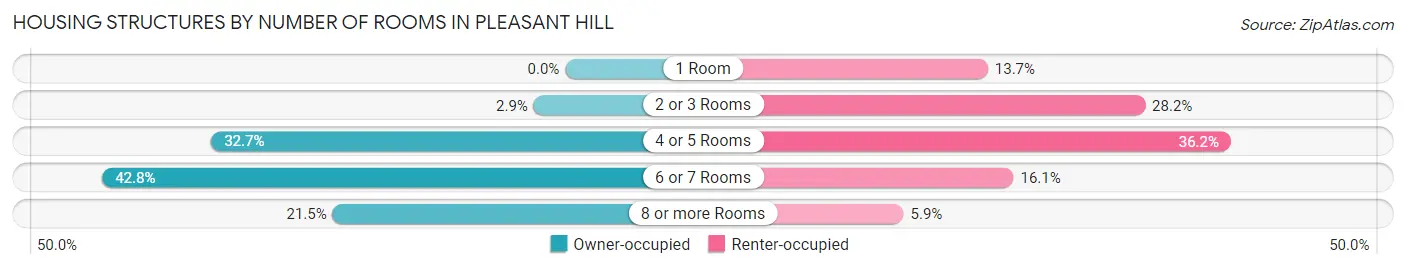
| Number of Rooms | Owner-occupied | Renter-occupied |
| 1 Room | 0 (0.0%) | 690 (13.7%) |
| 2 or 3 Rooms | 256 (2.9%) | 1,424 (28.2%) |
| 4 or 5 Rooms | 2,872 (32.7%) | 1,824 (36.1%) |
| 6 or 7 Rooms | 3,757 (42.8%) | 810 (16.1%) |
| 8 or more Rooms | 1,888 (21.5%) | 297 (5.9%) |
| Total | 8,773 (100.0%) | 5,045 (100.0%) |
Housing Structure by Heating Type in Pleasant Hill
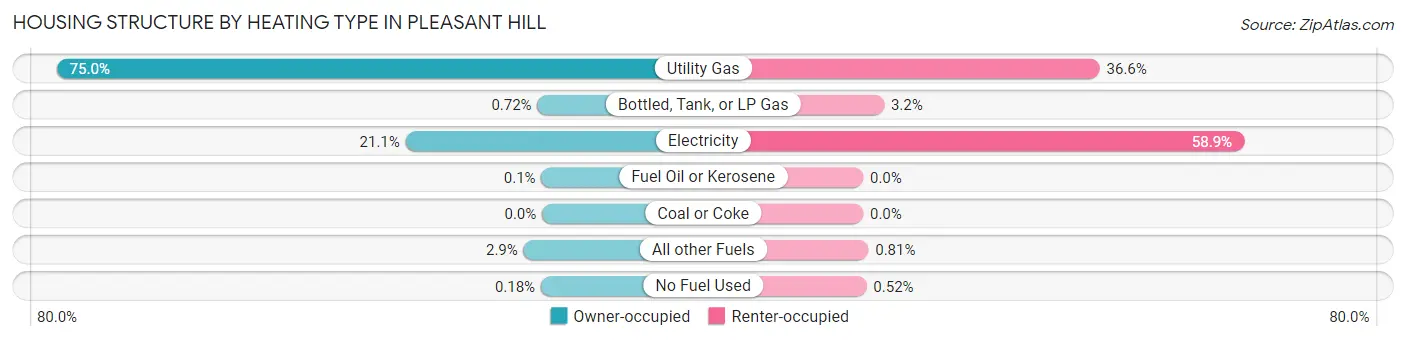
| Heating Type | Owner-occupied | Renter-occupied |
| Utility Gas | 6,583 (75.0%) | 1,845 (36.6%) |
| Bottled, Tank, or LP Gas | 63 (0.7%) | 163 (3.2%) |
| Electricity | 1,851 (21.1%) | 2,970 (58.9%) |
| Fuel Oil or Kerosene | 9 (0.1%) | 0 (0.0%) |
| Coal or Coke | 0 (0.0%) | 0 (0.0%) |
| All other Fuels | 251 (2.9%) | 41 (0.8%) |
| No Fuel Used | 16 (0.2%) | 26 (0.5%) |
| Total | 8,773 (100.0%) | 5,045 (100.0%) |
Household Vehicle Usage in Pleasant Hill
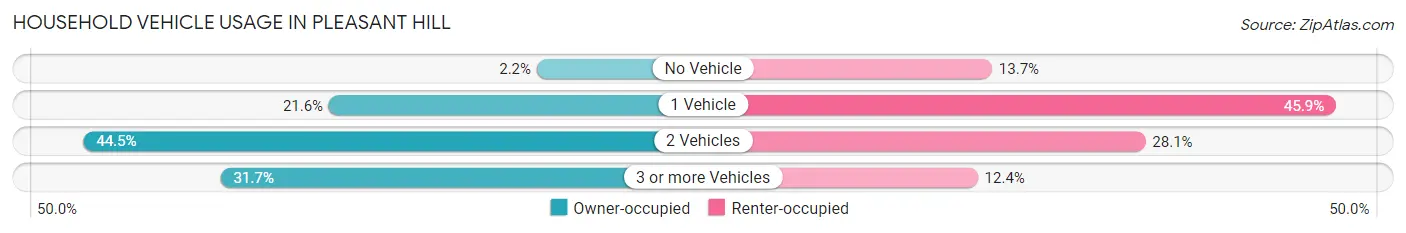
| Vehicles per Household | Owner-occupied | Renter-occupied |
| No Vehicle | 191 (2.2%) | 692 (13.7%) |
| 1 Vehicle | 1,894 (21.6%) | 2,313 (45.9%) |
| 2 Vehicles | 3,906 (44.5%) | 1,415 (28.1%) |
| 3 or more Vehicles | 2,782 (31.7%) | 625 (12.4%) |
| Total | 8,773 (100.0%) | 5,045 (100.0%) |
Real Estate & Mortgages in Pleasant Hill
Real Estate and Mortgage Overview in Pleasant Hill
| Characteristic | Without Mortgage | With Mortgage |
| Housing Units | 2,072 | 6,701 |
| Median Property Value | $953,500 | $962,400 |
| Median Household Income | $109,389 | $4,357 |
| Monthly Housing Costs | $867 | $4,112 |
| Real Estate Taxes | $4,821 | $50 |
Property Value by Mortgage Status in Pleasant Hill
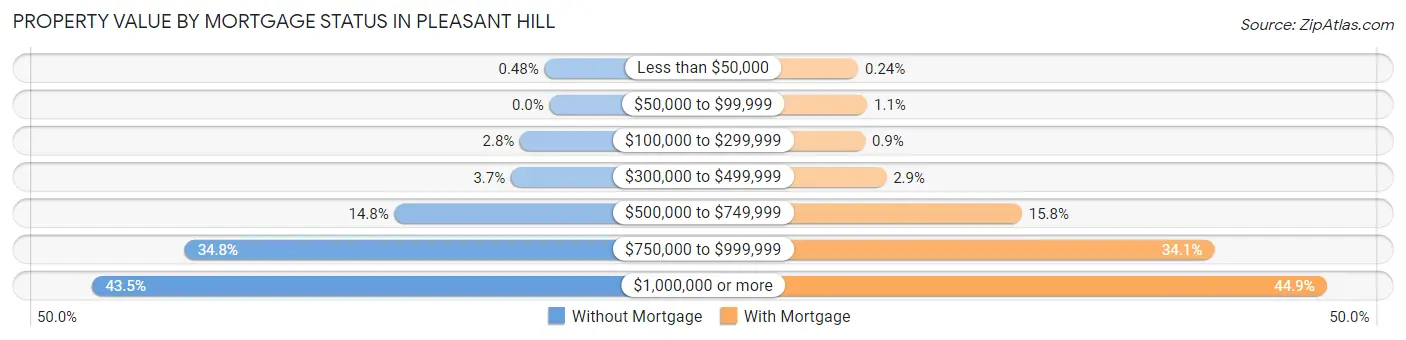
| Property Value | Without Mortgage | With Mortgage |
| Less than $50,000 | 10 (0.5%) | 16 (0.2%) |
| $50,000 to $99,999 | 0 (0.0%) | 74 (1.1%) |
| $100,000 to $299,999 | 58 (2.8%) | 60 (0.9%) |
| $300,000 to $499,999 | 76 (3.7%) | 196 (2.9%) |
| $500,000 to $749,999 | 306 (14.8%) | 1,061 (15.8%) |
| $750,000 to $999,999 | 720 (34.7%) | 2,288 (34.1%) |
| $1,000,000 or more | 902 (43.5%) | 3,006 (44.9%) |
| Total | 2,072 (100.0%) | 6,701 (100.0%) |
Household Income by Mortgage Status in Pleasant Hill
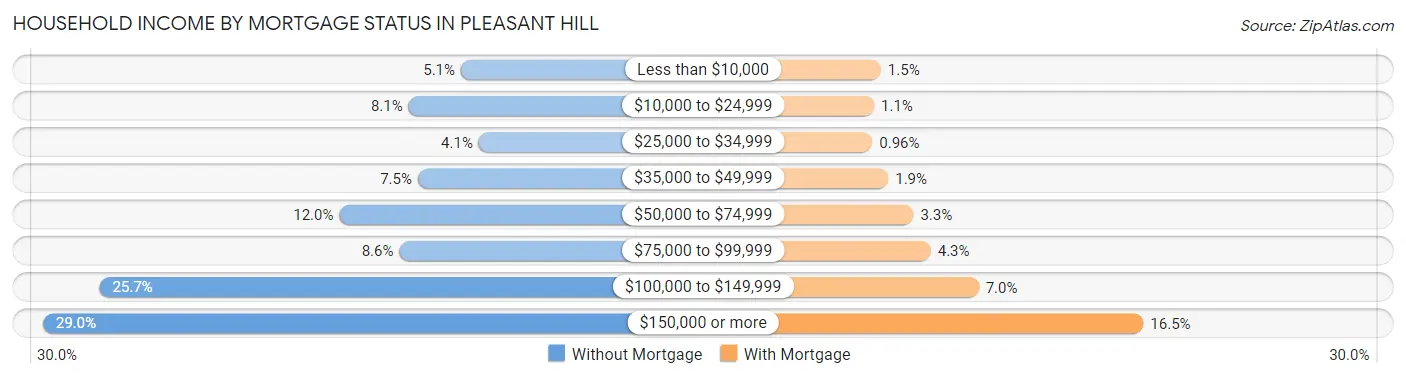
| Household Income | Without Mortgage | With Mortgage |
| Less than $10,000 | 105 (5.1%) | 97 (1.5%) |
| $10,000 to $24,999 | 167 (8.1%) | 71 (1.1%) |
| $25,000 to $34,999 | 84 (4.1%) | 64 (1.0%) |
| $35,000 to $49,999 | 156 (7.5%) | 125 (1.9%) |
| $50,000 to $74,999 | 249 (12.0%) | 222 (3.3%) |
| $75,000 to $99,999 | 178 (8.6%) | 288 (4.3%) |
| $100,000 to $149,999 | 533 (25.7%) | 472 (7.0%) |
| $150,000 or more | 600 (29.0%) | 1,102 (16.5%) |
| Total | 2,072 (100.0%) | 6,701 (100.0%) |
Property Value to Household Income Ratio in Pleasant Hill
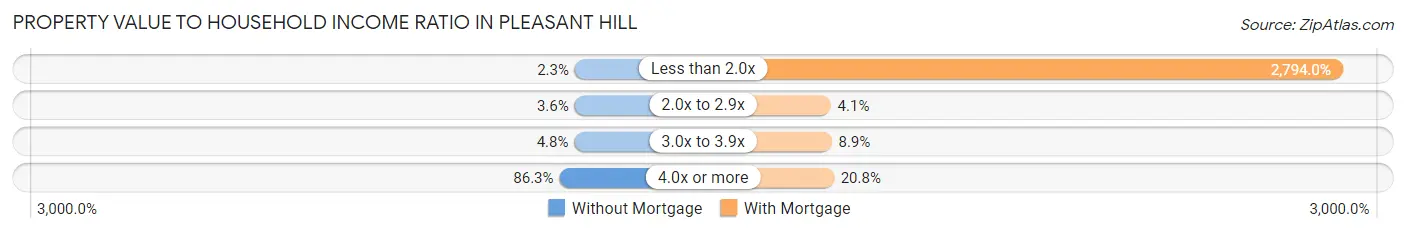
| Value-to-Income Ratio | Without Mortgage | With Mortgage |
| Less than 2.0x | 48 (2.3%) | 187,224 (2,794.0%) |
| 2.0x to 2.9x | 75 (3.6%) | 275 (4.1%) |
| 3.0x to 3.9x | 100 (4.8%) | 596 (8.9%) |
| 4.0x or more | 1,789 (86.3%) | 1,395 (20.8%) |
| Total | 2,072 (100.0%) | 6,701 (100.0%) |
Real Estate Taxes by Mortgage Status in Pleasant Hill
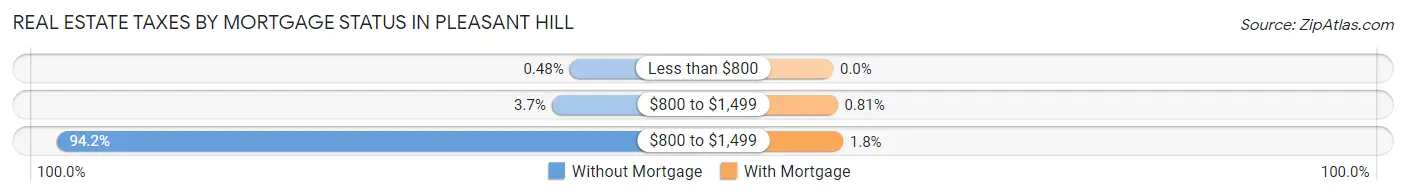
| Property Taxes | Without Mortgage | With Mortgage |
| Less than $800 | 10 (0.5%) | 0 (0.0%) |
| $800 to $1,499 | 77 (3.7%) | 54 (0.8%) |
| $800 to $1,499 | 1,951 (94.2%) | 120 (1.8%) |
| Total | 2,072 (100.0%) | 6,701 (100.0%) |
Health & Disability in Pleasant Hill
Health Insurance Coverage by Age in Pleasant Hill
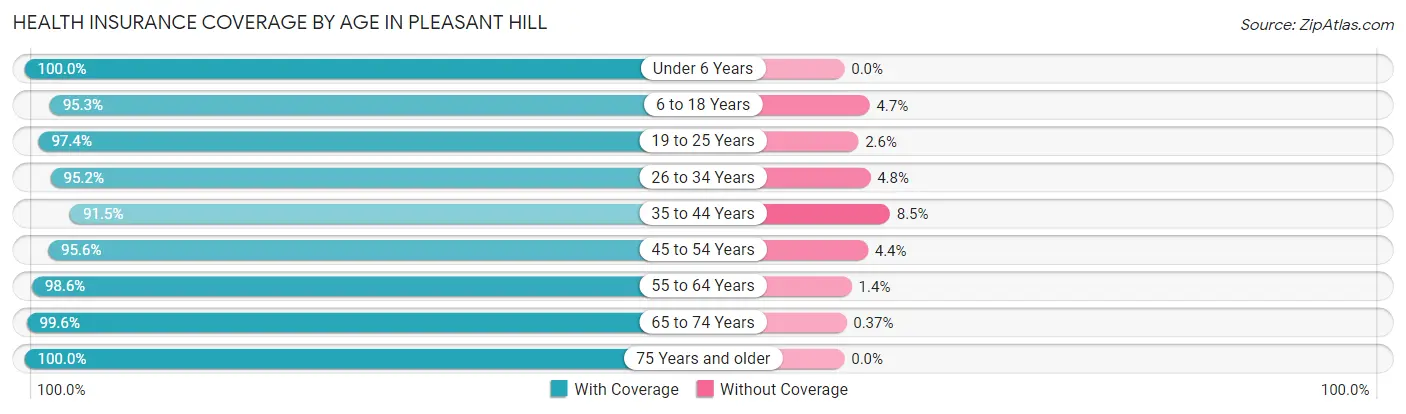
| Age Bracket | With Coverage | Without Coverage |
| Under 6 Years | 2,073 (100.0%) | 0 (0.0%) |
| 6 to 18 Years | 4,900 (95.3%) | 241 (4.7%) |
| 19 to 25 Years | 2,815 (97.4%) | 75 (2.6%) |
| 26 to 34 Years | 3,247 (95.2%) | 165 (4.8%) |
| 35 to 44 Years | 4,856 (91.5%) | 450 (8.5%) |
| 45 to 54 Years | 4,819 (95.6%) | 221 (4.4%) |
| 55 to 64 Years | 4,384 (98.6%) | 61 (1.4%) |
| 65 to 74 Years | 3,461 (99.6%) | 13 (0.4%) |
| 75 Years and older | 2,397 (100.0%) | 0 (0.0%) |
| Total | 32,952 (96.4%) | 1,226 (3.6%) |
Health Insurance Coverage by Citizenship Status in Pleasant Hill
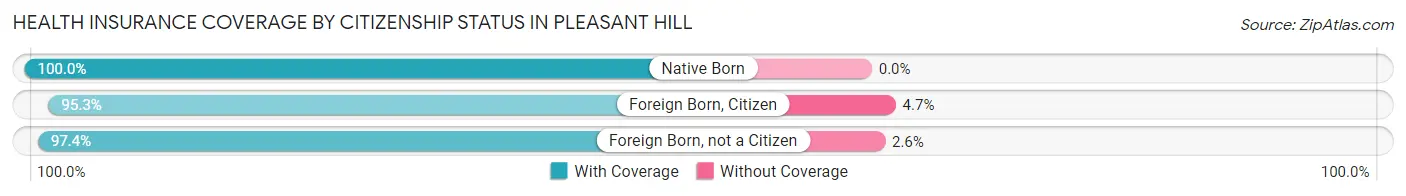
| Citizenship Status | With Coverage | Without Coverage |
| Native Born | 2,073 (100.0%) | 0 (0.0%) |
| Foreign Born, Citizen | 4,900 (95.3%) | 241 (4.7%) |
| Foreign Born, not a Citizen | 2,815 (97.4%) | 75 (2.6%) |
Health Insurance Coverage by Household Income in Pleasant Hill
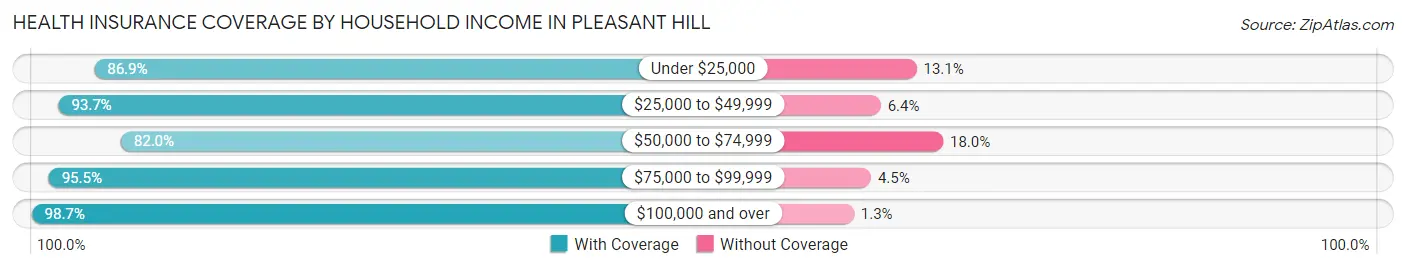
| Household Income | With Coverage | Without Coverage |
| Under $25,000 | 1,769 (86.9%) | 266 (13.1%) |
| $25,000 to $49,999 | 1,933 (93.6%) | 131 (6.4%) |
| $50,000 to $74,999 | 1,617 (82.0%) | 356 (18.0%) |
| $75,000 to $99,999 | 2,821 (95.5%) | 134 (4.5%) |
| $100,000 and over | 24,479 (98.7%) | 328 (1.3%) |
Public vs Private Health Insurance Coverage by Age in Pleasant Hill
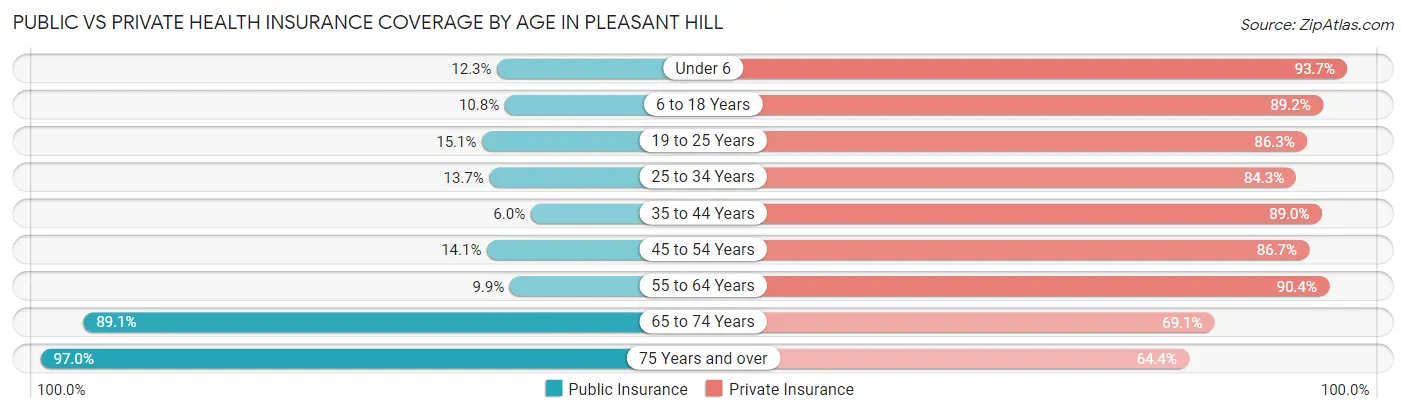
| Age Bracket | Public Insurance | Private Insurance |
| Under 6 | 254 (12.2%) | 1,943 (93.7%) |
| 6 to 18 Years | 557 (10.8%) | 4,587 (89.2%) |
| 19 to 25 Years | 435 (15.0%) | 2,493 (86.3%) |
| 25 to 34 Years | 467 (13.7%) | 2,877 (84.3%) |
| 35 to 44 Years | 319 (6.0%) | 4,723 (89.0%) |
| 45 to 54 Years | 712 (14.1%) | 4,369 (86.7%) |
| 55 to 64 Years | 440 (9.9%) | 4,018 (90.4%) |
| 65 to 74 Years | 3,096 (89.1%) | 2,402 (69.1%) |
| 75 Years and over | 2,326 (97.0%) | 1,544 (64.4%) |
| Total | 8,606 (25.2%) | 28,956 (84.7%) |
Disability Status by Sex by Age in Pleasant Hill
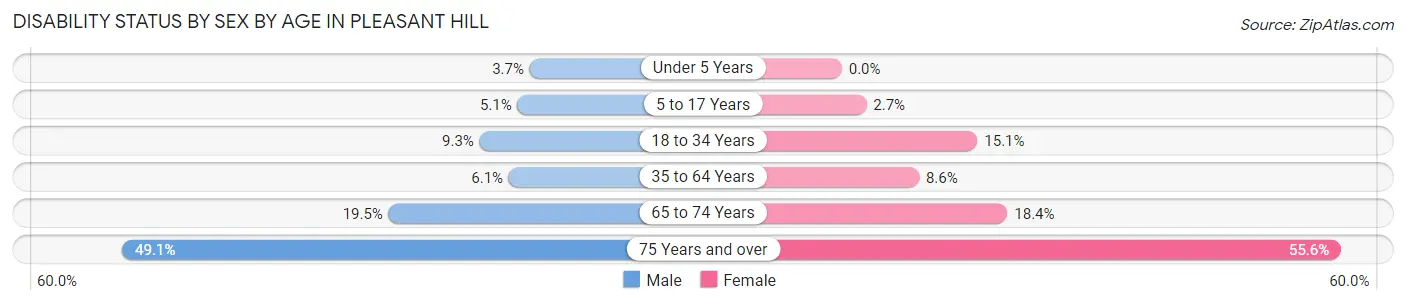
| Age Bracket | Male | Female |
| Under 5 Years | 32 (3.7%) | 0 (0.0%) |
| 5 to 17 Years | 144 (5.1%) | 62 (2.7%) |
| 18 to 34 Years | 313 (9.3%) | 505 (15.1%) |
| 35 to 64 Years | 439 (6.1%) | 648 (8.6%) |
| 65 to 74 Years | 297 (19.5%) | 359 (18.4%) |
| 75 Years and over | 485 (49.1%) | 784 (55.6%) |
Disability Class by Sex by Age in Pleasant Hill
Disability Class: Hearing Difficulty
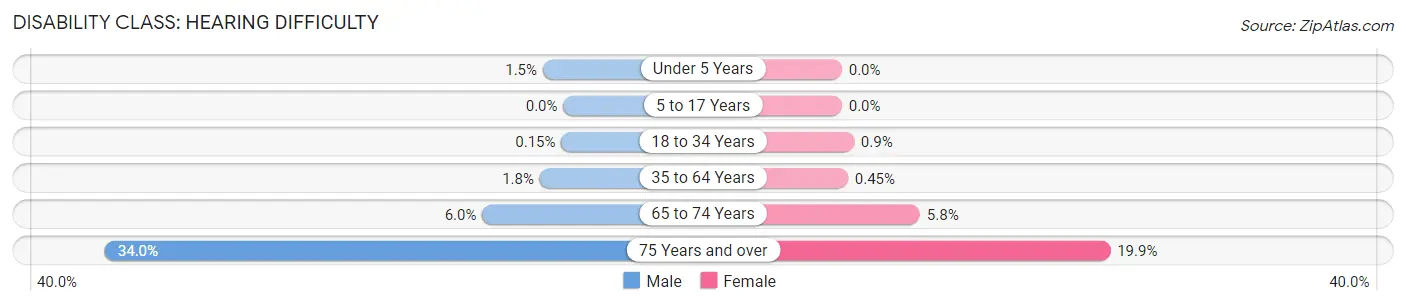
| Age Bracket | Male | Female |
| Under 5 Years | 13 (1.5%) | 0 (0.0%) |
| 5 to 17 Years | 0 (0.0%) | 0 (0.0%) |
| 18 to 34 Years | 5 (0.2%) | 30 (0.9%) |
| 35 to 64 Years | 127 (1.8%) | 34 (0.4%) |
| 65 to 74 Years | 92 (6.0%) | 113 (5.8%) |
| 75 Years and over | 336 (34.0%) | 281 (19.9%) |
Disability Class: Vision Difficulty
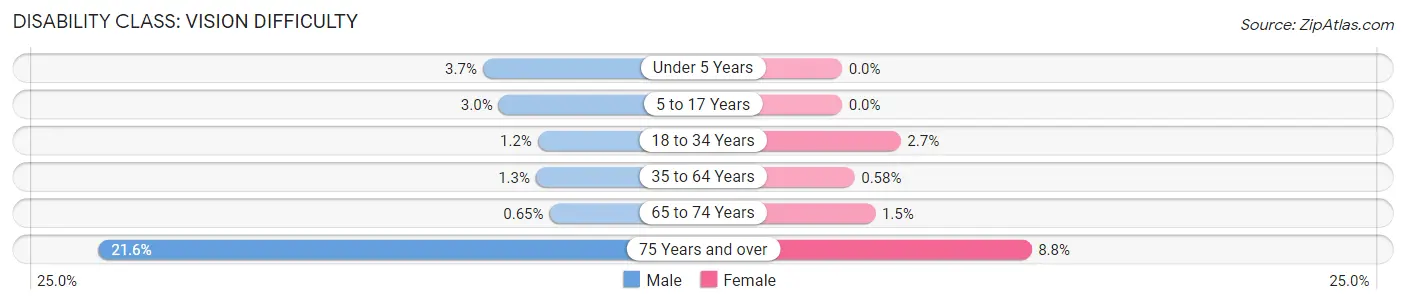
| Age Bracket | Male | Female |
| Under 5 Years | 32 (3.7%) | 0 (0.0%) |
| 5 to 17 Years | 85 (3.0%) | 0 (0.0%) |
| 18 to 34 Years | 40 (1.2%) | 91 (2.7%) |
| 35 to 64 Years | 93 (1.3%) | 44 (0.6%) |
| 65 to 74 Years | 10 (0.6%) | 30 (1.5%) |
| 75 Years and over | 213 (21.6%) | 124 (8.8%) |
Disability Class: Cognitive Difficulty
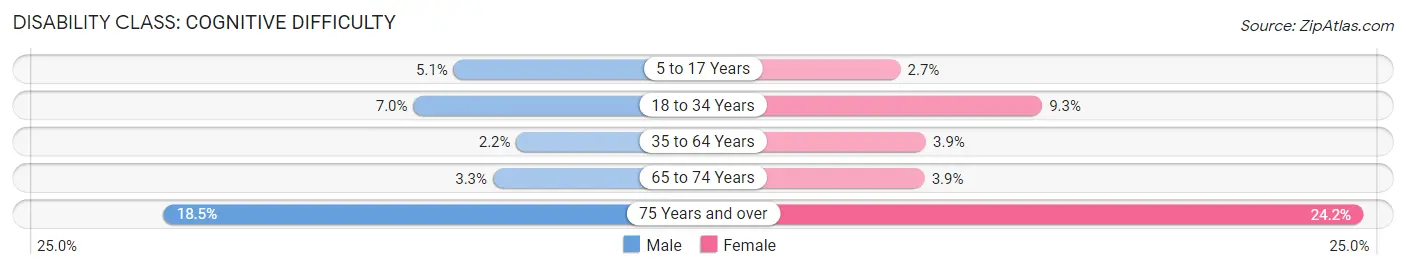
| Age Bracket | Male | Female |
| 5 to 17 Years | 144 (5.1%) | 62 (2.7%) |
| 18 to 34 Years | 234 (7.0%) | 311 (9.3%) |
| 35 to 64 Years | 158 (2.2%) | 295 (3.9%) |
| 65 to 74 Years | 50 (3.3%) | 75 (3.8%) |
| 75 Years and over | 183 (18.5%) | 341 (24.2%) |
Disability Class: Ambulatory Difficulty
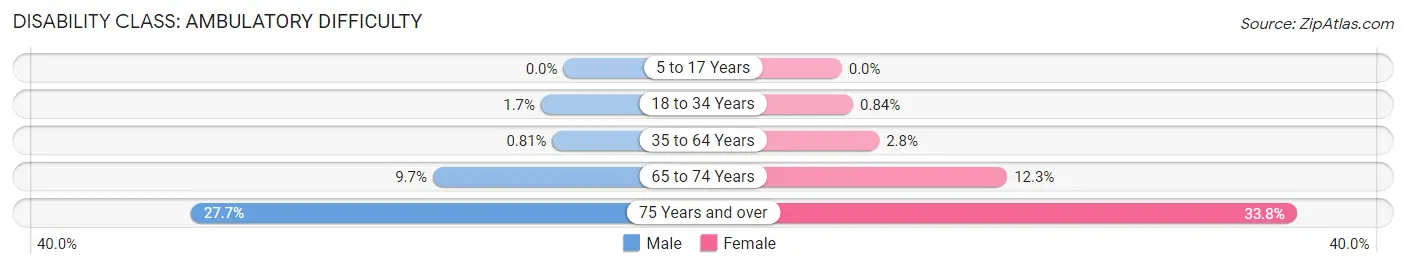
| Age Bracket | Male | Female |
| 5 to 17 Years | 0 (0.0%) | 0 (0.0%) |
| 18 to 34 Years | 56 (1.7%) | 28 (0.8%) |
| 35 to 64 Years | 59 (0.8%) | 210 (2.8%) |
| 65 to 74 Years | 148 (9.7%) | 239 (12.3%) |
| 75 Years and over | 273 (27.7%) | 476 (33.8%) |
Disability Class: Self-Care Difficulty
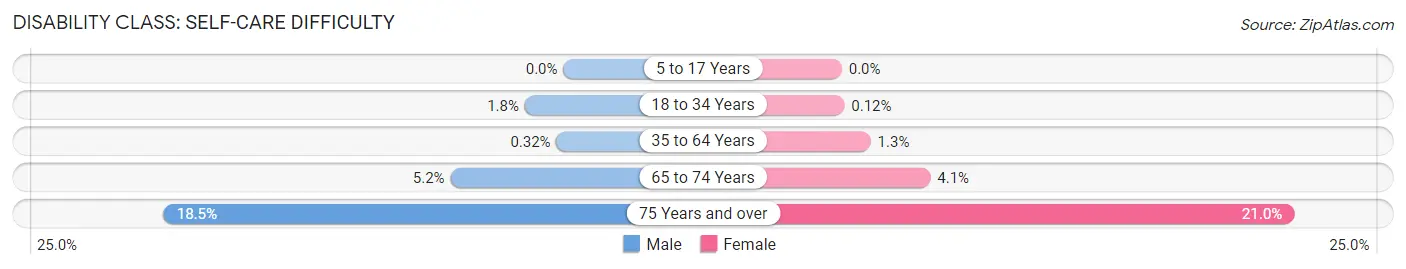
| Age Bracket | Male | Female |
| 5 to 17 Years | 0 (0.0%) | 0 (0.0%) |
| 18 to 34 Years | 60 (1.8%) | 4 (0.1%) |
| 35 to 64 Years | 23 (0.3%) | 101 (1.3%) |
| 65 to 74 Years | 80 (5.2%) | 80 (4.1%) |
| 75 Years and over | 183 (18.5%) | 296 (21.0%) |
Technology Access in Pleasant Hill
Computing Device Access in Pleasant Hill
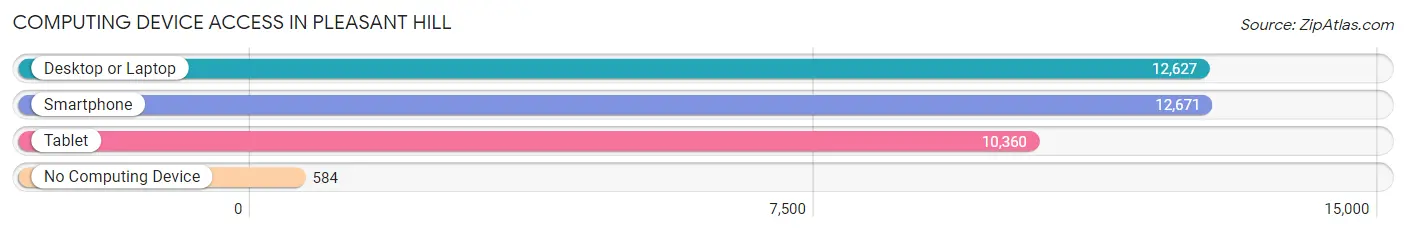
| Device Type | # Households | % Households |
| Desktop or Laptop | 12,627 | 91.4% |
| Smartphone | 12,671 | 91.7% |
| Tablet | 10,360 | 75.0% |
| No Computing Device | 584 | 4.2% |
| Total | 13,818 | 100.0% |
Internet Access in Pleasant Hill
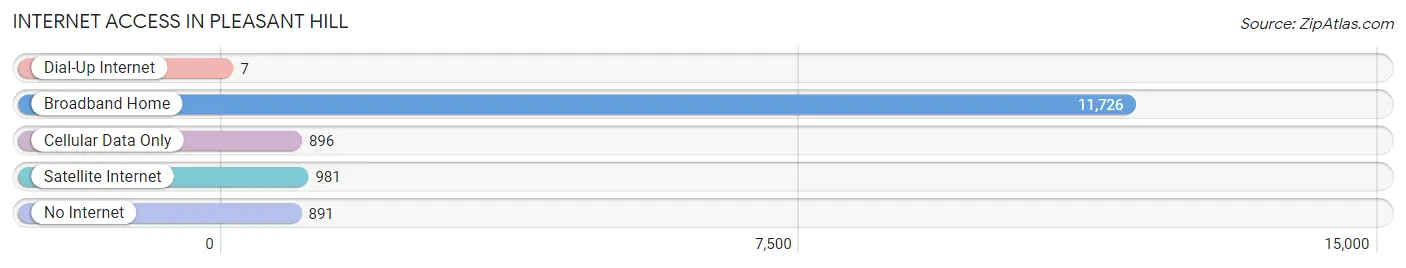
| Internet Type | # Households | % Households |
| Dial-Up Internet | 7 | 0.1% |
| Broadband Home | 11,726 | 84.9% |
| Cellular Data Only | 896 | 6.5% |
| Satellite Internet | 981 | 7.1% |
| No Internet | 891 | 6.5% |
| Total | 13,818 | 100.0% |
Pleasant Hill Summary
Pleasant Hill is a city located in Contra Costa County, California, United States. It is a suburb of the San Francisco Bay Area and is located in the East Bay region of the Bay Area. The population was 33,152 at the 2010 census. It was incorporated in 1961.
Geography
Pleasant Hill is located at 37°57'19" North, 122°04'57" West (37.955278, -122.0825). It is situated in the San Francisco Bay Area, approximately 17 miles (27 km) east of San Francisco and 32 miles (51 km) northeast of San Jose.
The city is bordered by the cities of Walnut Creek to the north, Concord to the east, Martinez to the south, and Lafayette to the west. The city is located in the East Bay region of the Bay Area, and is part of the larger San Francisco-Oakland-Hayward metropolitan area.
The city is located in the San Ramon Valley, and is situated on the east side of the valley, near the foothills of the Diablo Range. The city is located at the base of Mount Diablo, and is surrounded by rolling hills and valleys.
Climate
Pleasant Hill has a Mediterranean climate, with warm, dry summers and mild, wet winters. The average annual temperature is 61°F (16°C). The average annual precipitation is 22.5 inches (572 mm).
Demographics
As of the 2010 census, the population of Pleasant Hill was 33,152. The racial makeup of the city was 68.2% White, 11.3% Asian, 8.2% African American, 0.5% Native American, 0.2% Pacific Islander, 6.7% from other races, and 5.1% from two or more races. Hispanic or Latino of any race were 14.3% of the population.
The median household income in Pleasant Hill was $90,845, and the median family income was $103,844. The per capita income was $41,845. About 4.2% of families and 5.7% of the population were below the poverty line, including 6.3% of those under age 18 and 4.2% of those age 65 or over.
Economy
Pleasant Hill is home to a variety of businesses, including retail stores, restaurants, and professional services. The city is also home to several corporate headquarters, including Safeway, Inc., Ross Stores, Inc., and Chevron Corporation.
The city is served by two major highways, Interstate 680 and State Route 24. The city is also served by BART, the Bay Area Rapid Transit system, which provides access to San Francisco and other Bay Area cities.
The city is home to Diablo Valley College, a two-year community college, and John F. Kennedy University, a private university.
Conclusion
Pleasant Hill is a city located in Contra Costa County, California, United States. It is a suburb of the San Francisco Bay Area and is located in the East Bay region of the Bay Area. The population was 33,152 at the 2010 census. It is situated in the San Francisco Bay Area, approximately 17 miles (27 km) east of San Francisco and 32 miles (51 km) northeast of San Jose. The city is bordered by the cities of Walnut Creek to the north, Concord to the east, Martinez to the south, and Lafayette to the west. The city is located in the East Bay region of the Bay Area, and is part of the larger San Francisco-Oakland-Hayward metropolitan area. Pleasant Hill has a Mediterranean climate, with warm, dry summers and mild, wet winters. The population of Pleasant Hill is diverse, with a majority of White, Asian, African American, and Hispanic or Latino residents. The city is home to a variety of businesses, including retail stores, restaurants, and professional services. The city is also home to several corporate headquarters, including Safeway, Inc., Ross Stores, Inc., and Chevron Corporation. Pleasant Hill is served by two major highways, Interstate 680 and State Route 24, and is also served by BART, the Bay Area Rapid Transit system. The city is home to Diablo Valley College, a two-year community college, and John F. Kennedy University, a private university.
Common Questions
What is Per Capita Income in Pleasant Hill?
Per Capita income in Pleasant Hill is $64,672.
What is the Median Family Income in Pleasant Hill?
Median Family Income in Pleasant Hill is $165,701.
What is the Median Household income in Pleasant Hill?
Median Household Income in Pleasant Hill is $137,685.
What is Income or Wage Gap in Pleasant Hill?
Income or Wage Gap in Pleasant Hill is 26.9%.
Women in Pleasant Hill earn 73.1 cents for every dollar earned by a man.
What is Inequality or Gini Index in Pleasant Hill?
Inequality or Gini Index in Pleasant Hill is 0.40.
What is the Total Population of Pleasant Hill?
Total Population of Pleasant Hill is 34,504.
What is the Total Male Population of Pleasant Hill?
Total Male Population of Pleasant Hill is 17,001.
What is the Total Female Population of Pleasant Hill?
Total Female Population of Pleasant Hill is 17,503.
What is the Ratio of Males per 100 Females in Pleasant Hill?
There are 97.13 Males per 100 Females in Pleasant Hill.
What is the Ratio of Females per 100 Males in Pleasant Hill?
There are 102.95 Females per 100 Males in Pleasant Hill.
What is the Median Population Age in Pleasant Hill?
Median Population Age in Pleasant Hill is 42.0 Years.
What is the Average Family Size in Pleasant Hill
Average Family Size in Pleasant Hill is 3.0 People.
What is the Average Household Size in Pleasant Hill
Average Household Size in Pleasant Hill is 2.5 People.
How Large is the Labor Force in Pleasant Hill?
There are 19,394 People in the Labor Forcein in Pleasant Hill.
What is the Percentage of People in the Labor Force in Pleasant Hill?
67.4% of People are in the Labor Force in Pleasant Hill.
What is the Unemployment Rate in Pleasant Hill?
Unemployment Rate in Pleasant Hill is 3.7%.