Deland, FL Map & Demographics
Deland Map
Deland Overview
$32,718
PER CAPITA INCOME
$85,904
AVG FAMILY INCOME
$71,439
AVG HOUSEHOLD INCOME
32.7%
WAGE / INCOME GAP [ % ]
67.3¢/ $1
WAGE / INCOME GAP [ $ ]
$6,329
FAMILY INCOME DEFICIT
0.43
INEQUALITY / GINI INDEX
38,392
TOTAL POPULATION
16,913
MALE POPULATION
21,479
FEMALE POPULATION
78.74
MALES / 100 FEMALES
127.00
FEMALES / 100 MALES
38.1
MEDIAN AGE
3.1
AVG FAMILY SIZE
2.5
AVG HOUSEHOLD SIZE
16,556
LABOR FORCE [ PEOPLE ]
53.0%
PERCENT IN LABOR FORCE
4.1%
UNEMPLOYMENT RATE
Deland Area Codes
Income in Deland
Income Overview in Deland
Per Capita Income in Deland is $32,718, while median incomes of families and households are $85,904 and $71,439 respectively.
| Characteristic | Number | Measure |
| Per Capita Income | 38,392 | $32,718 |
| Median Family Income | 9,069 | $85,904 |
| Mean Family Income | 9,069 | $104,531 |
| Median Household Income | 14,162 | $71,439 |
| Mean Household Income | 14,162 | $85,631 |
| Income Deficit | 9,069 | $6,329 |
| Wage / Income Gap (%) | 38,392 | 32.66% |
| Wage / Income Gap ($) | 38,392 | 67.34¢ per $1 |
| Gini / Inequality Index | 38,392 | 0.43 |
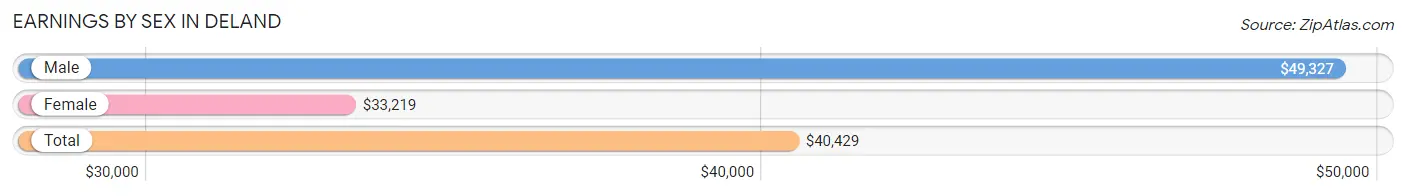
Earnings by Sex in Deland
Average Earnings in Deland are $40,429, $49,327 for men and $33,219 for women, a difference of 32.7%.
| Sex | Number | Average Earnings |
| Male | 8,082 (47.4%) | $49,327 |
| Female | 8,963 (52.6%) | $33,219 |
| Total | 17,045 (100.0%) | $40,429 |
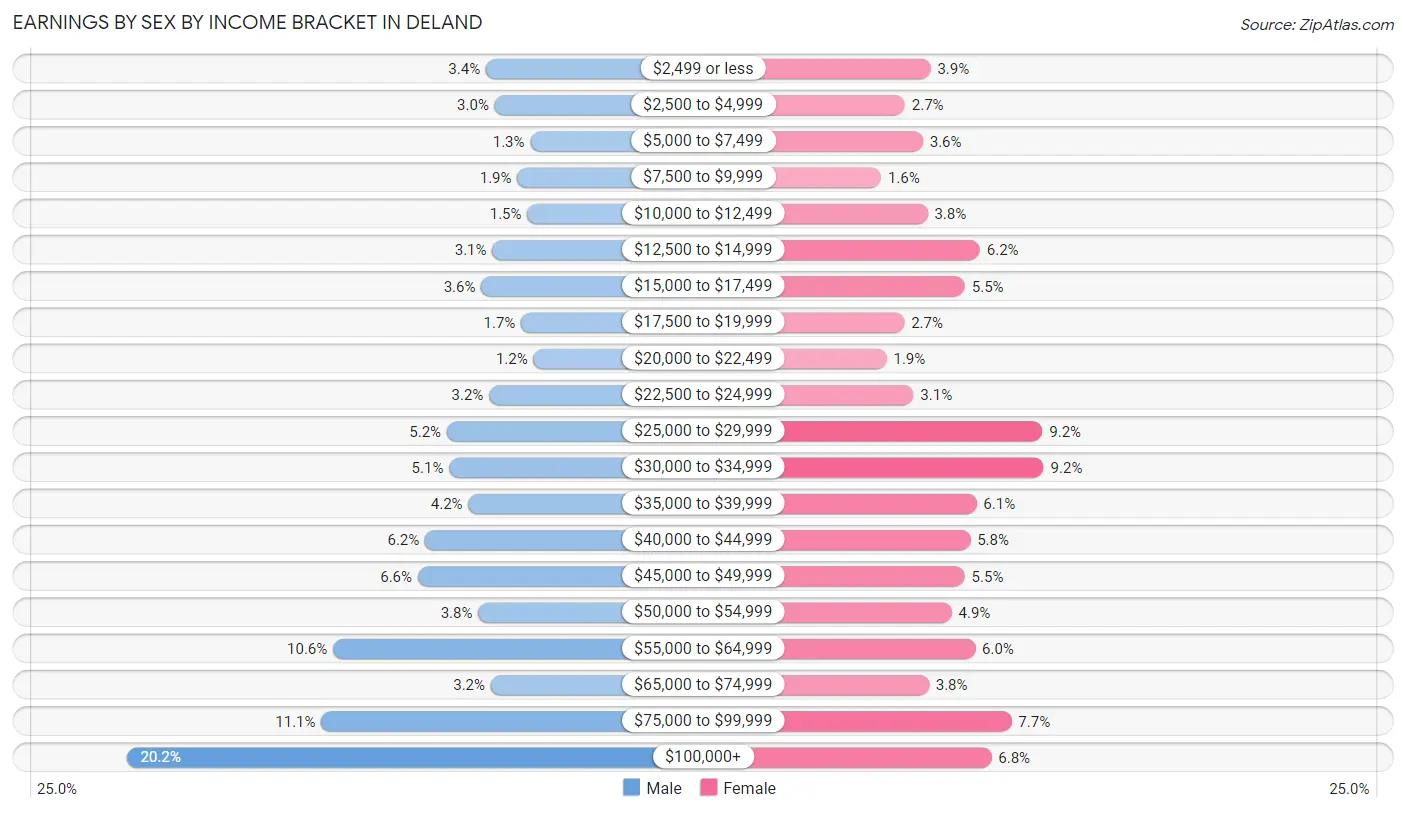
Earnings by Sex by Income Bracket in Deland
The most common earnings brackets in Deland are $100,000+ for men (1,631 | 20.2%) and $30,000 to $34,999 for women (826 | 9.2%).
| Income | Male | Female |
| $2,499 or less | 274 (3.4%) | 351 (3.9%) |
| $2,500 to $4,999 | 241 (3.0%) | 244 (2.7%) |
| $5,000 to $7,499 | 106 (1.3%) | 319 (3.6%) |
| $7,500 to $9,999 | 155 (1.9%) | 143 (1.6%) |
| $10,000 to $12,499 | 117 (1.5%) | 339 (3.8%) |
| $12,500 to $14,999 | 250 (3.1%) | 558 (6.2%) |
| $15,000 to $17,499 | 292 (3.6%) | 496 (5.5%) |
| $17,500 to $19,999 | 141 (1.7%) | 241 (2.7%) |
| $20,000 to $22,499 | 94 (1.2%) | 167 (1.9%) |
| $22,500 to $24,999 | 262 (3.2%) | 280 (3.1%) |
| $25,000 to $29,999 | 422 (5.2%) | 821 (9.2%) |
| $30,000 to $34,999 | 413 (5.1%) | 826 (9.2%) |
| $35,000 to $39,999 | 340 (4.2%) | 544 (6.1%) |
| $40,000 to $44,999 | 504 (6.2%) | 518 (5.8%) |
| $45,000 to $49,999 | 532 (6.6%) | 495 (5.5%) |
| $50,000 to $54,999 | 303 (3.7%) | 440 (4.9%) |
| $55,000 to $64,999 | 853 (10.5%) | 539 (6.0%) |
| $65,000 to $74,999 | 255 (3.2%) | 344 (3.8%) |
| $75,000 to $99,999 | 897 (11.1%) | 691 (7.7%) |
| $100,000+ | 1,631 (20.2%) | 607 (6.8%) |
| Total | 8,082 (100.0%) | 8,963 (100.0%) |
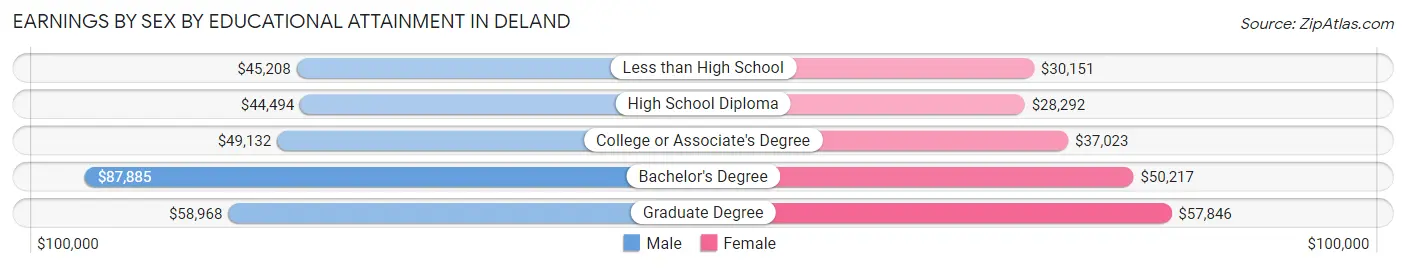
Earnings by Sex by Educational Attainment in Deland
Average earnings in Deland are $53,971 for men and $37,292 for women, a difference of 30.9%. Men with an educational attainment of bachelor's degree enjoy the highest average annual earnings of $87,885, while those with high school diploma education earn the least with $44,494. Women with an educational attainment of graduate degree earn the most with the average annual earnings of $57,846, while those with high school diploma education have the smallest earnings of $28,292.
| Educational Attainment | Male Income | Female Income |
| Less than High School | $45,208 | $30,151 |
| High School Diploma | $44,494 | $28,292 |
| College or Associate's Degree | $49,132 | $37,023 |
| Bachelor's Degree | $87,885 | $50,217 |
| Graduate Degree | $58,968 | $57,846 |
| Total | $53,971 | $37,292 |
Family Income in Deland
Family Income Brackets in Deland
According to the Deland family income data, there are 2,167 families falling into the $75,000 to $99,999 income range, which is the most common income bracket and makes up 23.9% of all families. Conversely, the less than $10,000 income bracket is the least frequent group with only 82 families (0.9%) belonging to this category.
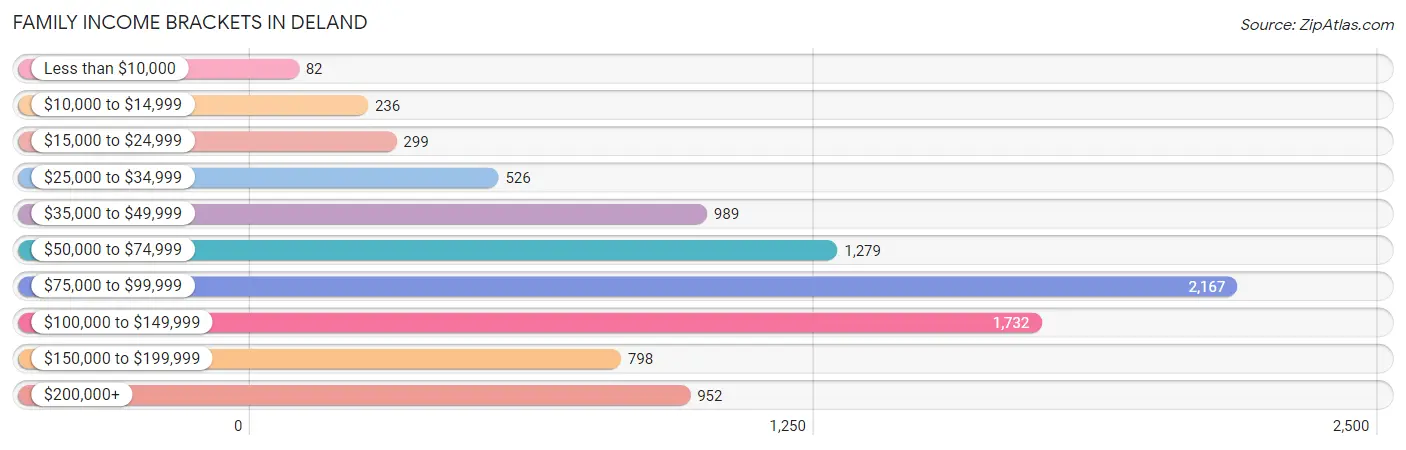
| Income Bracket | # Families | % Families |
| Less than $10,000 | 82 | 0.9% |
| $10,000 to $14,999 | 236 | 2.6% |
| $15,000 to $24,999 | 299 | 3.3% |
| $25,000 to $34,999 | 526 | 5.8% |
| $35,000 to $49,999 | 989 | 10.9% |
| $50,000 to $74,999 | 1,279 | 14.1% |
| $75,000 to $99,999 | 2,167 | 23.9% |
| $100,000 to $149,999 | 1,732 | 19.1% |
| $150,000 to $199,999 | 798 | 8.8% |
| $200,000+ | 952 | 10.5% |
Family Income by Famaliy Size in Deland
5-person families (654 | 7.2%) account for the highest median family income in Deland with $119,265 per family, while 2-person families (4,916 | 54.2%) have the highest median income of $39,223 per family member.
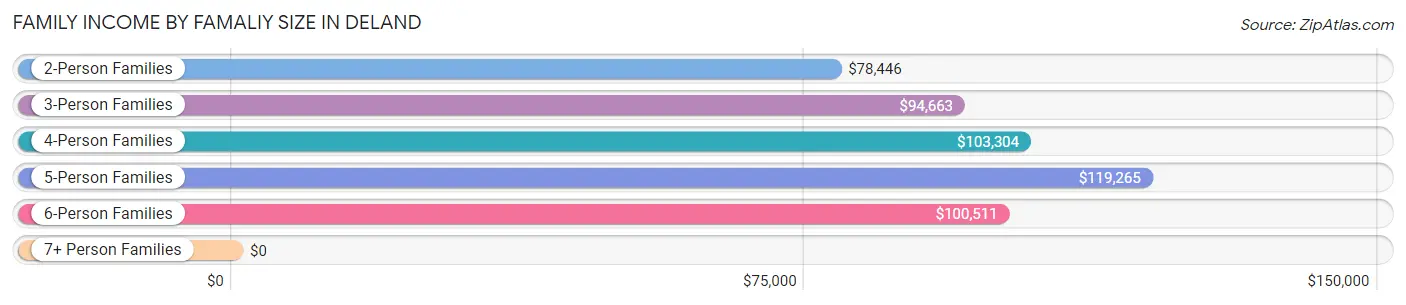
| Income Bracket | # Families | Median Income |
| 2-Person Families | 4,916 (54.2%) | $78,446 |
| 3-Person Families | 1,559 (17.2%) | $94,663 |
| 4-Person Families | 1,531 (16.9%) | $103,304 |
| 5-Person Families | 654 (7.2%) | $119,265 |
| 6-Person Families | 392 (4.3%) | $100,511 |
| 7+ Person Families | 17 (0.2%) | $0 |
| Total | 9,069 (100.0%) | $85,904 |
Family Income by Number of Earners in Deland
The median family income in Deland is $85,904, with families comprising 3+ earners (754) having the highest median family income of $126,351, while families with no earners (1,671) have the lowest median family income of $67,250, accounting for 8.3% and 18.4% of families, respectively.
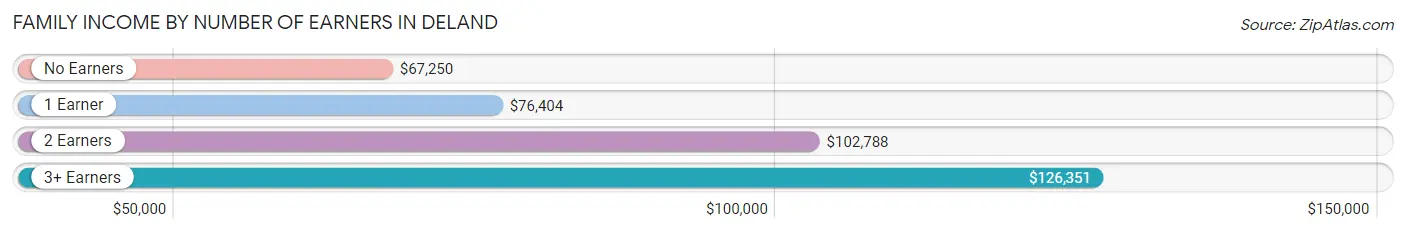
| Number of Earners | # Families | Median Income |
| No Earners | 1,671 (18.4%) | $67,250 |
| 1 Earner | 2,970 (32.8%) | $76,404 |
| 2 Earners | 3,674 (40.5%) | $102,788 |
| 3+ Earners | 754 (8.3%) | $126,351 |
| Total | 9,069 (100.0%) | $85,904 |
Household Income in Deland
Household Income Brackets in Deland
With 2,677 households falling in the category, the $75,000 to $99,999 income range is the most frequent in Deland, accounting for 18.9% of all households. In contrast, only 538 households (3.8%) fall into the less than $10,000 income bracket, making it the least populous group.
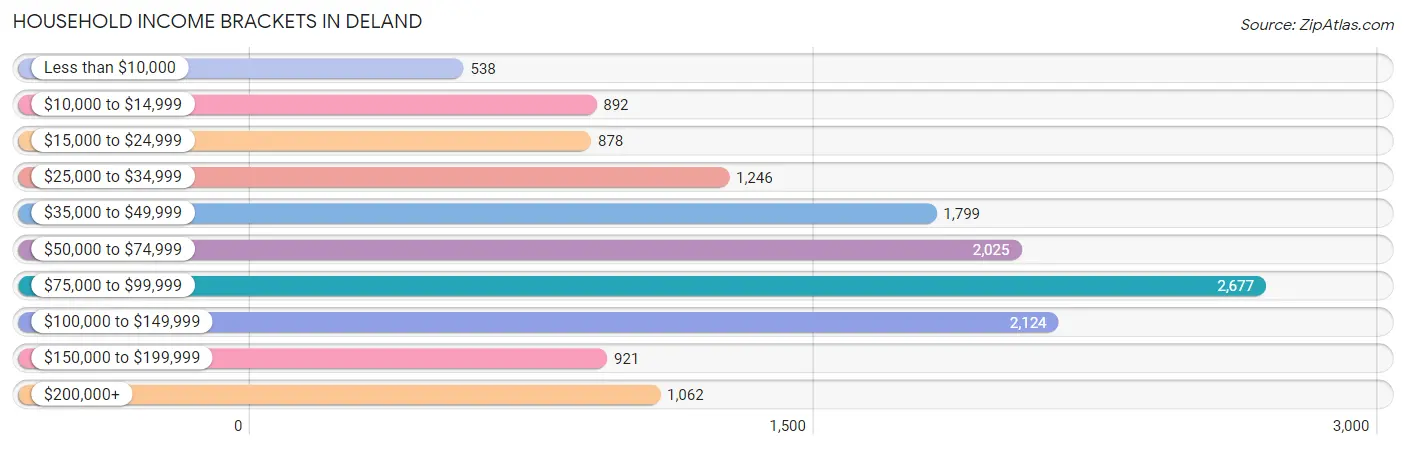
| Income Bracket | # Households | % Households |
| Less than $10,000 | 538 | 3.8% |
| $10,000 to $14,999 | 892 | 6.3% |
| $15,000 to $24,999 | 878 | 6.2% |
| $25,000 to $34,999 | 1,246 | 8.8% |
| $35,000 to $49,999 | 1,799 | 12.7% |
| $50,000 to $74,999 | 2,025 | 14.3% |
| $75,000 to $99,999 | 2,677 | 18.9% |
| $100,000 to $149,999 | 2,124 | 15.0% |
| $150,000 to $199,999 | 921 | 6.5% |
| $200,000+ | 1,062 | 7.5% |
Household Income by Householder Age in Deland
The median household income in Deland is $71,439, with the highest median household income of $83,665 found in the 45 to 64 years age bracket for the primary householder. A total of 4,964 households (35.0%) fall into this category. Meanwhile, the 65+ years age bracket for the primary householder has the lowest median household income of $44,727, with 4,468 households (31.6%) in this group.
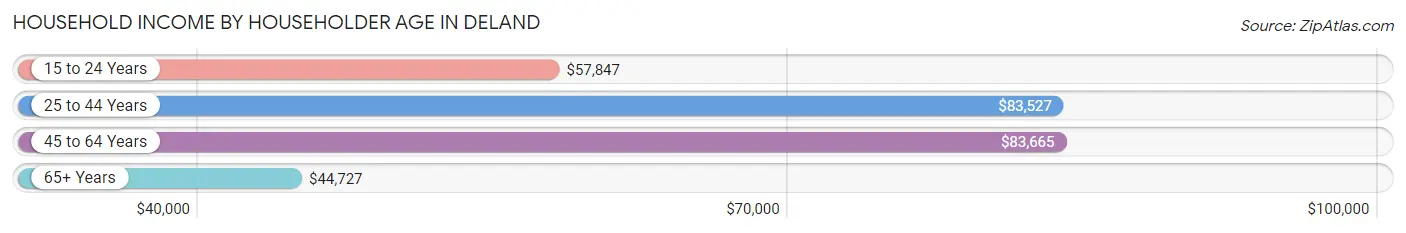
| Income Bracket | # Households | Median Income |
| 15 to 24 Years | 608 (4.3%) | $57,847 |
| 25 to 44 Years | 4,122 (29.1%) | $83,527 |
| 45 to 64 Years | 4,964 (35.0%) | $83,665 |
| 65+ Years | 4,468 (31.6%) | $44,727 |
| Total | 14,162 (100.0%) | $71,439 |
Poverty in Deland
Income Below Poverty by Sex and Age in Deland
With 9.5% poverty level for males and 10.3% for females among the residents of Deland, 55 to 64 year old males and 6 to 11 year old females are the most vulnerable to poverty, with 280 males (17.2%) and 217 females (16.7%) in their respective age groups living below the poverty level.
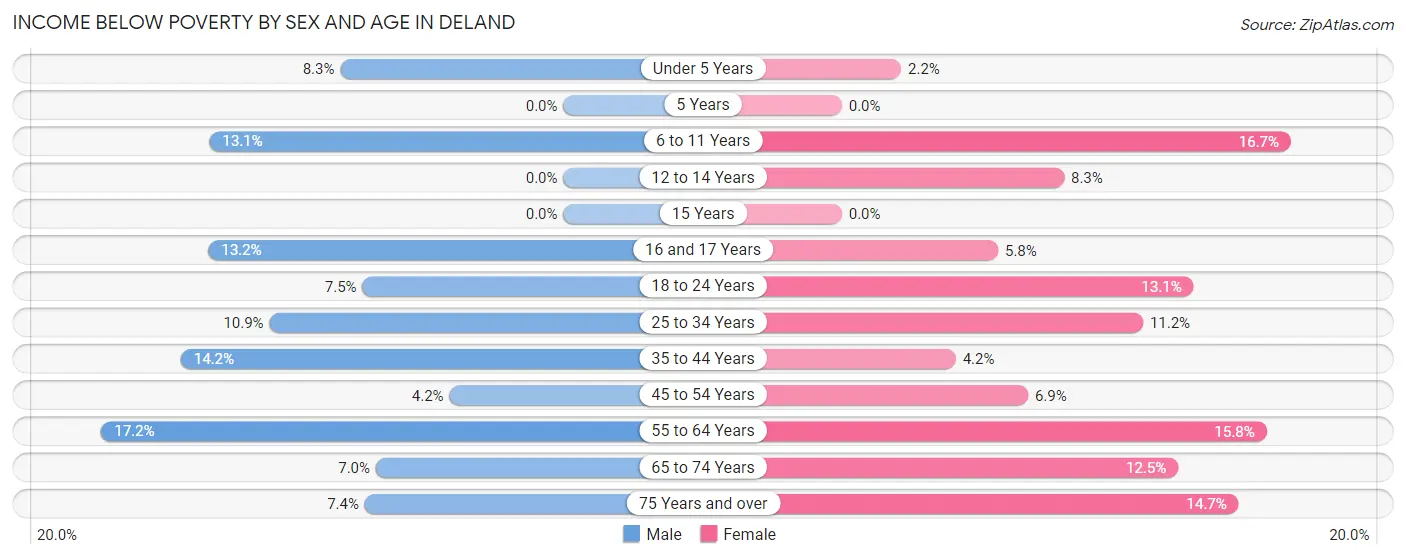
| Age Bracket | Male | Female |
| Under 5 Years | 75 (8.3%) | 37 (2.2%) |
| 5 Years | 0 (0.0%) | 0 (0.0%) |
| 6 to 11 Years | 194 (13.1%) | 217 (16.7%) |
| 12 to 14 Years | 0 (0.0%) | 40 (8.3%) |
| 15 Years | 0 (0.0%) | 0 (0.0%) |
| 16 and 17 Years | 39 (13.2%) | 43 (5.8%) |
| 18 to 24 Years | 104 (7.5%) | 181 (13.1%) |
| 25 to 34 Years | 196 (10.9%) | 243 (11.2%) |
| 35 to 44 Years | 300 (14.2%) | 98 (4.2%) |
| 45 to 54 Years | 82 (4.2%) | 155 (6.9%) |
| 55 to 64 Years | 280 (17.2%) | 408 (15.8%) |
| 65 to 74 Years | 120 (7.0%) | 291 (12.5%) |
| 75 Years and over | 87 (7.4%) | 291 (14.7%) |
| Total | 1,477 (9.5%) | 2,004 (10.3%) |
Income Above Poverty by Sex and Age in Deland
According to the poverty statistics in Deland, males aged 5 years and females aged 5 years are the age groups that are most secure financially, with 100.0% of males and 100.0% of females in these age groups living above the poverty line.
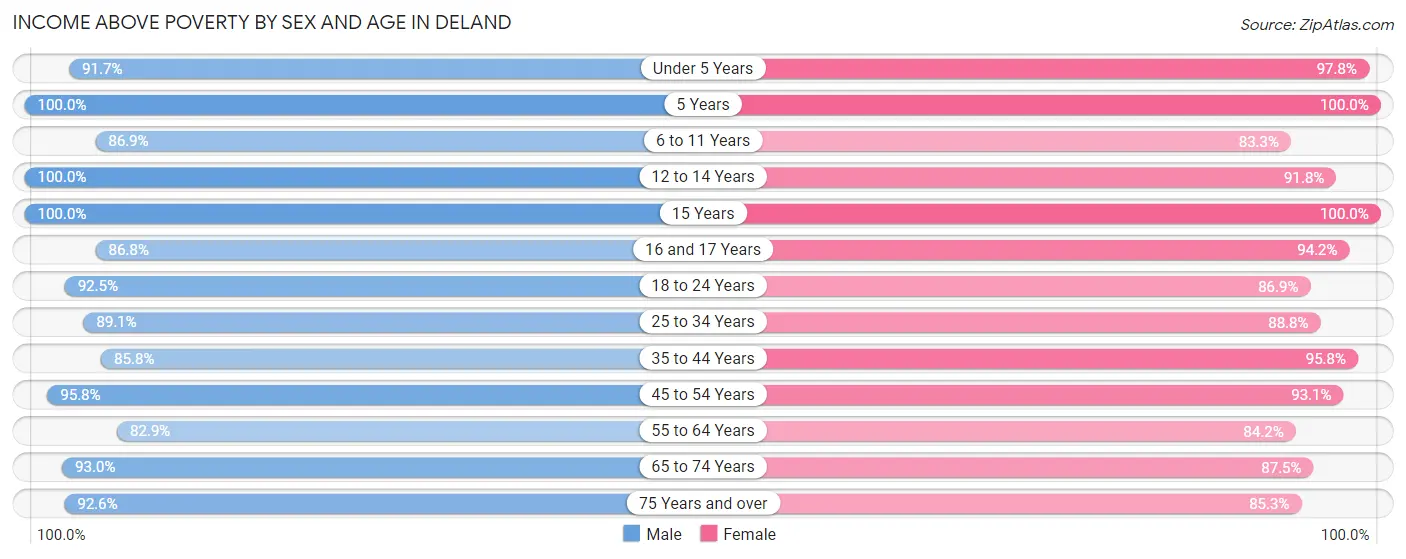
| Age Bracket | Male | Female |
| Under 5 Years | 831 (91.7%) | 1,646 (97.8%) |
| 5 Years | 166 (100.0%) | 73 (100.0%) |
| 6 to 11 Years | 1,282 (86.9%) | 1,085 (83.3%) |
| 12 to 14 Years | 588 (100.0%) | 445 (91.7%) |
| 15 Years | 278 (100.0%) | 153 (100.0%) |
| 16 and 17 Years | 257 (86.8%) | 699 (94.2%) |
| 18 to 24 Years | 1,291 (92.5%) | 1,205 (86.9%) |
| 25 to 34 Years | 1,601 (89.1%) | 1,930 (88.8%) |
| 35 to 44 Years | 1,813 (85.8%) | 2,221 (95.8%) |
| 45 to 54 Years | 1,855 (95.8%) | 2,088 (93.1%) |
| 55 to 64 Years | 1,353 (82.9%) | 2,179 (84.2%) |
| 65 to 74 Years | 1,603 (93.0%) | 2,040 (87.5%) |
| 75 Years and over | 1,094 (92.6%) | 1,685 (85.3%) |
| Total | 14,012 (90.5%) | 17,449 (89.7%) |
Income Below Poverty Among Married-Couple Families in Deland
The poverty statistics for married-couple families in Deland show that 2.3% or 151 of the total 6,565 families live below the poverty line. Families with 3 or 4 children have the highest poverty rate of 12.3%, comprising of 63 families. On the other hand, families with 5 or more children have the lowest poverty rate of 0.0%, which includes 0 families.
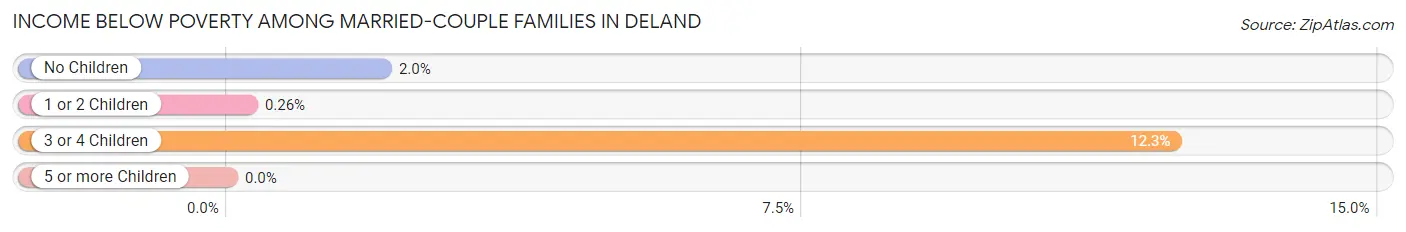
| Children | Above Poverty | Below Poverty |
| No Children | 4,055 (98.0%) | 83 (2.0%) |
| 1 or 2 Children | 1,902 (99.7%) | 5 (0.3%) |
| 3 or 4 Children | 448 (87.7%) | 63 (12.3%) |
| 5 or more Children | 9 (100.0%) | 0 (0.0%) |
| Total | 6,414 (97.7%) | 151 (2.3%) |
Income Below Poverty Among Single-Parent Households in Deland
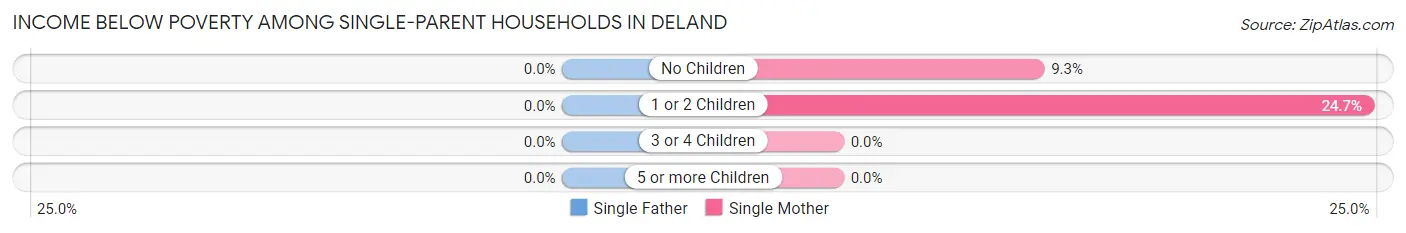
| Children | Single Father | Single Mother |
| No Children | 0 (0.0%) | 62 (9.3%) |
| 1 or 2 Children | 0 (0.0%) | 229 (24.7%) |
| 3 or 4 Children | 0 (0.0%) | 0 (0.0%) |
| 5 or more Children | 0 (0.0%) | 0 (0.0%) |
| Total | 0 (0.0%) | 291 (15.3%) |
Income Below Poverty Among Married-Couple vs Single-Parent Households in Deland
The poverty data for Deland shows that 151 of the married-couple family households (2.3%) and 291 of the single-parent households (11.6%) are living below the poverty level. Within the married-couple family households, those with 3 or 4 children have the highest poverty rate, with 63 households (12.3%) falling below the poverty line. Among the single-parent households, those with 1 or 2 children have the highest poverty rate, with 229 household (21.0%) living below poverty.
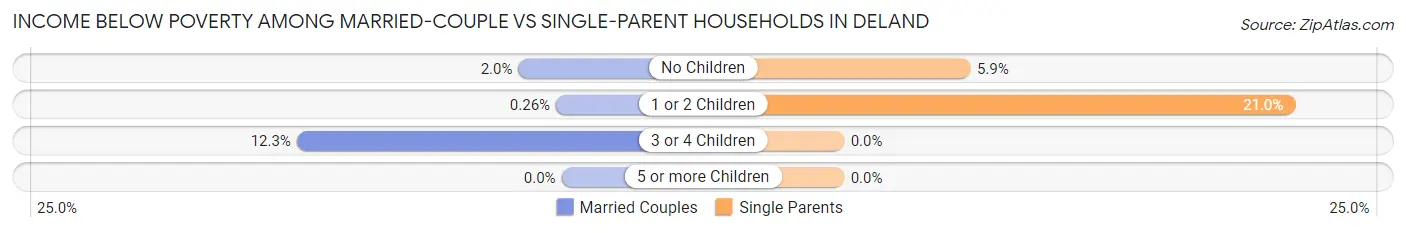
| Children | Married-Couple Families | Single-Parent Households |
| No Children | 83 (2.0%) | 62 (5.9%) |
| 1 or 2 Children | 5 (0.3%) | 229 (21.0%) |
| 3 or 4 Children | 63 (12.3%) | 0 (0.0%) |
| 5 or more Children | 0 (0.0%) | 0 (0.0%) |
| Total | 151 (2.3%) | 291 (11.6%) |
Race in Deland
The most populous races in Deland are White / Caucasian (26,422 | 68.8%), Hispanic or Latino (7,509 | 19.6%), and Black / African American (5,436 | 14.2%).
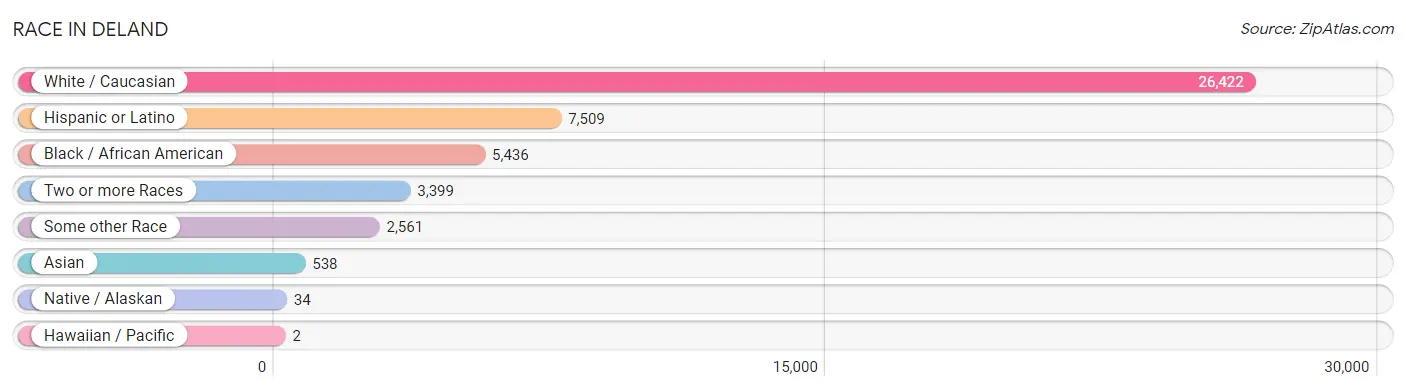
| Race | # Population | % Population |
| Asian | 538 | 1.4% |
| Black / African American | 5,436 | 14.2% |
| Hawaiian / Pacific | 2 | 0.0% |
| Hispanic or Latino | 7,509 | 19.6% |
| Native / Alaskan | 34 | 0.1% |
| White / Caucasian | 26,422 | 68.8% |
| Two or more Races | 3,399 | 8.8% |
| Some other Race | 2,561 | 6.7% |
| Total | 38,392 | 100.0% |
Ancestry in Deland
The most populous ancestries reported in Deland are English (3,759 | 9.8%), Puerto Rican (3,459 | 9.0%), German (2,841 | 7.4%), Irish (2,495 | 6.5%), and Mexican (2,350 | 6.1%), together accounting for 38.8% of all Deland residents.
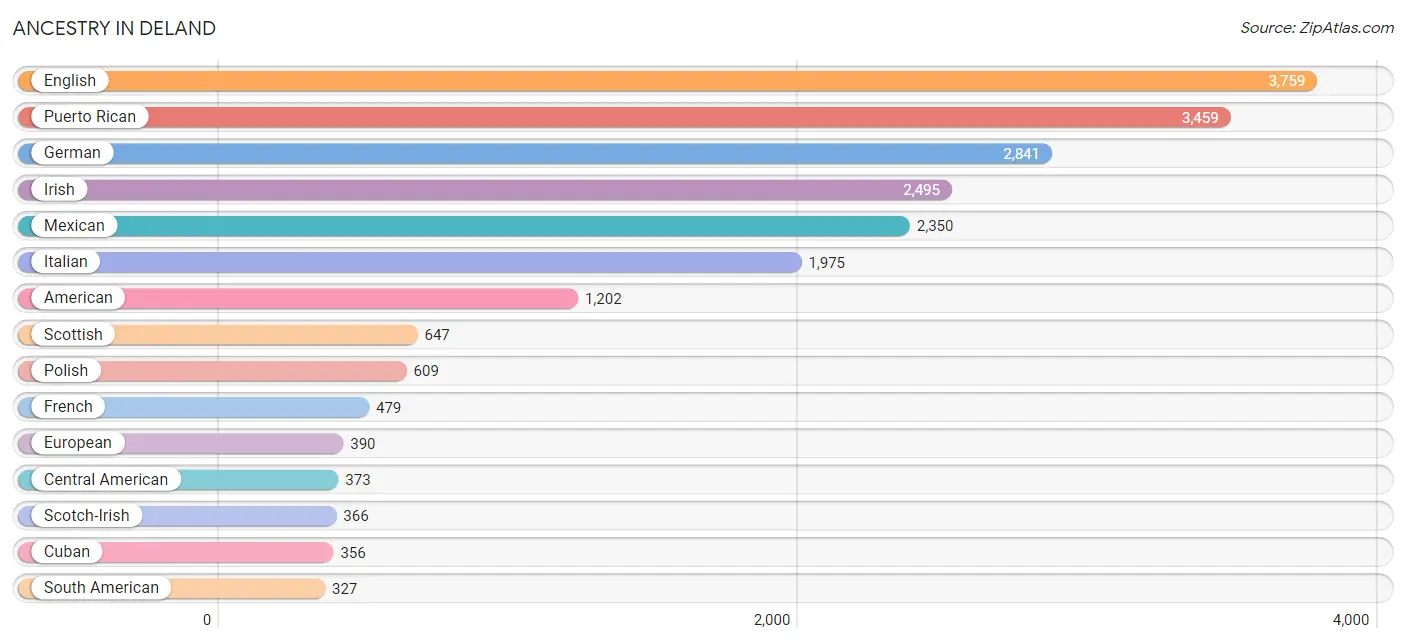
| Ancestry | # Population | % Population |
| African | 56 | 0.2% |
| Albanian | 4 | 0.0% |
| American | 1,202 | 3.1% |
| Arab | 121 | 0.3% |
| Argentinean | 20 | 0.1% |
| Armenian | 9 | 0.0% |
| Australian | 24 | 0.1% |
| Austrian | 81 | 0.2% |
| Bahamian | 50 | 0.1% |
| Barbadian | 13 | 0.0% |
| Bhutanese | 30 | 0.1% |
| Brazilian | 29 | 0.1% |
| British | 205 | 0.5% |
| Burmese | 94 | 0.2% |
| Canadian | 84 | 0.2% |
| Cape Verdean | 61 | 0.2% |
| Central American | 373 | 1.0% |
| Central American Indian | 50 | 0.1% |
| Cherokee | 23 | 0.1% |
| Chilean | 12 | 0.0% |
| Choctaw | 9 | 0.0% |
| Colombian | 75 | 0.2% |
| Croatian | 9 | 0.0% |
| Cuban | 356 | 0.9% |
| Czech | 88 | 0.2% |
| Czechoslovakian | 17 | 0.0% |
| Danish | 94 | 0.2% |
| Dominican | 66 | 0.2% |
| Dutch | 221 | 0.6% |
| Eastern European | 55 | 0.1% |
| Ecuadorian | 13 | 0.0% |
| English | 3,759 | 9.8% |
| Estonian | 14 | 0.0% |
| Ethiopian | 64 | 0.2% |
| European | 390 | 1.0% |
| Finnish | 14 | 0.0% |
| French | 479 | 1.3% |
| French Canadian | 107 | 0.3% |
| German | 2,841 | 7.4% |
| Greek | 212 | 0.5% |
| Guatemalan | 102 | 0.3% |
| Guyanese | 33 | 0.1% |
| Haitian | 152 | 0.4% |
| Honduran | 36 | 0.1% |
| Hungarian | 222 | 0.6% |
| Indian (Asian) | 214 | 0.6% |
| Irish | 2,495 | 6.5% |
| Israeli | 25 | 0.1% |
| Italian | 1,975 | 5.1% |
| Jamaican | 20 | 0.1% |
| Japanese | 11 | 0.0% |
| Korean | 42 | 0.1% |
| Lebanese | 89 | 0.2% |
| Lithuanian | 95 | 0.3% |
| Lumbee | 8 | 0.0% |
| Mexican | 2,350 | 6.1% |
| Mexican American Indian | 7 | 0.0% |
| Native Hawaiian | 6 | 0.0% |
| Nicaraguan | 35 | 0.1% |
| Northern European | 8 | 0.0% |
| Norwegian | 274 | 0.7% |
| Palestinian | 11 | 0.0% |
| Panamanian | 104 | 0.3% |
| Peruvian | 90 | 0.2% |
| Polish | 609 | 1.6% |
| Portuguese | 105 | 0.3% |
| Puerto Rican | 3,459 | 9.0% |
| Romanian | 53 | 0.1% |
| Russian | 182 | 0.5% |
| Salvadoran | 96 | 0.3% |
| Scandinavian | 96 | 0.3% |
| Scotch-Irish | 366 | 0.9% |
| Scottish | 647 | 1.7% |
| Serbian | 59 | 0.2% |
| Slavic | 14 | 0.0% |
| Slovak | 64 | 0.2% |
| Somali | 28 | 0.1% |
| South American | 327 | 0.9% |
| Spaniard | 40 | 0.1% |
| Spanish | 97 | 0.3% |
| Sri Lankan | 161 | 0.4% |
| Subsaharan African | 209 | 0.5% |
| Swedish | 128 | 0.3% |
| Swiss | 87 | 0.2% |
| Syrian | 12 | 0.0% |
| Thai | 116 | 0.3% |
| Trinidadian and Tobagonian | 31 | 0.1% |
| Ukrainian | 51 | 0.1% |
| Venezuelan | 117 | 0.3% |
| Welsh | 196 | 0.5% |
| West Indian | 9 | 0.0% | View All 91 Rows |
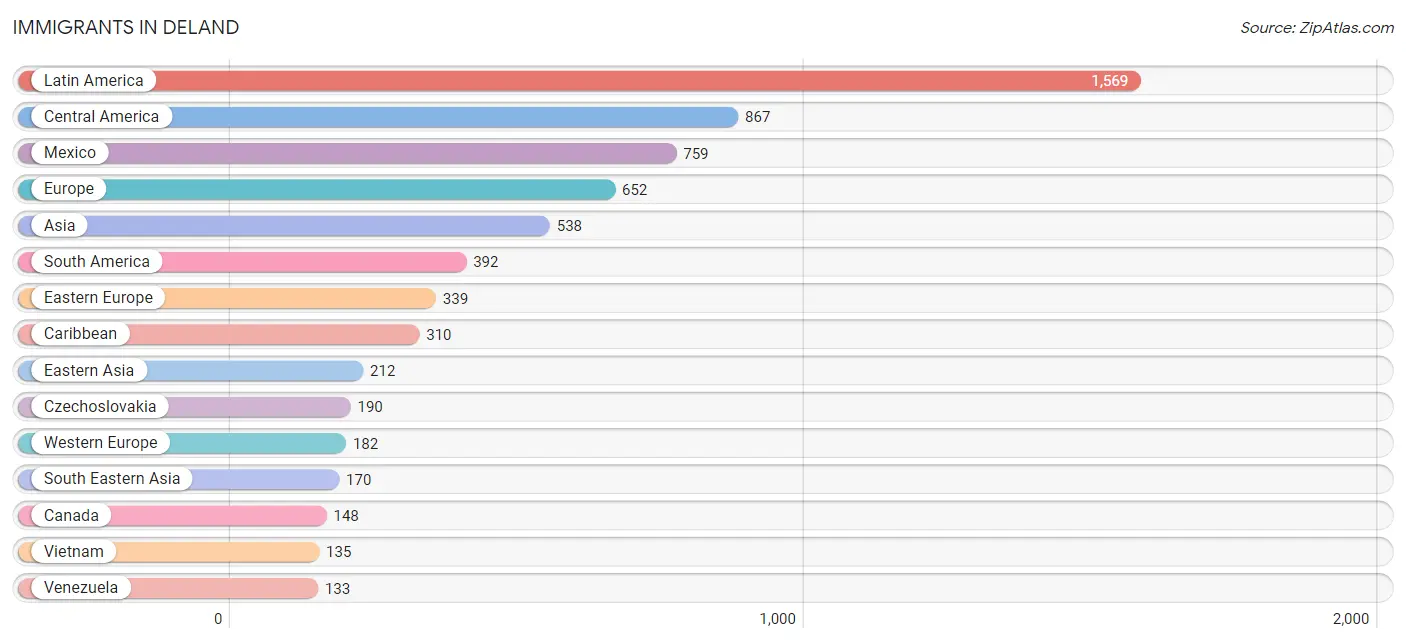
Immigrants in Deland
The most numerous immigrant groups reported in Deland came from Latin America (1,569 | 4.1%), Central America (867 | 2.3%), Mexico (759 | 2.0%), Europe (652 | 1.7%), and Asia (538 | 1.4%), together accounting for 11.4% of all Deland residents.
| Immigration Origin | # Population | % Population |
| Africa | 81 | 0.2% |
| Argentina | 21 | 0.1% |
| Asia | 538 | 1.4% |
| Australia | 11 | 0.0% |
| Bahamas | 3 | 0.0% |
| Bangladesh | 17 | 0.0% |
| Barbados | 13 | 0.0% |
| Belgium | 13 | 0.0% |
| Brazil | 113 | 0.3% |
| Canada | 148 | 0.4% |
| Caribbean | 310 | 0.8% |
| Central America | 867 | 2.3% |
| Chile | 12 | 0.0% |
| China | 92 | 0.2% |
| Colombia | 19 | 0.1% |
| Cuba | 54 | 0.1% |
| Czechoslovakia | 190 | 0.5% |
| Dominican Republic | 48 | 0.1% |
| Eastern Africa | 48 | 0.1% |
| Eastern Asia | 212 | 0.5% |
| Eastern Europe | 339 | 0.9% |
| Ecuador | 13 | 0.0% |
| El Salvador | 36 | 0.1% |
| England | 25 | 0.1% |
| Europe | 652 | 1.7% |
| Germany | 128 | 0.3% |
| Guatemala | 16 | 0.0% |
| Guyana | 33 | 0.1% |
| Haiti | 114 | 0.3% |
| Honduras | 16 | 0.0% |
| India | 53 | 0.1% |
| Indonesia | 9 | 0.0% |
| Israel | 24 | 0.1% |
| Italy | 13 | 0.0% |
| Jamaica | 25 | 0.1% |
| Kenya | 9 | 0.0% |
| Korea | 120 | 0.3% |
| Latin America | 1,569 | 4.1% |
| Lebanon | 9 | 0.0% |
| Lithuania | 27 | 0.1% |
| Mexico | 759 | 2.0% |
| Netherlands | 20 | 0.1% |
| North Macedonia | 76 | 0.2% |
| Northern Europe | 110 | 0.3% |
| Norway | 24 | 0.1% |
| Oceania | 11 | 0.0% |
| Panama | 40 | 0.1% |
| Peru | 48 | 0.1% |
| Philippines | 26 | 0.1% |
| Portugal | 8 | 0.0% |
| Russia | 33 | 0.1% |
| Saudi Arabia | 24 | 0.1% |
| Somalia | 39 | 0.1% |
| South Africa | 33 | 0.1% |
| South America | 392 | 1.0% |
| South Central Asia | 70 | 0.2% |
| South Eastern Asia | 170 | 0.4% |
| Southern Europe | 21 | 0.1% |
| Sweden | 6 | 0.0% |
| Switzerland | 21 | 0.1% |
| Trinidad and Tobago | 41 | 0.1% |
| Ukraine | 13 | 0.0% |
| Venezuela | 133 | 0.4% |
| Vietnam | 135 | 0.4% |
| Western Asia | 75 | 0.2% |
| Western Europe | 182 | 0.5% | View All 66 Rows |
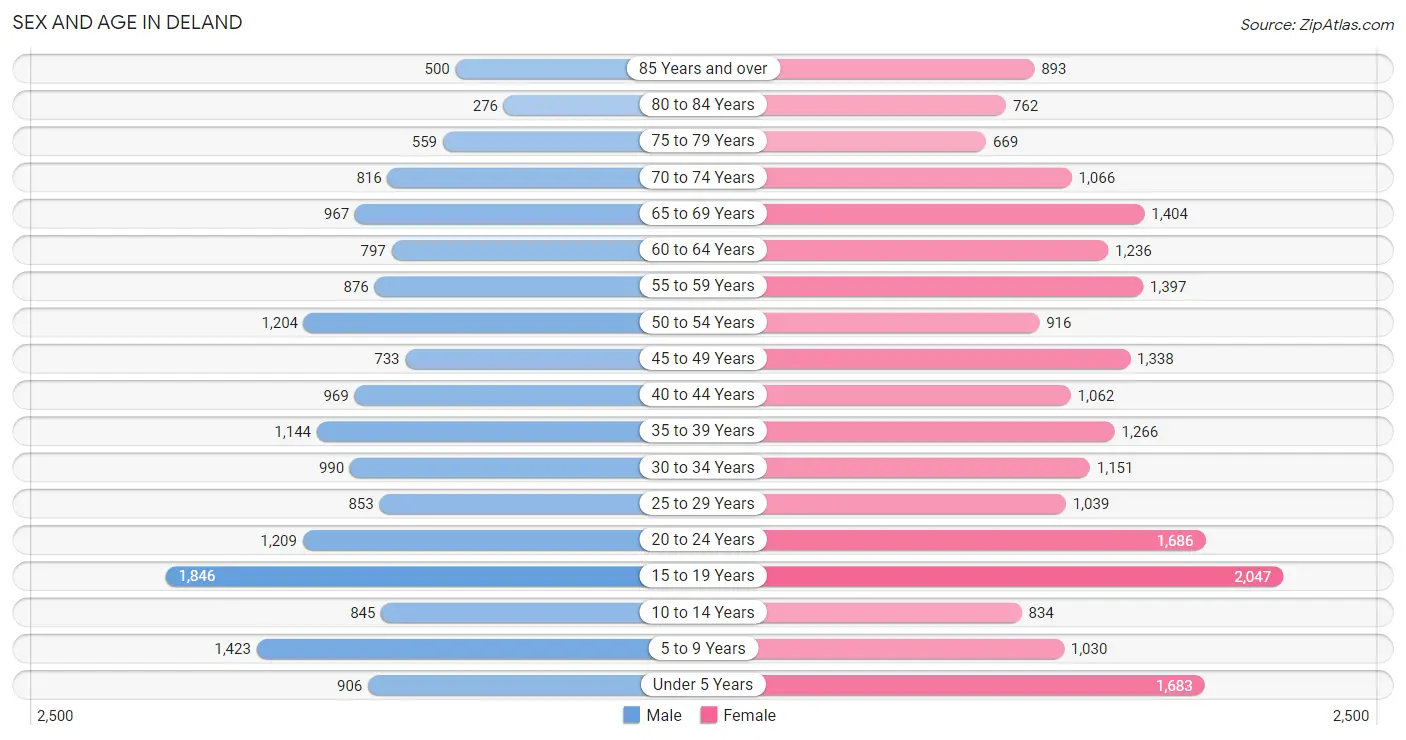
Sex and Age in Deland
Sex and Age in Deland
The most populous age groups in Deland are 15 to 19 Years (1,846 | 10.9%) for men and 15 to 19 Years (2,047 | 9.5%) for women.
| Age Bracket | Male | Female |
| Under 5 Years | 906 (5.4%) | 1,683 (7.8%) |
| 5 to 9 Years | 1,423 (8.4%) | 1,030 (4.8%) |
| 10 to 14 Years | 845 (5.0%) | 834 (3.9%) |
| 15 to 19 Years | 1,846 (10.9%) | 2,047 (9.5%) |
| 20 to 24 Years | 1,209 (7.1%) | 1,686 (7.9%) |
| 25 to 29 Years | 853 (5.0%) | 1,039 (4.8%) |
| 30 to 34 Years | 990 (5.9%) | 1,151 (5.4%) |
| 35 to 39 Years | 1,144 (6.8%) | 1,266 (5.9%) |
| 40 to 44 Years | 969 (5.7%) | 1,062 (4.9%) |
| 45 to 49 Years | 733 (4.3%) | 1,338 (6.2%) |
| 50 to 54 Years | 1,204 (7.1%) | 916 (4.3%) |
| 55 to 59 Years | 876 (5.2%) | 1,397 (6.5%) |
| 60 to 64 Years | 797 (4.7%) | 1,236 (5.8%) |
| 65 to 69 Years | 967 (5.7%) | 1,404 (6.5%) |
| 70 to 74 Years | 816 (4.8%) | 1,066 (5.0%) |
| 75 to 79 Years | 559 (3.3%) | 669 (3.1%) |
| 80 to 84 Years | 276 (1.6%) | 762 (3.5%) |
| 85 Years and over | 500 (3.0%) | 893 (4.2%) |
| Total | 16,913 (100.0%) | 21,479 (100.0%) |
Families and Households in Deland
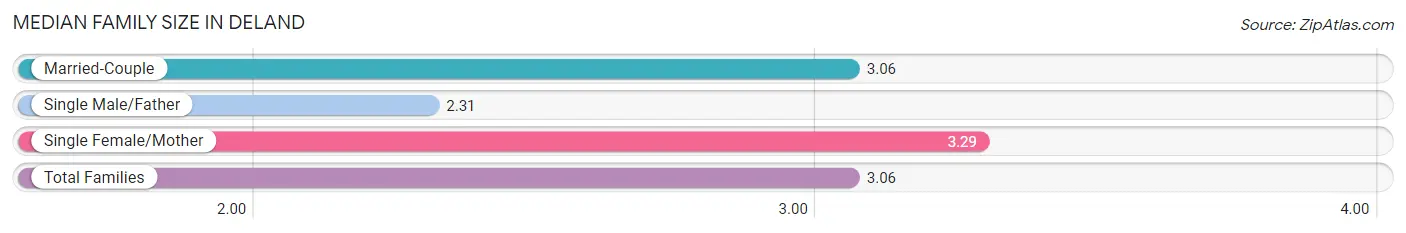
Median Family Size in Deland
The median family size in Deland is 3.06 persons per family, with single female/mother families (1,896 | 20.9%) accounting for the largest median family size of 3.29 persons per family. On the other hand, single male/father families (608 | 6.7%) represent the smallest median family size with 2.31 persons per family.
| Family Type | # Families | Family Size |
| Married-Couple | 6,565 (72.4%) | 3.06 |
| Single Male/Father | 608 (6.7%) | 2.31 |
| Single Female/Mother | 1,896 (20.9%) | 3.29 |
| Total Families | 9,069 (100.0%) | 3.06 |
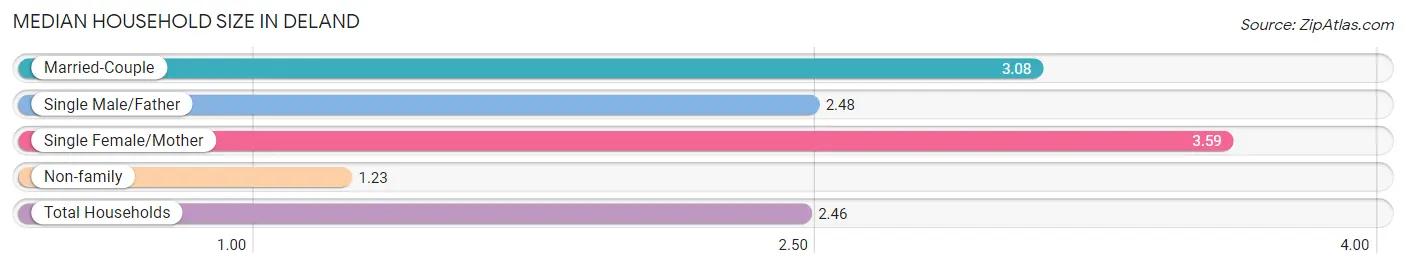
Median Household Size in Deland
The median household size in Deland is 2.46 persons per household, with single female/mother households (1,896 | 13.4%) accounting for the largest median household size of 3.59 persons per household. non-family households (5,093 | 36.0%) represent the smallest median household size with 1.23 persons per household.
| Household Type | # Households | Household Size |
| Married-Couple | 6,565 (46.4%) | 3.08 |
| Single Male/Father | 608 (4.3%) | 2.48 |
| Single Female/Mother | 1,896 (13.4%) | 3.59 |
| Non-family | 5,093 (36.0%) | 1.23 |
| Total Households | 14,162 (100.0%) | 2.46 |
Household Size by Marriage Status in Deland
Out of a total of 14,162 households in Deland, 9,069 (64.0%) are family households, while 5,093 (36.0%) are nonfamily households. The most numerous type of family households are 2-person households, comprising 4,632, and the most common type of nonfamily households are 1-person households, comprising 4,012.
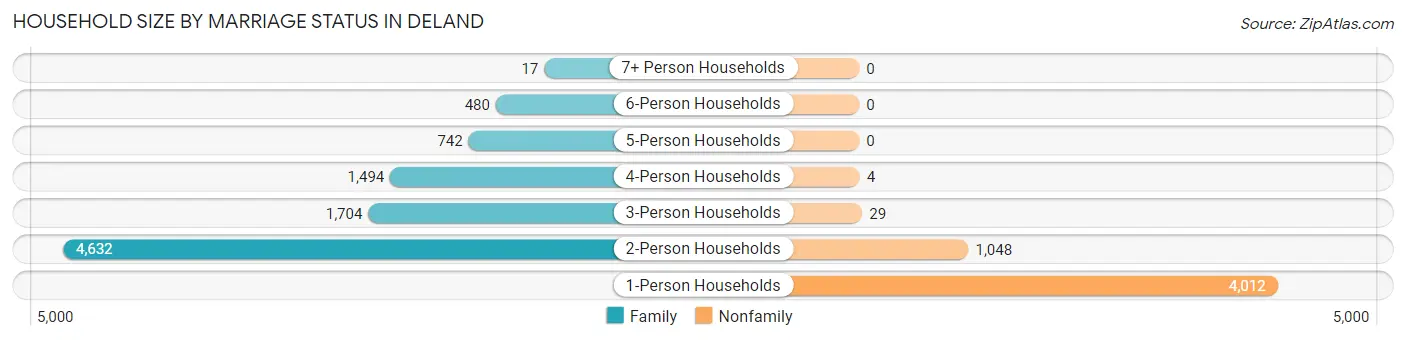
| Household Size | Family Households | Nonfamily Households |
| 1-Person Households | - | 4,012 (28.3%) |
| 2-Person Households | 4,632 (32.7%) | 1,048 (7.4%) |
| 3-Person Households | 1,704 (12.0%) | 29 (0.2%) |
| 4-Person Households | 1,494 (10.5%) | 4 (0.0%) |
| 5-Person Households | 742 (5.2%) | 0 (0.0%) |
| 6-Person Households | 480 (3.4%) | 0 (0.0%) |
| 7+ Person Households | 17 (0.1%) | 0 (0.0%) |
| Total | 9,069 (64.0%) | 5,093 (36.0%) |
Female Fertility in Deland
Fertility by Age in Deland
Average fertility rate in Deland is 37.0 births per 1,000 women. Women in the age bracket of 20 to 34 years have the highest fertility rate with 64.0 births per 1,000 women. Women in the age bracket of 20 to 34 years acount for 68.5% of all women with births.
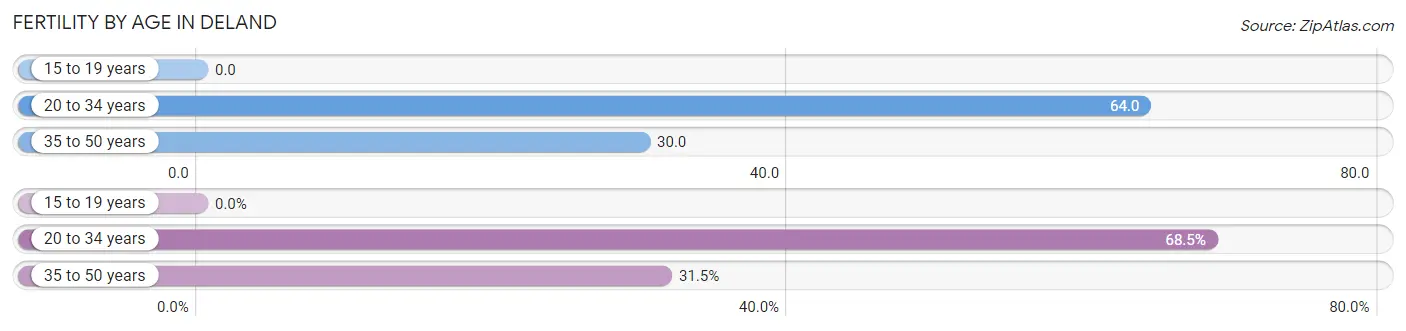
| Age Bracket | Women with Births | Births / 1,000 Women |
| 15 to 19 years | 0 (0.0%) | 0.0 |
| 20 to 34 years | 248 (68.5%) | 64.0 |
| 35 to 50 years | 114 (31.5%) | 30.0 |
| Total | 362 (100.0%) | 37.0 |
Fertility by Age by Marriage Status in Deland
56.4% of women with births (362) in Deland are married. The highest percentage of unmarried women with births falls into 20 to 34 years age bracket with 60.1% of them unmarried at the time of birth, while the lowest percentage of unmarried women with births belong to 35 to 50 years age bracket with 7.9% of them unmarried.
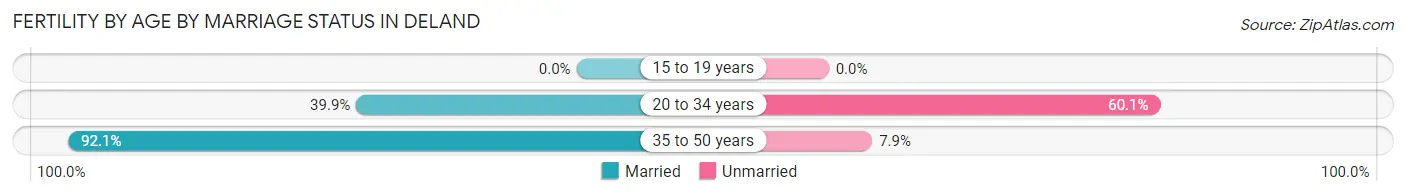
| Age Bracket | Married | Unmarried |
| 15 to 19 years | 0 (0.0%) | 0 (0.0%) |
| 20 to 34 years | 99 (39.9%) | 149 (60.1%) |
| 35 to 50 years | 105 (92.1%) | 9 (7.9%) |
| Total | 204 (56.4%) | 158 (43.6%) |
Fertility by Education in Deland
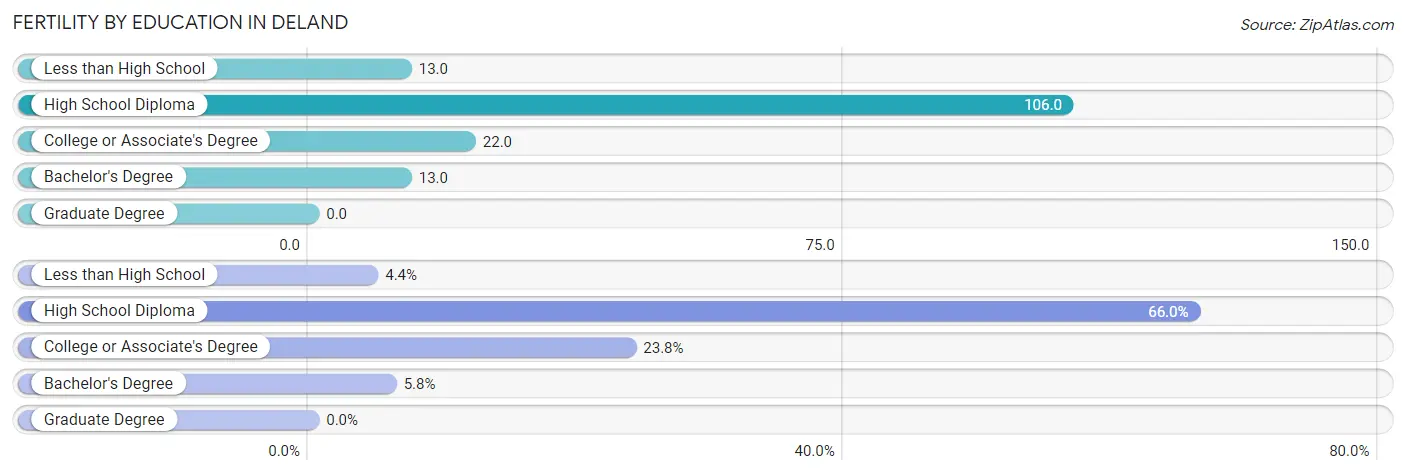
| Educational Attainment | Women with Births | Births / 1,000 Women |
| Less than High School | 16 (4.4%) | 13.0 |
| High School Diploma | 239 (66.0%) | 106.0 |
| College or Associate's Degree | 86 (23.8%) | 22.0 |
| Bachelor's Degree | 21 (5.8%) | 13.0 |
| Graduate Degree | 0 (0.0%) | 0.0 |
| Total | 362 (100.0%) | 37.0 |
Fertility by Education by Marriage Status in Deland
43.6% of women with births in Deland are unmarried. Women with the educational attainment of college or associate's degree are most likely to be married with 100.0% of them married at childbirth, while women with the educational attainment of less than high school are least likely to be married with 100.0% of them unmarried at childbirth.
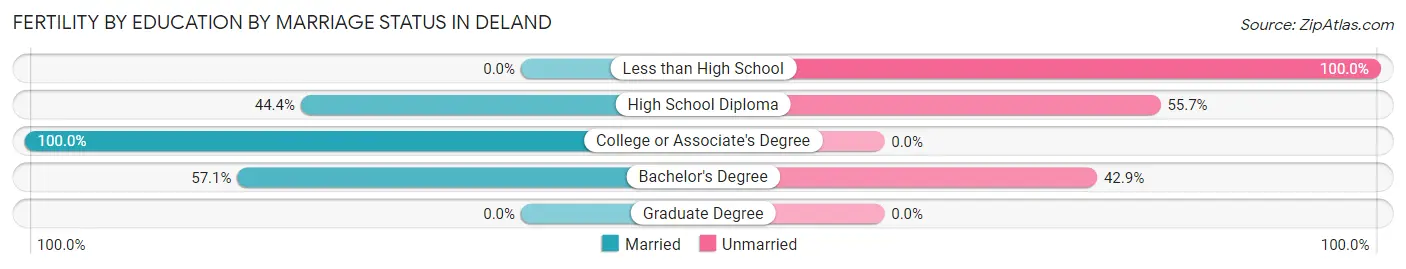
| Educational Attainment | Married | Unmarried |
| Less than High School | 0 (0.0%) | 16 (100.0%) |
| High School Diploma | 106 (44.4%) | 133 (55.6%) |
| College or Associate's Degree | 86 (100.0%) | 0 (0.0%) |
| Bachelor's Degree | 12 (57.1%) | 9 (42.9%) |
| Graduate Degree | 0 (0.0%) | 0 (0.0%) |
| Total | 204 (56.4%) | 158 (43.6%) |
Employment Characteristics in Deland
Employment by Class of Employer in Deland
Among the 15,761 employed individuals in Deland, private company employees (11,198 | 71.1%), not-for-profit organizations (1,259 | 8.0%), and local government employees (1,029 | 6.5%) make up the most common classes of employment.
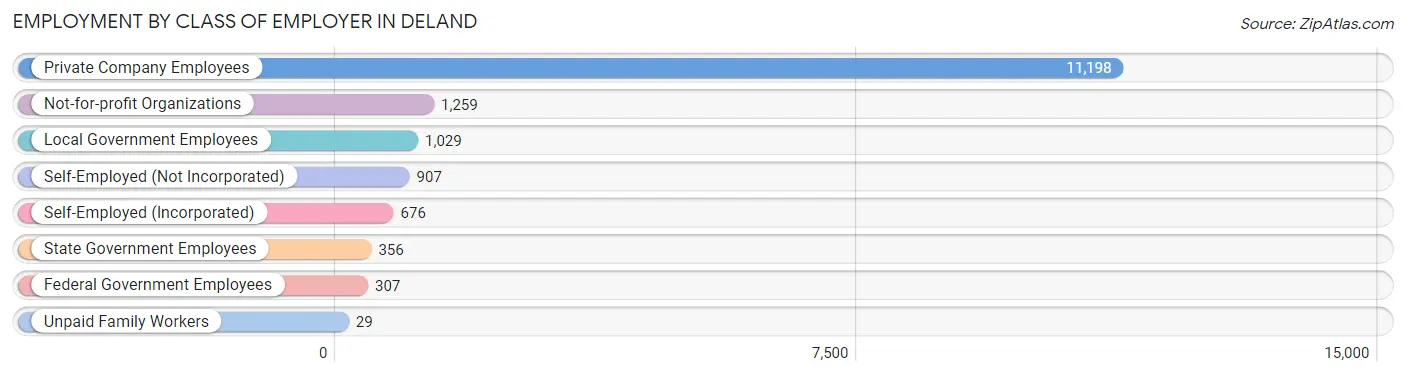
| Employer Class | # Employees | % Employees |
| Private Company Employees | 11,198 | 71.1% |
| Self-Employed (Incorporated) | 676 | 4.3% |
| Self-Employed (Not Incorporated) | 907 | 5.8% |
| Not-for-profit Organizations | 1,259 | 8.0% |
| Local Government Employees | 1,029 | 6.5% |
| State Government Employees | 356 | 2.3% |
| Federal Government Employees | 307 | 1.9% |
| Unpaid Family Workers | 29 | 0.2% |
| Total | 15,761 | 100.0% |
Employment Status by Age in Deland
According to the labor force statistics for Deland, out of the total population over 16 years of age (31,238), 53.0% or 16,556 individuals are in the labor force, with 4.1% or 679 of them unemployed. The age group with the highest labor force participation rate is 30 to 34 years, with 88.1% or 1,886 individuals in the labor force. Within the labor force, the 75 years and over age range has the highest percentage of unemployed individuals, with 15.9% or 20 of them being unemployed.
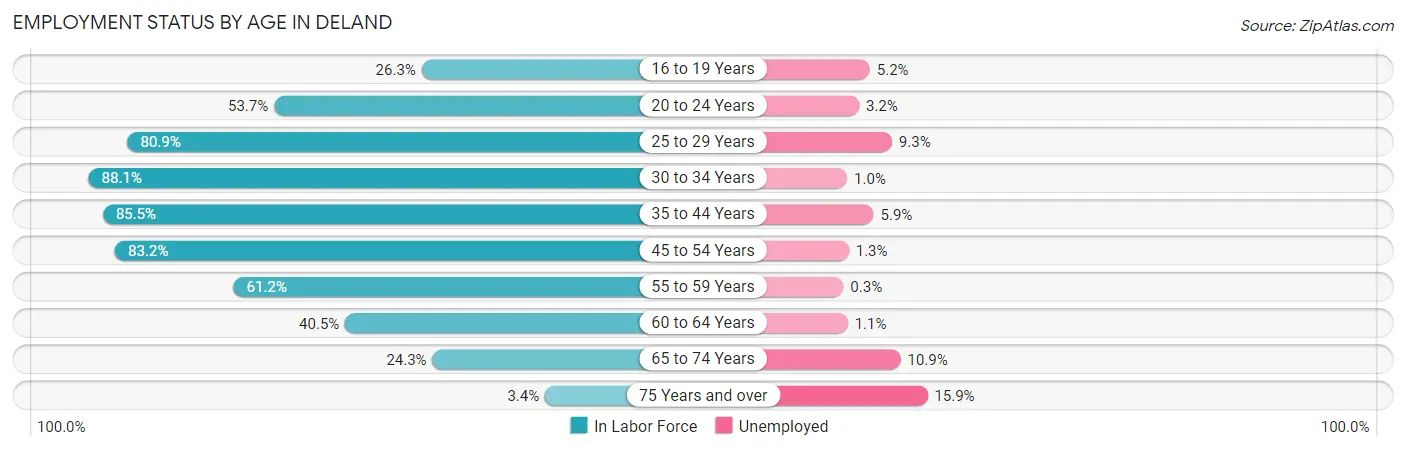
| Age Bracket | In Labor Force | Unemployed |
| 16 to 19 Years | 910 (26.3%) | 47 (5.2%) |
| 20 to 24 Years | 1,555 (53.7%) | 50 (3.2%) |
| 25 to 29 Years | 1,531 (80.9%) | 142 (9.3%) |
| 30 to 34 Years | 1,886 (88.1%) | 19 (1.0%) |
| 35 to 44 Years | 3,797 (85.5%) | 224 (5.9%) |
| 45 to 54 Years | 3,487 (83.2%) | 45 (1.3%) |
| 55 to 59 Years | 1,391 (61.2%) | 4 (0.3%) |
| 60 to 64 Years | 823 (40.5%) | 9 (1.1%) |
| 65 to 74 Years | 1,033 (24.3%) | 113 (10.9%) |
| 75 Years and over | 124 (3.4%) | 20 (15.9%) |
| Total | 16,556 (53.0%) | 679 (4.1%) |
Employment Status by Educational Attainment in Deland
According to labor force statistics for Deland, 76.1% of individuals (12,915) out of the total population between 25 and 64 years of age (16,971) are in the labor force, with 3.4% or 439 of them being unemployed. The group with the highest labor force participation rate are those with the educational attainment of bachelor's degree or higher, with 85.5% or 4,802 individuals in the labor force. Within the labor force, individuals with college / associate degree education have the highest percentage of unemployment, with 6.1% or 263 of them being unemployed.
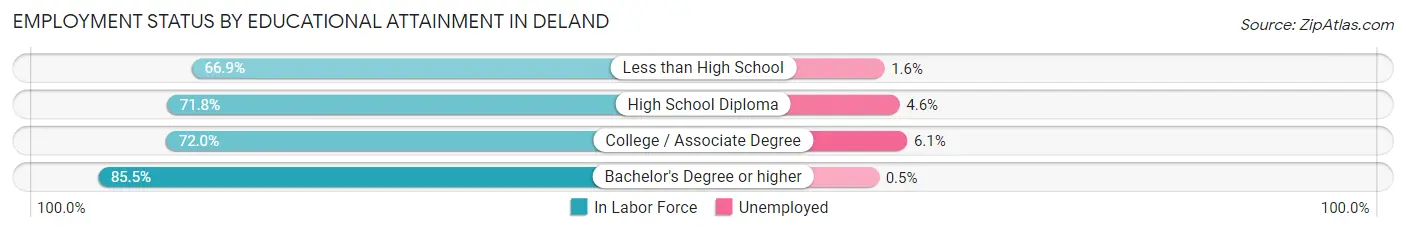
| Educational Attainment | In Labor Force | Unemployed |
| Less than High School | 758 (66.9%) | 18 (1.6%) |
| High School Diploma | 3,047 (71.8%) | 195 (4.6%) |
| College / Associate Degree | 4,304 (72.0%) | 365 (6.1%) |
| Bachelor's Degree or higher | 4,802 (85.5%) | 28 (0.5%) |
| Total | 12,915 (76.1%) | 577 (3.4%) |
Employment Occupations by Sex in Deland
Management, Business, Science and Arts Occupations
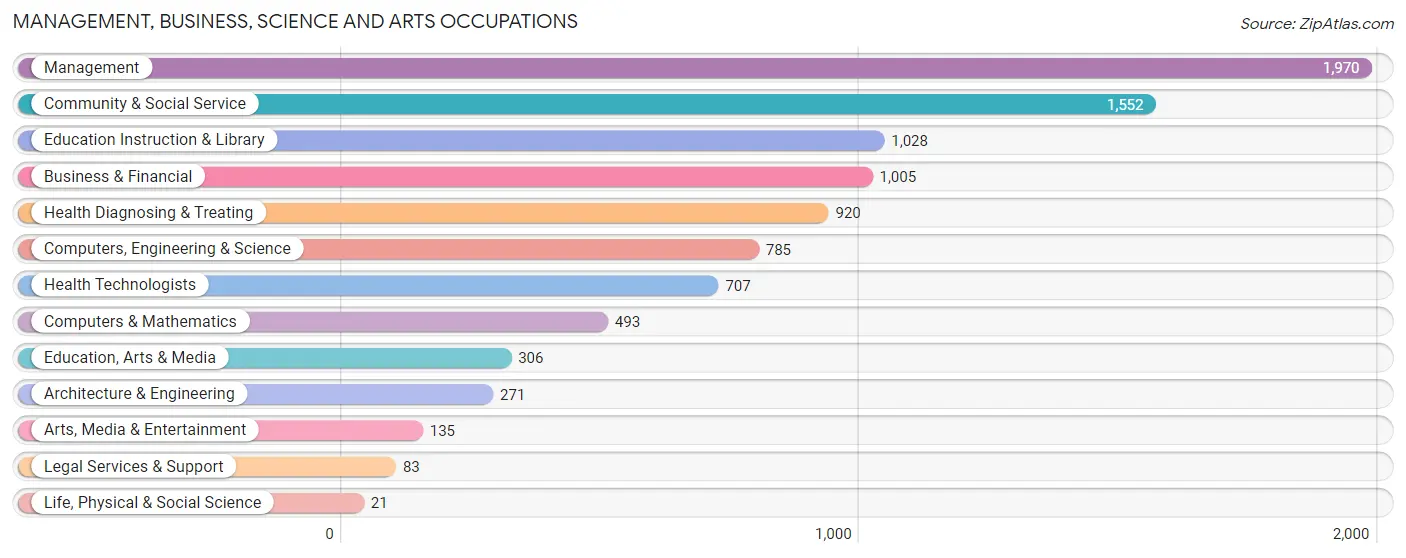
The most common Management, Business, Science and Arts occupations in Deland are Management (1,970 | 12.5%), Community & Social Service (1,552 | 9.9%), Education Instruction & Library (1,028 | 6.5%), Business & Financial (1,005 | 6.4%), and Health Diagnosing & Treating (920 | 5.8%).
Management, Business, Science and Arts Occupations by Sex
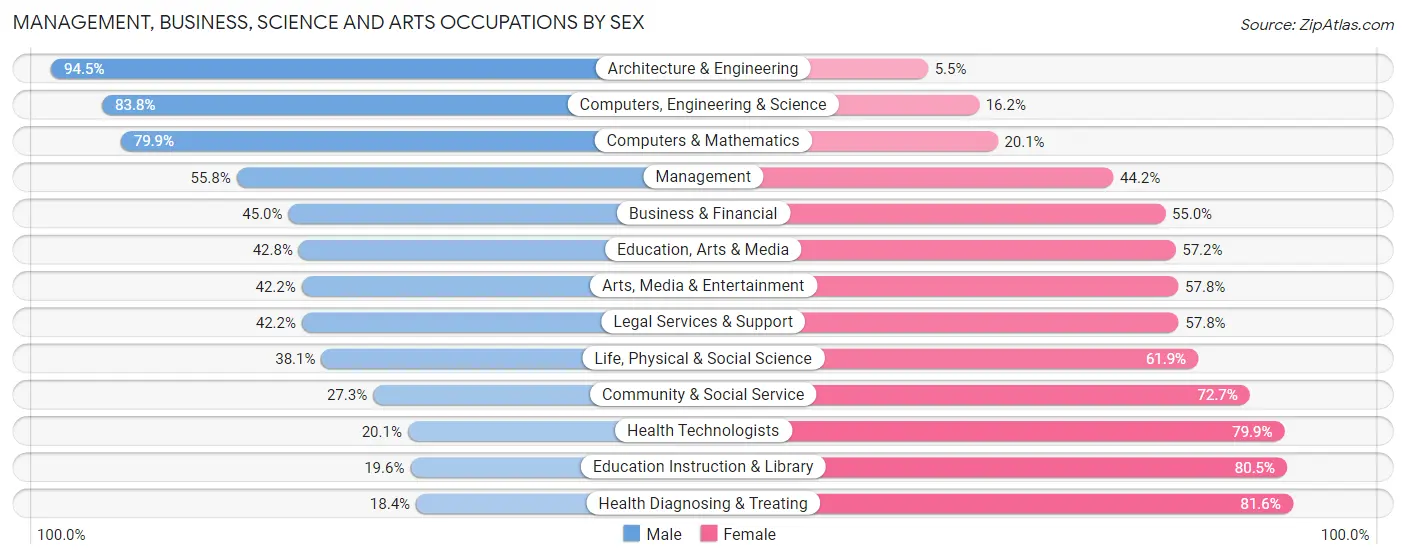
Within the Management, Business, Science and Arts occupations in Deland, the most male-oriented occupations are Architecture & Engineering (94.5%), Computers, Engineering & Science (83.8%), and Computers & Mathematics (79.9%), while the most female-oriented occupations are Health Diagnosing & Treating (81.6%), Education Instruction & Library (80.4%), and Health Technologists (79.9%).
| Occupation | Male | Female |
| Management | 1,099 (55.8%) | 871 (44.2%) |
| Business & Financial | 452 (45.0%) | 553 (55.0%) |
| Computers, Engineering & Science | 658 (83.8%) | 127 (16.2%) |
| Computers & Mathematics | 394 (79.9%) | 99 (20.1%) |
| Architecture & Engineering | 256 (94.5%) | 15 (5.5%) |
| Life, Physical & Social Science | 8 (38.1%) | 13 (61.9%) |
| Community & Social Service | 424 (27.3%) | 1,128 (72.7%) |
| Education, Arts & Media | 131 (42.8%) | 175 (57.2%) |
| Legal Services & Support | 35 (42.2%) | 48 (57.8%) |
| Education Instruction & Library | 201 (19.6%) | 827 (80.4%) |
| Arts, Media & Entertainment | 57 (42.2%) | 78 (57.8%) |
| Health Diagnosing & Treating | 169 (18.4%) | 751 (81.6%) |
| Health Technologists | 142 (20.1%) | 565 (79.9%) |
| Total (Category) | 2,802 (45.0%) | 3,430 (55.0%) |
| Total (Overall) | 7,347 (46.7%) | 8,401 (53.3%) |
Services Occupations
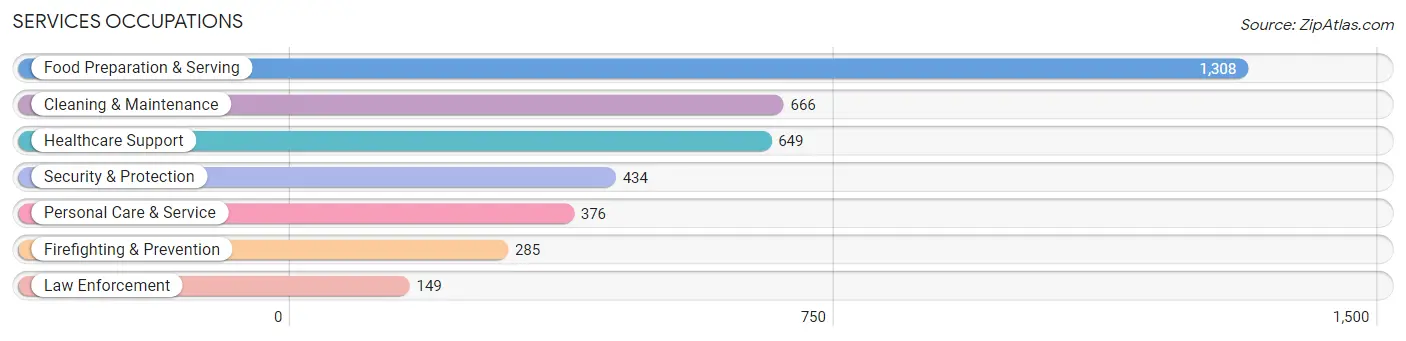
The most common Services occupations in Deland are Food Preparation & Serving (1,308 | 8.3%), Cleaning & Maintenance (666 | 4.2%), Healthcare Support (649 | 4.1%), Security & Protection (434 | 2.8%), and Personal Care & Service (376 | 2.4%).
Services Occupations by Sex
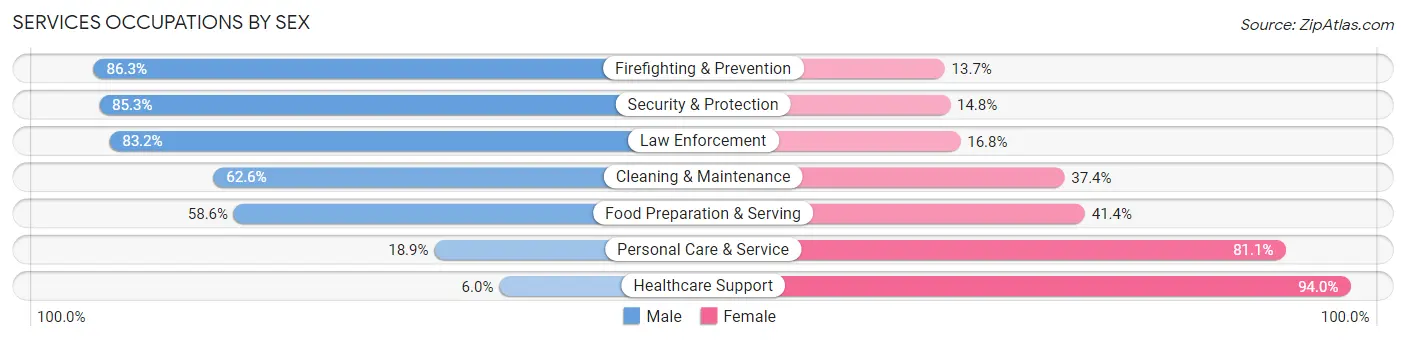
Within the Services occupations in Deland, the most male-oriented occupations are Firefighting & Prevention (86.3%), Security & Protection (85.3%), and Law Enforcement (83.2%), while the most female-oriented occupations are Healthcare Support (94.0%), Personal Care & Service (81.1%), and Food Preparation & Serving (41.4%).
| Occupation | Male | Female |
| Healthcare Support | 39 (6.0%) | 610 (94.0%) |
| Security & Protection | 370 (85.3%) | 64 (14.7%) |
| Firefighting & Prevention | 246 (86.3%) | 39 (13.7%) |
| Law Enforcement | 124 (83.2%) | 25 (16.8%) |
| Food Preparation & Serving | 766 (58.6%) | 542 (41.4%) |
| Cleaning & Maintenance | 417 (62.6%) | 249 (37.4%) |
| Personal Care & Service | 71 (18.9%) | 305 (81.1%) |
| Total (Category) | 1,663 (48.4%) | 1,770 (51.6%) |
| Total (Overall) | 7,347 (46.7%) | 8,401 (53.3%) |
Sales and Office Occupations
The most common Sales and Office occupations in Deland are Office & Administration (2,025 | 12.9%), and Sales & Related (1,969 | 12.5%).

Sales and Office Occupations by Sex

| Occupation | Male | Female |
| Sales & Related | 646 (32.8%) | 1,323 (67.2%) |
| Office & Administration | 564 (27.9%) | 1,461 (72.2%) |
| Total (Category) | 1,210 (30.3%) | 2,784 (69.7%) |
| Total (Overall) | 7,347 (46.7%) | 8,401 (53.3%) |
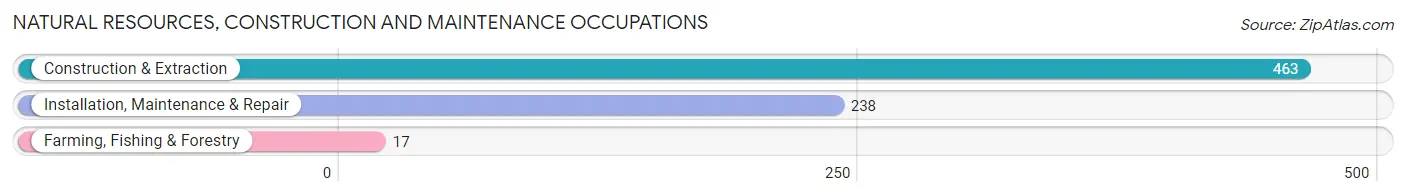
Natural Resources, Construction and Maintenance Occupations
The most common Natural Resources, Construction and Maintenance occupations in Deland are Construction & Extraction (463 | 2.9%), Installation, Maintenance & Repair (238 | 1.5%), and Farming, Fishing & Forestry (17 | 0.1%).
Natural Resources, Construction and Maintenance Occupations by Sex
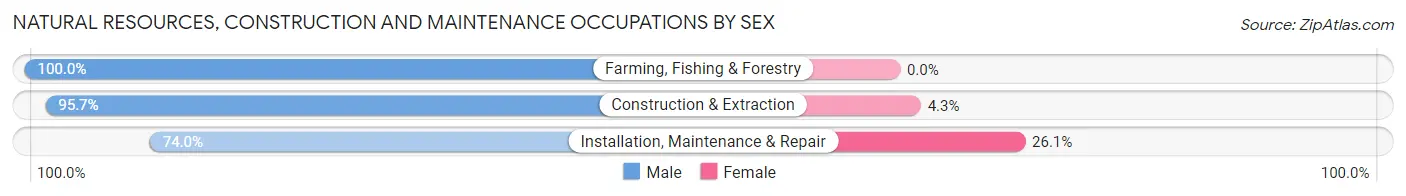
| Occupation | Male | Female |
| Farming, Fishing & Forestry | 17 (100.0%) | 0 (0.0%) |
| Construction & Extraction | 443 (95.7%) | 20 (4.3%) |
| Installation, Maintenance & Repair | 176 (74.0%) | 62 (26.1%) |
| Total (Category) | 636 (88.6%) | 82 (11.4%) |
| Total (Overall) | 7,347 (46.7%) | 8,401 (53.3%) |
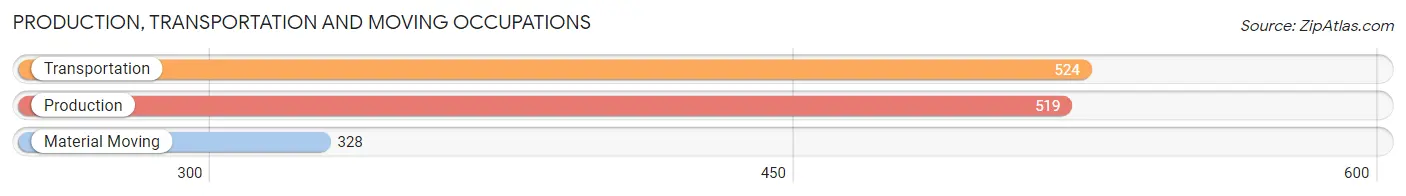
Production, Transportation and Moving Occupations
The most common Production, Transportation and Moving occupations in Deland are Transportation (524 | 3.3%), Production (519 | 3.3%), and Material Moving (328 | 2.1%).
Production, Transportation and Moving Occupations by Sex
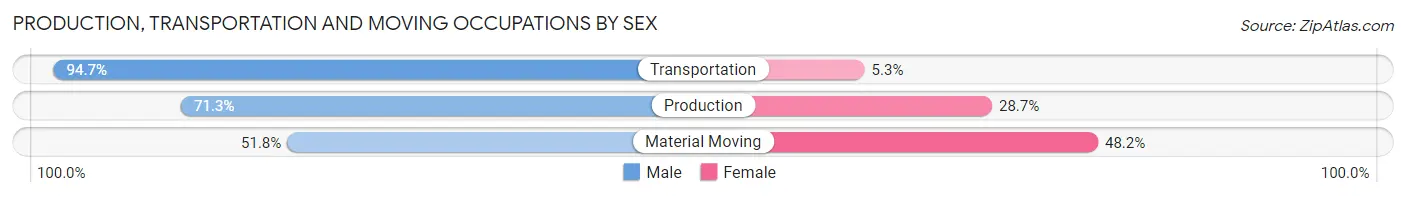
| Occupation | Male | Female |
| Production | 370 (71.3%) | 149 (28.7%) |
| Transportation | 496 (94.7%) | 28 (5.3%) |
| Material Moving | 170 (51.8%) | 158 (48.2%) |
| Total (Category) | 1,036 (75.6%) | 335 (24.4%) |
| Total (Overall) | 7,347 (46.7%) | 8,401 (53.3%) |
Employment Industries by Sex in Deland
Employment Industries in Deland
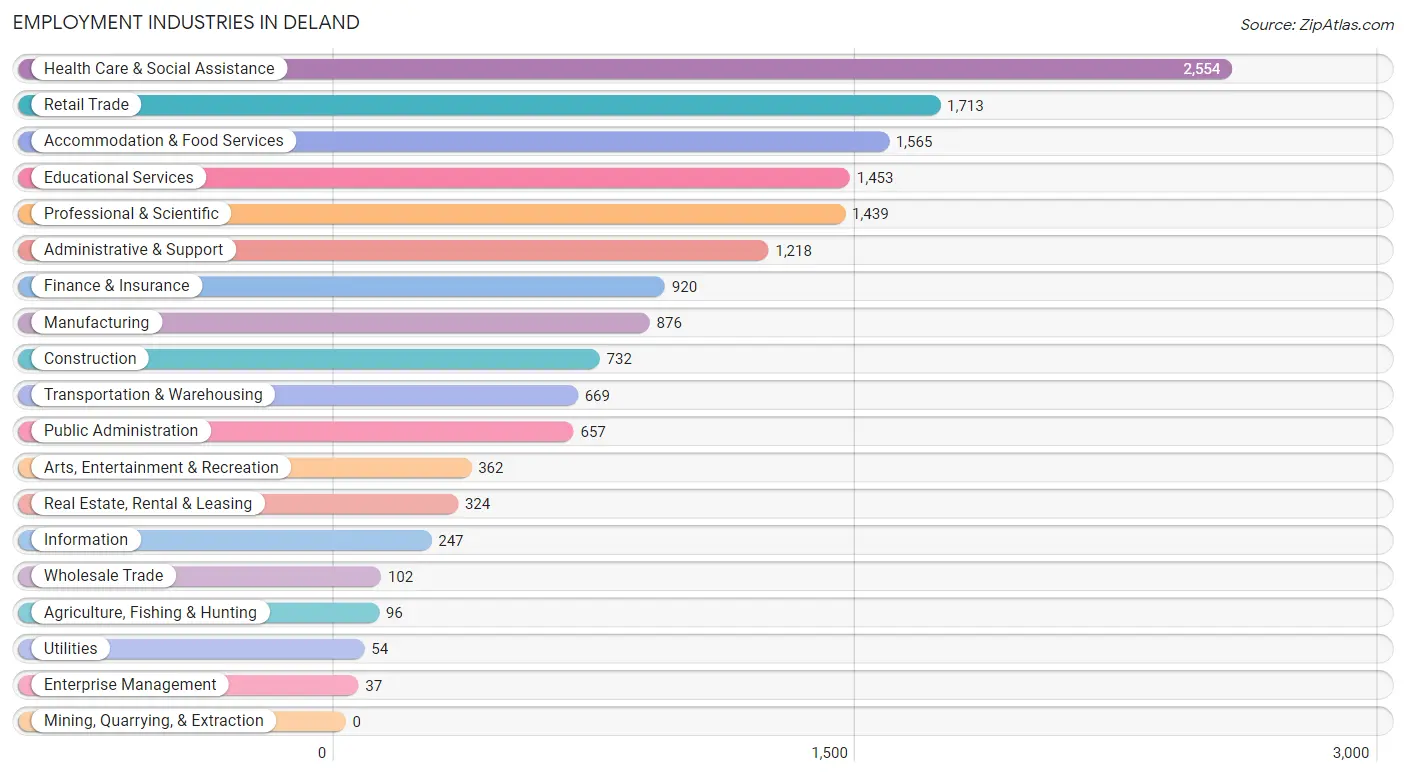
The major employment industries in Deland include Health Care & Social Assistance (2,554 | 16.2%), Retail Trade (1,713 | 10.9%), Accommodation & Food Services (1,565 | 9.9%), Educational Services (1,453 | 9.2%), and Professional & Scientific (1,439 | 9.1%).
Employment Industries by Sex in Deland
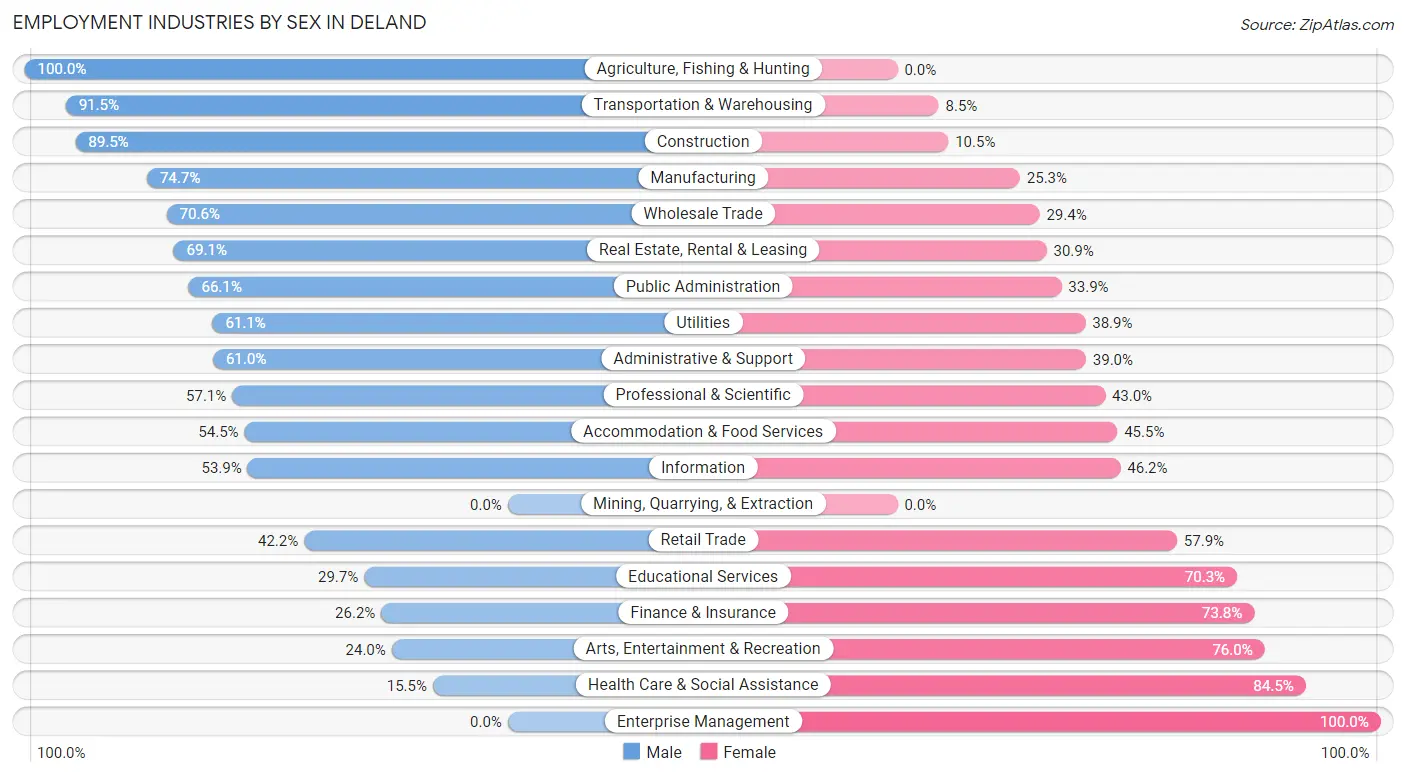
The Deland industries that see more men than women are Agriculture, Fishing & Hunting (100.0%), Transportation & Warehousing (91.5%), and Construction (89.5%), whereas the industries that tend to have a higher number of women are Enterprise Management (100.0%), Health Care & Social Assistance (84.5%), and Arts, Entertainment & Recreation (76.0%).
| Industry | Male | Female |
| Agriculture, Fishing & Hunting | 96 (100.0%) | 0 (0.0%) |
| Mining, Quarrying, & Extraction | 0 (0.0%) | 0 (0.0%) |
| Construction | 655 (89.5%) | 77 (10.5%) |
| Manufacturing | 654 (74.7%) | 222 (25.3%) |
| Wholesale Trade | 72 (70.6%) | 30 (29.4%) |
| Retail Trade | 722 (42.1%) | 991 (57.9%) |
| Transportation & Warehousing | 612 (91.5%) | 57 (8.5%) |
| Utilities | 33 (61.1%) | 21 (38.9%) |
| Information | 133 (53.8%) | 114 (46.2%) |
| Finance & Insurance | 241 (26.2%) | 679 (73.8%) |
| Real Estate, Rental & Leasing | 224 (69.1%) | 100 (30.9%) |
| Professional & Scientific | 821 (57.1%) | 618 (42.9%) |
| Enterprise Management | 0 (0.0%) | 37 (100.0%) |
| Administrative & Support | 743 (61.0%) | 475 (39.0%) |
| Educational Services | 432 (29.7%) | 1,021 (70.3%) |
| Health Care & Social Assistance | 396 (15.5%) | 2,158 (84.5%) |
| Arts, Entertainment & Recreation | 87 (24.0%) | 275 (76.0%) |
| Accommodation & Food Services | 853 (54.5%) | 712 (45.5%) |
| Public Administration | 434 (66.1%) | 223 (33.9%) |
| Total | 7,347 (46.7%) | 8,401 (53.3%) |
Education in Deland
School Enrollment in Deland
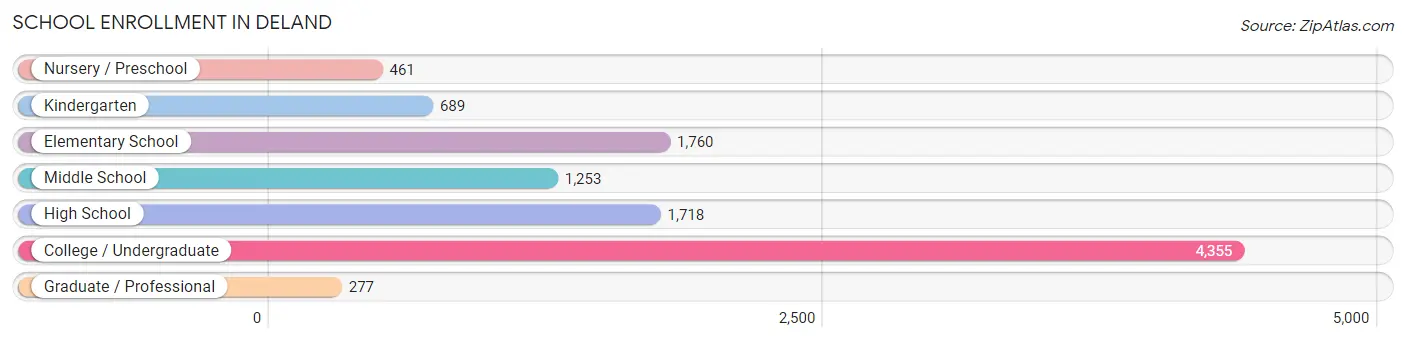
The most common levels of schooling among the 10,513 students in Deland are college / undergraduate (4,355 | 41.4%), elementary school (1,760 | 16.7%), and high school (1,718 | 16.3%).
| School Level | # Students | % Students |
| Nursery / Preschool | 461 | 4.4% |
| Kindergarten | 689 | 6.6% |
| Elementary School | 1,760 | 16.7% |
| Middle School | 1,253 | 11.9% |
| High School | 1,718 | 16.3% |
| College / Undergraduate | 4,355 | 41.4% |
| Graduate / Professional | 277 | 2.6% |
| Total | 10,513 | 100.0% |
School Enrollment by Age by Funding Source in Deland
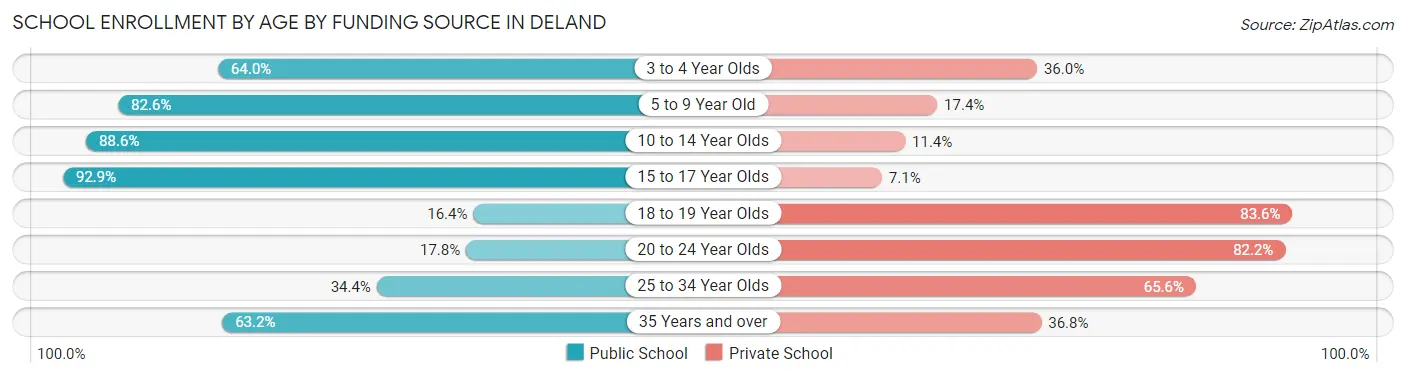
Out of a total of 10,513 students who are enrolled in schools in Deland, 4,394 (41.8%) attend a private institution, while the remaining 6,119 (58.2%) are enrolled in public schools. The age group of 18 to 19 year olds has the highest likelihood of being enrolled in private schools, with 1,694 (83.6% in the age bracket) enrolled. Conversely, the age group of 15 to 17 year olds has the lowest likelihood of being enrolled in a private school, with 1,318 (92.9% in the age bracket) attending a public institution.
| Age Bracket | Public School | Private School |
| 3 to 4 Year Olds | 231 (64.0%) | 130 (36.0%) |
| 5 to 9 Year Old | 1,874 (82.6%) | 395 (17.4%) |
| 10 to 14 Year Olds | 1,487 (88.6%) | 192 (11.4%) |
| 15 to 17 Year Olds | 1,318 (92.9%) | 101 (7.1%) |
| 18 to 19 Year Olds | 333 (16.4%) | 1,694 (83.6%) |
| 20 to 24 Year Olds | 272 (17.8%) | 1,259 (82.2%) |
| 25 to 34 Year Olds | 211 (34.4%) | 402 (65.6%) |
| 35 Years and over | 388 (63.2%) | 226 (36.8%) |
| Total | 6,119 (58.2%) | 4,394 (41.8%) |
Educational Attainment by Field of Study in Deland
Business (1,697 | 19.7%), education (1,109 | 12.9%), science & technology (1,007 | 11.7%), psychology (774 | 9.0%), and arts & humanities (674 | 7.8%) are the most common fields of study among 8,601 individuals in Deland who have obtained a bachelor's degree or higher.
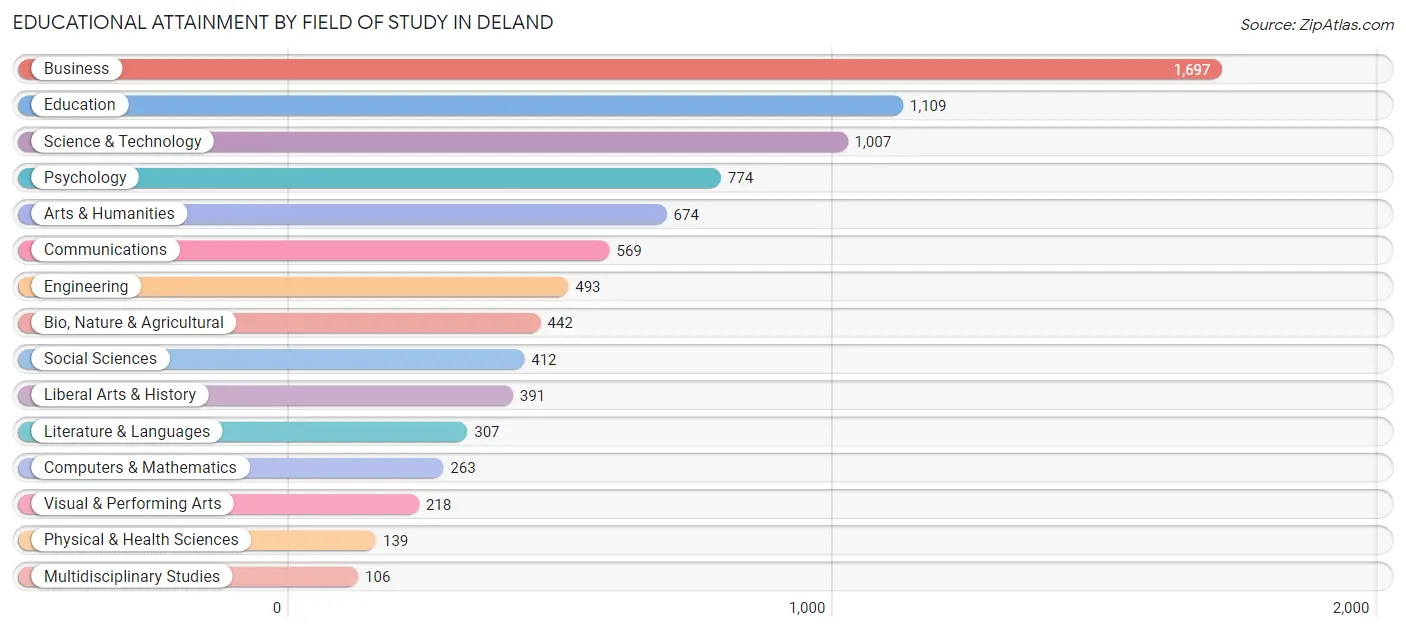
| Field of Study | # Graduates | % Graduates |
| Computers & Mathematics | 263 | 3.1% |
| Bio, Nature & Agricultural | 442 | 5.1% |
| Physical & Health Sciences | 139 | 1.6% |
| Psychology | 774 | 9.0% |
| Social Sciences | 412 | 4.8% |
| Engineering | 493 | 5.7% |
| Multidisciplinary Studies | 106 | 1.2% |
| Science & Technology | 1,007 | 11.7% |
| Business | 1,697 | 19.7% |
| Education | 1,109 | 12.9% |
| Literature & Languages | 307 | 3.6% |
| Liberal Arts & History | 391 | 4.5% |
| Visual & Performing Arts | 218 | 2.5% |
| Communications | 569 | 6.6% |
| Arts & Humanities | 674 | 7.8% |
| Total | 8,601 | 100.0% |
Transportation & Commute in Deland
Vehicle Availability by Sex in Deland
The most prevalent vehicle ownership categories in Deland are males with 2 vehicles (3,812, accounting for 51.3%) and females with 2 vehicles (4,275, making up 45.9%).
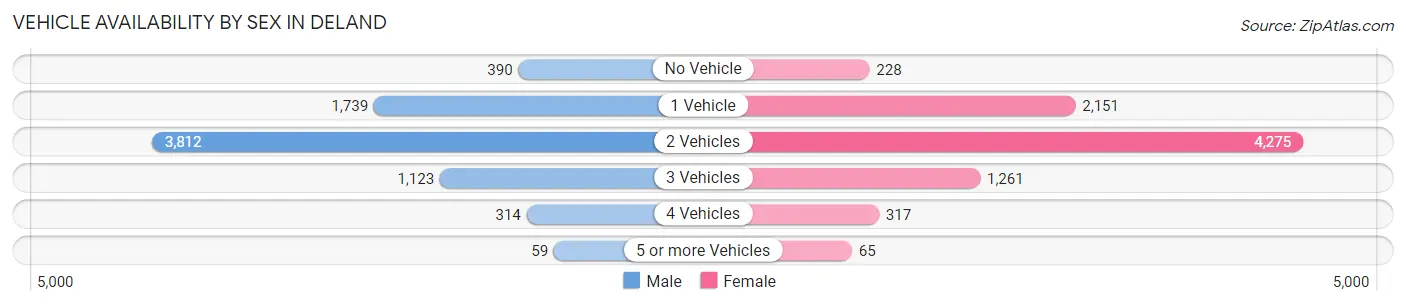
| Vehicles Available | Male | Female |
| No Vehicle | 390 (5.2%) | 228 (2.8%) |
| 1 Vehicle | 1,739 (23.4%) | 2,151 (25.9%) |
| 2 Vehicles | 3,812 (51.3%) | 4,275 (51.5%) |
| 3 Vehicles | 1,123 (15.1%) | 1,261 (15.2%) |
| 4 Vehicles | 314 (4.2%) | 317 (3.8%) |
| 5 or more Vehicles | 59 (0.8%) | 65 (0.8%) |
| Total | 7,437 (100.0%) | 8,297 (100.0%) |
Commute Time in Deland
The most frequently occuring commute durations in Deland are 10 to 14 minutes (2,219 commuters, 16.8%), 5 to 9 minutes (2,092 commuters, 15.8%), and 30 to 34 minutes (1,790 commuters, 13.5%).
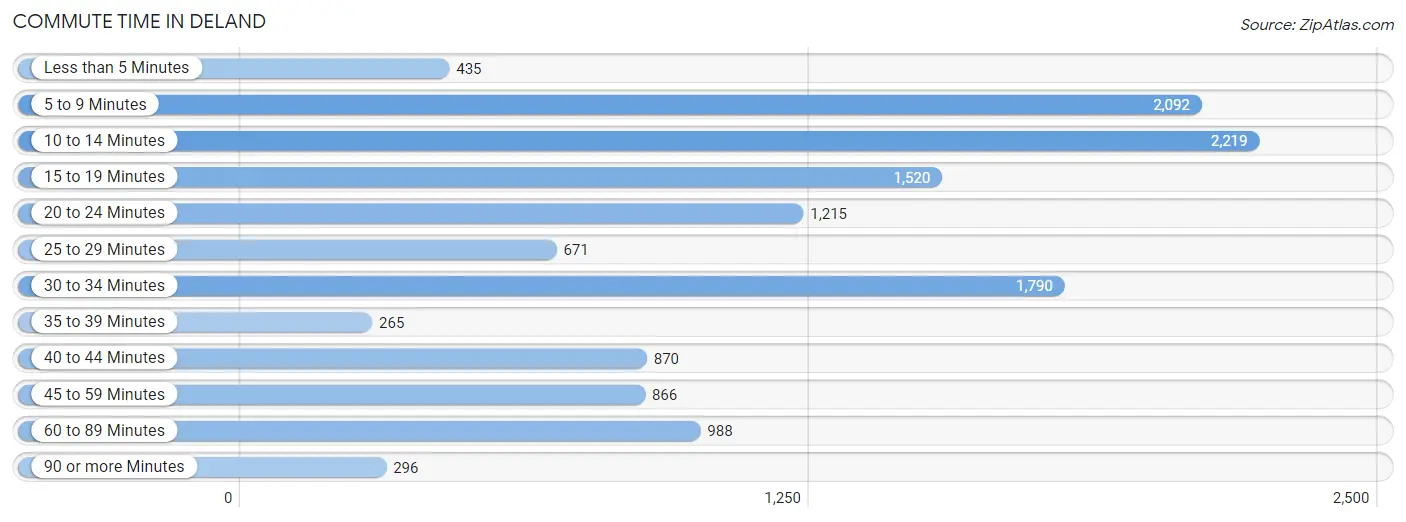
| Commute Time | # Commuters | % Commuters |
| Less than 5 Minutes | 435 | 3.3% |
| 5 to 9 Minutes | 2,092 | 15.8% |
| 10 to 14 Minutes | 2,219 | 16.8% |
| 15 to 19 Minutes | 1,520 | 11.5% |
| 20 to 24 Minutes | 1,215 | 9.2% |
| 25 to 29 Minutes | 671 | 5.1% |
| 30 to 34 Minutes | 1,790 | 13.5% |
| 35 to 39 Minutes | 265 | 2.0% |
| 40 to 44 Minutes | 870 | 6.6% |
| 45 to 59 Minutes | 866 | 6.6% |
| 60 to 89 Minutes | 988 | 7.5% |
| 90 or more Minutes | 296 | 2.2% |
Commute Time by Sex in Deland
The most common commute times in Deland are 5 to 9 minutes (1,026 commuters, 16.4%) for males and 10 to 14 minutes (1,427 commuters, 20.5%) for females.
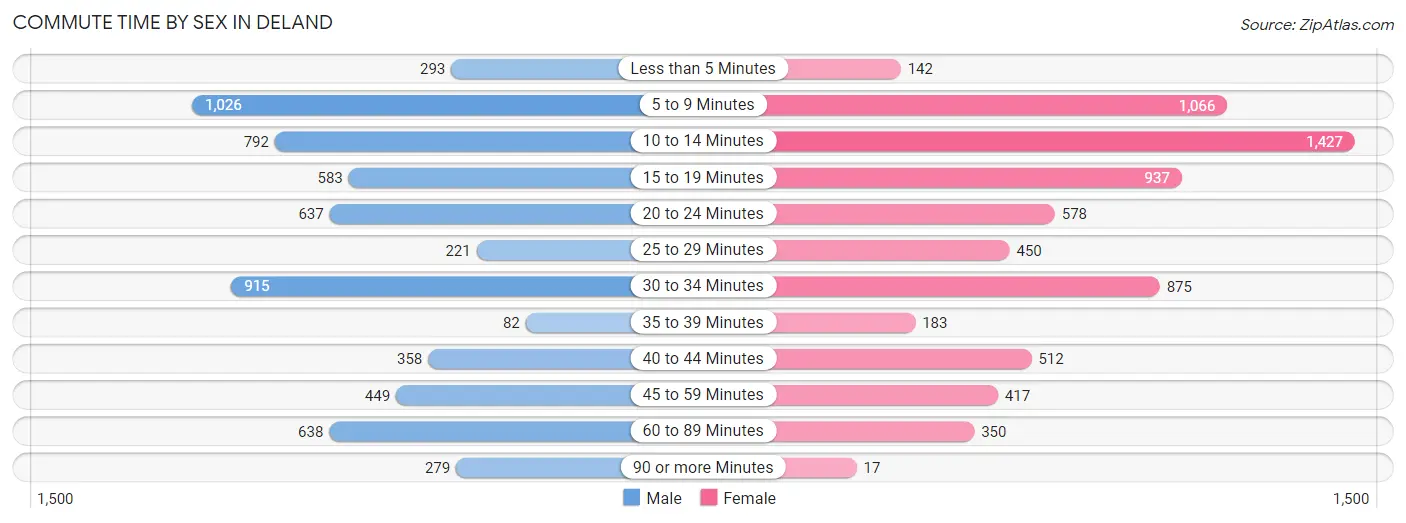
| Commute Time | Male | Female |
| Less than 5 Minutes | 293 (4.7%) | 142 (2.0%) |
| 5 to 9 Minutes | 1,026 (16.4%) | 1,066 (15.3%) |
| 10 to 14 Minutes | 792 (12.6%) | 1,427 (20.5%) |
| 15 to 19 Minutes | 583 (9.3%) | 937 (13.5%) |
| 20 to 24 Minutes | 637 (10.2%) | 578 (8.3%) |
| 25 to 29 Minutes | 221 (3.5%) | 450 (6.5%) |
| 30 to 34 Minutes | 915 (14.6%) | 875 (12.6%) |
| 35 to 39 Minutes | 82 (1.3%) | 183 (2.6%) |
| 40 to 44 Minutes | 358 (5.7%) | 512 (7.4%) |
| 45 to 59 Minutes | 449 (7.2%) | 417 (6.0%) |
| 60 to 89 Minutes | 638 (10.2%) | 350 (5.0%) |
| 90 or more Minutes | 279 (4.4%) | 17 (0.2%) |
Time of Departure to Work by Sex in Deland
The most frequent times of departure to work in Deland are 7:00 AM to 7:29 AM (807, 12.9%) for males and 8:00 AM to 8:29 AM (1,070, 15.4%) for females.
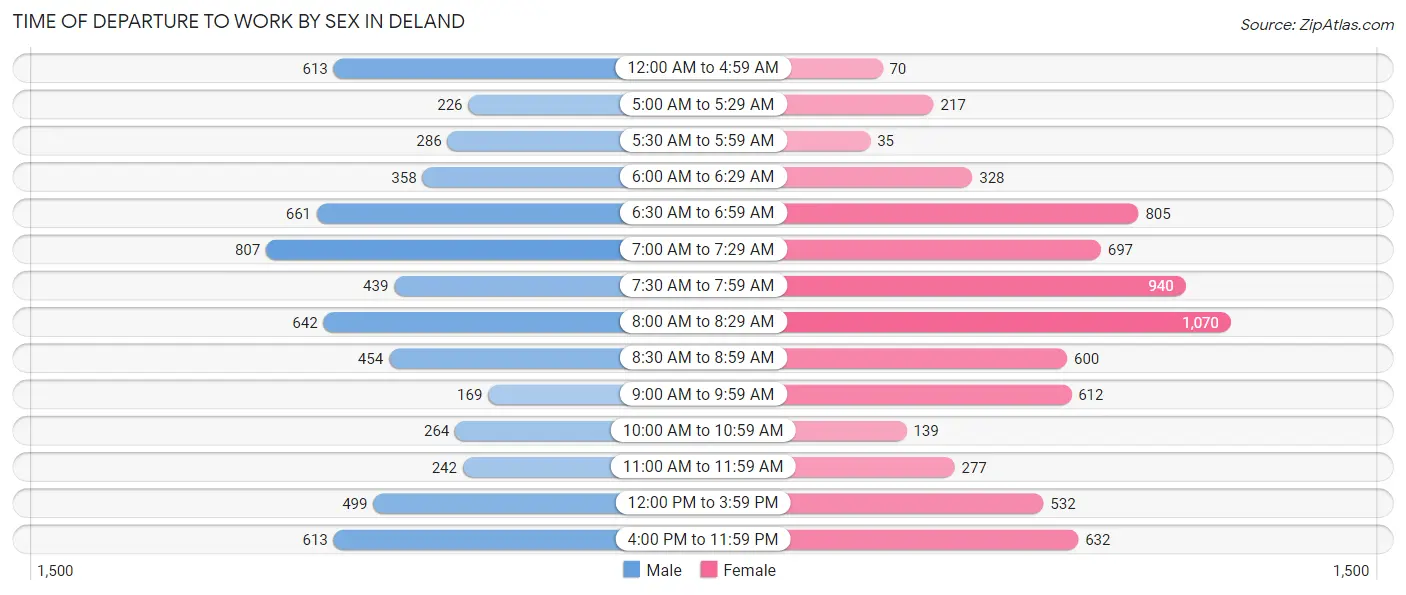
| Time of Departure | Male | Female |
| 12:00 AM to 4:59 AM | 613 (9.8%) | 70 (1.0%) |
| 5:00 AM to 5:29 AM | 226 (3.6%) | 217 (3.1%) |
| 5:30 AM to 5:59 AM | 286 (4.6%) | 35 (0.5%) |
| 6:00 AM to 6:29 AM | 358 (5.7%) | 328 (4.7%) |
| 6:30 AM to 6:59 AM | 661 (10.5%) | 805 (11.6%) |
| 7:00 AM to 7:29 AM | 807 (12.9%) | 697 (10.0%) |
| 7:30 AM to 7:59 AM | 439 (7.0%) | 940 (13.5%) |
| 8:00 AM to 8:29 AM | 642 (10.2%) | 1,070 (15.4%) |
| 8:30 AM to 8:59 AM | 454 (7.2%) | 600 (8.6%) |
| 9:00 AM to 9:59 AM | 169 (2.7%) | 612 (8.8%) |
| 10:00 AM to 10:59 AM | 264 (4.2%) | 139 (2.0%) |
| 11:00 AM to 11:59 AM | 242 (3.9%) | 277 (4.0%) |
| 12:00 PM to 3:59 PM | 499 (8.0%) | 532 (7.6%) |
| 4:00 PM to 11:59 PM | 613 (9.8%) | 632 (9.1%) |
| Total | 6,273 (100.0%) | 6,954 (100.0%) |
Housing Occupancy in Deland
Occupancy by Ownership in Deland
Of the total 14,162 dwellings in Deland, owner-occupied units account for 8,619 (60.9%), while renter-occupied units make up 5,543 (39.1%).
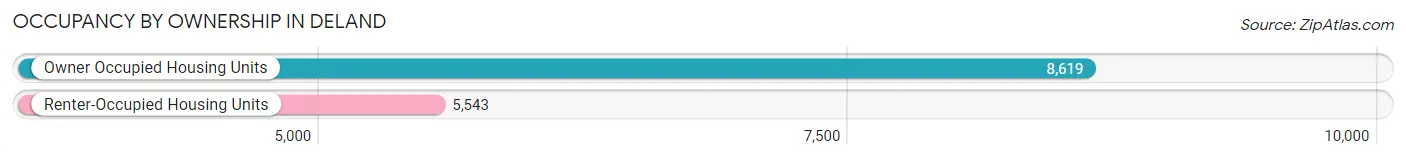
| Occupancy | # Housing Units | % Housing Units |
| Owner Occupied Housing Units | 8,619 | 60.9% |
| Renter-Occupied Housing Units | 5,543 | 39.1% |
| Total Occupied Housing Units | 14,162 | 100.0% |
Occupancy by Household Size in Deland
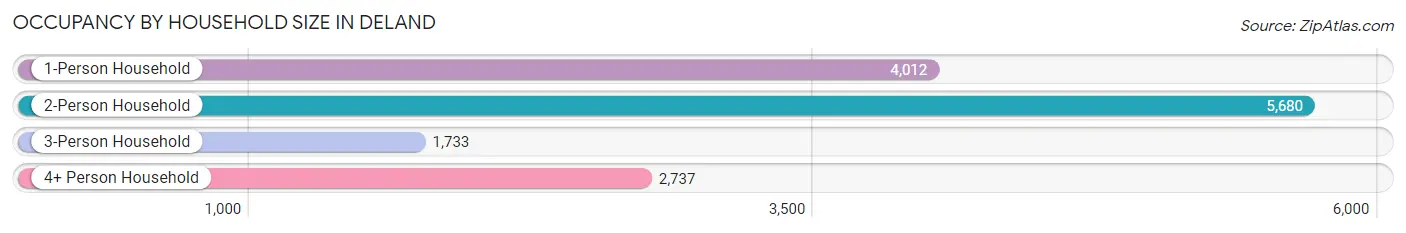
| Household Size | # Housing Units | % Housing Units |
| 1-Person Household | 4,012 | 28.3% |
| 2-Person Household | 5,680 | 40.1% |
| 3-Person Household | 1,733 | 12.2% |
| 4+ Person Household | 2,737 | 19.3% |
| Total Housing Units | 14,162 | 100.0% |
Occupancy by Ownership by Household Size in Deland
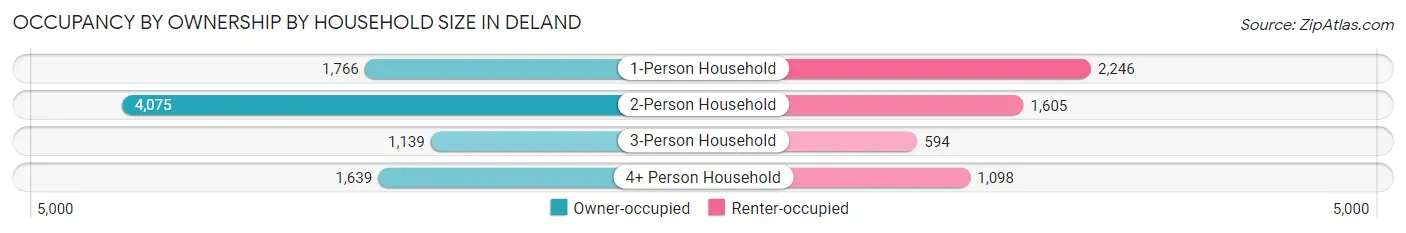
| Household Size | Owner-occupied | Renter-occupied |
| 1-Person Household | 1,766 (44.0%) | 2,246 (56.0%) |
| 2-Person Household | 4,075 (71.7%) | 1,605 (28.3%) |
| 3-Person Household | 1,139 (65.7%) | 594 (34.3%) |
| 4+ Person Household | 1,639 (59.9%) | 1,098 (40.1%) |
| Total Housing Units | 8,619 (60.9%) | 5,543 (39.1%) |
Occupancy by Educational Attainment in Deland
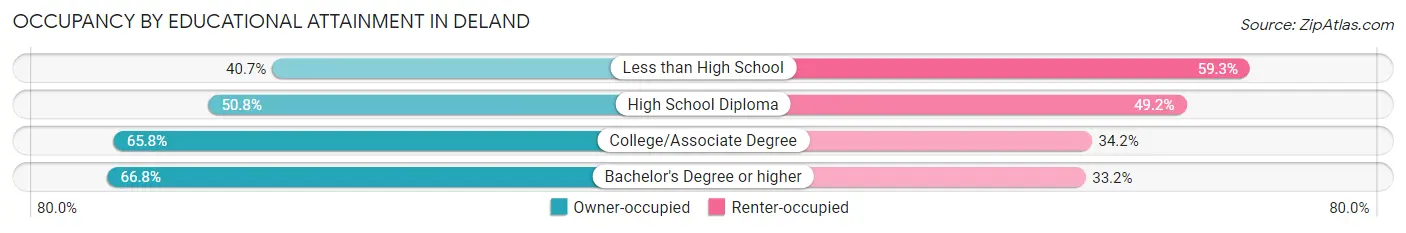
| Household Size | Owner-occupied | Renter-occupied |
| Less than High School | 396 (40.7%) | 576 (59.3%) |
| High School Diploma | 1,724 (50.8%) | 1,668 (49.2%) |
| College/Associate Degree | 3,249 (65.8%) | 1,686 (34.2%) |
| Bachelor's Degree or higher | 3,250 (66.8%) | 1,613 (33.2%) |
Occupancy by Age of Householder in Deland
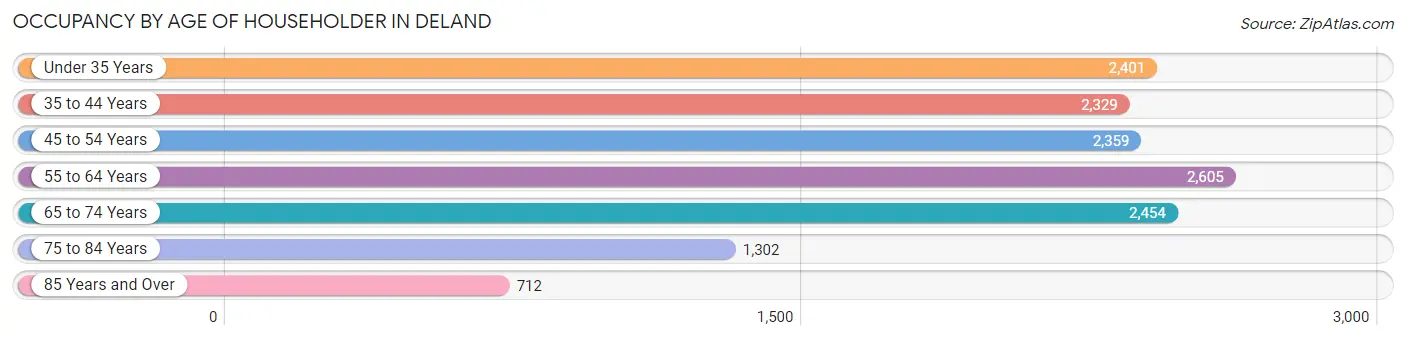
| Age Bracket | # Households | % Households |
| Under 35 Years | 2,401 | 17.0% |
| 35 to 44 Years | 2,329 | 16.5% |
| 45 to 54 Years | 2,359 | 16.7% |
| 55 to 64 Years | 2,605 | 18.4% |
| 65 to 74 Years | 2,454 | 17.3% |
| 75 to 84 Years | 1,302 | 9.2% |
| 85 Years and Over | 712 | 5.0% |
| Total | 14,162 | 100.0% |
Housing Finances in Deland
Median Income by Occupancy in Deland
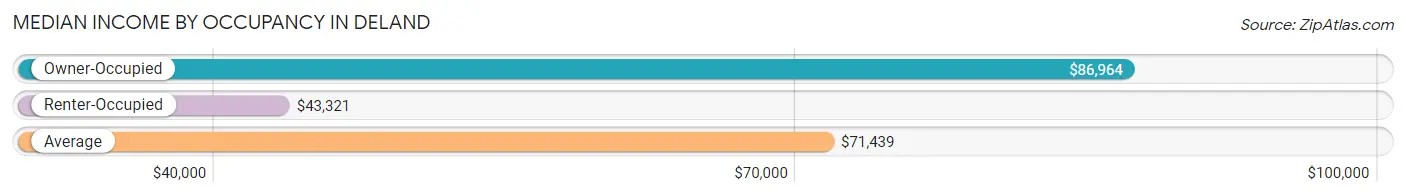
| Occupancy Type | # Households | Median Income |
| Owner-Occupied | 8,619 (60.9%) | $86,964 |
| Renter-Occupied | 5,543 (39.1%) | $43,321 |
| Average | 14,162 (100.0%) | $71,439 |
Occupancy by Householder Income Bracket in Deland
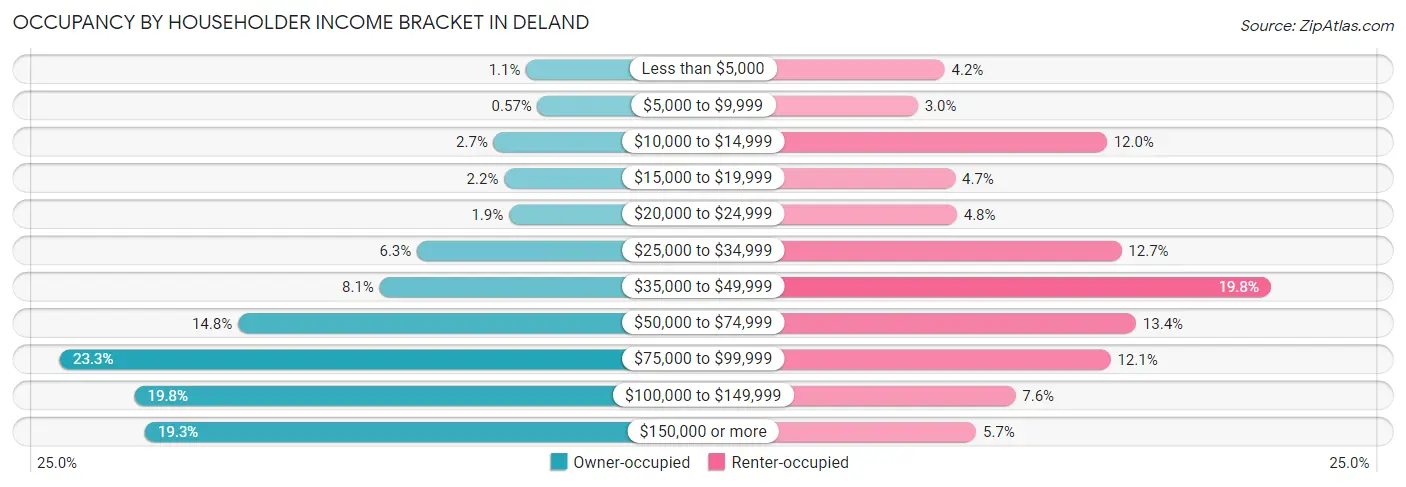
| Income Bracket | Owner-occupied | Renter-occupied |
| Less than $5,000 | 96 (1.1%) | 235 (4.2%) |
| $5,000 to $9,999 | 49 (0.6%) | 164 (3.0%) |
| $10,000 to $14,999 | 229 (2.7%) | 663 (12.0%) |
| $15,000 to $19,999 | 186 (2.2%) | 263 (4.7%) |
| $20,000 to $24,999 | 166 (1.9%) | 267 (4.8%) |
| $25,000 to $34,999 | 544 (6.3%) | 702 (12.7%) |
| $35,000 to $49,999 | 697 (8.1%) | 1,096 (19.8%) |
| $50,000 to $74,999 | 1,279 (14.8%) | 740 (13.4%) |
| $75,000 to $99,999 | 2,009 (23.3%) | 673 (12.1%) |
| $100,000 to $149,999 | 1,703 (19.8%) | 422 (7.6%) |
| $150,000 or more | 1,661 (19.3%) | 318 (5.7%) |
| Total | 8,619 (100.0%) | 5,543 (100.0%) |
Monthly Housing Cost Tiers in Deland
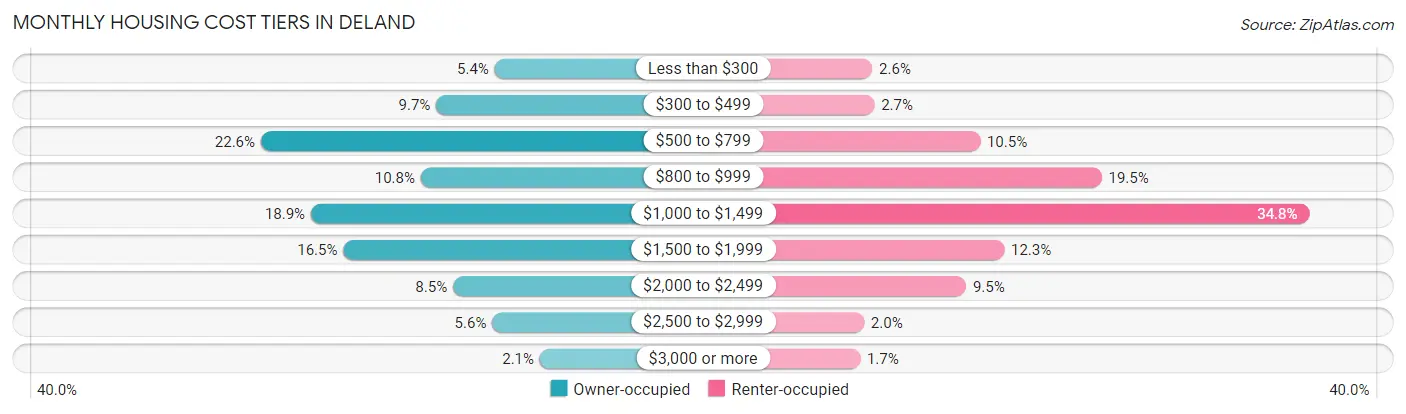
| Monthly Cost | Owner-occupied | Renter-occupied |
| Less than $300 | 464 (5.4%) | 142 (2.6%) |
| $300 to $499 | 835 (9.7%) | 150 (2.7%) |
| $500 to $799 | 1,948 (22.6%) | 582 (10.5%) |
| $800 to $999 | 933 (10.8%) | 1,078 (19.5%) |
| $1,000 to $1,499 | 1,630 (18.9%) | 1,926 (34.7%) |
| $1,500 to $1,999 | 1,425 (16.5%) | 680 (12.3%) |
| $2,000 to $2,499 | 728 (8.5%) | 525 (9.5%) |
| $2,500 to $2,999 | 479 (5.6%) | 108 (1.9%) |
| $3,000 or more | 177 (2.1%) | 92 (1.7%) |
| Total | 8,619 (100.0%) | 5,543 (100.0%) |
Physical Housing Characteristics in Deland
Housing Structures in Deland
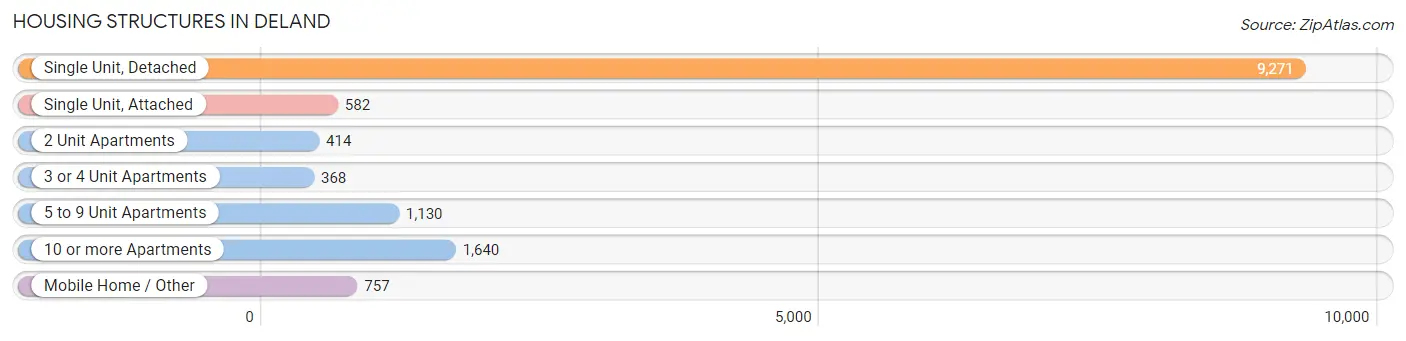
| Structure Type | # Housing Units | % Housing Units |
| Single Unit, Detached | 9,271 | 65.5% |
| Single Unit, Attached | 582 | 4.1% |
| 2 Unit Apartments | 414 | 2.9% |
| 3 or 4 Unit Apartments | 368 | 2.6% |
| 5 to 9 Unit Apartments | 1,130 | 8.0% |
| 10 or more Apartments | 1,640 | 11.6% |
| Mobile Home / Other | 757 | 5.3% |
| Total | 14,162 | 100.0% |
Housing Structures by Occupancy in Deland
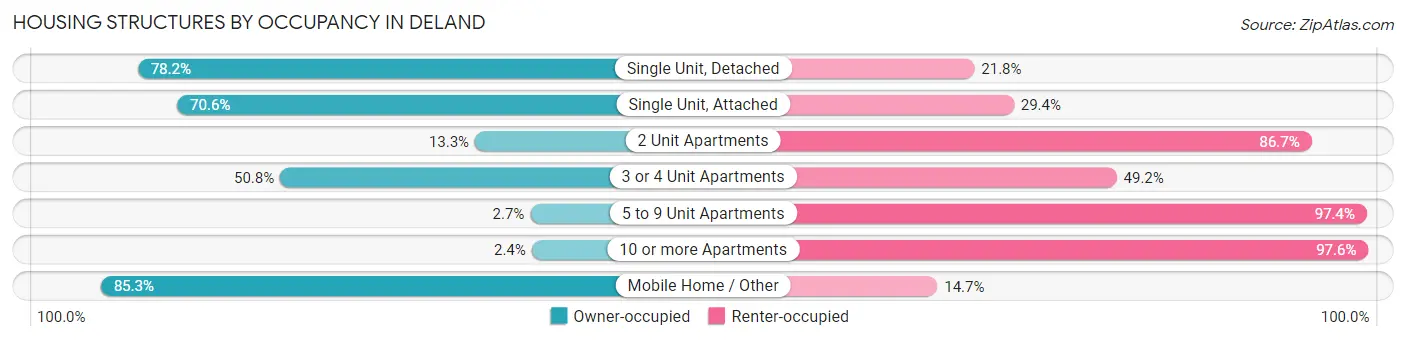
| Structure Type | Owner-occupied | Renter-occupied |
| Single Unit, Detached | 7,251 (78.2%) | 2,020 (21.8%) |
| Single Unit, Attached | 411 (70.6%) | 171 (29.4%) |
| 2 Unit Apartments | 55 (13.3%) | 359 (86.7%) |
| 3 or 4 Unit Apartments | 187 (50.8%) | 181 (49.2%) |
| 5 to 9 Unit Apartments | 30 (2.6%) | 1,100 (97.4%) |
| 10 or more Apartments | 39 (2.4%) | 1,601 (97.6%) |
| Mobile Home / Other | 646 (85.3%) | 111 (14.7%) |
| Total | 8,619 (60.9%) | 5,543 (39.1%) |
Housing Structures by Number of Rooms in Deland
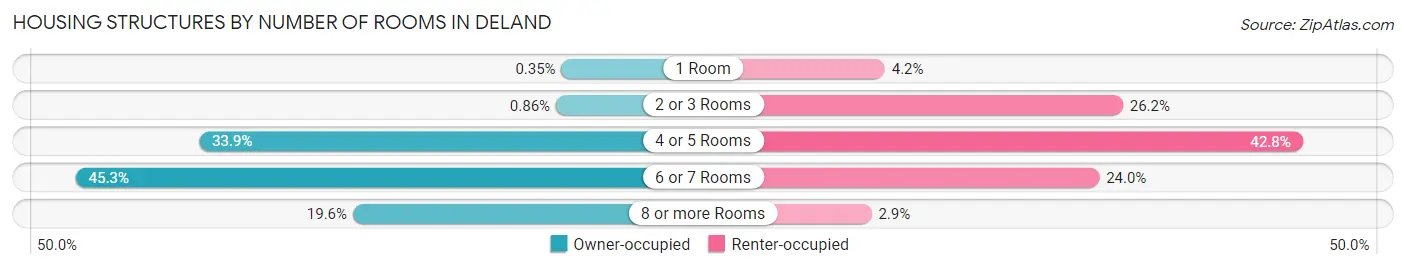
| Number of Rooms | Owner-occupied | Renter-occupied |
| 1 Room | 30 (0.4%) | 230 (4.2%) |
| 2 or 3 Rooms | 74 (0.9%) | 1,450 (26.2%) |
| 4 or 5 Rooms | 2,919 (33.9%) | 2,372 (42.8%) |
| 6 or 7 Rooms | 3,903 (45.3%) | 1,329 (24.0%) |
| 8 or more Rooms | 1,693 (19.6%) | 162 (2.9%) |
| Total | 8,619 (100.0%) | 5,543 (100.0%) |
Housing Structure by Heating Type in Deland
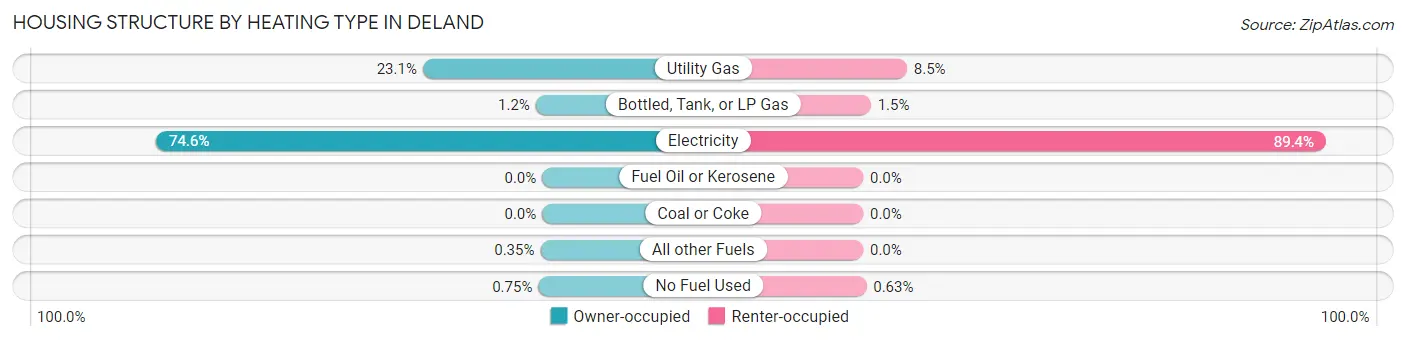
| Heating Type | Owner-occupied | Renter-occupied |
| Utility Gas | 1,988 (23.1%) | 469 (8.5%) |
| Bottled, Tank, or LP Gas | 107 (1.2%) | 82 (1.5%) |
| Electricity | 6,429 (74.6%) | 4,957 (89.4%) |
| Fuel Oil or Kerosene | 0 (0.0%) | 0 (0.0%) |
| Coal or Coke | 0 (0.0%) | 0 (0.0%) |
| All other Fuels | 30 (0.4%) | 0 (0.0%) |
| No Fuel Used | 65 (0.7%) | 35 (0.6%) |
| Total | 8,619 (100.0%) | 5,543 (100.0%) |
Household Vehicle Usage in Deland
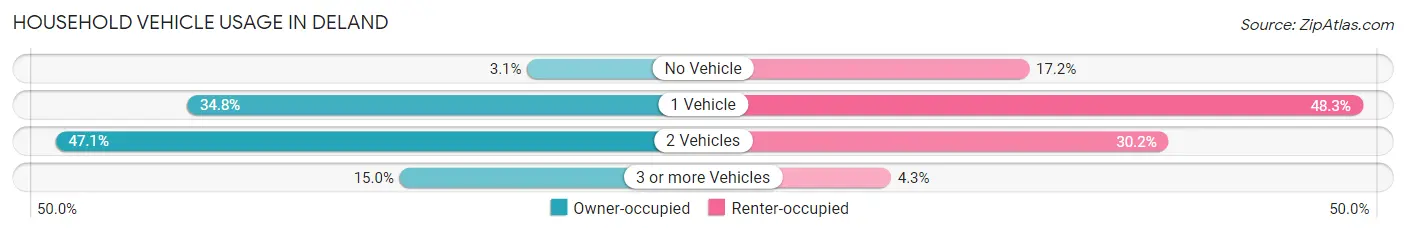
| Vehicles per Household | Owner-occupied | Renter-occupied |
| No Vehicle | 265 (3.1%) | 953 (17.2%) |
| 1 Vehicle | 3,003 (34.8%) | 2,679 (48.3%) |
| 2 Vehicles | 4,060 (47.1%) | 1,674 (30.2%) |
| 3 or more Vehicles | 1,291 (15.0%) | 237 (4.3%) |
| Total | 8,619 (100.0%) | 5,543 (100.0%) |
Real Estate & Mortgages in Deland
Real Estate and Mortgage Overview in Deland
| Characteristic | Without Mortgage | With Mortgage |
| Housing Units | 3,640 | 4,979 |
| Median Property Value | $262,700 | $287,600 |
| Median Household Income | $72,283 | $1,270 |
| Monthly Housing Costs | $601 | $177 |
| Real Estate Taxes | $2,574 | $126 |
Property Value by Mortgage Status in Deland
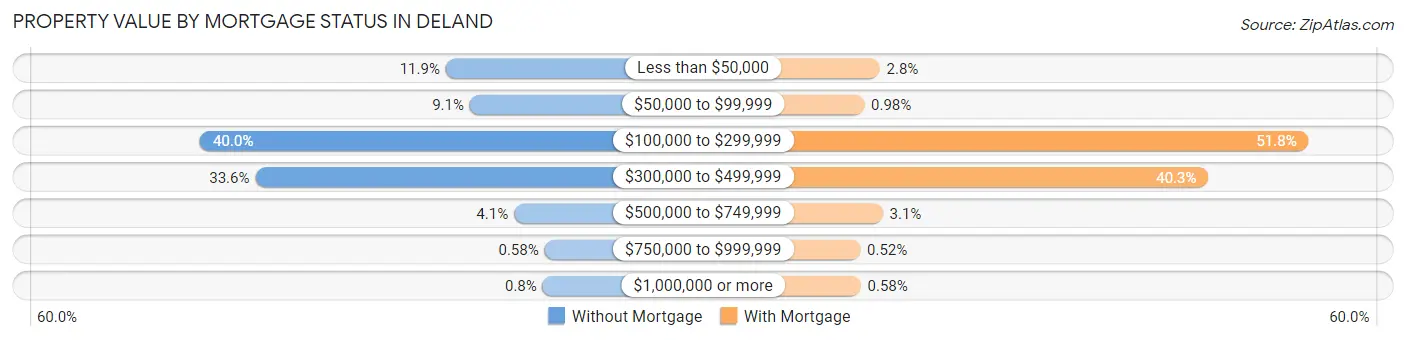
| Property Value | Without Mortgage | With Mortgage |
| Less than $50,000 | 432 (11.9%) | 137 (2.8%) |
| $50,000 to $99,999 | 332 (9.1%) | 49 (1.0%) |
| $100,000 to $299,999 | 1,454 (40.0%) | 2,577 (51.8%) |
| $300,000 to $499,999 | 1,224 (33.6%) | 2,007 (40.3%) |
| $500,000 to $749,999 | 148 (4.1%) | 154 (3.1%) |
| $750,000 to $999,999 | 21 (0.6%) | 26 (0.5%) |
| $1,000,000 or more | 29 (0.8%) | 29 (0.6%) |
| Total | 3,640 (100.0%) | 4,979 (100.0%) |
Household Income by Mortgage Status in Deland
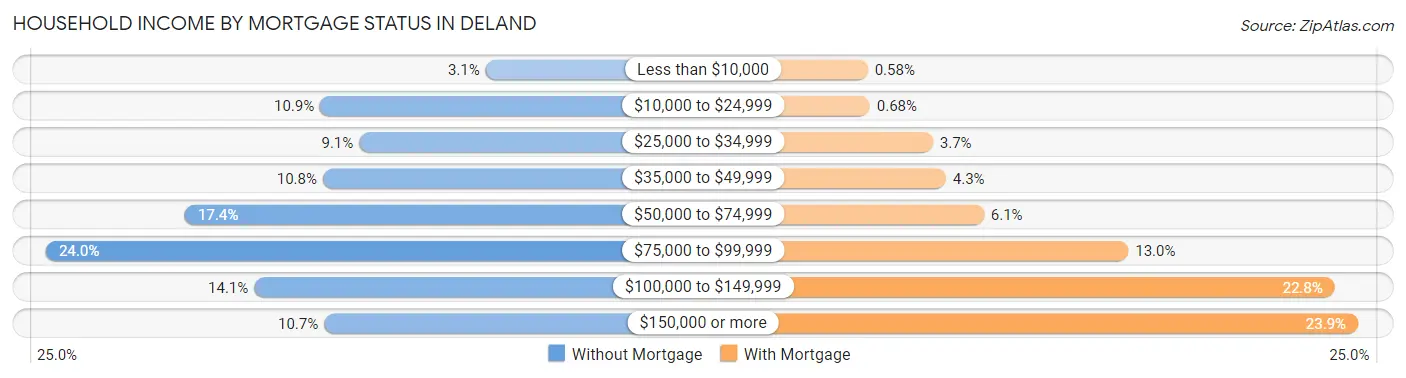
| Household Income | Without Mortgage | With Mortgage |
| Less than $10,000 | 111 (3.0%) | 29 (0.6%) |
| $10,000 to $24,999 | 398 (10.9%) | 34 (0.7%) |
| $25,000 to $34,999 | 330 (9.1%) | 183 (3.7%) |
| $35,000 to $49,999 | 393 (10.8%) | 214 (4.3%) |
| $50,000 to $74,999 | 632 (17.4%) | 304 (6.1%) |
| $75,000 to $99,999 | 873 (24.0%) | 647 (13.0%) |
| $100,000 to $149,999 | 512 (14.1%) | 1,136 (22.8%) |
| $150,000 or more | 391 (10.7%) | 1,191 (23.9%) |
| Total | 3,640 (100.0%) | 4,979 (100.0%) |
Property Value to Household Income Ratio in Deland
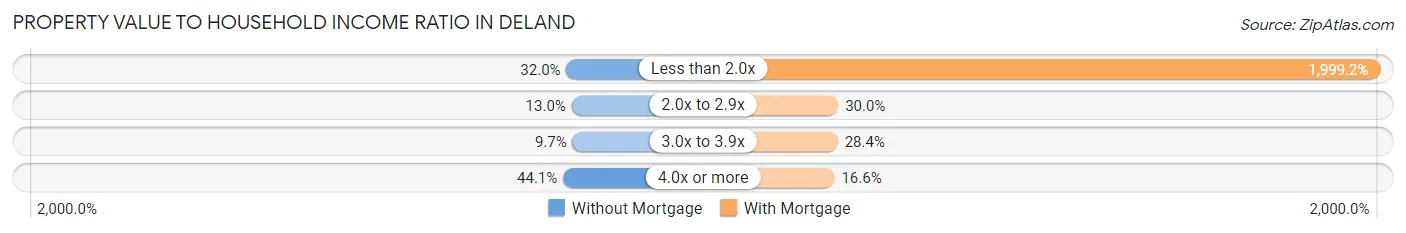
| Value-to-Income Ratio | Without Mortgage | With Mortgage |
| Less than 2.0x | 1,165 (32.0%) | 99,540 (1,999.2%) |
| 2.0x to 2.9x | 473 (13.0%) | 1,495 (30.0%) |
| 3.0x to 3.9x | 354 (9.7%) | 1,416 (28.4%) |
| 4.0x or more | 1,604 (44.1%) | 825 (16.6%) |
| Total | 3,640 (100.0%) | 4,979 (100.0%) |
Real Estate Taxes by Mortgage Status in Deland
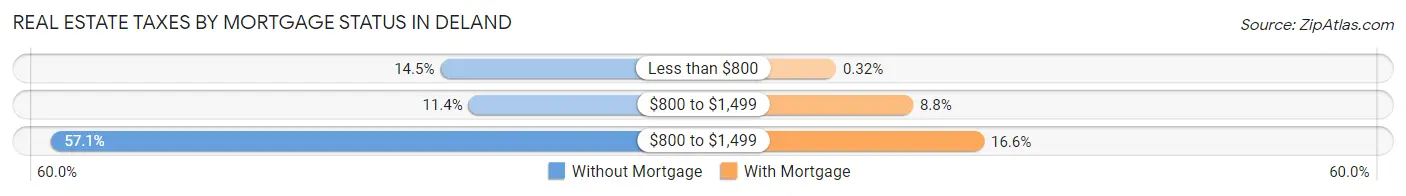
| Property Taxes | Without Mortgage | With Mortgage |
| Less than $800 | 526 (14.4%) | 16 (0.3%) |
| $800 to $1,499 | 413 (11.4%) | 436 (8.8%) |
| $800 to $1,499 | 2,077 (57.1%) | 824 (16.6%) |
| Total | 3,640 (100.0%) | 4,979 (100.0%) |
Health & Disability in Deland
Health Insurance Coverage by Age in Deland
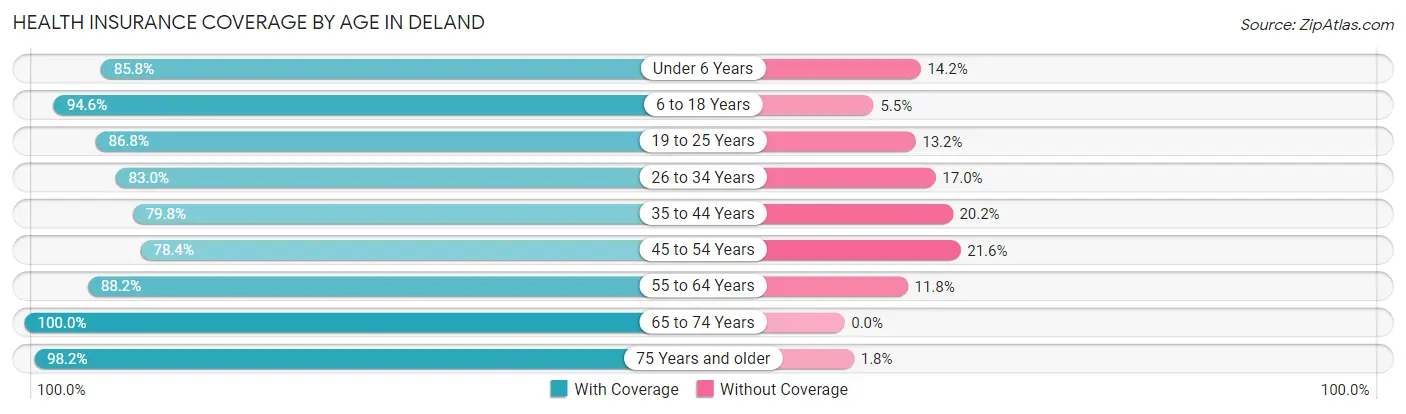
| Age Bracket | With Coverage | Without Coverage |
| Under 6 Years | 2,457 (85.8%) | 407 (14.2%) |
| 6 to 18 Years | 6,209 (94.6%) | 358 (5.4%) |
| 19 to 25 Years | 3,761 (86.8%) | 574 (13.2%) |
| 26 to 34 Years | 3,073 (83.0%) | 629 (17.0%) |
| 35 to 44 Years | 3,494 (79.8%) | 883 (20.2%) |
| 45 to 54 Years | 3,276 (78.4%) | 904 (21.6%) |
| 55 to 64 Years | 3,722 (88.2%) | 498 (11.8%) |
| 65 to 74 Years | 4,054 (100.0%) | 0 (0.0%) |
| 75 Years and older | 3,101 (98.2%) | 56 (1.8%) |
| Total | 33,147 (88.5%) | 4,309 (11.5%) |
Health Insurance Coverage by Citizenship Status in Deland

| Citizenship Status | With Coverage | Without Coverage |
| Native Born | 2,457 (85.8%) | 407 (14.2%) |
| Foreign Born, Citizen | 6,209 (94.6%) | 358 (5.4%) |
| Foreign Born, not a Citizen | 3,761 (86.8%) | 574 (13.2%) |
Health Insurance Coverage by Household Income in Deland
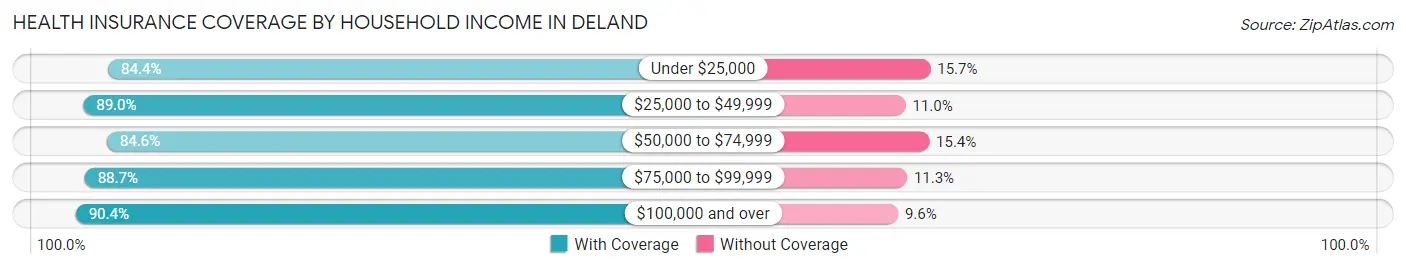
| Household Income | With Coverage | Without Coverage |
| Under $25,000 | 2,959 (84.4%) | 549 (15.7%) |
| $25,000 to $49,999 | 5,543 (89.0%) | 685 (11.0%) |
| $50,000 to $74,999 | 4,048 (84.6%) | 738 (15.4%) |
| $75,000 to $99,999 | 5,958 (88.7%) | 757 (11.3%) |
| $100,000 and over | 12,147 (90.4%) | 1,288 (9.6%) |
Public vs Private Health Insurance Coverage by Age in Deland
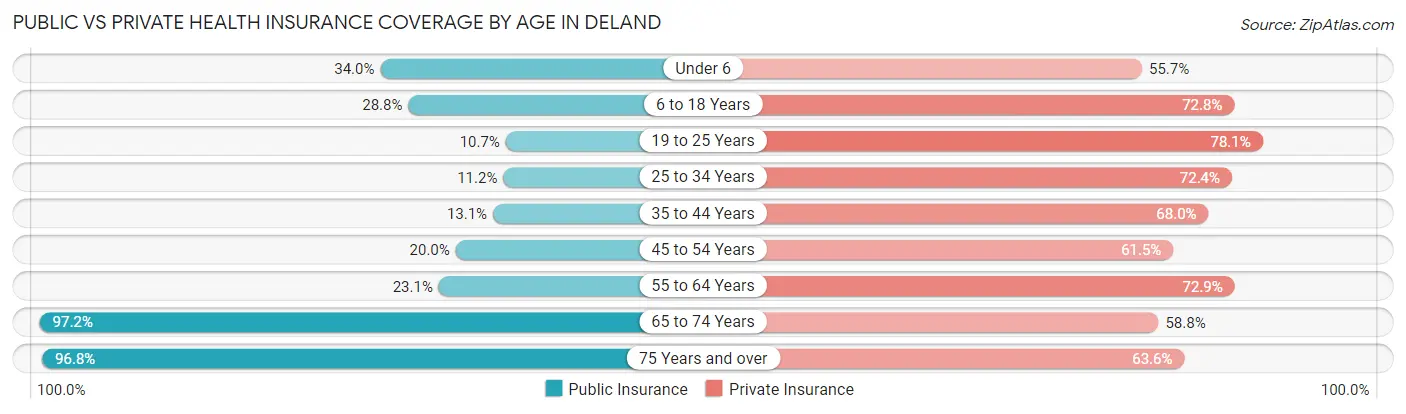
| Age Bracket | Public Insurance | Private Insurance |
| Under 6 | 973 (34.0%) | 1,596 (55.7%) |
| 6 to 18 Years | 1,890 (28.8%) | 4,783 (72.8%) |
| 19 to 25 Years | 464 (10.7%) | 3,385 (78.1%) |
| 25 to 34 Years | 413 (11.2%) | 2,680 (72.4%) |
| 35 to 44 Years | 572 (13.1%) | 2,978 (68.0%) |
| 45 to 54 Years | 836 (20.0%) | 2,571 (61.5%) |
| 55 to 64 Years | 976 (23.1%) | 3,077 (72.9%) |
| 65 to 74 Years | 3,941 (97.2%) | 2,383 (58.8%) |
| 75 Years and over | 3,055 (96.8%) | 2,007 (63.6%) |
| Total | 13,120 (35.0%) | 25,460 (68.0%) |
Disability Status by Sex by Age in Deland
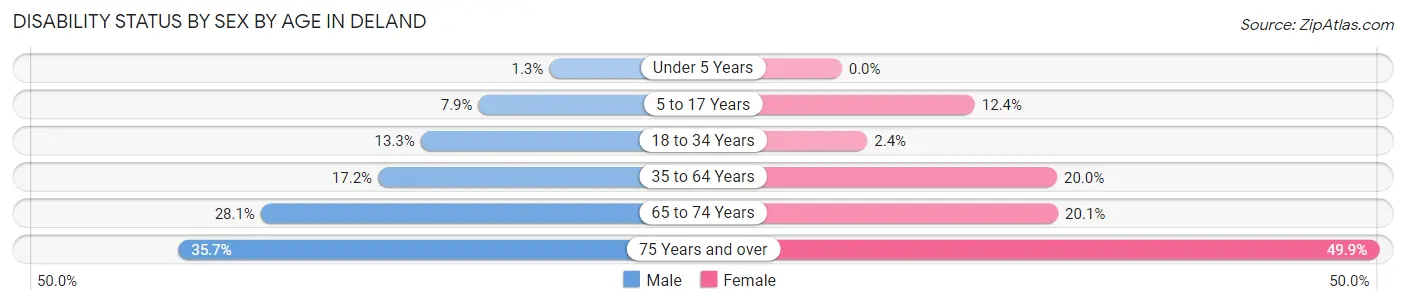
| Age Bracket | Male | Female |
| Under 5 Years | 12 (1.3%) | 0 (0.0%) |
| 5 to 17 Years | 224 (7.9%) | 342 (12.3%) |
| 18 to 34 Years | 564 (13.3%) | 119 (2.4%) |
| 35 to 64 Years | 967 (17.2%) | 1,430 (20.0%) |
| 65 to 74 Years | 484 (28.1%) | 468 (20.1%) |
| 75 Years and over | 422 (35.7%) | 985 (49.8%) |
Disability Class by Sex by Age in Deland
Disability Class: Hearing Difficulty
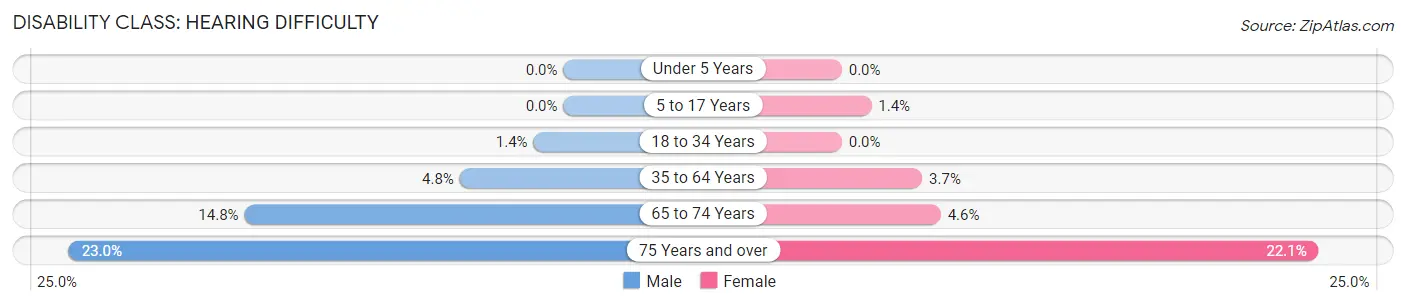
| Age Bracket | Male | Female |
| Under 5 Years | 0 (0.0%) | 0 (0.0%) |
| 5 to 17 Years | 0 (0.0%) | 38 (1.4%) |
| 18 to 34 Years | 59 (1.4%) | 0 (0.0%) |
| 35 to 64 Years | 270 (4.8%) | 267 (3.7%) |
| 65 to 74 Years | 255 (14.8%) | 107 (4.6%) |
| 75 Years and over | 271 (23.0%) | 437 (22.1%) |
Disability Class: Vision Difficulty
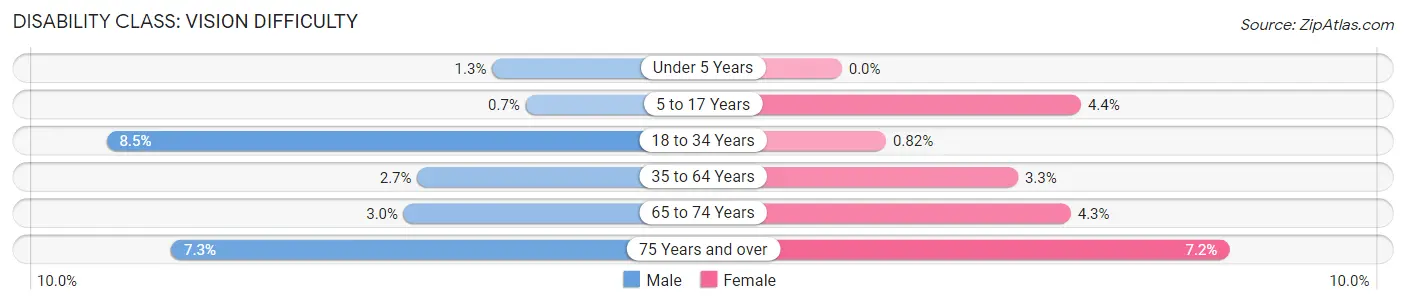
| Age Bracket | Male | Female |
| Under 5 Years | 12 (1.3%) | 0 (0.0%) |
| 5 to 17 Years | 20 (0.7%) | 123 (4.4%) |
| 18 to 34 Years | 361 (8.5%) | 41 (0.8%) |
| 35 to 64 Years | 152 (2.7%) | 234 (3.3%) |
| 65 to 74 Years | 51 (3.0%) | 99 (4.3%) |
| 75 Years and over | 86 (7.3%) | 142 (7.2%) |
Disability Class: Cognitive Difficulty
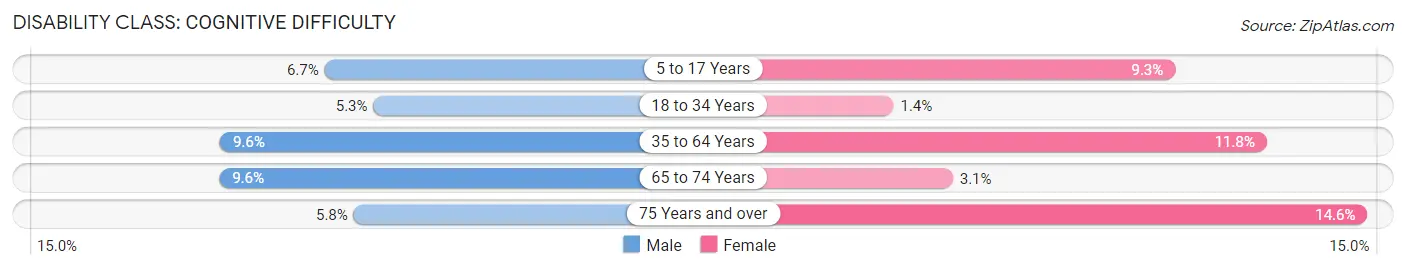
| Age Bracket | Male | Female |
| 5 to 17 Years | 189 (6.7%) | 257 (9.3%) |
| 18 to 34 Years | 225 (5.3%) | 72 (1.4%) |
| 35 to 64 Years | 537 (9.6%) | 847 (11.8%) |
| 65 to 74 Years | 165 (9.6%) | 72 (3.1%) |
| 75 Years and over | 69 (5.8%) | 289 (14.6%) |
Disability Class: Ambulatory Difficulty
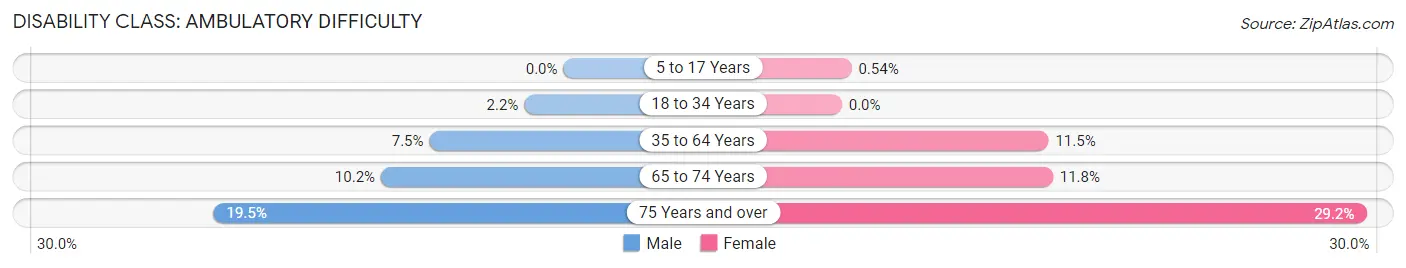
| Age Bracket | Male | Female |
| 5 to 17 Years | 0 (0.0%) | 15 (0.5%) |
| 18 to 34 Years | 93 (2.2%) | 0 (0.0%) |
| 35 to 64 Years | 419 (7.5%) | 824 (11.5%) |
| 65 to 74 Years | 175 (10.2%) | 274 (11.7%) |
| 75 Years and over | 230 (19.5%) | 577 (29.2%) |
Disability Class: Self-Care Difficulty
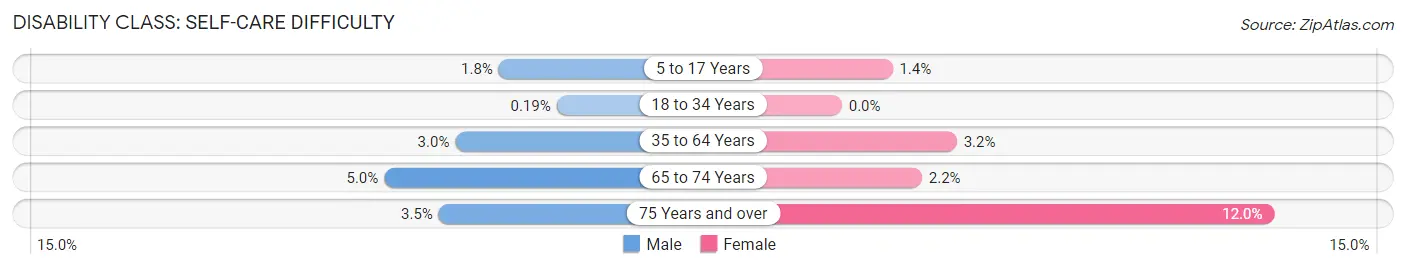
| Age Bracket | Male | Female |
| 5 to 17 Years | 51 (1.8%) | 39 (1.4%) |
| 18 to 34 Years | 8 (0.2%) | 0 (0.0%) |
| 35 to 64 Years | 169 (3.0%) | 229 (3.2%) |
| 65 to 74 Years | 86 (5.0%) | 52 (2.2%) |
| 75 Years and over | 41 (3.5%) | 238 (12.0%) |
Technology Access in Deland
Computing Device Access in Deland
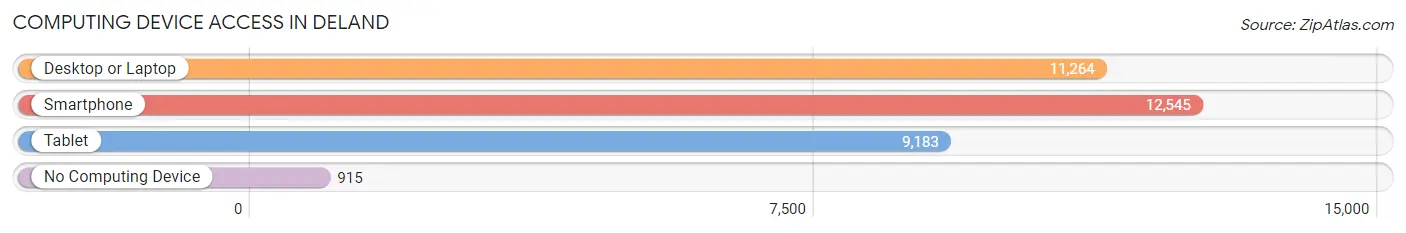
| Device Type | # Households | % Households |
| Desktop or Laptop | 11,264 | 79.5% |
| Smartphone | 12,545 | 88.6% |
| Tablet | 9,183 | 64.8% |
| No Computing Device | 915 | 6.5% |
| Total | 14,162 | 100.0% |
Internet Access in Deland
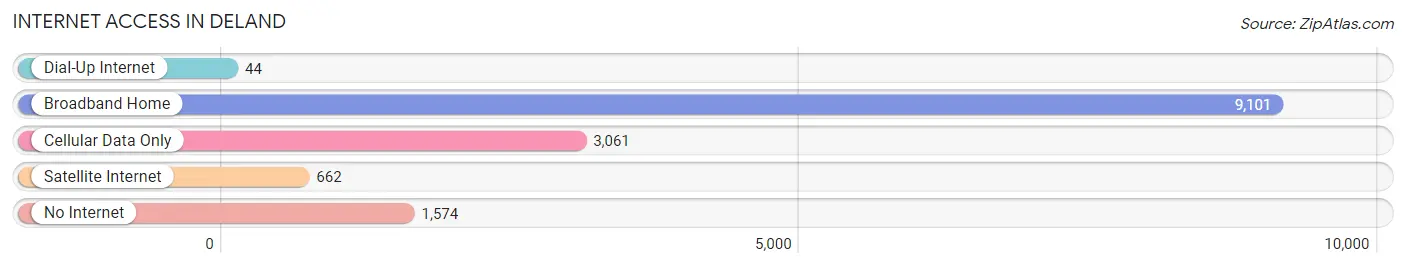
| Internet Type | # Households | % Households |
| Dial-Up Internet | 44 | 0.3% |
| Broadband Home | 9,101 | 64.3% |
| Cellular Data Only | 3,061 | 21.6% |
| Satellite Internet | 662 | 4.7% |
| No Internet | 1,574 | 11.1% |
| Total | 14,162 | 100.0% |
Deland Summary
Deland, Florida is a city located in Volusia County, in the central part of the state. It is the county seat of Volusia County and is part of the Deltona-Daytona Beach-Ormond Beach metropolitan area. The city has a population of approximately 28,000 people and is known for its historic downtown area, which is home to a variety of shops, restaurants, and other attractions.
History
Deland was founded in 1876 by Henry A. DeLand, a New York businessman who had moved to Florida in search of a healthier climate. He purchased a large tract of land and began to develop the area, naming it after himself. The city was incorporated in 1882 and quickly became a popular destination for tourists and settlers alike.
In the early 1900s, DeLand was a thriving agricultural center, with citrus groves, vegetable farms, and cattle ranches. The city was also home to several educational institutions, including Stetson University, which was founded in 1883.
Geography
Deland is located in central Florida, about 30 miles southwest of Daytona Beach and 40 miles northeast of Orlando. The city is situated on the St. Johns River, which flows through the city and provides a scenic backdrop. The city is also home to several lakes, including Lake Beresford, Lake Winnemissett, and Lake Monroe.
The city has a total area of 16.3 square miles, of which 15.7 square miles is land and 0.6 square miles is water. The city is located in a humid subtropical climate zone, with hot, humid summers and mild winters.
Economy
Deland’s economy is largely based on tourism, with many visitors coming to the city to enjoy its historic downtown area and other attractions. The city is also home to several manufacturing and distribution companies, as well as a number of retail stores.
The city is home to Stetson University, which is one of the largest employers in the area. The university has an enrollment of over 4,000 students and employs over 1,000 faculty and staff.
Demographics
As of the 2010 census, the population of DeLand was 28,237. The racial makeup of the city was 75.3% White, 17.2% African American, 0.5% Native American, 1.7% Asian, 0.1% Pacific Islander, and 4.2% from other races. Hispanic or Latino of any race were 11.2% of the population.
The median income for a household in the city was $37,845, and the median income for a family was $45,945. The per capita income for the city was $20,945. About 15.2% of the population was below the poverty line.
Deland is a vibrant city with a rich history and a diverse population. The city is home to a variety of attractions, including its historic downtown area, Stetson University, and several lakes and parks. The city’s economy is largely based on tourism, with many visitors coming to the city to enjoy its attractions. The city also has a number of manufacturing and distribution companies, as well as a number of retail stores. The city has a population of 28,237 people, with a median income of $37,845.
Common Questions
What is Per Capita Income in Deland?
Per Capita income in Deland is $32,718.
What is the Median Family Income in Deland?
Median Family Income in Deland is $85,904.
What is the Median Household income in Deland?
Median Household Income in Deland is $71,439.
What is Income or Wage Gap in Deland?
Income or Wage Gap in Deland is 32.7%.
Women in Deland earn 67.3 cents for every dollar earned by a man.
What is Family Income Deficit in Deland?
Family Income Deficit in Deland is $6,329.
Families that are below poverty line in Deland earn $6,329 less on average than the poverty threshold level.
What is Inequality or Gini Index in Deland?
Inequality or Gini Index in Deland is 0.43.
What is the Total Population of Deland?
Total Population of Deland is 38,392.
What is the Total Male Population of Deland?
Total Male Population of Deland is 16,913.
What is the Total Female Population of Deland?
Total Female Population of Deland is 21,479.
What is the Ratio of Males per 100 Females in Deland?
There are 78.74 Males per 100 Females in Deland.
What is the Ratio of Females per 100 Males in Deland?
There are 127.00 Females per 100 Males in Deland.
What is the Median Population Age in Deland?
Median Population Age in Deland is 38.1 Years.
What is the Average Family Size in Deland
Average Family Size in Deland is 3.1 People.
What is the Average Household Size in Deland
Average Household Size in Deland is 2.5 People.
How Large is the Labor Force in Deland?
There are 16,556 People in the Labor Forcein in Deland.
What is the Percentage of People in the Labor Force in Deland?
53.0% of People are in the Labor Force in Deland.
What is the Unemployment Rate in Deland?
Unemployment Rate in Deland is 4.1%.