Jupiter, FL Map & Demographics
Jupiter Map
Jupiter Overview
$67,483
PER CAPITA INCOME
$126,074
AVG FAMILY INCOME
$105,413
AVG HOUSEHOLD INCOME
34.6%
WAGE / INCOME GAP [ % ]
65.4¢/ $1
WAGE / INCOME GAP [ $ ]
$14,676
FAMILY INCOME DEFICIT
0.52
INEQUALITY / GINI INDEX
60,926
TOTAL POPULATION
30,051
MALE POPULATION
30,875
FEMALE POPULATION
97.33
MALES / 100 FEMALES
102.74
FEMALES / 100 MALES
47.1
MEDIAN AGE
3.0
AVG FAMILY SIZE
2.4
AVG HOUSEHOLD SIZE
31,511
LABOR FORCE [ PEOPLE ]
62.0%
PERCENT IN LABOR FORCE
4.0%
UNEMPLOYMENT RATE
Jupiter Area Codes
Income in Jupiter
Income Overview in Jupiter
Per Capita Income in Jupiter is $67,483, while median incomes of families and households are $126,074 and $105,413 respectively.
| Characteristic | Number | Measure |
| Per Capita Income | 60,926 | $67,483 |
| Median Family Income | 15,884 | $126,074 |
| Mean Family Income | 15,884 | $195,035 |
| Median Household Income | 25,014 | $105,413 |
| Mean Household Income | 25,014 | $160,308 |
| Income Deficit | 15,884 | $14,676 |
| Wage / Income Gap (%) | 60,926 | 34.64% |
| Wage / Income Gap ($) | 60,926 | 65.36¢ per $1 |
| Gini / Inequality Index | 60,926 | 0.52 |
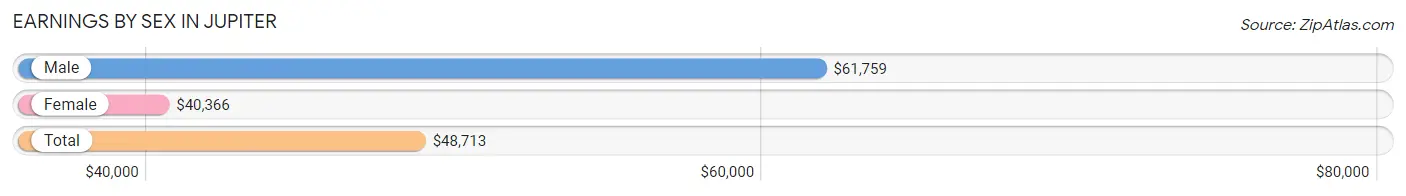
Earnings by Sex in Jupiter
Average Earnings in Jupiter are $48,713, $61,759 for men and $40,366 for women, a difference of 34.6%.
| Sex | Number | Average Earnings |
| Male | 17,533 (53.0%) | $61,759 |
| Female | 15,537 (47.0%) | $40,366 |
| Total | 33,070 (100.0%) | $48,713 |
Earnings by Sex by Income Bracket in Jupiter
The most common earnings brackets in Jupiter are $100,000+ for men (5,681 | 32.4%) and $100,000+ for women (2,059 | 13.3%).
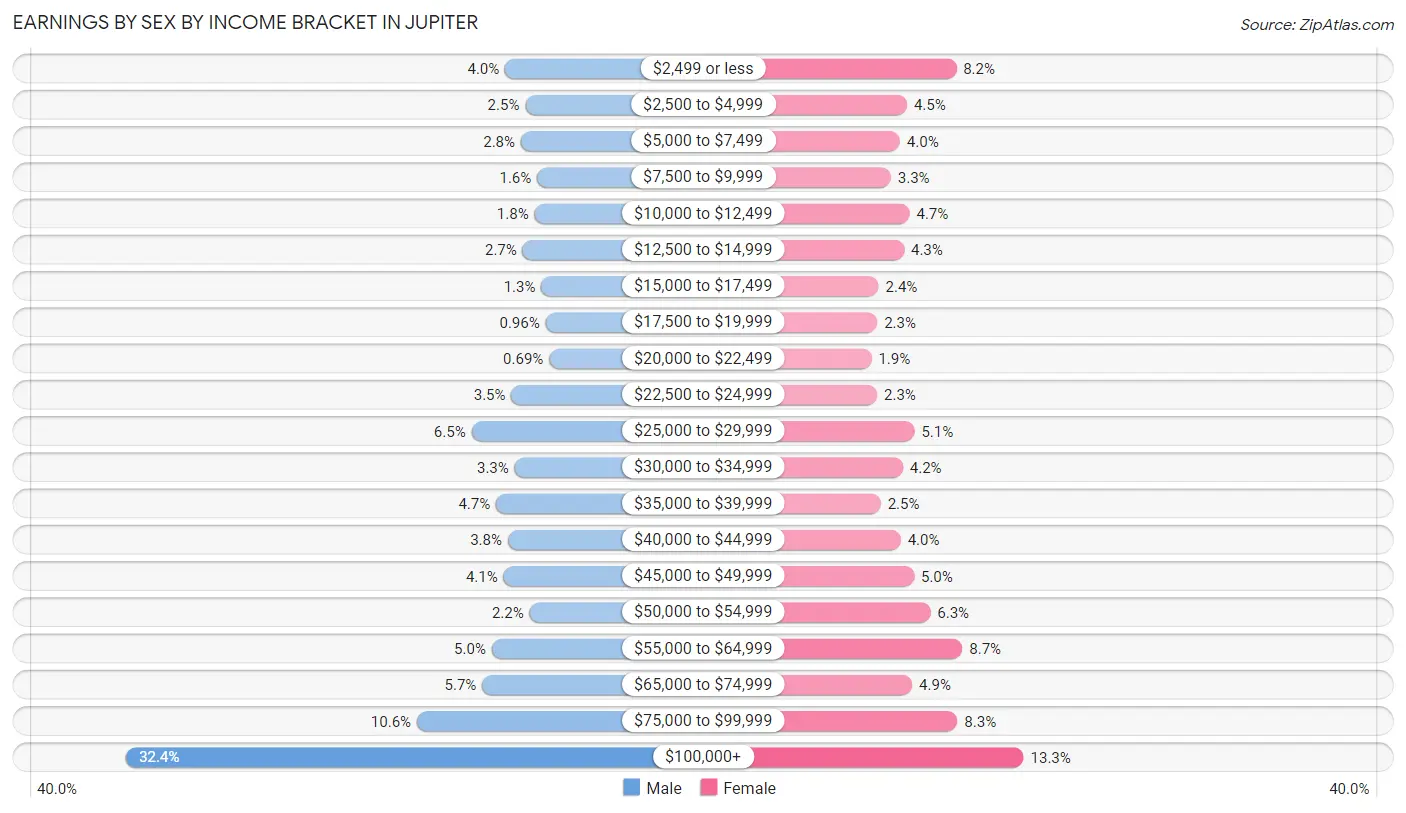
| Income | Male | Female |
| $2,499 or less | 700 (4.0%) | 1,274 (8.2%) |
| $2,500 to $4,999 | 434 (2.5%) | 700 (4.5%) |
| $5,000 to $7,499 | 492 (2.8%) | 619 (4.0%) |
| $7,500 to $9,999 | 279 (1.6%) | 512 (3.3%) |
| $10,000 to $12,499 | 313 (1.8%) | 731 (4.7%) |
| $12,500 to $14,999 | 470 (2.7%) | 666 (4.3%) |
| $15,000 to $17,499 | 225 (1.3%) | 370 (2.4%) |
| $17,500 to $19,999 | 168 (1.0%) | 354 (2.3%) |
| $20,000 to $22,499 | 121 (0.7%) | 287 (1.8%) |
| $22,500 to $24,999 | 618 (3.5%) | 352 (2.3%) |
| $25,000 to $29,999 | 1,141 (6.5%) | 788 (5.1%) |
| $30,000 to $34,999 | 575 (3.3%) | 652 (4.2%) |
| $35,000 to $39,999 | 819 (4.7%) | 395 (2.5%) |
| $40,000 to $44,999 | 665 (3.8%) | 628 (4.0%) |
| $45,000 to $49,999 | 720 (4.1%) | 783 (5.0%) |
| $50,000 to $54,999 | 378 (2.2%) | 973 (6.3%) |
| $55,000 to $64,999 | 875 (5.0%) | 1,345 (8.7%) |
| $65,000 to $74,999 | 1,001 (5.7%) | 761 (4.9%) |
| $75,000 to $99,999 | 1,858 (10.6%) | 1,288 (8.3%) |
| $100,000+ | 5,681 (32.4%) | 2,059 (13.3%) |
| Total | 17,533 (100.0%) | 15,537 (100.0%) |
Earnings by Sex by Educational Attainment in Jupiter
Average earnings in Jupiter are $73,583 for men and $47,698 for women, a difference of 35.2%. Men with an educational attainment of graduate degree enjoy the highest average annual earnings of $146,182, while those with less than high school education earn the least with $27,269. Women with an educational attainment of graduate degree earn the most with the average annual earnings of $66,168, while those with less than high school education have the smallest earnings of $11,095.
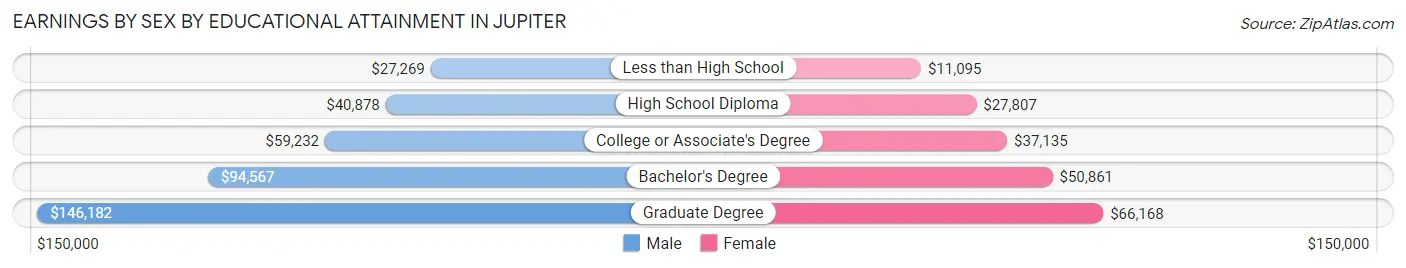
| Educational Attainment | Male Income | Female Income |
| Less than High School | $27,269 | $11,095 |
| High School Diploma | $40,878 | $27,807 |
| College or Associate's Degree | $59,232 | $37,135 |
| Bachelor's Degree | $94,567 | $50,861 |
| Graduate Degree | $146,182 | $66,168 |
| Total | $73,583 | $47,698 |
Family Income in Jupiter
Family Income Brackets in Jupiter
According to the Jupiter family income data, there are 4,320 families falling into the $200,000+ income range, which is the most common income bracket and makes up 27.2% of all families. Conversely, the $10,000 to $14,999 income bracket is the least frequent group with only 143 families (0.9%) belonging to this category.
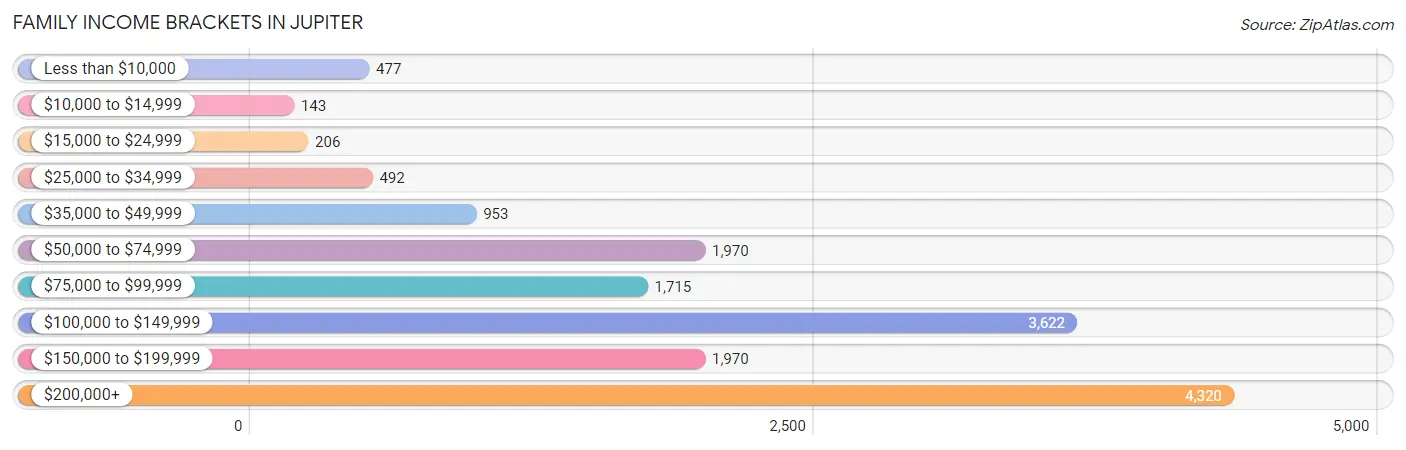
| Income Bracket | # Families | % Families |
| Less than $10,000 | 477 | 3.0% |
| $10,000 to $14,999 | 143 | 0.9% |
| $15,000 to $24,999 | 206 | 1.3% |
| $25,000 to $34,999 | 492 | 3.1% |
| $35,000 to $49,999 | 953 | 6.0% |
| $50,000 to $74,999 | 1,970 | 12.4% |
| $75,000 to $99,999 | 1,715 | 10.8% |
| $100,000 to $149,999 | 3,622 | 22.8% |
| $150,000 to $199,999 | 1,970 | 12.4% |
| $200,000+ | 4,320 | 27.2% |
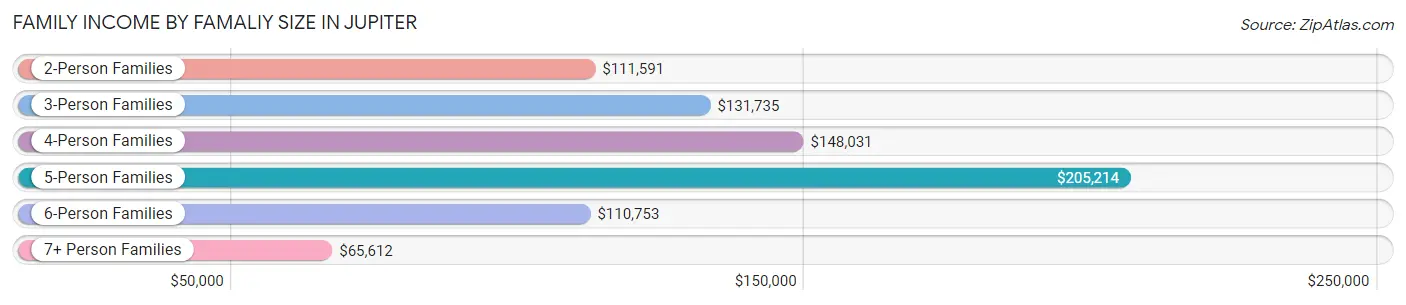
Family Income by Famaliy Size in Jupiter
5-person families (632 | 4.0%) account for the highest median family income in Jupiter with $205,214 per family, while 2-person families (8,540 | 53.8%) have the highest median income of $55,796 per family member.
| Income Bracket | # Families | Median Income |
| 2-Person Families | 8,540 (53.8%) | $111,591 |
| 3-Person Families | 3,227 (20.3%) | $131,735 |
| 4-Person Families | 3,102 (19.5%) | $148,031 |
| 5-Person Families | 632 (4.0%) | $205,214 |
| 6-Person Families | 145 (0.9%) | $110,753 |
| 7+ Person Families | 238 (1.5%) | $65,612 |
| Total | 15,884 (100.0%) | $126,074 |
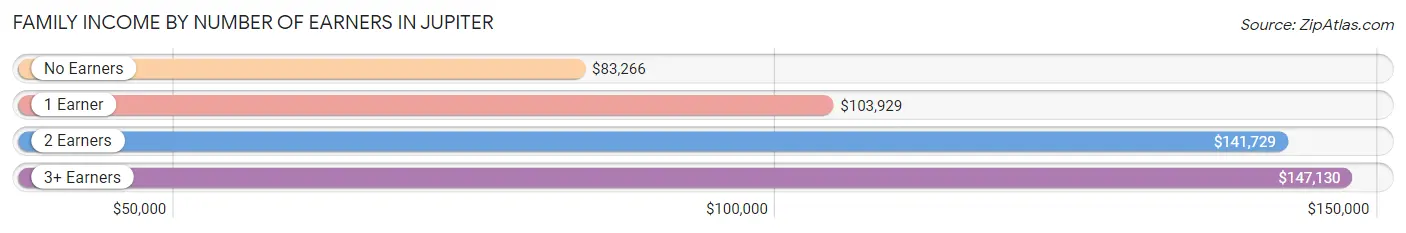
Family Income by Number of Earners in Jupiter
The median family income in Jupiter is $126,074, with families comprising 3+ earners (1,663) having the highest median family income of $147,130, while families with no earners (2,749) have the lowest median family income of $83,266, accounting for 10.5% and 17.3% of families, respectively.
| Number of Earners | # Families | Median Income |
| No Earners | 2,749 (17.3%) | $83,266 |
| 1 Earner | 4,622 (29.1%) | $103,929 |
| 2 Earners | 6,850 (43.1%) | $141,729 |
| 3+ Earners | 1,663 (10.5%) | $147,130 |
| Total | 15,884 (100.0%) | $126,074 |
Household Income in Jupiter
Household Income Brackets in Jupiter
With 5,228 households falling in the category, the $100,000 to $149,999 income range is the most frequent in Jupiter, accounting for 20.9% of all households. In contrast, only 525 households (2.1%) fall into the $10,000 to $14,999 income bracket, making it the least populous group.
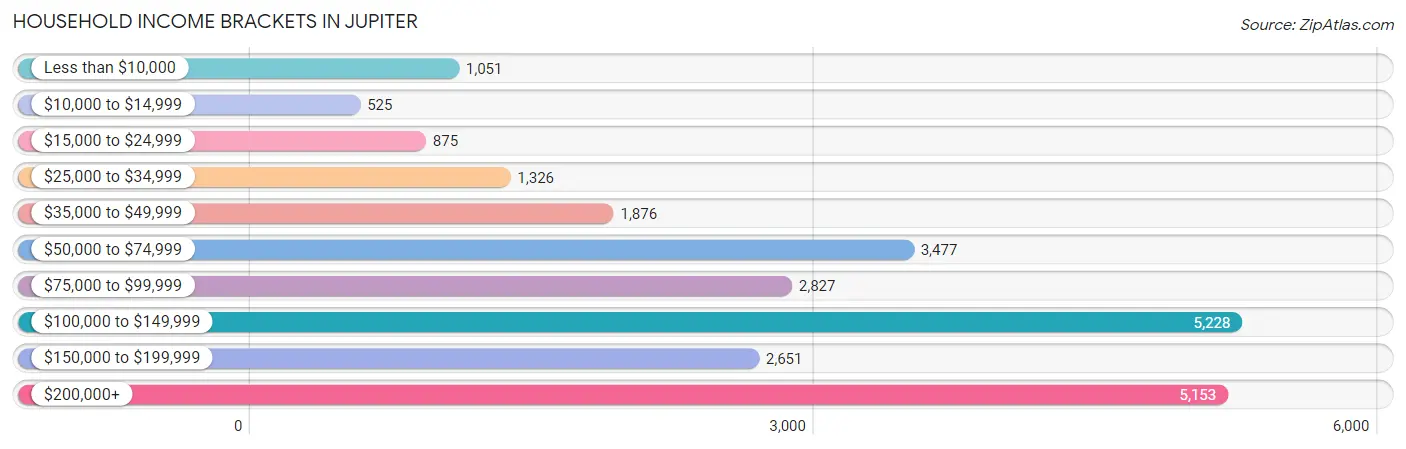
| Income Bracket | # Households | % Households |
| Less than $10,000 | 1,051 | 4.2% |
| $10,000 to $14,999 | 525 | 2.1% |
| $15,000 to $24,999 | 875 | 3.5% |
| $25,000 to $34,999 | 1,326 | 5.3% |
| $35,000 to $49,999 | 1,876 | 7.5% |
| $50,000 to $74,999 | 3,477 | 13.9% |
| $75,000 to $99,999 | 2,827 | 11.3% |
| $100,000 to $149,999 | 5,228 | 20.9% |
| $150,000 to $199,999 | 2,651 | 10.6% |
| $200,000+ | 5,153 | 20.6% |
Household Income by Householder Age in Jupiter
The median household income in Jupiter is $105,413, with the highest median household income of $118,392 found in the 45 to 64 years age bracket for the primary householder. A total of 10,292 households (41.1%) fall into this category. Meanwhile, the 15 to 24 years age bracket for the primary householder has the lowest median household income of $60,319, with 250 households (1.0%) in this group.
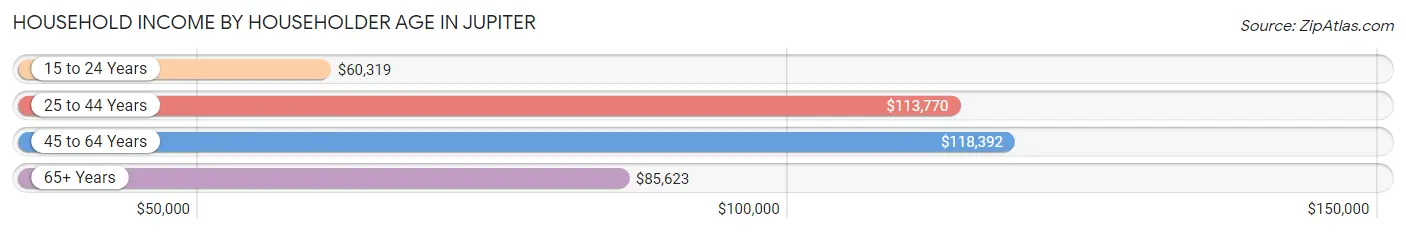
| Income Bracket | # Households | Median Income |
| 15 to 24 Years | 250 (1.0%) | $60,319 |
| 25 to 44 Years | 5,441 (21.7%) | $113,770 |
| 45 to 64 Years | 10,292 (41.1%) | $118,392 |
| 65+ Years | 9,031 (36.1%) | $85,623 |
| Total | 25,014 (100.0%) | $105,413 |
Poverty in Jupiter
Income Below Poverty by Sex and Age in Jupiter
With 7.4% poverty level for males and 8.7% for females among the residents of Jupiter, under 5 year old males and 15 year old females are the most vulnerable to poverty, with 301 males (19.5%) and 112 females (24.6%) in their respective age groups living below the poverty level.
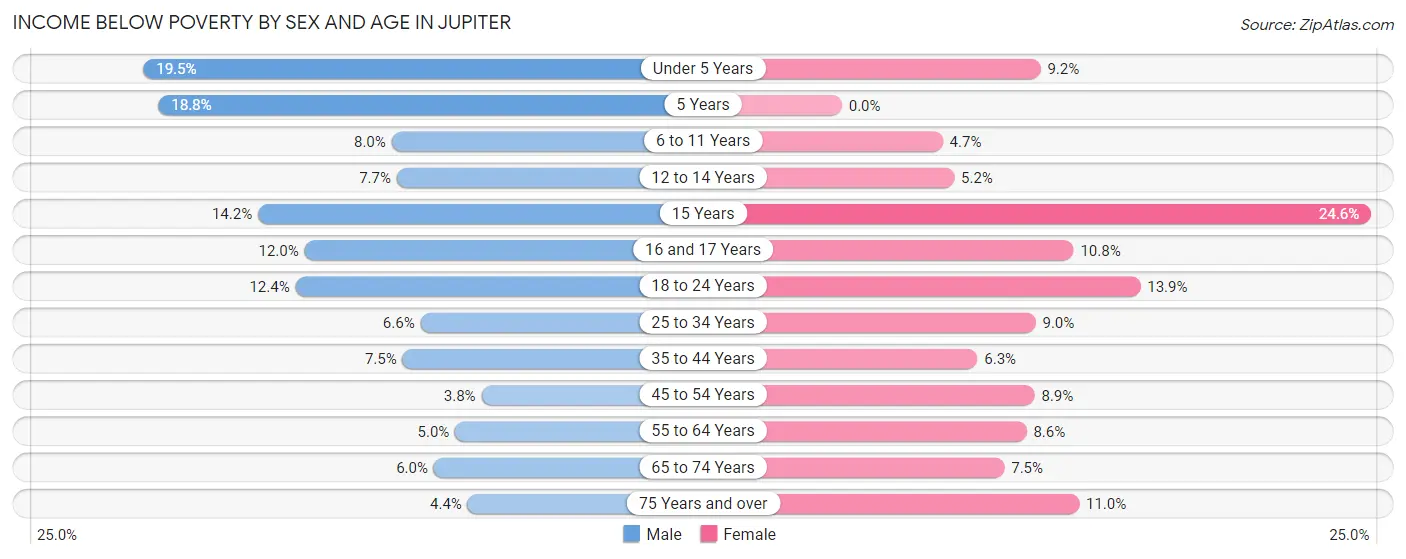
| Age Bracket | Male | Female |
| Under 5 Years | 301 (19.5%) | 79 (9.2%) |
| 5 Years | 31 (18.8%) | 0 (0.0%) |
| 6 to 11 Years | 131 (8.0%) | 98 (4.7%) |
| 12 to 14 Years | 127 (7.7%) | 54 (5.2%) |
| 15 Years | 51 (14.2%) | 112 (24.6%) |
| 16 and 17 Years | 101 (12.0%) | 60 (10.7%) |
| 18 to 24 Years | 299 (12.4%) | 286 (13.9%) |
| 25 to 34 Years | 215 (6.6%) | 276 (9.0%) |
| 35 to 44 Years | 214 (7.5%) | 237 (6.3%) |
| 45 to 54 Years | 146 (3.8%) | 396 (8.9%) |
| 55 to 64 Years | 250 (5.0%) | 368 (8.6%) |
| 65 to 74 Years | 211 (6.0%) | 296 (7.5%) |
| 75 Years and over | 123 (4.4%) | 404 (11.0%) |
| Total | 2,200 (7.4%) | 2,666 (8.7%) |
Income Above Poverty by Sex and Age in Jupiter
According to the poverty statistics in Jupiter, males aged 45 to 54 years and females aged 5 years are the age groups that are most secure financially, with 96.2% of males and 100.0% of females in these age groups living above the poverty line.
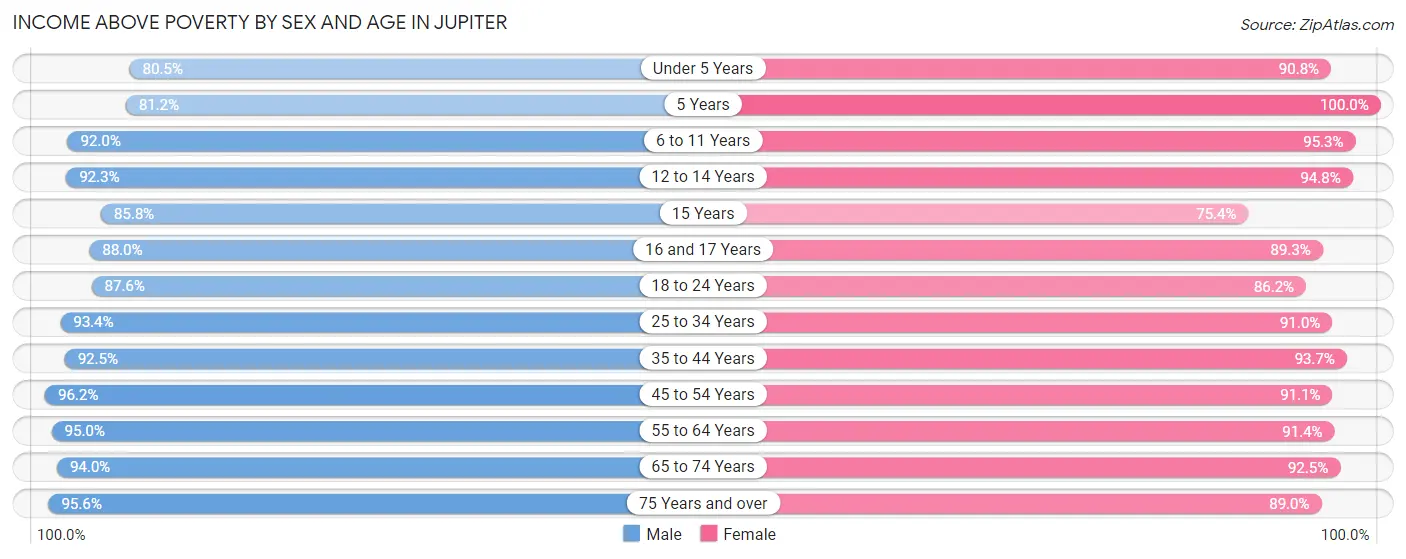
| Age Bracket | Male | Female |
| Under 5 Years | 1,243 (80.5%) | 778 (90.8%) |
| 5 Years | 134 (81.2%) | 277 (100.0%) |
| 6 to 11 Years | 1,512 (92.0%) | 1,996 (95.3%) |
| 12 to 14 Years | 1,516 (92.3%) | 983 (94.8%) |
| 15 Years | 309 (85.8%) | 344 (75.4%) |
| 16 and 17 Years | 740 (88.0%) | 498 (89.2%) |
| 18 to 24 Years | 2,106 (87.6%) | 1,779 (86.2%) |
| 25 to 34 Years | 3,028 (93.4%) | 2,795 (91.0%) |
| 35 to 44 Years | 2,656 (92.5%) | 3,533 (93.7%) |
| 45 to 54 Years | 3,695 (96.2%) | 4,032 (91.1%) |
| 55 to 64 Years | 4,732 (95.0%) | 3,925 (91.4%) |
| 65 to 74 Years | 3,301 (94.0%) | 3,629 (92.5%) |
| 75 Years and over | 2,648 (95.6%) | 3,265 (89.0%) |
| Total | 27,620 (92.6%) | 27,834 (91.3%) |
Income Below Poverty Among Married-Couple Families in Jupiter
The poverty statistics for married-couple families in Jupiter show that 4.1% or 534 of the total 12,940 families live below the poverty line. Families with 5 or more children have the highest poverty rate of 71.7%, comprising of 71 families. On the other hand, families with 3 or 4 children have the lowest poverty rate of 0.0%, which includes 0 families.
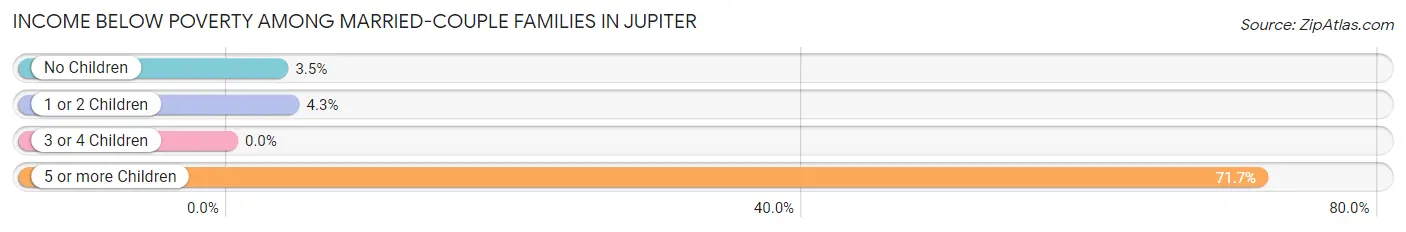
| Children | Above Poverty | Below Poverty |
| No Children | 7,943 (96.5%) | 289 (3.5%) |
| 1 or 2 Children | 3,882 (95.7%) | 174 (4.3%) |
| 3 or 4 Children | 553 (100.0%) | 0 (0.0%) |
| 5 or more Children | 28 (28.3%) | 71 (71.7%) |
| Total | 12,406 (95.9%) | 534 (4.1%) |
Income Below Poverty Among Single-Parent Households in Jupiter
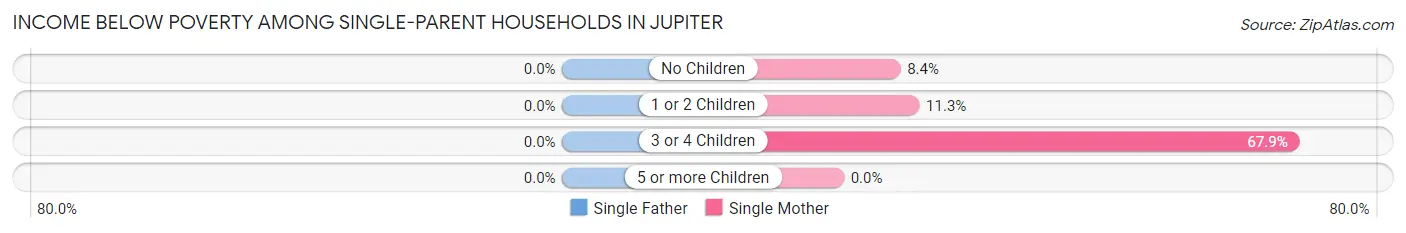
| Children | Single Father | Single Mother |
| No Children | 0 (0.0%) | 77 (8.4%) |
| 1 or 2 Children | 0 (0.0%) | 132 (11.3%) |
| 3 or 4 Children | 0 (0.0%) | 36 (67.9%) |
| 5 or more Children | 0 (0.0%) | 0 (0.0%) |
| Total | 0 (0.0%) | 245 (11.5%) |
Income Below Poverty Among Married-Couple vs Single-Parent Households in Jupiter
The poverty data for Jupiter shows that 534 of the married-couple family households (4.1%) and 245 of the single-parent households (8.3%) are living below the poverty level. Within the married-couple family households, those with 5 or more children have the highest poverty rate, with 71 households (71.7%) falling below the poverty line. Among the single-parent households, those with 3 or 4 children have the highest poverty rate, with 36 household (34.6%) living below poverty.
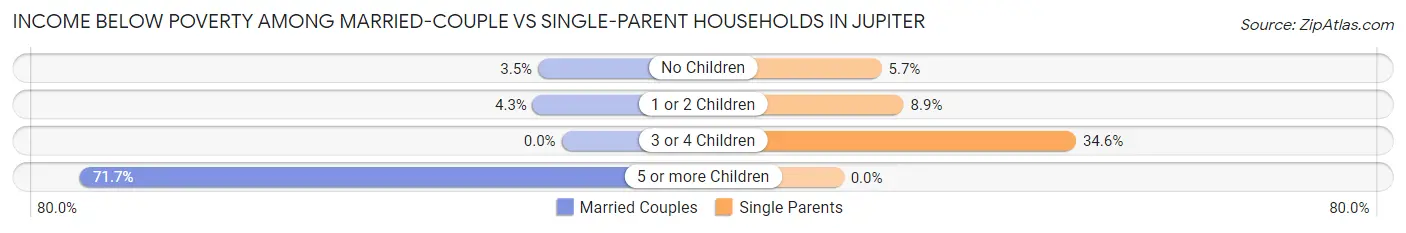
| Children | Married-Couple Families | Single-Parent Households |
| No Children | 289 (3.5%) | 77 (5.7%) |
| 1 or 2 Children | 174 (4.3%) | 132 (8.9%) |
| 3 or 4 Children | 0 (0.0%) | 36 (34.6%) |
| 5 or more Children | 71 (71.7%) | 0 (0.0%) |
| Total | 534 (4.1%) | 245 (8.3%) |
Race in Jupiter
The most populous races in Jupiter are White / Caucasian (50,726 | 83.3%), Hispanic or Latino (9,809 | 16.1%), and Two or more Races (6,809 | 11.2%).
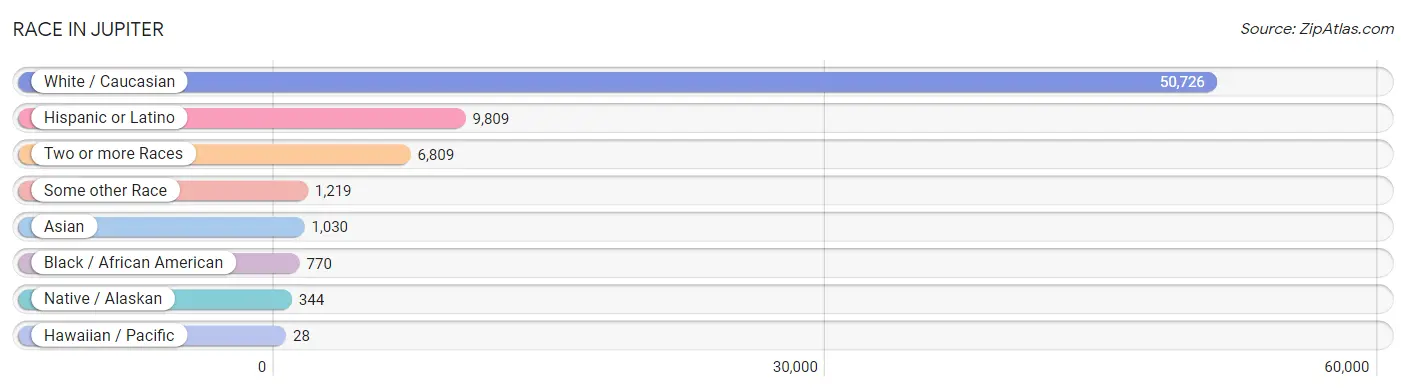
| Race | # Population | % Population |
| Asian | 1,030 | 1.7% |
| Black / African American | 770 | 1.3% |
| Hawaiian / Pacific | 28 | 0.1% |
| Hispanic or Latino | 9,809 | 16.1% |
| Native / Alaskan | 344 | 0.6% |
| White / Caucasian | 50,726 | 83.3% |
| Two or more Races | 6,809 | 11.2% |
| Some other Race | 1,219 | 2.0% |
| Total | 60,926 | 100.0% |
Ancestry in Jupiter
The most populous ancestries reported in Jupiter are Irish (10,073 | 16.5%), German (8,679 | 14.2%), English (7,460 | 12.2%), Italian (7,084 | 11.6%), and American (3,603 | 5.9%), together accounting for 60.6% of all Jupiter residents.
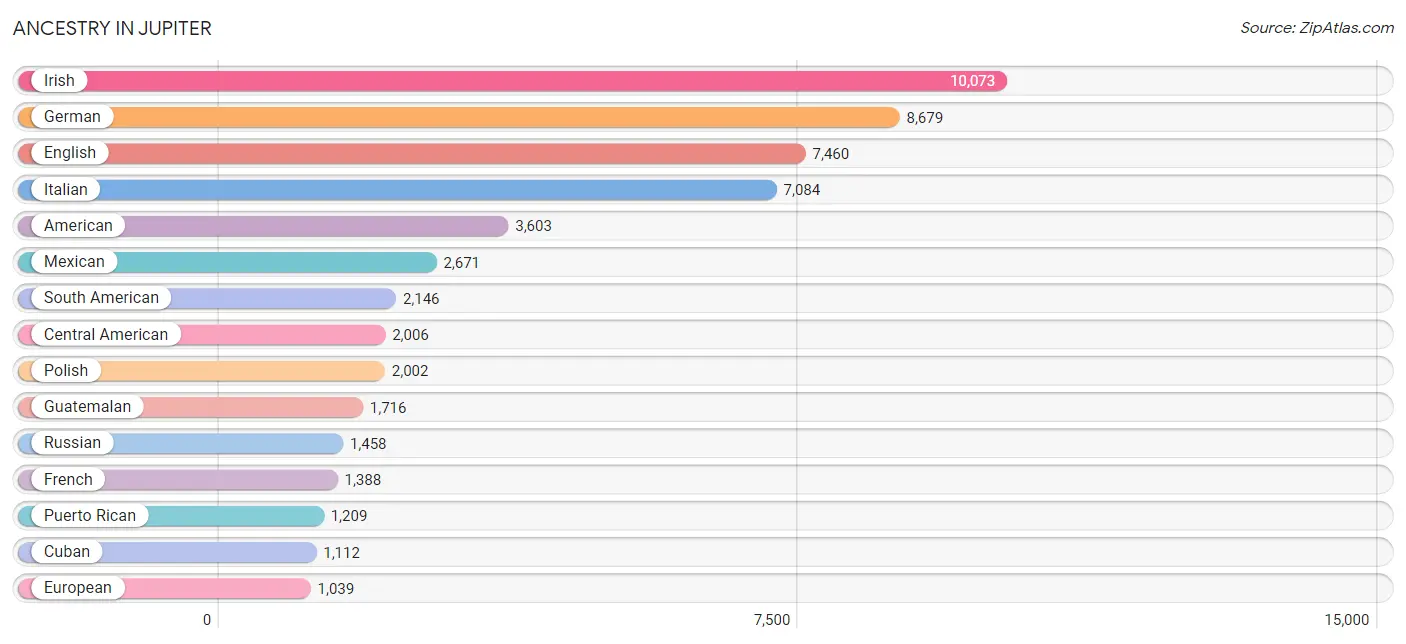
| Ancestry | # Population | % Population |
| African | 33 | 0.1% |
| Albanian | 276 | 0.4% |
| Alsatian | 9 | 0.0% |
| American | 3,603 | 5.9% |
| Arab | 194 | 0.3% |
| Argentinean | 24 | 0.0% |
| Armenian | 20 | 0.0% |
| Australian | 66 | 0.1% |
| Austrian | 212 | 0.4% |
| Bahamian | 57 | 0.1% |
| Basque | 13 | 0.0% |
| Belgian | 228 | 0.4% |
| Bhutanese | 134 | 0.2% |
| Bolivian | 178 | 0.3% |
| Brazilian | 433 | 0.7% |
| British | 490 | 0.8% |
| Bulgarian | 86 | 0.1% |
| Burmese | 350 | 0.6% |
| Canadian | 304 | 0.5% |
| Central American | 2,006 | 3.3% |
| Central American Indian | 241 | 0.4% |
| Cherokee | 142 | 0.2% |
| Chilean | 36 | 0.1% |
| Colombian | 807 | 1.3% |
| Costa Rican | 67 | 0.1% |
| Croatian | 110 | 0.2% |
| Cuban | 1,112 | 1.8% |
| Czech | 272 | 0.4% |
| Czechoslovakian | 61 | 0.1% |
| Danish | 139 | 0.2% |
| Dominican | 103 | 0.2% |
| Dutch | 1,032 | 1.7% |
| Eastern European | 579 | 0.9% |
| Ecuadorian | 388 | 0.6% |
| Egyptian | 31 | 0.1% |
| English | 7,460 | 12.2% |
| European | 1,039 | 1.7% |
| Finnish | 355 | 0.6% |
| French | 1,388 | 2.3% |
| French Canadian | 569 | 0.9% |
| German | 8,679 | 14.2% |
| Greek | 642 | 1.1% |
| Guatemalan | 1,716 | 2.8% |
| Haitian | 107 | 0.2% |
| Honduran | 139 | 0.2% |
| Hungarian | 432 | 0.7% |
| Icelander | 36 | 0.1% |
| Indian (Asian) | 465 | 0.8% |
| Iranian | 322 | 0.5% |
| Iraqi | 20 | 0.0% |
| Irish | 10,073 | 16.5% |
| Israeli | 74 | 0.1% |
| Italian | 7,084 | 11.6% |
| Jamaican | 246 | 0.4% |
| Japanese | 116 | 0.2% |
| Korean | 302 | 0.5% |
| Latvian | 40 | 0.1% |
| Lebanese | 80 | 0.1% |
| Lithuanian | 231 | 0.4% |
| Luxembourger | 7 | 0.0% |
| Macedonian | 12 | 0.0% |
| Mexican | 2,671 | 4.4% |
| Mexican American Indian | 116 | 0.2% |
| Moroccan | 6 | 0.0% |
| Native Hawaiian | 78 | 0.1% |
| Northern European | 155 | 0.3% |
| Norwegian | 671 | 1.1% |
| Pakistani | 119 | 0.2% |
| Peruvian | 249 | 0.4% |
| Pima | 86 | 0.1% |
| Polish | 2,002 | 3.3% |
| Portuguese | 281 | 0.5% |
| Potawatomi | 10 | 0.0% |
| Puerto Rican | 1,209 | 2.0% |
| Romanian | 110 | 0.2% |
| Russian | 1,458 | 2.4% |
| Salvadoran | 84 | 0.1% |
| Scandinavian | 504 | 0.8% |
| Scotch-Irish | 362 | 0.6% |
| Scottish | 911 | 1.5% |
| Slavic | 86 | 0.1% |
| Slovak | 195 | 0.3% |
| South African | 6 | 0.0% |
| South American | 2,146 | 3.5% |
| Spaniard | 229 | 0.4% |
| Spanish | 23 | 0.0% |
| Sri Lankan | 40 | 0.1% |
| Subsaharan African | 39 | 0.1% |
| Swedish | 837 | 1.4% |
| Swiss | 132 | 0.2% |
| Syrian | 47 | 0.1% |
| Thai | 404 | 0.7% |
| Turkish | 44 | 0.1% |
| Ukrainian | 385 | 0.6% |
| Uruguayan | 12 | 0.0% |
| Venezuelan | 452 | 0.7% |
| Welsh | 489 | 0.8% |
| West Indian | 33 | 0.1% | View All 98 Rows |
Immigrants in Jupiter
The most numerous immigrant groups reported in Jupiter came from Latin America (5,426 | 8.9%), Central America (2,999 | 4.9%), Europe (1,964 | 3.2%), South America (1,821 | 3.0%), and Guatemala (1,702 | 2.8%), together accounting for 22.8% of all Jupiter residents.
| Immigration Origin | # Population | % Population |
| Africa | 169 | 0.3% |
| Albania | 251 | 0.4% |
| Argentina | 24 | 0.0% |
| Asia | 938 | 1.5% |
| Australia | 46 | 0.1% |
| Austria | 44 | 0.1% |
| Bahamas | 14 | 0.0% |
| Barbados | 33 | 0.1% |
| Belgium | 37 | 0.1% |
| Bolivia | 60 | 0.1% |
| Brazil | 265 | 0.4% |
| Bulgaria | 41 | 0.1% |
| Cambodia | 18 | 0.0% |
| Canada | 527 | 0.9% |
| Caribbean | 606 | 1.0% |
| Central America | 2,999 | 4.9% |
| China | 269 | 0.4% |
| Colombia | 481 | 0.8% |
| Costa Rica | 67 | 0.1% |
| Cuba | 273 | 0.4% |
| Czechoslovakia | 95 | 0.2% |
| Dominican Republic | 60 | 0.1% |
| Eastern Africa | 10 | 0.0% |
| Eastern Asia | 343 | 0.6% |
| Eastern Europe | 862 | 1.4% |
| Ecuador | 426 | 0.7% |
| Egypt | 15 | 0.0% |
| El Salvador | 37 | 0.1% |
| England | 167 | 0.3% |
| Europe | 1,964 | 3.2% |
| France | 169 | 0.3% |
| Germany | 161 | 0.3% |
| Greece | 122 | 0.2% |
| Guatemala | 1,702 | 2.8% |
| Guyana | 16 | 0.0% |
| Haiti | 107 | 0.2% |
| Honduras | 45 | 0.1% |
| Hungary | 12 | 0.0% |
| India | 218 | 0.4% |
| Iran | 32 | 0.1% |
| Ireland | 69 | 0.1% |
| Israel | 102 | 0.2% |
| Italy | 66 | 0.1% |
| Jamaica | 86 | 0.1% |
| Japan | 48 | 0.1% |
| Korea | 26 | 0.0% |
| Latin America | 5,426 | 8.9% |
| Latvia | 21 | 0.0% |
| Lebanon | 21 | 0.0% |
| Mexico | 1,110 | 1.8% |
| Morocco | 20 | 0.0% |
| Netherlands | 9 | 0.0% |
| North Macedonia | 12 | 0.0% |
| Northern Africa | 63 | 0.1% |
| Northern Europe | 439 | 0.7% |
| Oceania | 60 | 0.1% |
| Panama | 38 | 0.1% |
| Peru | 148 | 0.2% |
| Philippines | 130 | 0.2% |
| Poland | 162 | 0.3% |
| Romania | 70 | 0.1% |
| Russia | 155 | 0.3% |
| Scotland | 10 | 0.0% |
| South Africa | 96 | 0.2% |
| South America | 1,821 | 3.0% |
| South Central Asia | 250 | 0.4% |
| South Eastern Asia | 213 | 0.4% |
| Southern Europe | 209 | 0.3% |
| Spain | 21 | 0.0% |
| Sweden | 46 | 0.1% |
| Switzerland | 26 | 0.0% |
| Taiwan | 21 | 0.0% |
| Thailand | 20 | 0.0% |
| Trinidad and Tobago | 12 | 0.0% |
| Turkey | 9 | 0.0% |
| Ukraine | 43 | 0.1% |
| Uruguay | 12 | 0.0% |
| Venezuela | 389 | 0.6% |
| Vietnam | 45 | 0.1% |
| Western Asia | 132 | 0.2% |
| Western Europe | 446 | 0.7% |
| Zimbabwe | 5 | 0.0% | View All 82 Rows |
Sex and Age in Jupiter
Sex and Age in Jupiter
The most populous age groups in Jupiter are 55 to 59 Years (2,757 | 9.2%) for men and 50 to 54 Years (2,473 | 8.0%) for women.
| Age Bracket | Male | Female |
| Under 5 Years | 1,544 (5.1%) | 859 (2.8%) |
| 5 to 9 Years | 1,362 (4.5%) | 1,378 (4.5%) |
| 10 to 14 Years | 2,101 (7.0%) | 2,042 (6.6%) |
| 15 to 19 Years | 1,856 (6.2%) | 1,819 (5.9%) |
| 20 to 24 Years | 1,839 (6.1%) | 1,426 (4.6%) |
| 25 to 29 Years | 1,812 (6.0%) | 1,778 (5.8%) |
| 30 to 34 Years | 1,431 (4.8%) | 1,293 (4.2%) |
| 35 to 39 Years | 1,404 (4.7%) | 1,567 (5.1%) |
| 40 to 44 Years | 1,468 (4.9%) | 2,203 (7.1%) |
| 45 to 49 Years | 1,648 (5.5%) | 1,955 (6.3%) |
| 50 to 54 Years | 2,193 (7.3%) | 2,473 (8.0%) |
| 55 to 59 Years | 2,757 (9.2%) | 2,069 (6.7%) |
| 60 to 64 Years | 2,233 (7.4%) | 2,232 (7.2%) |
| 65 to 69 Years | 2,057 (6.9%) | 2,117 (6.9%) |
| 70 to 74 Years | 1,480 (4.9%) | 1,842 (6.0%) |
| 75 to 79 Years | 1,345 (4.5%) | 1,740 (5.6%) |
| 80 to 84 Years | 798 (2.7%) | 1,025 (3.3%) |
| 85 Years and over | 723 (2.4%) | 1,057 (3.4%) |
| Total | 30,051 (100.0%) | 30,875 (100.0%) |
Families and Households in Jupiter
Median Family Size in Jupiter
The median family size in Jupiter is 3.02 persons per family, with married-couple families (12,940 | 81.5%) accounting for the largest median family size of 3.05 persons per family. On the other hand, single female/mother families (2,139 | 13.5%) represent the smallest median family size with 2.85 persons per family.
| Family Type | # Families | Family Size |
| Married-Couple | 12,940 (81.5%) | 3.05 |
| Single Male/Father | 805 (5.1%) | 2.98 |
| Single Female/Mother | 2,139 (13.5%) | 2.85 |
| Total Families | 15,884 (100.0%) | 3.02 |
Median Household Size in Jupiter
The median household size in Jupiter is 2.41 persons per household, with single male/father households (805 | 3.2%) accounting for the largest median household size of 3.7 persons per household. non-family households (9,130 | 36.5%) represent the smallest median household size with 1.25 persons per household.
| Household Type | # Households | Household Size |
| Married-Couple | 12,940 (51.7%) | 3.06 |
| Single Male/Father | 805 (3.2%) | 3.70 |
| Single Female/Mother | 2,139 (8.6%) | 2.92 |
| Non-family | 9,130 (36.5%) | 1.25 |
| Total Households | 25,014 (100.0%) | 2.41 |
Household Size by Marriage Status in Jupiter
Out of a total of 25,014 households in Jupiter, 15,884 (63.5%) are family households, while 9,130 (36.5%) are nonfamily households. The most numerous type of family households are 2-person households, comprising 8,214, and the most common type of nonfamily households are 1-person households, comprising 7,461.
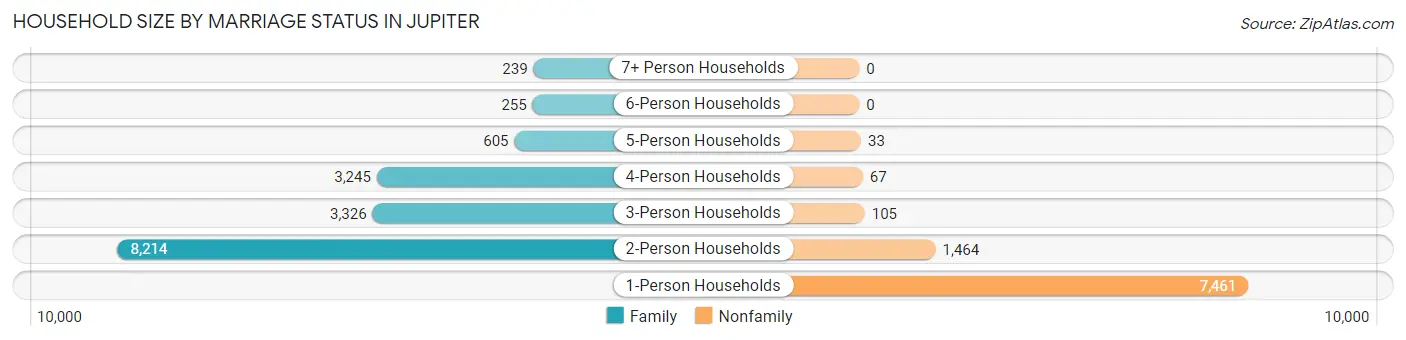
| Household Size | Family Households | Nonfamily Households |
| 1-Person Households | - | 7,461 (29.8%) |
| 2-Person Households | 8,214 (32.8%) | 1,464 (5.9%) |
| 3-Person Households | 3,326 (13.3%) | 105 (0.4%) |
| 4-Person Households | 3,245 (13.0%) | 67 (0.3%) |
| 5-Person Households | 605 (2.4%) | 33 (0.1%) |
| 6-Person Households | 255 (1.0%) | 0 (0.0%) |
| 7+ Person Households | 239 (1.0%) | 0 (0.0%) |
| Total | 15,884 (63.5%) | 9,130 (36.5%) |
Female Fertility in Jupiter
Fertility by Age in Jupiter
Average fertility rate in Jupiter is 24.0 births per 1,000 women. Women in the age bracket of 20 to 34 years have the highest fertility rate with 39.0 births per 1,000 women. Women in the age bracket of 20 to 34 years acount for 58.0% of all women with births.
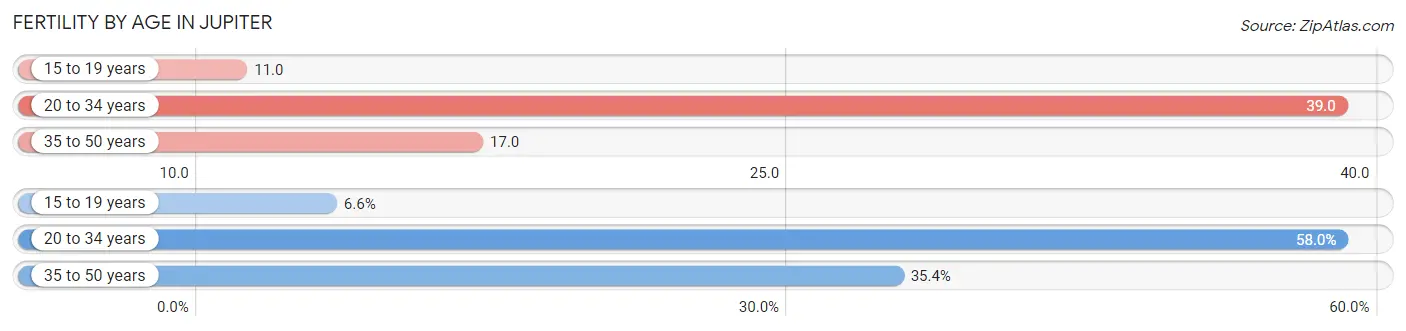
| Age Bracket | Women with Births | Births / 1,000 Women |
| 15 to 19 years | 20 (6.6%) | 11.0 |
| 20 to 34 years | 177 (58.0%) | 39.0 |
| 35 to 50 years | 108 (35.4%) | 17.0 |
| Total | 305 (100.0%) | 24.0 |
Fertility by Age by Marriage Status in Jupiter
89.8% of women with births (305) in Jupiter are married. The highest percentage of unmarried women with births falls into 20 to 34 years age bracket with 17.5% of them unmarried at the time of birth, while the lowest percentage of unmarried women with births belong to 15 to 19 years age bracket with 0.0% of them unmarried.
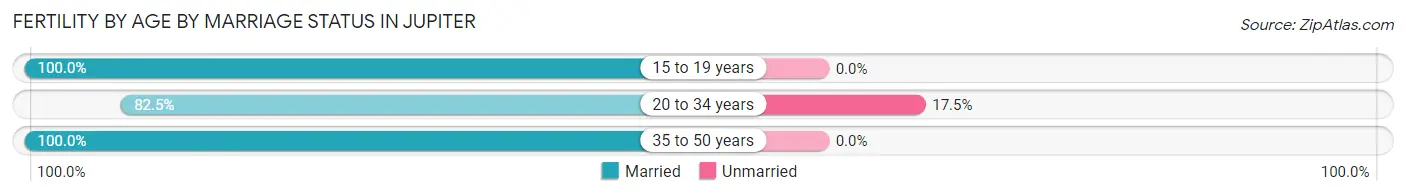
| Age Bracket | Married | Unmarried |
| 15 to 19 years | 20 (100.0%) | 0 (0.0%) |
| 20 to 34 years | 146 (82.5%) | 31 (17.5%) |
| 35 to 50 years | 108 (100.0%) | 0 (0.0%) |
| Total | 274 (89.8%) | 31 (10.2%) |
Fertility by Education in Jupiter
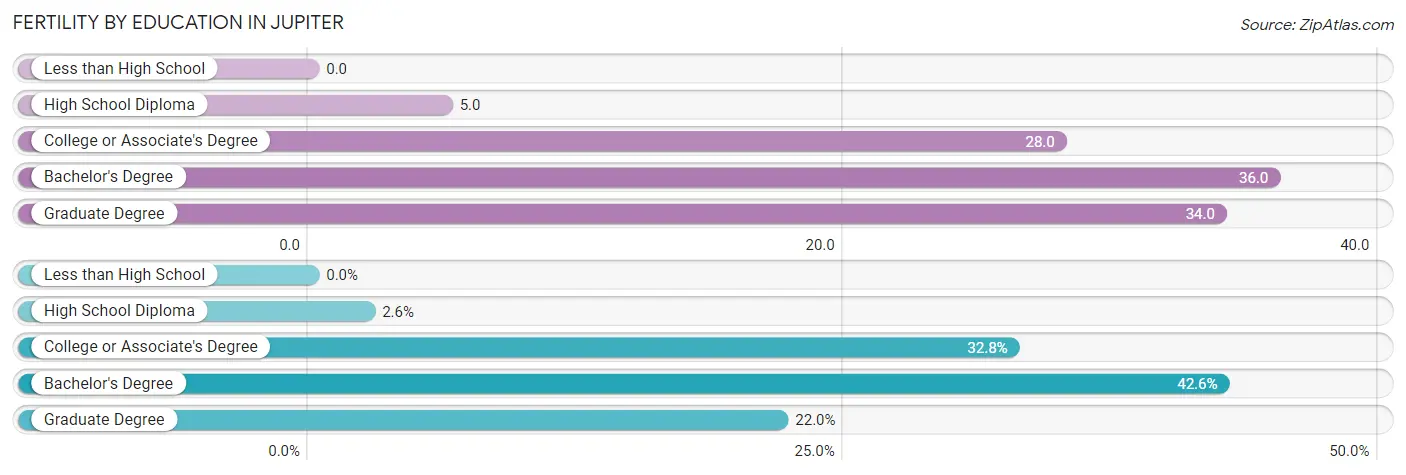
| Educational Attainment | Women with Births | Births / 1,000 Women |
| Less than High School | 0 (0.0%) | 0.0 |
| High School Diploma | 8 (2.6%) | 5.0 |
| College or Associate's Degree | 100 (32.8%) | 28.0 |
| Bachelor's Degree | 130 (42.6%) | 36.0 |
| Graduate Degree | 67 (22.0%) | 34.0 |
| Total | 305 (100.0%) | 24.0 |
Fertility by Education by Marriage Status in Jupiter
10.2% of women with births in Jupiter are unmarried. Women with the educational attainment of high school diploma are most likely to be married with 100.0% of them married at childbirth, while women with the educational attainment of college or associate's degree are least likely to be married with 17.0% of them unmarried at childbirth.
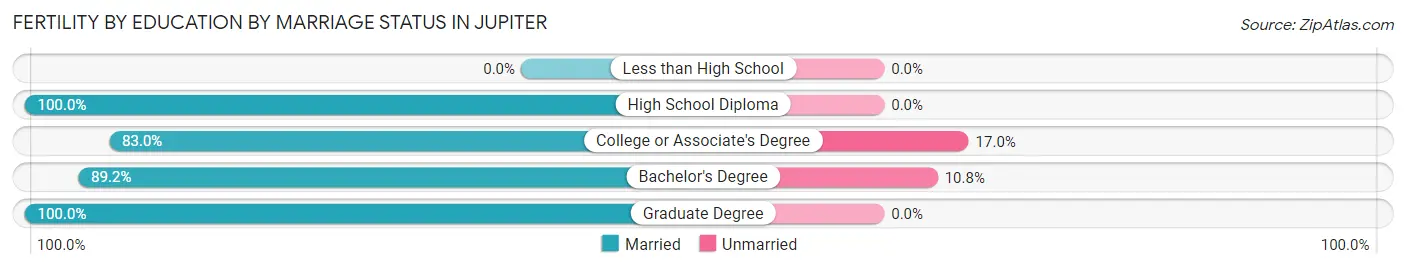
| Educational Attainment | Married | Unmarried |
| Less than High School | 0 (0.0%) | 0 (0.0%) |
| High School Diploma | 8 (100.0%) | 0 (0.0%) |
| College or Associate's Degree | 83 (83.0%) | 17 (17.0%) |
| Bachelor's Degree | 116 (89.2%) | 14 (10.8%) |
| Graduate Degree | 67 (100.0%) | 0 (0.0%) |
| Total | 274 (89.8%) | 31 (10.2%) |
Employment Characteristics in Jupiter
Employment by Class of Employer in Jupiter
Among the 29,466 employed individuals in Jupiter, private company employees (20,531 | 69.7%), self-employed (incorporated) (2,621 | 8.9%), and self-employed (not incorporated) (1,840 | 6.2%) make up the most common classes of employment.
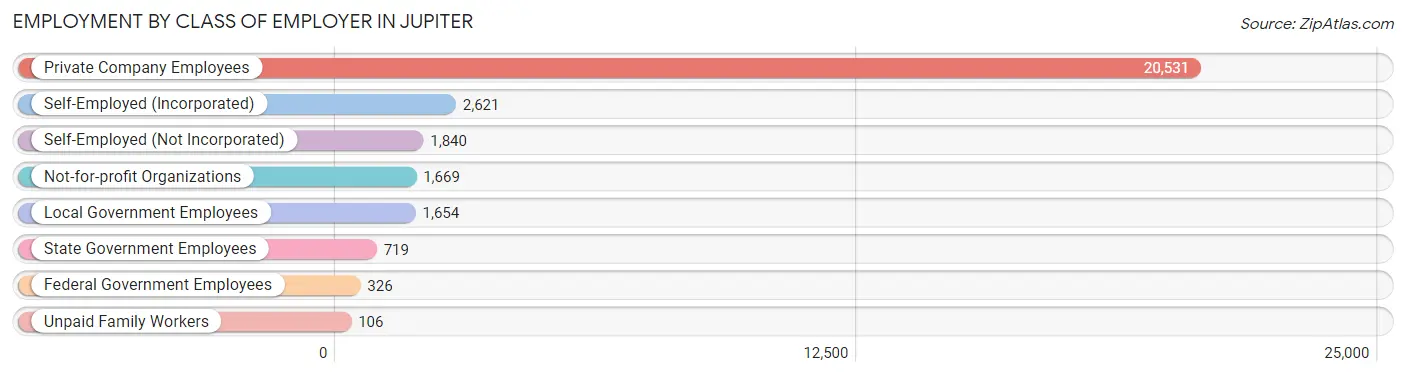
| Employer Class | # Employees | % Employees |
| Private Company Employees | 20,531 | 69.7% |
| Self-Employed (Incorporated) | 2,621 | 8.9% |
| Self-Employed (Not Incorporated) | 1,840 | 6.2% |
| Not-for-profit Organizations | 1,669 | 5.7% |
| Local Government Employees | 1,654 | 5.6% |
| State Government Employees | 719 | 2.4% |
| Federal Government Employees | 326 | 1.1% |
| Unpaid Family Workers | 106 | 0.4% |
| Total | 29,466 | 100.0% |
Employment Status by Age in Jupiter
According to the labor force statistics for Jupiter, out of the total population over 16 years of age (50,824), 62.0% or 31,511 individuals are in the labor force, with 4.0% or 1,260 of them unemployed. The age group with the highest labor force participation rate is 25 to 29 years, with 91.1% or 3,270 individuals in the labor force. Within the labor force, the 20 to 24 years age range has the highest percentage of unemployed individuals, with 14.9% or 410 of them being unemployed.
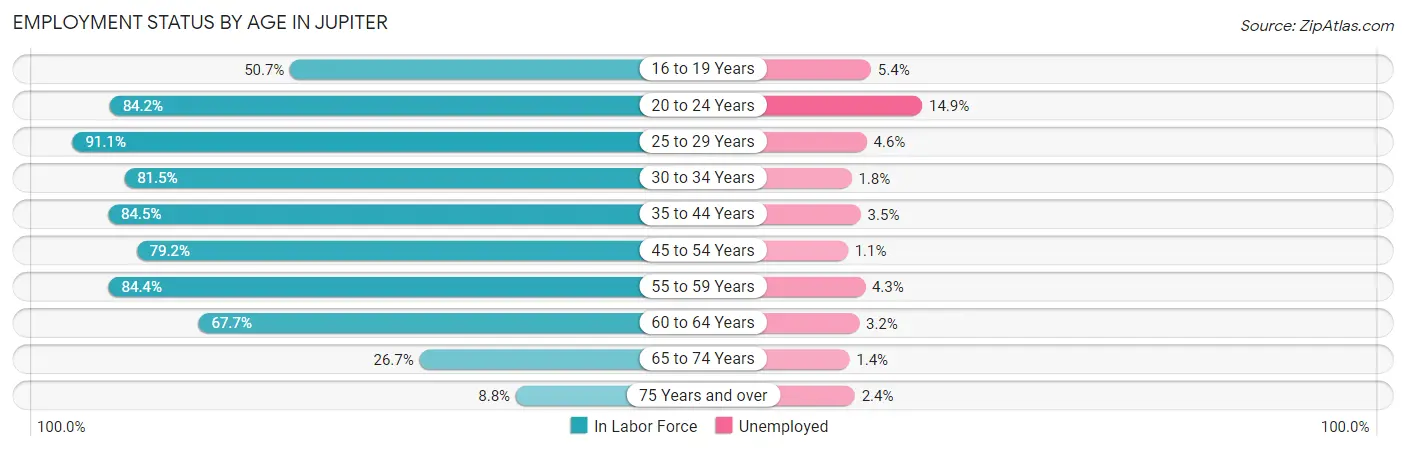
| Age Bracket | In Labor Force | Unemployed |
| 16 to 19 Years | 1,450 (50.7%) | 78 (5.4%) |
| 20 to 24 Years | 2,749 (84.2%) | 410 (14.9%) |
| 25 to 29 Years | 3,270 (91.1%) | 150 (4.6%) |
| 30 to 34 Years | 2,220 (81.5%) | 40 (1.8%) |
| 35 to 44 Years | 5,612 (84.5%) | 196 (3.5%) |
| 45 to 54 Years | 6,549 (79.2%) | 72 (1.1%) |
| 55 to 59 Years | 4,073 (84.4%) | 175 (4.3%) |
| 60 to 64 Years | 3,023 (67.7%) | 97 (3.2%) |
| 65 to 74 Years | 2,001 (26.7%) | 28 (1.4%) |
| 75 Years and over | 589 (8.8%) | 14 (2.4%) |
| Total | 31,511 (62.0%) | 1,260 (4.0%) |
Employment Status by Educational Attainment in Jupiter
According to labor force statistics for Jupiter, 81.1% of individuals (24,748) out of the total population between 25 and 64 years of age (30,516) are in the labor force, with 3.0% or 742 of them being unemployed. The group with the highest labor force participation rate are those with the educational attainment of bachelor's degree or higher, with 85.0% or 13,403 individuals in the labor force. Within the labor force, individuals with high school diploma education have the highest percentage of unemployment, with 5.4% or 176 of them being unemployed.
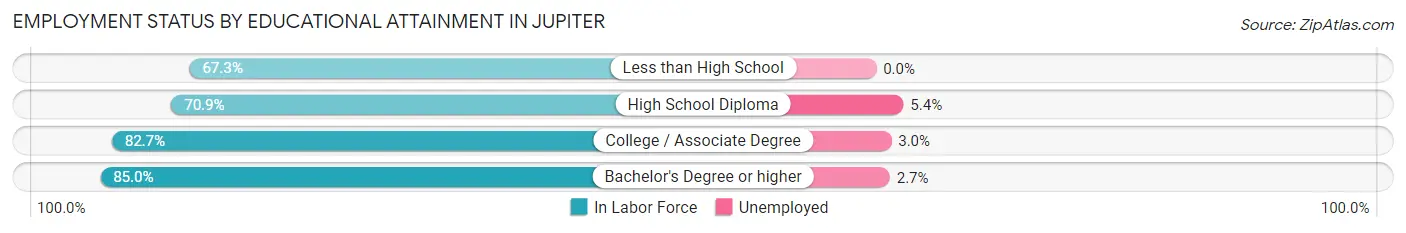
| Educational Attainment | In Labor Force | Unemployed |
| Less than High School | 1,376 (67.3%) | 0 (0.0%) |
| High School Diploma | 3,256 (70.9%) | 248 (5.4%) |
| College / Associate Degree | 6,708 (82.7%) | 243 (3.0%) |
| Bachelor's Degree or higher | 13,403 (85.0%) | 426 (2.7%) |
| Total | 24,748 (81.1%) | 915 (3.0%) |
Employment Occupations by Sex in Jupiter
Management, Business, Science and Arts Occupations
The most common Management, Business, Science and Arts occupations in Jupiter are Management (4,164 | 13.8%), Community & Social Service (4,035 | 13.3%), Business & Financial (2,488 | 8.2%), Health Diagnosing & Treating (2,148 | 7.1%), and Education Instruction & Library (2,084 | 6.9%).
Management, Business, Science and Arts Occupations by Sex
Within the Management, Business, Science and Arts occupations in Jupiter, the most male-oriented occupations are Architecture & Engineering (78.8%), Computers, Engineering & Science (71.6%), and Computers & Mathematics (69.4%), while the most female-oriented occupations are Education, Arts & Media (88.5%), Education Instruction & Library (82.3%), and Health Diagnosing & Treating (68.4%).
| Occupation | Male | Female |
| Management | 2,627 (63.1%) | 1,537 (36.9%) |
| Business & Financial | 1,637 (65.8%) | 851 (34.2%) |
| Computers, Engineering & Science | 1,450 (71.6%) | 574 (28.4%) |
| Computers & Mathematics | 558 (69.4%) | 246 (30.6%) |
| Architecture & Engineering | 617 (78.8%) | 166 (21.2%) |
| Life, Physical & Social Science | 275 (62.9%) | 162 (37.1%) |
| Community & Social Service | 1,307 (32.4%) | 2,728 (67.6%) |
| Education, Arts & Media | 50 (11.5%) | 386 (88.5%) |
| Legal Services & Support | 577 (65.3%) | 307 (34.7%) |
| Education Instruction & Library | 370 (17.7%) | 1,714 (82.3%) |
| Arts, Media & Entertainment | 310 (49.1%) | 321 (50.9%) |
| Health Diagnosing & Treating | 678 (31.6%) | 1,470 (68.4%) |
| Health Technologists | 540 (33.3%) | 1,081 (66.7%) |
| Total (Category) | 7,699 (51.8%) | 7,160 (48.2%) |
| Total (Overall) | 16,417 (54.2%) | 13,854 (45.8%) |
Services Occupations
The most common Services occupations in Jupiter are Food Preparation & Serving (2,003 | 6.6%), Cleaning & Maintenance (1,171 | 3.9%), Personal Care & Service (908 | 3.0%), Security & Protection (585 | 1.9%), and Healthcare Support (412 | 1.4%).
Services Occupations by Sex
Within the Services occupations in Jupiter, the most male-oriented occupations are Security & Protection (100.0%), Firefighting & Prevention (100.0%), and Law Enforcement (100.0%), while the most female-oriented occupations are Healthcare Support (86.4%), Personal Care & Service (59.7%), and Food Preparation & Serving (54.2%).
| Occupation | Male | Female |
| Healthcare Support | 56 (13.6%) | 356 (86.4%) |
| Security & Protection | 585 (100.0%) | 0 (0.0%) |
| Firefighting & Prevention | 320 (100.0%) | 0 (0.0%) |
| Law Enforcement | 265 (100.0%) | 0 (0.0%) |
| Food Preparation & Serving | 918 (45.8%) | 1,085 (54.2%) |
| Cleaning & Maintenance | 938 (80.1%) | 233 (19.9%) |
| Personal Care & Service | 366 (40.3%) | 542 (59.7%) |
| Total (Category) | 2,863 (56.4%) | 2,216 (43.6%) |
| Total (Overall) | 16,417 (54.2%) | 13,854 (45.8%) |
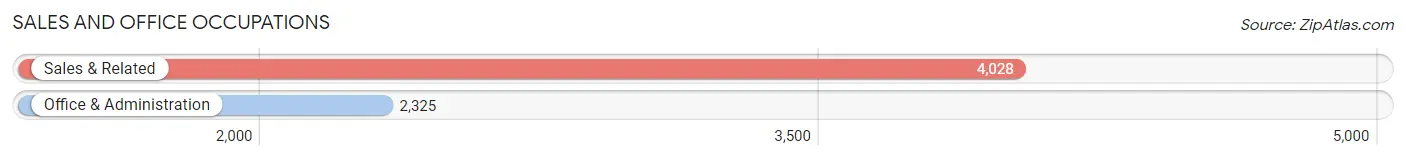
Sales and Office Occupations
The most common Sales and Office occupations in Jupiter are Sales & Related (4,028 | 13.3%), and Office & Administration (2,325 | 7.7%).
Sales and Office Occupations by Sex
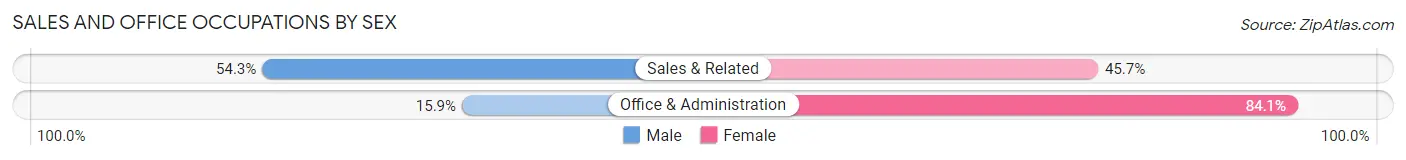
| Occupation | Male | Female |
| Sales & Related | 2,188 (54.3%) | 1,840 (45.7%) |
| Office & Administration | 370 (15.9%) | 1,955 (84.1%) |
| Total (Category) | 2,558 (40.3%) | 3,795 (59.7%) |
| Total (Overall) | 16,417 (54.2%) | 13,854 (45.8%) |
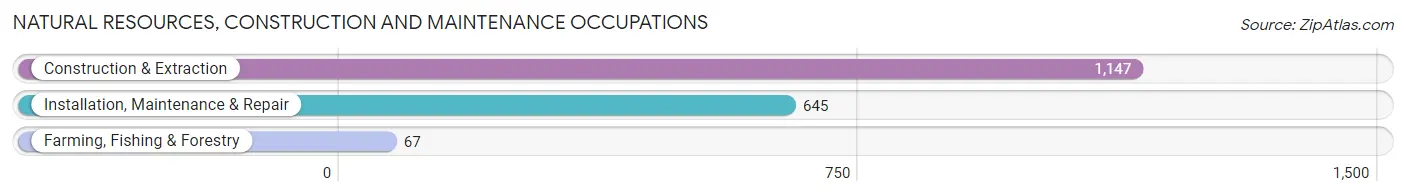
Natural Resources, Construction and Maintenance Occupations
The most common Natural Resources, Construction and Maintenance occupations in Jupiter are Construction & Extraction (1,147 | 3.8%), Installation, Maintenance & Repair (645 | 2.1%), and Farming, Fishing & Forestry (67 | 0.2%).
Natural Resources, Construction and Maintenance Occupations by Sex
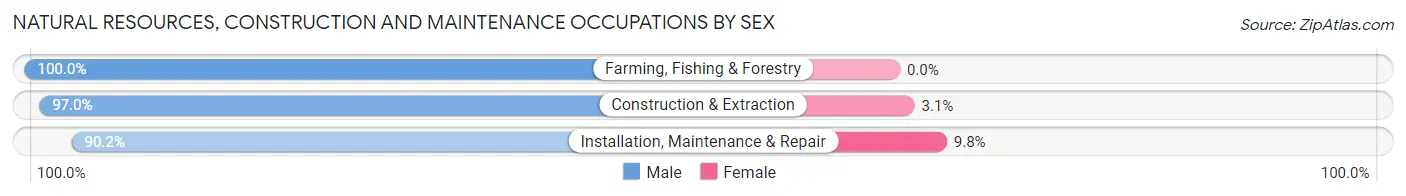
| Occupation | Male | Female |
| Farming, Fishing & Forestry | 67 (100.0%) | 0 (0.0%) |
| Construction & Extraction | 1,112 (97.0%) | 35 (3.0%) |
| Installation, Maintenance & Repair | 582 (90.2%) | 63 (9.8%) |
| Total (Category) | 1,761 (94.7%) | 98 (5.3%) |
| Total (Overall) | 16,417 (54.2%) | 13,854 (45.8%) |
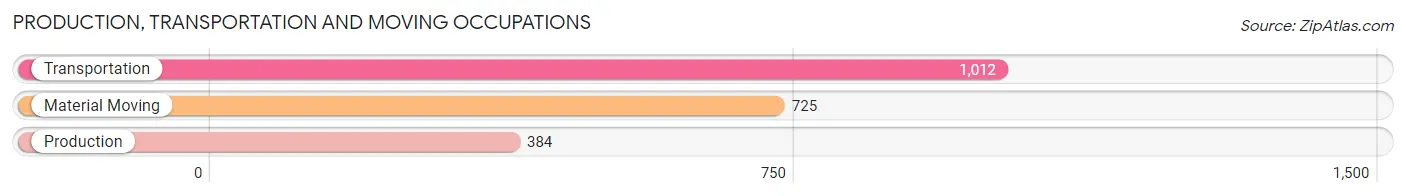
Production, Transportation and Moving Occupations
The most common Production, Transportation and Moving occupations in Jupiter are Transportation (1,012 | 3.3%), Material Moving (725 | 2.4%), and Production (384 | 1.3%).
Production, Transportation and Moving Occupations by Sex
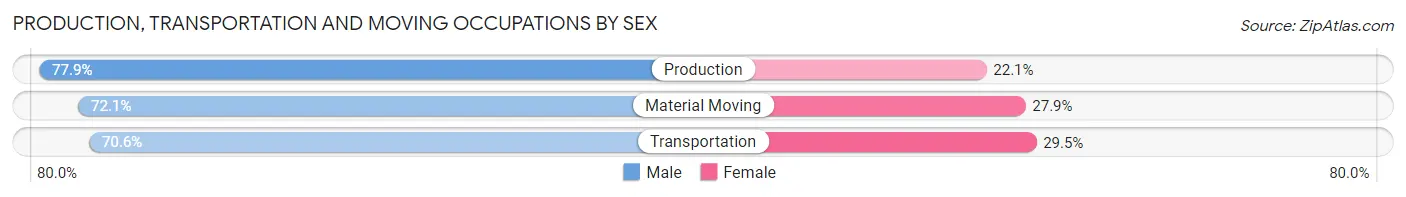
| Occupation | Male | Female |
| Production | 299 (77.9%) | 85 (22.1%) |
| Transportation | 714 (70.6%) | 298 (29.4%) |
| Material Moving | 523 (72.1%) | 202 (27.9%) |
| Total (Category) | 1,536 (72.4%) | 585 (27.6%) |
| Total (Overall) | 16,417 (54.2%) | 13,854 (45.8%) |
Employment Industries by Sex in Jupiter
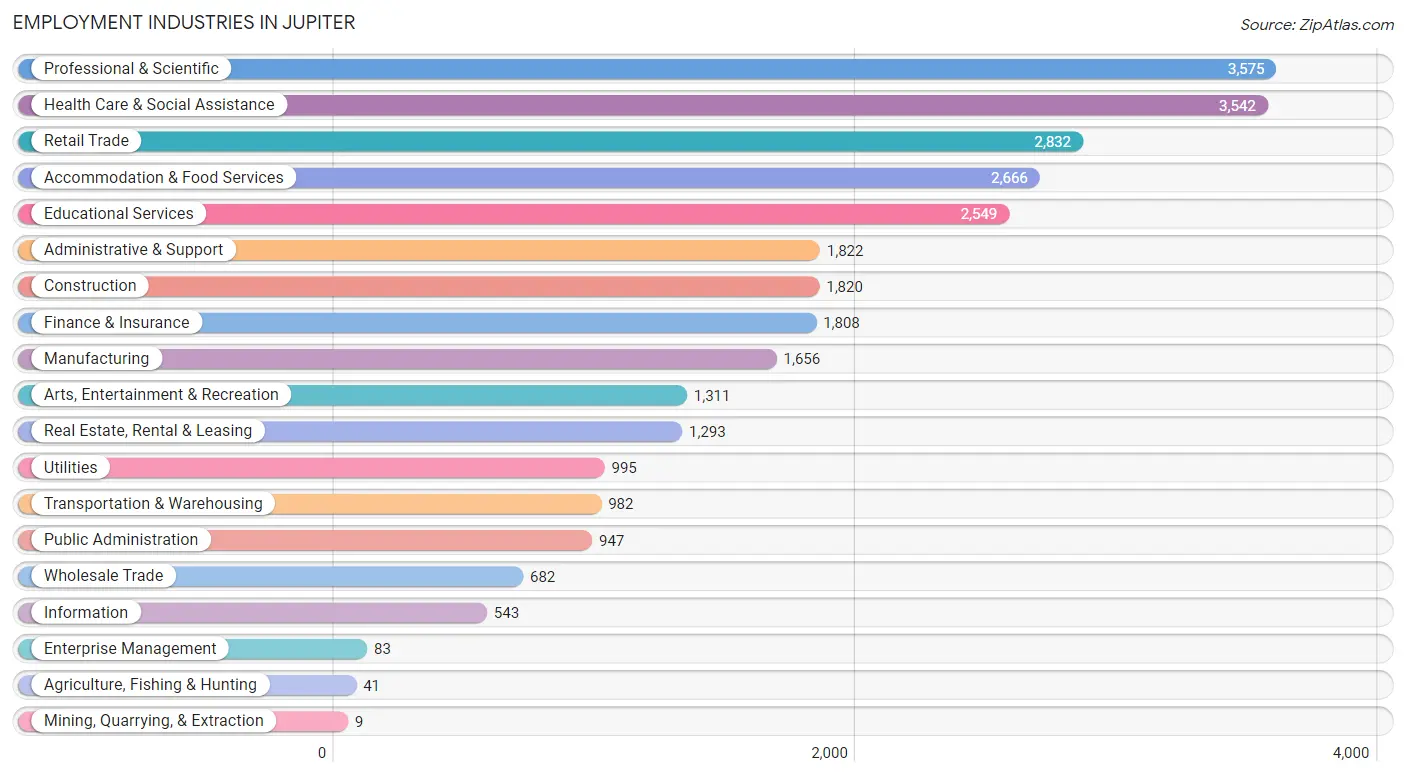
Employment Industries in Jupiter
The major employment industries in Jupiter include Professional & Scientific (3,575 | 11.8%), Health Care & Social Assistance (3,542 | 11.7%), Retail Trade (2,832 | 9.4%), Accommodation & Food Services (2,666 | 8.8%), and Educational Services (2,549 | 8.4%).
Employment Industries by Sex in Jupiter
The Jupiter industries that see more men than women are Mining, Quarrying, & Extraction (100.0%), Enterprise Management (100.0%), and Construction (86.2%), whereas the industries that tend to have a higher number of women are Educational Services (82.5%), Health Care & Social Assistance (71.4%), and Real Estate, Rental & Leasing (59.6%).
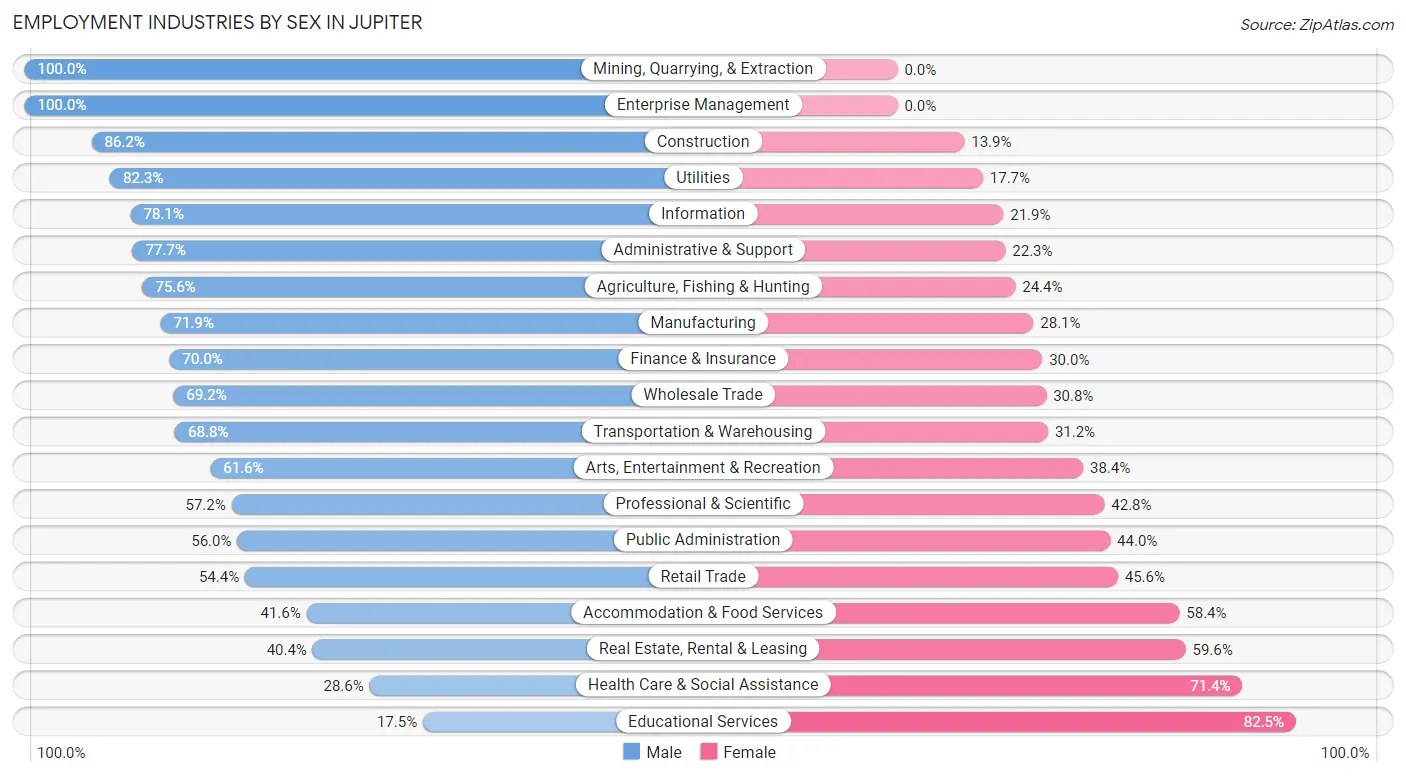
| Industry | Male | Female |
| Agriculture, Fishing & Hunting | 31 (75.6%) | 10 (24.4%) |
| Mining, Quarrying, & Extraction | 9 (100.0%) | 0 (0.0%) |
| Construction | 1,568 (86.2%) | 252 (13.9%) |
| Manufacturing | 1,190 (71.9%) | 466 (28.1%) |
| Wholesale Trade | 472 (69.2%) | 210 (30.8%) |
| Retail Trade | 1,540 (54.4%) | 1,292 (45.6%) |
| Transportation & Warehousing | 676 (68.8%) | 306 (31.2%) |
| Utilities | 819 (82.3%) | 176 (17.7%) |
| Information | 424 (78.1%) | 119 (21.9%) |
| Finance & Insurance | 1,266 (70.0%) | 542 (30.0%) |
| Real Estate, Rental & Leasing | 522 (40.4%) | 771 (59.6%) |
| Professional & Scientific | 2,044 (57.2%) | 1,531 (42.8%) |
| Enterprise Management | 83 (100.0%) | 0 (0.0%) |
| Administrative & Support | 1,415 (77.7%) | 407 (22.3%) |
| Educational Services | 447 (17.5%) | 2,102 (82.5%) |
| Health Care & Social Assistance | 1,013 (28.6%) | 2,529 (71.4%) |
| Arts, Entertainment & Recreation | 807 (61.6%) | 504 (38.4%) |
| Accommodation & Food Services | 1,110 (41.6%) | 1,556 (58.4%) |
| Public Administration | 530 (56.0%) | 417 (44.0%) |
| Total | 16,417 (54.2%) | 13,854 (45.8%) |
Education in Jupiter
School Enrollment in Jupiter
The most common levels of schooling among the 13,357 students in Jupiter are middle school (3,373 | 25.3%), high school (2,969 | 22.2%), and college / undergraduate (2,669 | 20.0%).
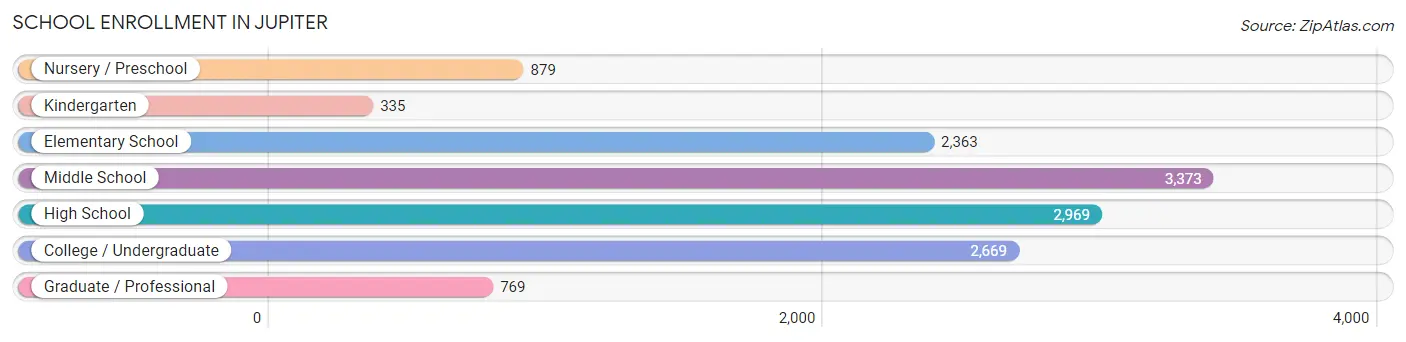
| School Level | # Students | % Students |
| Nursery / Preschool | 879 | 6.6% |
| Kindergarten | 335 | 2.5% |
| Elementary School | 2,363 | 17.7% |
| Middle School | 3,373 | 25.3% |
| High School | 2,969 | 22.2% |
| College / Undergraduate | 2,669 | 20.0% |
| Graduate / Professional | 769 | 5.8% |
| Total | 13,357 | 100.0% |
School Enrollment by Age by Funding Source in Jupiter
Out of a total of 13,357 students who are enrolled in schools in Jupiter, 3,313 (24.8%) attend a private institution, while the remaining 10,044 (75.2%) are enrolled in public schools. The age group of 3 to 4 year olds has the highest likelihood of being enrolled in private schools, with 535 (89.2% in the age bracket) enrolled. Conversely, the age group of 15 to 17 year olds has the lowest likelihood of being enrolled in a private school, with 1,794 (84.1% in the age bracket) attending a public institution.
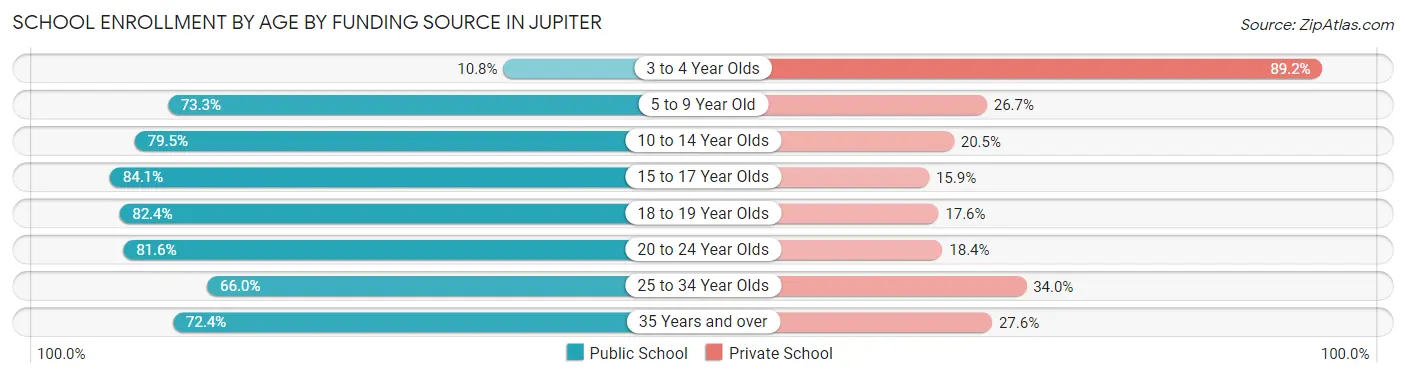
| Age Bracket | Public School | Private School |
| 3 to 4 Year Olds | 65 (10.8%) | 535 (89.2%) |
| 5 to 9 Year Old | 1,931 (73.3%) | 702 (26.7%) |
| 10 to 14 Year Olds | 3,190 (79.5%) | 823 (20.5%) |
| 15 to 17 Year Olds | 1,794 (84.1%) | 339 (15.9%) |
| 18 to 19 Year Olds | 1,018 (82.4%) | 218 (17.6%) |
| 20 to 24 Year Olds | 986 (81.6%) | 222 (18.4%) |
| 25 to 34 Year Olds | 530 (66.0%) | 273 (34.0%) |
| 35 Years and over | 529 (72.4%) | 202 (27.6%) |
| Total | 10,044 (75.2%) | 3,313 (24.8%) |
Educational Attainment by Field of Study in Jupiter
Business (6,259 | 25.8%), education (2,618 | 10.8%), engineering (2,367 | 9.8%), social sciences (2,168 | 8.9%), and science & technology (2,077 | 8.6%) are the most common fields of study among 24,265 individuals in Jupiter who have obtained a bachelor's degree or higher.
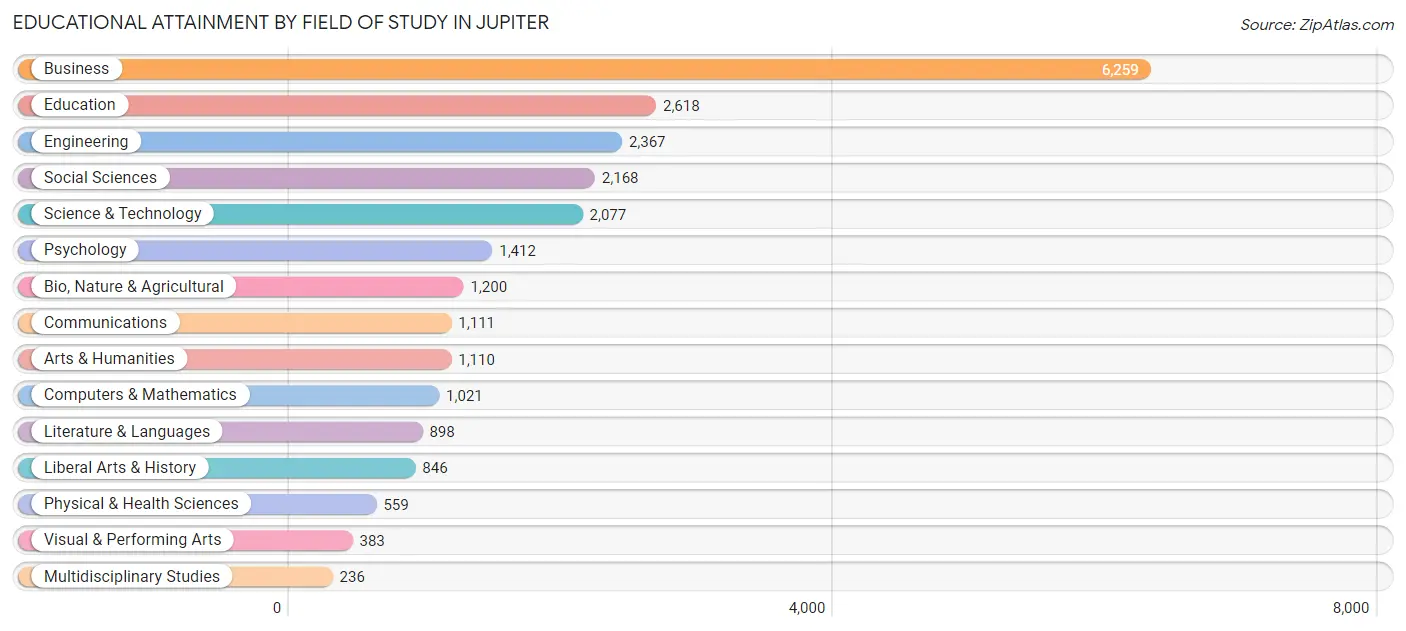
| Field of Study | # Graduates | % Graduates |
| Computers & Mathematics | 1,021 | 4.2% |
| Bio, Nature & Agricultural | 1,200 | 5.0% |
| Physical & Health Sciences | 559 | 2.3% |
| Psychology | 1,412 | 5.8% |
| Social Sciences | 2,168 | 8.9% |
| Engineering | 2,367 | 9.8% |
| Multidisciplinary Studies | 236 | 1.0% |
| Science & Technology | 2,077 | 8.6% |
| Business | 6,259 | 25.8% |
| Education | 2,618 | 10.8% |
| Literature & Languages | 898 | 3.7% |
| Liberal Arts & History | 846 | 3.5% |
| Visual & Performing Arts | 383 | 1.6% |
| Communications | 1,111 | 4.6% |
| Arts & Humanities | 1,110 | 4.6% |
| Total | 24,265 | 100.0% |
Transportation & Commute in Jupiter
Vehicle Availability by Sex in Jupiter
The most prevalent vehicle ownership categories in Jupiter are males with 2 vehicles (8,349, accounting for 51.6%) and females with 2 vehicles (5,828, making up 63.4%).
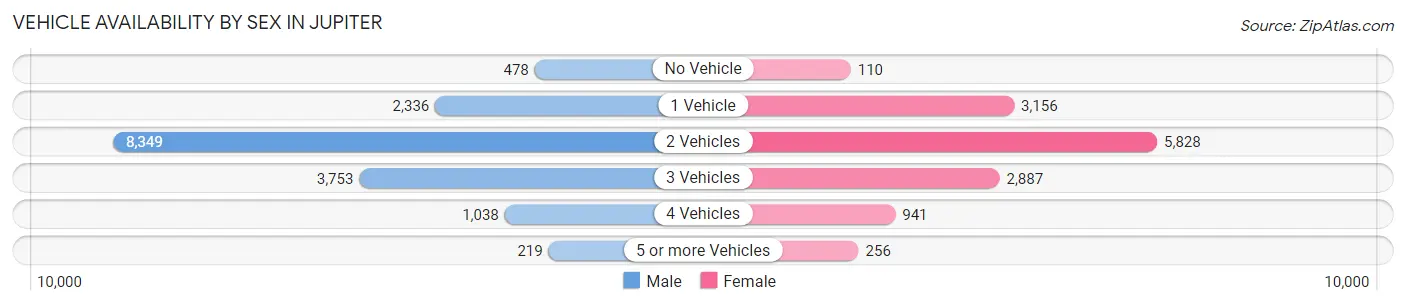
| Vehicles Available | Male | Female |
| No Vehicle | 478 (3.0%) | 110 (0.8%) |
| 1 Vehicle | 2,336 (14.4%) | 3,156 (23.9%) |
| 2 Vehicles | 8,349 (51.6%) | 5,828 (44.2%) |
| 3 Vehicles | 3,753 (23.2%) | 2,887 (21.9%) |
| 4 Vehicles | 1,038 (6.4%) | 941 (7.1%) |
| 5 or more Vehicles | 219 (1.3%) | 256 (1.9%) |
| Total | 16,173 (100.0%) | 13,178 (100.0%) |
Commute Time in Jupiter
The most frequently occuring commute durations in Jupiter are 15 to 19 minutes (4,653 commuters, 18.4%), 20 to 24 minutes (4,248 commuters, 16.8%), and 10 to 14 minutes (4,035 commuters, 15.9%).
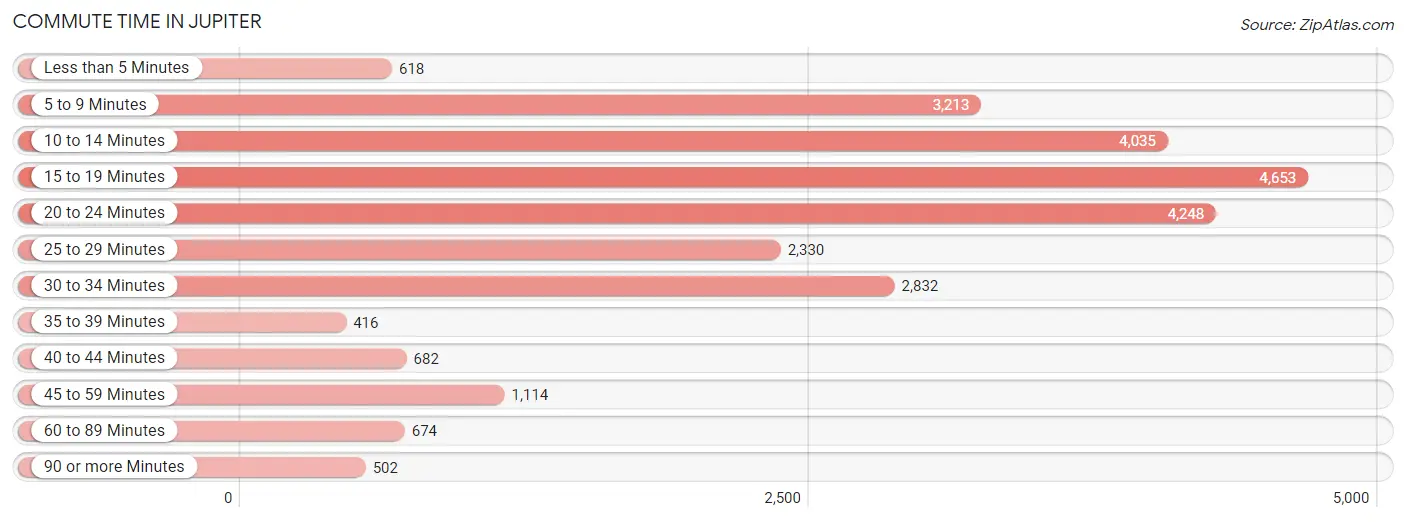
| Commute Time | # Commuters | % Commuters |
| Less than 5 Minutes | 618 | 2.4% |
| 5 to 9 Minutes | 3,213 | 12.7% |
| 10 to 14 Minutes | 4,035 | 15.9% |
| 15 to 19 Minutes | 4,653 | 18.4% |
| 20 to 24 Minutes | 4,248 | 16.8% |
| 25 to 29 Minutes | 2,330 | 9.2% |
| 30 to 34 Minutes | 2,832 | 11.2% |
| 35 to 39 Minutes | 416 | 1.6% |
| 40 to 44 Minutes | 682 | 2.7% |
| 45 to 59 Minutes | 1,114 | 4.4% |
| 60 to 89 Minutes | 674 | 2.7% |
| 90 or more Minutes | 502 | 2.0% |
Commute Time by Sex in Jupiter
The most common commute times in Jupiter are 20 to 24 minutes (3,056 commuters, 21.5%) for males and 15 to 19 minutes (2,297 commuters, 20.7%) for females.
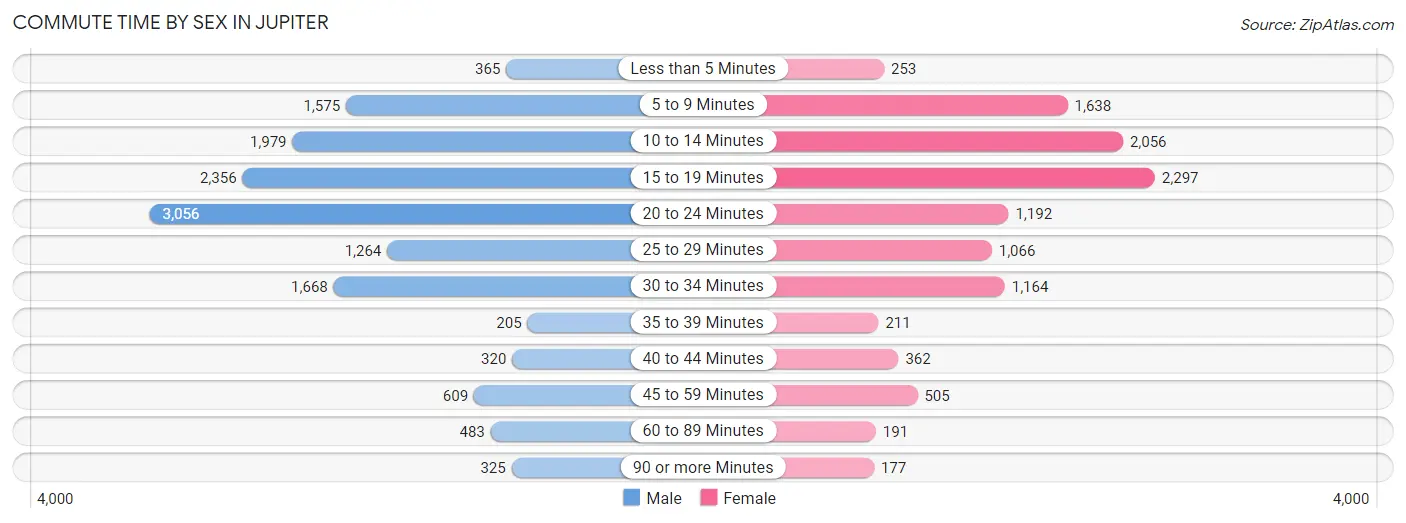
| Commute Time | Male | Female |
| Less than 5 Minutes | 365 (2.6%) | 253 (2.3%) |
| 5 to 9 Minutes | 1,575 (11.1%) | 1,638 (14.7%) |
| 10 to 14 Minutes | 1,979 (13.9%) | 2,056 (18.5%) |
| 15 to 19 Minutes | 2,356 (16.6%) | 2,297 (20.7%) |
| 20 to 24 Minutes | 3,056 (21.5%) | 1,192 (10.7%) |
| 25 to 29 Minutes | 1,264 (8.9%) | 1,066 (9.6%) |
| 30 to 34 Minutes | 1,668 (11.7%) | 1,164 (10.5%) |
| 35 to 39 Minutes | 205 (1.4%) | 211 (1.9%) |
| 40 to 44 Minutes | 320 (2.2%) | 362 (3.3%) |
| 45 to 59 Minutes | 609 (4.3%) | 505 (4.5%) |
| 60 to 89 Minutes | 483 (3.4%) | 191 (1.7%) |
| 90 or more Minutes | 325 (2.3%) | 177 (1.6%) |
Time of Departure to Work by Sex in Jupiter
The most frequent times of departure to work in Jupiter are 7:00 AM to 7:29 AM (2,472, 17.4%) for males and 7:30 AM to 7:59 AM (1,836, 16.5%) for females.
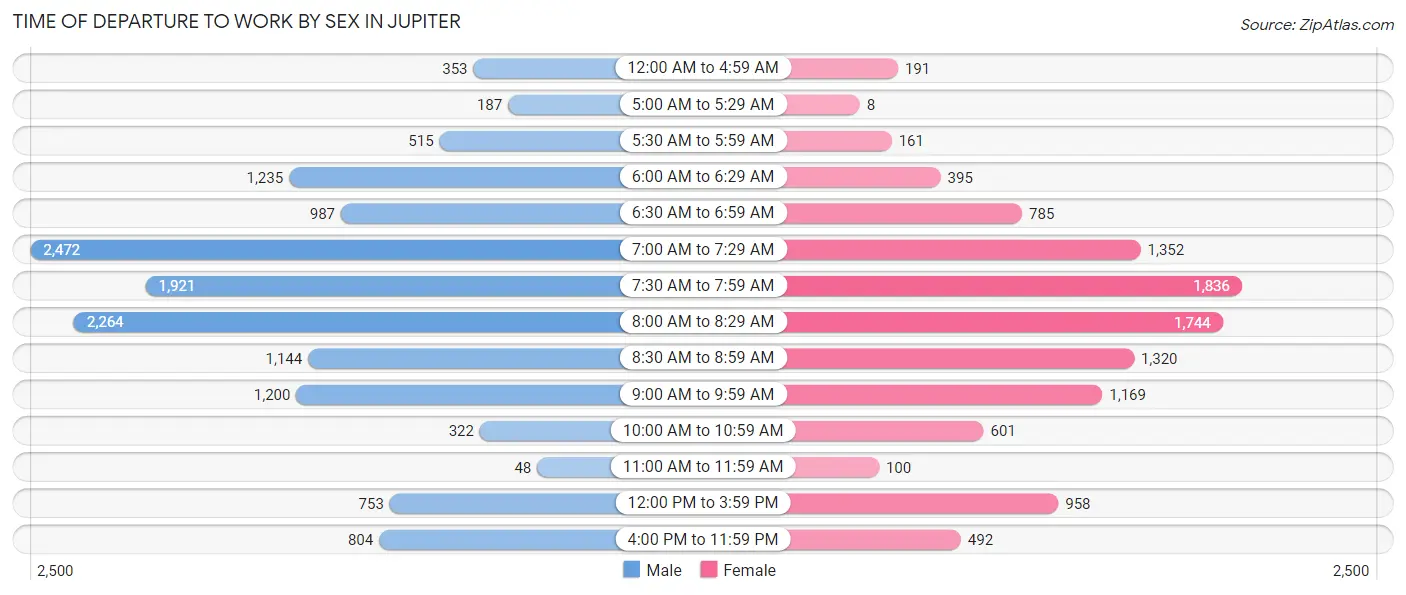
| Time of Departure | Male | Female |
| 12:00 AM to 4:59 AM | 353 (2.5%) | 191 (1.7%) |
| 5:00 AM to 5:29 AM | 187 (1.3%) | 8 (0.1%) |
| 5:30 AM to 5:59 AM | 515 (3.6%) | 161 (1.5%) |
| 6:00 AM to 6:29 AM | 1,235 (8.7%) | 395 (3.5%) |
| 6:30 AM to 6:59 AM | 987 (7.0%) | 785 (7.1%) |
| 7:00 AM to 7:29 AM | 2,472 (17.4%) | 1,352 (12.2%) |
| 7:30 AM to 7:59 AM | 1,921 (13.5%) | 1,836 (16.5%) |
| 8:00 AM to 8:29 AM | 2,264 (15.9%) | 1,744 (15.7%) |
| 8:30 AM to 8:59 AM | 1,144 (8.1%) | 1,320 (11.9%) |
| 9:00 AM to 9:59 AM | 1,200 (8.5%) | 1,169 (10.5%) |
| 10:00 AM to 10:59 AM | 322 (2.3%) | 601 (5.4%) |
| 11:00 AM to 11:59 AM | 48 (0.3%) | 100 (0.9%) |
| 12:00 PM to 3:59 PM | 753 (5.3%) | 958 (8.6%) |
| 4:00 PM to 11:59 PM | 804 (5.7%) | 492 (4.4%) |
| Total | 14,205 (100.0%) | 11,112 (100.0%) |
Housing Occupancy in Jupiter
Occupancy by Ownership in Jupiter
Of the total 25,014 dwellings in Jupiter, owner-occupied units account for 19,379 (77.5%), while renter-occupied units make up 5,635 (22.5%).
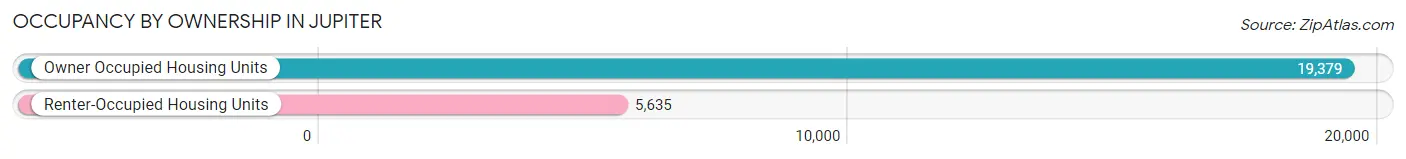
| Occupancy | # Housing Units | % Housing Units |
| Owner Occupied Housing Units | 19,379 | 77.5% |
| Renter-Occupied Housing Units | 5,635 | 22.5% |
| Total Occupied Housing Units | 25,014 | 100.0% |
Occupancy by Household Size in Jupiter
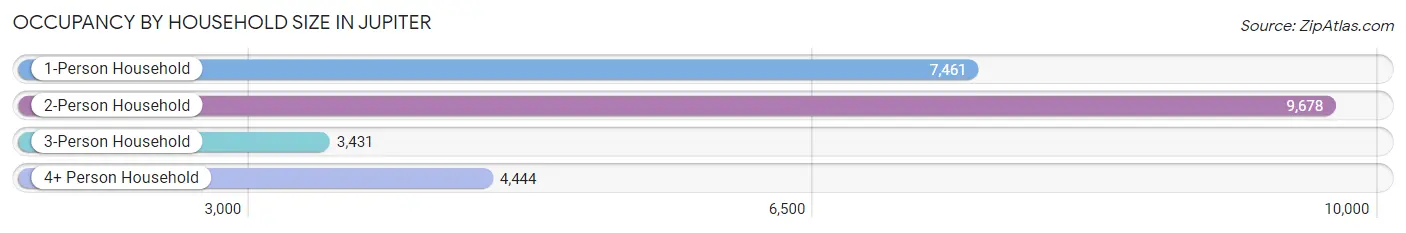
| Household Size | # Housing Units | % Housing Units |
| 1-Person Household | 7,461 | 29.8% |
| 2-Person Household | 9,678 | 38.7% |
| 3-Person Household | 3,431 | 13.7% |
| 4+ Person Household | 4,444 | 17.8% |
| Total Housing Units | 25,014 | 100.0% |
Occupancy by Ownership by Household Size in Jupiter
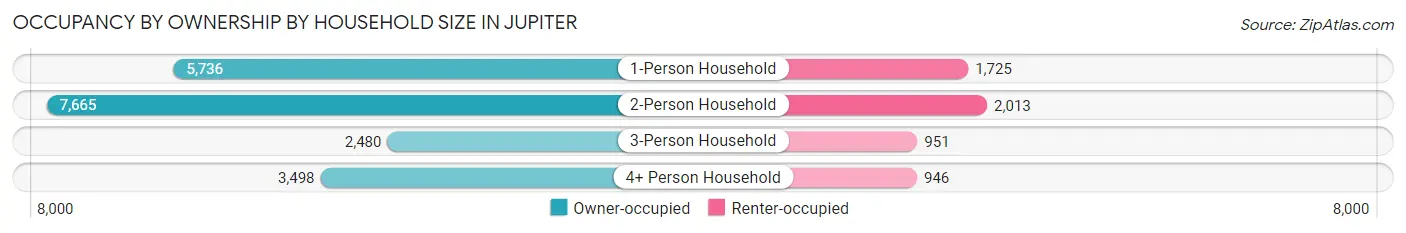
| Household Size | Owner-occupied | Renter-occupied |
| 1-Person Household | 5,736 (76.9%) | 1,725 (23.1%) |
| 2-Person Household | 7,665 (79.2%) | 2,013 (20.8%) |
| 3-Person Household | 2,480 (72.3%) | 951 (27.7%) |
| 4+ Person Household | 3,498 (78.7%) | 946 (21.3%) |
| Total Housing Units | 19,379 (77.5%) | 5,635 (22.5%) |
Occupancy by Educational Attainment in Jupiter
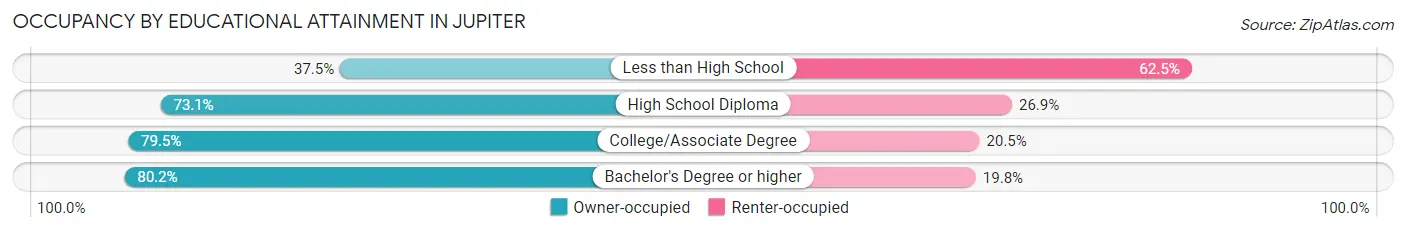
| Household Size | Owner-occupied | Renter-occupied |
| Less than High School | 342 (37.5%) | 571 (62.5%) |
| High School Diploma | 2,530 (73.1%) | 933 (26.9%) |
| College/Associate Degree | 5,442 (79.5%) | 1,404 (20.5%) |
| Bachelor's Degree or higher | 11,065 (80.2%) | 2,727 (19.8%) |
Occupancy by Age of Householder in Jupiter
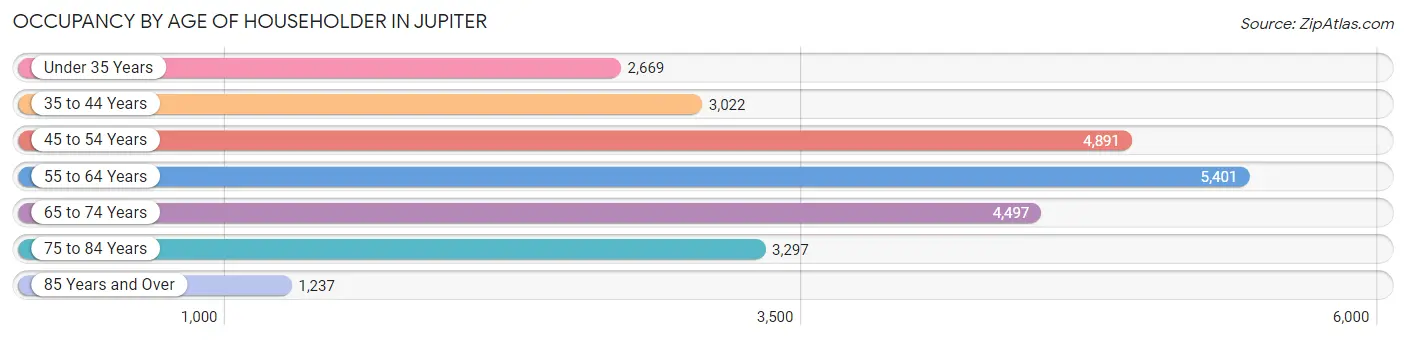
| Age Bracket | # Households | % Households |
| Under 35 Years | 2,669 | 10.7% |
| 35 to 44 Years | 3,022 | 12.1% |
| 45 to 54 Years | 4,891 | 19.6% |
| 55 to 64 Years | 5,401 | 21.6% |
| 65 to 74 Years | 4,497 | 18.0% |
| 75 to 84 Years | 3,297 | 13.2% |
| 85 Years and Over | 1,237 | 5.0% |
| Total | 25,014 | 100.0% |
Housing Finances in Jupiter
Median Income by Occupancy in Jupiter
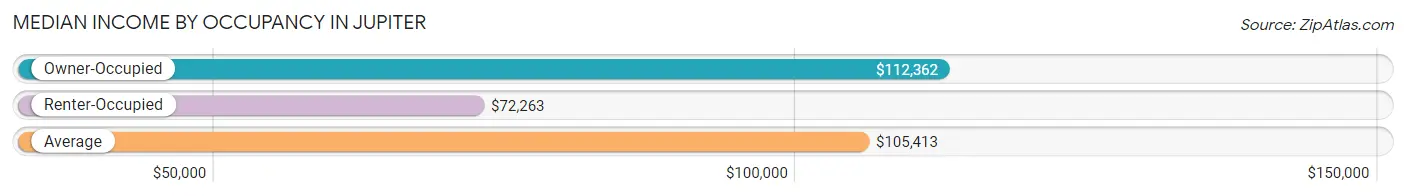
| Occupancy Type | # Households | Median Income |
| Owner-Occupied | 19,379 (77.5%) | $112,362 |
| Renter-Occupied | 5,635 (22.5%) | $72,263 |
| Average | 25,014 (100.0%) | $105,413 |
Occupancy by Householder Income Bracket in Jupiter
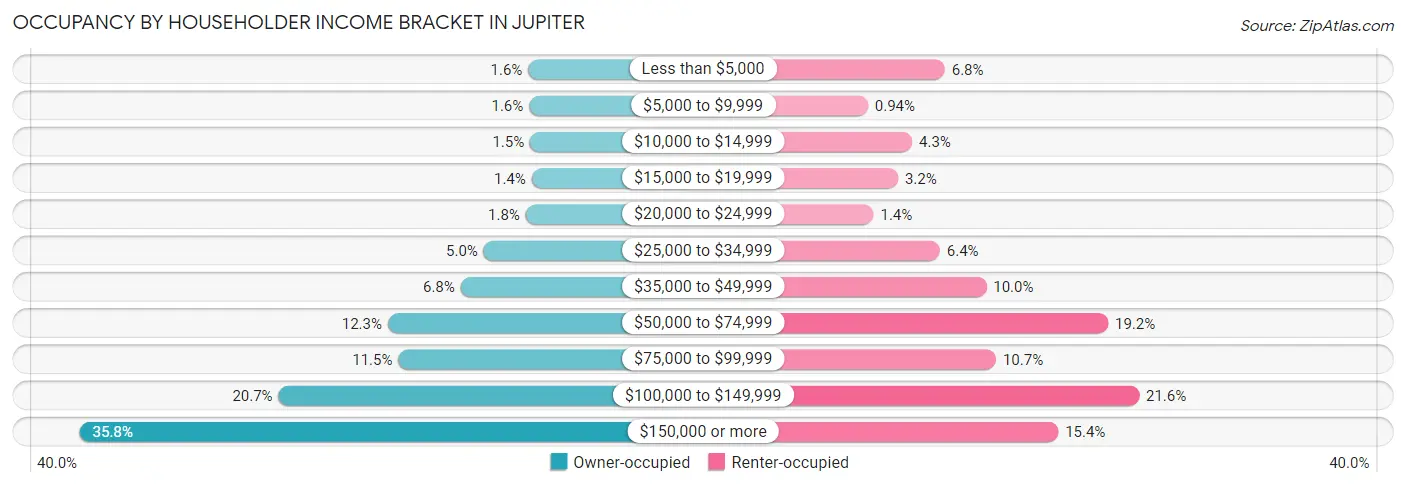
| Income Bracket | Owner-occupied | Renter-occupied |
| Less than $5,000 | 316 (1.6%) | 383 (6.8%) |
| $5,000 to $9,999 | 303 (1.6%) | 53 (0.9%) |
| $10,000 to $14,999 | 289 (1.5%) | 243 (4.3%) |
| $15,000 to $19,999 | 266 (1.4%) | 182 (3.2%) |
| $20,000 to $24,999 | 352 (1.8%) | 77 (1.4%) |
| $25,000 to $34,999 | 973 (5.0%) | 362 (6.4%) |
| $35,000 to $49,999 | 1,314 (6.8%) | 561 (10.0%) |
| $50,000 to $74,999 | 2,389 (12.3%) | 1,084 (19.2%) |
| $75,000 to $99,999 | 2,234 (11.5%) | 603 (10.7%) |
| $100,000 to $149,999 | 4,004 (20.7%) | 1,217 (21.6%) |
| $150,000 or more | 6,939 (35.8%) | 870 (15.4%) |
| Total | 19,379 (100.0%) | 5,635 (100.0%) |
Monthly Housing Cost Tiers in Jupiter
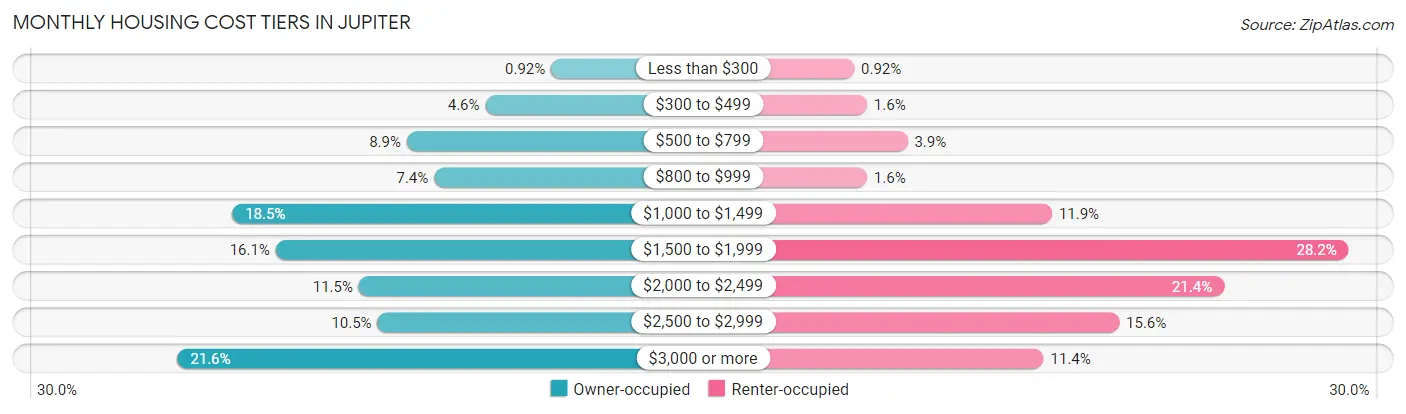
| Monthly Cost | Owner-occupied | Renter-occupied |
| Less than $300 | 178 (0.9%) | 52 (0.9%) |
| $300 to $499 | 881 (4.5%) | 92 (1.6%) |
| $500 to $799 | 1,722 (8.9%) | 218 (3.9%) |
| $800 to $999 | 1,431 (7.4%) | 92 (1.6%) |
| $1,000 to $1,499 | 3,590 (18.5%) | 668 (11.8%) |
| $1,500 to $1,999 | 3,126 (16.1%) | 1,591 (28.2%) |
| $2,000 to $2,499 | 2,236 (11.5%) | 1,203 (21.3%) |
| $2,500 to $2,999 | 2,037 (10.5%) | 877 (15.6%) |
| $3,000 or more | 4,178 (21.6%) | 642 (11.4%) |
| Total | 19,379 (100.0%) | 5,635 (100.0%) |
Physical Housing Characteristics in Jupiter
Housing Structures in Jupiter
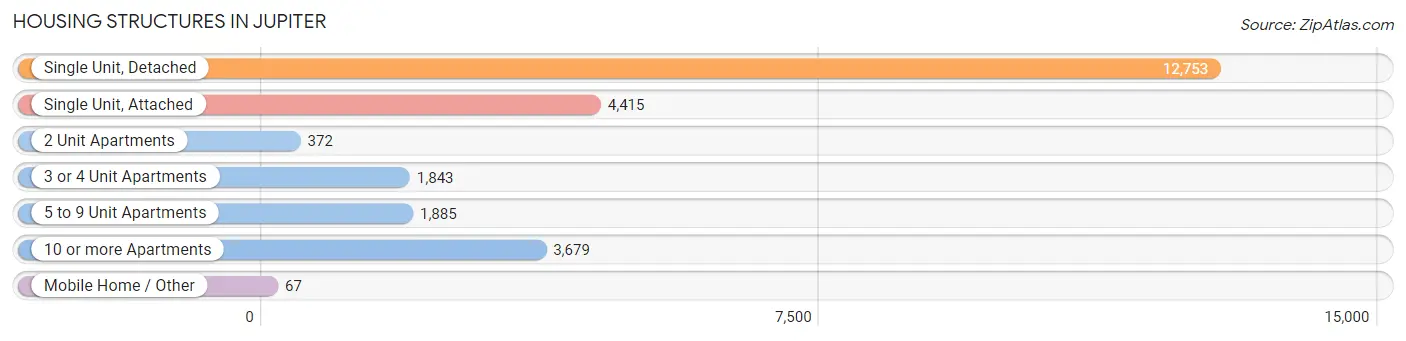
| Structure Type | # Housing Units | % Housing Units |
| Single Unit, Detached | 12,753 | 51.0% |
| Single Unit, Attached | 4,415 | 17.6% |
| 2 Unit Apartments | 372 | 1.5% |
| 3 or 4 Unit Apartments | 1,843 | 7.4% |
| 5 to 9 Unit Apartments | 1,885 | 7.5% |
| 10 or more Apartments | 3,679 | 14.7% |
| Mobile Home / Other | 67 | 0.3% |
| Total | 25,014 | 100.0% |
Housing Structures by Occupancy in Jupiter
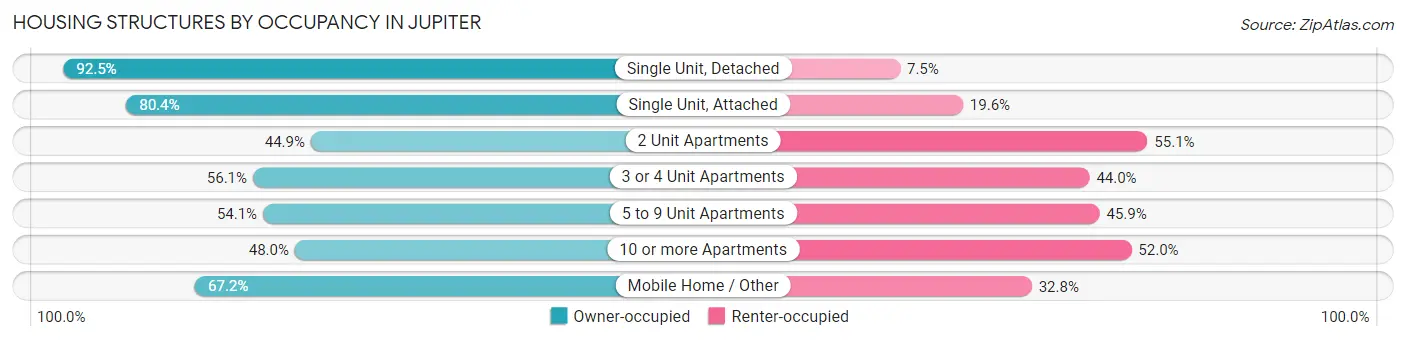
| Structure Type | Owner-occupied | Renter-occupied |
| Single Unit, Detached | 11,799 (92.5%) | 954 (7.5%) |
| Single Unit, Attached | 3,550 (80.4%) | 865 (19.6%) |
| 2 Unit Apartments | 167 (44.9%) | 205 (55.1%) |
| 3 or 4 Unit Apartments | 1,033 (56.0%) | 810 (44.0%) |
| 5 to 9 Unit Apartments | 1,020 (54.1%) | 865 (45.9%) |
| 10 or more Apartments | 1,765 (48.0%) | 1,914 (52.0%) |
| Mobile Home / Other | 45 (67.2%) | 22 (32.8%) |
| Total | 19,379 (77.5%) | 5,635 (22.5%) |
Housing Structures by Number of Rooms in Jupiter
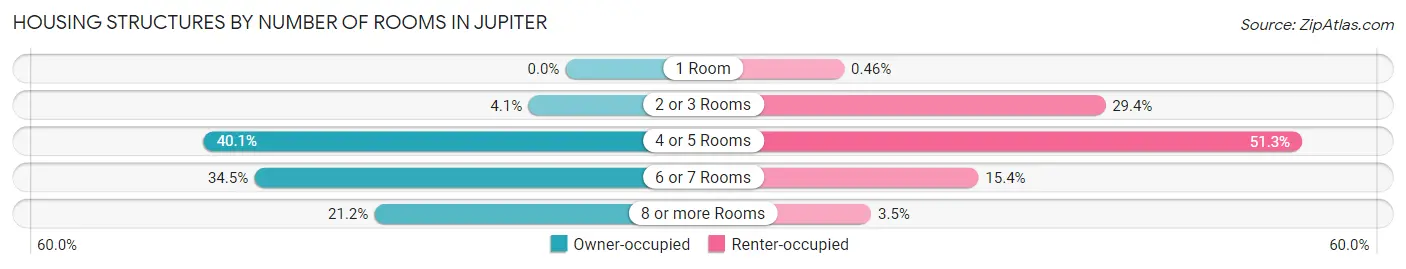
| Number of Rooms | Owner-occupied | Renter-occupied |
| 1 Room | 0 (0.0%) | 26 (0.5%) |
| 2 or 3 Rooms | 800 (4.1%) | 1,659 (29.4%) |
| 4 or 5 Rooms | 7,774 (40.1%) | 2,889 (51.3%) |
| 6 or 7 Rooms | 6,694 (34.5%) | 866 (15.4%) |
| 8 or more Rooms | 4,111 (21.2%) | 195 (3.5%) |
| Total | 19,379 (100.0%) | 5,635 (100.0%) |
Housing Structure by Heating Type in Jupiter
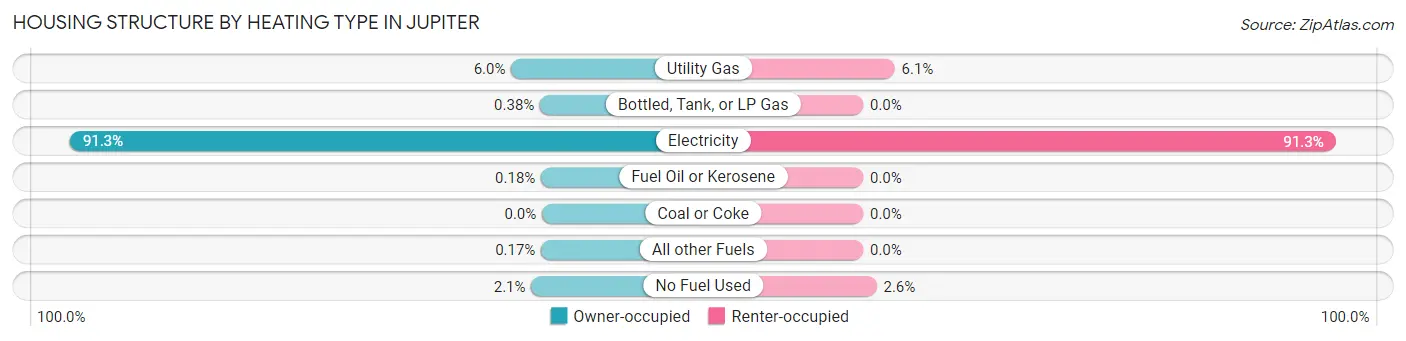
| Heating Type | Owner-occupied | Renter-occupied |
| Utility Gas | 1,153 (5.9%) | 344 (6.1%) |
| Bottled, Tank, or LP Gas | 73 (0.4%) | 0 (0.0%) |
| Electricity | 17,684 (91.2%) | 5,144 (91.3%) |
| Fuel Oil or Kerosene | 35 (0.2%) | 0 (0.0%) |
| Coal or Coke | 0 (0.0%) | 0 (0.0%) |
| All other Fuels | 33 (0.2%) | 0 (0.0%) |
| No Fuel Used | 401 (2.1%) | 147 (2.6%) |
| Total | 19,379 (100.0%) | 5,635 (100.0%) |
Household Vehicle Usage in Jupiter
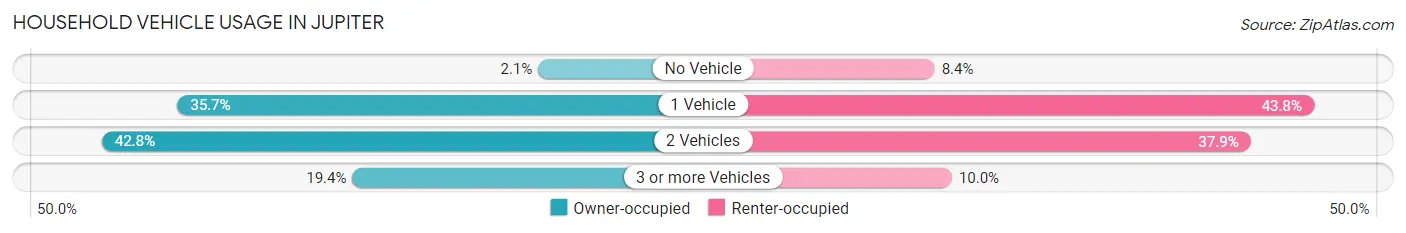
| Vehicles per Household | Owner-occupied | Renter-occupied |
| No Vehicle | 399 (2.1%) | 472 (8.4%) |
| 1 Vehicle | 6,926 (35.7%) | 2,466 (43.8%) |
| 2 Vehicles | 8,293 (42.8%) | 2,134 (37.9%) |
| 3 or more Vehicles | 3,761 (19.4%) | 563 (10.0%) |
| Total | 19,379 (100.0%) | 5,635 (100.0%) |
Real Estate & Mortgages in Jupiter
Real Estate and Mortgage Overview in Jupiter
| Characteristic | Without Mortgage | With Mortgage |
| Housing Units | 7,762 | 11,617 |
| Median Property Value | $481,100 | $495,700 |
| Median Household Income | $86,532 | $4,709 |
| Monthly Housing Costs | $996 | $3,839 |
| Real Estate Taxes | $4,607 | $201 |
Property Value by Mortgage Status in Jupiter
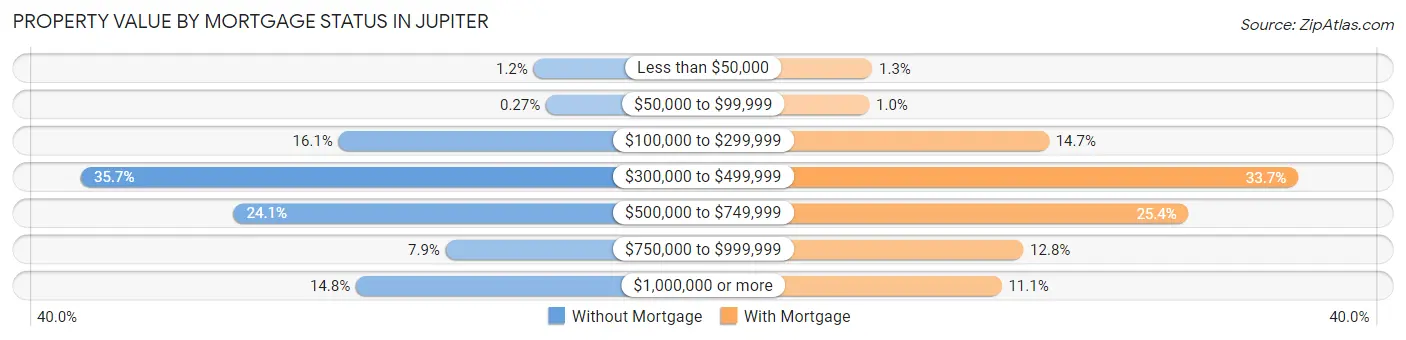
| Property Value | Without Mortgage | With Mortgage |
| Less than $50,000 | 95 (1.2%) | 146 (1.3%) |
| $50,000 to $99,999 | 21 (0.3%) | 120 (1.0%) |
| $100,000 to $299,999 | 1,247 (16.1%) | 1,710 (14.7%) |
| $300,000 to $499,999 | 2,771 (35.7%) | 3,917 (33.7%) |
| $500,000 to $749,999 | 1,868 (24.1%) | 2,948 (25.4%) |
| $750,000 to $999,999 | 615 (7.9%) | 1,484 (12.8%) |
| $1,000,000 or more | 1,145 (14.7%) | 1,292 (11.1%) |
| Total | 7,762 (100.0%) | 11,617 (100.0%) |
Household Income by Mortgage Status in Jupiter
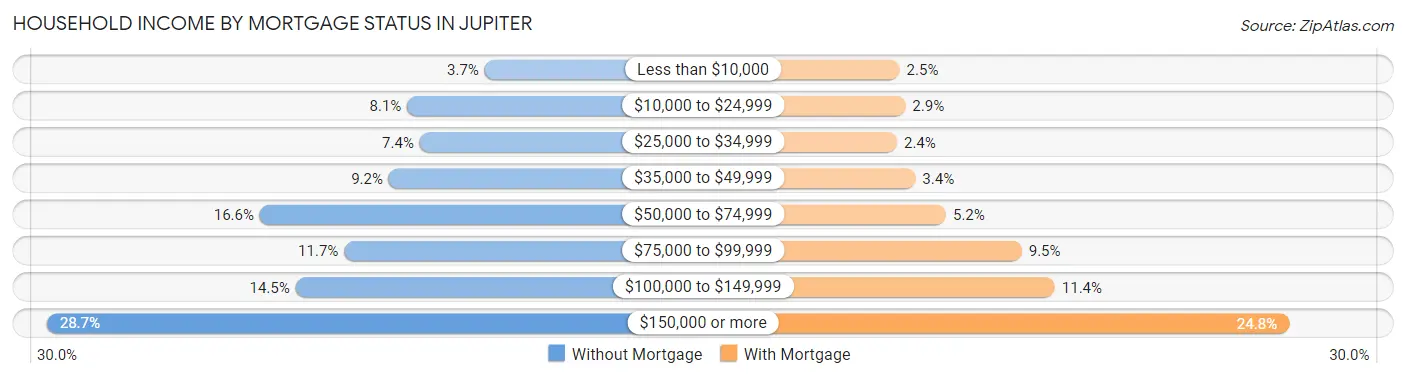
| Household Income | Without Mortgage | With Mortgage |
| Less than $10,000 | 288 (3.7%) | 293 (2.5%) |
| $10,000 to $24,999 | 632 (8.1%) | 331 (2.9%) |
| $25,000 to $34,999 | 576 (7.4%) | 275 (2.4%) |
| $35,000 to $49,999 | 713 (9.2%) | 397 (3.4%) |
| $50,000 to $74,999 | 1,285 (16.6%) | 601 (5.2%) |
| $75,000 to $99,999 | 911 (11.7%) | 1,104 (9.5%) |
| $100,000 to $149,999 | 1,127 (14.5%) | 1,323 (11.4%) |
| $150,000 or more | 2,230 (28.7%) | 2,877 (24.8%) |
| Total | 7,762 (100.0%) | 11,617 (100.0%) |
Property Value to Household Income Ratio in Jupiter
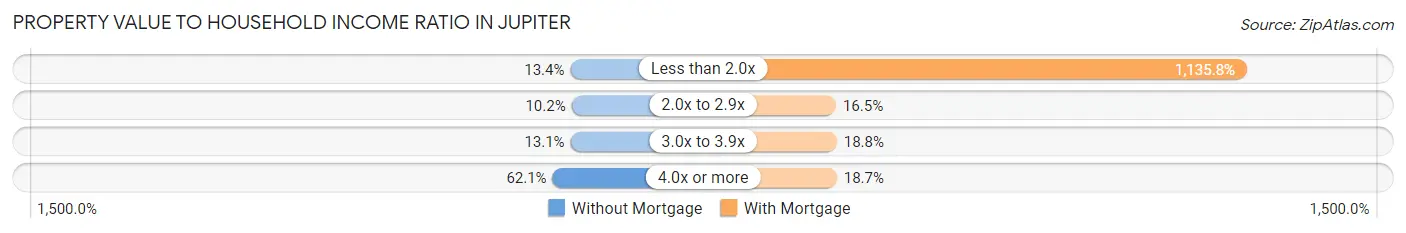
| Value-to-Income Ratio | Without Mortgage | With Mortgage |
| Less than 2.0x | 1,037 (13.4%) | 131,947 (1,135.8%) |
| 2.0x to 2.9x | 793 (10.2%) | 1,916 (16.5%) |
| 3.0x to 3.9x | 1,013 (13.1%) | 2,188 (18.8%) |
| 4.0x or more | 4,817 (62.1%) | 2,176 (18.7%) |
| Total | 7,762 (100.0%) | 11,617 (100.0%) |
Real Estate Taxes by Mortgage Status in Jupiter
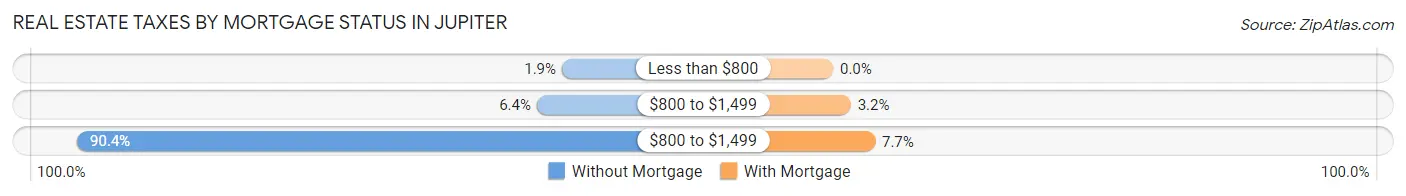
| Property Taxes | Without Mortgage | With Mortgage |
| Less than $800 | 145 (1.9%) | 0 (0.0%) |
| $800 to $1,499 | 500 (6.4%) | 375 (3.2%) |
| $800 to $1,499 | 7,020 (90.4%) | 891 (7.7%) |
| Total | 7,762 (100.0%) | 11,617 (100.0%) |
Health & Disability in Jupiter
Health Insurance Coverage by Age in Jupiter
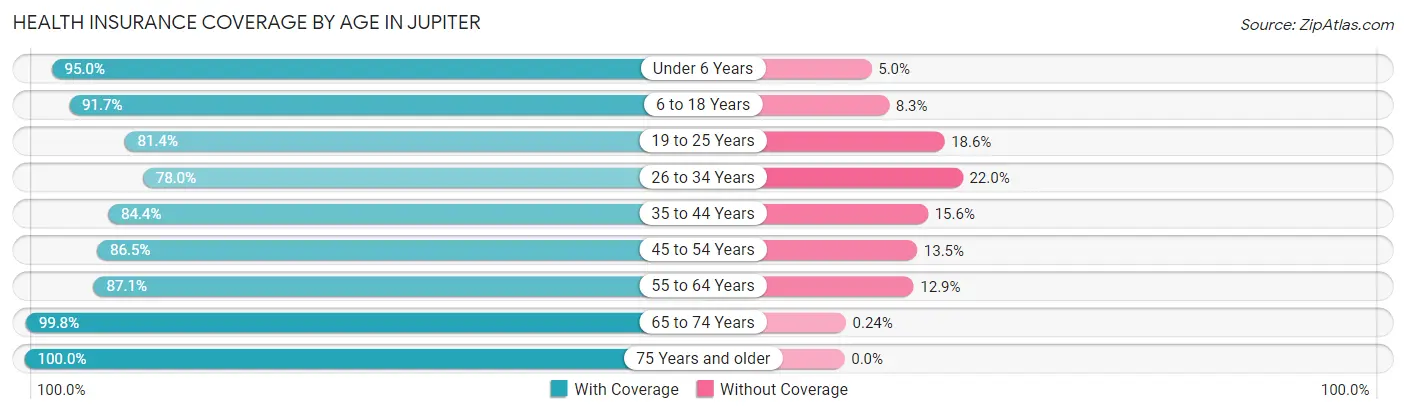
| Age Bracket | With Coverage | Without Coverage |
| Under 6 Years | 2,702 (95.0%) | 143 (5.0%) |
| 6 to 18 Years | 8,499 (91.7%) | 769 (8.3%) |
| 19 to 25 Years | 4,216 (81.4%) | 965 (18.6%) |
| 26 to 34 Years | 4,090 (78.0%) | 1,156 (22.0%) |
| 35 to 44 Years | 5,607 (84.4%) | 1,033 (15.6%) |
| 45 to 54 Years | 7,150 (86.5%) | 1,119 (13.5%) |
| 55 to 64 Years | 8,080 (87.1%) | 1,195 (12.9%) |
| 65 to 74 Years | 7,419 (99.8%) | 18 (0.2%) |
| 75 Years and older | 6,440 (100.0%) | 0 (0.0%) |
| Total | 54,203 (89.4%) | 6,398 (10.6%) |
Health Insurance Coverage by Citizenship Status in Jupiter
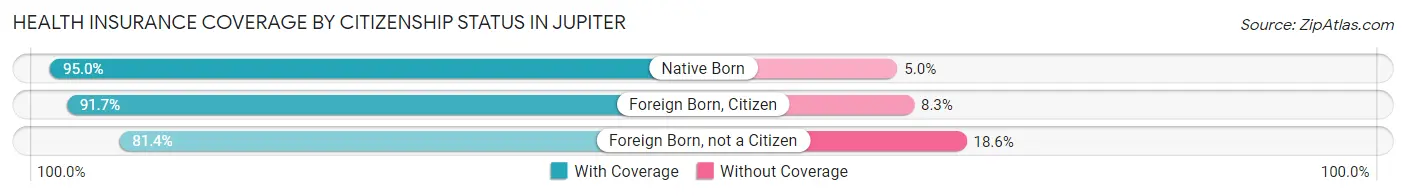
| Citizenship Status | With Coverage | Without Coverage |
| Native Born | 2,702 (95.0%) | 143 (5.0%) |
| Foreign Born, Citizen | 8,499 (91.7%) | 769 (8.3%) |
| Foreign Born, not a Citizen | 4,216 (81.4%) | 965 (18.6%) |
Health Insurance Coverage by Household Income in Jupiter
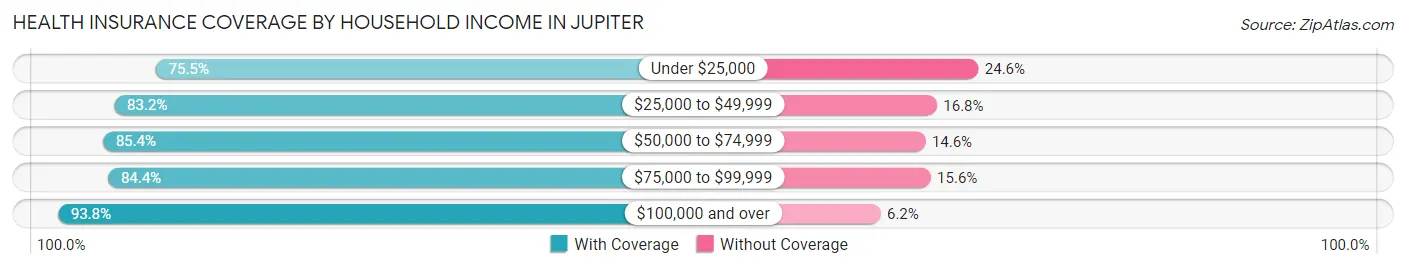
| Household Income | With Coverage | Without Coverage |
| Under $25,000 | 3,071 (75.4%) | 999 (24.5%) |
| $25,000 to $49,999 | 5,013 (83.2%) | 1,011 (16.8%) |
| $50,000 to $74,999 | 6,482 (85.4%) | 1,112 (14.6%) |
| $75,000 to $99,999 | 5,260 (84.4%) | 974 (15.6%) |
| $100,000 and over | 34,058 (93.8%) | 2,263 (6.2%) |
Public vs Private Health Insurance Coverage by Age in Jupiter
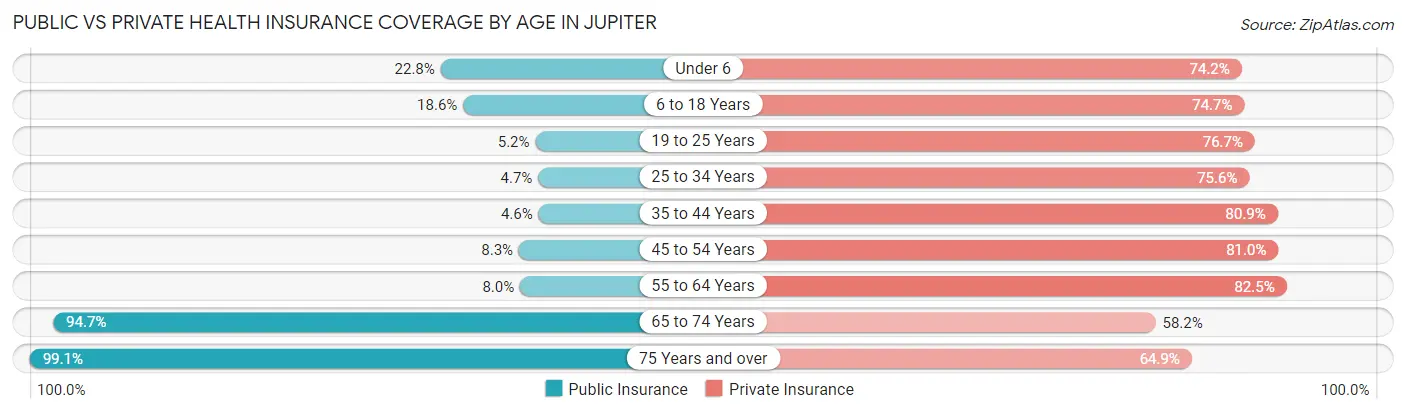
| Age Bracket | Public Insurance | Private Insurance |
| Under 6 | 648 (22.8%) | 2,111 (74.2%) |
| 6 to 18 Years | 1,724 (18.6%) | 6,923 (74.7%) |
| 19 to 25 Years | 269 (5.2%) | 3,972 (76.7%) |
| 25 to 34 Years | 245 (4.7%) | 3,967 (75.6%) |
| 35 to 44 Years | 306 (4.6%) | 5,371 (80.9%) |
| 45 to 54 Years | 682 (8.3%) | 6,698 (81.0%) |
| 55 to 64 Years | 746 (8.0%) | 7,655 (82.5%) |
| 65 to 74 Years | 7,042 (94.7%) | 4,331 (58.2%) |
| 75 Years and over | 6,379 (99.1%) | 4,182 (64.9%) |
| Total | 18,041 (29.8%) | 45,210 (74.6%) |
Disability Status by Sex by Age in Jupiter
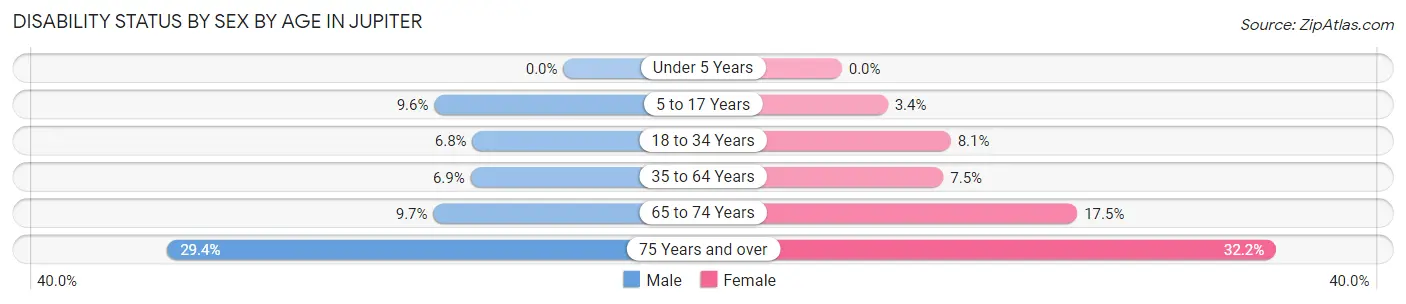
| Age Bracket | Male | Female |
| Under 5 Years | 0 (0.0%) | 0 (0.0%) |
| 5 to 17 Years | 447 (9.6%) | 151 (3.4%) |
| 18 to 34 Years | 387 (6.8%) | 429 (8.1%) |
| 35 to 64 Years | 806 (6.9%) | 942 (7.5%) |
| 65 to 74 Years | 339 (9.7%) | 686 (17.5%) |
| 75 Years and over | 815 (29.4%) | 1,183 (32.2%) |
Disability Class by Sex by Age in Jupiter
Disability Class: Hearing Difficulty
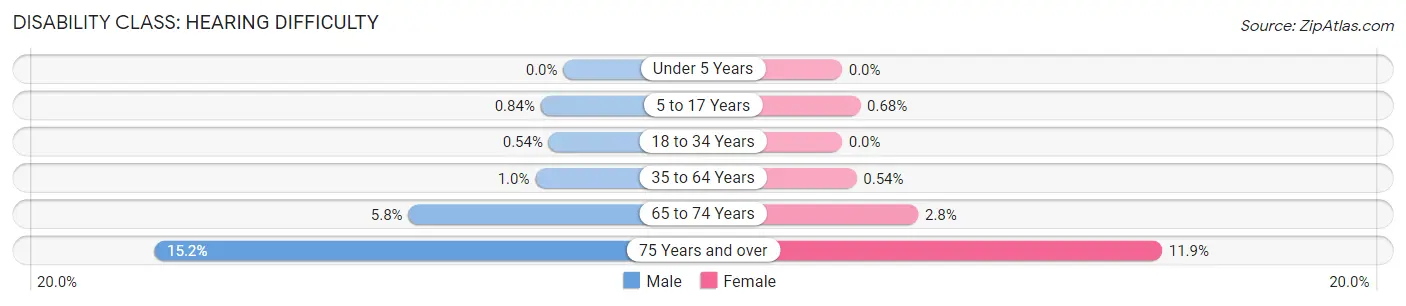
| Age Bracket | Male | Female |
| Under 5 Years | 0 (0.0%) | 0 (0.0%) |
| 5 to 17 Years | 39 (0.8%) | 30 (0.7%) |
| 18 to 34 Years | 31 (0.5%) | 0 (0.0%) |
| 35 to 64 Years | 122 (1.0%) | 67 (0.5%) |
| 65 to 74 Years | 202 (5.8%) | 111 (2.8%) |
| 75 Years and over | 421 (15.2%) | 436 (11.9%) |
Disability Class: Vision Difficulty
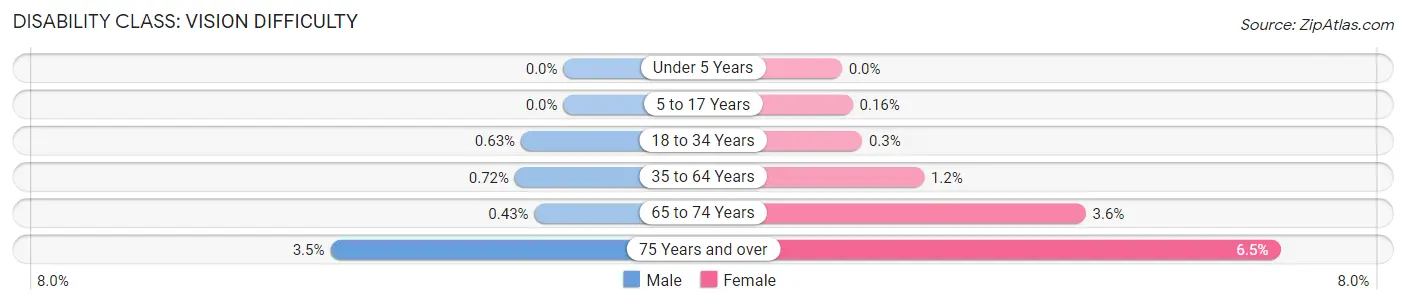
| Age Bracket | Male | Female |
| Under 5 Years | 0 (0.0%) | 0 (0.0%) |
| 5 to 17 Years | 0 (0.0%) | 7 (0.2%) |
| 18 to 34 Years | 36 (0.6%) | 16 (0.3%) |
| 35 to 64 Years | 84 (0.7%) | 153 (1.2%) |
| 65 to 74 Years | 15 (0.4%) | 142 (3.6%) |
| 75 Years and over | 96 (3.5%) | 239 (6.5%) |
Disability Class: Cognitive Difficulty
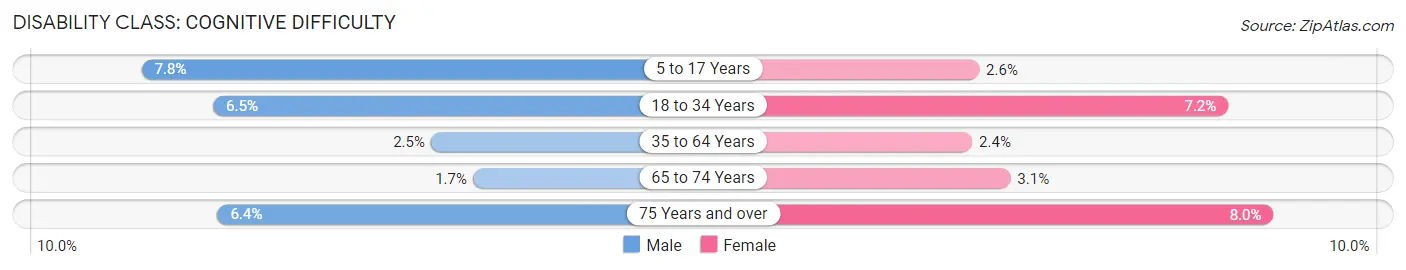
| Age Bracket | Male | Female |
| 5 to 17 Years | 365 (7.8%) | 113 (2.5%) |
| 18 to 34 Years | 373 (6.5%) | 380 (7.2%) |
| 35 to 64 Years | 288 (2.5%) | 302 (2.4%) |
| 65 to 74 Years | 59 (1.7%) | 123 (3.1%) |
| 75 Years and over | 178 (6.4%) | 294 (8.0%) |
Disability Class: Ambulatory Difficulty
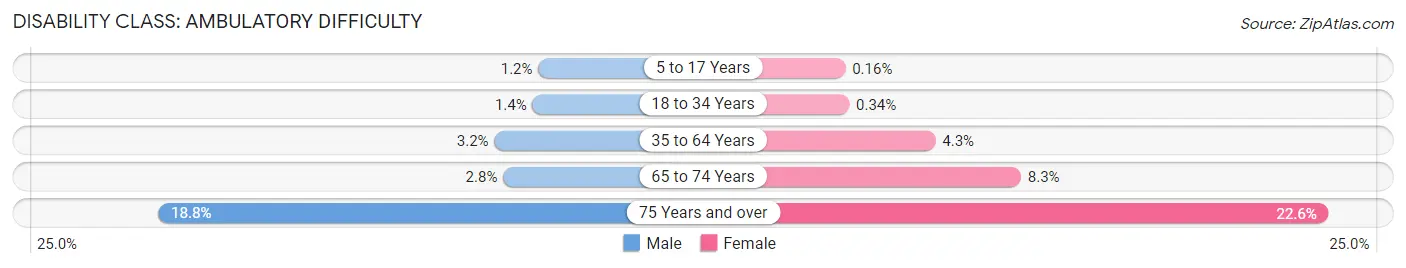
| Age Bracket | Male | Female |
| 5 to 17 Years | 54 (1.2%) | 7 (0.2%) |
| 18 to 34 Years | 82 (1.4%) | 18 (0.3%) |
| 35 to 64 Years | 374 (3.2%) | 542 (4.3%) |
| 65 to 74 Years | 98 (2.8%) | 326 (8.3%) |
| 75 Years and over | 521 (18.8%) | 829 (22.6%) |
Disability Class: Self-Care Difficulty
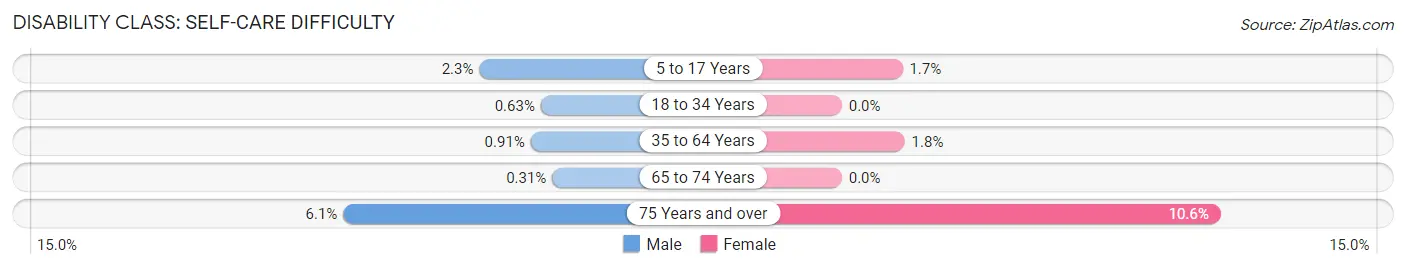
| Age Bracket | Male | Female |
| 5 to 17 Years | 109 (2.3%) | 75 (1.7%) |
| 18 to 34 Years | 36 (0.6%) | 0 (0.0%) |
| 35 to 64 Years | 106 (0.9%) | 218 (1.8%) |
| 65 to 74 Years | 11 (0.3%) | 0 (0.0%) |
| 75 Years and over | 170 (6.1%) | 387 (10.5%) |
Technology Access in Jupiter
Computing Device Access in Jupiter
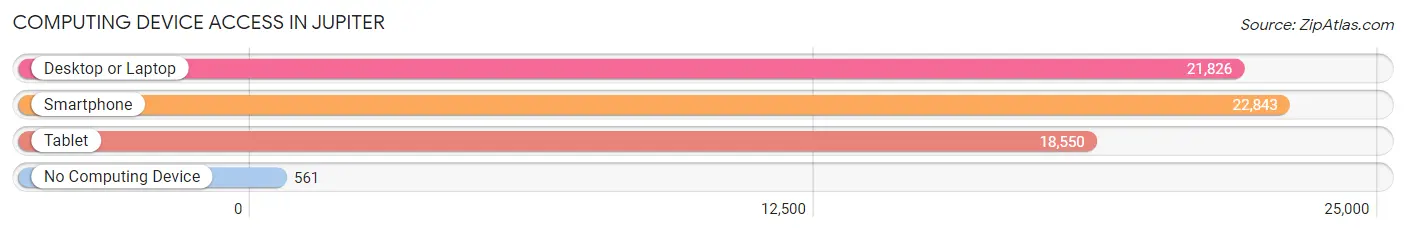
| Device Type | # Households | % Households |
| Desktop or Laptop | 21,826 | 87.3% |
| Smartphone | 22,843 | 91.3% |
| Tablet | 18,550 | 74.2% |
| No Computing Device | 561 | 2.2% |
| Total | 25,014 | 100.0% |
Internet Access in Jupiter
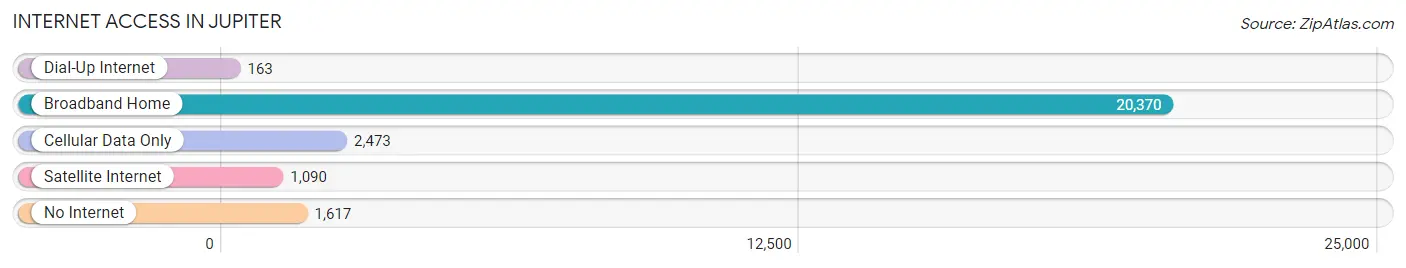
| Internet Type | # Households | % Households |
| Dial-Up Internet | 163 | 0.6% |
| Broadband Home | 20,370 | 81.4% |
| Cellular Data Only | 2,473 | 9.9% |
| Satellite Internet | 1,090 | 4.4% |
| No Internet | 1,617 | 6.5% |
| Total | 25,014 | 100.0% |
Jupiter Summary
Jupiter, Florida is a town located in Palm Beach County, Florida, United States. It is located on the Atlantic coast of Florida, about 50 miles north of Miami. The town is known for its beautiful beaches, lush green parks, and vibrant nightlife. It is also home to some of the most prestigious golf courses in the world.
History
Jupiter was first settled in the late 1800s by a group of settlers from the Bahamas. The settlers named the town after the Roman god Jupiter, who was the god of the sky and thunder. The town was incorporated in 1925 and has since grown to become one of the most popular tourist destinations in Florida.
Geography
Jupiter is located in the southeastern part of Palm Beach County, Florida. It is bordered by the Atlantic Ocean to the east, the Loxahatchee River to the west, and the Indian River Lagoon to the south. The town is located on a barrier island, which is separated from the mainland by the Intracoastal Waterway. The town has a total area of 21.3 square miles, of which 19.7 square miles is land and 1.6 square miles is water.
Economy
Jupiter’s economy is largely driven by tourism. The town is home to several resorts, hotels, and restaurants, which attract visitors from all over the world. The town is also home to several golf courses, which attract golfers from around the world. Additionally, the town is home to several marinas, which attract boaters from around the world.
Demographics
As of the 2010 census, Jupiter had a population of 55,156. The racial makeup of the town was 87.3% White, 5.3% African American, 0.3% Native American, 2.2% Asian, 0.1% Pacific Islander, 2.3% from other races, and 2.5% from two or more races. Hispanic or Latino of any race were 8.7% of the population.
Jupiter is a diverse town with a variety of cultures and backgrounds. The town is home to a large number of retirees, as well as young professionals and families. The town is also home to a large number of immigrants, particularly from Latin America.
Conclusion
Jupiter, Florida is a beautiful town located in Palm Beach County, Florida. It is known for its beautiful beaches, lush green parks, and vibrant nightlife. The town has a diverse population and a strong economy driven by tourism. It is home to several resorts, hotels, and restaurants, as well as several golf courses and marinas. Jupiter is a great place to live, work, and play.
Common Questions
What is Per Capita Income in Jupiter?
Per Capita income in Jupiter is $67,483.
What is the Median Family Income in Jupiter?
Median Family Income in Jupiter is $126,074.
What is the Median Household income in Jupiter?
Median Household Income in Jupiter is $105,413.
What is Income or Wage Gap in Jupiter?
Income or Wage Gap in Jupiter is 34.6%.
Women in Jupiter earn 65.4 cents for every dollar earned by a man.
What is Family Income Deficit in Jupiter?
Family Income Deficit in Jupiter is $14,676.
Families that are below poverty line in Jupiter earn $14,676 less on average than the poverty threshold level.
What is Inequality or Gini Index in Jupiter?
Inequality or Gini Index in Jupiter is 0.52.
What is the Total Population of Jupiter?
Total Population of Jupiter is 60,926.
What is the Total Male Population of Jupiter?
Total Male Population of Jupiter is 30,051.
What is the Total Female Population of Jupiter?
Total Female Population of Jupiter is 30,875.
What is the Ratio of Males per 100 Females in Jupiter?
There are 97.33 Males per 100 Females in Jupiter.
What is the Ratio of Females per 100 Males in Jupiter?
There are 102.74 Females per 100 Males in Jupiter.
What is the Median Population Age in Jupiter?
Median Population Age in Jupiter is 47.1 Years.
What is the Average Family Size in Jupiter
Average Family Size in Jupiter is 3.0 People.
What is the Average Household Size in Jupiter
Average Household Size in Jupiter is 2.4 People.
How Large is the Labor Force in Jupiter?
There are 31,511 People in the Labor Forcein in Jupiter.
What is the Percentage of People in the Labor Force in Jupiter?
62.0% of People are in the Labor Force in Jupiter.
What is the Unemployment Rate in Jupiter?
Unemployment Rate in Jupiter is 4.0%.