Lake Zurich, IL Map & Demographics
Lake Zurich Map
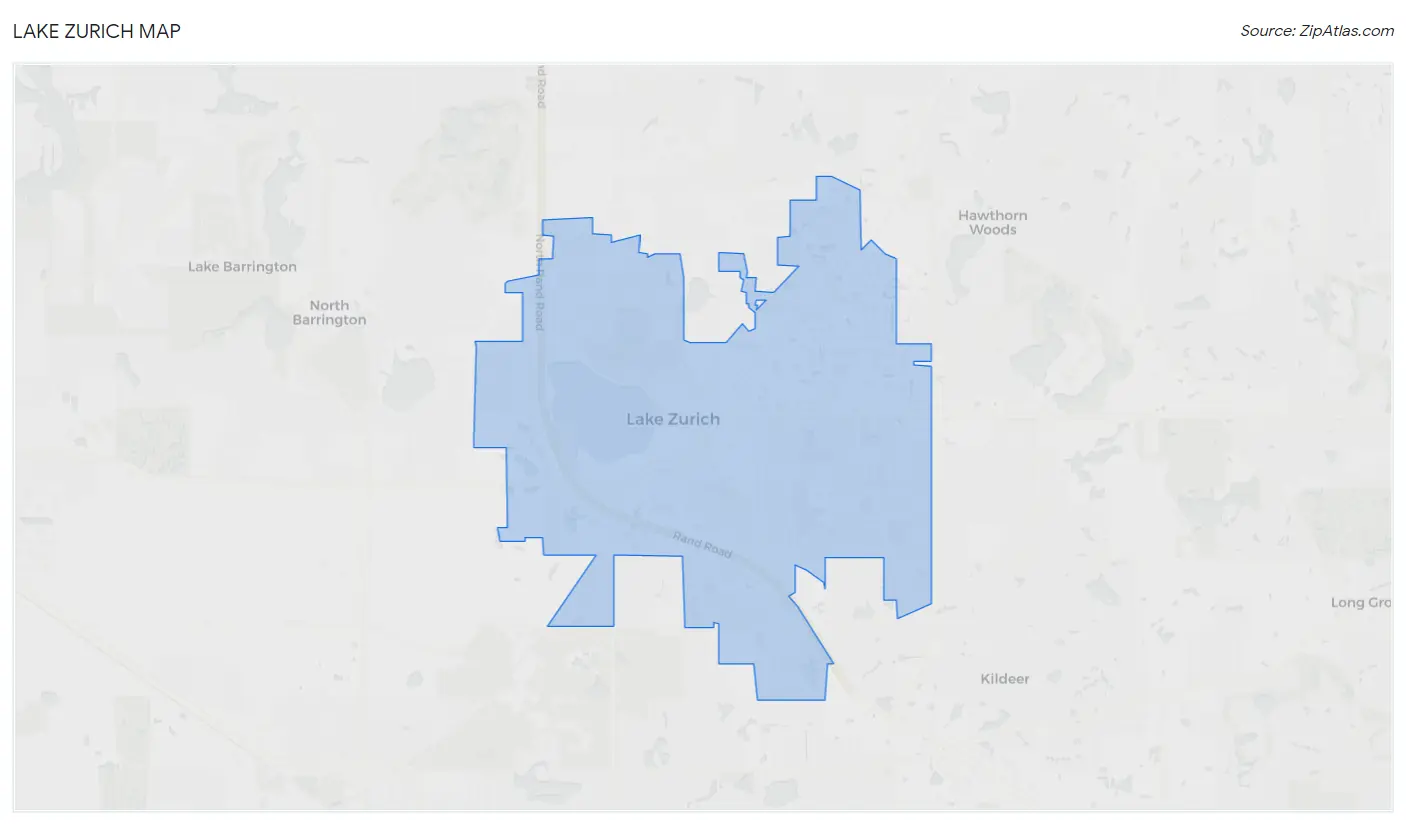
Lake Zurich Overview
$59,566
PER CAPITA INCOME
$151,888
AVG FAMILY INCOME
$135,211
AVG HOUSEHOLD INCOME
45.4%
WAGE / INCOME GAP [ % ]
54.6¢/ $1
WAGE / INCOME GAP [ $ ]
0.38
INEQUALITY / GINI INDEX
19,749
TOTAL POPULATION
9,826
MALE POPULATION
9,923
FEMALE POPULATION
99.02
MALES / 100 FEMALES
100.99
FEMALES / 100 MALES
41.2
MEDIAN AGE
3.1
AVG FAMILY SIZE
2.7
AVG HOUSEHOLD SIZE
11,664
LABOR FORCE [ PEOPLE ]
74.3%
PERCENT IN LABOR FORCE
3.5%
UNEMPLOYMENT RATE
Lake Zurich Zip Codes
Income in Lake Zurich
Income Overview in Lake Zurich
Per Capita Income in Lake Zurich is $59,566, while median incomes of families and households are $151,888 and $135,211 respectively.
| Characteristic | Number | Measure |
| Per Capita Income | 19,749 | $59,566 |
| Median Family Income | 5,683 | $151,888 |
| Mean Family Income | 5,683 | $179,889 |
| Median Household Income | 7,173 | $135,211 |
| Mean Household Income | 7,173 | $162,339 |
| Income Deficit | 5,683 | $0 |
| Wage / Income Gap (%) | 19,749 | 45.41% |
| Wage / Income Gap ($) | 19,749 | 54.59¢ per $1 |
| Gini / Inequality Index | 19,749 | 0.38 |
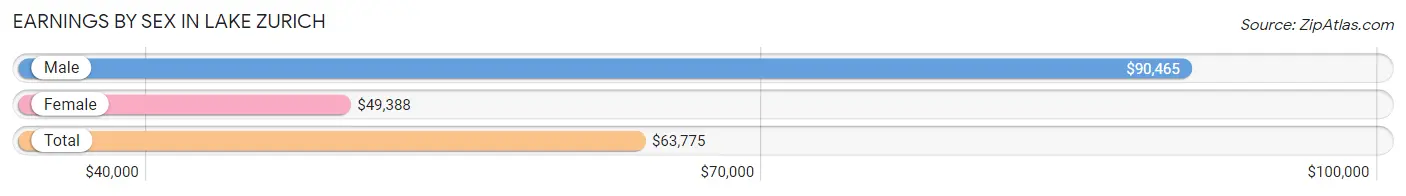
Earnings by Sex in Lake Zurich
Average Earnings in Lake Zurich are $63,775, $90,465 for men and $49,388 for women, a difference of 45.4%.
| Sex | Number | Average Earnings |
| Male | 6,202 (50.7%) | $90,465 |
| Female | 6,023 (49.3%) | $49,388 |
| Total | 12,225 (100.0%) | $63,775 |
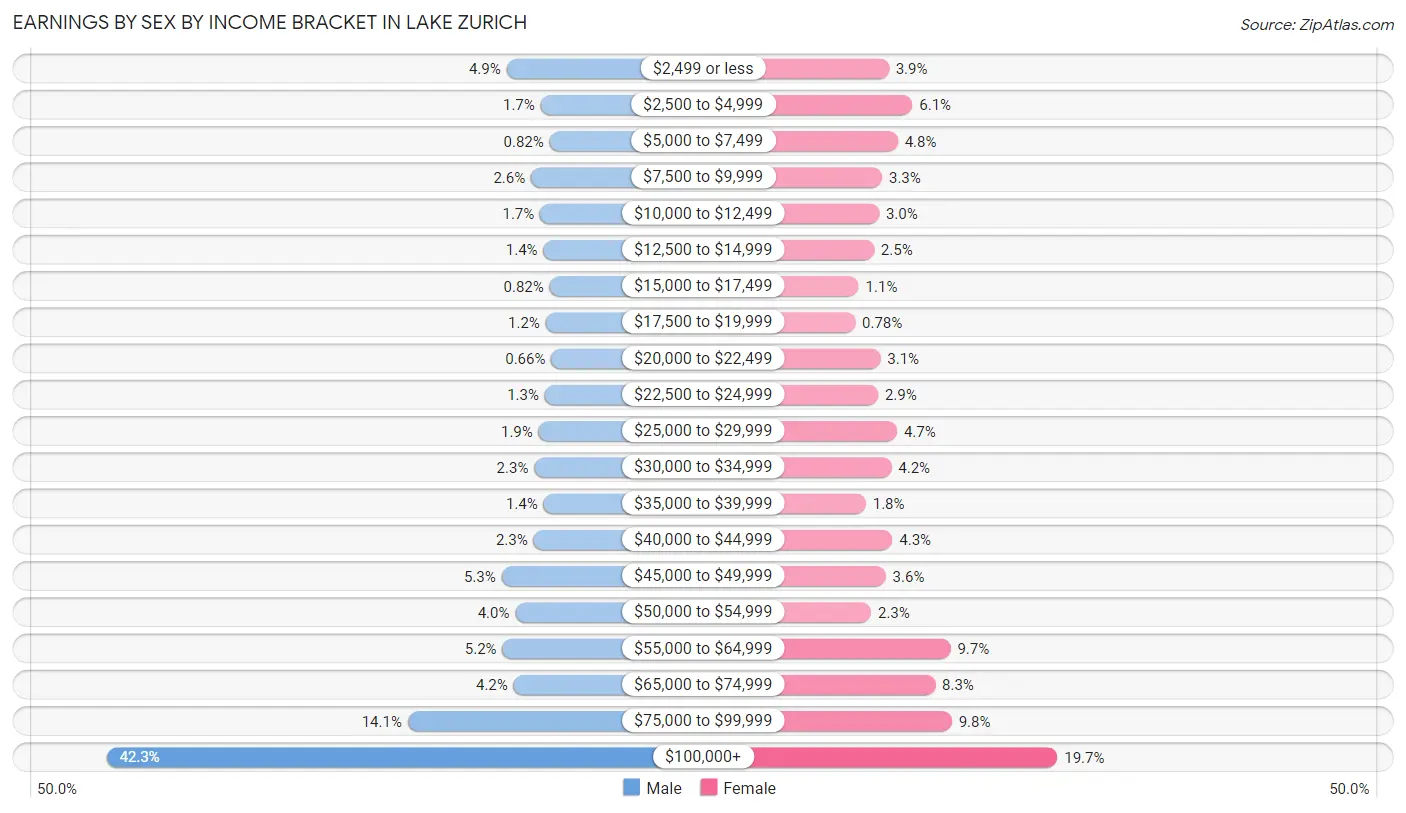
Earnings by Sex by Income Bracket in Lake Zurich
The most common earnings brackets in Lake Zurich are $100,000+ for men (2,625 | 42.3%) and $100,000+ for women (1,188 | 19.7%).
| Income | Male | Female |
| $2,499 or less | 301 (4.9%) | 237 (3.9%) |
| $2,500 to $4,999 | 103 (1.7%) | 370 (6.1%) |
| $5,000 to $7,499 | 51 (0.8%) | 287 (4.8%) |
| $7,500 to $9,999 | 159 (2.6%) | 199 (3.3%) |
| $10,000 to $12,499 | 106 (1.7%) | 181 (3.0%) |
| $12,500 to $14,999 | 87 (1.4%) | 153 (2.5%) |
| $15,000 to $17,499 | 51 (0.8%) | 67 (1.1%) |
| $17,500 to $19,999 | 74 (1.2%) | 47 (0.8%) |
| $20,000 to $22,499 | 41 (0.7%) | 189 (3.1%) |
| $22,500 to $24,999 | 79 (1.3%) | 176 (2.9%) |
| $25,000 to $29,999 | 115 (1.8%) | 283 (4.7%) |
| $30,000 to $34,999 | 140 (2.3%) | 251 (4.2%) |
| $35,000 to $39,999 | 86 (1.4%) | 107 (1.8%) |
| $40,000 to $44,999 | 144 (2.3%) | 257 (4.3%) |
| $45,000 to $49,999 | 330 (5.3%) | 219 (3.6%) |
| $50,000 to $54,999 | 250 (4.0%) | 137 (2.3%) |
| $55,000 to $64,999 | 325 (5.2%) | 585 (9.7%) |
| $65,000 to $74,999 | 260 (4.2%) | 498 (8.3%) |
| $75,000 to $99,999 | 875 (14.1%) | 592 (9.8%) |
| $100,000+ | 2,625 (42.3%) | 1,188 (19.7%) |
| Total | 6,202 (100.0%) | 6,023 (100.0%) |
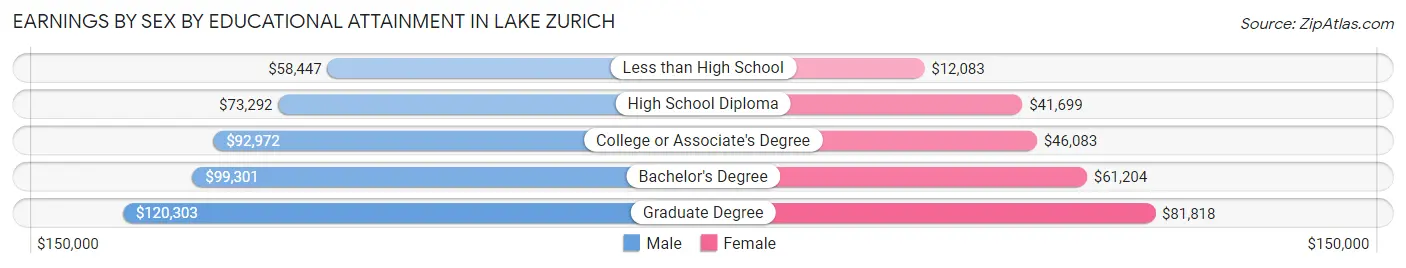
Earnings by Sex by Educational Attainment in Lake Zurich
Average earnings in Lake Zurich are $97,757 for men and $58,537 for women, a difference of 40.1%. Men with an educational attainment of graduate degree enjoy the highest average annual earnings of $120,303, while those with less than high school education earn the least with $58,447. Women with an educational attainment of graduate degree earn the most with the average annual earnings of $81,818, while those with less than high school education have the smallest earnings of $12,083.
| Educational Attainment | Male Income | Female Income |
| Less than High School | $58,447 | $12,083 |
| High School Diploma | $73,292 | $41,699 |
| College or Associate's Degree | $92,972 | $46,083 |
| Bachelor's Degree | $99,301 | $61,204 |
| Graduate Degree | $120,303 | $81,818 |
| Total | $97,757 | $58,537 |
Family Income in Lake Zurich
Family Income Brackets in Lake Zurich
According to the Lake Zurich family income data, there are 1,836 families falling into the $200,000+ income range, which is the most common income bracket and makes up 32.3% of all families. Conversely, the less than $10,000 income bracket is the least frequent group with only 23 families (0.4%) belonging to this category.
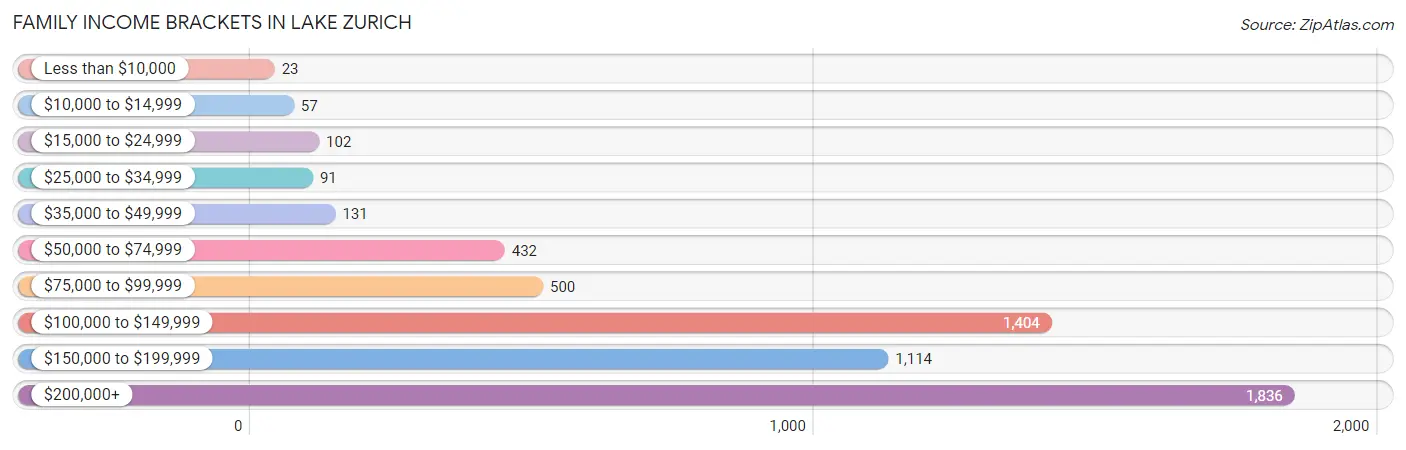
| Income Bracket | # Families | % Families |
| Less than $10,000 | 23 | 0.4% |
| $10,000 to $14,999 | 57 | 1.0% |
| $15,000 to $24,999 | 102 | 1.8% |
| $25,000 to $34,999 | 91 | 1.6% |
| $35,000 to $49,999 | 131 | 2.3% |
| $50,000 to $74,999 | 432 | 7.6% |
| $75,000 to $99,999 | 500 | 8.8% |
| $100,000 to $149,999 | 1,404 | 24.7% |
| $150,000 to $199,999 | 1,114 | 19.6% |
| $200,000+ | 1,836 | 32.3% |
Family Income by Famaliy Size in Lake Zurich
4-person families (1,261 | 22.2%) account for the highest median family income in Lake Zurich with $187,951 per family, while 2-person families (2,413 | 42.5%) have the highest median income of $60,078 per family member.
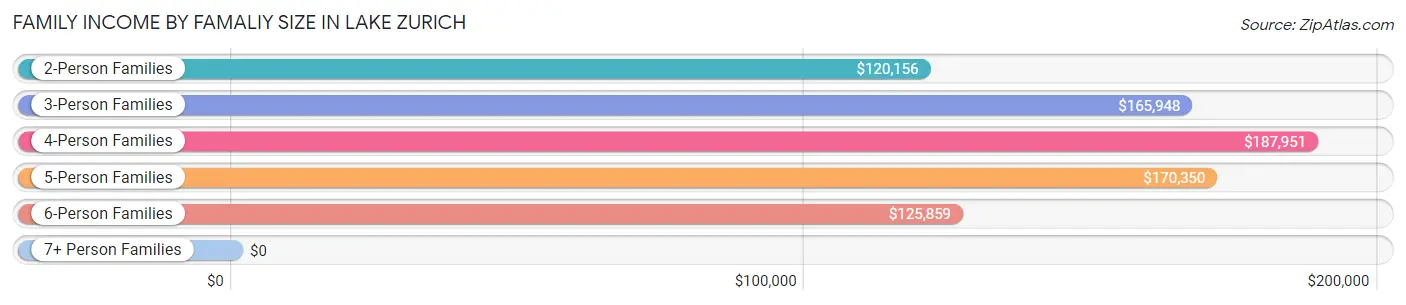
| Income Bracket | # Families | Median Income |
| 2-Person Families | 2,413 (42.5%) | $120,156 |
| 3-Person Families | 1,454 (25.6%) | $165,948 |
| 4-Person Families | 1,261 (22.2%) | $187,951 |
| 5-Person Families | 465 (8.2%) | $170,350 |
| 6-Person Families | 79 (1.4%) | $125,859 |
| 7+ Person Families | 11 (0.2%) | $0 |
| Total | 5,683 (100.0%) | $151,888 |
Family Income by Number of Earners in Lake Zurich
The median family income in Lake Zurich is $151,888, with families comprising 3+ earners (901) having the highest median family income of $195,536, while families with no earners (478) have the lowest median family income of $73,333, accounting for 15.9% and 8.4% of families, respectively.
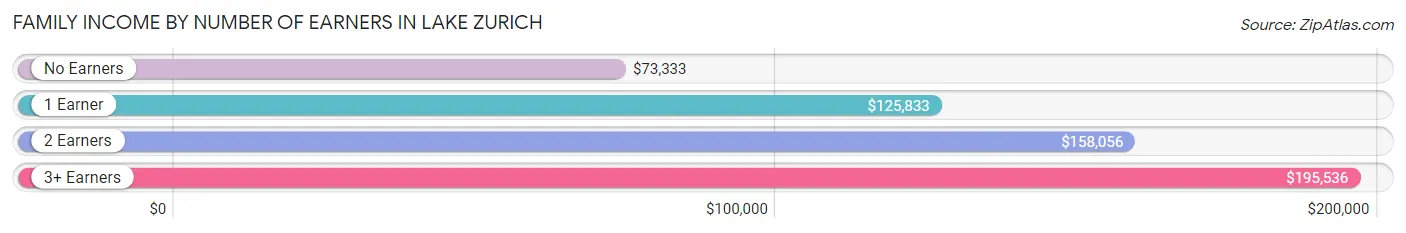
| Number of Earners | # Families | Median Income |
| No Earners | 478 (8.4%) | $73,333 |
| 1 Earner | 1,142 (20.1%) | $125,833 |
| 2 Earners | 3,162 (55.6%) | $158,056 |
| 3+ Earners | 901 (15.9%) | $195,536 |
| Total | 5,683 (100.0%) | $151,888 |
Household Income in Lake Zurich
Household Income Brackets in Lake Zurich
With 1,994 households falling in the category, the $200,000+ income range is the most frequent in Lake Zurich, accounting for 27.8% of all households. In contrast, only 57 households (0.8%) fall into the $10,000 to $14,999 income bracket, making it the least populous group.
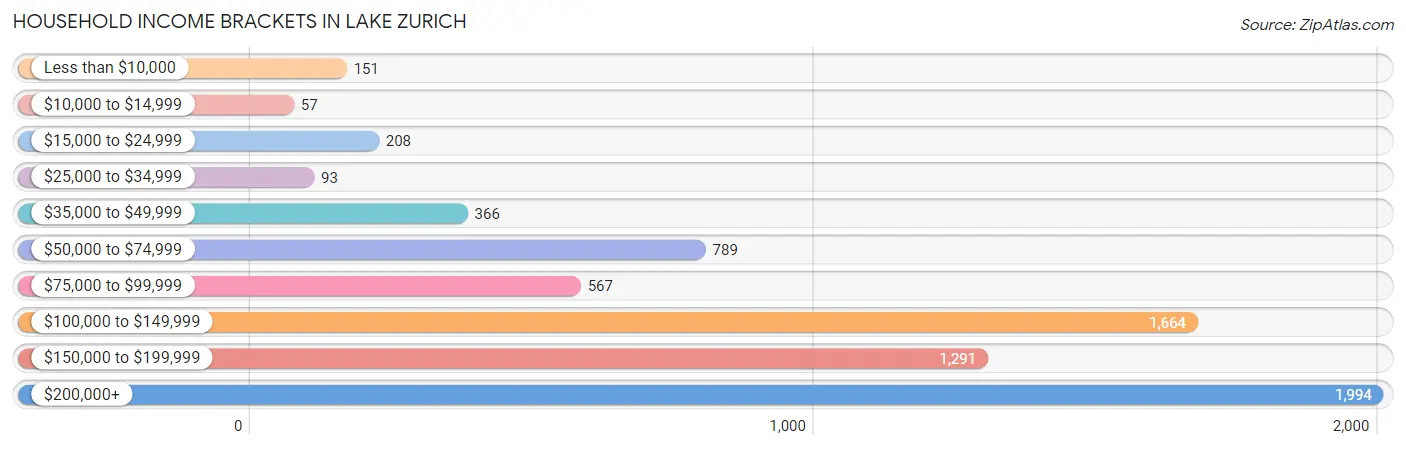
| Income Bracket | # Households | % Households |
| Less than $10,000 | 151 | 2.1% |
| $10,000 to $14,999 | 57 | 0.8% |
| $15,000 to $24,999 | 208 | 2.9% |
| $25,000 to $34,999 | 93 | 1.3% |
| $35,000 to $49,999 | 366 | 5.1% |
| $50,000 to $74,999 | 789 | 11.0% |
| $75,000 to $99,999 | 567 | 7.9% |
| $100,000 to $149,999 | 1,664 | 23.2% |
| $150,000 to $199,999 | 1,291 | 18.0% |
| $200,000+ | 1,994 | 27.8% |
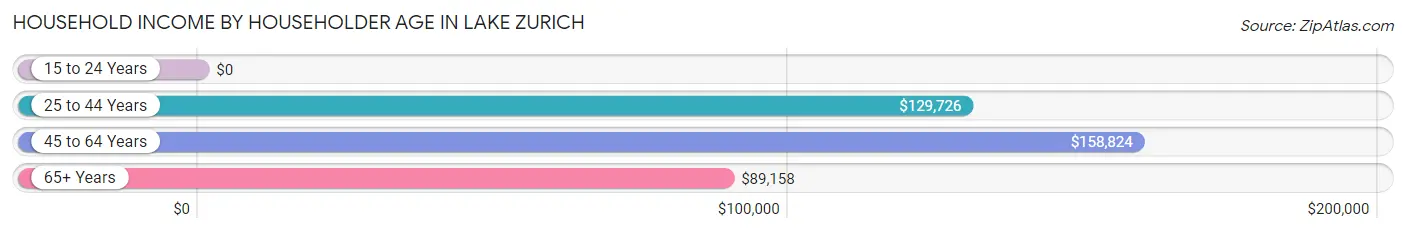
Household Income by Householder Age in Lake Zurich
The median household income in Lake Zurich is $135,211, with the highest median household income of $158,824 found in the 45 to 64 years age bracket for the primary householder. A total of 3,404 households (47.5%) fall into this category.
| Income Bracket | # Households | Median Income |
| 15 to 24 Years | 0 (0.0%) | $0 |
| 25 to 44 Years | 2,296 (32.0%) | $129,726 |
| 45 to 64 Years | 3,404 (47.5%) | $158,824 |
| 65+ Years | 1,473 (20.5%) | $89,158 |
| Total | 7,173 (100.0%) | $135,211 |
Poverty in Lake Zurich
Income Below Poverty by Sex and Age in Lake Zurich
With 2.9% poverty level for males and 3.2% for females among the residents of Lake Zurich, 12 to 14 year old males and 75 year old and over females are the most vulnerable to poverty, with 35 males (9.6%) and 44 females (8.8%) in their respective age groups living below the poverty level.

| Age Bracket | Male | Female |
| Under 5 Years | 0 (0.0%) | 0 (0.0%) |
| 5 Years | 8 (4.8%) | 0 (0.0%) |
| 6 to 11 Years | 39 (3.6%) | 42 (6.5%) |
| 12 to 14 Years | 35 (9.6%) | 18 (5.0%) |
| 15 Years | 0 (0.0%) | 0 (0.0%) |
| 16 and 17 Years | 0 (0.0%) | 0 (0.0%) |
| 18 to 24 Years | 41 (4.5%) | 0 (0.0%) |
| 25 to 34 Years | 34 (3.6%) | 40 (3.6%) |
| 35 to 44 Years | 29 (2.4%) | 75 (5.5%) |
| 45 to 54 Years | 66 (4.4%) | 45 (3.2%) |
| 55 to 64 Years | 25 (1.6%) | 37 (2.1%) |
| 65 to 74 Years | 0 (0.0%) | 12 (1.5%) |
| 75 Years and over | 10 (3.2%) | 44 (8.8%) |
| Total | 287 (2.9%) | 313 (3.2%) |
Income Above Poverty by Sex and Age in Lake Zurich
According to the poverty statistics in Lake Zurich, males aged under 5 years and females aged under 5 years are the age groups that are most secure financially, with 100.0% of males and 100.0% of females in these age groups living above the poverty line.
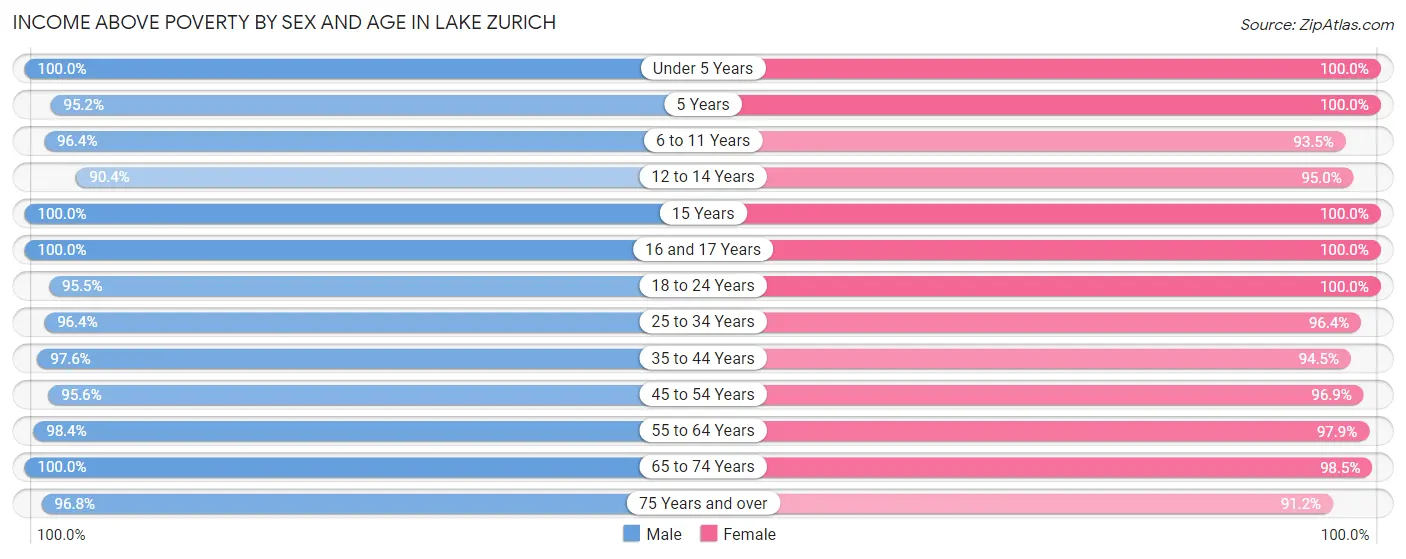
| Age Bracket | Male | Female |
| Under 5 Years | 596 (100.0%) | 511 (100.0%) |
| 5 Years | 158 (95.2%) | 62 (100.0%) |
| 6 to 11 Years | 1,037 (96.4%) | 606 (93.5%) |
| 12 to 14 Years | 329 (90.4%) | 340 (95.0%) |
| 15 Years | 152 (100.0%) | 118 (100.0%) |
| 16 and 17 Years | 165 (100.0%) | 330 (100.0%) |
| 18 to 24 Years | 860 (95.5%) | 862 (100.0%) |
| 25 to 34 Years | 898 (96.4%) | 1,068 (96.4%) |
| 35 to 44 Years | 1,191 (97.6%) | 1,283 (94.5%) |
| 45 to 54 Years | 1,427 (95.6%) | 1,383 (96.9%) |
| 55 to 64 Years | 1,515 (98.4%) | 1,681 (97.9%) |
| 65 to 74 Years | 843 (100.0%) | 760 (98.5%) |
| 75 Years and over | 305 (96.8%) | 454 (91.2%) |
| Total | 9,476 (97.1%) | 9,458 (96.8%) |
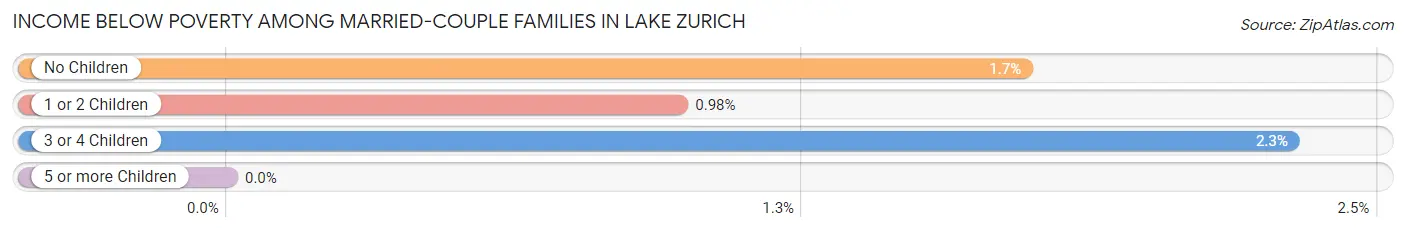
Income Below Poverty Among Married-Couple Families in Lake Zurich
The poverty statistics for married-couple families in Lake Zurich show that 1.5% or 73 of the total 4,906 families live below the poverty line. Families with 3 or 4 children have the highest poverty rate of 2.3%, comprising of 8 families. On the other hand, families with 1 or 2 children have the lowest poverty rate of 1.0%, which includes 18 families.
| Children | Above Poverty | Below Poverty |
| No Children | 2,666 (98.3%) | 47 (1.7%) |
| 1 or 2 Children | 1,828 (99.0%) | 18 (1.0%) |
| 3 or 4 Children | 339 (97.7%) | 8 (2.3%) |
| 5 or more Children | 0 (0.0%) | 0 (0.0%) |
| Total | 4,833 (98.5%) | 73 (1.5%) |
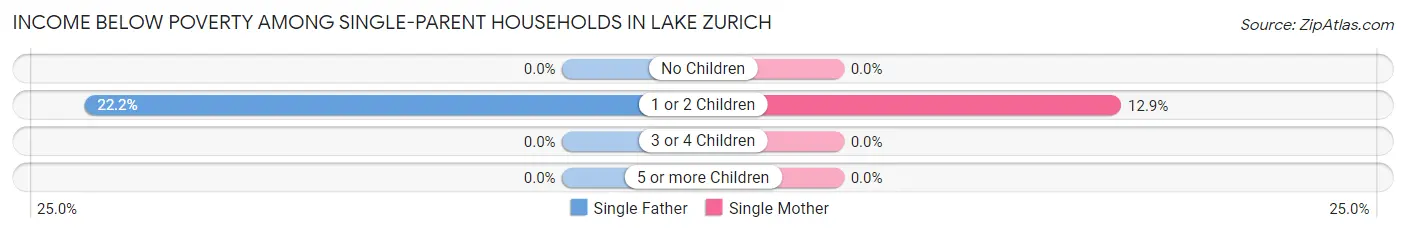
Income Below Poverty Among Single-Parent Households in Lake Zurich
According to the poverty data in Lake Zurich, 9.0% or 12 single-father households and 6.5% or 42 single-mother households are living below the poverty line. Among single-father households, those with 1 or 2 children have the highest poverty rate, with 12 households (22.2%) experiencing poverty. Likewise, among single-mother households, those with 1 or 2 children have the highest poverty rate, with 42 households (12.9%) falling below the poverty line.
| Children | Single Father | Single Mother |
| No Children | 0 (0.0%) | 0 (0.0%) |
| 1 or 2 Children | 12 (22.2%) | 42 (12.9%) |
| 3 or 4 Children | 0 (0.0%) | 0 (0.0%) |
| 5 or more Children | 0 (0.0%) | 0 (0.0%) |
| Total | 12 (9.0%) | 42 (6.5%) |
Income Below Poverty Among Married-Couple vs Single-Parent Households in Lake Zurich
The poverty data for Lake Zurich shows that 73 of the married-couple family households (1.5%) and 54 of the single-parent households (7.0%) are living below the poverty level. Within the married-couple family households, those with 3 or 4 children have the highest poverty rate, with 8 households (2.3%) falling below the poverty line. Among the single-parent households, those with 1 or 2 children have the highest poverty rate, with 54 household (14.2%) living below poverty.
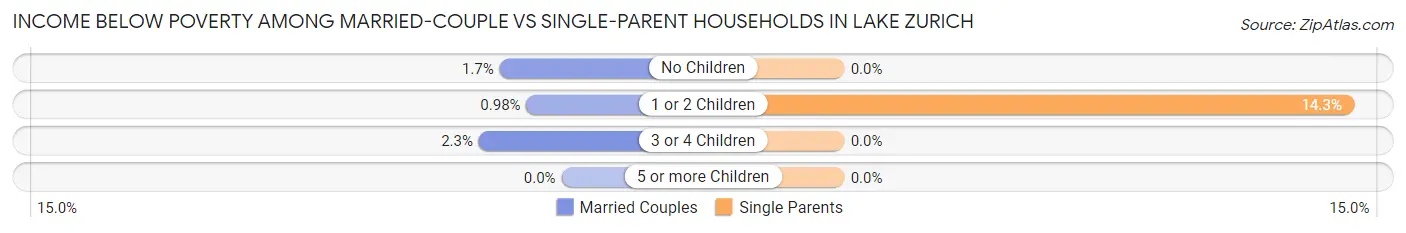
| Children | Married-Couple Families | Single-Parent Households |
| No Children | 47 (1.7%) | 0 (0.0%) |
| 1 or 2 Children | 18 (1.0%) | 54 (14.2%) |
| 3 or 4 Children | 8 (2.3%) | 0 (0.0%) |
| 5 or more Children | 0 (0.0%) | 0 (0.0%) |
| Total | 73 (1.5%) | 54 (7.0%) |
Race in Lake Zurich
The most populous races in Lake Zurich are White / Caucasian (16,742 | 84.8%), Asian (1,865 | 9.4%), and Two or more Races (837 | 4.2%).
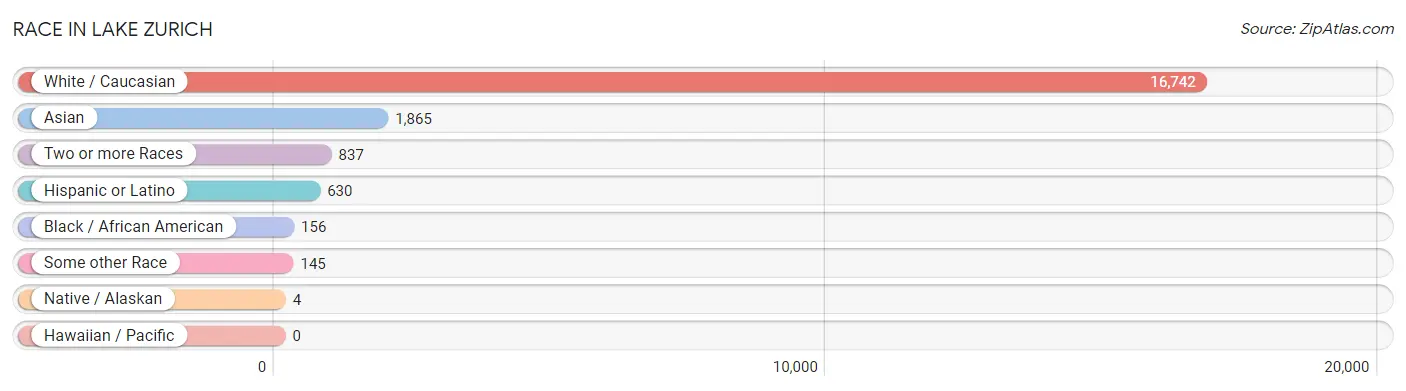
| Race | # Population | % Population |
| Asian | 1,865 | 9.4% |
| Black / African American | 156 | 0.8% |
| Hawaiian / Pacific | 0 | 0.0% |
| Hispanic or Latino | 630 | 3.2% |
| Native / Alaskan | 4 | 0.0% |
| White / Caucasian | 16,742 | 84.8% |
| Two or more Races | 837 | 4.2% |
| Some other Race | 145 | 0.7% |
| Total | 19,749 | 100.0% |
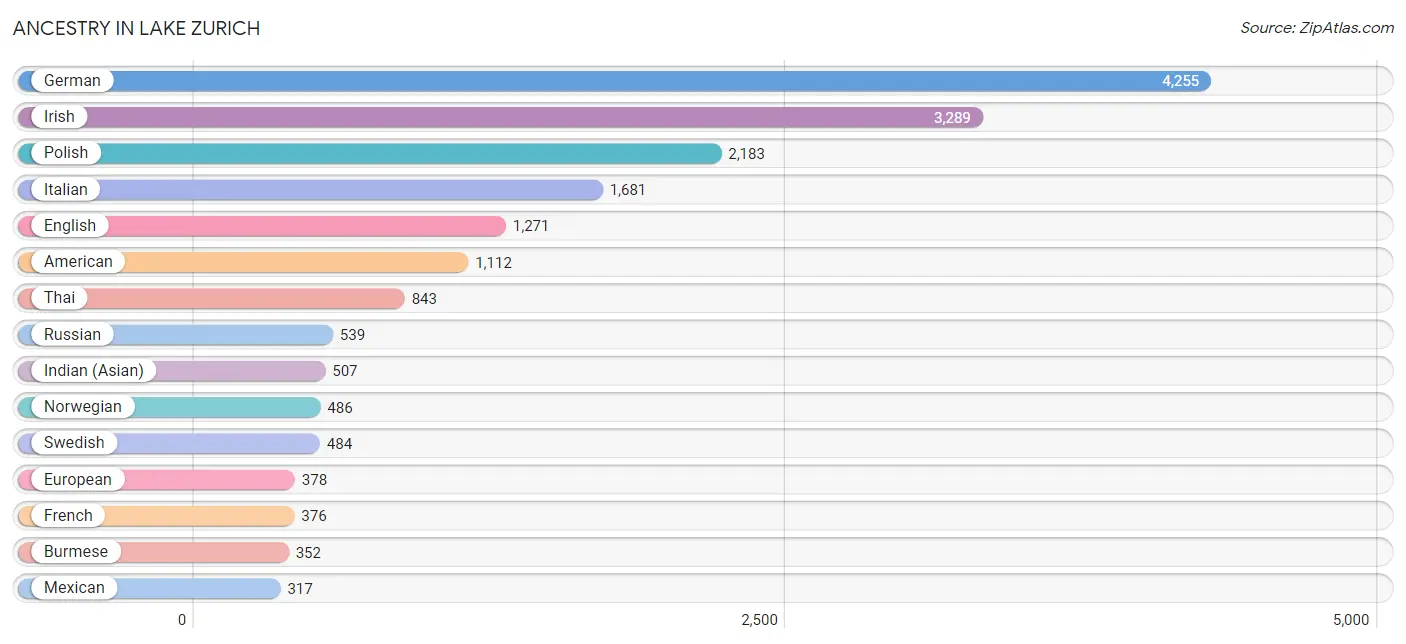
Ancestry in Lake Zurich
The most populous ancestries reported in Lake Zurich are German (4,255 | 21.5%), Irish (3,289 | 16.7%), Polish (2,183 | 11.1%), Italian (1,681 | 8.5%), and English (1,271 | 6.4%), together accounting for 64.2% of all Lake Zurich residents.
| Ancestry | # Population | % Population |
| American | 1,112 | 5.6% |
| Arab | 128 | 0.6% |
| Armenian | 9 | 0.1% |
| Assyrian / Chaldean / Syriac | 51 | 0.3% |
| Austrian | 27 | 0.1% |
| Belgian | 40 | 0.2% |
| Bhutanese | 173 | 0.9% |
| Blackfeet | 16 | 0.1% |
| Brazilian | 29 | 0.2% |
| British | 48 | 0.2% |
| Bulgarian | 215 | 1.1% |
| Burmese | 352 | 1.8% |
| Canadian | 123 | 0.6% |
| Central American | 96 | 0.5% |
| Central American Indian | 23 | 0.1% |
| Cherokee | 15 | 0.1% |
| Chilean | 6 | 0.0% |
| Colombian | 20 | 0.1% |
| Croatian | 43 | 0.2% |
| Cuban | 21 | 0.1% |
| Czech | 245 | 1.2% |
| Czechoslovakian | 51 | 0.3% |
| Danish | 86 | 0.4% |
| Dutch | 141 | 0.7% |
| Eastern European | 116 | 0.6% |
| English | 1,271 | 6.4% |
| European | 378 | 1.9% |
| Filipino | 41 | 0.2% |
| Finnish | 21 | 0.1% |
| French | 376 | 1.9% |
| French Canadian | 54 | 0.3% |
| German | 4,255 | 21.5% |
| German Russian | 28 | 0.1% |
| Greek | 308 | 1.6% |
| Guatemalan | 81 | 0.4% |
| Honduran | 9 | 0.1% |
| Hungarian | 175 | 0.9% |
| Indian (Asian) | 507 | 2.6% |
| Irish | 3,289 | 16.7% |
| Israeli | 39 | 0.2% |
| Italian | 1,681 | 8.5% |
| Korean | 148 | 0.7% |
| Latvian | 10 | 0.1% |
| Lebanese | 5 | 0.0% |
| Lithuanian | 230 | 1.2% |
| Luxembourger | 16 | 0.1% |
| Mexican | 317 | 1.6% |
| Northern European | 9 | 0.1% |
| Norwegian | 486 | 2.5% |
| Pakistani | 42 | 0.2% |
| Polish | 2,183 | 11.1% |
| Portuguese | 47 | 0.2% |
| Puerto Rican | 127 | 0.6% |
| Romanian | 98 | 0.5% |
| Russian | 539 | 2.7% |
| Salvadoran | 6 | 0.0% |
| Scandinavian | 77 | 0.4% |
| Scotch-Irish | 49 | 0.3% |
| Scottish | 247 | 1.3% |
| Serbian | 12 | 0.1% |
| Slavic | 5 | 0.0% |
| Slovak | 28 | 0.1% |
| South American | 43 | 0.2% |
| Sri Lankan | 37 | 0.2% |
| Swedish | 484 | 2.5% |
| Swiss | 57 | 0.3% |
| Syrian | 63 | 0.3% |
| Thai | 843 | 4.3% |
| Turkish | 27 | 0.1% |
| Ukrainian | 115 | 0.6% |
| Venezuelan | 17 | 0.1% |
| Vietnamese | 8 | 0.0% |
| Welsh | 88 | 0.4% |
| Yugoslavian | 38 | 0.2% | View All 74 Rows |
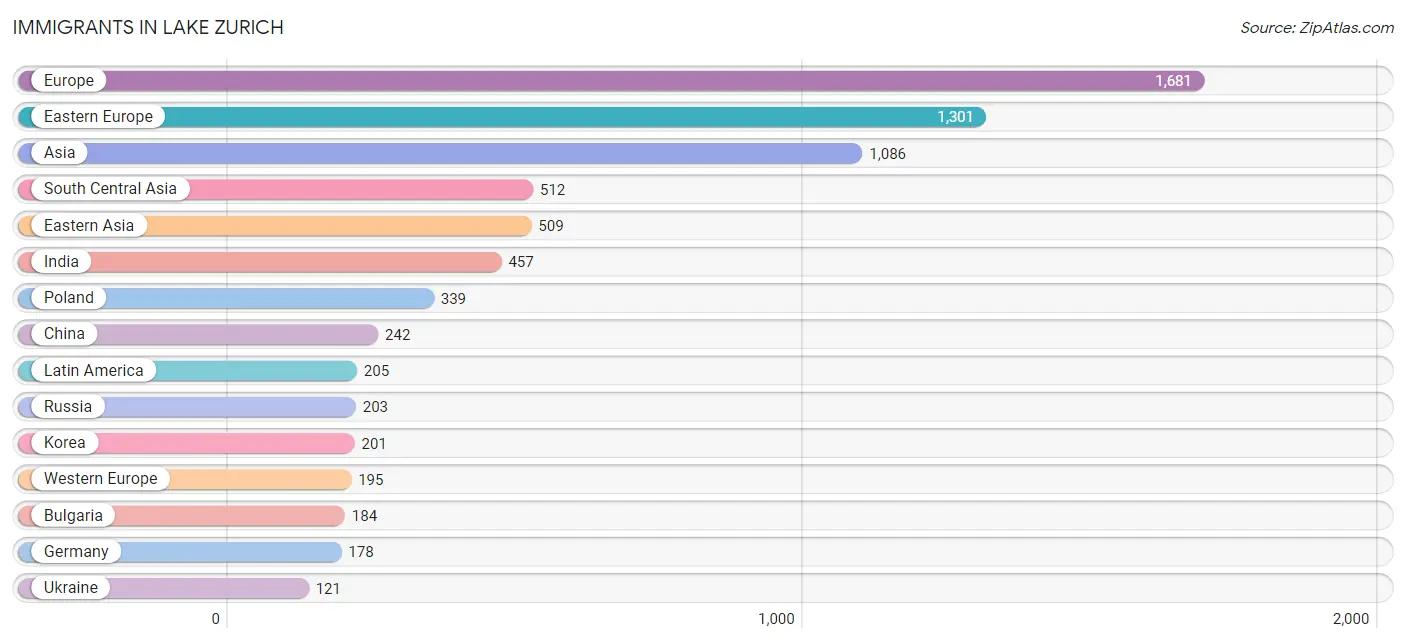
Immigrants in Lake Zurich
The most numerous immigrant groups reported in Lake Zurich came from Europe (1,681 | 8.5%), Eastern Europe (1,301 | 6.6%), Asia (1,086 | 5.5%), South Central Asia (512 | 2.6%), and Eastern Asia (509 | 2.6%), together accounting for 25.8% of all Lake Zurich residents.
| Immigration Origin | # Population | % Population |
| Africa | 35 | 0.2% |
| Asia | 1,086 | 5.5% |
| Bangladesh | 8 | 0.0% |
| Belarus | 44 | 0.2% |
| Bosnia and Herzegovina | 8 | 0.0% |
| Brazil | 73 | 0.4% |
| Bulgaria | 184 | 0.9% |
| Canada | 26 | 0.1% |
| Central America | 90 | 0.5% |
| China | 242 | 1.2% |
| Colombia | 20 | 0.1% |
| Czechoslovakia | 120 | 0.6% |
| Eastern Asia | 509 | 2.6% |
| Eastern Europe | 1,301 | 6.6% |
| El Salvador | 6 | 0.0% |
| England | 23 | 0.1% |
| Europe | 1,681 | 8.5% |
| France | 11 | 0.1% |
| Germany | 178 | 0.9% |
| Greece | 38 | 0.2% |
| Guatemala | 29 | 0.2% |
| Honduras | 9 | 0.1% |
| Hong Kong | 8 | 0.0% |
| Hungary | 13 | 0.1% |
| India | 457 | 2.3% |
| Iraq | 10 | 0.1% |
| Ireland | 40 | 0.2% |
| Italy | 47 | 0.2% |
| Japan | 66 | 0.3% |
| Korea | 201 | 1.0% |
| Latin America | 205 | 1.0% |
| Latvia | 59 | 0.3% |
| Lithuania | 82 | 0.4% |
| Mexico | 46 | 0.2% |
| Moldova | 94 | 0.5% |
| Netherlands | 6 | 0.0% |
| Northern Africa | 35 | 0.2% |
| Northern Europe | 68 | 0.3% |
| Pakistan | 39 | 0.2% |
| Philippines | 22 | 0.1% |
| Poland | 339 | 1.7% |
| Romania | 18 | 0.1% |
| Russia | 203 | 1.0% |
| South America | 115 | 0.6% |
| South Central Asia | 512 | 2.6% |
| South Eastern Asia | 55 | 0.3% |
| Southern Europe | 94 | 0.5% |
| Spain | 9 | 0.1% |
| Taiwan | 11 | 0.1% |
| Thailand | 14 | 0.1% |
| Ukraine | 121 | 0.6% |
| Uzbekistan | 8 | 0.0% |
| Venezuela | 22 | 0.1% |
| Vietnam | 19 | 0.1% |
| Western Asia | 10 | 0.1% |
| Western Europe | 195 | 1.0% | View All 56 Rows |
Sex and Age in Lake Zurich
Sex and Age in Lake Zurich
The most populous age groups in Lake Zurich are 55 to 59 Years (866 | 8.8%) for men and 55 to 59 Years (872 | 8.8%) for women.
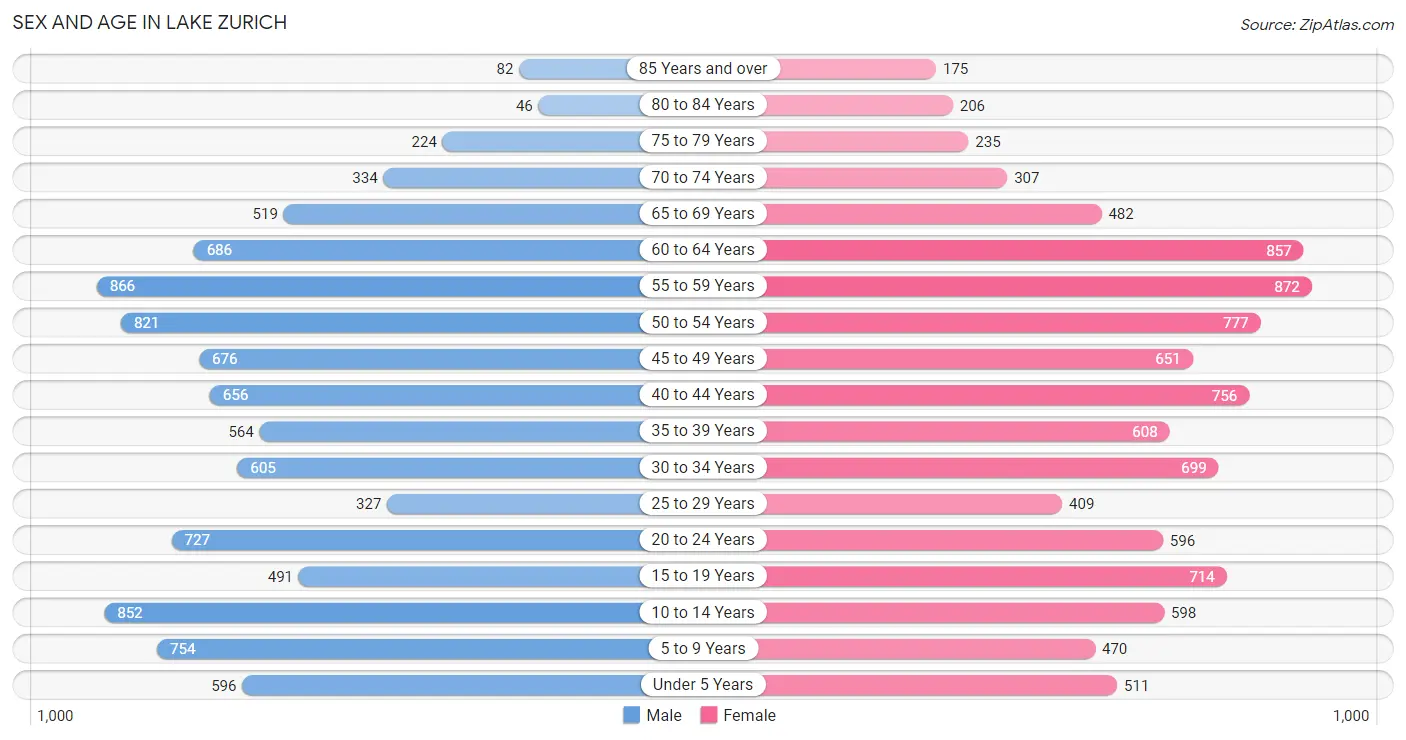
| Age Bracket | Male | Female |
| Under 5 Years | 596 (6.1%) | 511 (5.1%) |
| 5 to 9 Years | 754 (7.7%) | 470 (4.7%) |
| 10 to 14 Years | 852 (8.7%) | 598 (6.0%) |
| 15 to 19 Years | 491 (5.0%) | 714 (7.2%) |
| 20 to 24 Years | 727 (7.4%) | 596 (6.0%) |
| 25 to 29 Years | 327 (3.3%) | 409 (4.1%) |
| 30 to 34 Years | 605 (6.2%) | 699 (7.0%) |
| 35 to 39 Years | 564 (5.7%) | 608 (6.1%) |
| 40 to 44 Years | 656 (6.7%) | 756 (7.6%) |
| 45 to 49 Years | 676 (6.9%) | 651 (6.6%) |
| 50 to 54 Years | 821 (8.4%) | 777 (7.8%) |
| 55 to 59 Years | 866 (8.8%) | 872 (8.8%) |
| 60 to 64 Years | 686 (7.0%) | 857 (8.6%) |
| 65 to 69 Years | 519 (5.3%) | 482 (4.9%) |
| 70 to 74 Years | 334 (3.4%) | 307 (3.1%) |
| 75 to 79 Years | 224 (2.3%) | 235 (2.4%) |
| 80 to 84 Years | 46 (0.5%) | 206 (2.1%) |
| 85 Years and over | 82 (0.8%) | 175 (1.8%) |
| Total | 9,826 (100.0%) | 9,923 (100.0%) |
Families and Households in Lake Zurich
Median Family Size in Lake Zurich
The median family size in Lake Zurich is 3.09 persons per family, with married-couple families (4,906 | 86.3%) accounting for the largest median family size of 3.19 persons per family. On the other hand, single male/father families (134 | 2.4%) represent the smallest median family size with 2.35 persons per family.
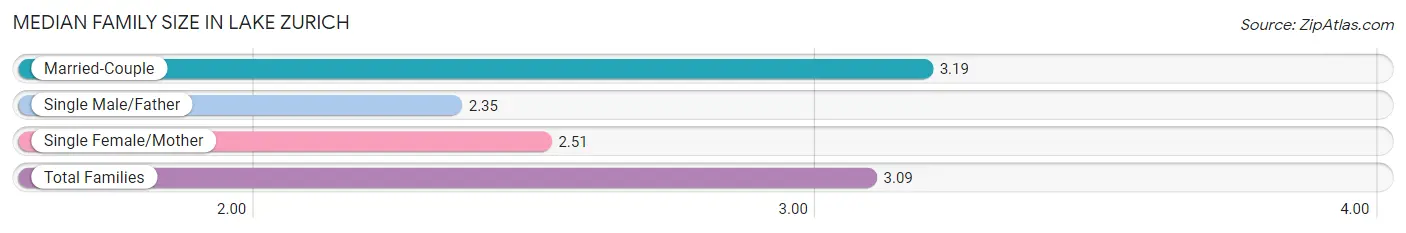
| Family Type | # Families | Family Size |
| Married-Couple | 4,906 (86.3%) | 3.19 |
| Single Male/Father | 134 (2.4%) | 2.35 |
| Single Female/Mother | 643 (11.3%) | 2.51 |
| Total Families | 5,683 (100.0%) | 3.09 |
Median Household Size in Lake Zurich
The median household size in Lake Zurich is 2.72 persons per household, with married-couple households (4,906 | 68.4%) accounting for the largest median household size of 3.19 persons per household. non-family households (1,490 | 20.8%) represent the smallest median household size with 1.25 persons per household.
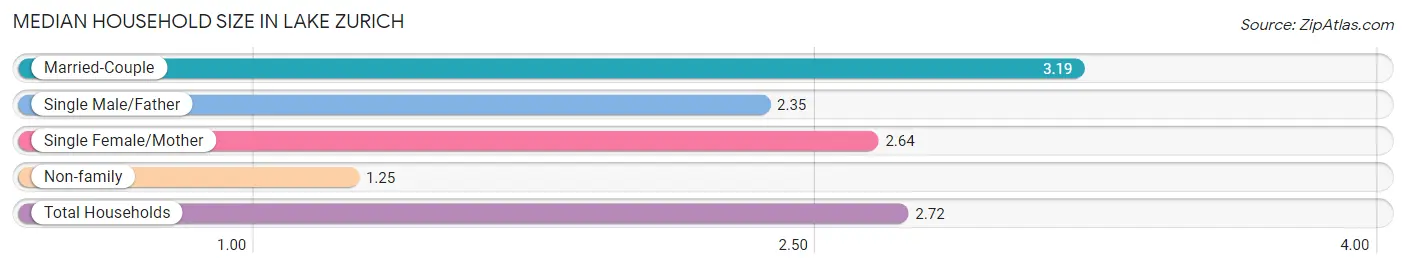
| Household Type | # Households | Household Size |
| Married-Couple | 4,906 (68.4%) | 3.19 |
| Single Male/Father | 134 (1.9%) | 2.35 |
| Single Female/Mother | 643 (9.0%) | 2.64 |
| Non-family | 1,490 (20.8%) | 1.25 |
| Total Households | 7,173 (100.0%) | 2.72 |
Household Size by Marriage Status in Lake Zurich
Out of a total of 7,173 households in Lake Zurich, 5,683 (79.2%) are family households, while 1,490 (20.8%) are nonfamily households. The most numerous type of family households are 2-person households, comprising 2,360, and the most common type of nonfamily households are 1-person households, comprising 1,117.
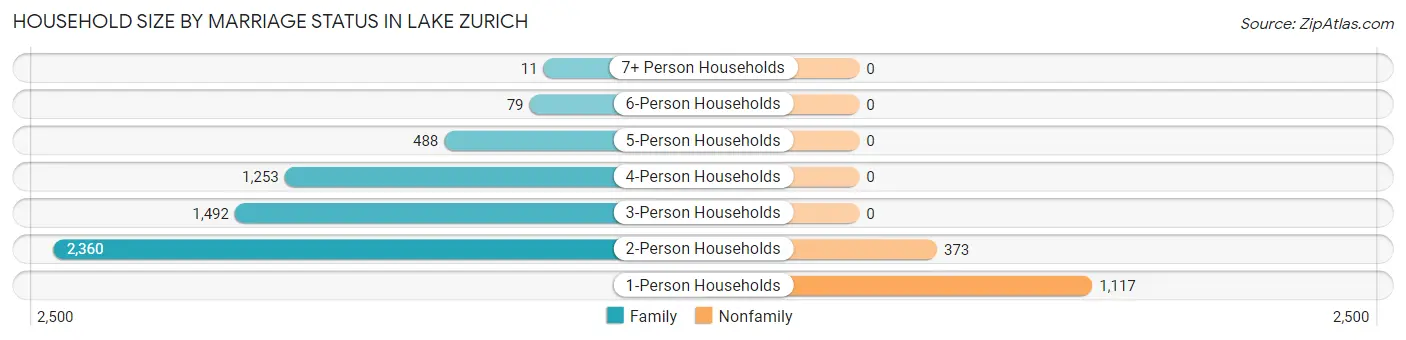
| Household Size | Family Households | Nonfamily Households |
| 1-Person Households | - | 1,117 (15.6%) |
| 2-Person Households | 2,360 (32.9%) | 373 (5.2%) |
| 3-Person Households | 1,492 (20.8%) | 0 (0.0%) |
| 4-Person Households | 1,253 (17.5%) | 0 (0.0%) |
| 5-Person Households | 488 (6.8%) | 0 (0.0%) |
| 6-Person Households | 79 (1.1%) | 0 (0.0%) |
| 7+ Person Households | 11 (0.2%) | 0 (0.0%) |
| Total | 5,683 (79.2%) | 1,490 (20.8%) |
Female Fertility in Lake Zurich
Fertility by Age in Lake Zurich
Average fertility rate in Lake Zurich is 55.0 births per 1,000 women. Women in the age bracket of 20 to 34 years have the highest fertility rate with 80.0 births per 1,000 women. Women in the age bracket of 20 to 34 years acount for 55.1% of all women with births.
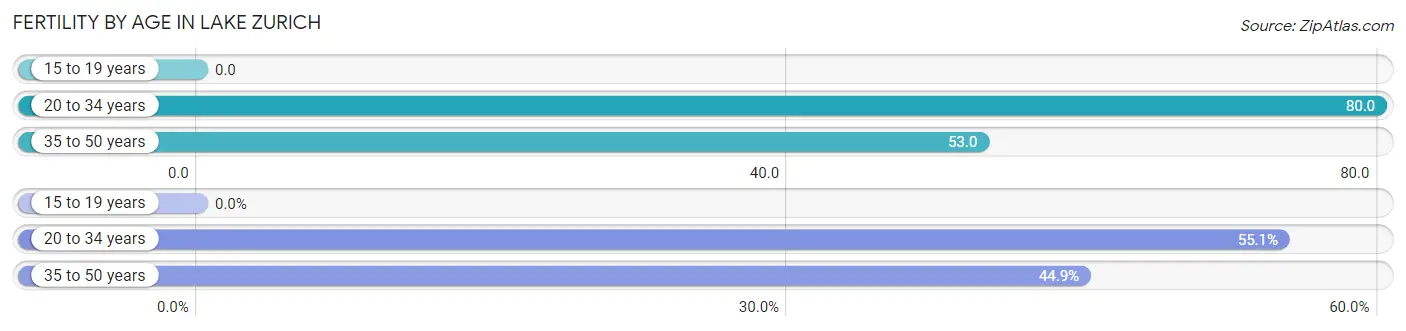
| Age Bracket | Women with Births | Births / 1,000 Women |
| 15 to 19 years | 0 (0.0%) | 0.0 |
| 20 to 34 years | 136 (55.1%) | 80.0 |
| 35 to 50 years | 111 (44.9%) | 53.0 |
| Total | 247 (100.0%) | 55.0 |
Fertility by Age by Marriage Status in Lake Zurich
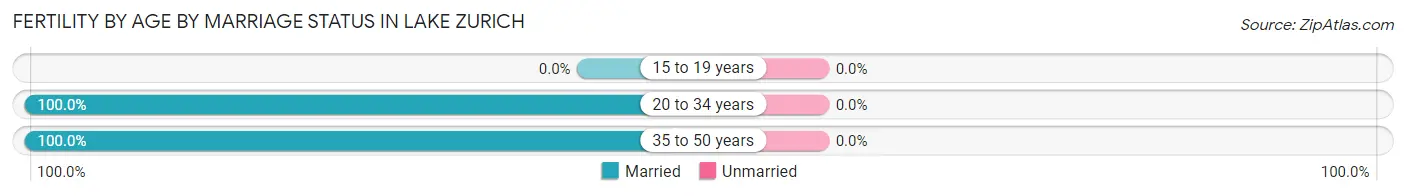
| Age Bracket | Married | Unmarried |
| 15 to 19 years | 0 (0.0%) | 0 (0.0%) |
| 20 to 34 years | 136 (100.0%) | 0 (0.0%) |
| 35 to 50 years | 111 (100.0%) | 0 (0.0%) |
| Total | 247 (100.0%) | 0 (0.0%) |
Fertility by Education in Lake Zurich
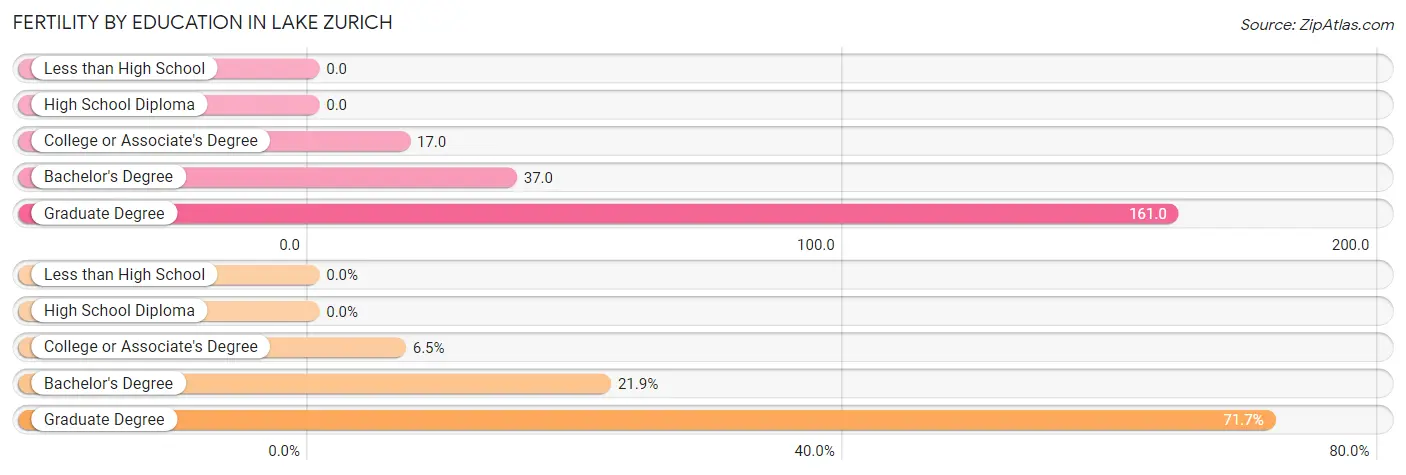
| Educational Attainment | Women with Births | Births / 1,000 Women |
| Less than High School | 0 (0.0%) | 0.0 |
| High School Diploma | 0 (0.0%) | 0.0 |
| College or Associate's Degree | 16 (6.5%) | 17.0 |
| Bachelor's Degree | 54 (21.9%) | 37.0 |
| Graduate Degree | 177 (71.7%) | 161.0 |
| Total | 247 (100.0%) | 55.0 |
Fertility by Education by Marriage Status in Lake Zurich
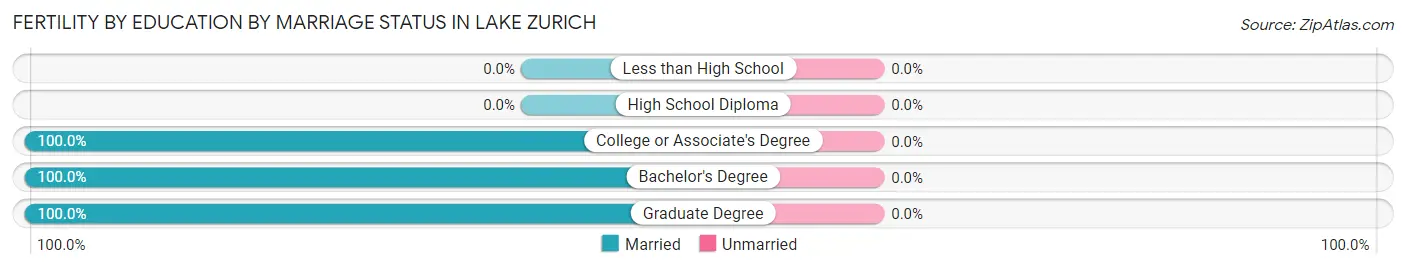
| Educational Attainment | Married | Unmarried |
| Less than High School | 0 (0.0%) | 0 (0.0%) |
| High School Diploma | 0 (0.0%) | 0 (0.0%) |
| College or Associate's Degree | 16 (100.0%) | 0 (0.0%) |
| Bachelor's Degree | 54 (100.0%) | 0 (0.0%) |
| Graduate Degree | 177 (100.0%) | 0 (0.0%) |
| Total | 247 (100.0%) | 0 (0.0%) |
Employment Characteristics in Lake Zurich
Employment by Class of Employer in Lake Zurich
Among the 10,943 employed individuals in Lake Zurich, private company employees (7,895 | 72.2%), local government employees (1,126 | 10.3%), and not-for-profit organizations (792 | 7.2%) make up the most common classes of employment.
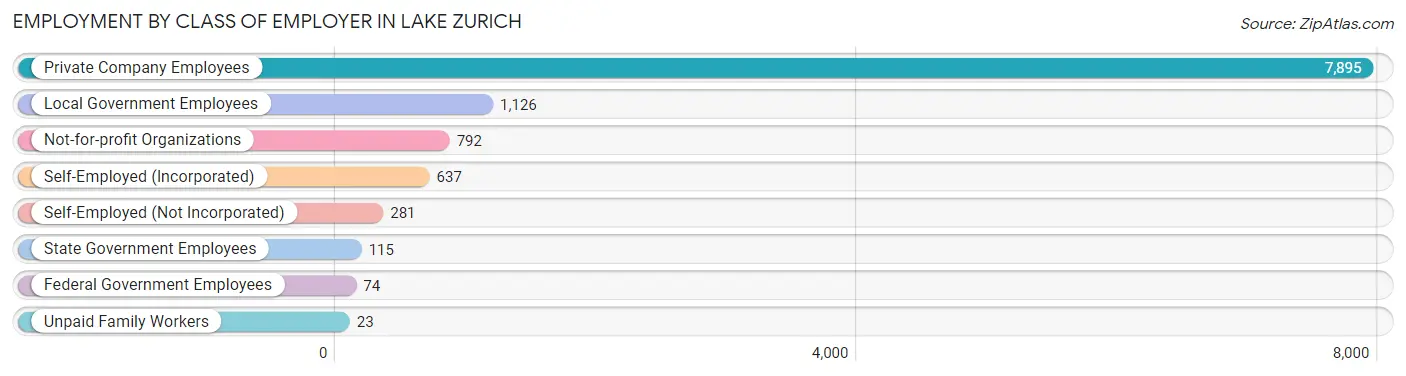
| Employer Class | # Employees | % Employees |
| Private Company Employees | 7,895 | 72.2% |
| Self-Employed (Incorporated) | 637 | 5.8% |
| Self-Employed (Not Incorporated) | 281 | 2.6% |
| Not-for-profit Organizations | 792 | 7.2% |
| Local Government Employees | 1,126 | 10.3% |
| State Government Employees | 115 | 1.1% |
| Federal Government Employees | 74 | 0.7% |
| Unpaid Family Workers | 23 | 0.2% |
| Total | 10,943 | 100.0% |
Employment Status by Age in Lake Zurich
According to the labor force statistics for Lake Zurich, out of the total population over 16 years of age (15,698), 74.3% or 11,664 individuals are in the labor force, with 3.5% or 408 of them unemployed. The age group with the highest labor force participation rate is 30 to 34 years, with 93.7% or 1,222 individuals in the labor force. Within the labor force, the 16 to 19 years age range has the highest percentage of unemployed individuals, with 9.9% or 40 of them being unemployed.
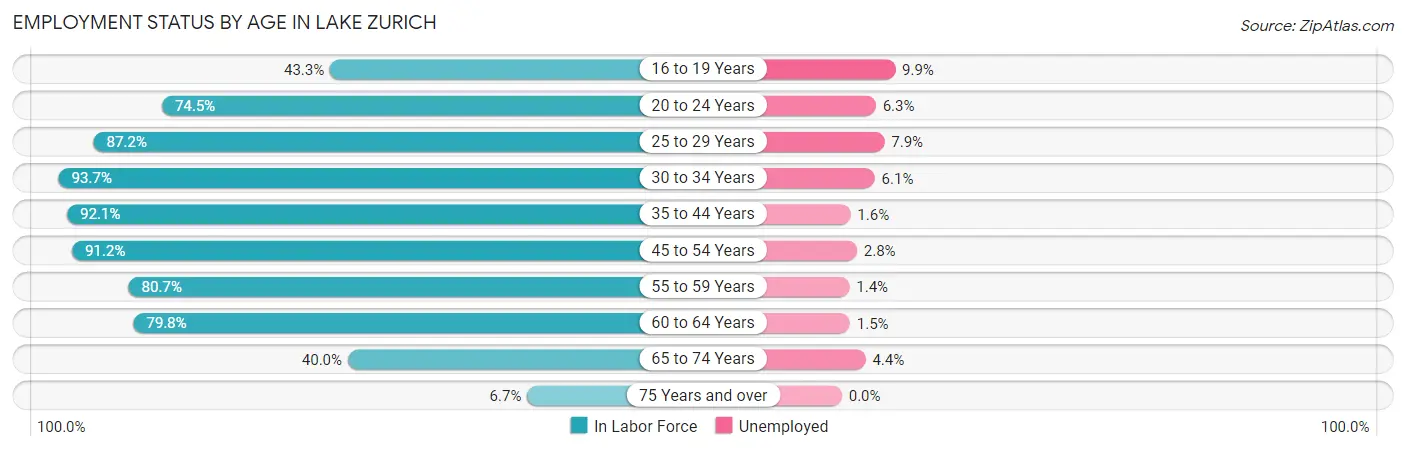
| Age Bracket | In Labor Force | Unemployed |
| 16 to 19 Years | 405 (43.3%) | 40 (9.9%) |
| 20 to 24 Years | 986 (74.5%) | 62 (6.3%) |
| 25 to 29 Years | 642 (87.2%) | 51 (7.9%) |
| 30 to 34 Years | 1,222 (93.7%) | 75 (6.1%) |
| 35 to 44 Years | 2,380 (92.1%) | 38 (1.6%) |
| 45 to 54 Years | 2,668 (91.2%) | 75 (2.8%) |
| 55 to 59 Years | 1,403 (80.7%) | 20 (1.4%) |
| 60 to 64 Years | 1,231 (79.8%) | 18 (1.5%) |
| 65 to 74 Years | 657 (40.0%) | 29 (4.4%) |
| 75 Years and over | 65 (6.7%) | 0 (0.0%) |
| Total | 11,664 (74.3%) | 408 (3.5%) |
Employment Status by Educational Attainment in Lake Zurich
According to labor force statistics for Lake Zurich, 88.1% of individuals (9,541) out of the total population between 25 and 64 years of age (10,830) are in the labor force, with 2.9% or 277 of them being unemployed. The group with the highest labor force participation rate are those with the educational attainment of bachelor's degree or higher, with 91.5% or 6,125 individuals in the labor force. Within the labor force, individuals with college / associate degree education have the highest percentage of unemployment, with 6.4% or 153 of them being unemployed.
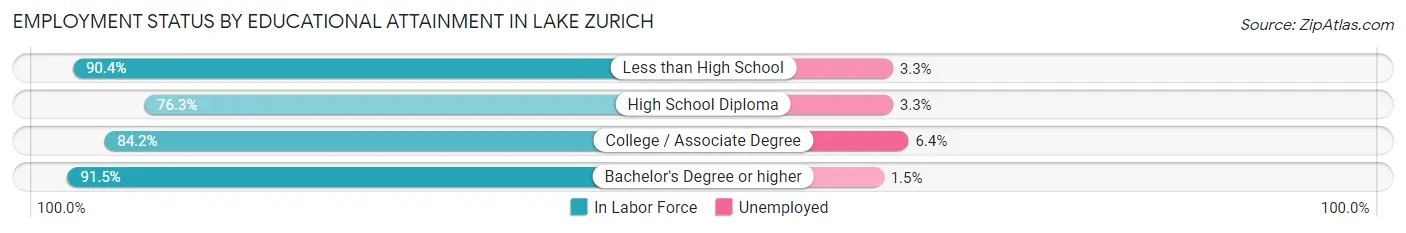
| Educational Attainment | In Labor Force | Unemployed |
| Less than High School | 246 (90.4%) | 9 (3.3%) |
| High School Diploma | 777 (76.3%) | 34 (3.3%) |
| College / Associate Degree | 2,395 (84.2%) | 182 (6.4%) |
| Bachelor's Degree or higher | 6,125 (91.5%) | 100 (1.5%) |
| Total | 9,541 (88.1%) | 314 (2.9%) |
Employment Occupations by Sex in Lake Zurich
Management, Business, Science and Arts Occupations
The most common Management, Business, Science and Arts occupations in Lake Zurich are Management (1,909 | 17.0%), Community & Social Service (1,639 | 14.6%), Computers, Engineering & Science (1,379 | 12.3%), Education Instruction & Library (1,023 | 9.1%), and Business & Financial (1,011 | 9.0%).
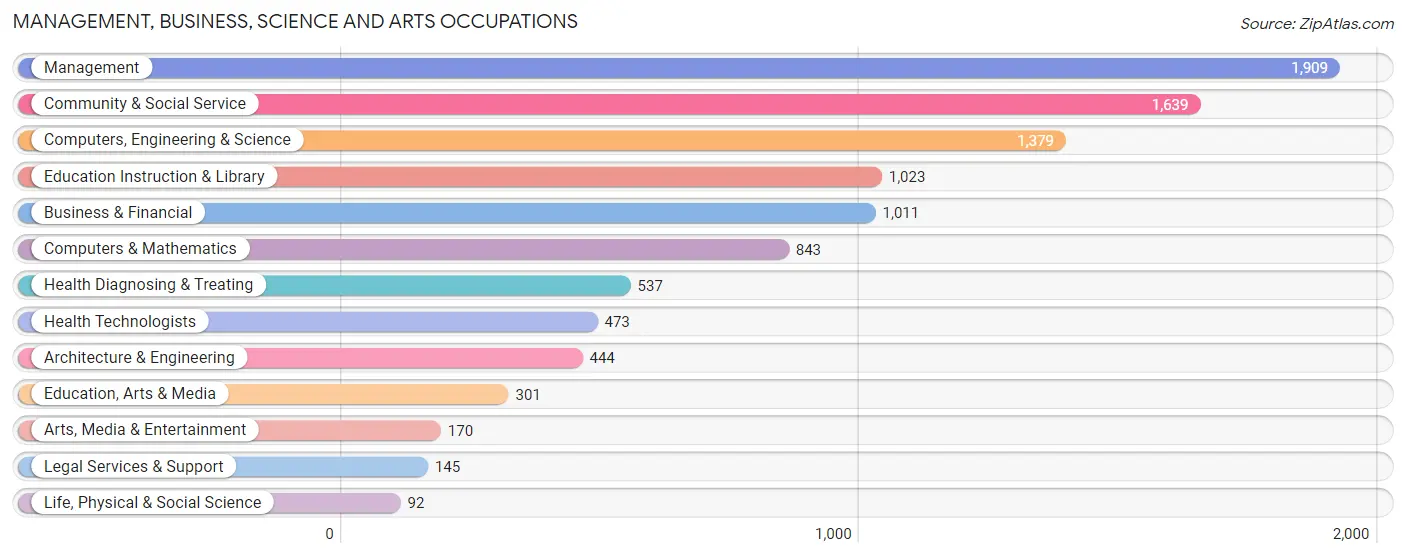
Management, Business, Science and Arts Occupations by Sex
Within the Management, Business, Science and Arts occupations in Lake Zurich, the most male-oriented occupations are Architecture & Engineering (93.0%), Computers, Engineering & Science (75.8%), and Computers & Mathematics (70.7%), while the most female-oriented occupations are Health Diagnosing & Treating (78.6%), Arts, Media & Entertainment (78.2%), and Health Technologists (75.7%).
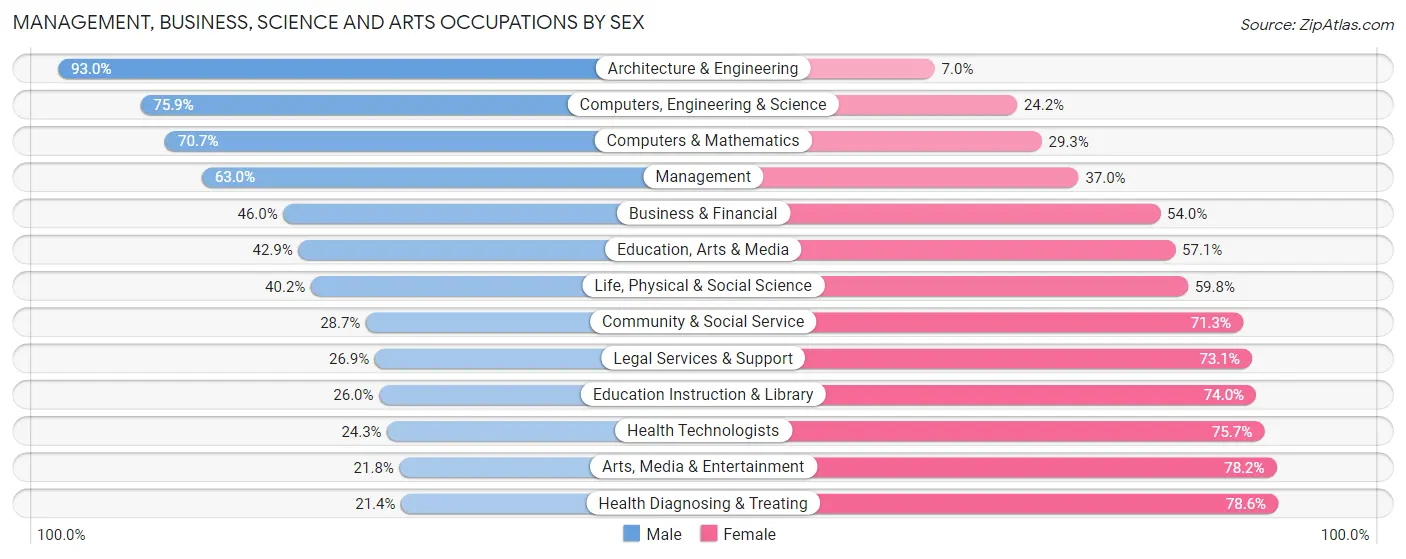
| Occupation | Male | Female |
| Management | 1,203 (63.0%) | 706 (37.0%) |
| Business & Financial | 465 (46.0%) | 546 (54.0%) |
| Computers, Engineering & Science | 1,046 (75.8%) | 333 (24.1%) |
| Computers & Mathematics | 596 (70.7%) | 247 (29.3%) |
| Architecture & Engineering | 413 (93.0%) | 31 (7.0%) |
| Life, Physical & Social Science | 37 (40.2%) | 55 (59.8%) |
| Community & Social Service | 471 (28.7%) | 1,168 (71.3%) |
| Education, Arts & Media | 129 (42.9%) | 172 (57.1%) |
| Legal Services & Support | 39 (26.9%) | 106 (73.1%) |
| Education Instruction & Library | 266 (26.0%) | 757 (74.0%) |
| Arts, Media & Entertainment | 37 (21.8%) | 133 (78.2%) |
| Health Diagnosing & Treating | 115 (21.4%) | 422 (78.6%) |
| Health Technologists | 115 (24.3%) | 358 (75.7%) |
| Total (Category) | 3,300 (51.0%) | 3,175 (49.0%) |
| Total (Overall) | 5,679 (50.5%) | 5,562 (49.5%) |
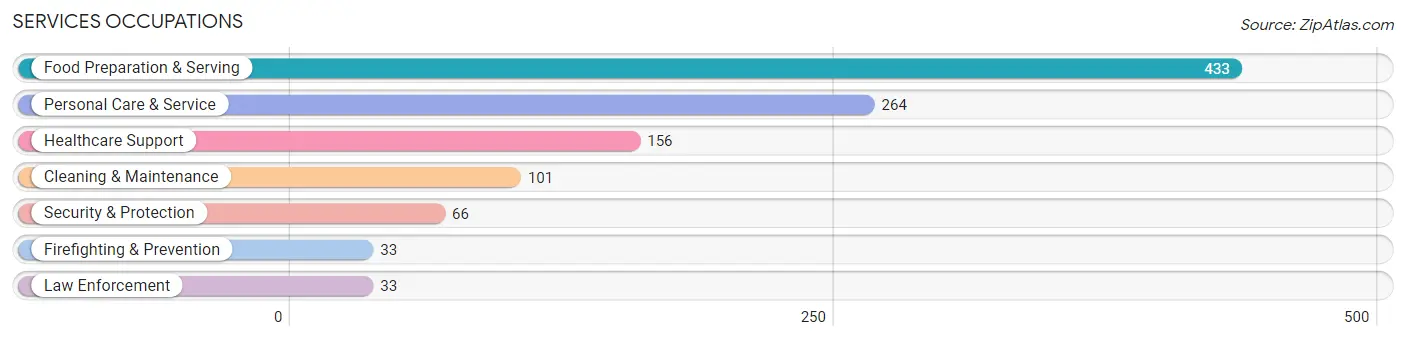
Services Occupations
The most common Services occupations in Lake Zurich are Food Preparation & Serving (433 | 3.8%), Personal Care & Service (264 | 2.4%), Healthcare Support (156 | 1.4%), Cleaning & Maintenance (101 | 0.9%), and Security & Protection (66 | 0.6%).
Services Occupations by Sex
Within the Services occupations in Lake Zurich, the most male-oriented occupations are Security & Protection (100.0%), Firefighting & Prevention (100.0%), and Law Enforcement (100.0%), while the most female-oriented occupations are Healthcare Support (94.9%), Personal Care & Service (91.3%), and Food Preparation & Serving (82.9%).
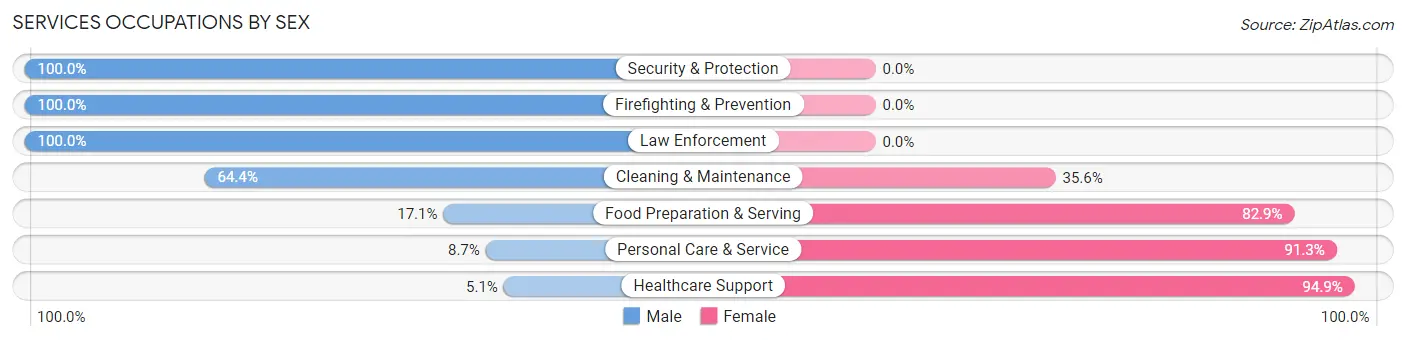
| Occupation | Male | Female |
| Healthcare Support | 8 (5.1%) | 148 (94.9%) |
| Security & Protection | 66 (100.0%) | 0 (0.0%) |
| Firefighting & Prevention | 33 (100.0%) | 0 (0.0%) |
| Law Enforcement | 33 (100.0%) | 0 (0.0%) |
| Food Preparation & Serving | 74 (17.1%) | 359 (82.9%) |
| Cleaning & Maintenance | 65 (64.4%) | 36 (35.6%) |
| Personal Care & Service | 23 (8.7%) | 241 (91.3%) |
| Total (Category) | 236 (23.1%) | 784 (76.9%) |
| Total (Overall) | 5,679 (50.5%) | 5,562 (49.5%) |
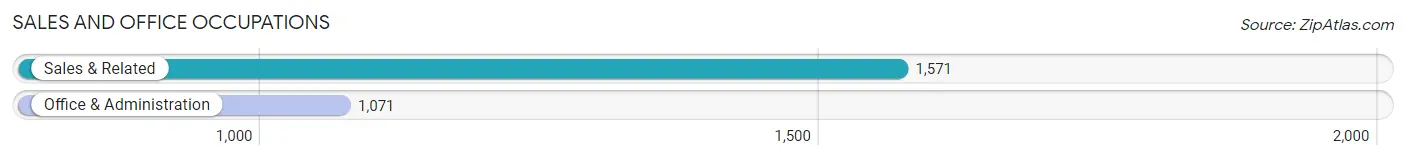
Sales and Office Occupations
The most common Sales and Office occupations in Lake Zurich are Sales & Related (1,571 | 14.0%), and Office & Administration (1,071 | 9.5%).
Sales and Office Occupations by Sex
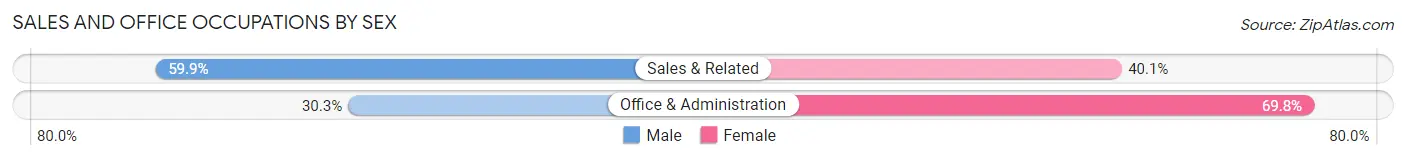
| Occupation | Male | Female |
| Sales & Related | 941 (59.9%) | 630 (40.1%) |
| Office & Administration | 324 (30.2%) | 747 (69.8%) |
| Total (Category) | 1,265 (47.9%) | 1,377 (52.1%) |
| Total (Overall) | 5,679 (50.5%) | 5,562 (49.5%) |
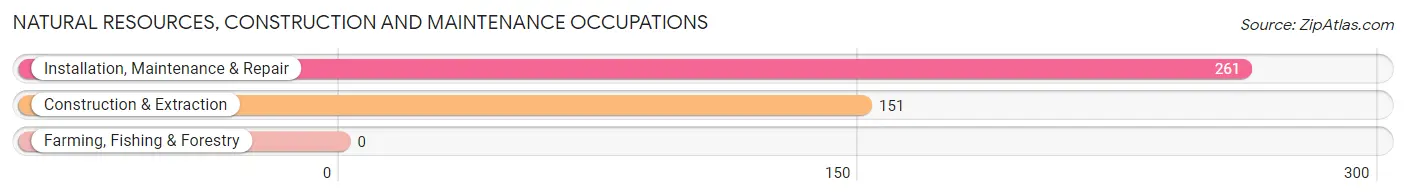
Natural Resources, Construction and Maintenance Occupations
The most common Natural Resources, Construction and Maintenance occupations in Lake Zurich are Installation, Maintenance & Repair (261 | 2.3%), and Construction & Extraction (151 | 1.3%).
Natural Resources, Construction and Maintenance Occupations by Sex
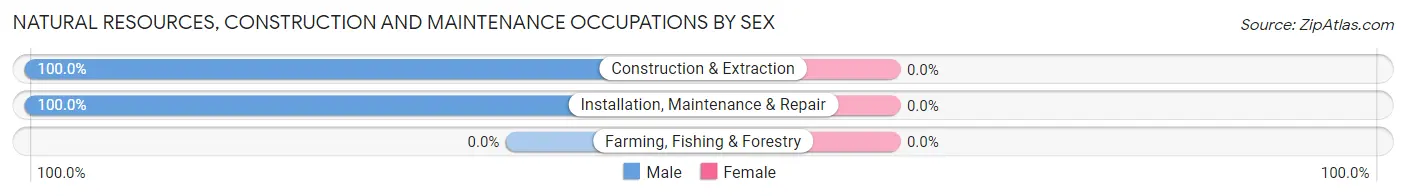
| Occupation | Male | Female |
| Farming, Fishing & Forestry | 0 (0.0%) | 0 (0.0%) |
| Construction & Extraction | 151 (100.0%) | 0 (0.0%) |
| Installation, Maintenance & Repair | 261 (100.0%) | 0 (0.0%) |
| Total (Category) | 412 (100.0%) | 0 (0.0%) |
| Total (Overall) | 5,679 (50.5%) | 5,562 (49.5%) |
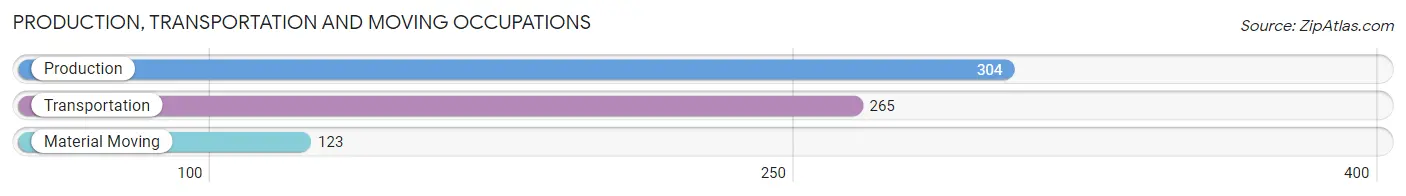
Production, Transportation and Moving Occupations
The most common Production, Transportation and Moving occupations in Lake Zurich are Production (304 | 2.7%), Transportation (265 | 2.4%), and Material Moving (123 | 1.1%).
Production, Transportation and Moving Occupations by Sex
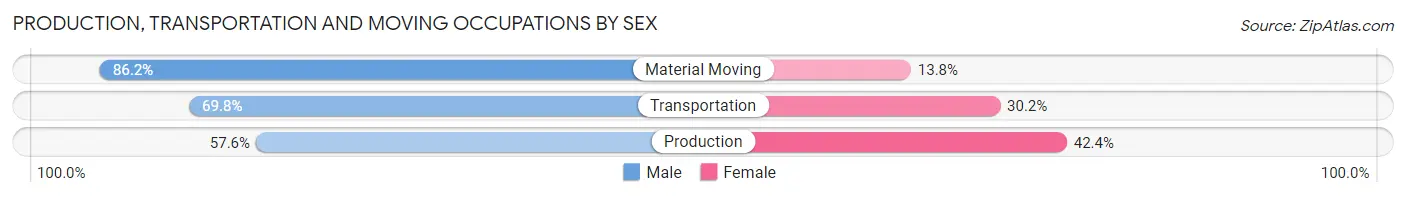
| Occupation | Male | Female |
| Production | 175 (57.6%) | 129 (42.4%) |
| Transportation | 185 (69.8%) | 80 (30.2%) |
| Material Moving | 106 (86.2%) | 17 (13.8%) |
| Total (Category) | 466 (67.3%) | 226 (32.7%) |
| Total (Overall) | 5,679 (50.5%) | 5,562 (49.5%) |
Employment Industries by Sex in Lake Zurich
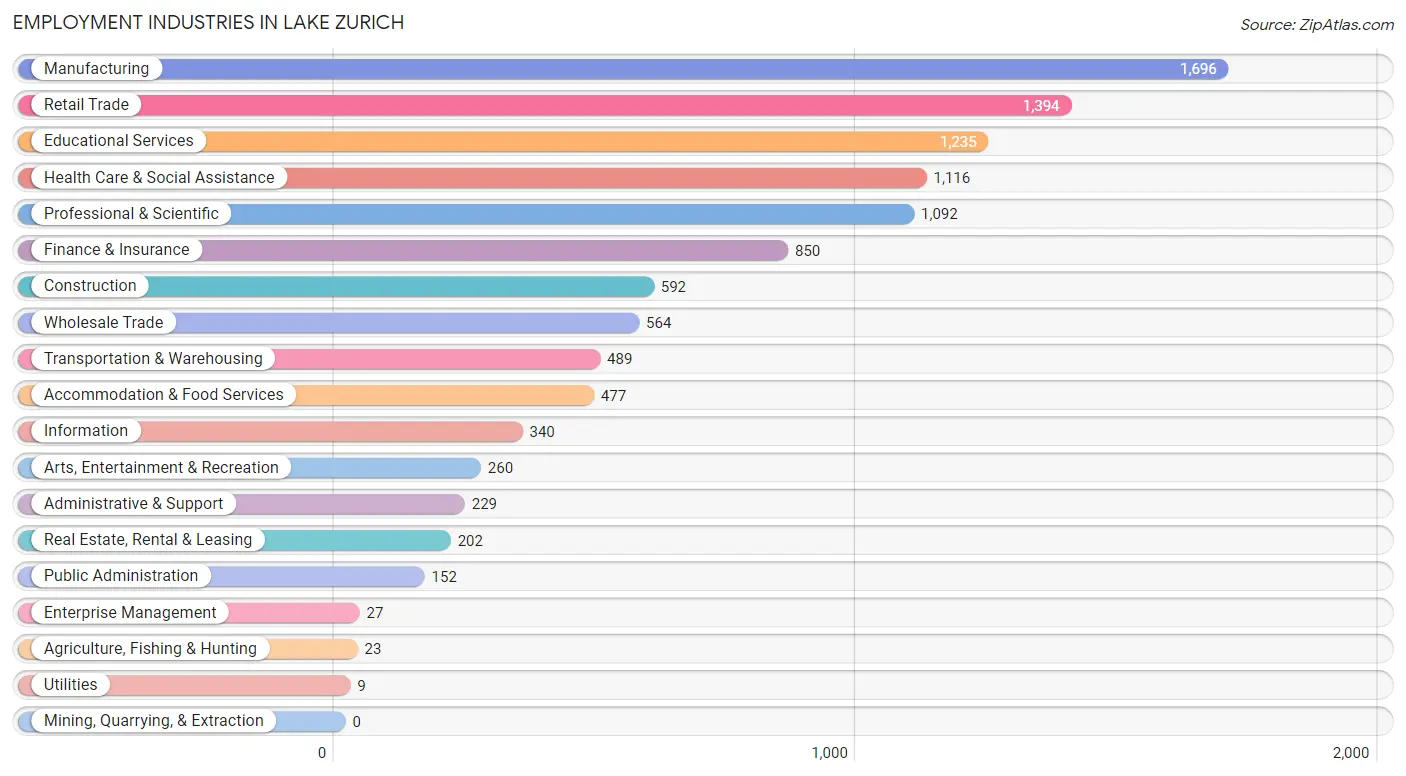
Employment Industries in Lake Zurich
The major employment industries in Lake Zurich include Manufacturing (1,696 | 15.1%), Retail Trade (1,394 | 12.4%), Educational Services (1,235 | 11.0%), Health Care & Social Assistance (1,116 | 9.9%), and Professional & Scientific (1,092 | 9.7%).
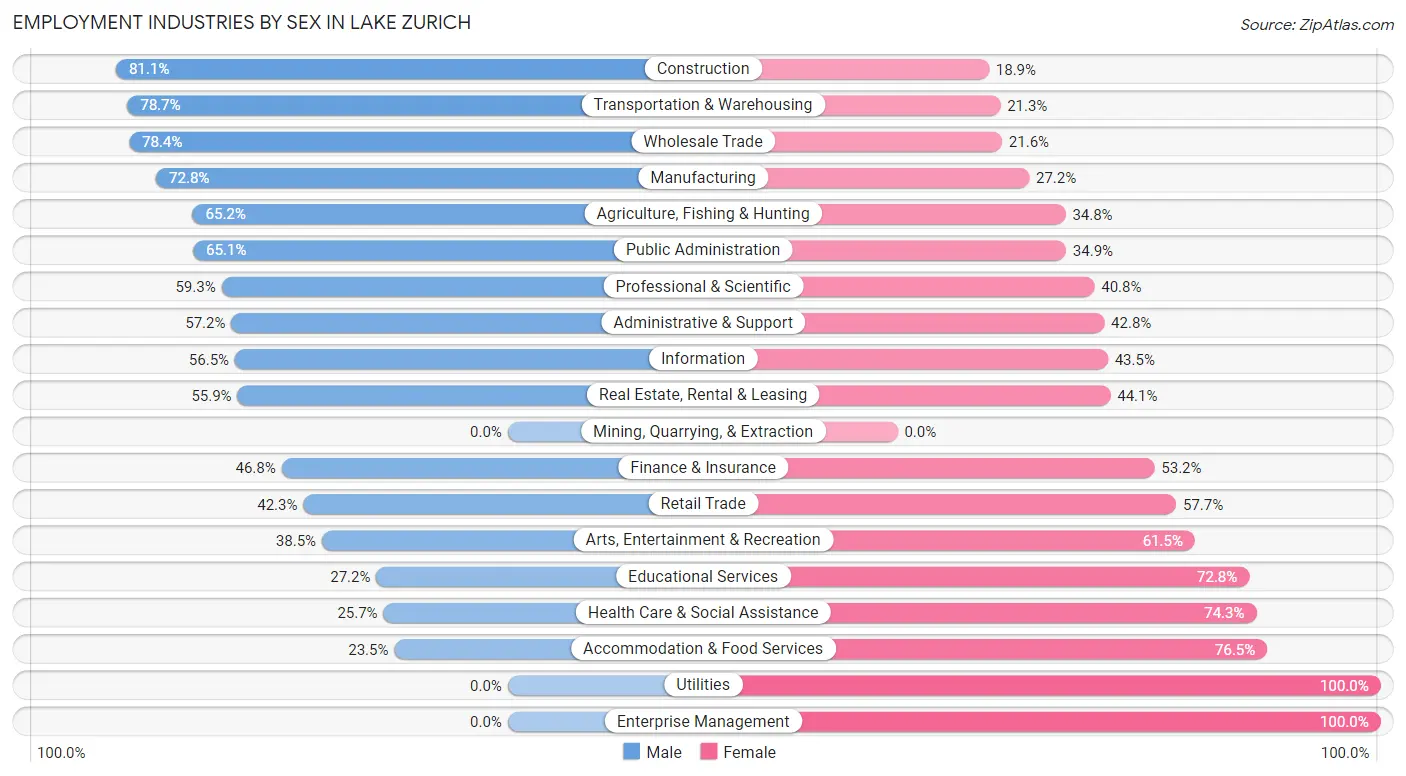
Employment Industries by Sex in Lake Zurich
The Lake Zurich industries that see more men than women are Construction (81.1%), Transportation & Warehousing (78.7%), and Wholesale Trade (78.4%), whereas the industries that tend to have a higher number of women are Utilities (100.0%), Enterprise Management (100.0%), and Accommodation & Food Services (76.5%).
| Industry | Male | Female |
| Agriculture, Fishing & Hunting | 15 (65.2%) | 8 (34.8%) |
| Mining, Quarrying, & Extraction | 0 (0.0%) | 0 (0.0%) |
| Construction | 480 (81.1%) | 112 (18.9%) |
| Manufacturing | 1,234 (72.8%) | 462 (27.2%) |
| Wholesale Trade | 442 (78.4%) | 122 (21.6%) |
| Retail Trade | 590 (42.3%) | 804 (57.7%) |
| Transportation & Warehousing | 385 (78.7%) | 104 (21.3%) |
| Utilities | 0 (0.0%) | 9 (100.0%) |
| Information | 192 (56.5%) | 148 (43.5%) |
| Finance & Insurance | 398 (46.8%) | 452 (53.2%) |
| Real Estate, Rental & Leasing | 113 (55.9%) | 89 (44.1%) |
| Professional & Scientific | 647 (59.3%) | 445 (40.7%) |
| Enterprise Management | 0 (0.0%) | 27 (100.0%) |
| Administrative & Support | 131 (57.2%) | 98 (42.8%) |
| Educational Services | 336 (27.2%) | 899 (72.8%) |
| Health Care & Social Assistance | 287 (25.7%) | 829 (74.3%) |
| Arts, Entertainment & Recreation | 100 (38.5%) | 160 (61.5%) |
| Accommodation & Food Services | 112 (23.5%) | 365 (76.5%) |
| Public Administration | 99 (65.1%) | 53 (34.9%) |
| Total | 5,679 (50.5%) | 5,562 (49.5%) |
Education in Lake Zurich
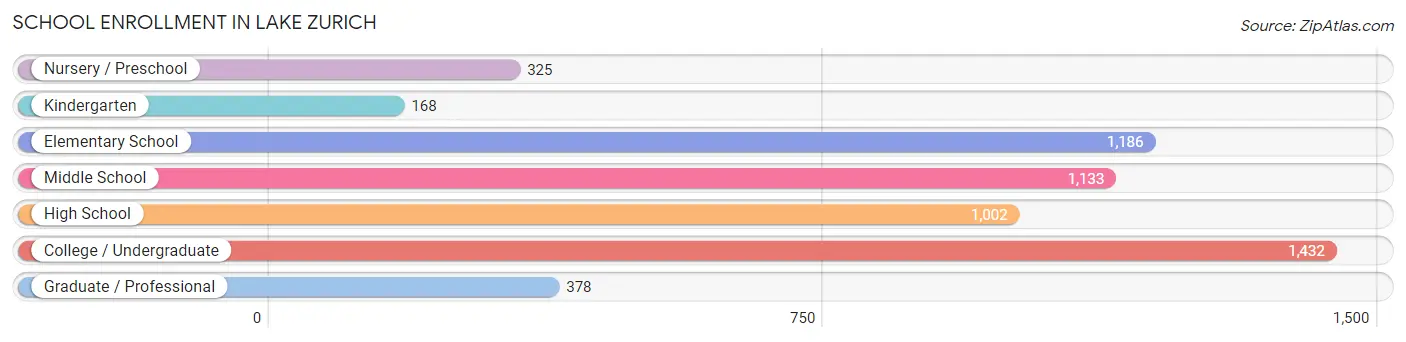
School Enrollment in Lake Zurich
The most common levels of schooling among the 5,624 students in Lake Zurich are college / undergraduate (1,432 | 25.5%), elementary school (1,186 | 21.1%), and middle school (1,133 | 20.2%).
| School Level | # Students | % Students |
| Nursery / Preschool | 325 | 5.8% |
| Kindergarten | 168 | 3.0% |
| Elementary School | 1,186 | 21.1% |
| Middle School | 1,133 | 20.2% |
| High School | 1,002 | 17.8% |
| College / Undergraduate | 1,432 | 25.5% |
| Graduate / Professional | 378 | 6.7% |
| Total | 5,624 | 100.0% |
School Enrollment by Age by Funding Source in Lake Zurich
Out of a total of 5,624 students who are enrolled in schools in Lake Zurich, 720 (12.8%) attend a private institution, while the remaining 4,904 (87.2%) are enrolled in public schools. The age group of 35 years and over has the highest likelihood of being enrolled in private schools, with 155 (41.5% in the age bracket) enrolled. Conversely, the age group of 15 to 17 year olds has the lowest likelihood of being enrolled in a private school, with 765 (100.0% in the age bracket) attending a public institution.
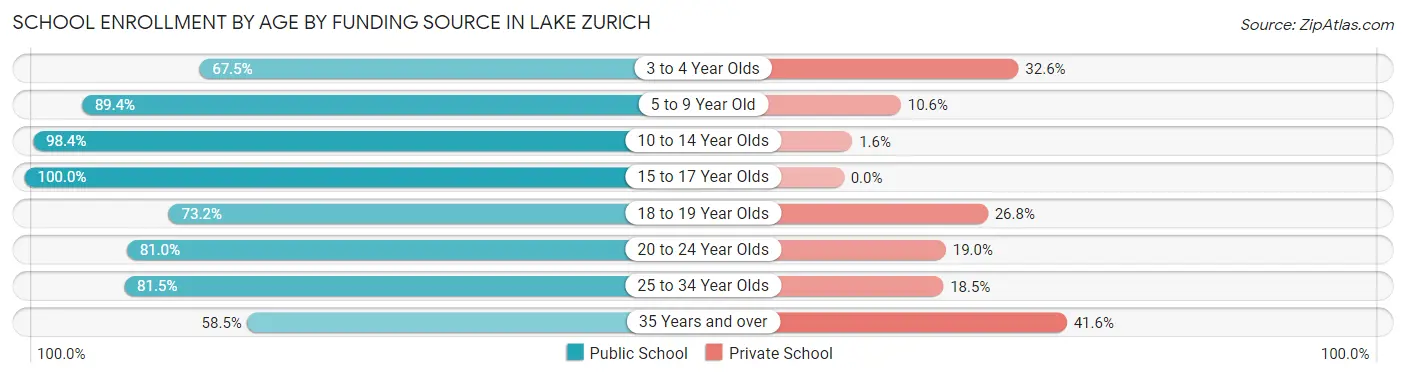
| Age Bracket | Public School | Private School |
| 3 to 4 Year Olds | 172 (67.4%) | 83 (32.6%) |
| 5 to 9 Year Old | 1,067 (89.4%) | 127 (10.6%) |
| 10 to 14 Year Olds | 1,427 (98.4%) | 23 (1.6%) |
| 15 to 17 Year Olds | 765 (100.0%) | 0 (0.0%) |
| 18 to 19 Year Olds | 319 (73.2%) | 117 (26.8%) |
| 20 to 24 Year Olds | 587 (81.0%) | 138 (19.0%) |
| 25 to 34 Year Olds | 347 (81.5%) | 79 (18.5%) |
| 35 Years and over | 218 (58.5%) | 155 (41.5%) |
| Total | 4,904 (87.2%) | 720 (12.8%) |
Educational Attainment by Field of Study in Lake Zurich
Business (1,668 | 19.8%), education (1,154 | 13.7%), engineering (1,068 | 12.7%), computers & mathematics (709 | 8.4%), and science & technology (682 | 8.1%) are the most common fields of study among 8,440 individuals in Lake Zurich who have obtained a bachelor's degree or higher.
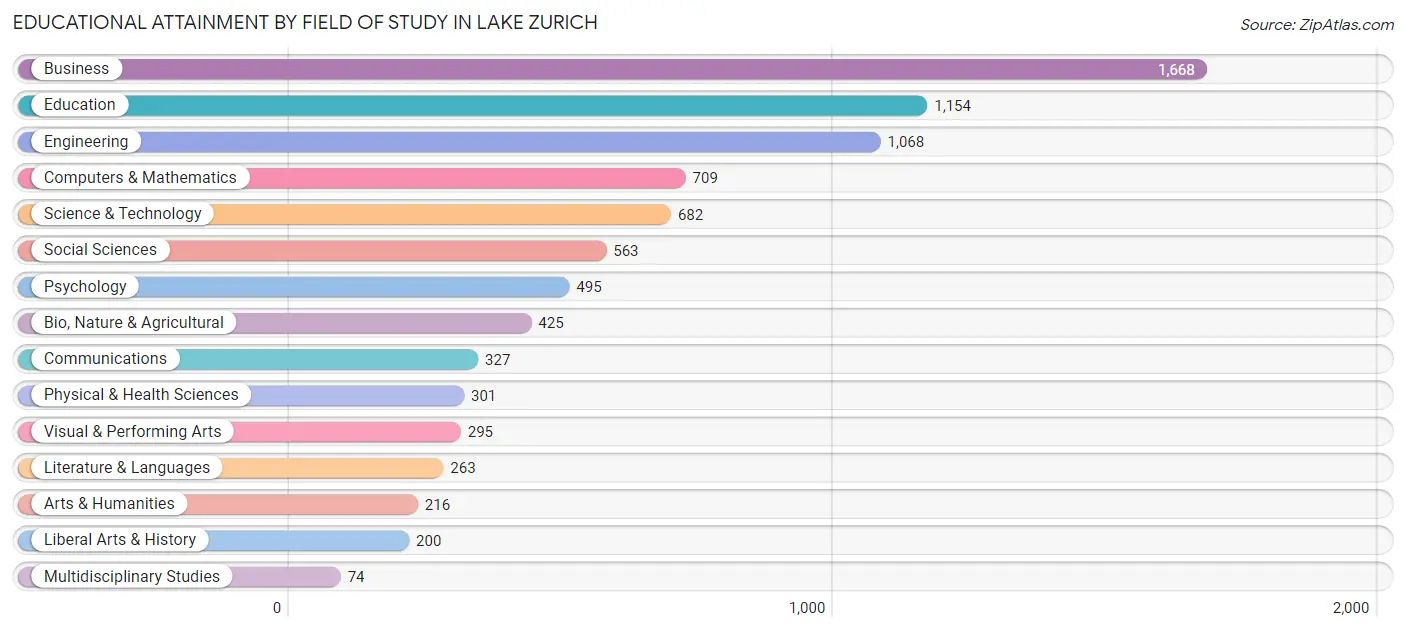
| Field of Study | # Graduates | % Graduates |
| Computers & Mathematics | 709 | 8.4% |
| Bio, Nature & Agricultural | 425 | 5.0% |
| Physical & Health Sciences | 301 | 3.6% |
| Psychology | 495 | 5.9% |
| Social Sciences | 563 | 6.7% |
| Engineering | 1,068 | 12.7% |
| Multidisciplinary Studies | 74 | 0.9% |
| Science & Technology | 682 | 8.1% |
| Business | 1,668 | 19.8% |
| Education | 1,154 | 13.7% |
| Literature & Languages | 263 | 3.1% |
| Liberal Arts & History | 200 | 2.4% |
| Visual & Performing Arts | 295 | 3.5% |
| Communications | 327 | 3.9% |
| Arts & Humanities | 216 | 2.6% |
| Total | 8,440 | 100.0% |
Transportation & Commute in Lake Zurich
Vehicle Availability by Sex in Lake Zurich
The most prevalent vehicle ownership categories in Lake Zurich are males with 2 vehicles (3,116, accounting for 55.4%) and females with 2 vehicles (2,843, making up 58.7%).
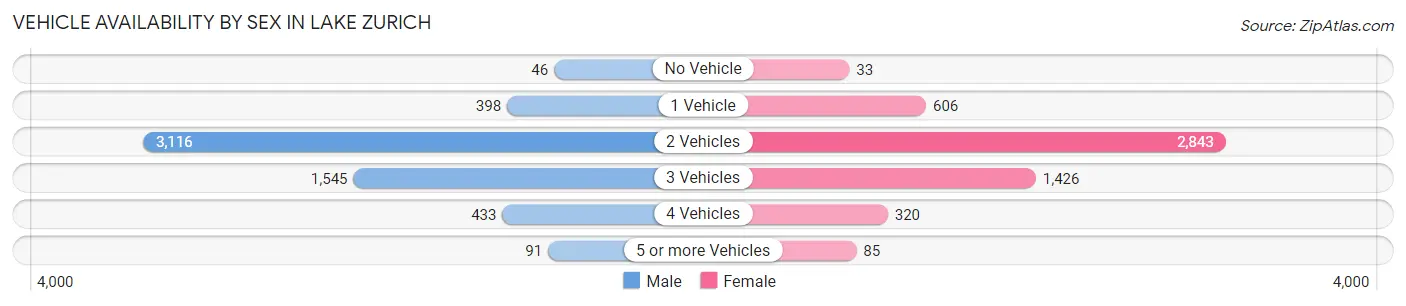
| Vehicles Available | Male | Female |
| No Vehicle | 46 (0.8%) | 33 (0.6%) |
| 1 Vehicle | 398 (7.1%) | 606 (11.4%) |
| 2 Vehicles | 3,116 (55.4%) | 2,843 (53.5%) |
| 3 Vehicles | 1,545 (27.5%) | 1,426 (26.8%) |
| 4 Vehicles | 433 (7.7%) | 320 (6.0%) |
| 5 or more Vehicles | 91 (1.6%) | 85 (1.6%) |
| Total | 5,629 (100.0%) | 5,313 (100.0%) |
Commute Time in Lake Zurich
The most frequently occuring commute durations in Lake Zurich are 30 to 34 minutes (1,760 commuters, 19.5%), 10 to 14 minutes (1,152 commuters, 12.8%), and 45 to 59 minutes (1,067 commuters, 11.8%).
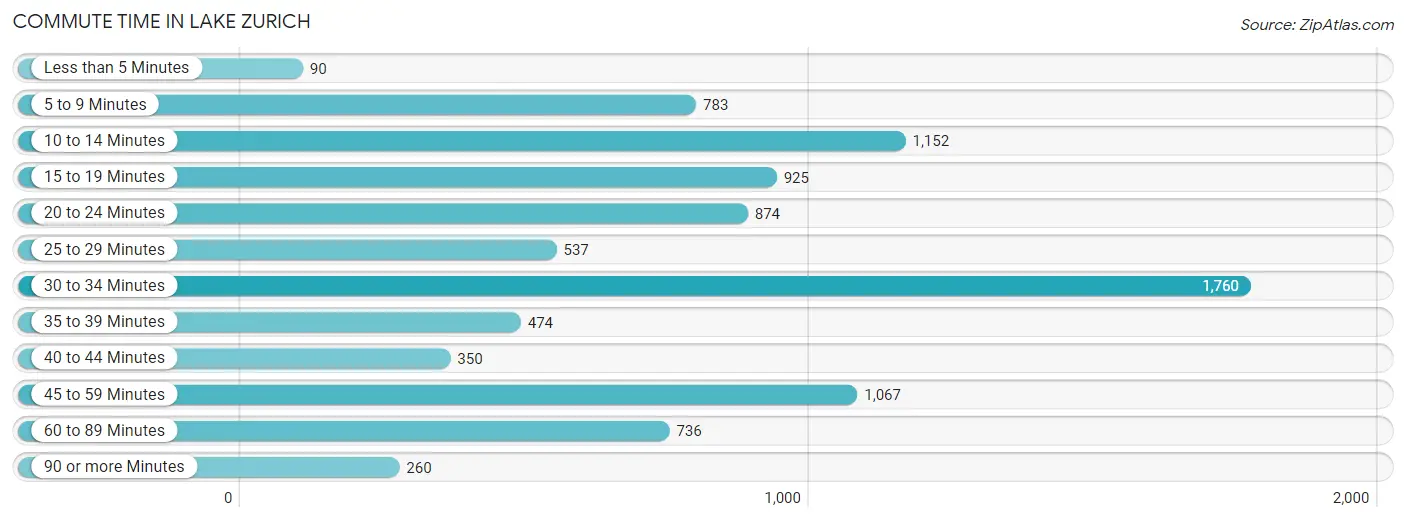
| Commute Time | # Commuters | % Commuters |
| Less than 5 Minutes | 90 | 1.0% |
| 5 to 9 Minutes | 783 | 8.7% |
| 10 to 14 Minutes | 1,152 | 12.8% |
| 15 to 19 Minutes | 925 | 10.3% |
| 20 to 24 Minutes | 874 | 9.7% |
| 25 to 29 Minutes | 537 | 6.0% |
| 30 to 34 Minutes | 1,760 | 19.5% |
| 35 to 39 Minutes | 474 | 5.3% |
| 40 to 44 Minutes | 350 | 3.9% |
| 45 to 59 Minutes | 1,067 | 11.8% |
| 60 to 89 Minutes | 736 | 8.2% |
| 90 or more Minutes | 260 | 2.9% |
Commute Time by Sex in Lake Zurich
The most common commute times in Lake Zurich are 30 to 34 minutes (864 commuters, 19.2%) for males and 30 to 34 minutes (896 commuters, 19.9%) for females.
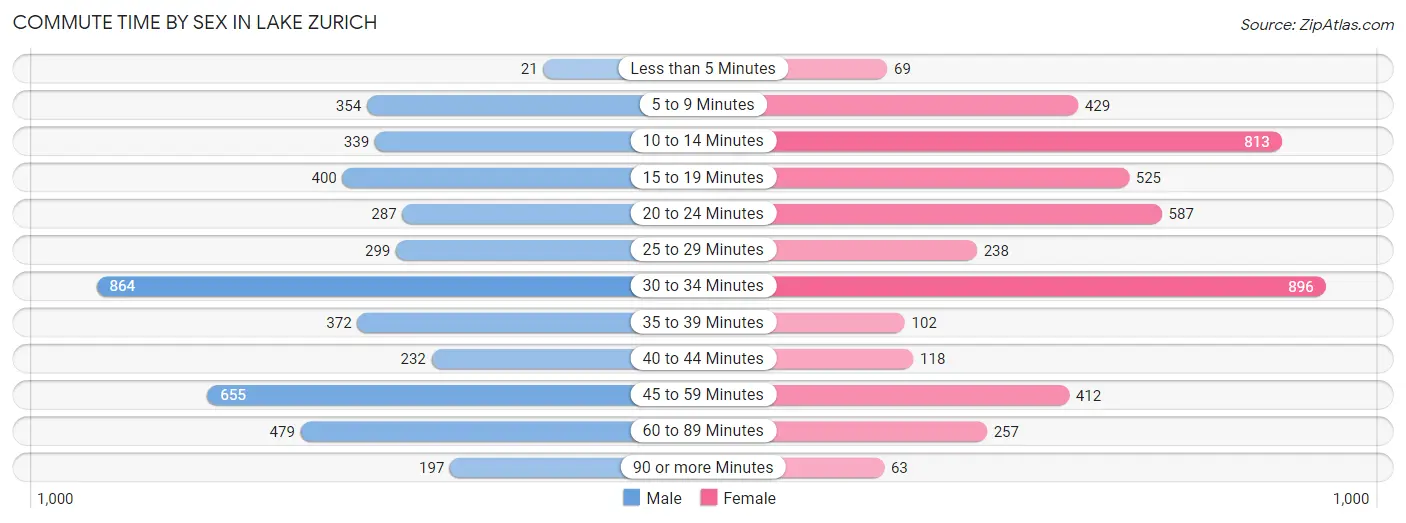
| Commute Time | Male | Female |
| Less than 5 Minutes | 21 (0.5%) | 69 (1.5%) |
| 5 to 9 Minutes | 354 (7.9%) | 429 (9.5%) |
| 10 to 14 Minutes | 339 (7.5%) | 813 (18.0%) |
| 15 to 19 Minutes | 400 (8.9%) | 525 (11.6%) |
| 20 to 24 Minutes | 287 (6.4%) | 587 (13.0%) |
| 25 to 29 Minutes | 299 (6.7%) | 238 (5.3%) |
| 30 to 34 Minutes | 864 (19.2%) | 896 (19.9%) |
| 35 to 39 Minutes | 372 (8.3%) | 102 (2.3%) |
| 40 to 44 Minutes | 232 (5.2%) | 118 (2.6%) |
| 45 to 59 Minutes | 655 (14.6%) | 412 (9.1%) |
| 60 to 89 Minutes | 479 (10.6%) | 257 (5.7%) |
| 90 or more Minutes | 197 (4.4%) | 63 (1.4%) |
Time of Departure to Work by Sex in Lake Zurich
The most frequent times of departure to work in Lake Zurich are 7:00 AM to 7:29 AM (709, 15.8%) for males and 7:00 AM to 7:29 AM (891, 19.8%) for females.
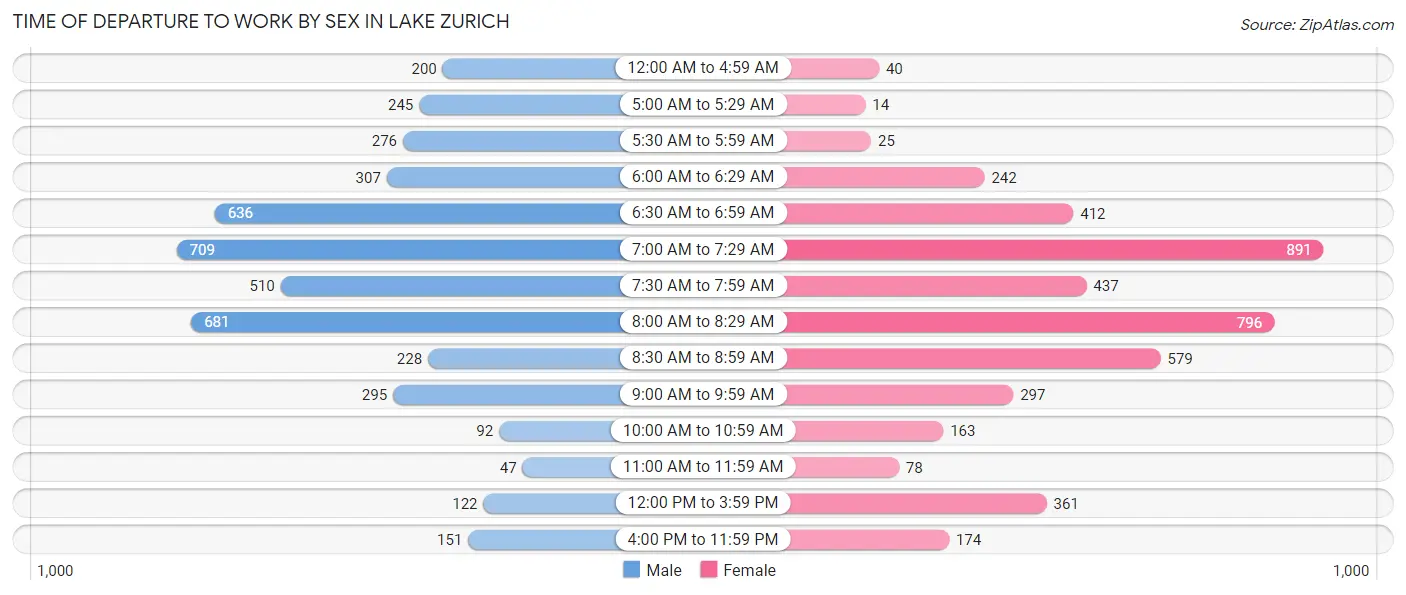
| Time of Departure | Male | Female |
| 12:00 AM to 4:59 AM | 200 (4.4%) | 40 (0.9%) |
| 5:00 AM to 5:29 AM | 245 (5.4%) | 14 (0.3%) |
| 5:30 AM to 5:59 AM | 276 (6.1%) | 25 (0.5%) |
| 6:00 AM to 6:29 AM | 307 (6.8%) | 242 (5.4%) |
| 6:30 AM to 6:59 AM | 636 (14.1%) | 412 (9.1%) |
| 7:00 AM to 7:29 AM | 709 (15.8%) | 891 (19.8%) |
| 7:30 AM to 7:59 AM | 510 (11.3%) | 437 (9.7%) |
| 8:00 AM to 8:29 AM | 681 (15.1%) | 796 (17.6%) |
| 8:30 AM to 8:59 AM | 228 (5.1%) | 579 (12.8%) |
| 9:00 AM to 9:59 AM | 295 (6.6%) | 297 (6.6%) |
| 10:00 AM to 10:59 AM | 92 (2.0%) | 163 (3.6%) |
| 11:00 AM to 11:59 AM | 47 (1.0%) | 78 (1.7%) |
| 12:00 PM to 3:59 PM | 122 (2.7%) | 361 (8.0%) |
| 4:00 PM to 11:59 PM | 151 (3.4%) | 174 (3.9%) |
| Total | 4,499 (100.0%) | 4,509 (100.0%) |
Housing Occupancy in Lake Zurich
Occupancy by Ownership in Lake Zurich
Of the total 7,173 dwellings in Lake Zurich, owner-occupied units account for 5,919 (82.5%), while renter-occupied units make up 1,254 (17.5%).
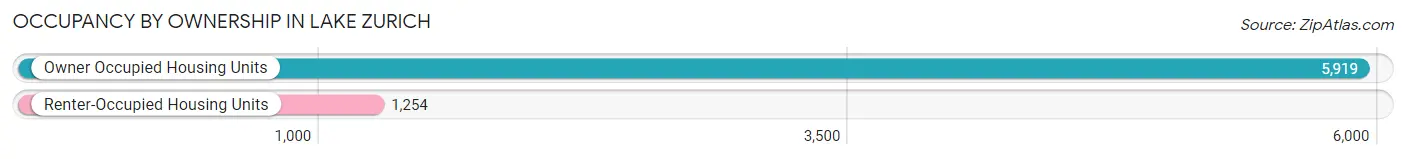
| Occupancy | # Housing Units | % Housing Units |
| Owner Occupied Housing Units | 5,919 | 82.5% |
| Renter-Occupied Housing Units | 1,254 | 17.5% |
| Total Occupied Housing Units | 7,173 | 100.0% |
Occupancy by Household Size in Lake Zurich
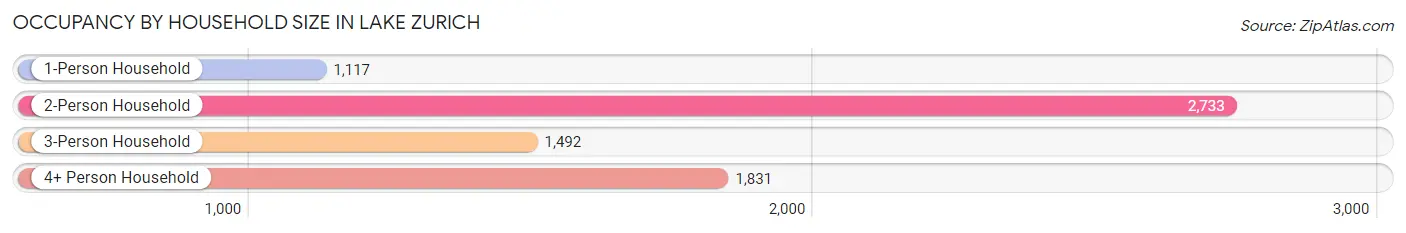
| Household Size | # Housing Units | % Housing Units |
| 1-Person Household | 1,117 | 15.6% |
| 2-Person Household | 2,733 | 38.1% |
| 3-Person Household | 1,492 | 20.8% |
| 4+ Person Household | 1,831 | 25.5% |
| Total Housing Units | 7,173 | 100.0% |
Occupancy by Ownership by Household Size in Lake Zurich
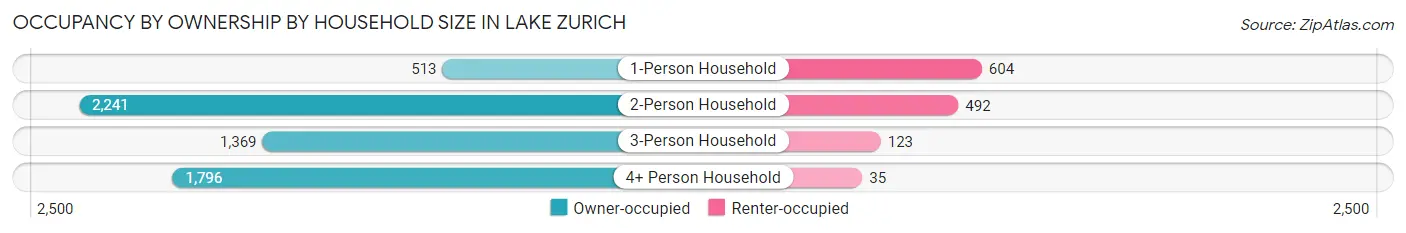
| Household Size | Owner-occupied | Renter-occupied |
| 1-Person Household | 513 (45.9%) | 604 (54.1%) |
| 2-Person Household | 2,241 (82.0%) | 492 (18.0%) |
| 3-Person Household | 1,369 (91.8%) | 123 (8.2%) |
| 4+ Person Household | 1,796 (98.1%) | 35 (1.9%) |
| Total Housing Units | 5,919 (82.5%) | 1,254 (17.5%) |
Occupancy by Educational Attainment in Lake Zurich
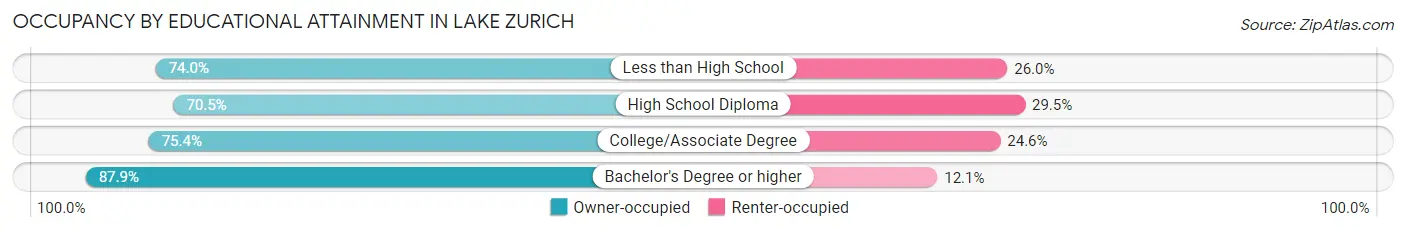
| Household Size | Owner-occupied | Renter-occupied |
| Less than High School | 74 (74.0%) | 26 (26.0%) |
| High School Diploma | 628 (70.5%) | 263 (29.5%) |
| College/Associate Degree | 1,301 (75.4%) | 425 (24.6%) |
| Bachelor's Degree or higher | 3,916 (87.9%) | 540 (12.1%) |
Occupancy by Age of Householder in Lake Zurich
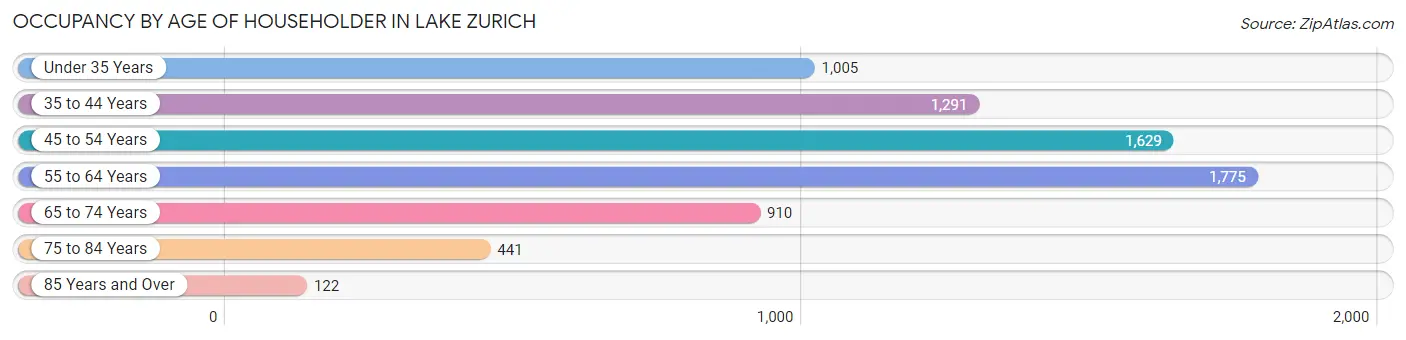
| Age Bracket | # Households | % Households |
| Under 35 Years | 1,005 | 14.0% |
| 35 to 44 Years | 1,291 | 18.0% |
| 45 to 54 Years | 1,629 | 22.7% |
| 55 to 64 Years | 1,775 | 24.7% |
| 65 to 74 Years | 910 | 12.7% |
| 75 to 84 Years | 441 | 6.1% |
| 85 Years and Over | 122 | 1.7% |
| Total | 7,173 | 100.0% |
Housing Finances in Lake Zurich
Median Income by Occupancy in Lake Zurich
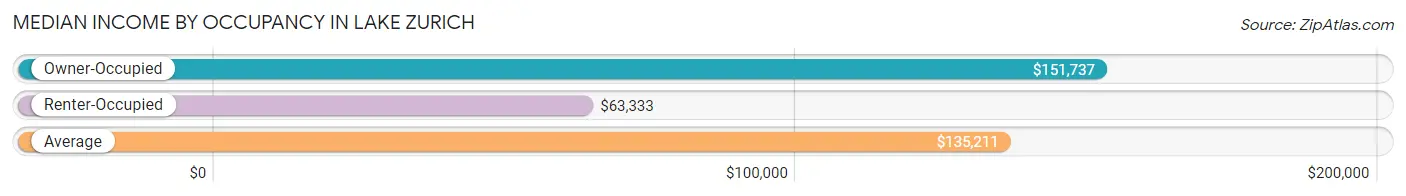
| Occupancy Type | # Households | Median Income |
| Owner-Occupied | 5,919 (82.5%) | $151,737 |
| Renter-Occupied | 1,254 (17.5%) | $63,333 |
| Average | 7,173 (100.0%) | $135,211 |
Occupancy by Householder Income Bracket in Lake Zurich
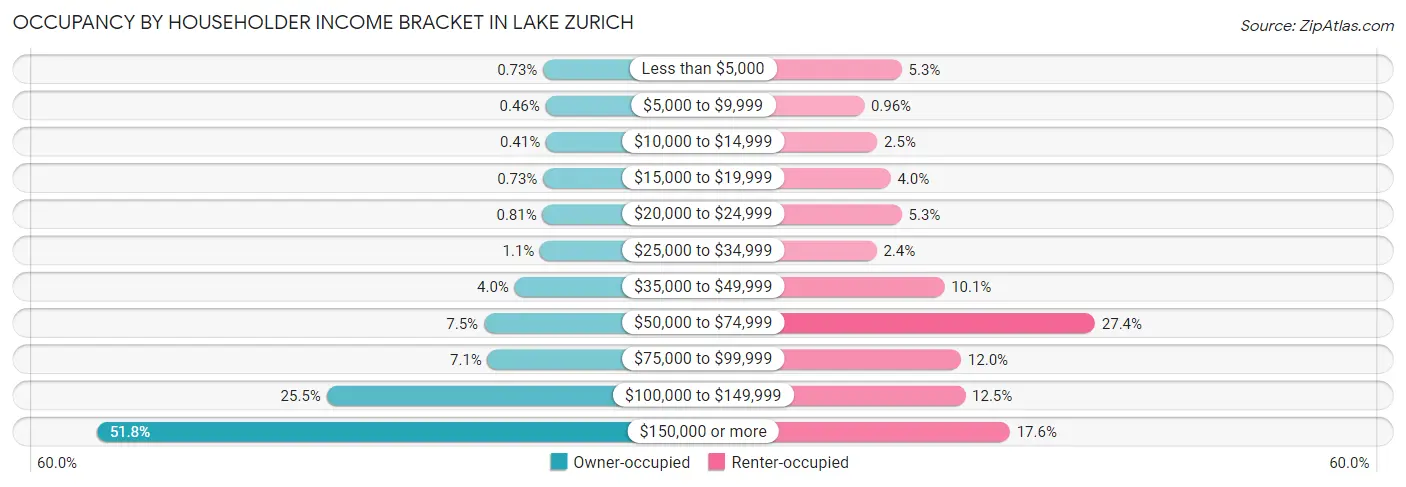
| Income Bracket | Owner-occupied | Renter-occupied |
| Less than $5,000 | 43 (0.7%) | 66 (5.3%) |
| $5,000 to $9,999 | 27 (0.5%) | 12 (1.0%) |
| $10,000 to $14,999 | 24 (0.4%) | 31 (2.5%) |
| $15,000 to $19,999 | 43 (0.7%) | 50 (4.0%) |
| $20,000 to $24,999 | 48 (0.8%) | 66 (5.3%) |
| $25,000 to $34,999 | 64 (1.1%) | 30 (2.4%) |
| $35,000 to $49,999 | 236 (4.0%) | 127 (10.1%) |
| $50,000 to $74,999 | 444 (7.5%) | 343 (27.4%) |
| $75,000 to $99,999 | 419 (7.1%) | 151 (12.0%) |
| $100,000 to $149,999 | 1,508 (25.5%) | 157 (12.5%) |
| $150,000 or more | 3,063 (51.7%) | 221 (17.6%) |
| Total | 5,919 (100.0%) | 1,254 (100.0%) |
Monthly Housing Cost Tiers in Lake Zurich
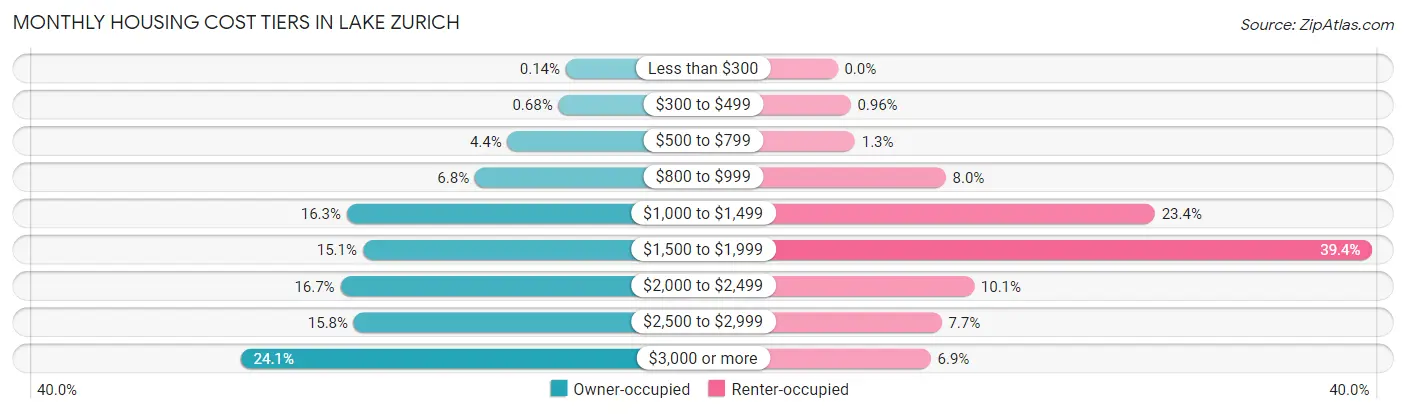
| Monthly Cost | Owner-occupied | Renter-occupied |
| Less than $300 | 8 (0.1%) | 0 (0.0%) |
| $300 to $499 | 40 (0.7%) | 12 (1.0%) |
| $500 to $799 | 262 (4.4%) | 16 (1.3%) |
| $800 to $999 | 404 (6.8%) | 100 (8.0%) |
| $1,000 to $1,499 | 963 (16.3%) | 293 (23.4%) |
| $1,500 to $1,999 | 893 (15.1%) | 494 (39.4%) |
| $2,000 to $2,499 | 991 (16.7%) | 126 (10.1%) |
| $2,500 to $2,999 | 932 (15.8%) | 96 (7.7%) |
| $3,000 or more | 1,426 (24.1%) | 86 (6.9%) |
| Total | 5,919 (100.0%) | 1,254 (100.0%) |
Physical Housing Characteristics in Lake Zurich
Housing Structures in Lake Zurich
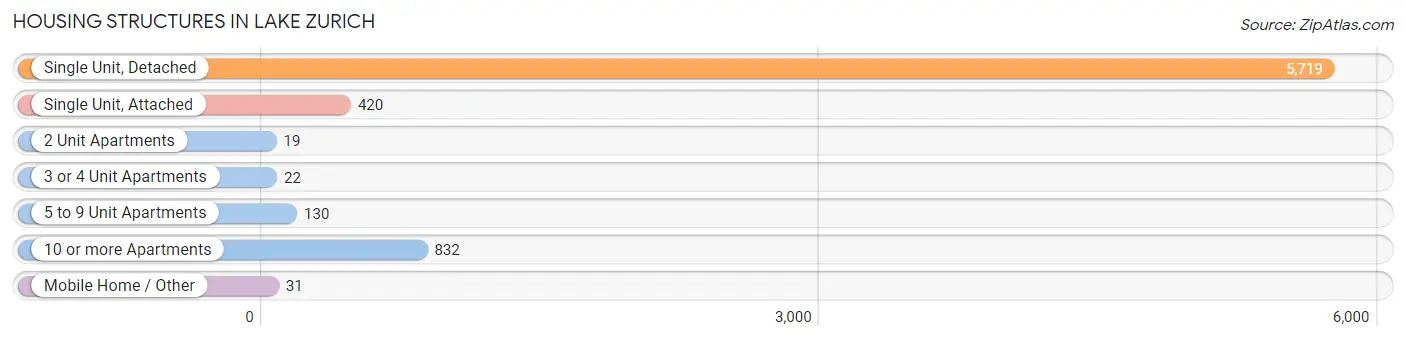
| Structure Type | # Housing Units | % Housing Units |
| Single Unit, Detached | 5,719 | 79.7% |
| Single Unit, Attached | 420 | 5.9% |
| 2 Unit Apartments | 19 | 0.3% |
| 3 or 4 Unit Apartments | 22 | 0.3% |
| 5 to 9 Unit Apartments | 130 | 1.8% |
| 10 or more Apartments | 832 | 11.6% |
| Mobile Home / Other | 31 | 0.4% |
| Total | 7,173 | 100.0% |
Housing Structures by Occupancy in Lake Zurich
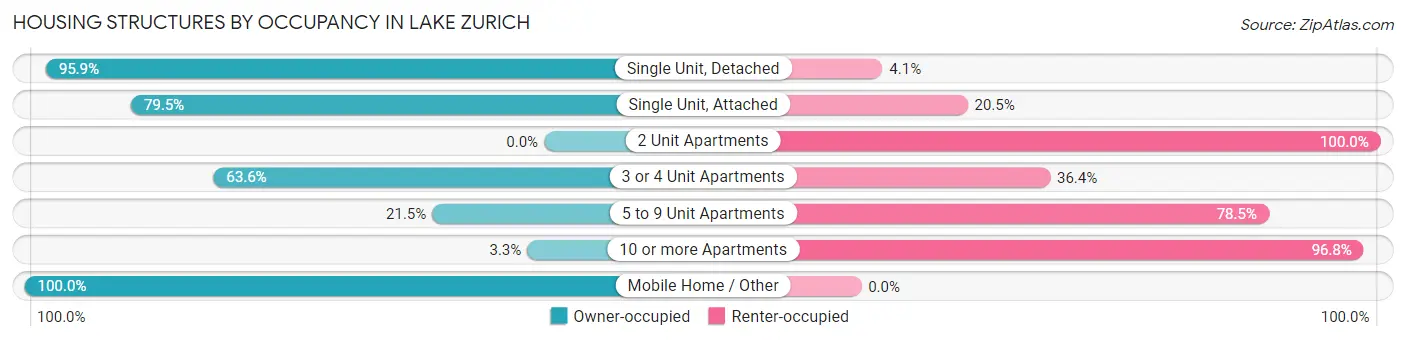
| Structure Type | Owner-occupied | Renter-occupied |
| Single Unit, Detached | 5,485 (95.9%) | 234 (4.1%) |
| Single Unit, Attached | 334 (79.5%) | 86 (20.5%) |
| 2 Unit Apartments | 0 (0.0%) | 19 (100.0%) |
| 3 or 4 Unit Apartments | 14 (63.6%) | 8 (36.4%) |
| 5 to 9 Unit Apartments | 28 (21.5%) | 102 (78.5%) |
| 10 or more Apartments | 27 (3.3%) | 805 (96.8%) |
| Mobile Home / Other | 31 (100.0%) | 0 (0.0%) |
| Total | 5,919 (82.5%) | 1,254 (17.5%) |
Housing Structures by Number of Rooms in Lake Zurich
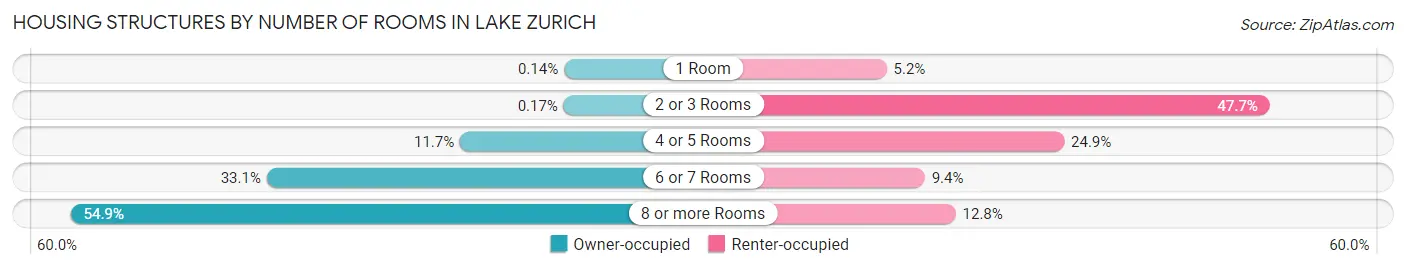
| Number of Rooms | Owner-occupied | Renter-occupied |
| 1 Room | 8 (0.1%) | 65 (5.2%) |
| 2 or 3 Rooms | 10 (0.2%) | 598 (47.7%) |
| 4 or 5 Rooms | 691 (11.7%) | 312 (24.9%) |
| 6 or 7 Rooms | 1,961 (33.1%) | 118 (9.4%) |
| 8 or more Rooms | 3,249 (54.9%) | 161 (12.8%) |
| Total | 5,919 (100.0%) | 1,254 (100.0%) |
Housing Structure by Heating Type in Lake Zurich
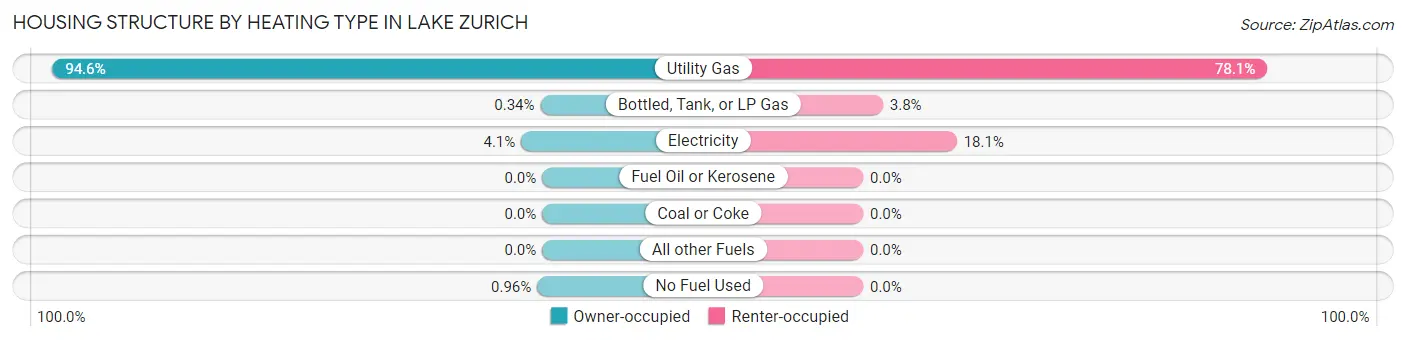
| Heating Type | Owner-occupied | Renter-occupied |
| Utility Gas | 5,602 (94.6%) | 979 (78.1%) |
| Bottled, Tank, or LP Gas | 20 (0.3%) | 48 (3.8%) |
| Electricity | 240 (4.1%) | 227 (18.1%) |
| Fuel Oil or Kerosene | 0 (0.0%) | 0 (0.0%) |
| Coal or Coke | 0 (0.0%) | 0 (0.0%) |
| All other Fuels | 0 (0.0%) | 0 (0.0%) |
| No Fuel Used | 57 (1.0%) | 0 (0.0%) |
| Total | 5,919 (100.0%) | 1,254 (100.0%) |
Household Vehicle Usage in Lake Zurich
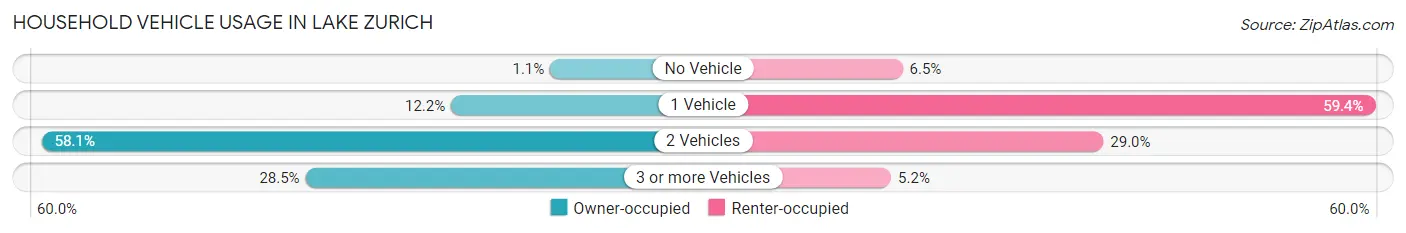
| Vehicles per Household | Owner-occupied | Renter-occupied |
| No Vehicle | 67 (1.1%) | 81 (6.5%) |
| 1 Vehicle | 724 (12.2%) | 745 (59.4%) |
| 2 Vehicles | 3,439 (58.1%) | 363 (28.9%) |
| 3 or more Vehicles | 1,689 (28.5%) | 65 (5.2%) |
| Total | 5,919 (100.0%) | 1,254 (100.0%) |
Real Estate & Mortgages in Lake Zurich
Real Estate and Mortgage Overview in Lake Zurich
| Characteristic | Without Mortgage | With Mortgage |
| Housing Units | 1,630 | 4,289 |
| Median Property Value | $366,300 | $408,700 |
| Median Household Income | $117,324 | $2,419 |
| Monthly Housing Costs | $1,064 | $1,426 |
| Real Estate Taxes | $8,709 | $80 |
Property Value by Mortgage Status in Lake Zurich
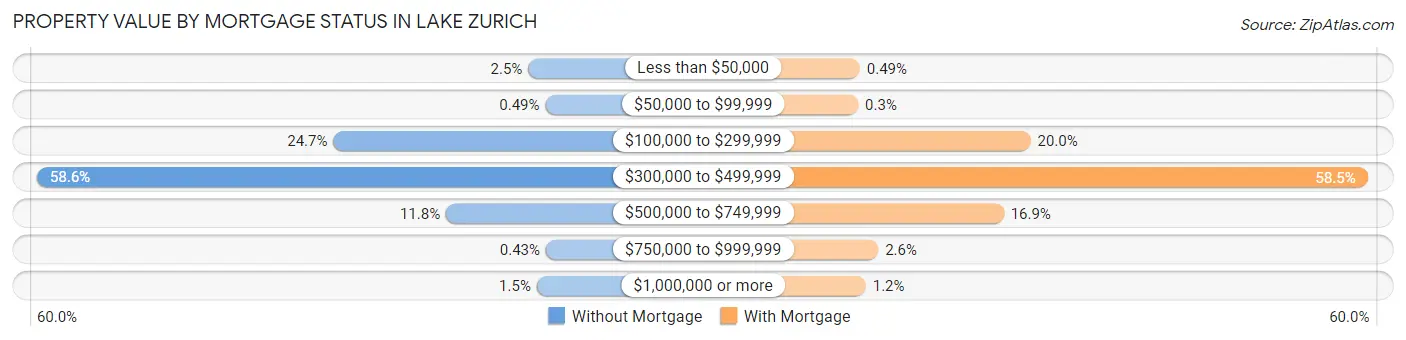
| Property Value | Without Mortgage | With Mortgage |
| Less than $50,000 | 40 (2.5%) | 21 (0.5%) |
| $50,000 to $99,999 | 8 (0.5%) | 13 (0.3%) |
| $100,000 to $299,999 | 403 (24.7%) | 858 (20.0%) |
| $300,000 to $499,999 | 955 (58.6%) | 2,510 (58.5%) |
| $500,000 to $749,999 | 193 (11.8%) | 726 (16.9%) |
| $750,000 to $999,999 | 7 (0.4%) | 111 (2.6%) |
| $1,000,000 or more | 24 (1.5%) | 50 (1.2%) |
| Total | 1,630 (100.0%) | 4,289 (100.0%) |
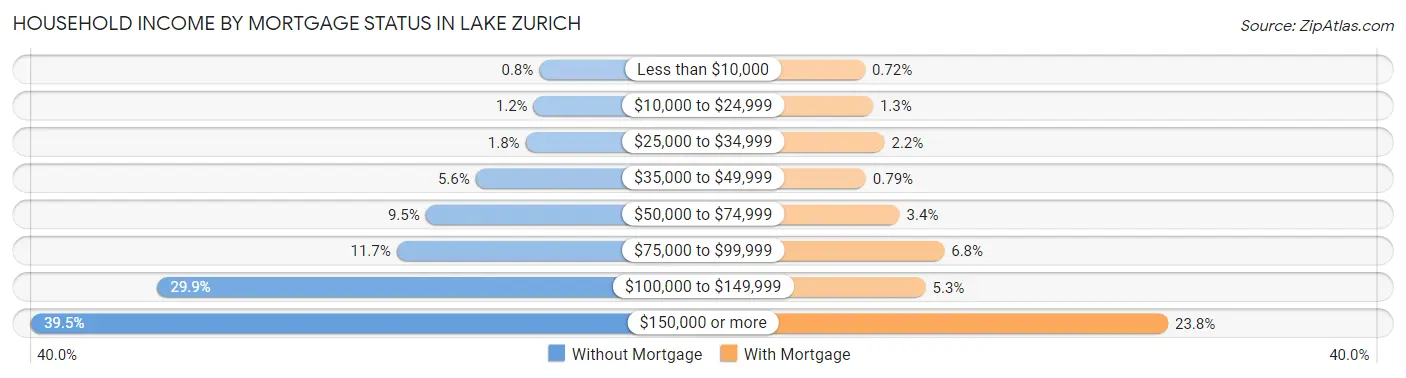
Household Income by Mortgage Status in Lake Zurich
| Household Income | Without Mortgage | With Mortgage |
| Less than $10,000 | 13 (0.8%) | 31 (0.7%) |
| $10,000 to $24,999 | 20 (1.2%) | 57 (1.3%) |
| $25,000 to $34,999 | 30 (1.8%) | 95 (2.2%) |
| $35,000 to $49,999 | 92 (5.6%) | 34 (0.8%) |
| $50,000 to $74,999 | 154 (9.5%) | 144 (3.4%) |
| $75,000 to $99,999 | 190 (11.7%) | 290 (6.8%) |
| $100,000 to $149,999 | 487 (29.9%) | 229 (5.3%) |
| $150,000 or more | 644 (39.5%) | 1,021 (23.8%) |
| Total | 1,630 (100.0%) | 4,289 (100.0%) |
Property Value to Household Income Ratio in Lake Zurich
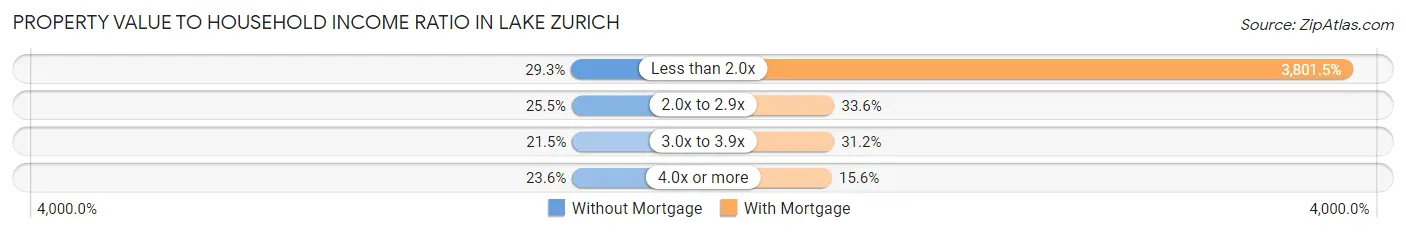
| Value-to-Income Ratio | Without Mortgage | With Mortgage |
| Less than 2.0x | 478 (29.3%) | 163,046 (3,801.5%) |
| 2.0x to 2.9x | 416 (25.5%) | 1,441 (33.6%) |
| 3.0x to 3.9x | 351 (21.5%) | 1,340 (31.2%) |
| 4.0x or more | 385 (23.6%) | 669 (15.6%) |
| Total | 1,630 (100.0%) | 4,289 (100.0%) |
Real Estate Taxes by Mortgage Status in Lake Zurich
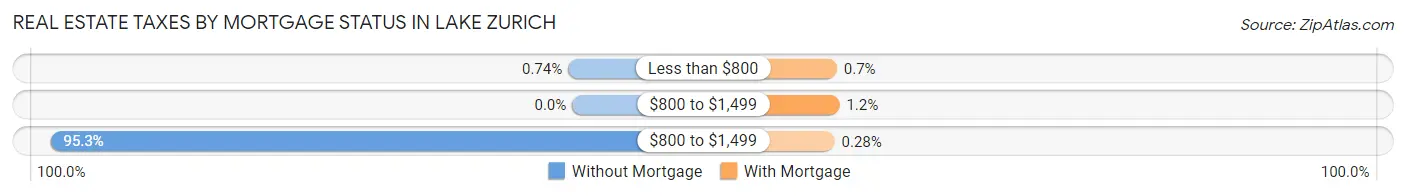
| Property Taxes | Without Mortgage | With Mortgage |
| Less than $800 | 12 (0.7%) | 30 (0.7%) |
| $800 to $1,499 | 0 (0.0%) | 50 (1.2%) |
| $800 to $1,499 | 1,553 (95.3%) | 12 (0.3%) |
| Total | 1,630 (100.0%) | 4,289 (100.0%) |
Health & Disability in Lake Zurich
Health Insurance Coverage by Age in Lake Zurich
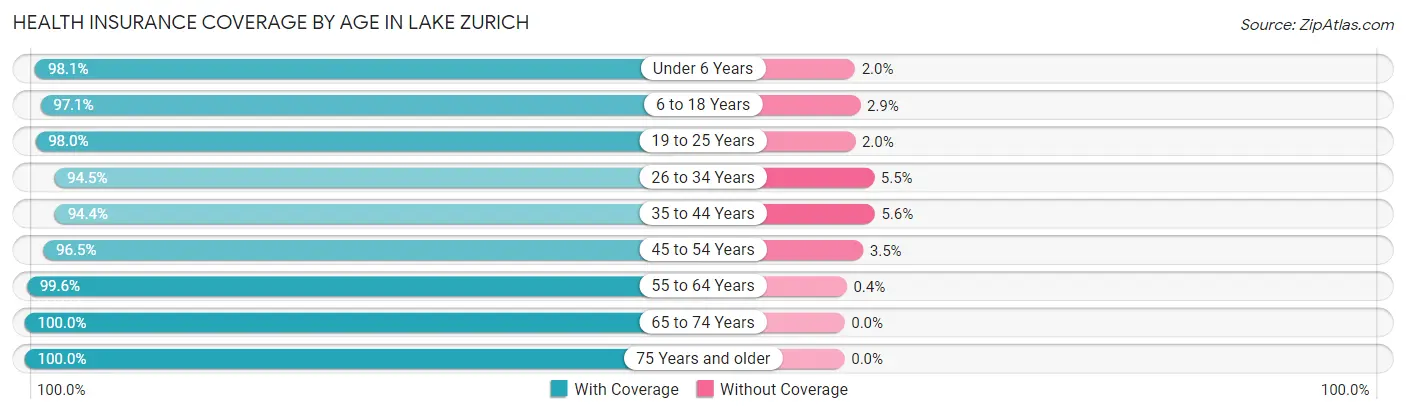
| Age Bracket | With Coverage | Without Coverage |
| Under 6 Years | 1,309 (98.1%) | 26 (1.9%) |
| 6 to 18 Years | 3,312 (97.1%) | 100 (2.9%) |
| 19 to 25 Years | 1,723 (98.0%) | 35 (2.0%) |
| 26 to 34 Years | 1,733 (94.5%) | 101 (5.5%) |
| 35 to 44 Years | 2,433 (94.4%) | 145 (5.6%) |
| 45 to 54 Years | 2,820 (96.5%) | 101 (3.5%) |
| 55 to 64 Years | 3,245 (99.6%) | 13 (0.4%) |
| 65 to 74 Years | 1,615 (100.0%) | 0 (0.0%) |
| 75 Years and older | 813 (100.0%) | 0 (0.0%) |
| Total | 19,003 (97.3%) | 521 (2.7%) |
Health Insurance Coverage by Citizenship Status in Lake Zurich
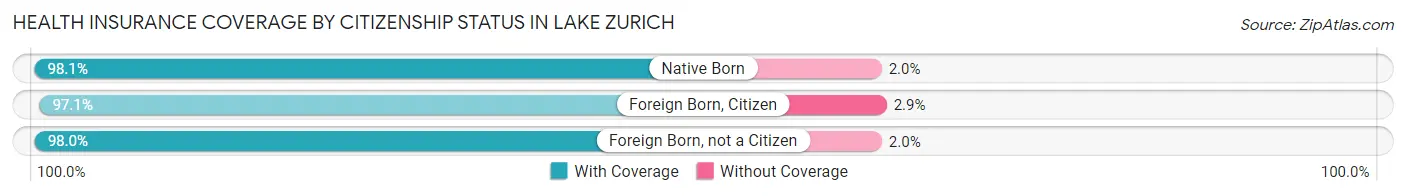
| Citizenship Status | With Coverage | Without Coverage |
| Native Born | 1,309 (98.1%) | 26 (1.9%) |
| Foreign Born, Citizen | 3,312 (97.1%) | 100 (2.9%) |
| Foreign Born, not a Citizen | 1,723 (98.0%) | 35 (2.0%) |
Health Insurance Coverage by Household Income in Lake Zurich
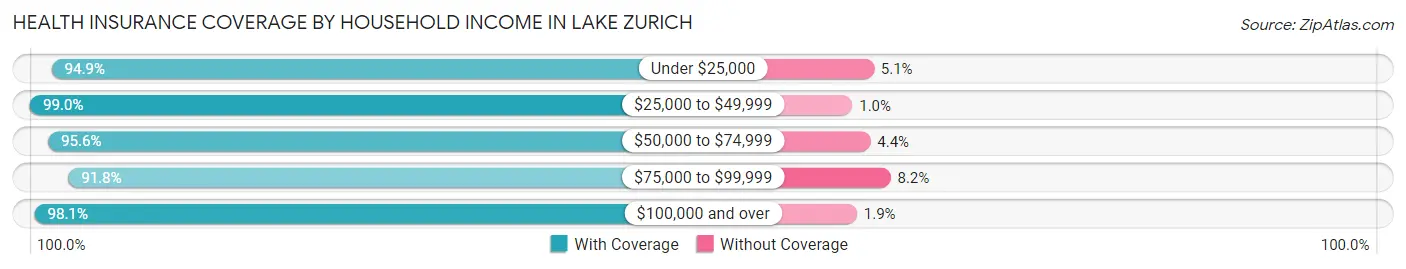
| Household Income | With Coverage | Without Coverage |
| Under $25,000 | 618 (94.9%) | 33 (5.1%) |
| $25,000 to $49,999 | 772 (99.0%) | 8 (1.0%) |
| $50,000 to $74,999 | 1,385 (95.6%) | 64 (4.4%) |
| $75,000 to $99,999 | 1,488 (91.8%) | 133 (8.2%) |
| $100,000 and over | 14,739 (98.1%) | 283 (1.9%) |
Public vs Private Health Insurance Coverage by Age in Lake Zurich
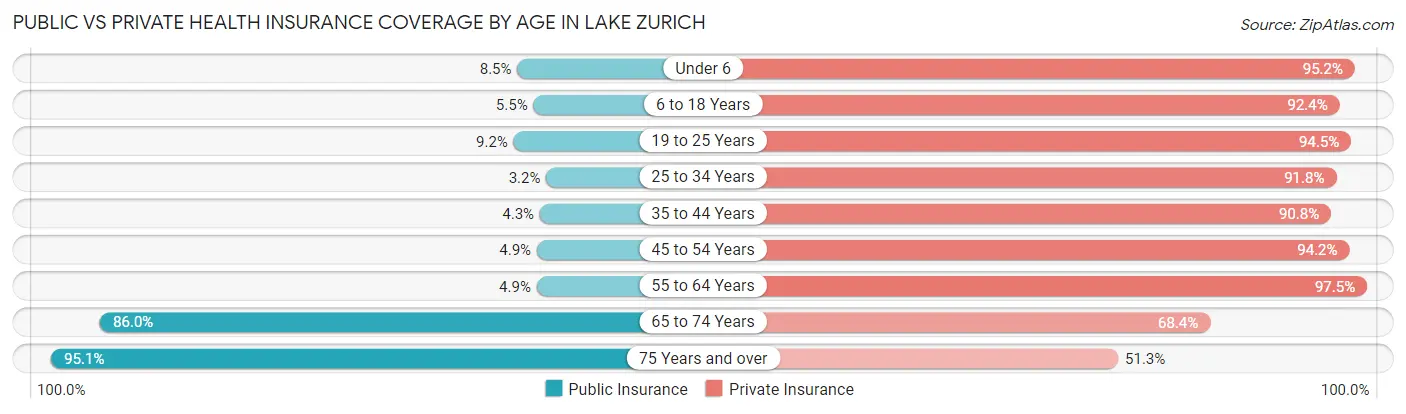
| Age Bracket | Public Insurance | Private Insurance |
| Under 6 | 114 (8.5%) | 1,271 (95.2%) |
| 6 to 18 Years | 189 (5.5%) | 3,152 (92.4%) |
| 19 to 25 Years | 162 (9.2%) | 1,662 (94.5%) |
| 25 to 34 Years | 58 (3.2%) | 1,683 (91.8%) |
| 35 to 44 Years | 112 (4.3%) | 2,341 (90.8%) |
| 45 to 54 Years | 143 (4.9%) | 2,752 (94.2%) |
| 55 to 64 Years | 161 (4.9%) | 3,176 (97.5%) |
| 65 to 74 Years | 1,389 (86.0%) | 1,104 (68.4%) |
| 75 Years and over | 773 (95.1%) | 417 (51.3%) |
| Total | 3,101 (15.9%) | 17,558 (89.9%) |
Disability Status by Sex by Age in Lake Zurich
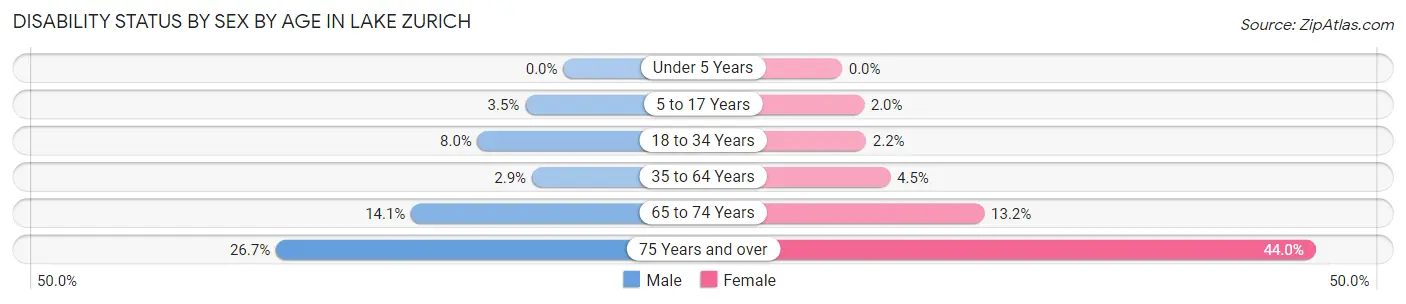
| Age Bracket | Male | Female |
| Under 5 Years | 0 (0.0%) | 0 (0.0%) |
| 5 to 17 Years | 68 (3.5%) | 31 (2.0%) |
| 18 to 34 Years | 145 (8.0%) | 44 (2.2%) |
| 35 to 64 Years | 124 (2.9%) | 202 (4.5%) |
| 65 to 74 Years | 119 (14.1%) | 102 (13.2%) |
| 75 Years and over | 84 (26.7%) | 219 (44.0%) |
Disability Class by Sex by Age in Lake Zurich
Disability Class: Hearing Difficulty
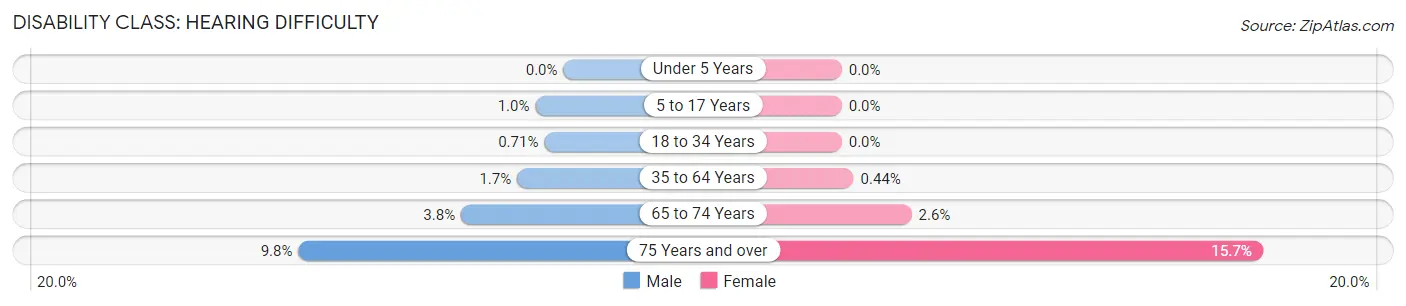
| Age Bracket | Male | Female |
| Under 5 Years | 0 (0.0%) | 0 (0.0%) |
| 5 to 17 Years | 20 (1.0%) | 0 (0.0%) |
| 18 to 34 Years | 13 (0.7%) | 0 (0.0%) |
| 35 to 64 Years | 73 (1.7%) | 20 (0.4%) |
| 65 to 74 Years | 32 (3.8%) | 20 (2.6%) |
| 75 Years and over | 31 (9.8%) | 78 (15.7%) |
Disability Class: Vision Difficulty
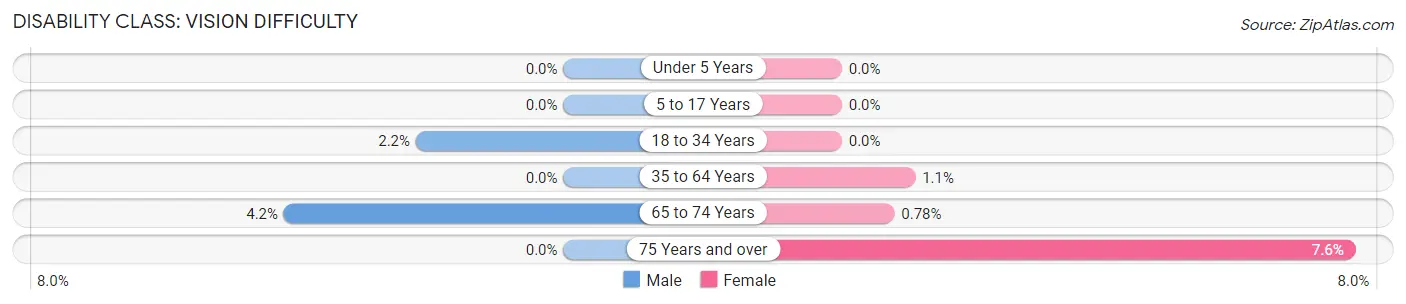
| Age Bracket | Male | Female |
| Under 5 Years | 0 (0.0%) | 0 (0.0%) |
| 5 to 17 Years | 0 (0.0%) | 0 (0.0%) |
| 18 to 34 Years | 40 (2.2%) | 0 (0.0%) |
| 35 to 64 Years | 0 (0.0%) | 49 (1.1%) |
| 65 to 74 Years | 35 (4.2%) | 6 (0.8%) |
| 75 Years and over | 0 (0.0%) | 38 (7.6%) |
Disability Class: Cognitive Difficulty
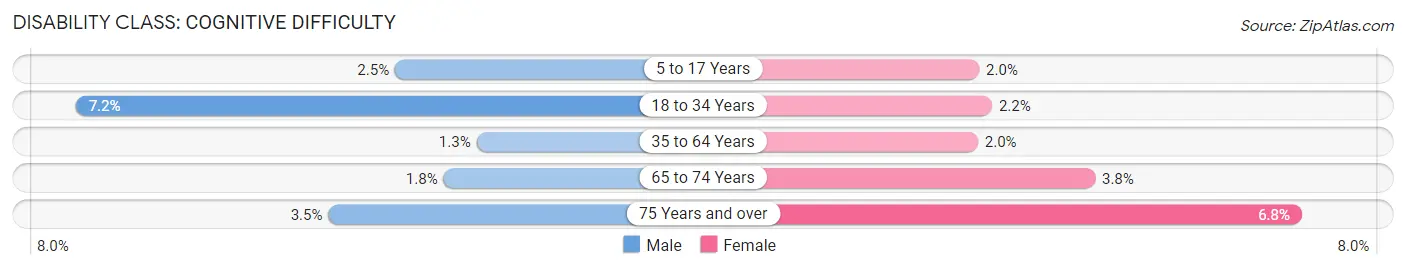
| Age Bracket | Male | Female |
| 5 to 17 Years | 48 (2.5%) | 31 (2.0%) |
| 18 to 34 Years | 132 (7.2%) | 44 (2.2%) |
| 35 to 64 Years | 55 (1.3%) | 91 (2.0%) |
| 65 to 74 Years | 15 (1.8%) | 29 (3.8%) |
| 75 Years and over | 11 (3.5%) | 34 (6.8%) |
Disability Class: Ambulatory Difficulty
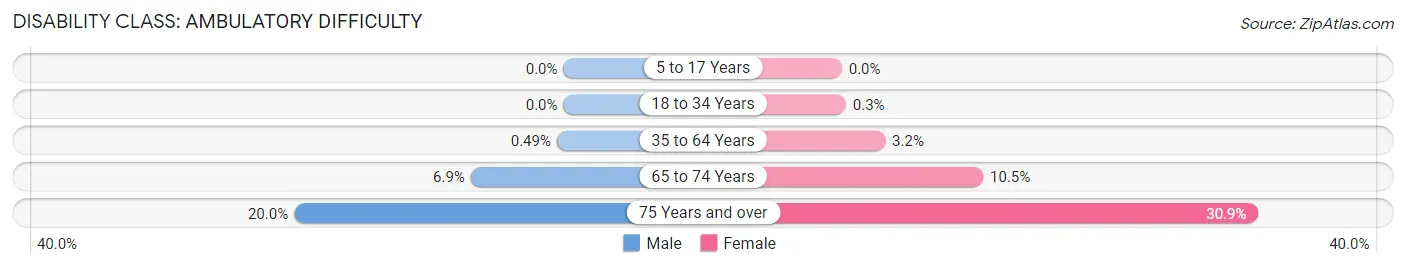
| Age Bracket | Male | Female |
| 5 to 17 Years | 0 (0.0%) | 0 (0.0%) |
| 18 to 34 Years | 0 (0.0%) | 6 (0.3%) |
| 35 to 64 Years | 21 (0.5%) | 145 (3.2%) |
| 65 to 74 Years | 58 (6.9%) | 81 (10.5%) |
| 75 Years and over | 63 (20.0%) | 154 (30.9%) |
Disability Class: Self-Care Difficulty
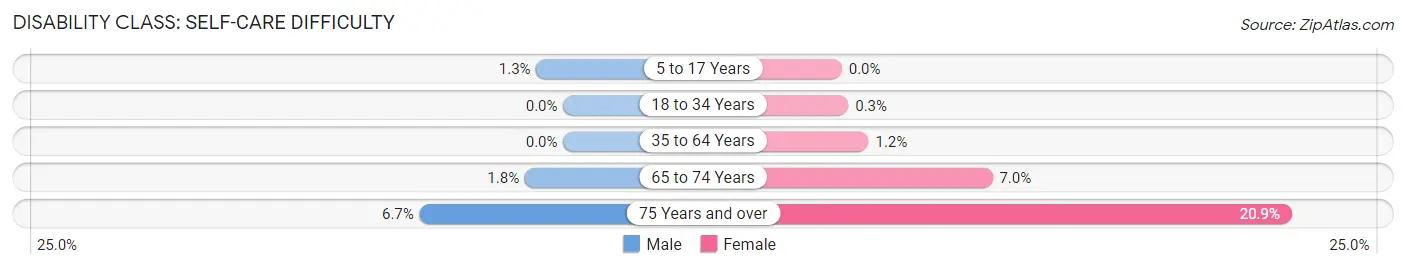
| Age Bracket | Male | Female |
| 5 to 17 Years | 24 (1.3%) | 0 (0.0%) |
| 18 to 34 Years | 0 (0.0%) | 6 (0.3%) |
| 35 to 64 Years | 0 (0.0%) | 56 (1.2%) |
| 65 to 74 Years | 15 (1.8%) | 54 (7.0%) |
| 75 Years and over | 21 (6.7%) | 104 (20.9%) |
Technology Access in Lake Zurich
Computing Device Access in Lake Zurich
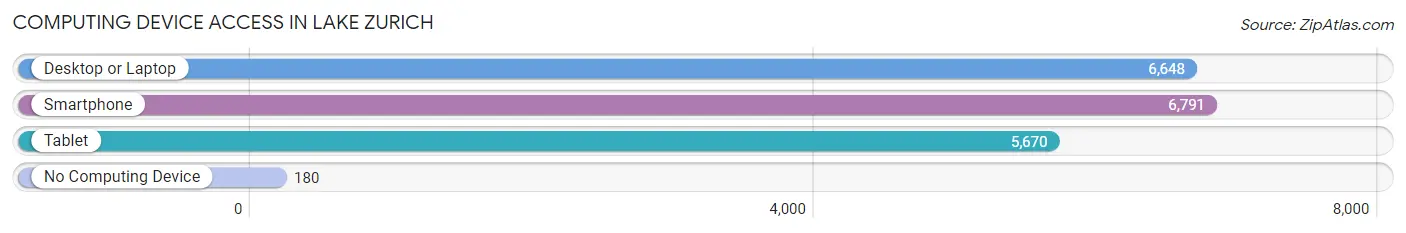
| Device Type | # Households | % Households |
| Desktop or Laptop | 6,648 | 92.7% |
| Smartphone | 6,791 | 94.7% |
| Tablet | 5,670 | 79.0% |
| No Computing Device | 180 | 2.5% |
| Total | 7,173 | 100.0% |
Internet Access in Lake Zurich
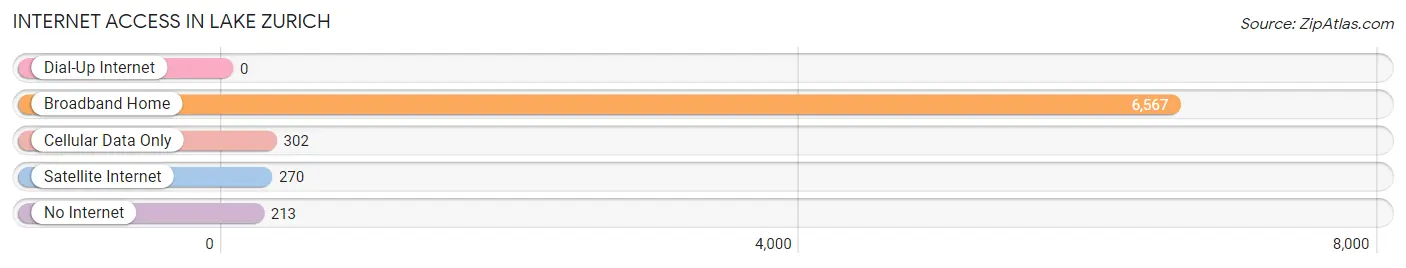
| Internet Type | # Households | % Households |
| Dial-Up Internet | 0 | 0.0% |
| Broadband Home | 6,567 | 91.5% |
| Cellular Data Only | 302 | 4.2% |
| Satellite Internet | 270 | 3.8% |
| No Internet | 213 | 3.0% |
| Total | 7,173 | 100.0% |
Lake Zurich Summary
History
Lake Zurich is a village located in Lake County, Illinois, United States. It is a northern suburb of Chicago, located about 40 miles northwest of the city. The village is situated on the shores of Lake Zurich, a natural glacial lake. The village was first settled in the early 1800s by German immigrants, and was incorporated in 1896.
The village was originally known as Cedar Lake, and was renamed Lake Zurich in 1856. The name was chosen to honor the nearby lake, which was named after the Swiss city of Zurich. The village was a popular summer resort destination in the late 19th and early 20th centuries, and was home to several resorts and hotels.
Geography
Lake Zurich is located in northeastern Illinois, in Lake County. It is situated on the shores of Lake Zurich, a natural glacial lake. The village is bordered by the villages of Barrington, Deer Park, Hawthorn Woods, Kildeer, and Long Grove. The village covers an area of 8.3 square miles, and has a population of 19,631 as of the 2010 census.
The village is located in the Fox River Valley, and is part of the Chicago metropolitan area. The village is located about 40 miles northwest of downtown Chicago, and is accessible via Interstate 94 and U.S. Route 12.
Economy
The economy of Lake Zurich is largely based on tourism and retail. The village is home to several shopping centers, including the Lake Zurich Shopping Center, the Lake Zurich Town Center, and the Lake Zurich Commons. The village is also home to several restaurants, bars, and other businesses.
The village is also home to several manufacturing and industrial businesses, including the Lake Zurich Manufacturing Company, which produces industrial equipment. The village is also home to several technology companies, including the software company, Zebra Technologies.
Demographics
As of the 2010 census, the population of Lake Zurich was 19,631. The racial makeup of the village was 87.3% White, 4.2% Asian, 3.2% African American, and 2.3% Hispanic or Latino. The median household income was $90,945, and the median family income was $103,945.
The village is home to several religious denominations, including Catholic, Lutheran, Methodist, and Presbyterian. The village is also home to several private schools, including Lake Zurich High School, Lake Zurich Middle School, and St. Francis de Sales Catholic School.
Conclusion
Lake Zurich is a village located in Lake County, Illinois, United States. It is a northern suburb of Chicago, located about 40 miles northwest of the city. The village is situated on the shores of Lake Zurich, a natural glacial lake. The village was first settled in the early 1800s by German immigrants, and was incorporated in 1896. The economy of Lake Zurich is largely based on tourism and retail, and the village is home to several manufacturing and industrial businesses. As of the 2010 census, the population of Lake Zurich was 19,631, and the racial makeup of the village was 87.3% White, 4.2% Asian, 3.2% African American, and 2.3% Hispanic or Latino. The village is home to several religious denominations, and is also home to several private schools.
Common Questions
What is Per Capita Income in Lake Zurich?
Per Capita income in Lake Zurich is $59,566.
What is the Median Family Income in Lake Zurich?
Median Family Income in Lake Zurich is $151,888.
What is the Median Household income in Lake Zurich?
Median Household Income in Lake Zurich is $135,211.
What is Income or Wage Gap in Lake Zurich?
Income or Wage Gap in Lake Zurich is 45.4%.
Women in Lake Zurich earn 54.6 cents for every dollar earned by a man.
What is Inequality or Gini Index in Lake Zurich?
Inequality or Gini Index in Lake Zurich is 0.38.
What is the Total Population of Lake Zurich?
Total Population of Lake Zurich is 19,749.
What is the Total Male Population of Lake Zurich?
Total Male Population of Lake Zurich is 9,826.
What is the Total Female Population of Lake Zurich?
Total Female Population of Lake Zurich is 9,923.
What is the Ratio of Males per 100 Females in Lake Zurich?
There are 99.02 Males per 100 Females in Lake Zurich.
What is the Ratio of Females per 100 Males in Lake Zurich?
There are 100.99 Females per 100 Males in Lake Zurich.
What is the Median Population Age in Lake Zurich?
Median Population Age in Lake Zurich is 41.2 Years.
What is the Average Family Size in Lake Zurich
Average Family Size in Lake Zurich is 3.1 People.
What is the Average Household Size in Lake Zurich
Average Household Size in Lake Zurich is 2.7 People.
How Large is the Labor Force in Lake Zurich?
There are 11,664 People in the Labor Forcein in Lake Zurich.
What is the Percentage of People in the Labor Force in Lake Zurich?
74.3% of People are in the Labor Force in Lake Zurich.
What is the Unemployment Rate in Lake Zurich?
Unemployment Rate in Lake Zurich is 3.5%.