North Port, FL Map & Demographics
North Port Map
North Port Overview
$40,064
PER CAPITA INCOME
$88,390
AVG FAMILY INCOME
$78,815
AVG HOUSEHOLD INCOME
25.4%
WAGE / INCOME GAP [ % ]
74.6¢/ $1
WAGE / INCOME GAP [ $ ]
0.42
INEQUALITY / GINI INDEX
76,975
TOTAL POPULATION
37,668
MALE POPULATION
39,307
FEMALE POPULATION
95.83
MALES / 100 FEMALES
104.35
FEMALES / 100 MALES
49.5
MEDIAN AGE
2.9
AVG FAMILY SIZE
2.5
AVG HOUSEHOLD SIZE
33,971
LABOR FORCE [ PEOPLE ]
52.1%
PERCENT IN LABOR FORCE
3.3%
UNEMPLOYMENT RATE
North Port Area Codes
Income in North Port
Income Overview in North Port
Per Capita Income in North Port is $40,064, while median incomes of families and households are $88,390 and $78,815 respectively.
| Characteristic | Number | Measure |
| Per Capita Income | 76,975 | $40,064 |
| Median Family Income | 22,387 | $88,390 |
| Mean Family Income | 22,387 | $108,651 |
| Median Household Income | 30,129 | $78,815 |
| Mean Household Income | 30,129 | $99,396 |
| Income Deficit | 22,387 | $0 |
| Wage / Income Gap (%) | 76,975 | 25.38% |
| Wage / Income Gap ($) | 76,975 | 74.62¢ per $1 |
| Gini / Inequality Index | 76,975 | 0.42 |
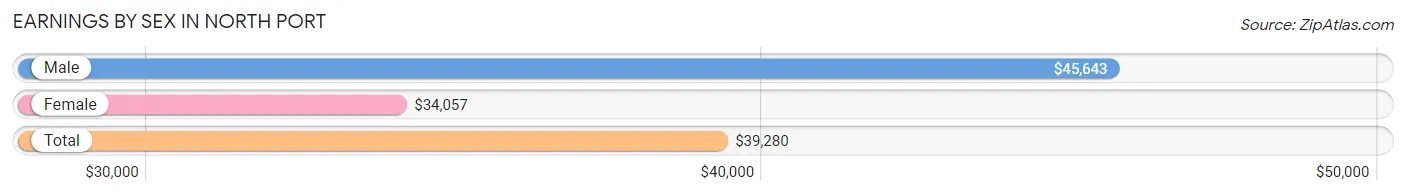
Earnings by Sex in North Port
Average Earnings in North Port are $39,280, $45,643 for men and $34,057 for women, a difference of 25.4%.
| Sex | Number | Average Earnings |
| Male | 18,709 (52.4%) | $45,643 |
| Female | 16,975 (47.6%) | $34,057 |
| Total | 35,684 (100.0%) | $39,280 |
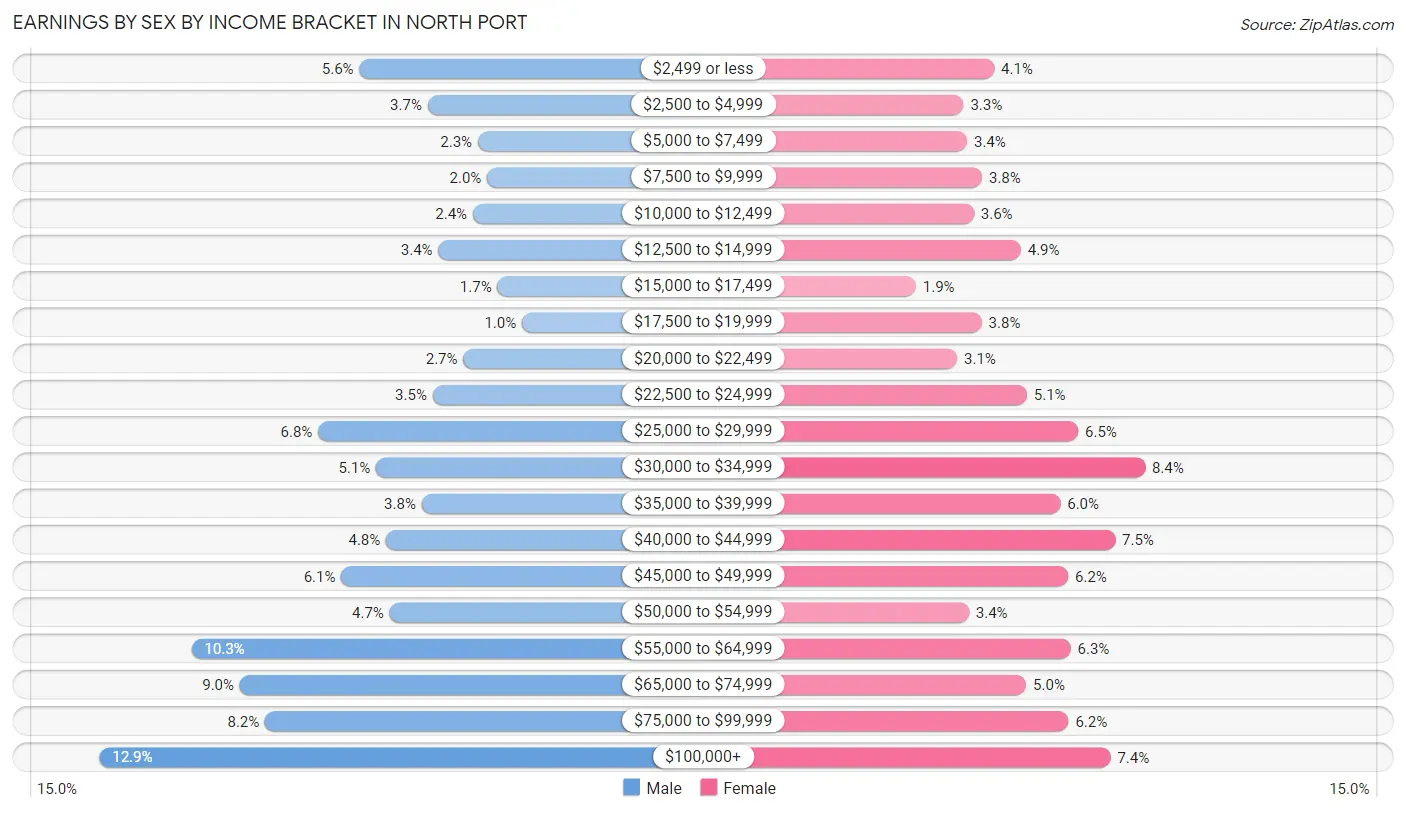
Earnings by Sex by Income Bracket in North Port
The most common earnings brackets in North Port are $100,000+ for men (2,413 | 12.9%) and $30,000 to $34,999 for women (1,423 | 8.4%).
| Income | Male | Female |
| $2,499 or less | 1,046 (5.6%) | 703 (4.1%) |
| $2,500 to $4,999 | 686 (3.7%) | 557 (3.3%) |
| $5,000 to $7,499 | 422 (2.3%) | 574 (3.4%) |
| $7,500 to $9,999 | 374 (2.0%) | 645 (3.8%) |
| $10,000 to $12,499 | 449 (2.4%) | 606 (3.6%) |
| $12,500 to $14,999 | 631 (3.4%) | 830 (4.9%) |
| $15,000 to $17,499 | 319 (1.7%) | 330 (1.9%) |
| $17,500 to $19,999 | 190 (1.0%) | 643 (3.8%) |
| $20,000 to $22,499 | 500 (2.7%) | 527 (3.1%) |
| $22,500 to $24,999 | 661 (3.5%) | 859 (5.1%) |
| $25,000 to $29,999 | 1,263 (6.8%) | 1,104 (6.5%) |
| $30,000 to $34,999 | 958 (5.1%) | 1,423 (8.4%) |
| $35,000 to $39,999 | 718 (3.8%) | 1,018 (6.0%) |
| $40,000 to $44,999 | 905 (4.8%) | 1,280 (7.5%) |
| $45,000 to $49,999 | 1,142 (6.1%) | 1,056 (6.2%) |
| $50,000 to $54,999 | 887 (4.7%) | 583 (3.4%) |
| $55,000 to $64,999 | 1,928 (10.3%) | 1,067 (6.3%) |
| $65,000 to $74,999 | 1,675 (8.9%) | 855 (5.0%) |
| $75,000 to $99,999 | 1,542 (8.2%) | 1,058 (6.2%) |
| $100,000+ | 2,413 (12.9%) | 1,257 (7.4%) |
| Total | 18,709 (100.0%) | 16,975 (100.0%) |
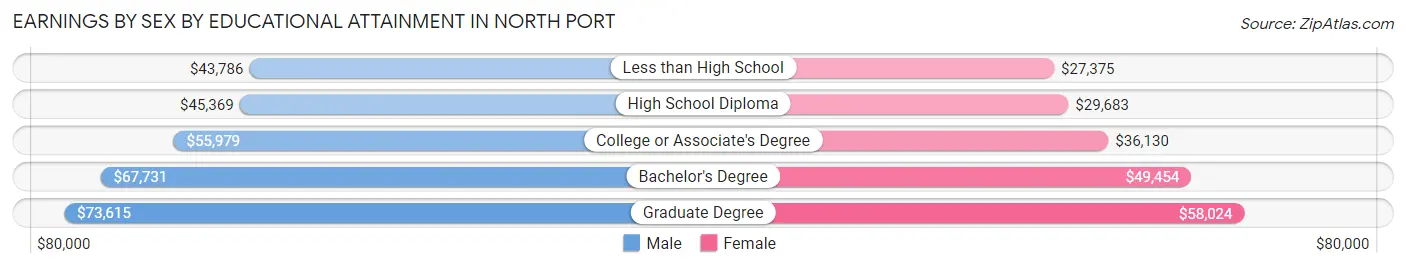
Earnings by Sex by Educational Attainment in North Port
Average earnings in North Port are $52,729 for men and $38,674 for women, a difference of 26.7%. Men with an educational attainment of graduate degree enjoy the highest average annual earnings of $73,615, while those with less than high school education earn the least with $43,786. Women with an educational attainment of graduate degree earn the most with the average annual earnings of $58,024, while those with less than high school education have the smallest earnings of $27,375.
| Educational Attainment | Male Income | Female Income |
| Less than High School | $43,786 | $27,375 |
| High School Diploma | $45,369 | $29,683 |
| College or Associate's Degree | $55,979 | $36,130 |
| Bachelor's Degree | $67,731 | $49,454 |
| Graduate Degree | $73,615 | $58,024 |
| Total | $52,729 | $38,674 |
Family Income in North Port
Family Income Brackets in North Port
According to the North Port family income data, there are 6,134 families falling into the $100,000 to $149,999 income range, which is the most common income bracket and makes up 27.4% of all families. Conversely, the $10,000 to $14,999 income bracket is the least frequent group with only 291 families (1.3%) belonging to this category.
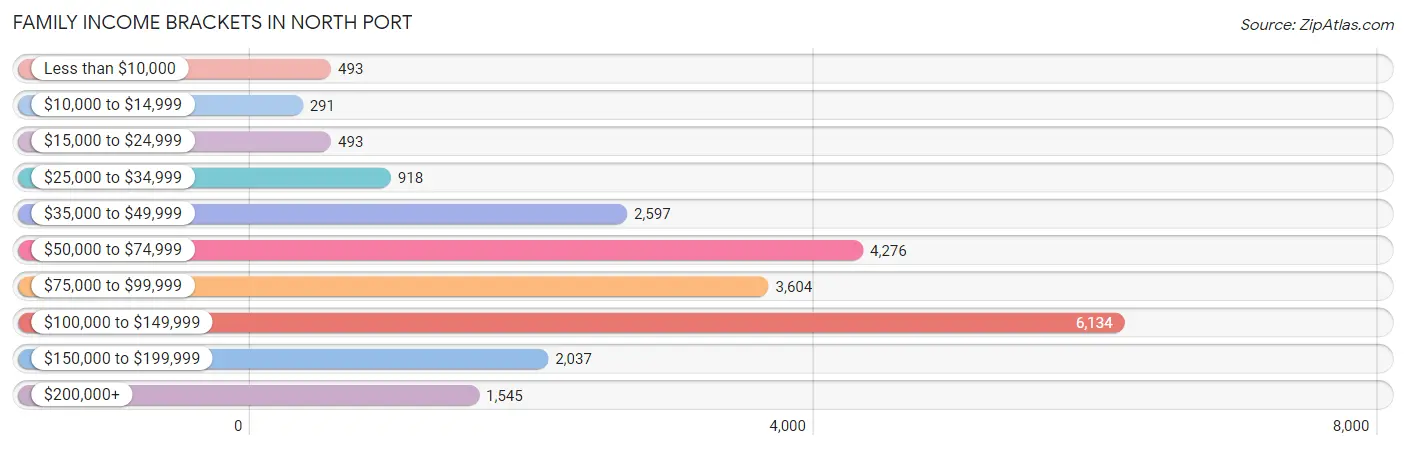
| Income Bracket | # Families | % Families |
| Less than $10,000 | 493 | 2.2% |
| $10,000 to $14,999 | 291 | 1.3% |
| $15,000 to $24,999 | 493 | 2.2% |
| $25,000 to $34,999 | 918 | 4.1% |
| $35,000 to $49,999 | 2,597 | 11.6% |
| $50,000 to $74,999 | 4,276 | 19.1% |
| $75,000 to $99,999 | 3,604 | 16.1% |
| $100,000 to $149,999 | 6,134 | 27.4% |
| $150,000 to $199,999 | 2,037 | 9.1% |
| $200,000+ | 1,545 | 6.9% |
Family Income by Famaliy Size in North Port
6-person families (180 | 0.8%) account for the highest median family income in North Port with $143,068 per family, while 2-person families (13,184 | 58.9%) have the highest median income of $40,432 per family member.
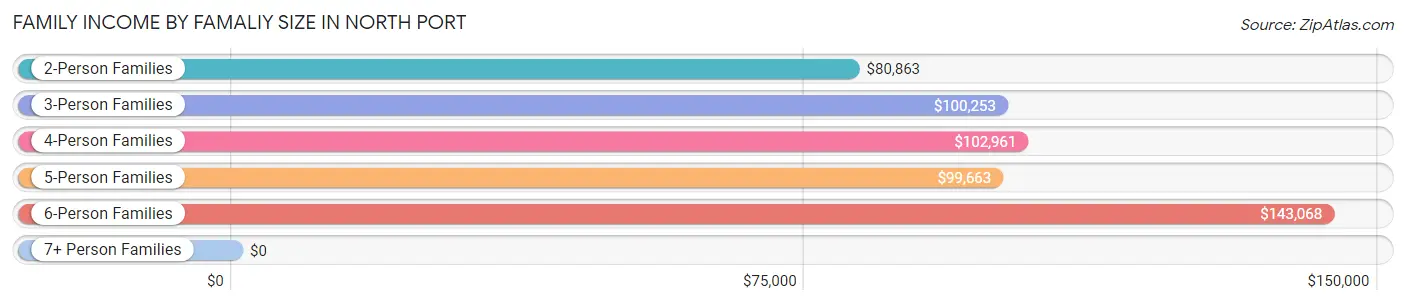
| Income Bracket | # Families | Median Income |
| 2-Person Families | 13,184 (58.9%) | $80,863 |
| 3-Person Families | 4,350 (19.4%) | $100,253 |
| 4-Person Families | 2,926 (13.1%) | $102,961 |
| 5-Person Families | 1,635 (7.3%) | $99,663 |
| 6-Person Families | 180 (0.8%) | $143,068 |
| 7+ Person Families | 112 (0.5%) | $0 |
| Total | 22,387 (100.0%) | $88,390 |
Family Income by Number of Earners in North Port
The median family income in North Port is $88,390, with families comprising 3+ earners (2,302) having the highest median family income of $119,741, while families with 1 earner (5,955) have the lowest median family income of $64,983, accounting for 10.3% and 26.6% of families, respectively.
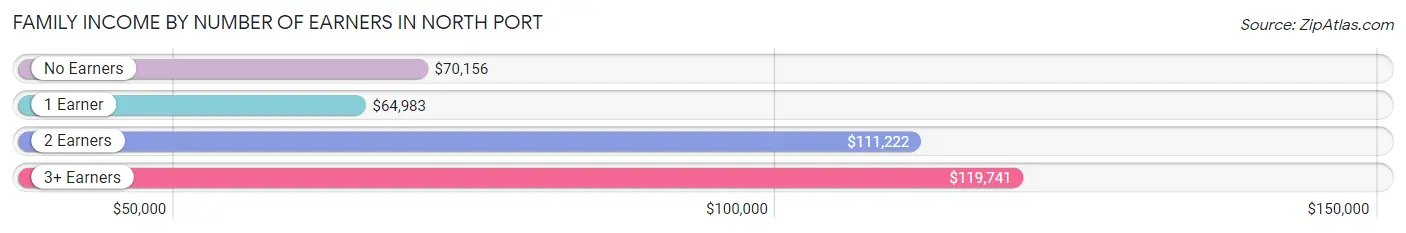
| Number of Earners | # Families | Median Income |
| No Earners | 6,847 (30.6%) | $70,156 |
| 1 Earner | 5,955 (26.6%) | $64,983 |
| 2 Earners | 7,283 (32.5%) | $111,222 |
| 3+ Earners | 2,302 (10.3%) | $119,741 |
| Total | 22,387 (100.0%) | $88,390 |
Household Income in North Port
Household Income Brackets in North Port
With 6,930 households falling in the category, the $100,000 to $149,999 income range is the most frequent in North Port, accounting for 23.0% of all households. In contrast, only 542 households (1.8%) fall into the $10,000 to $14,999 income bracket, making it the least populous group.
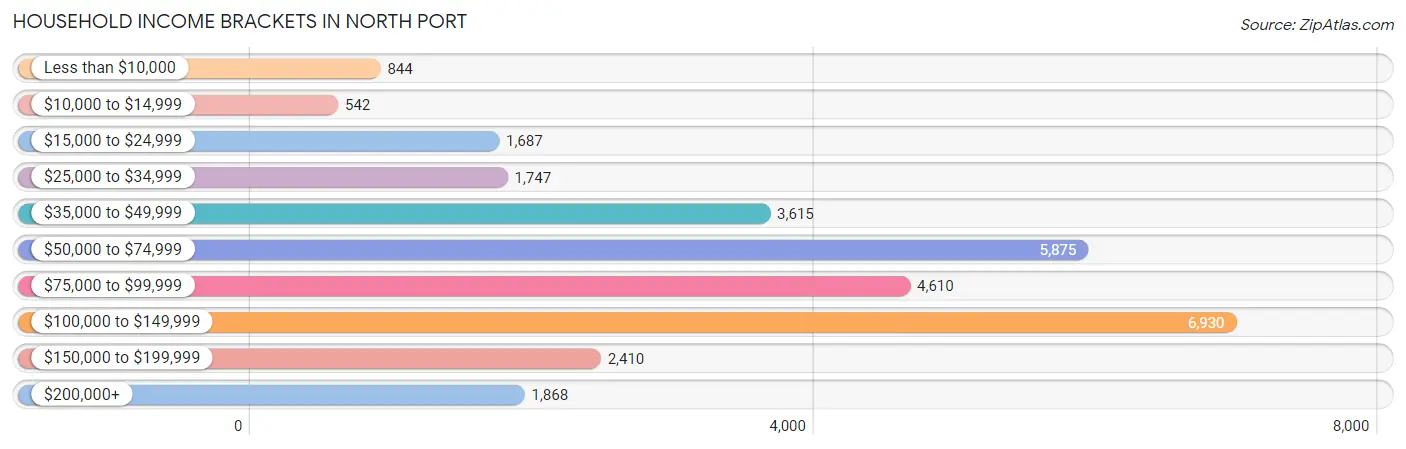
| Income Bracket | # Households | % Households |
| Less than $10,000 | 844 | 2.8% |
| $10,000 to $14,999 | 542 | 1.8% |
| $15,000 to $24,999 | 1,687 | 5.6% |
| $25,000 to $34,999 | 1,747 | 5.8% |
| $35,000 to $49,999 | 3,615 | 12.0% |
| $50,000 to $74,999 | 5,875 | 19.5% |
| $75,000 to $99,999 | 4,610 | 15.3% |
| $100,000 to $149,999 | 6,930 | 23.0% |
| $150,000 to $199,999 | 2,410 | 8.0% |
| $200,000+ | 1,868 | 6.2% |
Household Income by Householder Age in North Port
The median household income in North Port is $78,815, with the highest median household income of $95,978 found in the 45 to 64 years age bracket for the primary householder. A total of 11,273 households (37.4%) fall into this category. Meanwhile, the 15 to 24 years age bracket for the primary householder has the lowest median household income of $0, with 316 households (1.1%) in this group.
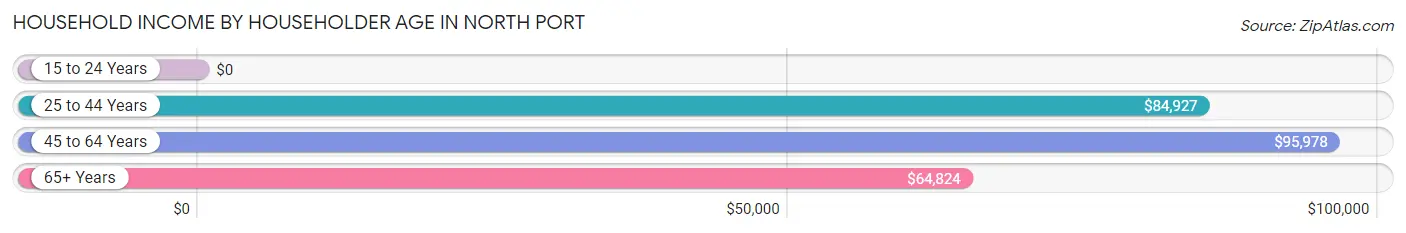
| Income Bracket | # Households | Median Income |
| 15 to 24 Years | 316 (1.1%) | $0 |
| 25 to 44 Years | 6,084 (20.2%) | $84,927 |
| 45 to 64 Years | 11,273 (37.4%) | $95,978 |
| 65+ Years | 12,456 (41.3%) | $64,824 |
| Total | 30,129 (100.0%) | $78,815 |
Poverty in North Port
Income Below Poverty by Sex and Age in North Port
With 6.0% poverty level for males and 6.7% for females among the residents of North Port, 12 to 14 year old males and 55 to 64 year old females are the most vulnerable to poverty, with 221 males (18.6%) and 604 females (9.4%) in their respective age groups living below the poverty level.
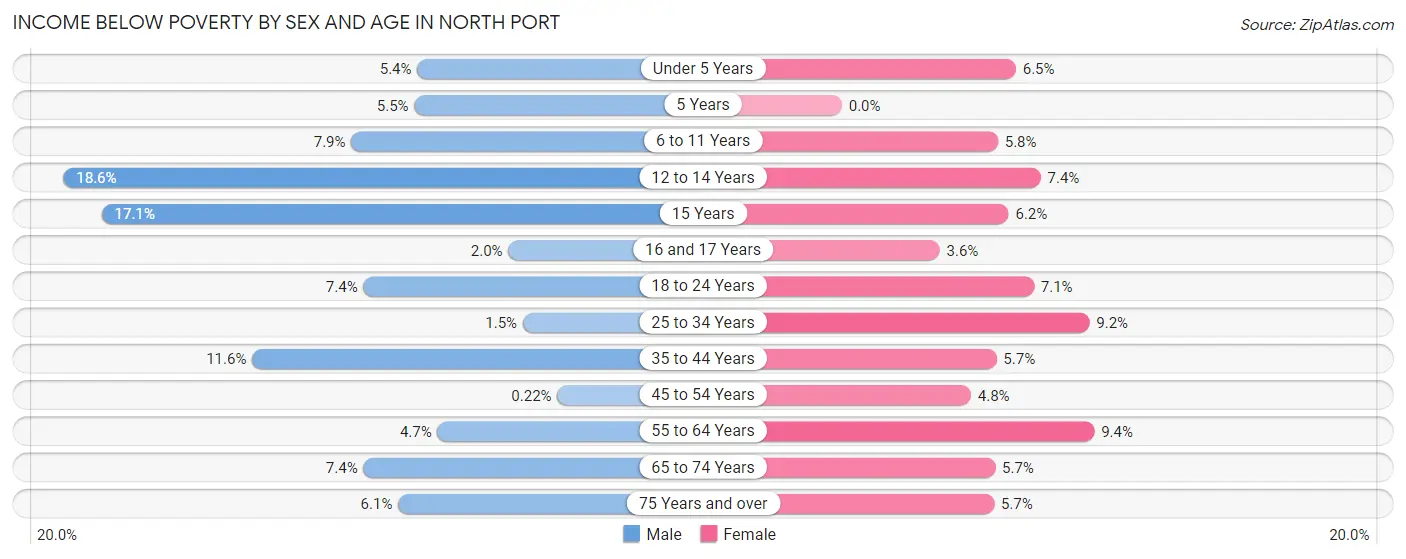
| Age Bracket | Male | Female |
| Under 5 Years | 82 (5.4%) | 148 (6.5%) |
| 5 Years | 12 (5.5%) | 0 (0.0%) |
| 6 to 11 Years | 200 (7.9%) | 127 (5.8%) |
| 12 to 14 Years | 221 (18.6%) | 56 (7.4%) |
| 15 Years | 42 (17.1%) | 18 (6.2%) |
| 16 and 17 Years | 20 (2.0%) | 31 (3.6%) |
| 18 to 24 Years | 264 (7.4%) | 194 (7.1%) |
| 25 to 34 Years | 50 (1.5%) | 366 (9.2%) |
| 35 to 44 Years | 348 (11.6%) | 195 (5.7%) |
| 45 to 54 Years | 10 (0.2%) | 234 (4.8%) |
| 55 to 64 Years | 267 (4.7%) | 604 (9.4%) |
| 65 to 74 Years | 484 (7.4%) | 395 (5.7%) |
| 75 Years and over | 250 (6.1%) | 235 (5.7%) |
| Total | 2,250 (6.0%) | 2,603 (6.7%) |
Income Above Poverty by Sex and Age in North Port
According to the poverty statistics in North Port, males aged 45 to 54 years and females aged 5 years are the age groups that are most secure financially, with 99.8% of males and 100.0% of females in these age groups living above the poverty line.
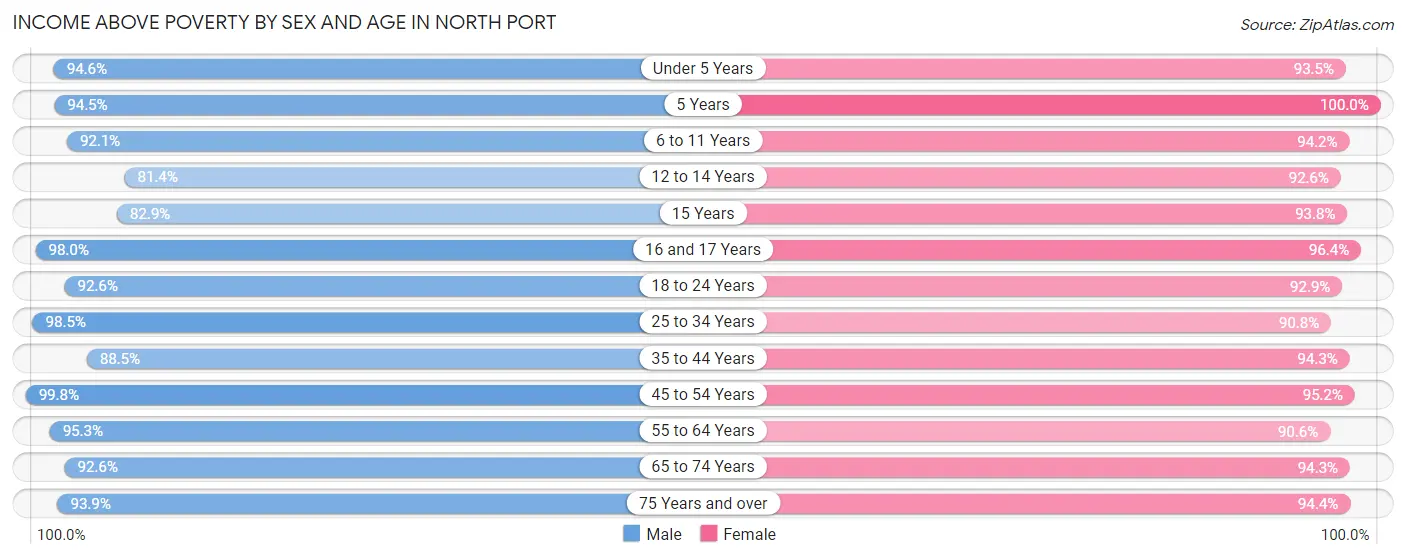
| Age Bracket | Male | Female |
| Under 5 Years | 1,432 (94.6%) | 2,144 (93.5%) |
| 5 Years | 205 (94.5%) | 169 (100.0%) |
| 6 to 11 Years | 2,340 (92.1%) | 2,065 (94.2%) |
| 12 to 14 Years | 970 (81.4%) | 703 (92.6%) |
| 15 Years | 203 (82.9%) | 273 (93.8%) |
| 16 and 17 Years | 958 (98.0%) | 824 (96.4%) |
| 18 to 24 Years | 3,294 (92.6%) | 2,527 (92.9%) |
| 25 to 34 Years | 3,287 (98.5%) | 3,615 (90.8%) |
| 35 to 44 Years | 2,665 (88.4%) | 3,201 (94.3%) |
| 45 to 54 Years | 4,486 (99.8%) | 4,650 (95.2%) |
| 55 to 64 Years | 5,449 (95.3%) | 5,839 (90.6%) |
| 65 to 74 Years | 6,038 (92.6%) | 6,547 (94.3%) |
| 75 Years and over | 3,830 (93.9%) | 3,927 (94.4%) |
| Total | 35,157 (94.0%) | 36,484 (93.3%) |
Income Below Poverty Among Married-Couple Families in North Port
The poverty statistics for married-couple families in North Port show that 3.0% or 549 of the total 17,972 families live below the poverty line. Families with 1 or 2 children have the highest poverty rate of 3.6%, comprising of 126 families. On the other hand, families with 3 or 4 children have the lowest poverty rate of 0.0%, which includes 0 families.
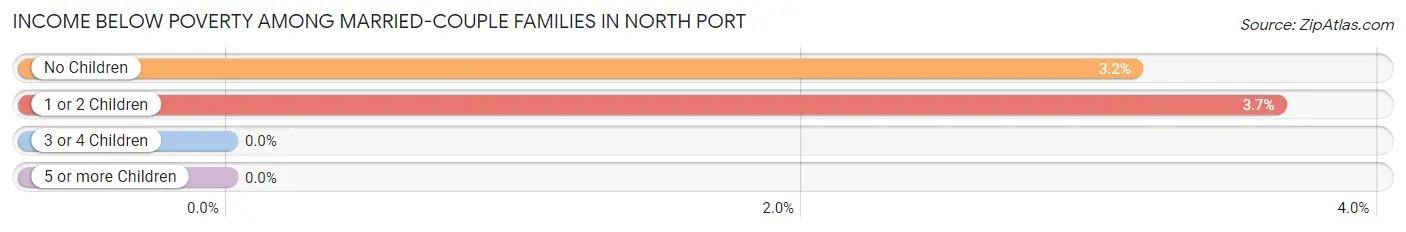
| Children | Above Poverty | Below Poverty |
| No Children | 13,003 (96.9%) | 423 (3.2%) |
| 1 or 2 Children | 3,325 (96.4%) | 126 (3.6%) |
| 3 or 4 Children | 1,070 (100.0%) | 0 (0.0%) |
| 5 or more Children | 25 (100.0%) | 0 (0.0%) |
| Total | 17,423 (97.0%) | 549 (3.0%) |
Income Below Poverty Among Single-Parent Households in North Port
According to the poverty data in North Port, 9.9% or 100 single-father households and 11.3% or 383 single-mother households are living below the poverty line. Among single-father households, those with 1 or 2 children have the highest poverty rate, with 100 households (17.9%) experiencing poverty. Likewise, among single-mother households, those with 5 or more children have the highest poverty rate, with 3 households (100.0%) falling below the poverty line.
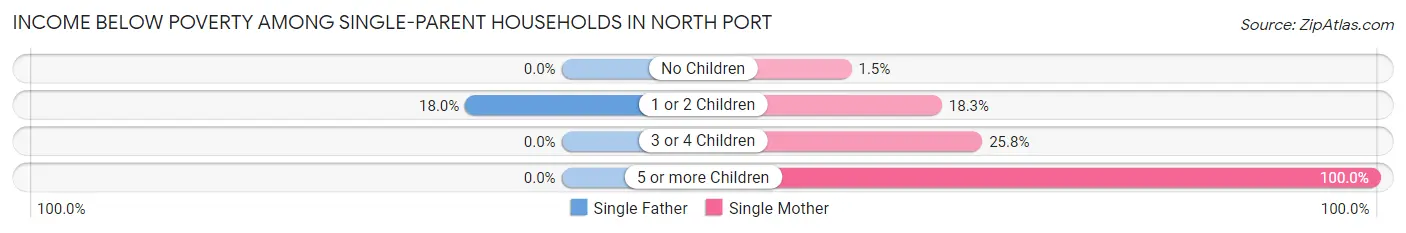
| Children | Single Father | Single Mother |
| No Children | 0 (0.0%) | 22 (1.5%) |
| 1 or 2 Children | 100 (17.9%) | 318 (18.3%) |
| 3 or 4 Children | 0 (0.0%) | 40 (25.8%) |
| 5 or more Children | 0 (0.0%) | 3 (100.0%) |
| Total | 100 (9.9%) | 383 (11.3%) |
Income Below Poverty Among Married-Couple vs Single-Parent Households in North Port
The poverty data for North Port shows that 549 of the married-couple family households (3.0%) and 483 of the single-parent households (10.9%) are living below the poverty level. Within the married-couple family households, those with 1 or 2 children have the highest poverty rate, with 126 households (3.6%) falling below the poverty line. Among the single-parent households, those with 5 or more children have the highest poverty rate, with 3 household (100.0%) living below poverty.
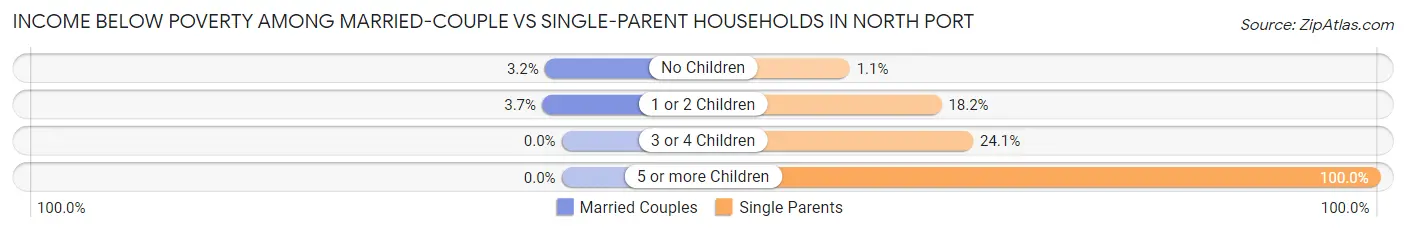
| Children | Married-Couple Families | Single-Parent Households |
| No Children | 423 (3.2%) | 22 (1.1%) |
| 1 or 2 Children | 126 (3.6%) | 418 (18.2%) |
| 3 or 4 Children | 0 (0.0%) | 40 (24.1%) |
| 5 or more Children | 0 (0.0%) | 3 (100.0%) |
| Total | 549 (3.0%) | 483 (10.9%) |
Race in North Port
The most populous races in North Port are White / Caucasian (65,185 | 84.7%), Hispanic or Latino (7,817 | 10.2%), and Two or more Races (4,935 | 6.4%).
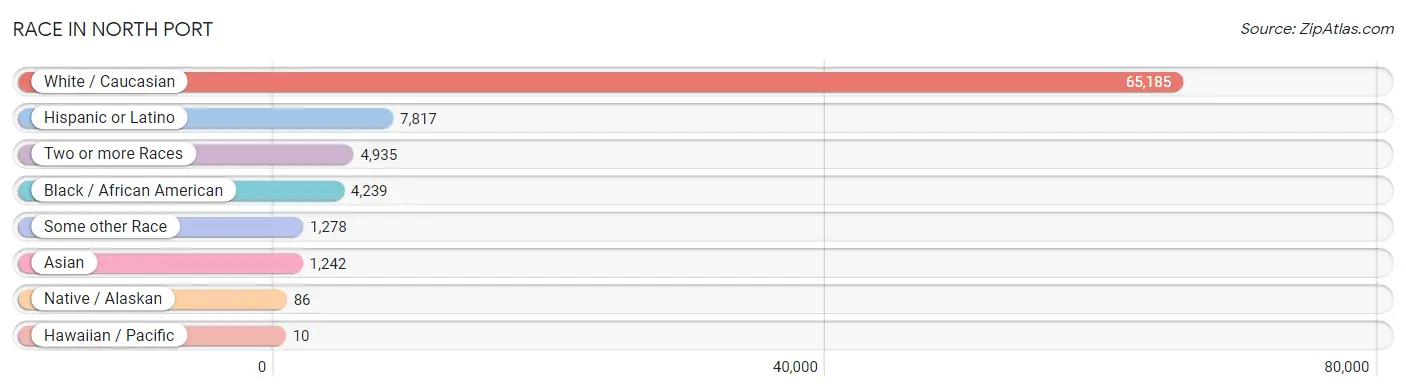
| Race | # Population | % Population |
| Asian | 1,242 | 1.6% |
| Black / African American | 4,239 | 5.5% |
| Hawaiian / Pacific | 10 | 0.0% |
| Hispanic or Latino | 7,817 | 10.2% |
| Native / Alaskan | 86 | 0.1% |
| White / Caucasian | 65,185 | 84.7% |
| Two or more Races | 4,935 | 6.4% |
| Some other Race | 1,278 | 1.7% |
| Total | 76,975 | 100.0% |
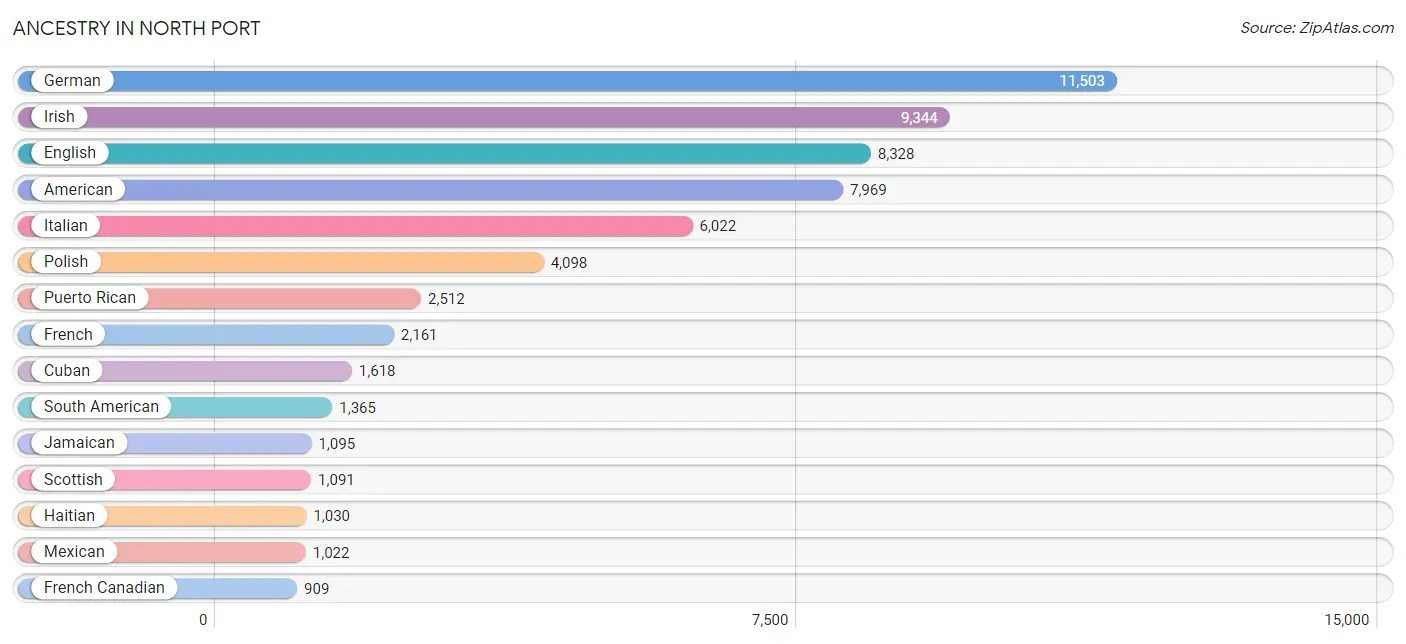
Ancestry in North Port
The most populous ancestries reported in North Port are German (11,503 | 14.9%), Irish (9,344 | 12.1%), English (8,328 | 10.8%), American (7,969 | 10.3%), and Italian (6,022 | 7.8%), together accounting for 56.1% of all North Port residents.
| Ancestry | # Population | % Population |
| African | 194 | 0.3% |
| American | 7,969 | 10.3% |
| Arab | 592 | 0.8% |
| Argentinean | 8 | 0.0% |
| Armenian | 85 | 0.1% |
| Austrian | 152 | 0.2% |
| Bahamian | 104 | 0.1% |
| Belgian | 29 | 0.0% |
| Bhutanese | 11 | 0.0% |
| Brazilian | 40 | 0.1% |
| British | 318 | 0.4% |
| Bulgarian | 87 | 0.1% |
| Burmese | 219 | 0.3% |
| Canadian | 301 | 0.4% |
| Central American | 612 | 0.8% |
| Central American Indian | 94 | 0.1% |
| Cherokee | 350 | 0.4% |
| Chilean | 29 | 0.0% |
| Colombian | 215 | 0.3% |
| Costa Rican | 19 | 0.0% |
| Croatian | 147 | 0.2% |
| Cuban | 1,618 | 2.1% |
| Czech | 195 | 0.3% |
| Czechoslovakian | 40 | 0.1% |
| Danish | 201 | 0.3% |
| Dominican | 212 | 0.3% |
| Dutch | 478 | 0.6% |
| Eastern European | 33 | 0.0% |
| Ecuadorian | 92 | 0.1% |
| English | 8,328 | 10.8% |
| European | 426 | 0.5% |
| Finnish | 146 | 0.2% |
| French | 2,161 | 2.8% |
| French Canadian | 909 | 1.2% |
| German | 11,503 | 14.9% |
| Greek | 172 | 0.2% |
| Guamanian / Chamorro | 25 | 0.0% |
| Guatemalan | 380 | 0.5% |
| Guyanese | 220 | 0.3% |
| Haitian | 1,030 | 1.3% |
| Honduran | 28 | 0.0% |
| Hungarian | 411 | 0.5% |
| Indian (Asian) | 256 | 0.3% |
| Indonesian | 183 | 0.2% |
| Irish | 9,344 | 12.1% |
| Iroquois | 3 | 0.0% |
| Israeli | 16 | 0.0% |
| Italian | 6,022 | 7.8% |
| Jamaican | 1,095 | 1.4% |
| Korean | 549 | 0.7% |
| Laotian | 57 | 0.1% |
| Lebanese | 341 | 0.4% |
| Lithuanian | 399 | 0.5% |
| Maltese | 7 | 0.0% |
| Mexican | 1,022 | 1.3% |
| Mongolian | 16 | 0.0% |
| Nicaraguan | 178 | 0.2% |
| Northern European | 23 | 0.0% |
| Norwegian | 373 | 0.5% |
| Pakistani | 183 | 0.2% |
| Palestinian | 155 | 0.2% |
| Paraguayan | 22 | 0.0% |
| Pennsylvania German | 68 | 0.1% |
| Peruvian | 874 | 1.1% |
| Polish | 4,098 | 5.3% |
| Portuguese | 606 | 0.8% |
| Puerto Rican | 2,512 | 3.3% |
| Romanian | 79 | 0.1% |
| Russian | 884 | 1.1% |
| Salvadoran | 7 | 0.0% |
| Scandinavian | 141 | 0.2% |
| Scotch-Irish | 476 | 0.6% |
| Scottish | 1,091 | 1.4% |
| Serbian | 89 | 0.1% |
| Slavic | 91 | 0.1% |
| Slovak | 412 | 0.5% |
| Slovene | 17 | 0.0% |
| South American | 1,365 | 1.8% |
| South American Indian | 18 | 0.0% |
| Spaniard | 92 | 0.1% |
| Spanish | 108 | 0.1% |
| Sri Lankan | 44 | 0.1% |
| Subsaharan African | 194 | 0.3% |
| Swedish | 741 | 1.0% |
| Swiss | 139 | 0.2% |
| Syrian | 94 | 0.1% |
| Thai | 115 | 0.2% |
| Trinidadian and Tobagonian | 34 | 0.0% |
| Turkish | 34 | 0.0% |
| Ukrainian | 828 | 1.1% |
| Venezuelan | 125 | 0.2% |
| Welsh | 485 | 0.6% |
| West Indian | 21 | 0.0% |
| Yugoslavian | 27 | 0.0% | View All 94 Rows |
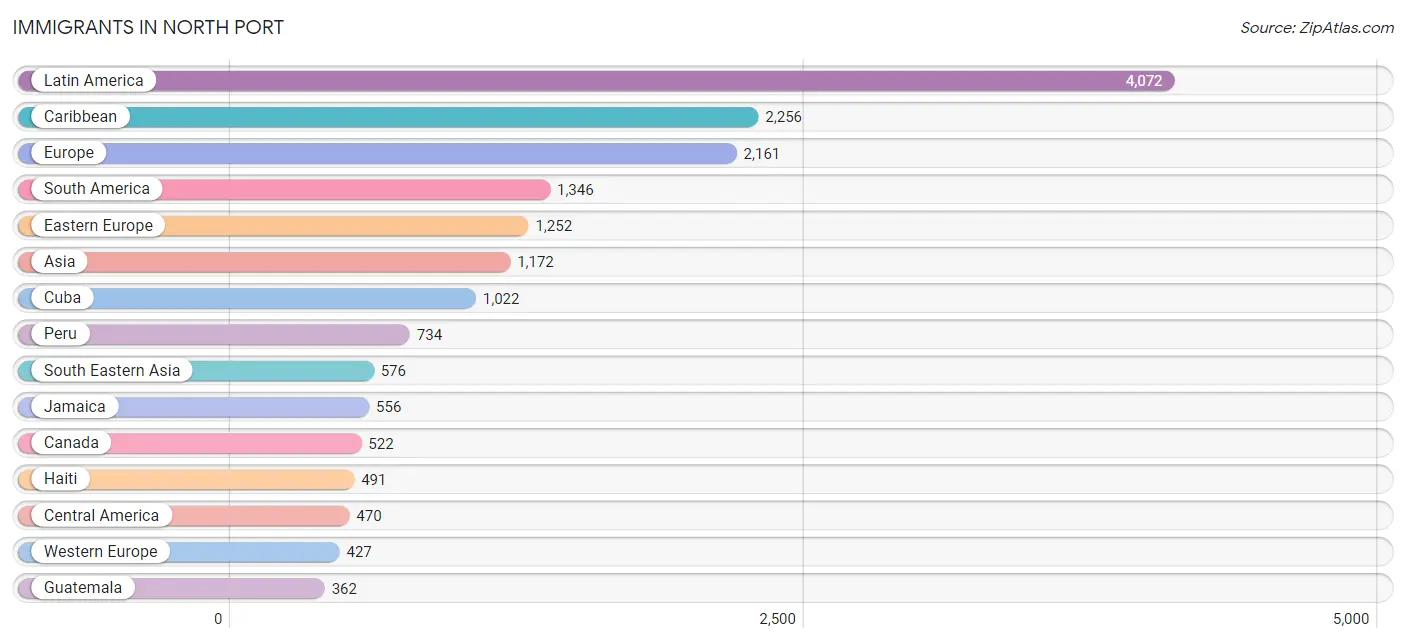
Immigrants in North Port
The most numerous immigrant groups reported in North Port came from Latin America (4,072 | 5.3%), Caribbean (2,256 | 2.9%), Europe (2,161 | 2.8%), South America (1,346 | 1.8%), and Eastern Europe (1,252 | 1.6%), together accounting for 14.4% of all North Port residents.
| Immigration Origin | # Population | % Population |
| Africa | 33 | 0.0% |
| Asia | 1,172 | 1.5% |
| Austria | 47 | 0.1% |
| Bahamas | 54 | 0.1% |
| Belarus | 47 | 0.1% |
| Belgium | 10 | 0.0% |
| Bolivia | 131 | 0.2% |
| Brazil | 10 | 0.0% |
| Bulgaria | 39 | 0.1% |
| Cabo Verde | 33 | 0.0% |
| Canada | 522 | 0.7% |
| Caribbean | 2,256 | 2.9% |
| Central America | 470 | 0.6% |
| Chile | 29 | 0.0% |
| China | 47 | 0.1% |
| Colombia | 127 | 0.2% |
| Cuba | 1,022 | 1.3% |
| Czechoslovakia | 193 | 0.3% |
| Dominican Republic | 69 | 0.1% |
| Eastern Asia | 101 | 0.1% |
| Eastern Europe | 1,252 | 1.6% |
| Ecuador | 66 | 0.1% |
| England | 145 | 0.2% |
| Europe | 2,161 | 2.8% |
| France | 60 | 0.1% |
| Germany | 300 | 0.4% |
| Guatemala | 362 | 0.5% |
| Guyana | 114 | 0.2% |
| Haiti | 491 | 0.6% |
| Honduras | 16 | 0.0% |
| Hungary | 49 | 0.1% |
| India | 98 | 0.1% |
| Indonesia | 63 | 0.1% |
| Israel | 23 | 0.0% |
| Italy | 81 | 0.1% |
| Jamaica | 556 | 0.7% |
| Jordan | 82 | 0.1% |
| Kazakhstan | 43 | 0.1% |
| Korea | 54 | 0.1% |
| Latin America | 4,072 | 5.3% |
| Latvia | 2 | 0.0% |
| Lebanon | 61 | 0.1% |
| Malaysia | 16 | 0.0% |
| Mexico | 42 | 0.1% |
| Moldova | 58 | 0.1% |
| Nicaragua | 50 | 0.1% |
| Northern Europe | 207 | 0.3% |
| Peru | 734 | 0.9% |
| Philippines | 177 | 0.2% |
| Poland | 200 | 0.3% |
| Portugal | 130 | 0.2% |
| Romania | 13 | 0.0% |
| Russia | 264 | 0.3% |
| Scotland | 48 | 0.1% |
| Serbia | 30 | 0.0% |
| South America | 1,346 | 1.8% |
| South Central Asia | 169 | 0.2% |
| South Eastern Asia | 576 | 0.7% |
| Southern Europe | 275 | 0.4% |
| Spain | 57 | 0.1% |
| Switzerland | 10 | 0.0% |
| Syria | 63 | 0.1% |
| Thailand | 146 | 0.2% |
| Trinidad and Tobago | 64 | 0.1% |
| Ukraine | 265 | 0.3% |
| Uzbekistan | 28 | 0.0% |
| Venezuela | 135 | 0.2% |
| Vietnam | 44 | 0.1% |
| Western Africa | 33 | 0.0% |
| Western Asia | 229 | 0.3% |
| Western Europe | 427 | 0.5% | View All 71 Rows |
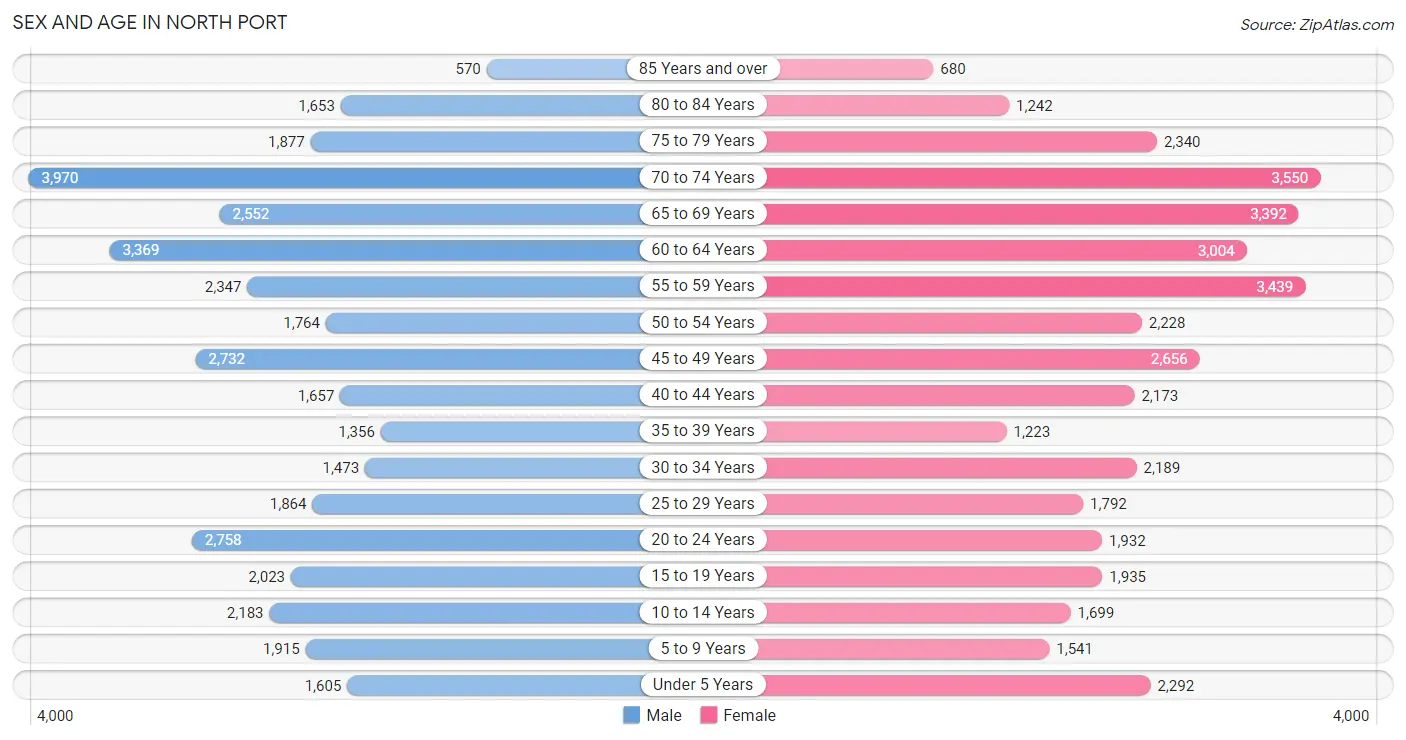
Sex and Age in North Port
Sex and Age in North Port
The most populous age groups in North Port are 70 to 74 Years (3,970 | 10.5%) for men and 70 to 74 Years (3,550 | 9.0%) for women.
| Age Bracket | Male | Female |
| Under 5 Years | 1,605 (4.3%) | 2,292 (5.8%) |
| 5 to 9 Years | 1,915 (5.1%) | 1,541 (3.9%) |
| 10 to 14 Years | 2,183 (5.8%) | 1,699 (4.3%) |
| 15 to 19 Years | 2,023 (5.4%) | 1,935 (4.9%) |
| 20 to 24 Years | 2,758 (7.3%) | 1,932 (4.9%) |
| 25 to 29 Years | 1,864 (5.0%) | 1,792 (4.6%) |
| 30 to 34 Years | 1,473 (3.9%) | 2,189 (5.6%) |
| 35 to 39 Years | 1,356 (3.6%) | 1,223 (3.1%) |
| 40 to 44 Years | 1,657 (4.4%) | 2,173 (5.5%) |
| 45 to 49 Years | 2,732 (7.2%) | 2,656 (6.8%) |
| 50 to 54 Years | 1,764 (4.7%) | 2,228 (5.7%) |
| 55 to 59 Years | 2,347 (6.2%) | 3,439 (8.7%) |
| 60 to 64 Years | 3,369 (8.9%) | 3,004 (7.6%) |
| 65 to 69 Years | 2,552 (6.8%) | 3,392 (8.6%) |
| 70 to 74 Years | 3,970 (10.5%) | 3,550 (9.0%) |
| 75 to 79 Years | 1,877 (5.0%) | 2,340 (5.9%) |
| 80 to 84 Years | 1,653 (4.4%) | 1,242 (3.2%) |
| 85 Years and over | 570 (1.5%) | 680 (1.7%) |
| Total | 37,668 (100.0%) | 39,307 (100.0%) |
Families and Households in North Port
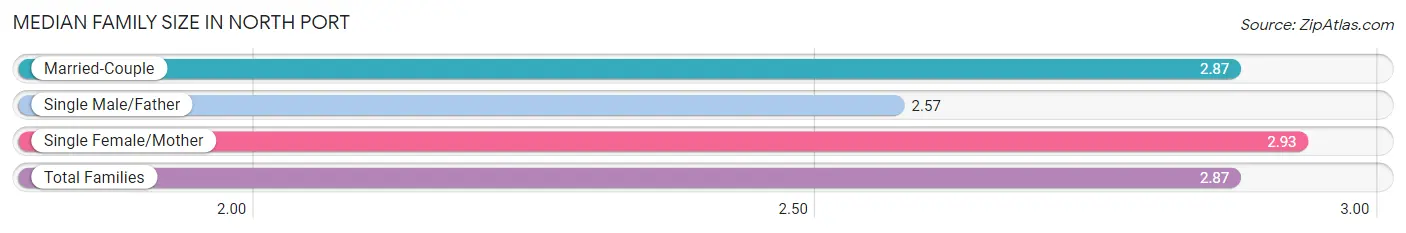
Median Family Size in North Port
The median family size in North Port is 2.87 persons per family, with single female/mother families (3,400 | 15.2%) accounting for the largest median family size of 2.93 persons per family. On the other hand, single male/father families (1,015 | 4.5%) represent the smallest median family size with 2.57 persons per family.
| Family Type | # Families | Family Size |
| Married-Couple | 17,972 (80.3%) | 2.87 |
| Single Male/Father | 1,015 (4.5%) | 2.57 |
| Single Female/Mother | 3,400 (15.2%) | 2.93 |
| Total Families | 22,387 (100.0%) | 2.87 |
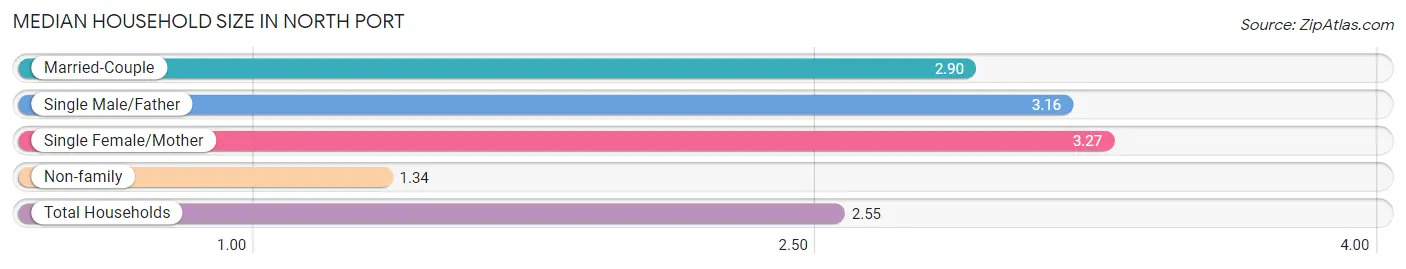
Median Household Size in North Port
The median household size in North Port is 2.55 persons per household, with single female/mother households (3,400 | 11.3%) accounting for the largest median household size of 3.27 persons per household. non-family households (7,742 | 25.7%) represent the smallest median household size with 1.34 persons per household.
| Household Type | # Households | Household Size |
| Married-Couple | 17,972 (59.7%) | 2.90 |
| Single Male/Father | 1,015 (3.4%) | 3.16 |
| Single Female/Mother | 3,400 (11.3%) | 3.27 |
| Non-family | 7,742 (25.7%) | 1.34 |
| Total Households | 30,129 (100.0%) | 2.55 |
Household Size by Marriage Status in North Port
Out of a total of 30,129 households in North Port, 22,387 (74.3%) are family households, while 7,742 (25.7%) are nonfamily households. The most numerous type of family households are 2-person households, comprising 12,724, and the most common type of nonfamily households are 1-person households, comprising 5,443.
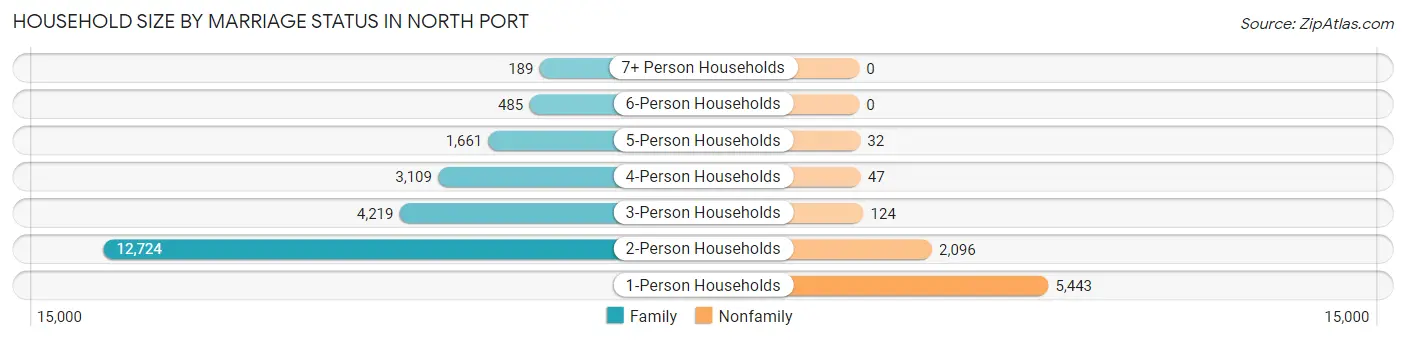
| Household Size | Family Households | Nonfamily Households |
| 1-Person Households | - | 5,443 (18.1%) |
| 2-Person Households | 12,724 (42.2%) | 2,096 (7.0%) |
| 3-Person Households | 4,219 (14.0%) | 124 (0.4%) |
| 4-Person Households | 3,109 (10.3%) | 47 (0.2%) |
| 5-Person Households | 1,661 (5.5%) | 32 (0.1%) |
| 6-Person Households | 485 (1.6%) | 0 (0.0%) |
| 7+ Person Households | 189 (0.6%) | 0 (0.0%) |
| Total | 22,387 (74.3%) | 7,742 (25.7%) |
Female Fertility in North Port
Fertility by Age in North Port
Average fertility rate in North Port is 54.0 births per 1,000 women. Women in the age bracket of 20 to 34 years have the highest fertility rate with 115.0 births per 1,000 women. Women in the age bracket of 20 to 34 years acount for 88.8% of all women with births.
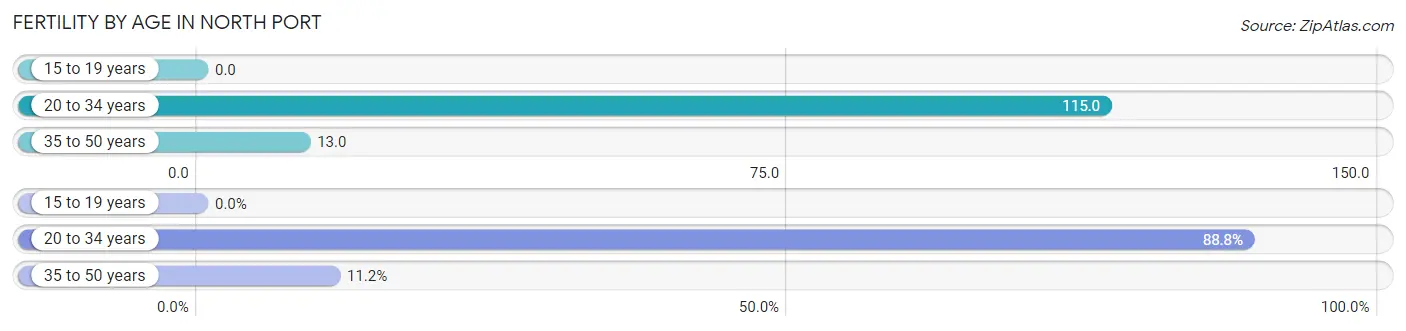
| Age Bracket | Women with Births | Births / 1,000 Women |
| 15 to 19 years | 0 (0.0%) | 0.0 |
| 20 to 34 years | 682 (88.8%) | 115.0 |
| 35 to 50 years | 86 (11.2%) | 13.0 |
| Total | 768 (100.0%) | 54.0 |
Fertility by Age by Marriage Status in North Port
70.3% of women with births (768) in North Port are married. The highest percentage of unmarried women with births falls into 20 to 34 years age bracket with 31.8% of them unmarried at the time of birth, while the lowest percentage of unmarried women with births belong to 35 to 50 years age bracket with 12.8% of them unmarried.
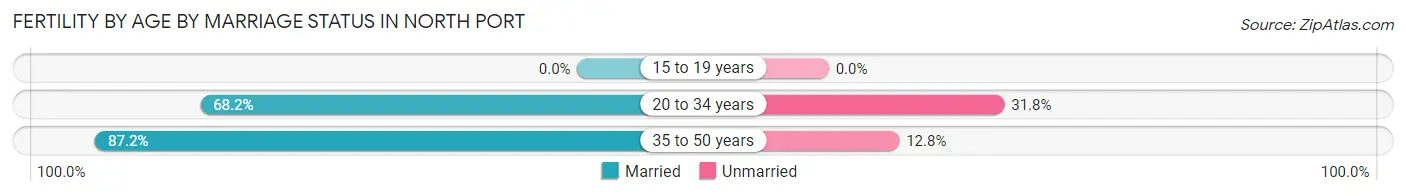
| Age Bracket | Married | Unmarried |
| 15 to 19 years | 0 (0.0%) | 0 (0.0%) |
| 20 to 34 years | 465 (68.2%) | 217 (31.8%) |
| 35 to 50 years | 75 (87.2%) | 11 (12.8%) |
| Total | 540 (70.3%) | 228 (29.7%) |
Fertility by Education in North Port
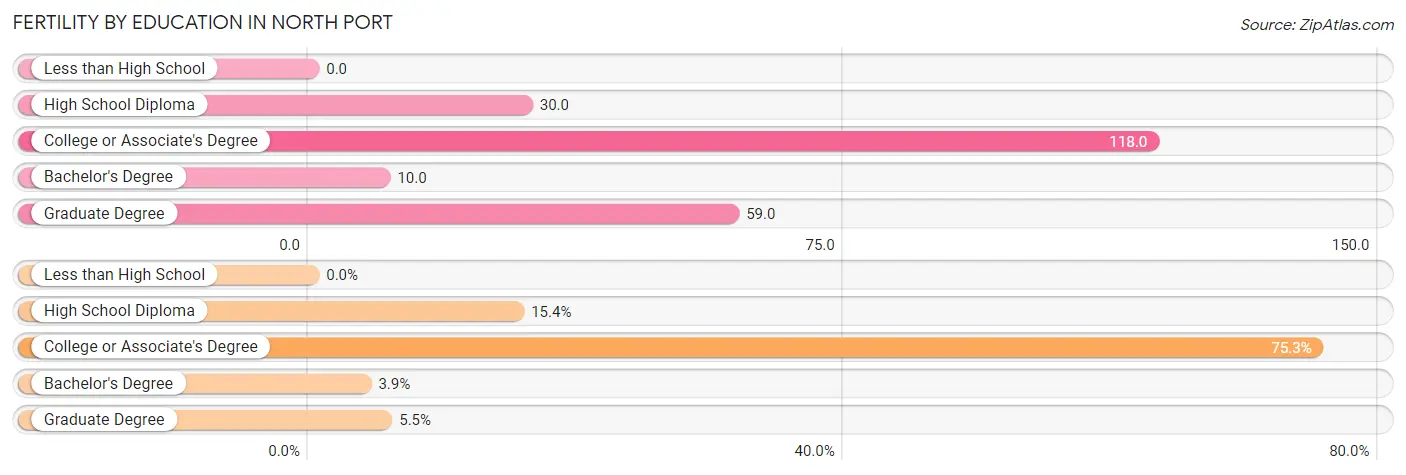
| Educational Attainment | Women with Births | Births / 1,000 Women |
| Less than High School | 0 (0.0%) | 0.0 |
| High School Diploma | 118 (15.4%) | 30.0 |
| College or Associate's Degree | 578 (75.3%) | 118.0 |
| Bachelor's Degree | 30 (3.9%) | 10.0 |
| Graduate Degree | 42 (5.5%) | 59.0 |
| Total | 768 (100.0%) | 54.0 |
Fertility by Education by Marriage Status in North Port
29.7% of women with births in North Port are unmarried. Women with the educational attainment of bachelor's degree are most likely to be married with 100.0% of them married at childbirth, while women with the educational attainment of high school diploma are least likely to be married with 43.2% of them unmarried at childbirth.
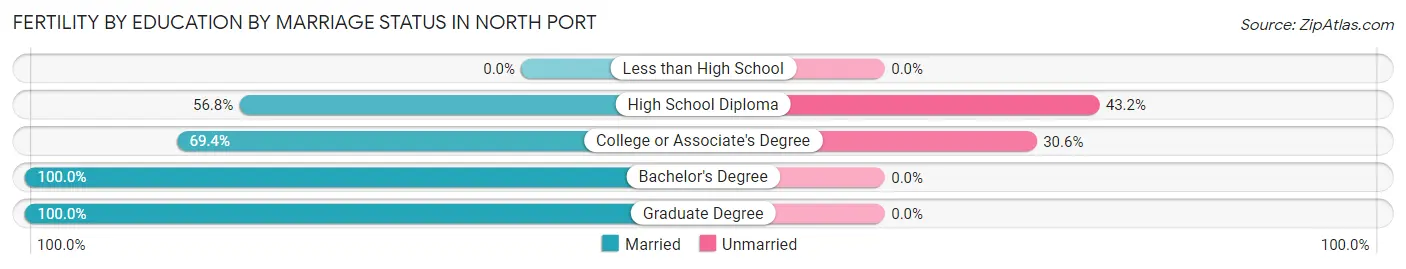
| Educational Attainment | Married | Unmarried |
| Less than High School | 0 (0.0%) | 0 (0.0%) |
| High School Diploma | 67 (56.8%) | 51 (43.2%) |
| College or Associate's Degree | 401 (69.4%) | 177 (30.6%) |
| Bachelor's Degree | 30 (100.0%) | 0 (0.0%) |
| Graduate Degree | 42 (100.0%) | 0 (0.0%) |
| Total | 540 (70.3%) | 228 (29.7%) |
Employment Characteristics in North Port
Employment by Class of Employer in North Port
Among the 32,029 employed individuals in North Port, private company employees (21,921 | 68.4%), self-employed (incorporated) (2,807 | 8.8%), and local government employees (2,783 | 8.7%) make up the most common classes of employment.
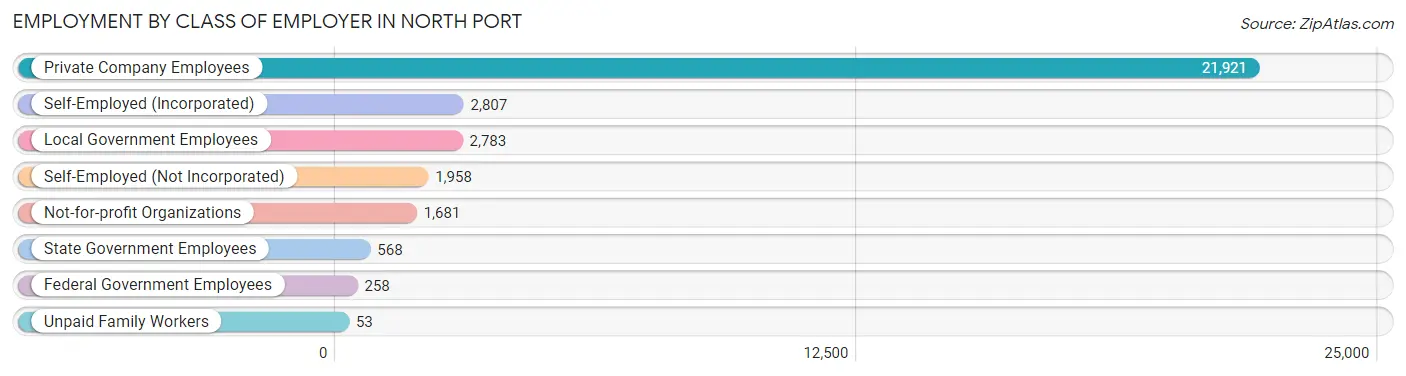
| Employer Class | # Employees | % Employees |
| Private Company Employees | 21,921 | 68.4% |
| Self-Employed (Incorporated) | 2,807 | 8.8% |
| Self-Employed (Not Incorporated) | 1,958 | 6.1% |
| Not-for-profit Organizations | 1,681 | 5.2% |
| Local Government Employees | 2,783 | 8.7% |
| State Government Employees | 568 | 1.8% |
| Federal Government Employees | 258 | 0.8% |
| Unpaid Family Workers | 53 | 0.2% |
| Total | 32,029 | 100.0% |
Employment Status by Age in North Port
According to the labor force statistics for North Port, out of the total population over 16 years of age (65,204), 52.1% or 33,971 individuals are in the labor force, with 3.3% or 1,121 of them unemployed. The age group with the highest labor force participation rate is 25 to 29 years, with 90.8% or 3,320 individuals in the labor force. Within the labor force, the 16 to 19 years age range has the highest percentage of unemployed individuals, with 11.3% or 189 of them being unemployed.
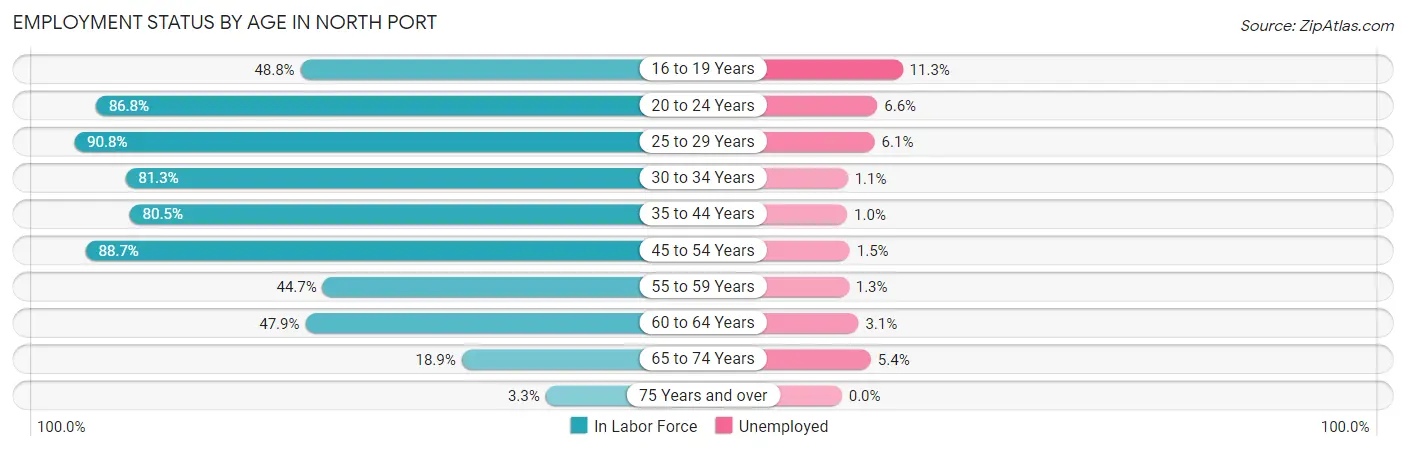
| Age Bracket | In Labor Force | Unemployed |
| 16 to 19 Years | 1,670 (48.8%) | 189 (11.3%) |
| 20 to 24 Years | 4,071 (86.8%) | 269 (6.6%) |
| 25 to 29 Years | 3,320 (90.8%) | 203 (6.1%) |
| 30 to 34 Years | 2,977 (81.3%) | 33 (1.1%) |
| 35 to 44 Years | 5,159 (80.5%) | 52 (1.0%) |
| 45 to 54 Years | 8,320 (88.7%) | 125 (1.5%) |
| 55 to 59 Years | 2,586 (44.7%) | 34 (1.3%) |
| 60 to 64 Years | 3,053 (47.9%) | 95 (3.1%) |
| 65 to 74 Years | 2,545 (18.9%) | 137 (5.4%) |
| 75 Years and over | 276 (3.3%) | 0 (0.0%) |
| Total | 33,971 (52.1%) | 1,121 (3.3%) |
Employment Status by Educational Attainment in North Port
According to labor force statistics for North Port, 72.1% of individuals (25,427) out of the total population between 25 and 64 years of age (35,266) are in the labor force, with 2.1% or 534 of them being unemployed. The group with the highest labor force participation rate are those with the educational attainment of bachelor's degree or higher, with 78.1% or 6,785 individuals in the labor force. Within the labor force, individuals with college / associate degree education have the highest percentage of unemployment, with 3.2% or 319 of them being unemployed.
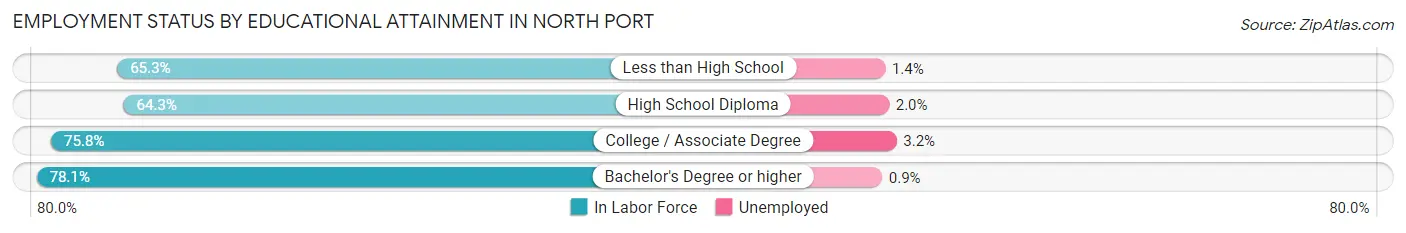
| Educational Attainment | In Labor Force | Unemployed |
| Less than High School | 1,584 (65.3%) | 34 (1.4%) |
| High School Diploma | 7,064 (64.3%) | 220 (2.0%) |
| College / Associate Degree | 9,980 (75.8%) | 421 (3.2%) |
| Bachelor's Degree or higher | 6,785 (78.1%) | 78 (0.9%) |
| Total | 25,427 (72.1%) | 741 (2.1%) |
Employment Occupations by Sex in North Port
Management, Business, Science and Arts Occupations
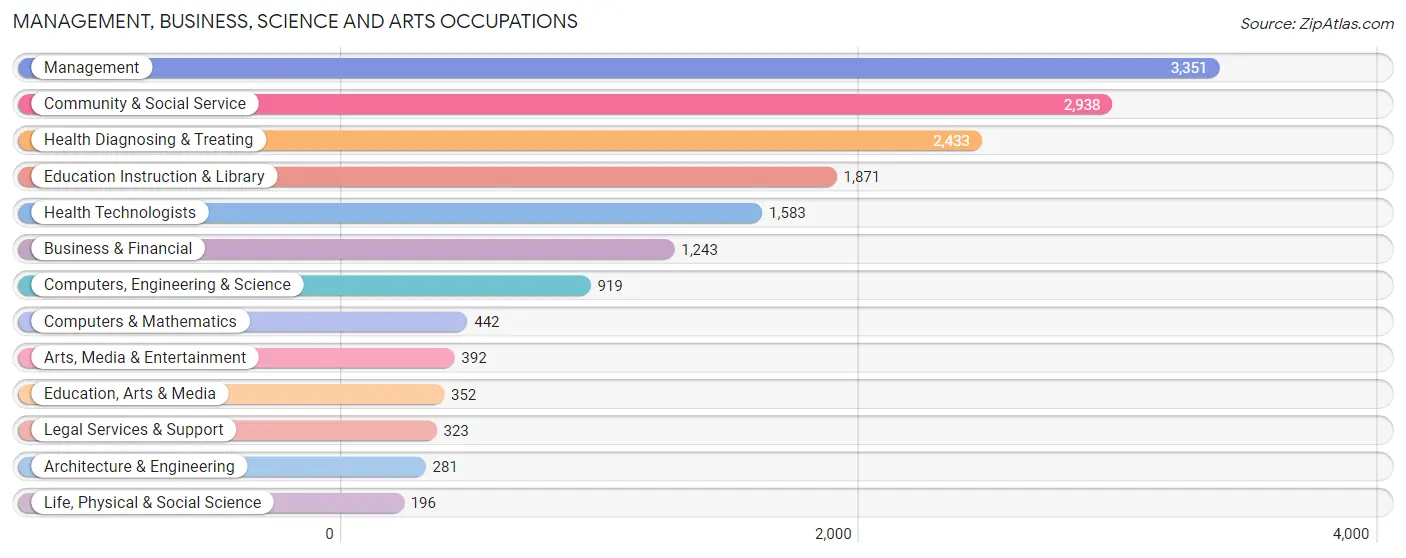
The most common Management, Business, Science and Arts occupations in North Port are Management (3,351 | 10.2%), Community & Social Service (2,938 | 9.0%), Health Diagnosing & Treating (2,433 | 7.4%), Education Instruction & Library (1,871 | 5.7%), and Health Technologists (1,583 | 4.8%).
Management, Business, Science and Arts Occupations by Sex
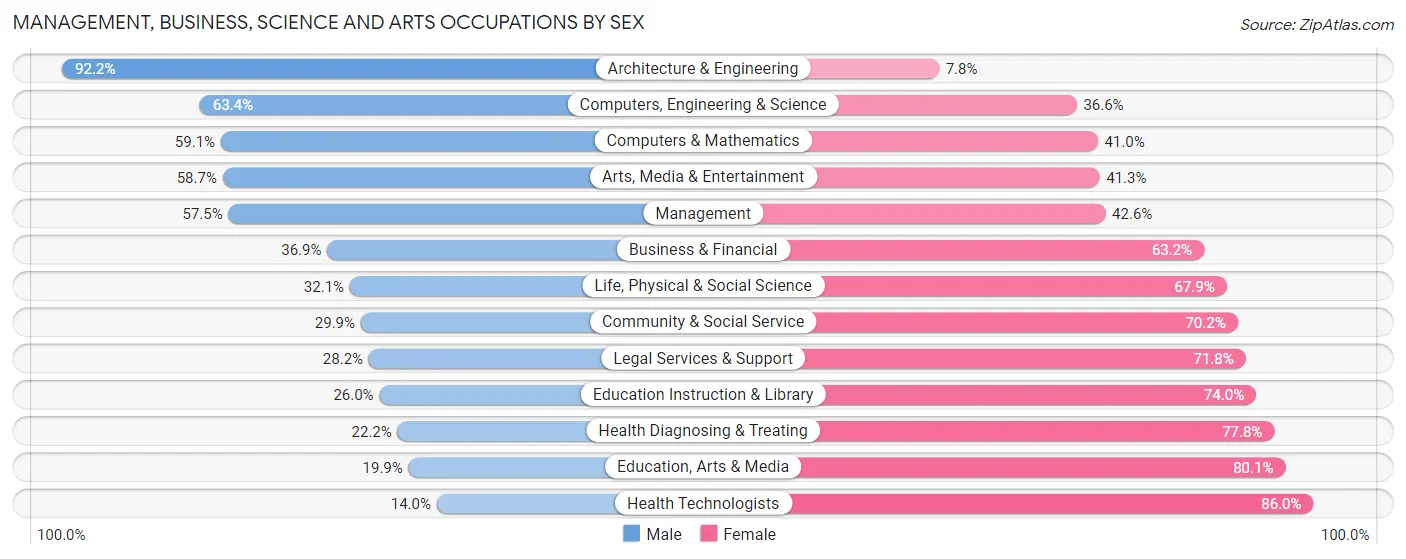
Within the Management, Business, Science and Arts occupations in North Port, the most male-oriented occupations are Architecture & Engineering (92.2%), Computers, Engineering & Science (63.4%), and Computers & Mathematics (59.1%), while the most female-oriented occupations are Health Technologists (86.0%), Education, Arts & Media (80.1%), and Health Diagnosing & Treating (77.8%).
| Occupation | Male | Female |
| Management | 1,925 (57.5%) | 1,426 (42.5%) |
| Business & Financial | 458 (36.8%) | 785 (63.1%) |
| Computers, Engineering & Science | 583 (63.4%) | 336 (36.6%) |
| Computers & Mathematics | 261 (59.1%) | 181 (40.9%) |
| Architecture & Engineering | 259 (92.2%) | 22 (7.8%) |
| Life, Physical & Social Science | 63 (32.1%) | 133 (67.9%) |
| Community & Social Service | 877 (29.8%) | 2,061 (70.2%) |
| Education, Arts & Media | 70 (19.9%) | 282 (80.1%) |
| Legal Services & Support | 91 (28.2%) | 232 (71.8%) |
| Education Instruction & Library | 486 (26.0%) | 1,385 (74.0%) |
| Arts, Media & Entertainment | 230 (58.7%) | 162 (41.3%) |
| Health Diagnosing & Treating | 540 (22.2%) | 1,893 (77.8%) |
| Health Technologists | 222 (14.0%) | 1,361 (86.0%) |
| Total (Category) | 4,383 (40.3%) | 6,501 (59.7%) |
| Total (Overall) | 16,863 (51.5%) | 15,868 (48.5%) |
Services Occupations
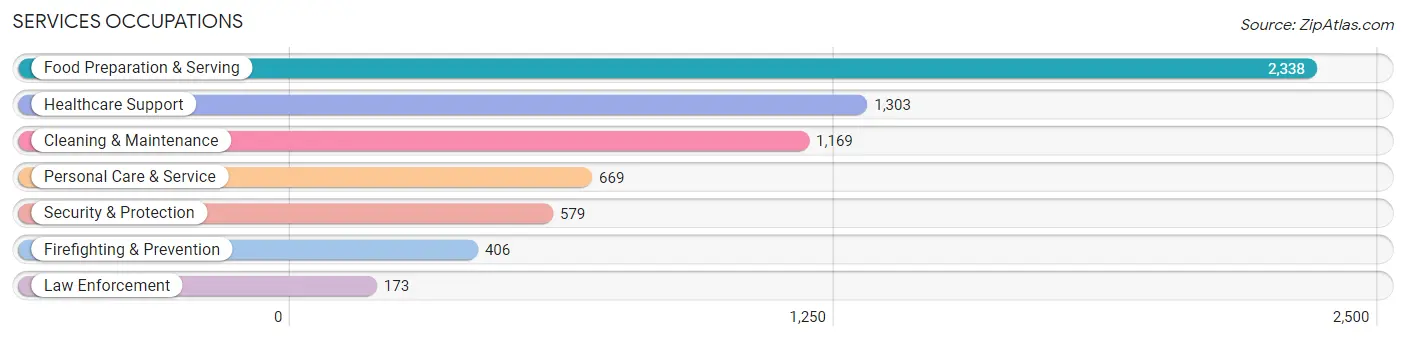
The most common Services occupations in North Port are Food Preparation & Serving (2,338 | 7.1%), Healthcare Support (1,303 | 4.0%), Cleaning & Maintenance (1,169 | 3.6%), Personal Care & Service (669 | 2.0%), and Security & Protection (579 | 1.8%).
Services Occupations by Sex
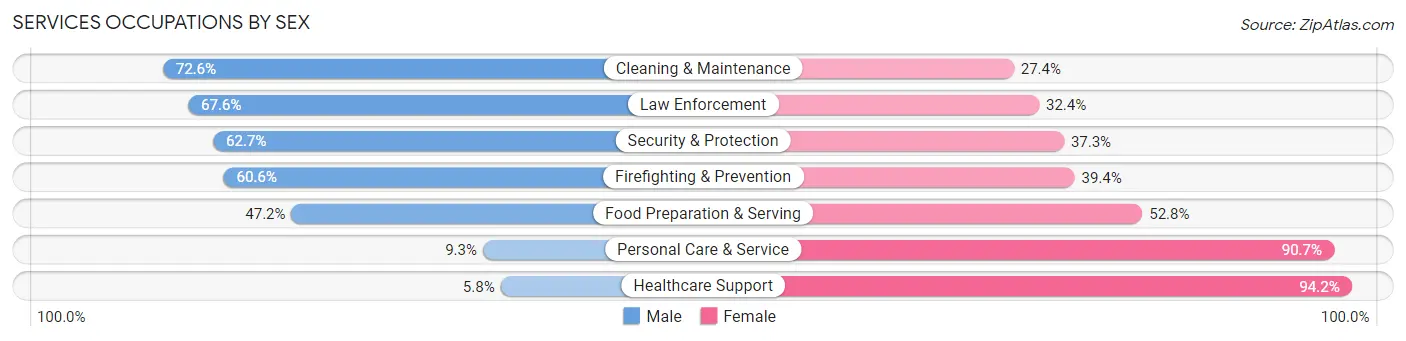
Within the Services occupations in North Port, the most male-oriented occupations are Cleaning & Maintenance (72.6%), Law Enforcement (67.6%), and Security & Protection (62.7%), while the most female-oriented occupations are Healthcare Support (94.2%), Personal Care & Service (90.7%), and Food Preparation & Serving (52.8%).
| Occupation | Male | Female |
| Healthcare Support | 75 (5.8%) | 1,228 (94.2%) |
| Security & Protection | 363 (62.7%) | 216 (37.3%) |
| Firefighting & Prevention | 246 (60.6%) | 160 (39.4%) |
| Law Enforcement | 117 (67.6%) | 56 (32.4%) |
| Food Preparation & Serving | 1,103 (47.2%) | 1,235 (52.8%) |
| Cleaning & Maintenance | 849 (72.6%) | 320 (27.4%) |
| Personal Care & Service | 62 (9.3%) | 607 (90.7%) |
| Total (Category) | 2,452 (40.5%) | 3,606 (59.5%) |
| Total (Overall) | 16,863 (51.5%) | 15,868 (48.5%) |
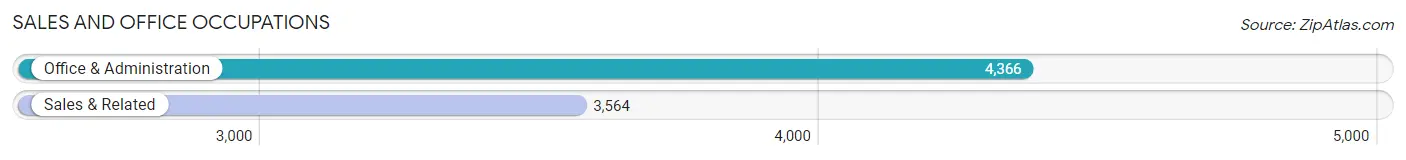
Sales and Office Occupations
The most common Sales and Office occupations in North Port are Office & Administration (4,366 | 13.3%), and Sales & Related (3,564 | 10.9%).
Sales and Office Occupations by Sex
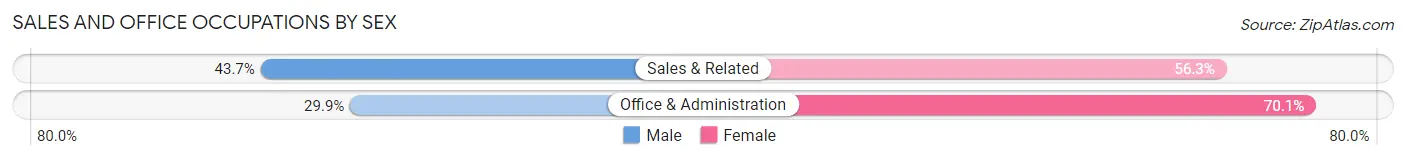
| Occupation | Male | Female |
| Sales & Related | 1,557 (43.7%) | 2,007 (56.3%) |
| Office & Administration | 1,306 (29.9%) | 3,060 (70.1%) |
| Total (Category) | 2,863 (36.1%) | 5,067 (63.9%) |
| Total (Overall) | 16,863 (51.5%) | 15,868 (48.5%) |
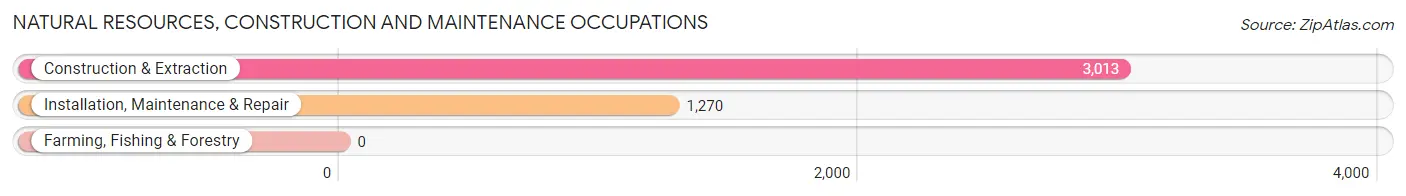
Natural Resources, Construction and Maintenance Occupations
The most common Natural Resources, Construction and Maintenance occupations in North Port are Construction & Extraction (3,013 | 9.2%), and Installation, Maintenance & Repair (1,270 | 3.9%).
Natural Resources, Construction and Maintenance Occupations by Sex
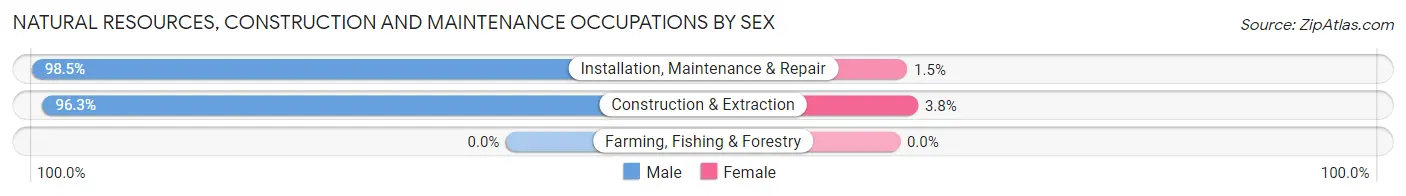
| Occupation | Male | Female |
| Farming, Fishing & Forestry | 0 (0.0%) | 0 (0.0%) |
| Construction & Extraction | 2,900 (96.3%) | 113 (3.7%) |
| Installation, Maintenance & Repair | 1,251 (98.5%) | 19 (1.5%) |
| Total (Category) | 4,151 (96.9%) | 132 (3.1%) |
| Total (Overall) | 16,863 (51.5%) | 15,868 (48.5%) |
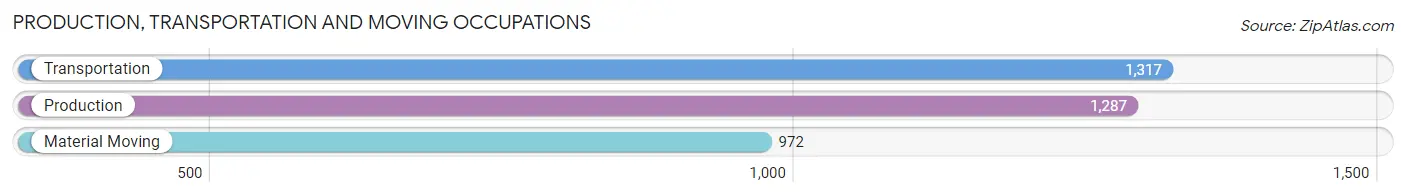
Production, Transportation and Moving Occupations
The most common Production, Transportation and Moving occupations in North Port are Transportation (1,317 | 4.0%), Production (1,287 | 3.9%), and Material Moving (972 | 3.0%).
Production, Transportation and Moving Occupations by Sex
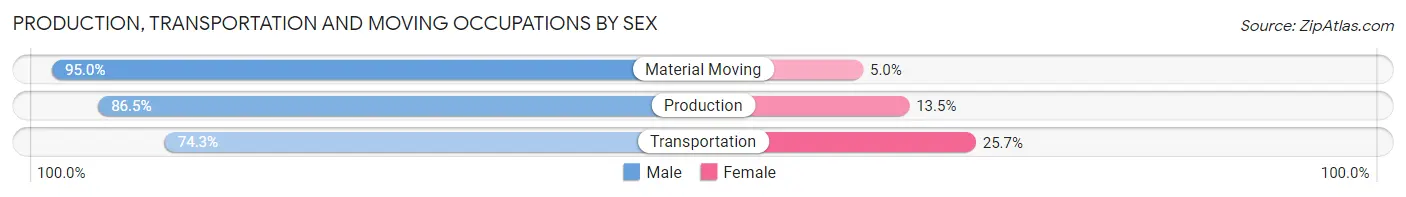
| Occupation | Male | Female |
| Production | 1,113 (86.5%) | 174 (13.5%) |
| Transportation | 978 (74.3%) | 339 (25.7%) |
| Material Moving | 923 (95.0%) | 49 (5.0%) |
| Total (Category) | 3,014 (84.3%) | 562 (15.7%) |
| Total (Overall) | 16,863 (51.5%) | 15,868 (48.5%) |
Employment Industries by Sex in North Port
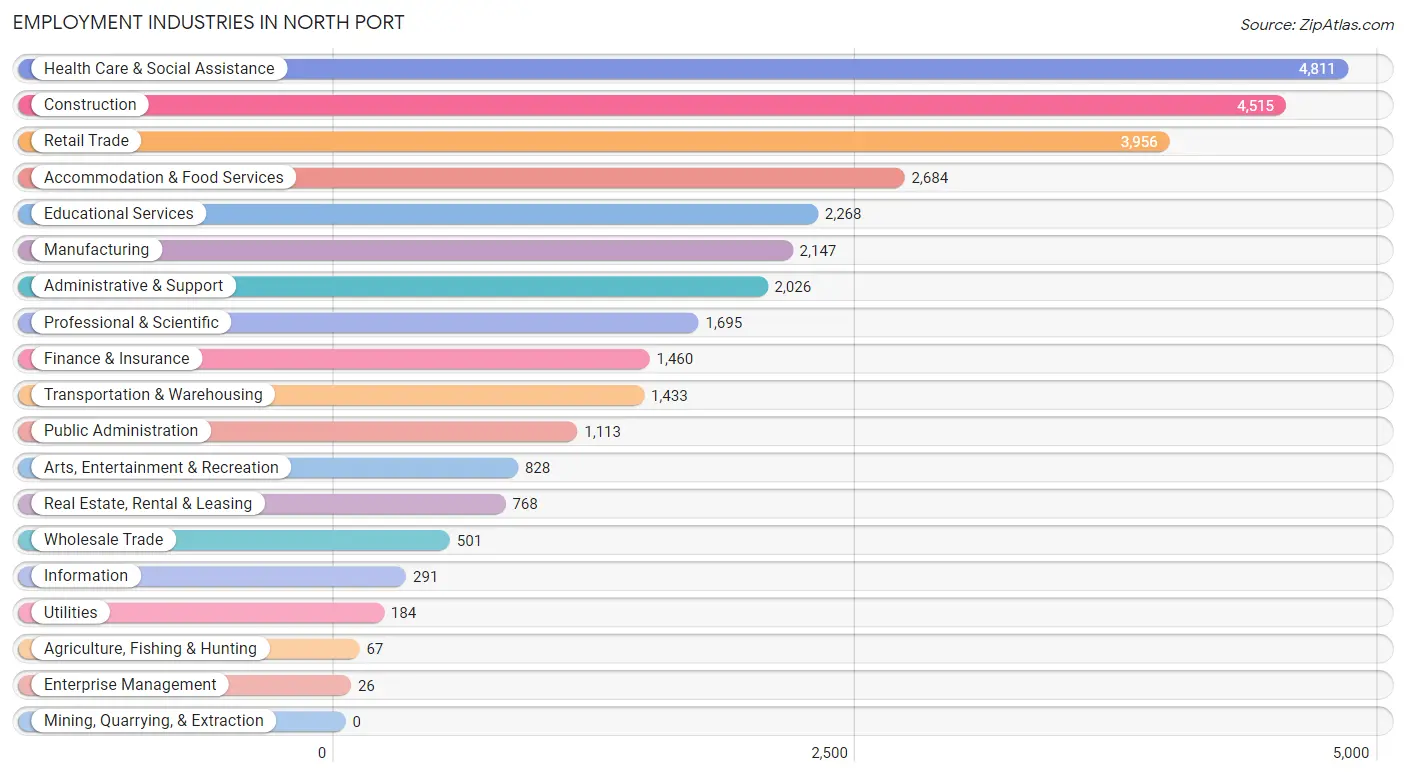
Employment Industries in North Port
The major employment industries in North Port include Health Care & Social Assistance (4,811 | 14.7%), Construction (4,515 | 13.8%), Retail Trade (3,956 | 12.1%), Accommodation & Food Services (2,684 | 8.2%), and Educational Services (2,268 | 6.9%).
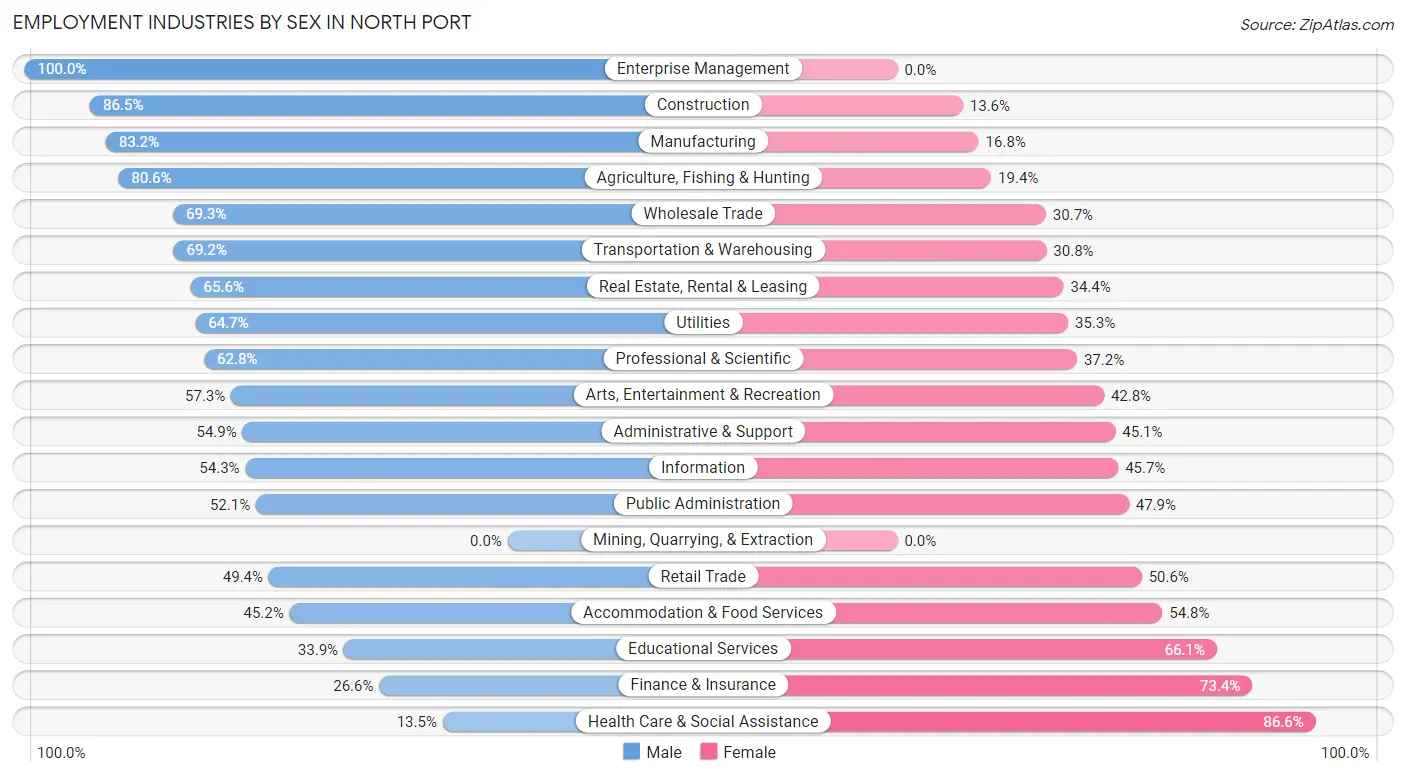
Employment Industries by Sex in North Port
The North Port industries that see more men than women are Enterprise Management (100.0%), Construction (86.5%), and Manufacturing (83.2%), whereas the industries that tend to have a higher number of women are Health Care & Social Assistance (86.6%), Finance & Insurance (73.4%), and Educational Services (66.1%).
| Industry | Male | Female |
| Agriculture, Fishing & Hunting | 54 (80.6%) | 13 (19.4%) |
| Mining, Quarrying, & Extraction | 0 (0.0%) | 0 (0.0%) |
| Construction | 3,903 (86.5%) | 612 (13.6%) |
| Manufacturing | 1,786 (83.2%) | 361 (16.8%) |
| Wholesale Trade | 347 (69.3%) | 154 (30.7%) |
| Retail Trade | 1,956 (49.4%) | 2,000 (50.6%) |
| Transportation & Warehousing | 991 (69.2%) | 442 (30.8%) |
| Utilities | 119 (64.7%) | 65 (35.3%) |
| Information | 158 (54.3%) | 133 (45.7%) |
| Finance & Insurance | 388 (26.6%) | 1,072 (73.4%) |
| Real Estate, Rental & Leasing | 504 (65.6%) | 264 (34.4%) |
| Professional & Scientific | 1,065 (62.8%) | 630 (37.2%) |
| Enterprise Management | 26 (100.0%) | 0 (0.0%) |
| Administrative & Support | 1,112 (54.9%) | 914 (45.1%) |
| Educational Services | 769 (33.9%) | 1,499 (66.1%) |
| Health Care & Social Assistance | 647 (13.5%) | 4,164 (86.6%) |
| Arts, Entertainment & Recreation | 474 (57.3%) | 354 (42.7%) |
| Accommodation & Food Services | 1,212 (45.2%) | 1,472 (54.8%) |
| Public Administration | 580 (52.1%) | 533 (47.9%) |
| Total | 16,863 (51.5%) | 15,868 (48.5%) |
Education in North Port
School Enrollment in North Port
The most common levels of schooling among the 14,498 students in North Port are college / undergraduate (3,556 | 24.5%), elementary school (3,171 | 21.9%), and high school (3,055 | 21.1%).
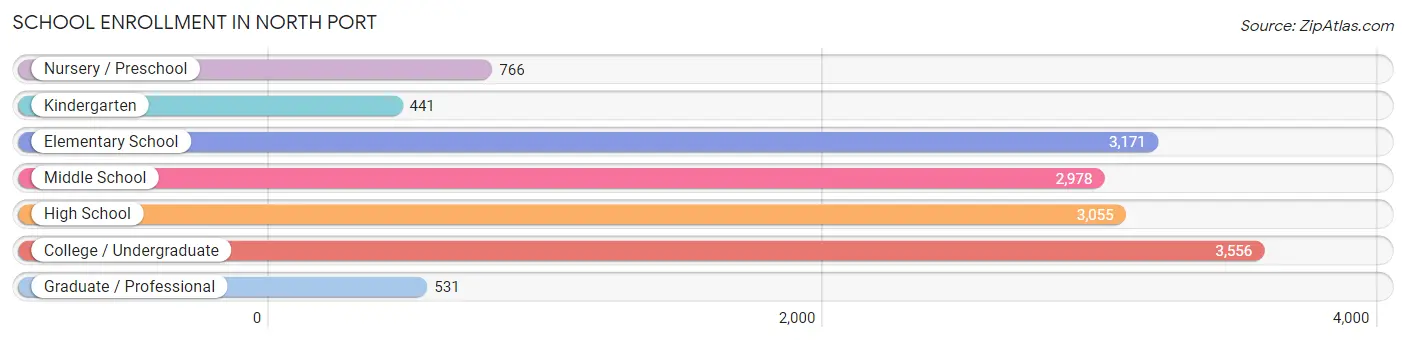
| School Level | # Students | % Students |
| Nursery / Preschool | 766 | 5.3% |
| Kindergarten | 441 | 3.0% |
| Elementary School | 3,171 | 21.9% |
| Middle School | 2,978 | 20.5% |
| High School | 3,055 | 21.1% |
| College / Undergraduate | 3,556 | 24.5% |
| Graduate / Professional | 531 | 3.7% |
| Total | 14,498 | 100.0% |
School Enrollment by Age by Funding Source in North Port
Out of a total of 14,498 students who are enrolled in schools in North Port, 1,986 (13.7%) attend a private institution, while the remaining 12,512 (86.3%) are enrolled in public schools. The age group of 3 to 4 year olds has the highest likelihood of being enrolled in private schools, with 392 (58.1% in the age bracket) enrolled. Conversely, the age group of 5 to 9 year old has the lowest likelihood of being enrolled in a private school, with 3,209 (97.8% in the age bracket) attending a public institution.
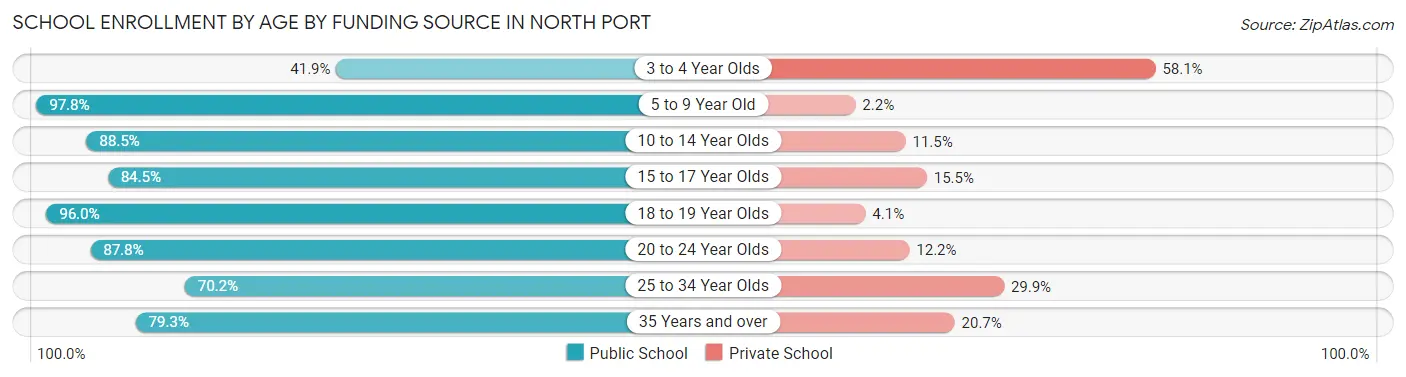
| Age Bracket | Public School | Private School |
| 3 to 4 Year Olds | 283 (41.9%) | 392 (58.1%) |
| 5 to 9 Year Old | 3,209 (97.8%) | 72 (2.2%) |
| 10 to 14 Year Olds | 3,280 (88.5%) | 427 (11.5%) |
| 15 to 17 Year Olds | 1,975 (84.5%) | 362 (15.5%) |
| 18 to 19 Year Olds | 781 (96.0%) | 33 (4.1%) |
| 20 to 24 Year Olds | 1,642 (87.8%) | 229 (12.2%) |
| 25 to 34 Year Olds | 759 (70.2%) | 323 (29.8%) |
| 35 Years and over | 580 (79.3%) | 151 (20.7%) |
| Total | 12,512 (86.3%) | 1,986 (13.7%) |
Educational Attainment by Field of Study in North Port
Business (3,941 | 23.5%), education (3,485 | 20.7%), science & technology (1,863 | 11.1%), arts & humanities (1,041 | 6.2%), and social sciences (1,035 | 6.2%) are the most common fields of study among 16,796 individuals in North Port who have obtained a bachelor's degree or higher.
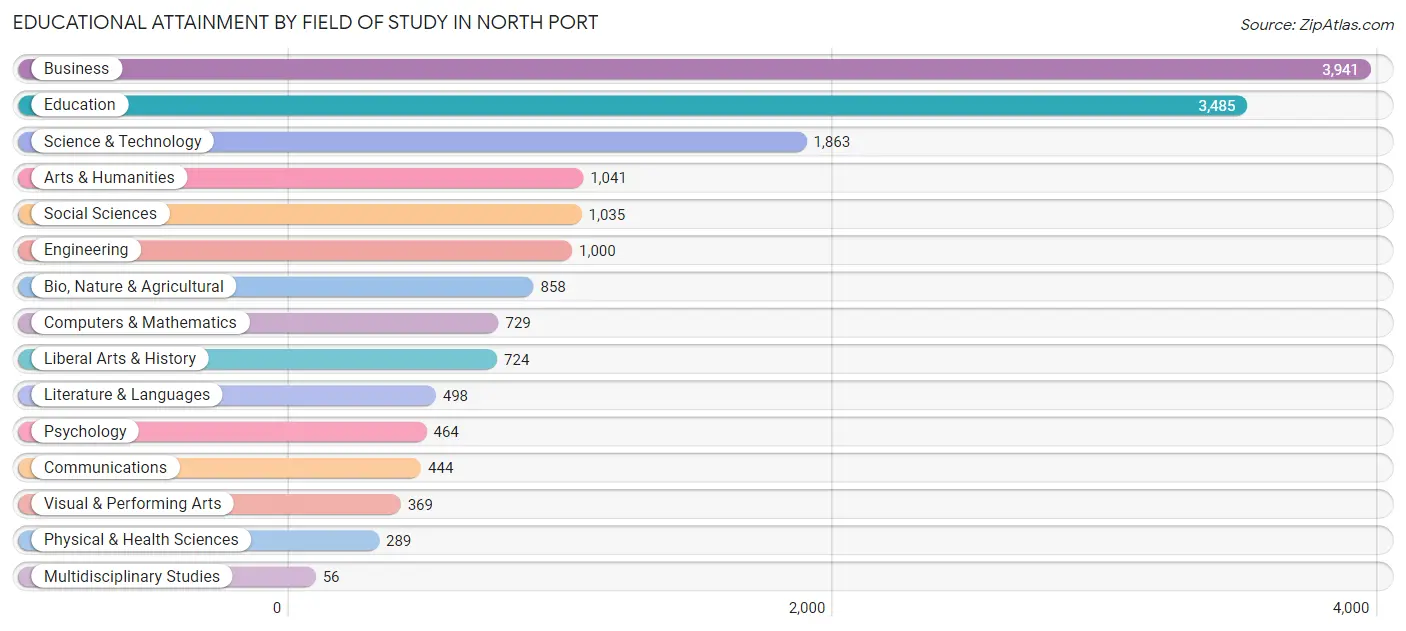
| Field of Study | # Graduates | % Graduates |
| Computers & Mathematics | 729 | 4.3% |
| Bio, Nature & Agricultural | 858 | 5.1% |
| Physical & Health Sciences | 289 | 1.7% |
| Psychology | 464 | 2.8% |
| Social Sciences | 1,035 | 6.2% |
| Engineering | 1,000 | 5.9% |
| Multidisciplinary Studies | 56 | 0.3% |
| Science & Technology | 1,863 | 11.1% |
| Business | 3,941 | 23.5% |
| Education | 3,485 | 20.7% |
| Literature & Languages | 498 | 3.0% |
| Liberal Arts & History | 724 | 4.3% |
| Visual & Performing Arts | 369 | 2.2% |
| Communications | 444 | 2.6% |
| Arts & Humanities | 1,041 | 6.2% |
| Total | 16,796 | 100.0% |
Transportation & Commute in North Port
Vehicle Availability by Sex in North Port
The most prevalent vehicle ownership categories in North Port are males with 2 vehicles (6,770, accounting for 40.5%) and females with 2 vehicles (6,667, making up 44.2%).
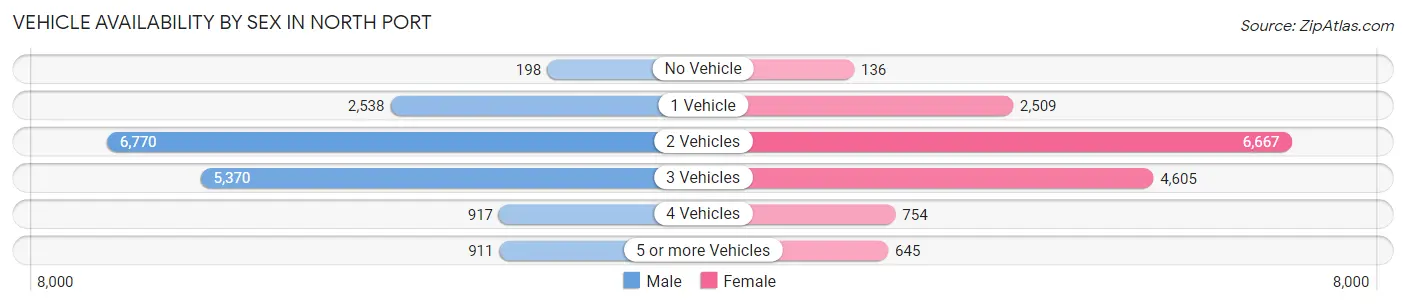
| Vehicles Available | Male | Female |
| No Vehicle | 198 (1.2%) | 136 (0.9%) |
| 1 Vehicle | 2,538 (15.2%) | 2,509 (16.4%) |
| 2 Vehicles | 6,770 (40.5%) | 6,667 (43.5%) |
| 3 Vehicles | 5,370 (32.2%) | 4,605 (30.1%) |
| 4 Vehicles | 917 (5.5%) | 754 (4.9%) |
| 5 or more Vehicles | 911 (5.4%) | 645 (4.2%) |
| Total | 16,704 (100.0%) | 15,316 (100.0%) |
Commute Time in North Port
The most frequently occuring commute durations in North Port are 30 to 34 minutes (6,835 commuters, 23.3%), 20 to 24 minutes (5,009 commuters, 17.0%), and 45 to 59 minutes (3,495 commuters, 11.9%).
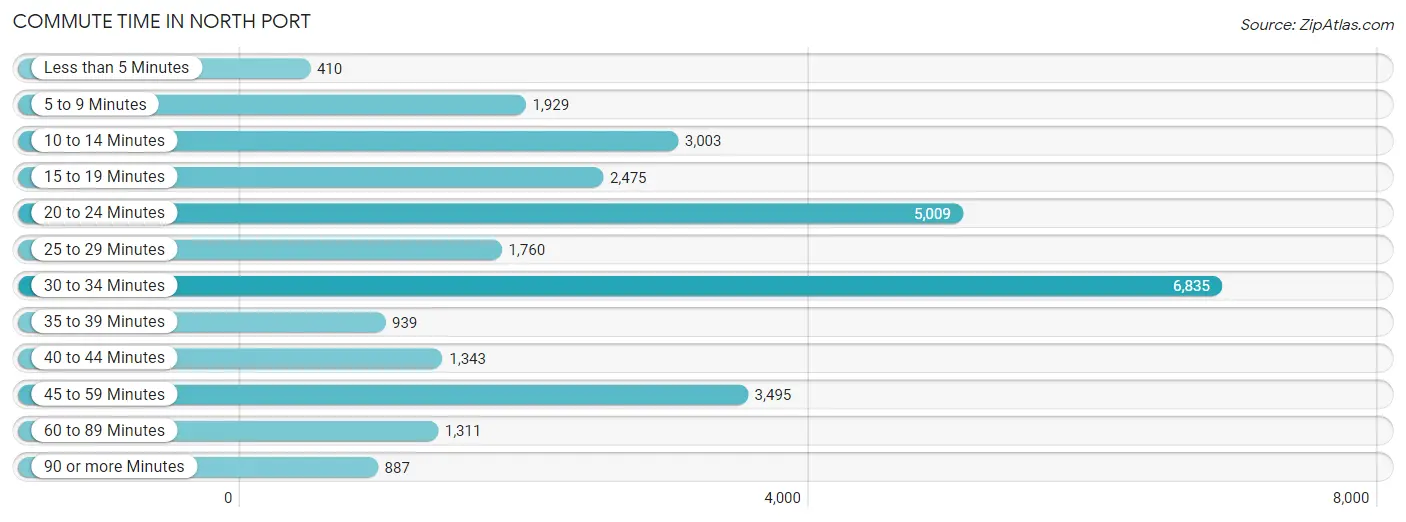
| Commute Time | # Commuters | % Commuters |
| Less than 5 Minutes | 410 | 1.4% |
| 5 to 9 Minutes | 1,929 | 6.6% |
| 10 to 14 Minutes | 3,003 | 10.2% |
| 15 to 19 Minutes | 2,475 | 8.4% |
| 20 to 24 Minutes | 5,009 | 17.0% |
| 25 to 29 Minutes | 1,760 | 6.0% |
| 30 to 34 Minutes | 6,835 | 23.3% |
| 35 to 39 Minutes | 939 | 3.2% |
| 40 to 44 Minutes | 1,343 | 4.6% |
| 45 to 59 Minutes | 3,495 | 11.9% |
| 60 to 89 Minutes | 1,311 | 4.5% |
| 90 or more Minutes | 887 | 3.0% |
Commute Time by Sex in North Port
The most common commute times in North Port are 30 to 34 minutes (4,058 commuters, 26.3%) for males and 30 to 34 minutes (2,777 commuters, 19.9%) for females.
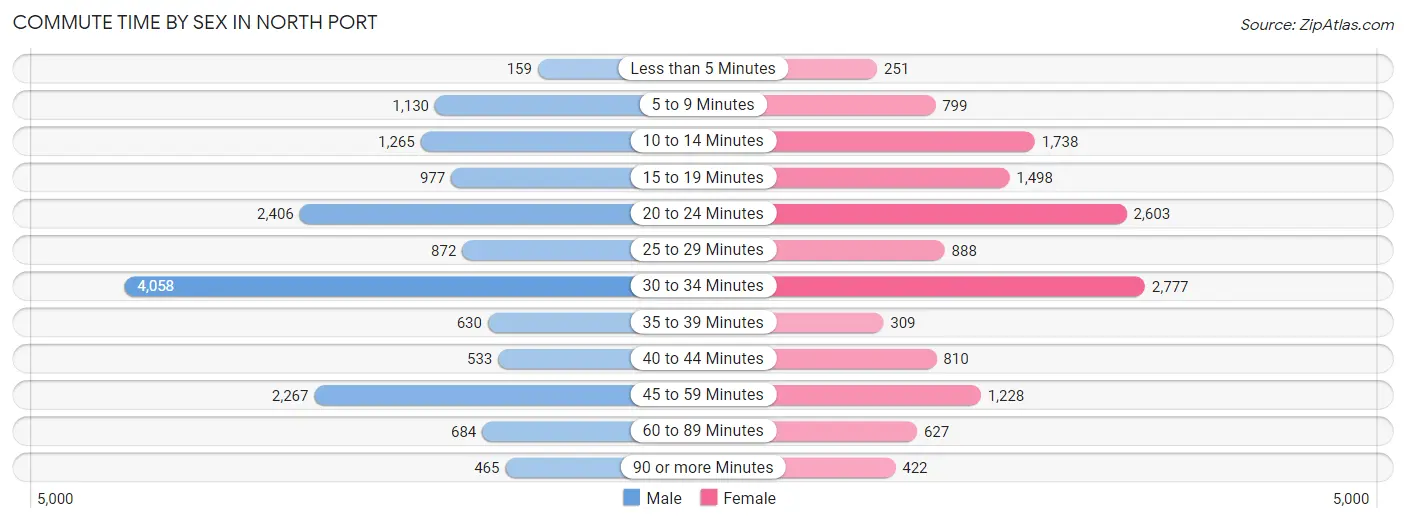
| Commute Time | Male | Female |
| Less than 5 Minutes | 159 (1.0%) | 251 (1.8%) |
| 5 to 9 Minutes | 1,130 (7.3%) | 799 (5.7%) |
| 10 to 14 Minutes | 1,265 (8.2%) | 1,738 (12.5%) |
| 15 to 19 Minutes | 977 (6.3%) | 1,498 (10.7%) |
| 20 to 24 Minutes | 2,406 (15.6%) | 2,603 (18.7%) |
| 25 to 29 Minutes | 872 (5.7%) | 888 (6.4%) |
| 30 to 34 Minutes | 4,058 (26.3%) | 2,777 (19.9%) |
| 35 to 39 Minutes | 630 (4.1%) | 309 (2.2%) |
| 40 to 44 Minutes | 533 (3.5%) | 810 (5.8%) |
| 45 to 59 Minutes | 2,267 (14.7%) | 1,228 (8.8%) |
| 60 to 89 Minutes | 684 (4.4%) | 627 (4.5%) |
| 90 or more Minutes | 465 (3.0%) | 422 (3.0%) |
Time of Departure to Work by Sex in North Port
The most frequent times of departure to work in North Port are 7:00 AM to 7:29 AM (2,862, 18.5%) for males and 6:30 AM to 6:59 AM (2,063, 14.8%) for females.
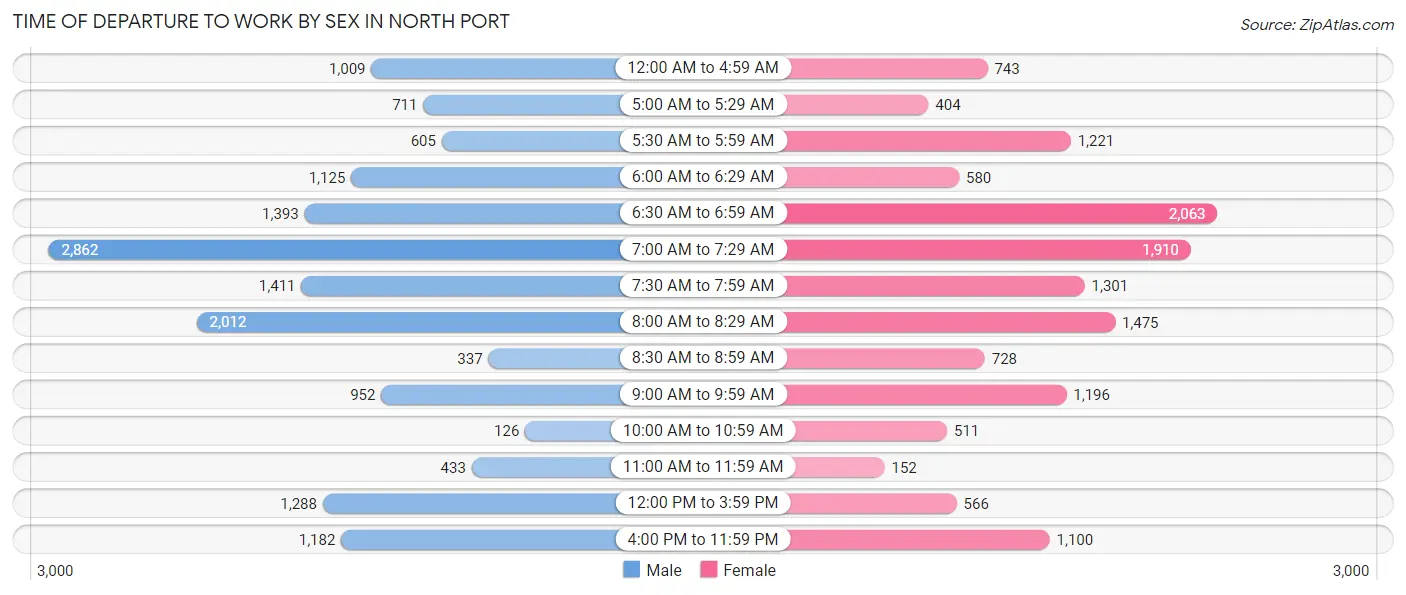
| Time of Departure | Male | Female |
| 12:00 AM to 4:59 AM | 1,009 (6.5%) | 743 (5.3%) |
| 5:00 AM to 5:29 AM | 711 (4.6%) | 404 (2.9%) |
| 5:30 AM to 5:59 AM | 605 (3.9%) | 1,221 (8.7%) |
| 6:00 AM to 6:29 AM | 1,125 (7.3%) | 580 (4.2%) |
| 6:30 AM to 6:59 AM | 1,393 (9.0%) | 2,063 (14.8%) |
| 7:00 AM to 7:29 AM | 2,862 (18.5%) | 1,910 (13.7%) |
| 7:30 AM to 7:59 AM | 1,411 (9.1%) | 1,301 (9.3%) |
| 8:00 AM to 8:29 AM | 2,012 (13.0%) | 1,475 (10.6%) |
| 8:30 AM to 8:59 AM | 337 (2.2%) | 728 (5.2%) |
| 9:00 AM to 9:59 AM | 952 (6.2%) | 1,196 (8.6%) |
| 10:00 AM to 10:59 AM | 126 (0.8%) | 511 (3.7%) |
| 11:00 AM to 11:59 AM | 433 (2.8%) | 152 (1.1%) |
| 12:00 PM to 3:59 PM | 1,288 (8.3%) | 566 (4.1%) |
| 4:00 PM to 11:59 PM | 1,182 (7.6%) | 1,100 (7.9%) |
| Total | 15,446 (100.0%) | 13,950 (100.0%) |
Housing Occupancy in North Port
Occupancy by Ownership in North Port
Of the total 30,129 dwellings in North Port, owner-occupied units account for 23,965 (79.5%), while renter-occupied units make up 6,164 (20.5%).
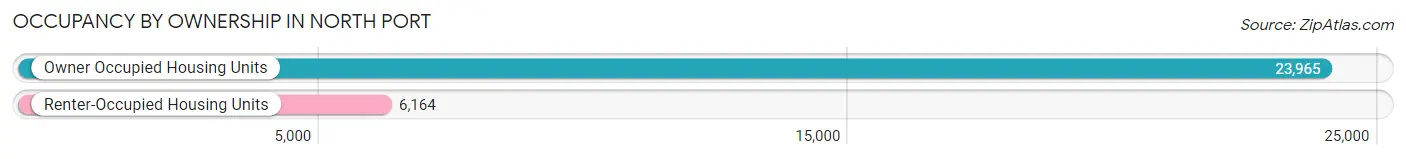
| Occupancy | # Housing Units | % Housing Units |
| Owner Occupied Housing Units | 23,965 | 79.5% |
| Renter-Occupied Housing Units | 6,164 | 20.5% |
| Total Occupied Housing Units | 30,129 | 100.0% |
Occupancy by Household Size in North Port
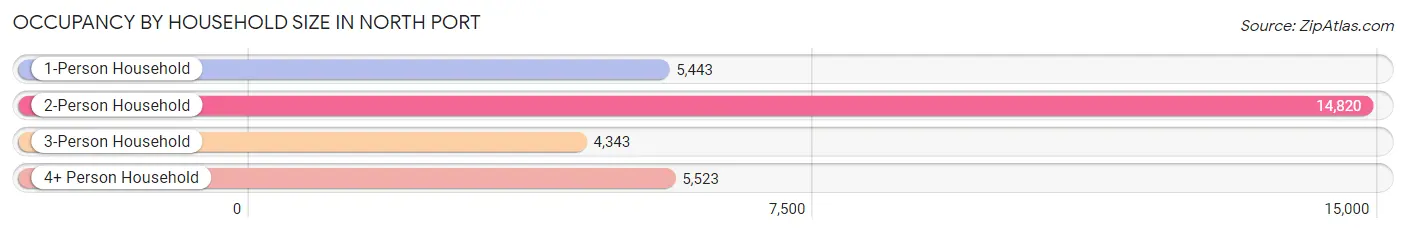
| Household Size | # Housing Units | % Housing Units |
| 1-Person Household | 5,443 | 18.1% |
| 2-Person Household | 14,820 | 49.2% |
| 3-Person Household | 4,343 | 14.4% |
| 4+ Person Household | 5,523 | 18.3% |
| Total Housing Units | 30,129 | 100.0% |
Occupancy by Ownership by Household Size in North Port
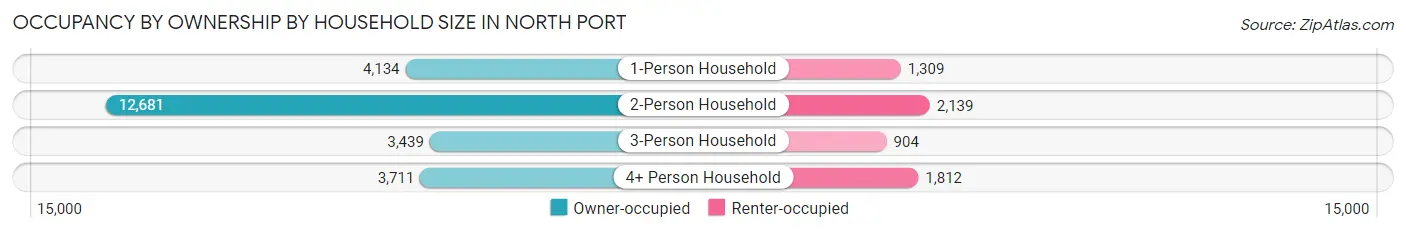
| Household Size | Owner-occupied | Renter-occupied |
| 1-Person Household | 4,134 (75.9%) | 1,309 (24.0%) |
| 2-Person Household | 12,681 (85.6%) | 2,139 (14.4%) |
| 3-Person Household | 3,439 (79.2%) | 904 (20.8%) |
| 4+ Person Household | 3,711 (67.2%) | 1,812 (32.8%) |
| Total Housing Units | 23,965 (79.5%) | 6,164 (20.5%) |
Occupancy by Educational Attainment in North Port
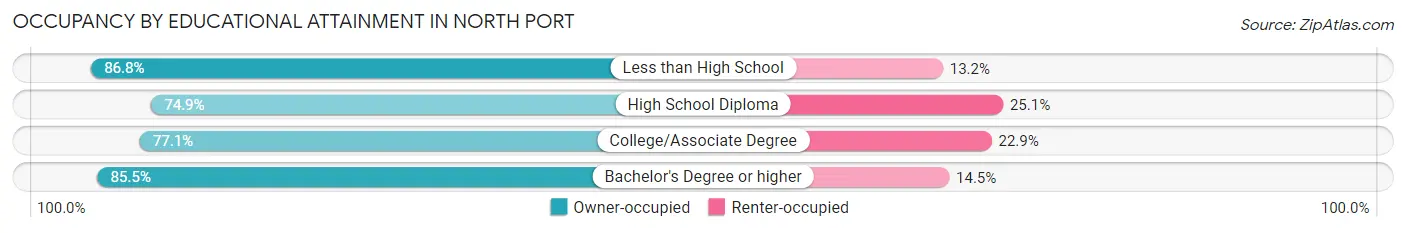
| Household Size | Owner-occupied | Renter-occupied |
| Less than High School | 1,603 (86.8%) | 244 (13.2%) |
| High School Diploma | 5,573 (74.9%) | 1,872 (25.1%) |
| College/Associate Degree | 9,496 (77.1%) | 2,815 (22.9%) |
| Bachelor's Degree or higher | 7,293 (85.5%) | 1,233 (14.5%) |
Occupancy by Age of Householder in North Port
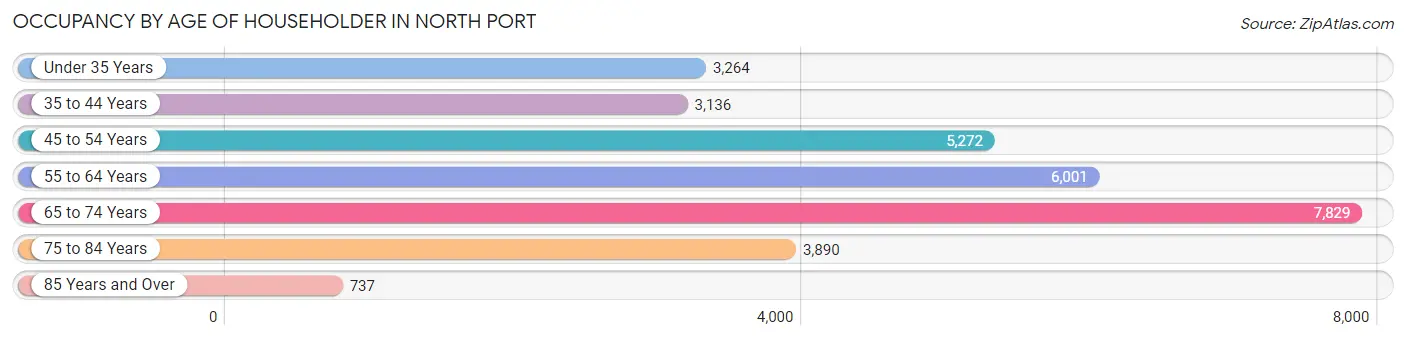
| Age Bracket | # Households | % Households |
| Under 35 Years | 3,264 | 10.8% |
| 35 to 44 Years | 3,136 | 10.4% |
| 45 to 54 Years | 5,272 | 17.5% |
| 55 to 64 Years | 6,001 | 19.9% |
| 65 to 74 Years | 7,829 | 26.0% |
| 75 to 84 Years | 3,890 | 12.9% |
| 85 Years and Over | 737 | 2.5% |
| Total | 30,129 | 100.0% |
Housing Finances in North Port
Median Income by Occupancy in North Port
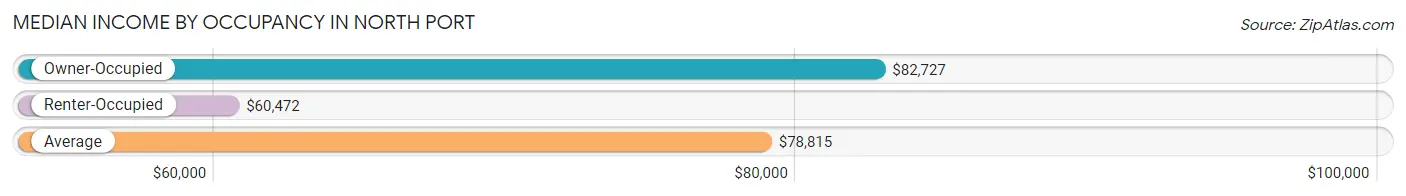
| Occupancy Type | # Households | Median Income |
| Owner-Occupied | 23,965 (79.5%) | $82,727 |
| Renter-Occupied | 6,164 (20.5%) | $60,472 |
| Average | 30,129 (100.0%) | $78,815 |
Occupancy by Householder Income Bracket in North Port
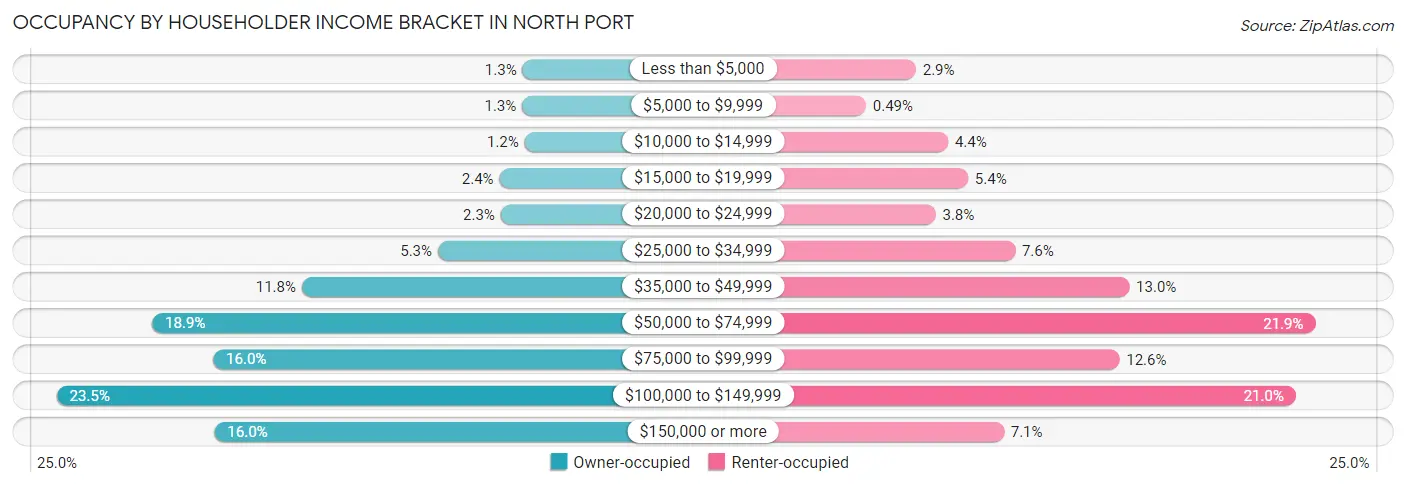
| Income Bracket | Owner-occupied | Renter-occupied |
| Less than $5,000 | 310 (1.3%) | 177 (2.9%) |
| $5,000 to $9,999 | 314 (1.3%) | 30 (0.5%) |
| $10,000 to $14,999 | 285 (1.2%) | 271 (4.4%) |
| $15,000 to $19,999 | 572 (2.4%) | 330 (5.3%) |
| $20,000 to $24,999 | 558 (2.3%) | 235 (3.8%) |
| $25,000 to $34,999 | 1,275 (5.3%) | 468 (7.6%) |
| $35,000 to $49,999 | 2,827 (11.8%) | 803 (13.0%) |
| $50,000 to $74,999 | 4,536 (18.9%) | 1,349 (21.9%) |
| $75,000 to $99,999 | 3,838 (16.0%) | 774 (12.6%) |
| $100,000 to $149,999 | 5,626 (23.5%) | 1,292 (21.0%) |
| $150,000 or more | 3,824 (16.0%) | 435 (7.1%) |
| Total | 23,965 (100.0%) | 6,164 (100.0%) |
Monthly Housing Cost Tiers in North Port
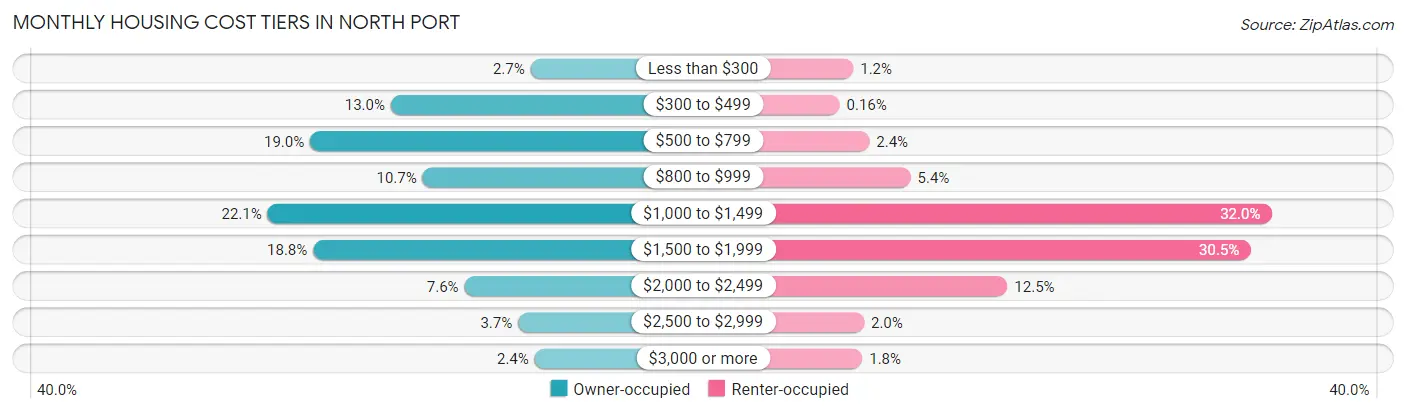
| Monthly Cost | Owner-occupied | Renter-occupied |
| Less than $300 | 657 (2.7%) | 72 (1.2%) |
| $300 to $499 | 3,123 (13.0%) | 10 (0.2%) |
| $500 to $799 | 4,548 (19.0%) | 145 (2.4%) |
| $800 to $999 | 2,561 (10.7%) | 332 (5.4%) |
| $1,000 to $1,499 | 5,298 (22.1%) | 1,974 (32.0%) |
| $1,500 to $1,999 | 4,493 (18.8%) | 1,878 (30.5%) |
| $2,000 to $2,499 | 1,824 (7.6%) | 772 (12.5%) |
| $2,500 to $2,999 | 876 (3.7%) | 121 (2.0%) |
| $3,000 or more | 585 (2.4%) | 113 (1.8%) |
| Total | 23,965 (100.0%) | 6,164 (100.0%) |
Physical Housing Characteristics in North Port
Housing Structures in North Port
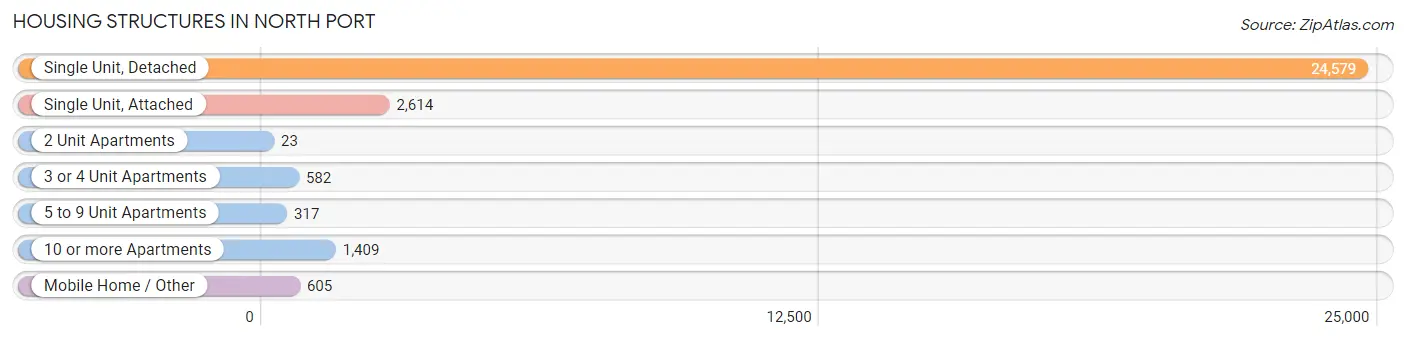
| Structure Type | # Housing Units | % Housing Units |
| Single Unit, Detached | 24,579 | 81.6% |
| Single Unit, Attached | 2,614 | 8.7% |
| 2 Unit Apartments | 23 | 0.1% |
| 3 or 4 Unit Apartments | 582 | 1.9% |
| 5 to 9 Unit Apartments | 317 | 1.1% |
| 10 or more Apartments | 1,409 | 4.7% |
| Mobile Home / Other | 605 | 2.0% |
| Total | 30,129 | 100.0% |
Housing Structures by Occupancy in North Port
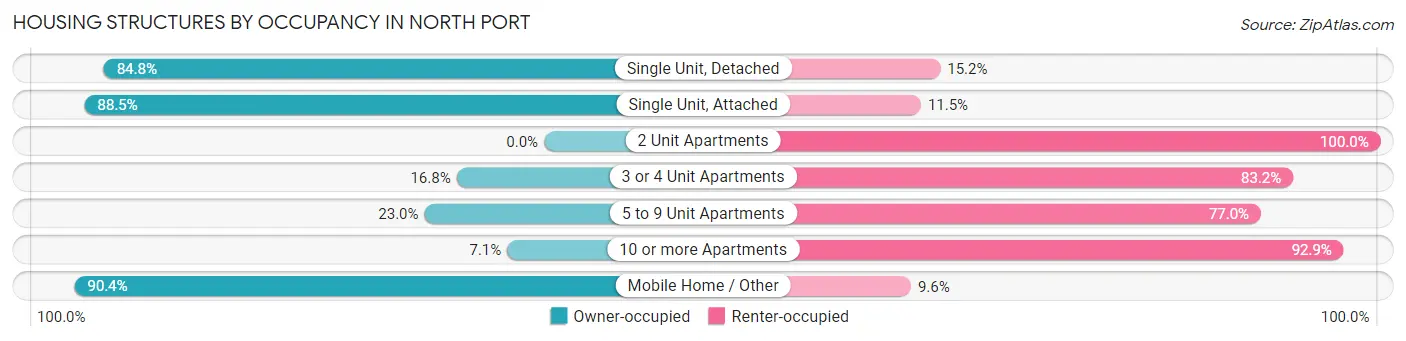
| Structure Type | Owner-occupied | Renter-occupied |
| Single Unit, Detached | 20,834 (84.8%) | 3,745 (15.2%) |
| Single Unit, Attached | 2,313 (88.5%) | 301 (11.5%) |
| 2 Unit Apartments | 0 (0.0%) | 23 (100.0%) |
| 3 or 4 Unit Apartments | 98 (16.8%) | 484 (83.2%) |
| 5 to 9 Unit Apartments | 73 (23.0%) | 244 (77.0%) |
| 10 or more Apartments | 100 (7.1%) | 1,309 (92.9%) |
| Mobile Home / Other | 547 (90.4%) | 58 (9.6%) |
| Total | 23,965 (79.5%) | 6,164 (20.5%) |
Housing Structures by Number of Rooms in North Port
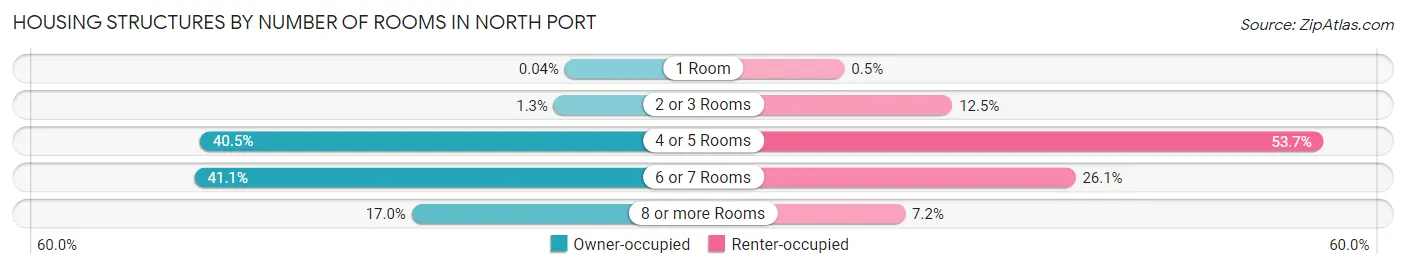
| Number of Rooms | Owner-occupied | Renter-occupied |
| 1 Room | 9 (0.0%) | 31 (0.5%) |
| 2 or 3 Rooms | 302 (1.3%) | 768 (12.5%) |
| 4 or 5 Rooms | 9,712 (40.5%) | 3,308 (53.7%) |
| 6 or 7 Rooms | 9,858 (41.1%) | 1,611 (26.1%) |
| 8 or more Rooms | 4,084 (17.0%) | 446 (7.2%) |
| Total | 23,965 (100.0%) | 6,164 (100.0%) |
Housing Structure by Heating Type in North Port
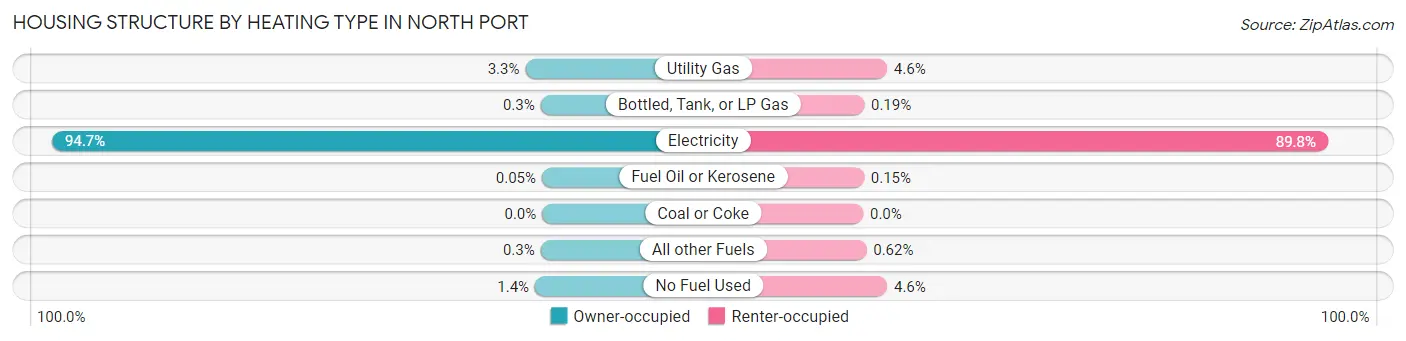
| Heating Type | Owner-occupied | Renter-occupied |
| Utility Gas | 778 (3.3%) | 284 (4.6%) |
| Bottled, Tank, or LP Gas | 73 (0.3%) | 12 (0.2%) |
| Electricity | 22,700 (94.7%) | 5,535 (89.8%) |
| Fuel Oil or Kerosene | 13 (0.1%) | 9 (0.2%) |
| Coal or Coke | 0 (0.0%) | 0 (0.0%) |
| All other Fuels | 71 (0.3%) | 38 (0.6%) |
| No Fuel Used | 330 (1.4%) | 286 (4.6%) |
| Total | 23,965 (100.0%) | 6,164 (100.0%) |
Household Vehicle Usage in North Port
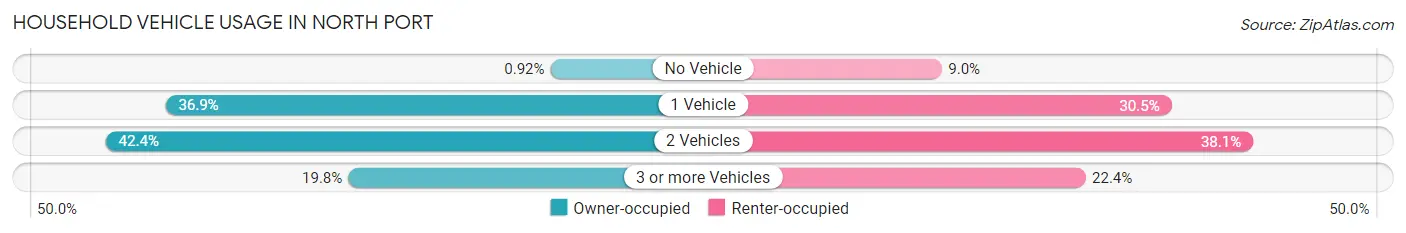
| Vehicles per Household | Owner-occupied | Renter-occupied |
| No Vehicle | 220 (0.9%) | 555 (9.0%) |
| 1 Vehicle | 8,830 (36.8%) | 1,879 (30.5%) |
| 2 Vehicles | 10,169 (42.4%) | 2,348 (38.1%) |
| 3 or more Vehicles | 4,746 (19.8%) | 1,382 (22.4%) |
| Total | 23,965 (100.0%) | 6,164 (100.0%) |
Real Estate & Mortgages in North Port
Real Estate and Mortgage Overview in North Port
| Characteristic | Without Mortgage | With Mortgage |
| Housing Units | 9,209 | 14,756 |
| Median Property Value | $309,800 | $272,600 |
| Median Household Income | $69,888 | $2,540 |
| Monthly Housing Costs | $551 | $585 |
| Real Estate Taxes | $2,873 | $163 |
Property Value by Mortgage Status in North Port
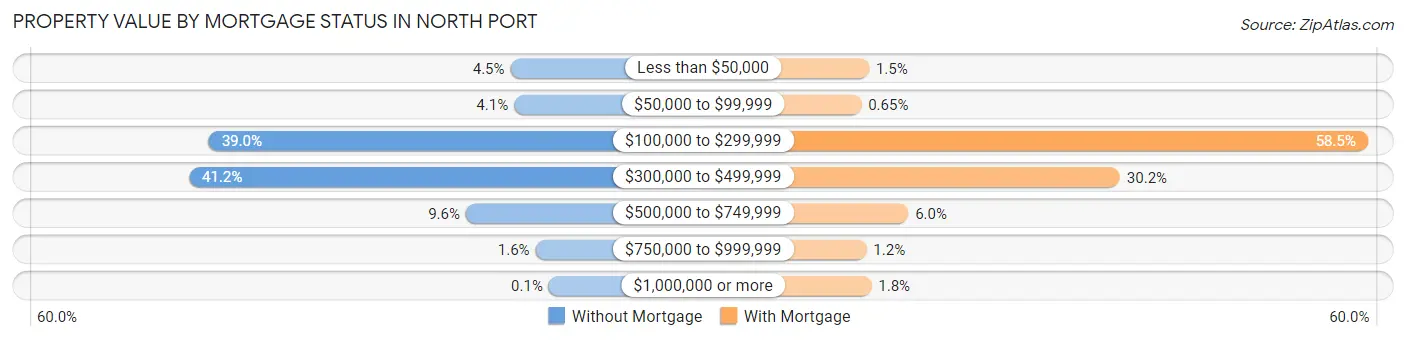
| Property Value | Without Mortgage | With Mortgage |
| Less than $50,000 | 413 (4.5%) | 226 (1.5%) |
| $50,000 to $99,999 | 375 (4.1%) | 96 (0.6%) |
| $100,000 to $299,999 | 3,587 (39.0%) | 8,637 (58.5%) |
| $300,000 to $499,999 | 3,794 (41.2%) | 4,458 (30.2%) |
| $500,000 to $749,999 | 882 (9.6%) | 889 (6.0%) |
| $750,000 to $999,999 | 149 (1.6%) | 183 (1.2%) |
| $1,000,000 or more | 9 (0.1%) | 267 (1.8%) |
| Total | 9,209 (100.0%) | 14,756 (100.0%) |
Household Income by Mortgage Status in North Port
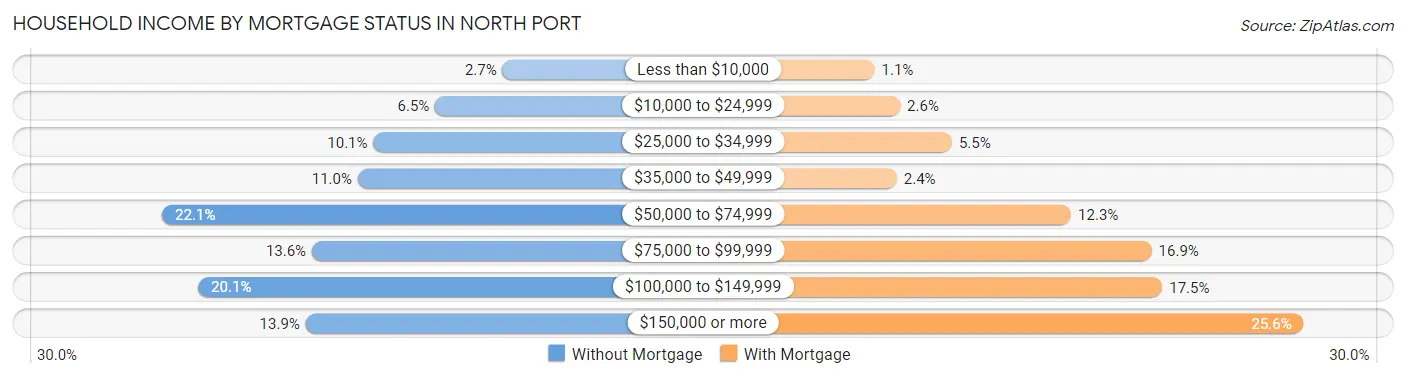
| Household Income | Without Mortgage | With Mortgage |
| Less than $10,000 | 248 (2.7%) | 161 (1.1%) |
| $10,000 to $24,999 | 602 (6.5%) | 376 (2.5%) |
| $25,000 to $34,999 | 927 (10.1%) | 813 (5.5%) |
| $35,000 to $49,999 | 1,009 (11.0%) | 348 (2.4%) |
| $50,000 to $74,999 | 2,039 (22.1%) | 1,818 (12.3%) |
| $75,000 to $99,999 | 1,251 (13.6%) | 2,497 (16.9%) |
| $100,000 to $149,999 | 1,849 (20.1%) | 2,587 (17.5%) |
| $150,000 or more | 1,284 (13.9%) | 3,777 (25.6%) |
| Total | 9,209 (100.0%) | 14,756 (100.0%) |
Property Value to Household Income Ratio in North Port
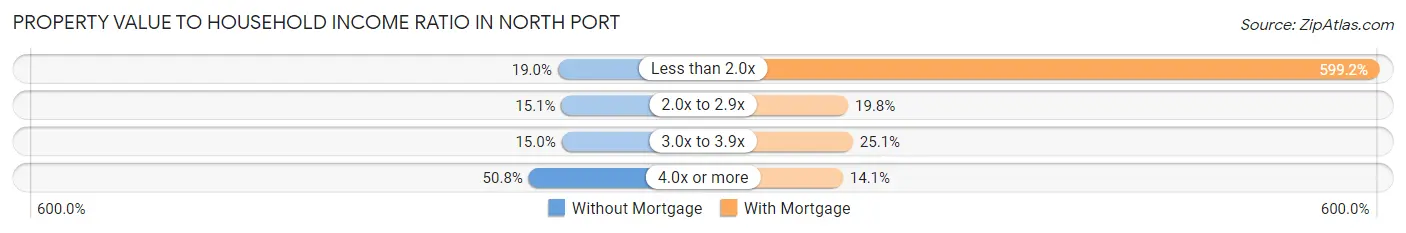
| Value-to-Income Ratio | Without Mortgage | With Mortgage |
| Less than 2.0x | 1,745 (19.0%) | 88,421 (599.2%) |
| 2.0x to 2.9x | 1,391 (15.1%) | 2,928 (19.8%) |
| 3.0x to 3.9x | 1,379 (15.0%) | 3,700 (25.1%) |
| 4.0x or more | 4,674 (50.7%) | 2,081 (14.1%) |
| Total | 9,209 (100.0%) | 14,756 (100.0%) |
Real Estate Taxes by Mortgage Status in North Port
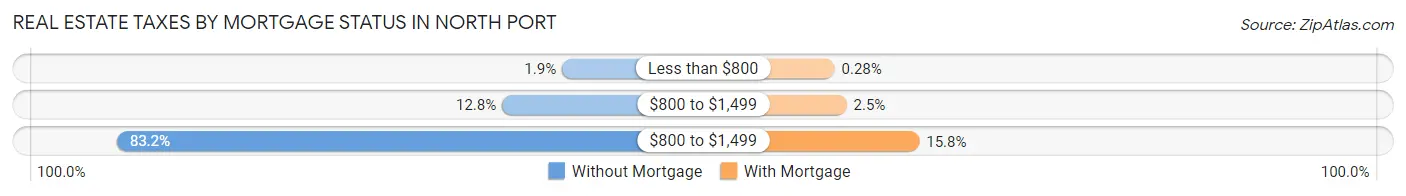
| Property Taxes | Without Mortgage | With Mortgage |
| Less than $800 | 170 (1.8%) | 42 (0.3%) |
| $800 to $1,499 | 1,179 (12.8%) | 364 (2.5%) |
| $800 to $1,499 | 7,658 (83.2%) | 2,326 (15.8%) |
| Total | 9,209 (100.0%) | 14,756 (100.0%) |
Health & Disability in North Port
Health Insurance Coverage by Age in North Port
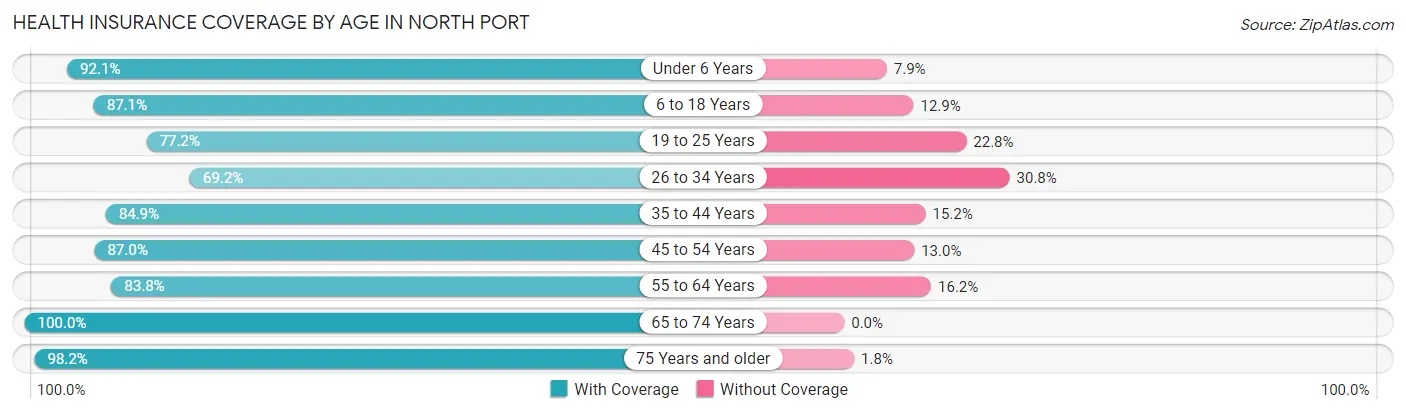
| Age Bracket | With Coverage | Without Coverage |
| Under 6 Years | 3,943 (92.1%) | 340 (7.9%) |
| 6 to 18 Years | 8,618 (87.1%) | 1,278 (12.9%) |
| 19 to 25 Years | 5,147 (77.2%) | 1,517 (22.8%) |
| 26 to 34 Years | 4,325 (69.2%) | 1,928 (30.8%) |
| 35 to 44 Years | 5,438 (84.9%) | 971 (15.1%) |
| 45 to 54 Years | 8,137 (87.0%) | 1,220 (13.0%) |
| 55 to 64 Years | 10,191 (83.8%) | 1,968 (16.2%) |
| 65 to 74 Years | 13,464 (100.0%) | 0 (0.0%) |
| 75 Years and older | 8,090 (98.2%) | 152 (1.8%) |
| Total | 67,353 (87.8%) | 9,374 (12.2%) |
Health Insurance Coverage by Citizenship Status in North Port
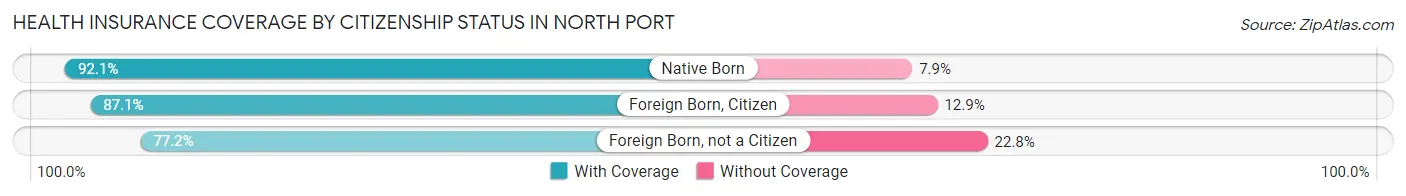
| Citizenship Status | With Coverage | Without Coverage |
| Native Born | 3,943 (92.1%) | 340 (7.9%) |
| Foreign Born, Citizen | 8,618 (87.1%) | 1,278 (12.9%) |
| Foreign Born, not a Citizen | 5,147 (77.2%) | 1,517 (22.8%) |
Health Insurance Coverage by Household Income in North Port
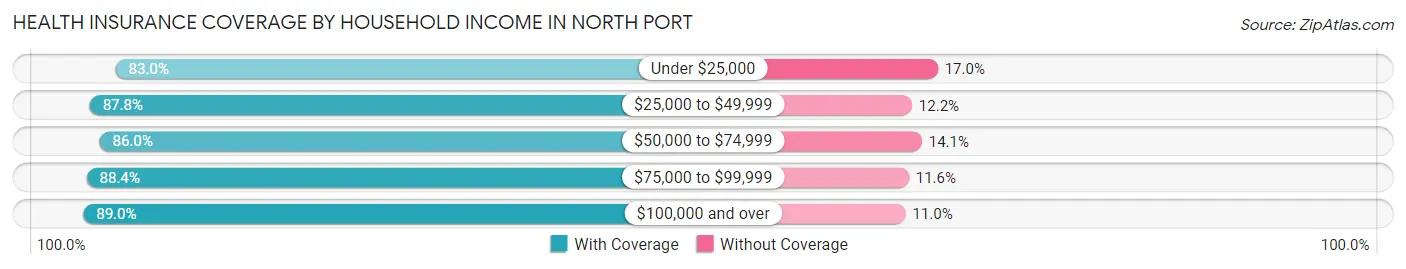
| Household Income | With Coverage | Without Coverage |
| Under $25,000 | 4,227 (83.0%) | 868 (17.0%) |
| $25,000 to $49,999 | 9,554 (87.8%) | 1,328 (12.2%) |
| $50,000 to $74,999 | 11,560 (86.0%) | 1,890 (14.1%) |
| $75,000 to $99,999 | 11,321 (88.4%) | 1,488 (11.6%) |
| $100,000 and over | 30,662 (89.0%) | 3,788 (11.0%) |
Public vs Private Health Insurance Coverage by Age in North Port
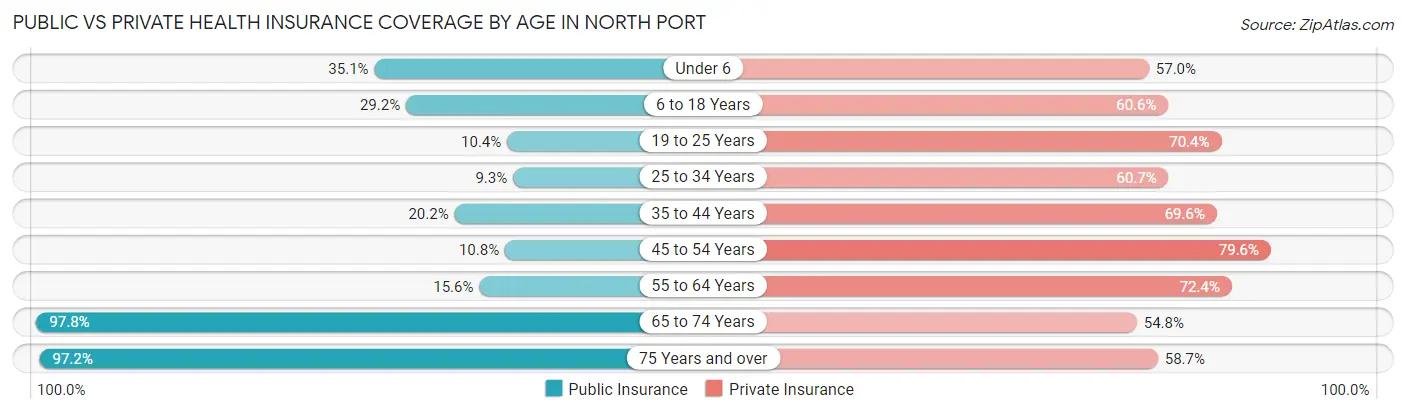
| Age Bracket | Public Insurance | Private Insurance |
| Under 6 | 1,502 (35.1%) | 2,441 (57.0%) |
| 6 to 18 Years | 2,891 (29.2%) | 5,996 (60.6%) |
| 19 to 25 Years | 696 (10.4%) | 4,694 (70.4%) |
| 25 to 34 Years | 584 (9.3%) | 3,793 (60.7%) |
| 35 to 44 Years | 1,295 (20.2%) | 4,460 (69.6%) |
| 45 to 54 Years | 1,013 (10.8%) | 7,452 (79.6%) |
| 55 to 64 Years | 1,898 (15.6%) | 8,800 (72.4%) |
| 65 to 74 Years | 13,168 (97.8%) | 7,373 (54.8%) |
| 75 Years and over | 8,013 (97.2%) | 4,834 (58.7%) |
| Total | 31,060 (40.5%) | 49,843 (65.0%) |
Disability Status by Sex by Age in North Port
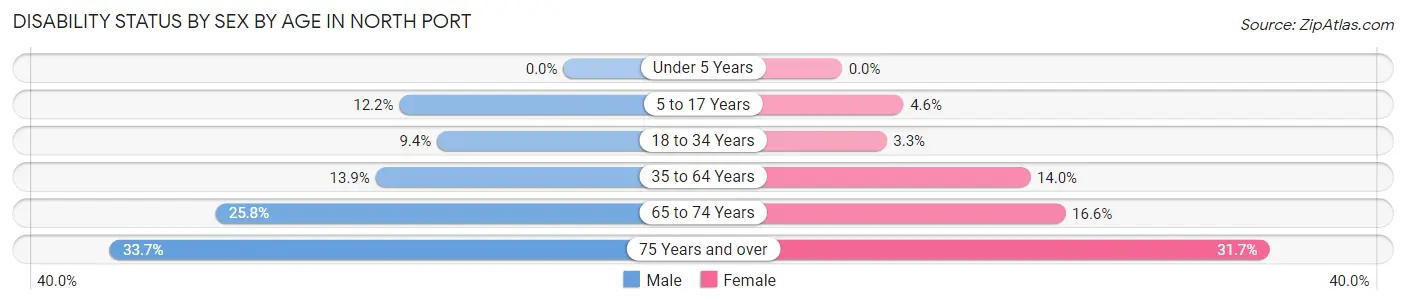
| Age Bracket | Male | Female |
| Under 5 Years | 0 (0.0%) | 0 (0.0%) |
| 5 to 17 Years | 648 (12.2%) | 200 (4.6%) |
| 18 to 34 Years | 637 (9.4%) | 222 (3.3%) |
| 35 to 64 Years | 1,840 (13.9%) | 2,057 (14.0%) |
| 65 to 74 Years | 1,683 (25.8%) | 1,151 (16.6%) |
| 75 Years and over | 1,373 (33.7%) | 1,321 (31.7%) |
Disability Class by Sex by Age in North Port
Disability Class: Hearing Difficulty
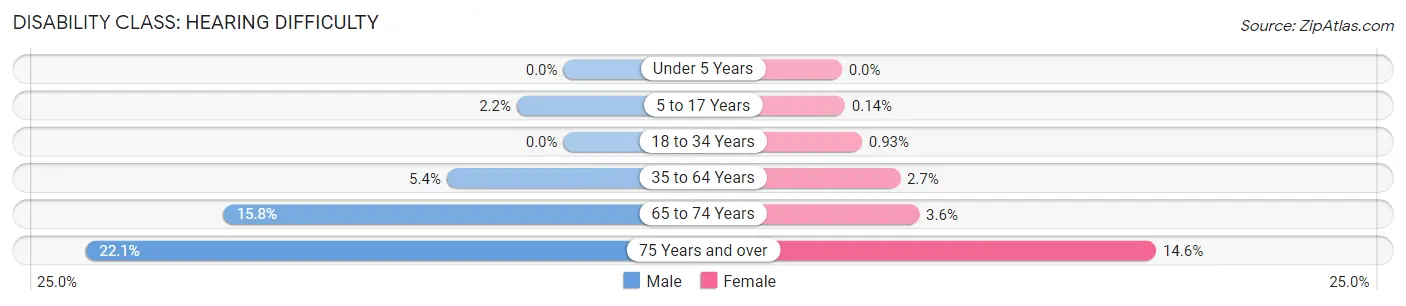
| Age Bracket | Male | Female |
| Under 5 Years | 0 (0.0%) | 0 (0.0%) |
| 5 to 17 Years | 115 (2.2%) | 6 (0.1%) |
| 18 to 34 Years | 0 (0.0%) | 62 (0.9%) |
| 35 to 64 Years | 714 (5.4%) | 397 (2.7%) |
| 65 to 74 Years | 1,028 (15.8%) | 249 (3.6%) |
| 75 Years and over | 903 (22.1%) | 607 (14.6%) |
Disability Class: Vision Difficulty
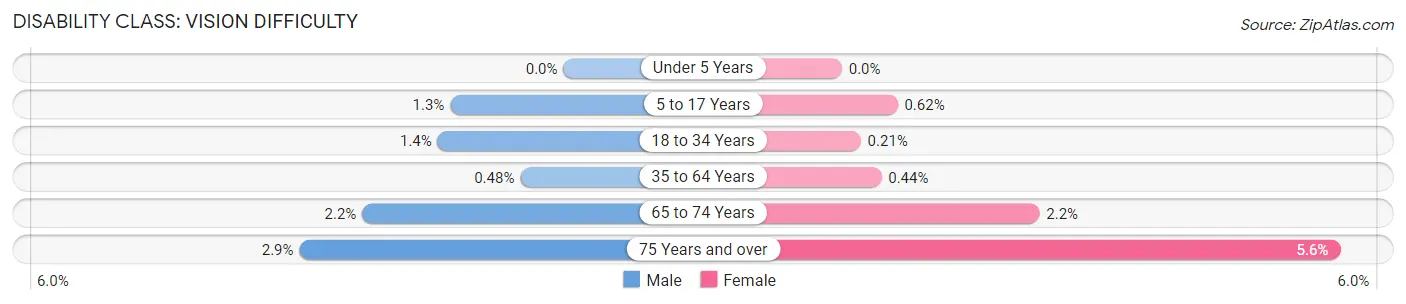
| Age Bracket | Male | Female |
| Under 5 Years | 0 (0.0%) | 0 (0.0%) |
| 5 to 17 Years | 67 (1.3%) | 27 (0.6%) |
| 18 to 34 Years | 95 (1.4%) | 14 (0.2%) |
| 35 to 64 Years | 64 (0.5%) | 65 (0.4%) |
| 65 to 74 Years | 146 (2.2%) | 153 (2.2%) |
| 75 Years and over | 120 (2.9%) | 231 (5.6%) |
Disability Class: Cognitive Difficulty
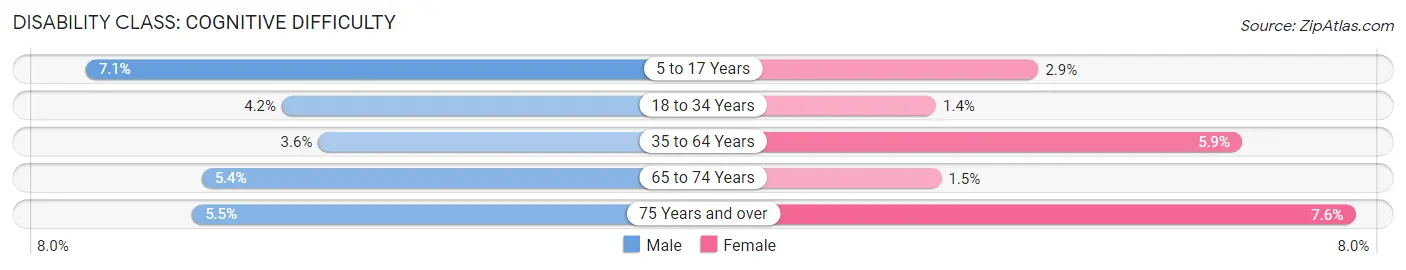
| Age Bracket | Male | Female |
| 5 to 17 Years | 377 (7.1%) | 128 (2.9%) |
| 18 to 34 Years | 284 (4.2%) | 94 (1.4%) |
| 35 to 64 Years | 480 (3.6%) | 875 (5.9%) |
| 65 to 74 Years | 350 (5.4%) | 103 (1.5%) |
| 75 Years and over | 225 (5.5%) | 317 (7.6%) |
Disability Class: Ambulatory Difficulty
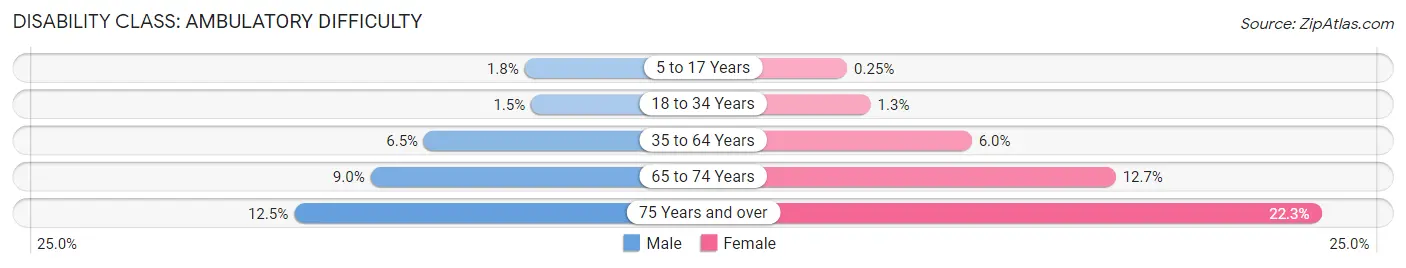
| Age Bracket | Male | Female |
| 5 to 17 Years | 96 (1.8%) | 11 (0.3%) |
| 18 to 34 Years | 102 (1.5%) | 90 (1.3%) |
| 35 to 64 Years | 854 (6.5%) | 888 (6.0%) |
| 65 to 74 Years | 584 (8.9%) | 882 (12.7%) |
| 75 Years and over | 510 (12.5%) | 926 (22.3%) |
Disability Class: Self-Care Difficulty
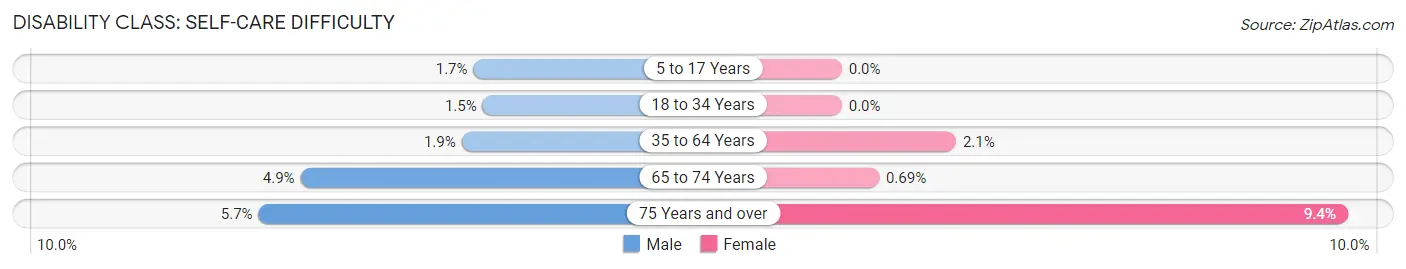
| Age Bracket | Male | Female |
| 5 to 17 Years | 89 (1.7%) | 0 (0.0%) |
| 18 to 34 Years | 102 (1.5%) | 0 (0.0%) |
| 35 to 64 Years | 249 (1.9%) | 312 (2.1%) |
| 65 to 74 Years | 318 (4.9%) | 48 (0.7%) |
| 75 Years and over | 231 (5.7%) | 391 (9.4%) |
Technology Access in North Port
Computing Device Access in North Port
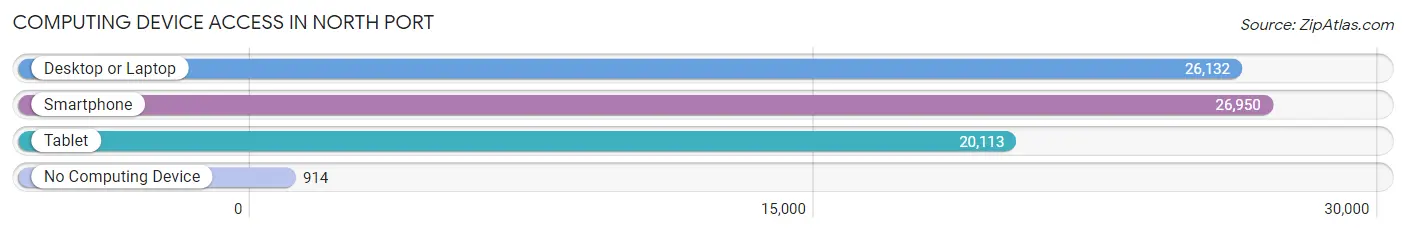
| Device Type | # Households | % Households |
| Desktop or Laptop | 26,132 | 86.7% |
| Smartphone | 26,950 | 89.4% |
| Tablet | 20,113 | 66.8% |
| No Computing Device | 914 | 3.0% |
| Total | 30,129 | 100.0% |
Internet Access in North Port
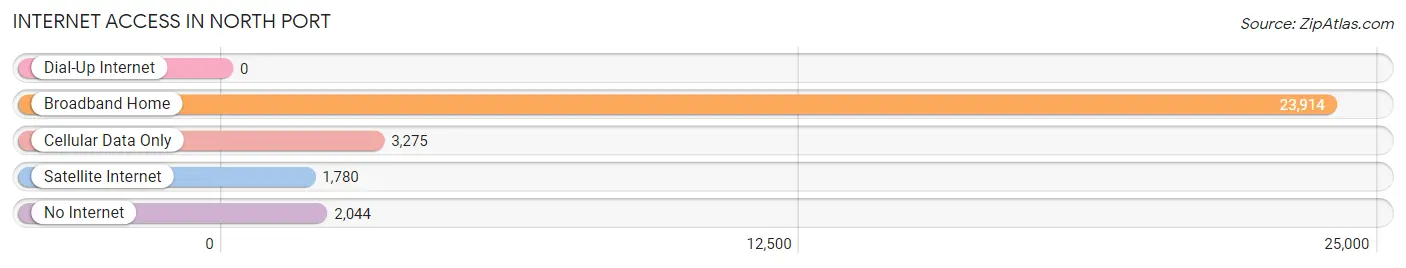
| Internet Type | # Households | % Households |
| Dial-Up Internet | 0 | 0.0% |
| Broadband Home | 23,914 | 79.4% |
| Cellular Data Only | 3,275 | 10.9% |
| Satellite Internet | 1,780 | 5.9% |
| No Internet | 2,044 | 6.8% |
| Total | 30,129 | 100.0% |
North Port Summary
Introduction
North Port is a city located in Sarasota County, Florida, United States. It is the most populous city in the county with a population of 59,357 as of the 2010 census. North Port is located in the Tampa Bay Area and is part of the Bradenton-Sarasota-Venice Metropolitan Statistical Area. The city is situated between the Myakka River and the Peace River, and is known for its natural beauty and outdoor activities.
History
North Port was first settled in the late 1800s by homesteaders who were attracted to the area by its natural beauty and abundant wildlife. The city was officially incorporated in 1959 and was named after the nearby port of North Port Charlotte. The city has grown steadily since then, and today it is home to a diverse population of over 59,000 people.
Geography
North Port is located in the southwestern part of Sarasota County, Florida. It is bordered by the cities of Port Charlotte to the north, Englewood to the east, Venice to the south, and Punta Gorda to the west. The city covers an area of approximately 58 square miles and is situated between the Myakka River and the Peace River. The city is known for its natural beauty and is home to several parks and nature preserves.
Climate
North Port has a humid subtropical climate, with hot, humid summers and mild winters. The average temperature in the summer months is around 90°F, while in the winter months it is around 70°F. The city receives an average of 54 inches of rain per year, with most of it falling in the summer months.
Economy
North Port’s economy is largely based on tourism and manufacturing. The city is home to several large manufacturing companies, including Tropicana Products, Inc., which produces orange juice and other citrus products. The city is also home to several retail stores, restaurants, and other businesses.
Demographics
As of the 2010 census, North Port had a population of 59,357. The racial makeup of the city was 79.2% White, 11.3% African American, 0.5% Native American, 1.7% Asian, 0.1% Pacific Islander, 5.2% from other races, and 2.1% from two or more races. Hispanic or Latino of any race were 16.3% of the population.
Conclusion
North Port is a vibrant city located in Sarasota County, Florida. It is known for its natural beauty and outdoor activities, and is home to a diverse population of over 59,000 people. The city’s economy is largely based on tourism and manufacturing, and it is home to several large companies and retail stores. North Port is a great place to live, work, and play, and is sure to continue to grow and thrive in the years to come.
Common Questions
What is Per Capita Income in North Port?
Per Capita income in North Port is $40,064.
What is the Median Family Income in North Port?
Median Family Income in North Port is $88,390.
What is the Median Household income in North Port?
Median Household Income in North Port is $78,815.
What is Income or Wage Gap in North Port?
Income or Wage Gap in North Port is 25.4%.
Women in North Port earn 74.6 cents for every dollar earned by a man.
What is Inequality or Gini Index in North Port?
Inequality or Gini Index in North Port is 0.42.
What is the Total Population of North Port?
Total Population of North Port is 76,975.
What is the Total Male Population of North Port?
Total Male Population of North Port is 37,668.
What is the Total Female Population of North Port?
Total Female Population of North Port is 39,307.
What is the Ratio of Males per 100 Females in North Port?
There are 95.83 Males per 100 Females in North Port.
What is the Ratio of Females per 100 Males in North Port?
There are 104.35 Females per 100 Males in North Port.
What is the Median Population Age in North Port?
Median Population Age in North Port is 49.5 Years.
What is the Average Family Size in North Port
Average Family Size in North Port is 2.9 People.
What is the Average Household Size in North Port
Average Household Size in North Port is 2.5 People.
How Large is the Labor Force in North Port?
There are 33,971 People in the Labor Forcein in North Port.
What is the Percentage of People in the Labor Force in North Port?
52.1% of People are in the Labor Force in North Port.
What is the Unemployment Rate in North Port?
Unemployment Rate in North Port is 3.3%.