Miami Beach, FL Map & Demographics
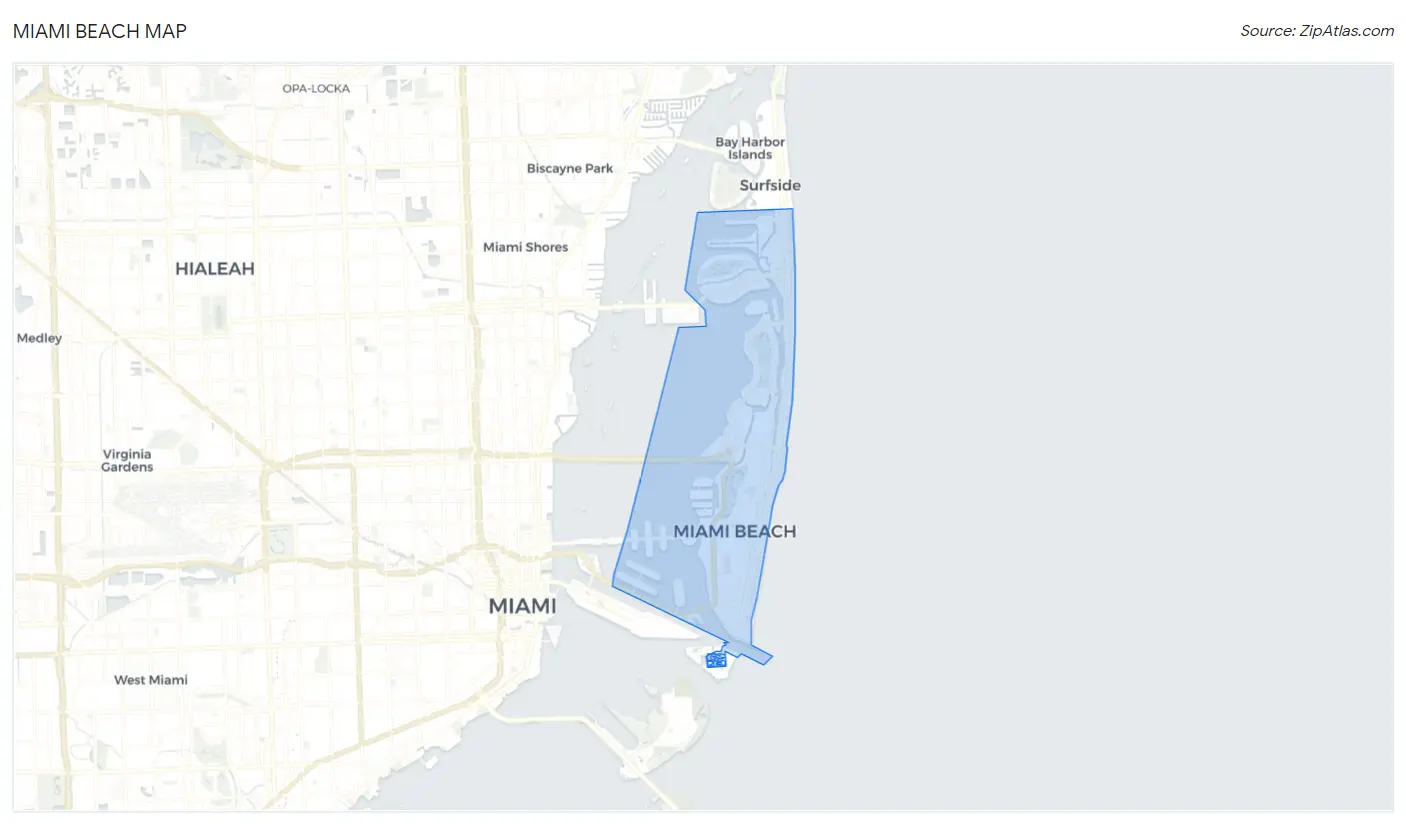
Miami Beach Map
Miami Beach Overview
$69,329
PER CAPITA INCOME
$91,629
AVG FAMILY INCOME
$65,116
AVG HOUSEHOLD INCOME
31.3%
WAGE / INCOME GAP [ % ]
68.7¢/ $1
WAGE / INCOME GAP [ $ ]
$8,234
FAMILY INCOME DEFICIT
0.62
INEQUALITY / GINI INDEX
82,400
TOTAL POPULATION
42,139
MALE POPULATION
40,261
FEMALE POPULATION
104.66
MALES / 100 FEMALES
95.54
FEMALES / 100 MALES
42.3
MEDIAN AGE
2.8
AVG FAMILY SIZE
1.9
AVG HOUSEHOLD SIZE
49,272
LABOR FORCE [ PEOPLE ]
68.8%
PERCENT IN LABOR FORCE
4.0%
UNEMPLOYMENT RATE
Income in Miami Beach
Income Overview in Miami Beach
Per Capita Income in Miami Beach is $69,329, while median incomes of families and households are $91,629 and $65,116 respectively.
| Characteristic | Number | Measure |
| Per Capita Income | 82,400 | $69,329 |
| Median Family Income | 18,031 | $91,629 |
| Mean Family Income | 18,031 | $181,164 |
| Median Household Income | 41,711 | $65,116 |
| Mean Household Income | 41,711 | $132,663 |
| Income Deficit | 18,031 | $8,234 |
| Wage / Income Gap (%) | 82,400 | 31.28% |
| Wage / Income Gap ($) | 82,400 | 68.72¢ per $1 |
| Gini / Inequality Index | 82,400 | 0.62 |
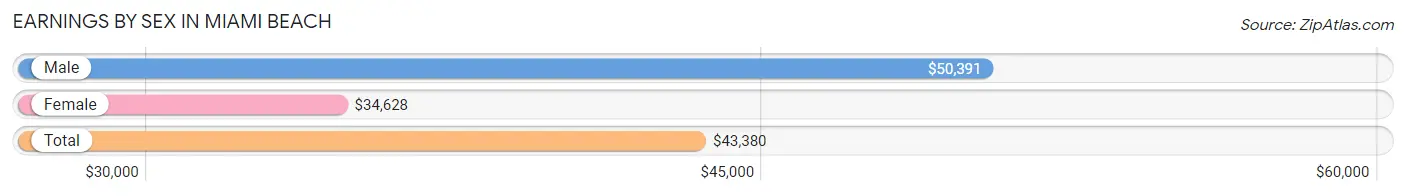
Earnings by Sex in Miami Beach
Average Earnings in Miami Beach are $43,380, $50,391 for men and $34,628 for women, a difference of 31.3%.
| Sex | Number | Average Earnings |
| Male | 29,413 (57.7%) | $50,391 |
| Female | 21,608 (42.3%) | $34,628 |
| Total | 51,021 (100.0%) | $43,380 |
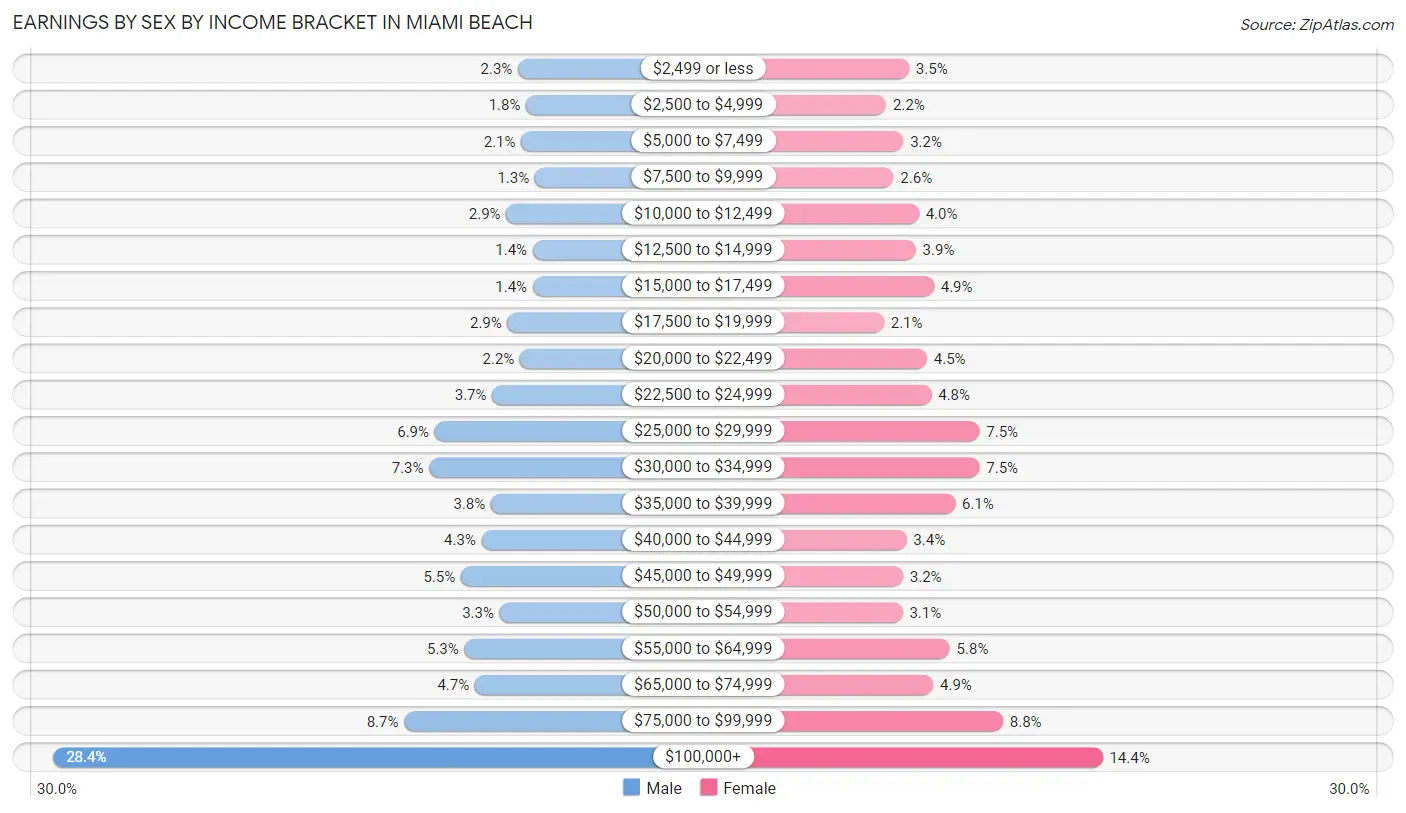
Earnings by Sex by Income Bracket in Miami Beach
The most common earnings brackets in Miami Beach are $100,000+ for men (8,350 | 28.4%) and $100,000+ for women (3,105 | 14.4%).
| Income | Male | Female |
| $2,499 or less | 664 (2.3%) | 754 (3.5%) |
| $2,500 to $4,999 | 530 (1.8%) | 478 (2.2%) |
| $5,000 to $7,499 | 613 (2.1%) | 686 (3.2%) |
| $7,500 to $9,999 | 384 (1.3%) | 566 (2.6%) |
| $10,000 to $12,499 | 860 (2.9%) | 872 (4.0%) |
| $12,500 to $14,999 | 421 (1.4%) | 837 (3.9%) |
| $15,000 to $17,499 | 422 (1.4%) | 1,056 (4.9%) |
| $17,500 to $19,999 | 837 (2.9%) | 449 (2.1%) |
| $20,000 to $22,499 | 633 (2.1%) | 972 (4.5%) |
| $22,500 to $24,999 | 1,090 (3.7%) | 1,027 (4.8%) |
| $25,000 to $29,999 | 2,042 (6.9%) | 1,610 (7.4%) |
| $30,000 to $34,999 | 2,133 (7.2%) | 1,610 (7.4%) |
| $35,000 to $39,999 | 1,113 (3.8%) | 1,314 (6.1%) |
| $40,000 to $44,999 | 1,269 (4.3%) | 724 (3.4%) |
| $45,000 to $49,999 | 1,610 (5.5%) | 681 (3.2%) |
| $50,000 to $54,999 | 969 (3.3%) | 676 (3.1%) |
| $55,000 to $64,999 | 1,550 (5.3%) | 1,249 (5.8%) |
| $65,000 to $74,999 | 1,377 (4.7%) | 1,047 (4.9%) |
| $75,000 to $99,999 | 2,546 (8.7%) | 1,895 (8.8%) |
| $100,000+ | 8,350 (28.4%) | 3,105 (14.4%) |
| Total | 29,413 (100.0%) | 21,608 (100.0%) |
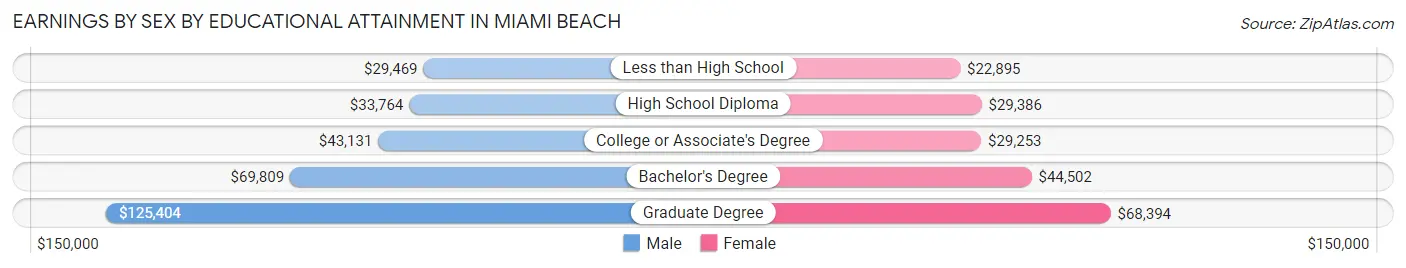
Earnings by Sex by Educational Attainment in Miami Beach
Average earnings in Miami Beach are $53,860 for men and $37,039 for women, a difference of 31.2%. Men with an educational attainment of graduate degree enjoy the highest average annual earnings of $125,404, while those with less than high school education earn the least with $29,469. Women with an educational attainment of graduate degree earn the most with the average annual earnings of $68,394, while those with less than high school education have the smallest earnings of $22,895.
| Educational Attainment | Male Income | Female Income |
| Less than High School | $29,469 | $22,895 |
| High School Diploma | $33,764 | $29,386 |
| College or Associate's Degree | $43,131 | $29,253 |
| Bachelor's Degree | $69,809 | $44,502 |
| Graduate Degree | $125,404 | $68,394 |
| Total | $53,860 | $37,039 |
Family Income in Miami Beach
Family Income Brackets in Miami Beach
According to the Miami Beach family income data, there are 4,219 families falling into the $200,000+ income range, which is the most common income bracket and makes up 23.4% of all families. Conversely, the $10,000 to $14,999 income bracket is the least frequent group with only 361 families (2.0%) belonging to this category.
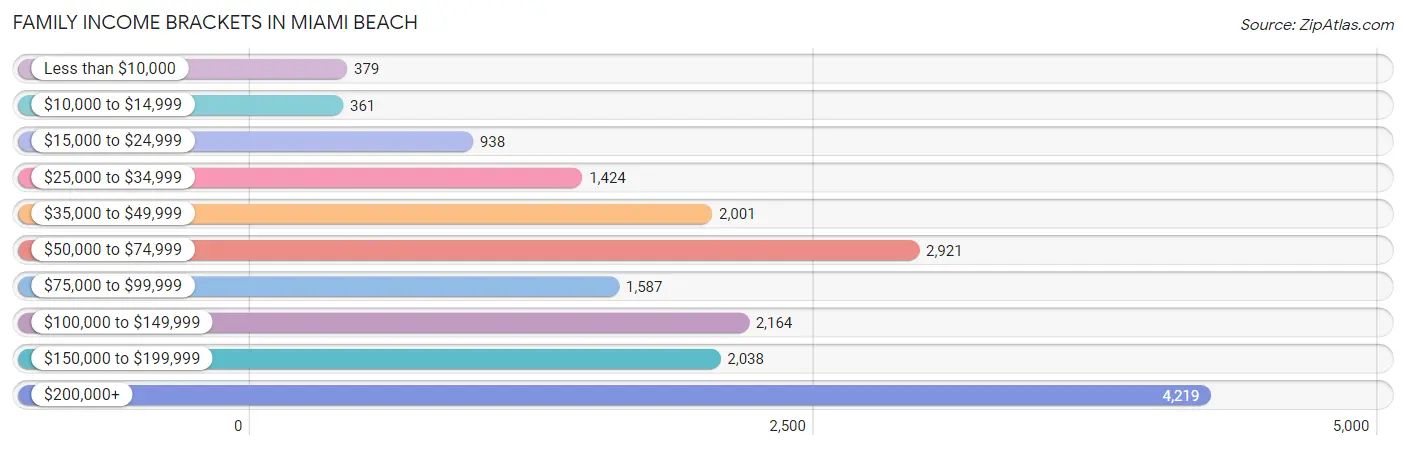
| Income Bracket | # Families | % Families |
| Less than $10,000 | 379 | 2.1% |
| $10,000 to $14,999 | 361 | 2.0% |
| $15,000 to $24,999 | 938 | 5.2% |
| $25,000 to $34,999 | 1,424 | 7.9% |
| $35,000 to $49,999 | 2,001 | 11.1% |
| $50,000 to $74,999 | 2,921 | 16.2% |
| $75,000 to $99,999 | 1,587 | 8.8% |
| $100,000 to $149,999 | 2,164 | 12.0% |
| $150,000 to $199,999 | 2,038 | 11.3% |
| $200,000+ | 4,219 | 23.4% |
Family Income by Famaliy Size in Miami Beach
7+ person families (43 | 0.2%) account for the highest median family income in Miami Beach with $250,001 per family, while 2-person families (10,620 | 58.9%) have the highest median income of $42,578 per family member.
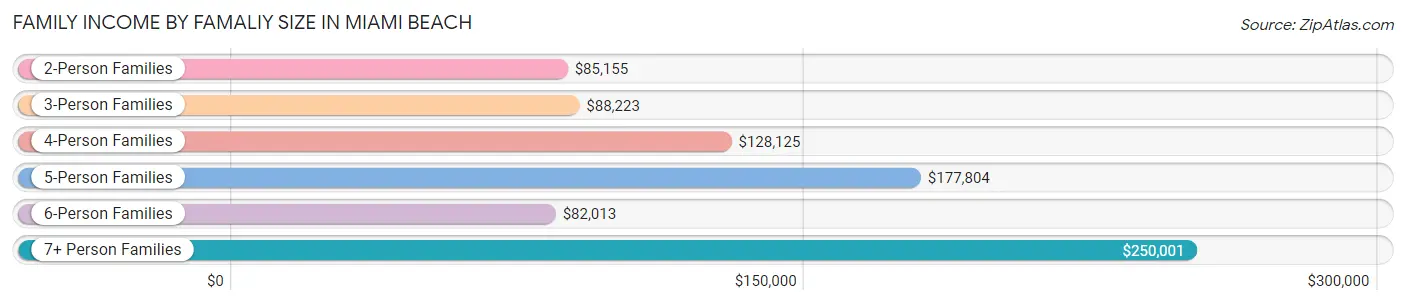
| Income Bracket | # Families | Median Income |
| 2-Person Families | 10,620 (58.9%) | $85,155 |
| 3-Person Families | 4,003 (22.2%) | $88,223 |
| 4-Person Families | 2,641 (14.6%) | $128,125 |
| 5-Person Families | 629 (3.5%) | $177,804 |
| 6-Person Families | 95 (0.5%) | $82,013 |
| 7+ Person Families | 43 (0.2%) | $250,001 |
| Total | 18,031 (100.0%) | $91,629 |
Family Income by Number of Earners in Miami Beach
The median family income in Miami Beach is $91,629, with families comprising 2 earners (8,412) having the highest median family income of $115,547, while families with no earners (2,270) have the lowest median family income of $39,576, accounting for 46.7% and 12.6% of families, respectively.
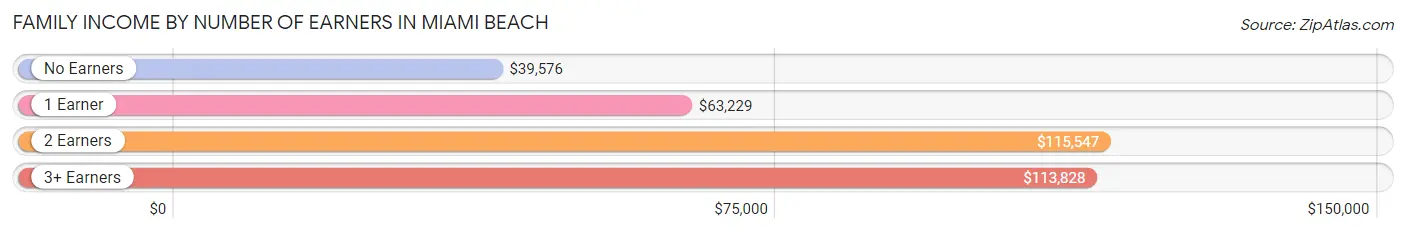
| Number of Earners | # Families | Median Income |
| No Earners | 2,270 (12.6%) | $39,576 |
| 1 Earner | 6,070 (33.7%) | $63,229 |
| 2 Earners | 8,412 (46.7%) | $115,547 |
| 3+ Earners | 1,279 (7.1%) | $113,828 |
| Total | 18,031 (100.0%) | $91,629 |
Household Income in Miami Beach
Household Income Brackets in Miami Beach
With 6,382 households falling in the category, the $200,000+ income range is the most frequent in Miami Beach, accounting for 15.3% of all households. In contrast, only 2,336 households (5.6%) fall into the less than $10,000 income bracket, making it the least populous group.
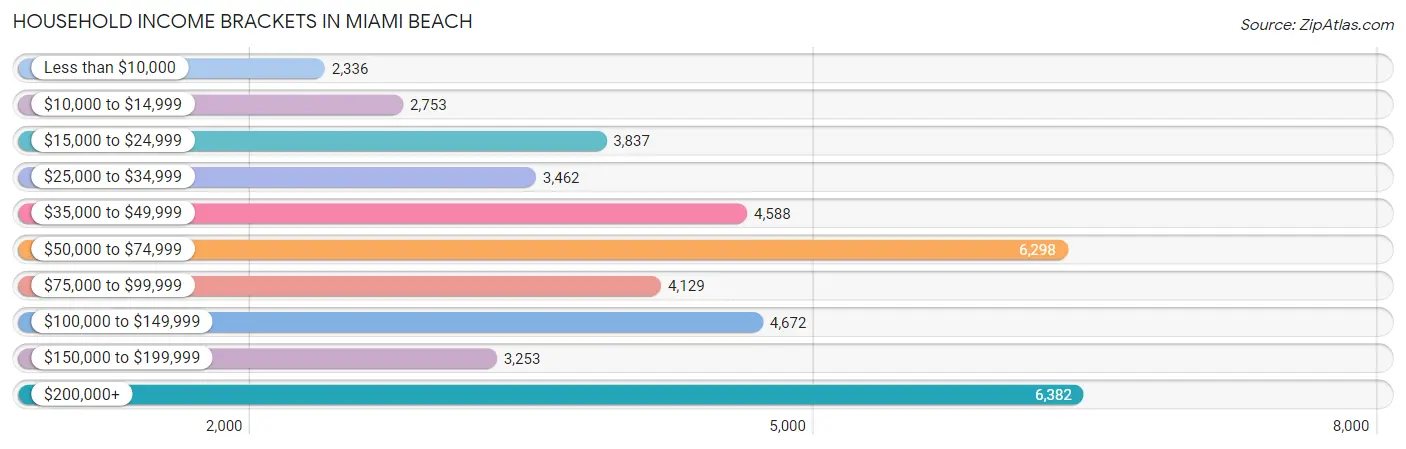
| Income Bracket | # Households | % Households |
| Less than $10,000 | 2,336 | 5.6% |
| $10,000 to $14,999 | 2,753 | 6.6% |
| $15,000 to $24,999 | 3,837 | 9.2% |
| $25,000 to $34,999 | 3,462 | 8.3% |
| $35,000 to $49,999 | 4,588 | 11.0% |
| $50,000 to $74,999 | 6,298 | 15.1% |
| $75,000 to $99,999 | 4,129 | 9.9% |
| $100,000 to $149,999 | 4,672 | 11.2% |
| $150,000 to $199,999 | 3,253 | 7.8% |
| $200,000+ | 6,382 | 15.3% |
Household Income by Householder Age in Miami Beach
The median household income in Miami Beach is $65,116, with the highest median household income of $76,070 found in the 45 to 64 years age bracket for the primary householder. A total of 14,845 households (35.6%) fall into this category. Meanwhile, the 65+ years age bracket for the primary householder has the lowest median household income of $35,881, with 9,964 households (23.9%) in this group.
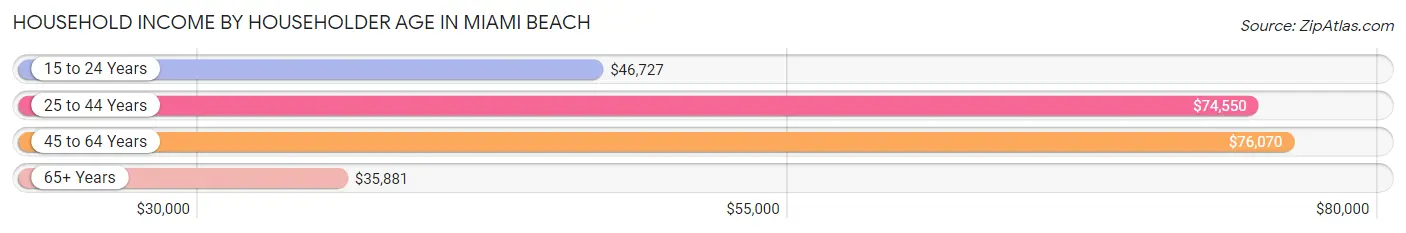
| Income Bracket | # Households | Median Income |
| 15 to 24 Years | 1,103 (2.6%) | $46,727 |
| 25 to 44 Years | 15,799 (37.9%) | $74,550 |
| 45 to 64 Years | 14,845 (35.6%) | $76,070 |
| 65+ Years | 9,964 (23.9%) | $35,881 |
| Total | 41,711 (100.0%) | $65,116 |
Poverty in Miami Beach
Income Below Poverty by Sex and Age in Miami Beach
With 11.7% poverty level for males and 15.5% for females among the residents of Miami Beach, 75 year old and over males and 75 year old and over females are the most vulnerable to poverty, with 714 males (29.2%) and 1,247 females (35.8%) in their respective age groups living below the poverty level.
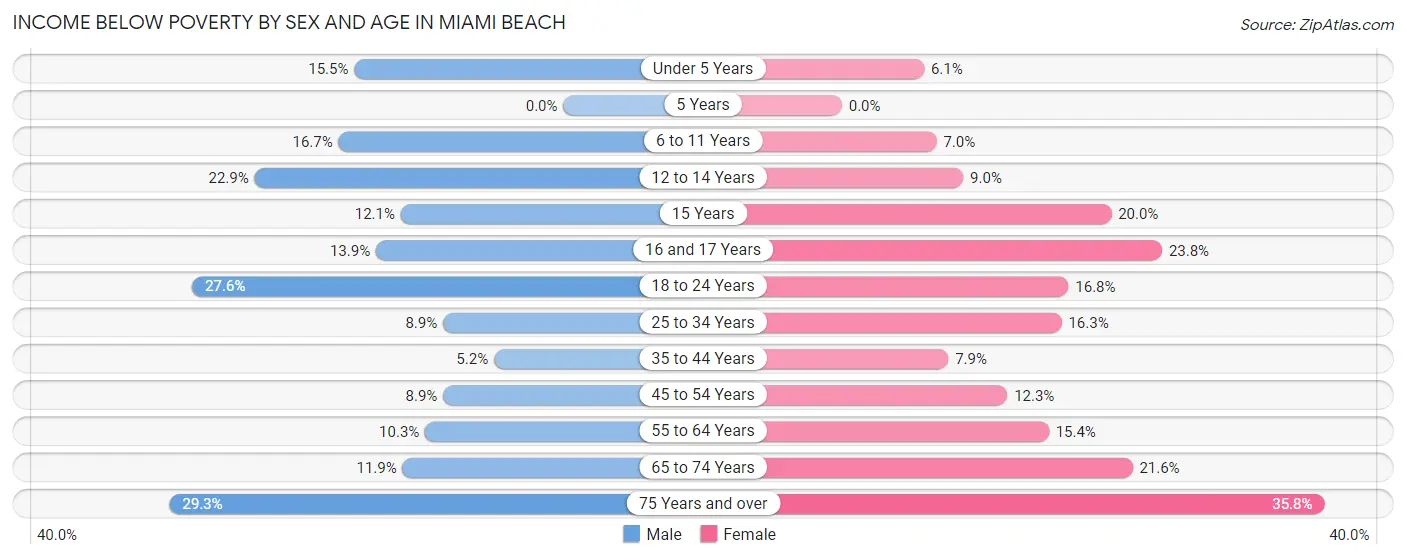
| Age Bracket | Male | Female |
| Under 5 Years | 274 (15.5%) | 107 (6.1%) |
| 5 Years | 0 (0.0%) | 0 (0.0%) |
| 6 to 11 Years | 296 (16.7%) | 154 (7.0%) |
| 12 to 14 Years | 183 (22.9%) | 79 (9.0%) |
| 15 Years | 35 (12.1%) | 83 (20.0%) |
| 16 and 17 Years | 105 (13.9%) | 111 (23.8%) |
| 18 to 24 Years | 558 (27.6%) | 405 (16.8%) |
| 25 to 34 Years | 637 (8.9%) | 1,139 (16.3%) |
| 35 to 44 Years | 396 (5.1%) | 468 (7.9%) |
| 45 to 54 Years | 655 (8.9%) | 668 (12.3%) |
| 55 to 64 Years | 564 (10.3%) | 717 (15.4%) |
| 65 to 74 Years | 486 (11.9%) | 993 (21.6%) |
| 75 Years and over | 714 (29.2%) | 1,247 (35.8%) |
| Total | 4,903 (11.7%) | 6,171 (15.5%) |
Income Above Poverty by Sex and Age in Miami Beach
According to the poverty statistics in Miami Beach, males aged 5 years and females aged 5 years are the age groups that are most secure financially, with 100.0% of males and 100.0% of females in these age groups living above the poverty line.
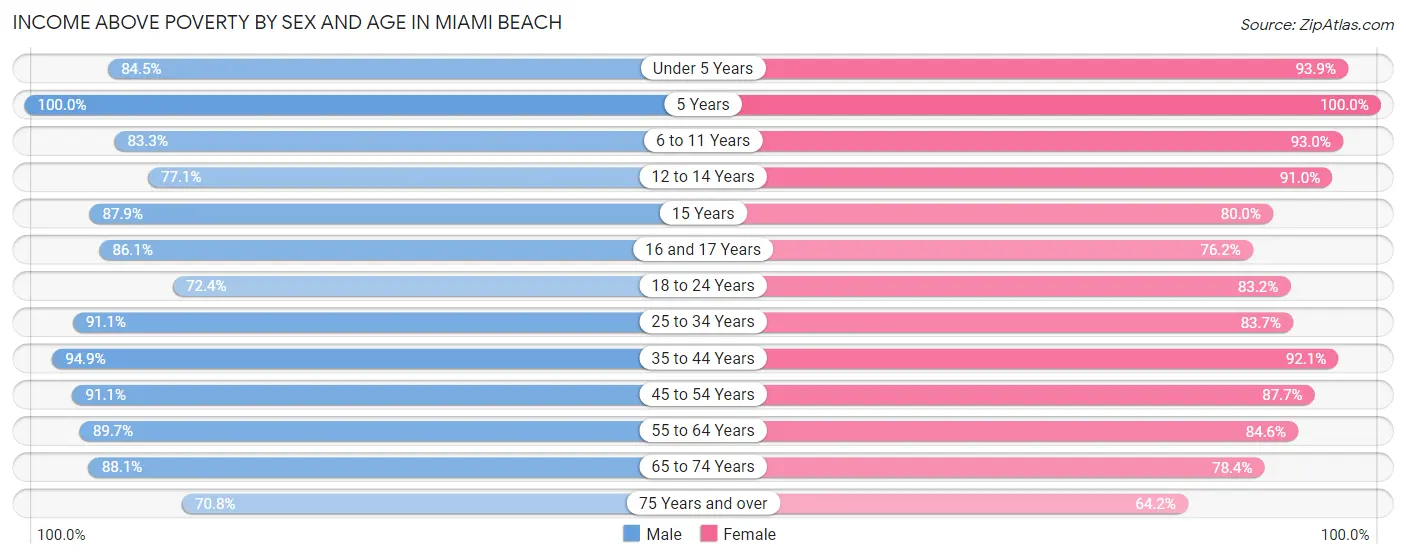
| Age Bracket | Male | Female |
| Under 5 Years | 1,492 (84.5%) | 1,647 (93.9%) |
| 5 Years | 197 (100.0%) | 597 (100.0%) |
| 6 to 11 Years | 1,478 (83.3%) | 2,037 (93.0%) |
| 12 to 14 Years | 615 (77.1%) | 798 (91.0%) |
| 15 Years | 255 (87.9%) | 332 (80.0%) |
| 16 and 17 Years | 650 (86.1%) | 356 (76.2%) |
| 18 to 24 Years | 1,466 (72.4%) | 2,003 (83.2%) |
| 25 to 34 Years | 6,498 (91.1%) | 5,846 (83.7%) |
| 35 to 44 Years | 7,297 (94.9%) | 5,455 (92.1%) |
| 45 to 54 Years | 6,685 (91.1%) | 4,772 (87.7%) |
| 55 to 64 Years | 4,935 (89.7%) | 3,952 (84.6%) |
| 65 to 74 Years | 3,585 (88.1%) | 3,608 (78.4%) |
| 75 Years and over | 1,727 (70.8%) | 2,234 (64.2%) |
| Total | 36,880 (88.3%) | 33,637 (84.5%) |
Income Below Poverty Among Married-Couple Families in Miami Beach
The poverty statistics for married-couple families in Miami Beach show that 5.0% or 663 of the total 13,382 families live below the poverty line. Families with 1 or 2 children have the highest poverty rate of 5.7%, comprising of 206 families. On the other hand, families with 5 or more children have the lowest poverty rate of 0.0%, which includes 0 families.
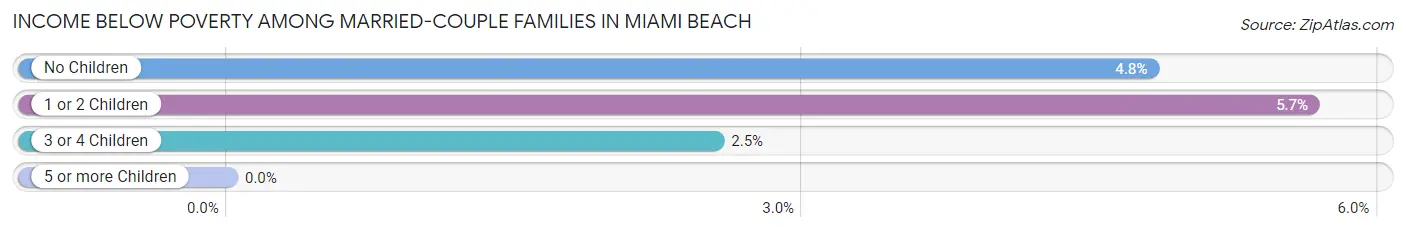
| Children | Above Poverty | Below Poverty |
| No Children | 8,855 (95.2%) | 447 (4.8%) |
| 1 or 2 Children | 3,438 (94.4%) | 206 (5.7%) |
| 3 or 4 Children | 383 (97.5%) | 10 (2.5%) |
| 5 or more Children | 43 (100.0%) | 0 (0.0%) |
| Total | 12,719 (95.1%) | 663 (5.0%) |
Income Below Poverty Among Single-Parent Households in Miami Beach
According to the poverty data in Miami Beach, 7.8% or 169 single-father households and 19.8% or 490 single-mother households are living below the poverty line. Among single-father households, those with 1 or 2 children have the highest poverty rate, with 96 households (9.8%) experiencing poverty. Likewise, among single-mother households, those with 3 or 4 children have the highest poverty rate, with 75 households (46.6%) falling below the poverty line.
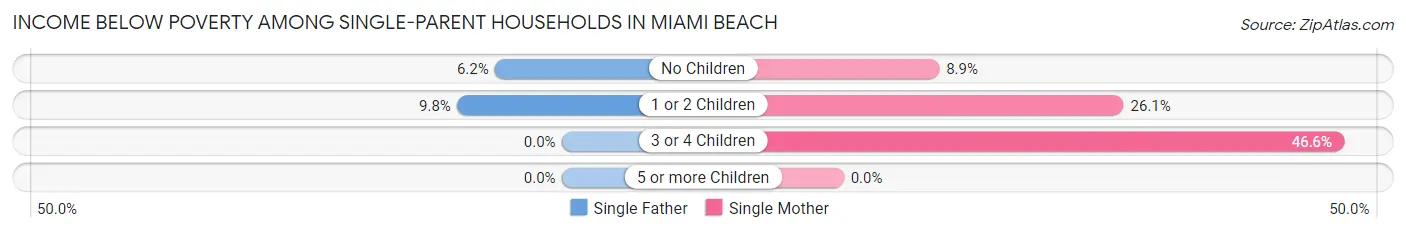
| Children | Single Father | Single Mother |
| No Children | 73 (6.2%) | 98 (8.9%) |
| 1 or 2 Children | 96 (9.8%) | 317 (26.1%) |
| 3 or 4 Children | 0 (0.0%) | 75 (46.6%) |
| 5 or more Children | 0 (0.0%) | 0 (0.0%) |
| Total | 169 (7.8%) | 490 (19.8%) |
Income Below Poverty Among Married-Couple vs Single-Parent Households in Miami Beach
The poverty data for Miami Beach shows that 663 of the married-couple family households (5.0%) and 659 of the single-parent households (14.2%) are living below the poverty level. Within the married-couple family households, those with 1 or 2 children have the highest poverty rate, with 206 households (5.7%) falling below the poverty line. Among the single-parent households, those with 3 or 4 children have the highest poverty rate, with 75 household (42.4%) living below poverty.
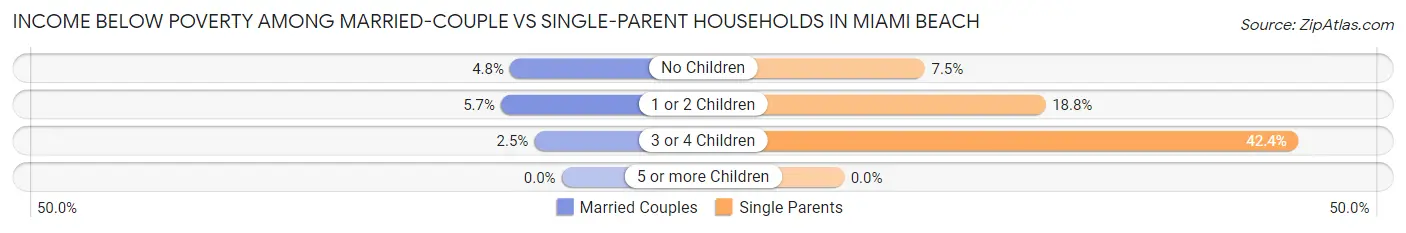
| Children | Married-Couple Families | Single-Parent Households |
| No Children | 447 (4.8%) | 171 (7.5%) |
| 1 or 2 Children | 206 (5.7%) | 413 (18.8%) |
| 3 or 4 Children | 10 (2.5%) | 75 (42.4%) |
| 5 or more Children | 0 (0.0%) | 0 (0.0%) |
| Total | 663 (5.0%) | 659 (14.2%) |
Race in Miami Beach
The most populous races in Miami Beach are White / Caucasian (50,761 | 61.6%), Hispanic or Latino (45,853 | 55.6%), and Two or more Races (16,802 | 20.4%).
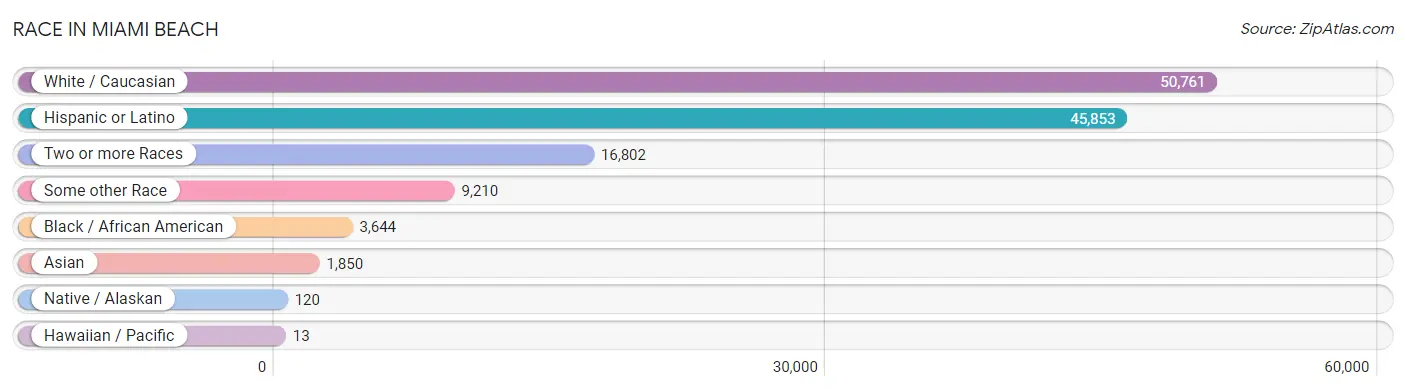
| Race | # Population | % Population |
| Asian | 1,850 | 2.2% |
| Black / African American | 3,644 | 4.4% |
| Hawaiian / Pacific | 13 | 0.0% |
| Hispanic or Latino | 45,853 | 55.6% |
| Native / Alaskan | 120 | 0.2% |
| White / Caucasian | 50,761 | 61.6% |
| Two or more Races | 16,802 | 20.4% |
| Some other Race | 9,210 | 11.2% |
| Total | 82,400 | 100.0% |
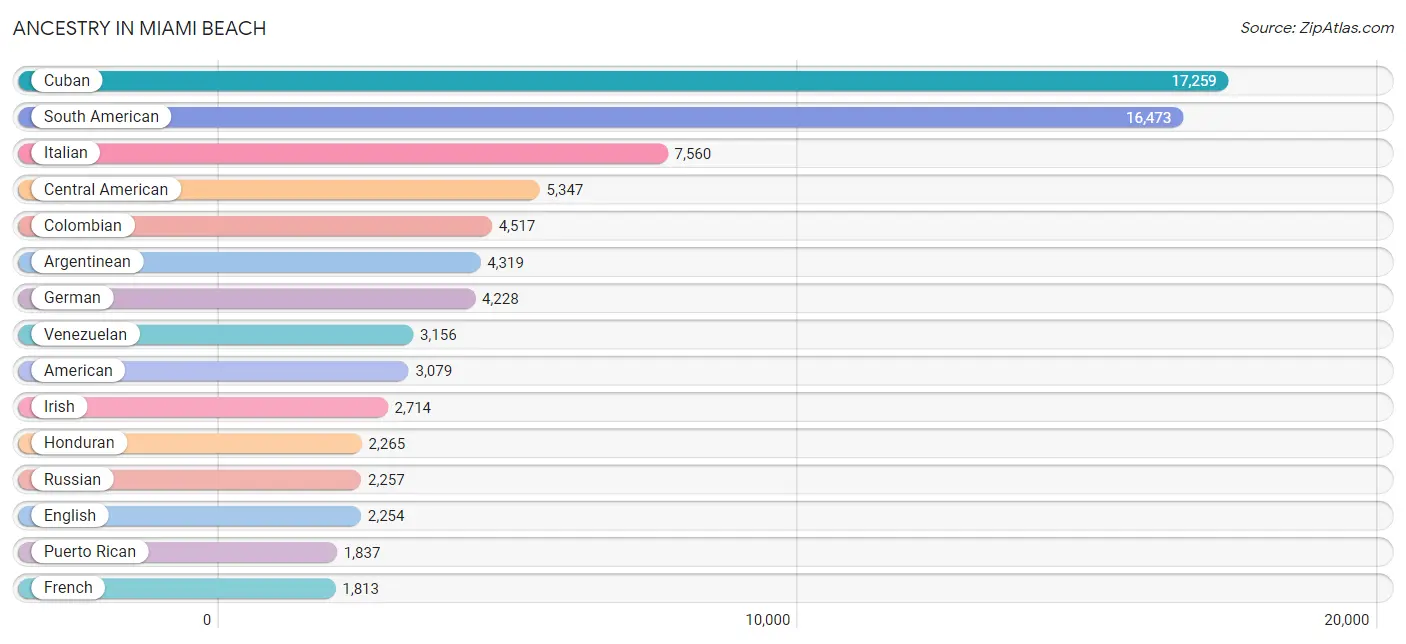
Ancestry in Miami Beach
The most populous ancestries reported in Miami Beach are Cuban (17,259 | 20.9%), South American (16,473 | 20.0%), Italian (7,560 | 9.2%), Central American (5,347 | 6.5%), and Colombian (4,517 | 5.5%), together accounting for 62.1% of all Miami Beach residents.
| Ancestry | # Population | % Population |
| African | 555 | 0.7% |
| Albanian | 27 | 0.0% |
| American | 3,079 | 3.7% |
| Apache | 14 | 0.0% |
| Arab | 1,299 | 1.6% |
| Argentinean | 4,319 | 5.2% |
| Armenian | 33 | 0.0% |
| Assyrian / Chaldean / Syriac | 9 | 0.0% |
| Australian | 20 | 0.0% |
| Austrian | 525 | 0.6% |
| Bahamian | 29 | 0.0% |
| Basque | 315 | 0.4% |
| Belgian | 46 | 0.1% |
| Belizean | 20 | 0.0% |
| Bhutanese | 111 | 0.1% |
| Bolivian | 211 | 0.3% |
| Brazilian | 984 | 1.2% |
| British | 409 | 0.5% |
| Bulgarian | 78 | 0.1% |
| Burmese | 209 | 0.3% |
| Cajun | 6 | 0.0% |
| Cambodian | 14 | 0.0% |
| Canadian | 398 | 0.5% |
| Central American | 5,347 | 6.5% |
| Central American Indian | 57 | 0.1% |
| Cherokee | 35 | 0.0% |
| Chilean | 901 | 1.1% |
| Chippewa | 8 | 0.0% |
| Choctaw | 29 | 0.0% |
| Colombian | 4,517 | 5.5% |
| Costa Rican | 273 | 0.3% |
| Creek | 12 | 0.0% |
| Croatian | 258 | 0.3% |
| Cuban | 17,259 | 20.9% |
| Czech | 179 | 0.2% |
| Czechoslovakian | 29 | 0.0% |
| Danish | 130 | 0.2% |
| Dominican | 660 | 0.8% |
| Dutch | 305 | 0.4% |
| Eastern European | 661 | 0.8% |
| Ecuadorian | 946 | 1.1% |
| Egyptian | 93 | 0.1% |
| English | 2,254 | 2.7% |
| Estonian | 22 | 0.0% |
| Ethiopian | 14 | 0.0% |
| European | 1,451 | 1.8% |
| Filipino | 9 | 0.0% |
| Finnish | 93 | 0.1% |
| French | 1,813 | 2.2% |
| French Canadian | 201 | 0.2% |
| German | 4,228 | 5.1% |
| Ghanaian | 20 | 0.0% |
| Greek | 196 | 0.2% |
| Guamanian / Chamorro | 13 | 0.0% |
| Guatemalan | 1,576 | 1.9% |
| Haitian | 296 | 0.4% |
| Honduran | 2,265 | 2.8% |
| Hungarian | 445 | 0.5% |
| Indian (Asian) | 390 | 0.5% |
| Iranian | 147 | 0.2% |
| Iraqi | 6 | 0.0% |
| Irish | 2,714 | 3.3% |
| Iroquois | 12 | 0.0% |
| Israeli | 300 | 0.4% |
| Italian | 7,560 | 9.2% |
| Jamaican | 240 | 0.3% |
| Japanese | 15 | 0.0% |
| Jordanian | 7 | 0.0% |
| Kenyan | 68 | 0.1% |
| Korean | 591 | 0.7% |
| Latvian | 10 | 0.0% |
| Lebanese | 276 | 0.3% |
| Lithuanian | 259 | 0.3% |
| Luxembourger | 5 | 0.0% |
| Macedonian | 9 | 0.0% |
| Maltese | 30 | 0.0% |
| Mexican | 1,416 | 1.7% |
| Mexican American Indian | 19 | 0.0% |
| Mongolian | 14 | 0.0% |
| Moroccan | 363 | 0.4% |
| Native Hawaiian | 49 | 0.1% |
| Nicaraguan | 809 | 1.0% |
| Northern European | 57 | 0.1% |
| Norwegian | 373 | 0.4% |
| Pakistani | 157 | 0.2% |
| Palestinian | 8 | 0.0% |
| Panamanian | 102 | 0.1% |
| Paraguayan | 182 | 0.2% |
| Peruvian | 1,504 | 1.8% |
| Polish | 1,471 | 1.8% |
| Portuguese | 958 | 1.2% |
| Potawatomi | 30 | 0.0% |
| Puerto Rican | 1,837 | 2.2% |
| Romanian | 519 | 0.6% |
| Russian | 2,257 | 2.7% |
| Salvadoran | 322 | 0.4% |
| Scandinavian | 56 | 0.1% |
| Scotch-Irish | 168 | 0.2% |
| Scottish | 489 | 0.6% |
| Senegalese | 5 | 0.0% |
| Serbian | 54 | 0.1% |
| Slovak | 96 | 0.1% |
| South African | 31 | 0.0% |
| South American | 16,473 | 20.0% |
| South American Indian | 9 | 0.0% |
| Spaniard | 1,148 | 1.4% |
| Spanish | 447 | 0.5% |
| Sri Lankan | 140 | 0.2% |
| Subsaharan African | 707 | 0.9% |
| Swedish | 228 | 0.3% |
| Swiss | 206 | 0.3% |
| Syrian | 20 | 0.0% |
| Taiwanese | 89 | 0.1% |
| Thai | 787 | 1.0% |
| Trinidadian and Tobagonian | 59 | 0.1% |
| Turkish | 485 | 0.6% |
| U.S. Virgin Islander | 9 | 0.0% |
| Ukrainian | 464 | 0.6% |
| Uruguayan | 737 | 0.9% |
| Venezuelan | 3,156 | 3.8% |
| Welsh | 136 | 0.2% |
| West Indian | 64 | 0.1% |
| Yugoslavian | 107 | 0.1% | View All 123 Rows |
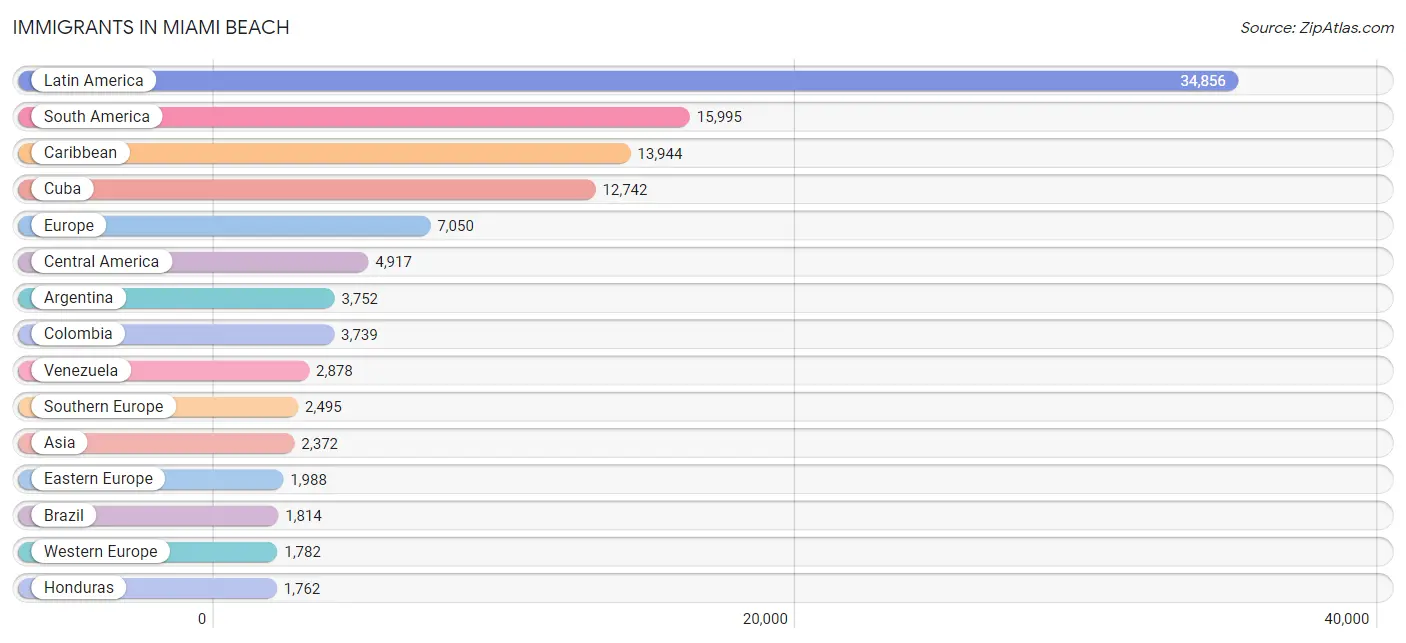
Immigrants in Miami Beach
The most numerous immigrant groups reported in Miami Beach came from Latin America (34,856 | 42.3%), South America (15,995 | 19.4%), Caribbean (13,944 | 16.9%), Cuba (12,742 | 15.5%), and Europe (7,050 | 8.6%), together accounting for 102.6% of all Miami Beach residents.
| Immigration Origin | # Population | % Population |
| Afghanistan | 10 | 0.0% |
| Africa | 498 | 0.6% |
| Albania | 6 | 0.0% |
| Argentina | 3,752 | 4.5% |
| Asia | 2,372 | 2.9% |
| Australia | 145 | 0.2% |
| Austria | 100 | 0.1% |
| Bahamas | 17 | 0.0% |
| Bangladesh | 17 | 0.0% |
| Belarus | 40 | 0.1% |
| Belgium | 37 | 0.0% |
| Belize | 20 | 0.0% |
| Bolivia | 144 | 0.2% |
| Bosnia and Herzegovina | 9 | 0.0% |
| Brazil | 1,814 | 2.2% |
| Bulgaria | 86 | 0.1% |
| Canada | 523 | 0.6% |
| Caribbean | 13,944 | 16.9% |
| Central America | 4,917 | 6.0% |
| Chile | 844 | 1.0% |
| China | 173 | 0.2% |
| Colombia | 3,739 | 4.5% |
| Costa Rica | 252 | 0.3% |
| Croatia | 132 | 0.2% |
| Cuba | 12,742 | 15.5% |
| Czechoslovakia | 94 | 0.1% |
| Dominican Republic | 645 | 0.8% |
| Eastern Africa | 22 | 0.0% |
| Eastern Asia | 343 | 0.4% |
| Eastern Europe | 1,988 | 2.4% |
| Ecuador | 680 | 0.8% |
| Egypt | 95 | 0.1% |
| El Salvador | 315 | 0.4% |
| England | 199 | 0.2% |
| Europe | 7,050 | 8.6% |
| France | 1,044 | 1.3% |
| Germany | 442 | 0.5% |
| Ghana | 20 | 0.0% |
| Greece | 37 | 0.0% |
| Guatemala | 1,364 | 1.7% |
| Guyana | 18 | 0.0% |
| Haiti | 283 | 0.3% |
| Honduras | 1,762 | 2.1% |
| Hong Kong | 25 | 0.0% |
| Hungary | 115 | 0.1% |
| India | 221 | 0.3% |
| Indonesia | 11 | 0.0% |
| Iran | 151 | 0.2% |
| Iraq | 31 | 0.0% |
| Ireland | 25 | 0.0% |
| Israel | 262 | 0.3% |
| Italy | 1,538 | 1.9% |
| Jamaica | 147 | 0.2% |
| Japan | 135 | 0.2% |
| Jordan | 60 | 0.1% |
| Kazakhstan | 53 | 0.1% |
| Kenya | 13 | 0.0% |
| Korea | 35 | 0.0% |
| Laos | 14 | 0.0% |
| Latin America | 34,856 | 42.3% |
| Latvia | 9 | 0.0% |
| Lebanon | 40 | 0.1% |
| Liberia | 9 | 0.0% |
| Lithuania | 46 | 0.1% |
| Malaysia | 14 | 0.0% |
| Mexico | 514 | 0.6% |
| Middle Africa | 27 | 0.0% |
| Moldova | 27 | 0.0% |
| Morocco | 162 | 0.2% |
| Netherlands | 31 | 0.0% |
| Nicaragua | 585 | 0.7% |
| Nigeria | 14 | 0.0% |
| North Macedonia | 9 | 0.0% |
| Northern Africa | 371 | 0.4% |
| Northern Europe | 785 | 0.9% |
| Norway | 15 | 0.0% |
| Oceania | 145 | 0.2% |
| Pakistan | 5 | 0.0% |
| Panama | 105 | 0.1% |
| Peru | 1,339 | 1.6% |
| Philippines | 252 | 0.3% |
| Poland | 60 | 0.1% |
| Portugal | 13 | 0.0% |
| Romania | 262 | 0.3% |
| Russia | 699 | 0.9% |
| Saudi Arabia | 37 | 0.0% |
| Scotland | 20 | 0.0% |
| Serbia | 46 | 0.1% |
| South Africa | 23 | 0.0% |
| South America | 15,995 | 19.4% |
| South Central Asia | 582 | 0.7% |
| South Eastern Asia | 507 | 0.6% |
| Southern Europe | 2,495 | 3.0% |
| Spain | 907 | 1.1% |
| Sri Lanka | 35 | 0.0% |
| Sweden | 138 | 0.2% |
| Switzerland | 123 | 0.2% |
| Syria | 60 | 0.1% |
| Taiwan | 9 | 0.0% |
| Thailand | 158 | 0.2% |
| Trinidad and Tobago | 70 | 0.1% |
| Turkey | 270 | 0.3% |
| Uganda | 2 | 0.0% |
| Ukraine | 179 | 0.2% |
| Uruguay | 644 | 0.8% |
| Uzbekistan | 90 | 0.1% |
| Venezuela | 2,878 | 3.5% |
| Vietnam | 50 | 0.1% |
| Western Africa | 43 | 0.1% |
| Western Asia | 940 | 1.1% |
| Western Europe | 1,782 | 2.2% |
| Zaire | 17 | 0.0% | View All 112 Rows |
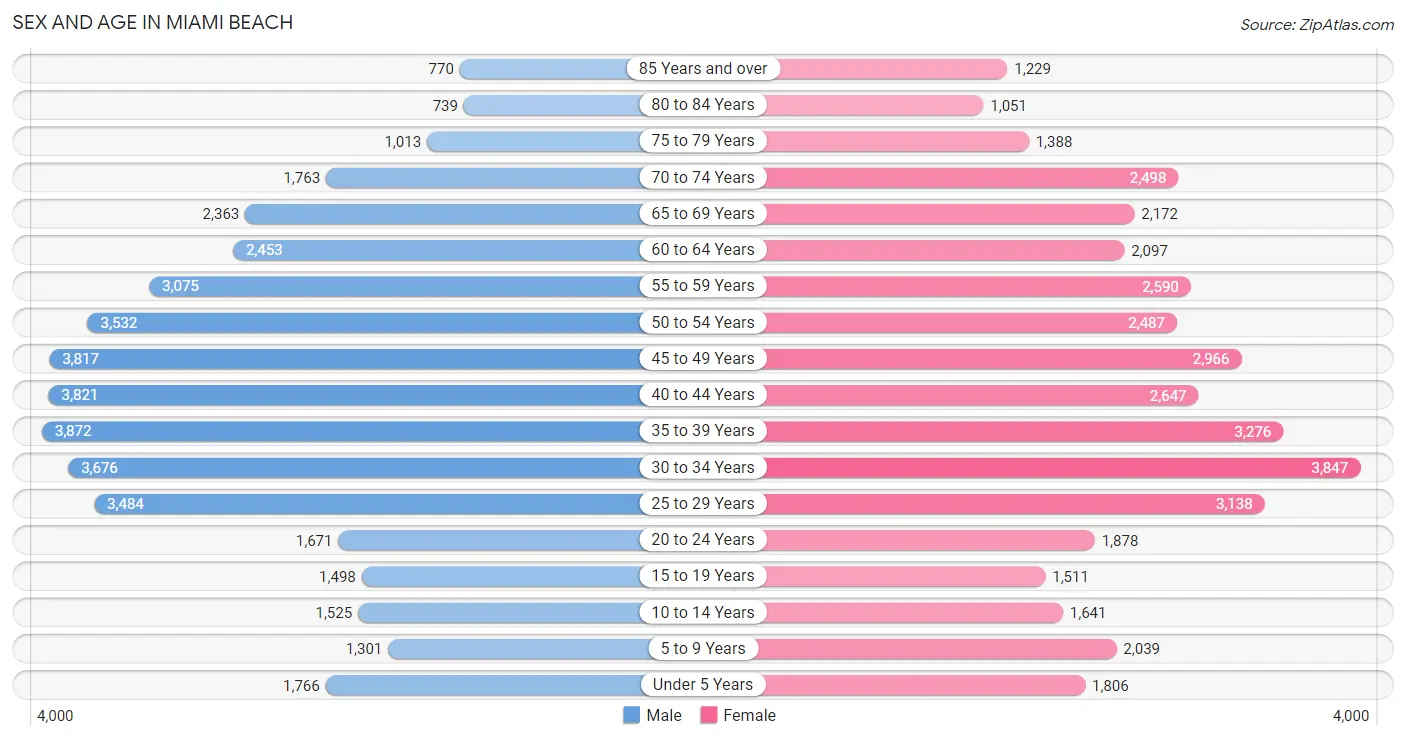
Sex and Age in Miami Beach
Sex and Age in Miami Beach
The most populous age groups in Miami Beach are 35 to 39 Years (3,872 | 9.2%) for men and 30 to 34 Years (3,847 | 9.6%) for women.
| Age Bracket | Male | Female |
| Under 5 Years | 1,766 (4.2%) | 1,806 (4.5%) |
| 5 to 9 Years | 1,301 (3.1%) | 2,039 (5.1%) |
| 10 to 14 Years | 1,525 (3.6%) | 1,641 (4.1%) |
| 15 to 19 Years | 1,498 (3.5%) | 1,511 (3.7%) |
| 20 to 24 Years | 1,671 (4.0%) | 1,878 (4.7%) |
| 25 to 29 Years | 3,484 (8.3%) | 3,138 (7.8%) |
| 30 to 34 Years | 3,676 (8.7%) | 3,847 (9.6%) |
| 35 to 39 Years | 3,872 (9.2%) | 3,276 (8.1%) |
| 40 to 44 Years | 3,821 (9.1%) | 2,647 (6.6%) |
| 45 to 49 Years | 3,817 (9.1%) | 2,966 (7.4%) |
| 50 to 54 Years | 3,532 (8.4%) | 2,487 (6.2%) |
| 55 to 59 Years | 3,075 (7.3%) | 2,590 (6.4%) |
| 60 to 64 Years | 2,453 (5.8%) | 2,097 (5.2%) |
| 65 to 69 Years | 2,363 (5.6%) | 2,172 (5.4%) |
| 70 to 74 Years | 1,763 (4.2%) | 2,498 (6.2%) |
| 75 to 79 Years | 1,013 (2.4%) | 1,388 (3.5%) |
| 80 to 84 Years | 739 (1.8%) | 1,051 (2.6%) |
| 85 Years and over | 770 (1.8%) | 1,229 (3.0%) |
| Total | 42,139 (100.0%) | 40,261 (100.0%) |
Families and Households in Miami Beach
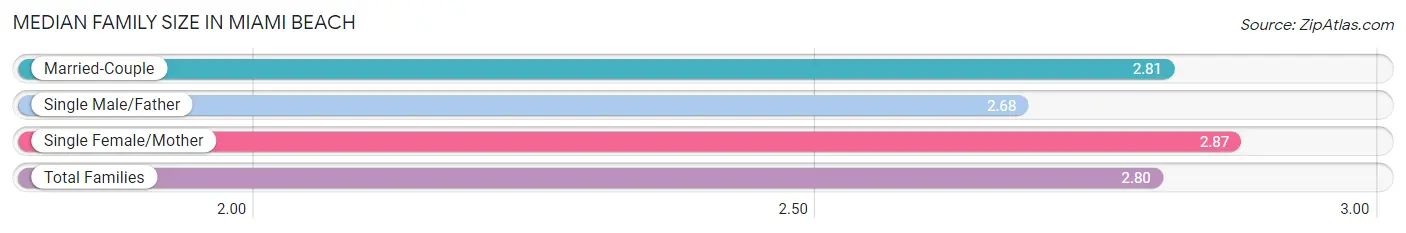
Median Family Size in Miami Beach
The median family size in Miami Beach is 2.80 persons per family, with single female/mother families (2,478 | 13.7%) accounting for the largest median family size of 2.87 persons per family. On the other hand, single male/father families (2,171 | 12.0%) represent the smallest median family size with 2.68 persons per family.
| Family Type | # Families | Family Size |
| Married-Couple | 13,382 (74.2%) | 2.81 |
| Single Male/Father | 2,171 (12.0%) | 2.68 |
| Single Female/Mother | 2,478 (13.7%) | 2.87 |
| Total Families | 18,031 (100.0%) | 2.80 |
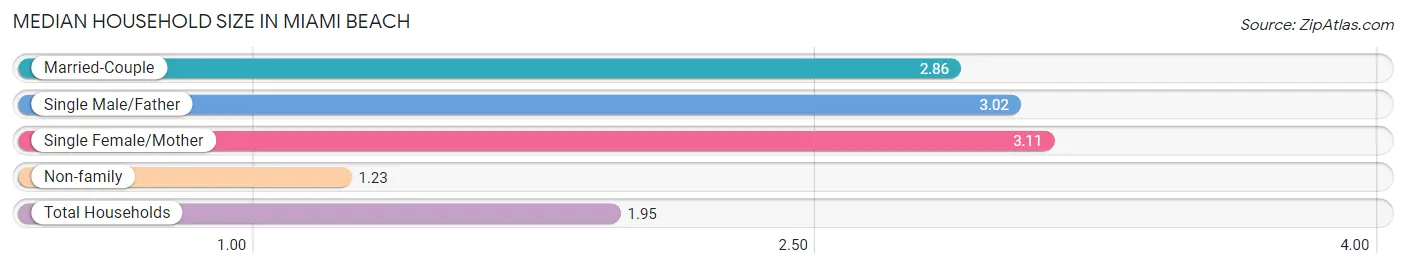
Median Household Size in Miami Beach
The median household size in Miami Beach is 1.95 persons per household, with single female/mother households (2,478 | 5.9%) accounting for the largest median household size of 3.11 persons per household. non-family households (23,680 | 56.8%) represent the smallest median household size with 1.23 persons per household.
| Household Type | # Households | Household Size |
| Married-Couple | 13,382 (32.1%) | 2.86 |
| Single Male/Father | 2,171 (5.2%) | 3.02 |
| Single Female/Mother | 2,478 (5.9%) | 3.11 |
| Non-family | 23,680 (56.8%) | 1.23 |
| Total Households | 41,711 (100.0%) | 1.95 |
Household Size by Marriage Status in Miami Beach
Out of a total of 41,711 households in Miami Beach, 18,031 (43.2%) are family households, while 23,680 (56.8%) are nonfamily households. The most numerous type of family households are 2-person households, comprising 9,693, and the most common type of nonfamily households are 1-person households, comprising 19,497.
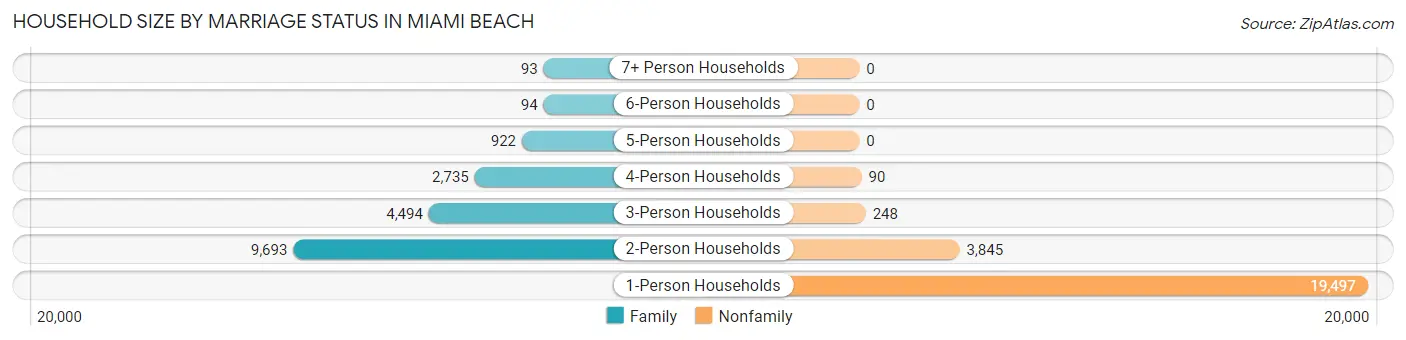
| Household Size | Family Households | Nonfamily Households |
| 1-Person Households | - | 19,497 (46.7%) |
| 2-Person Households | 9,693 (23.2%) | 3,845 (9.2%) |
| 3-Person Households | 4,494 (10.8%) | 248 (0.6%) |
| 4-Person Households | 2,735 (6.6%) | 90 (0.2%) |
| 5-Person Households | 922 (2.2%) | 0 (0.0%) |
| 6-Person Households | 94 (0.2%) | 0 (0.0%) |
| 7+ Person Households | 93 (0.2%) | 0 (0.0%) |
| Total | 18,031 (43.2%) | 23,680 (56.8%) |
Female Fertility in Miami Beach
Fertility by Age in Miami Beach
Average fertility rate in Miami Beach is 42.0 births per 1,000 women. Women in the age bracket of 20 to 34 years have the highest fertility rate with 52.0 births per 1,000 women. Women in the age bracket of 20 to 34 years acount for 55.5% of all women with births.
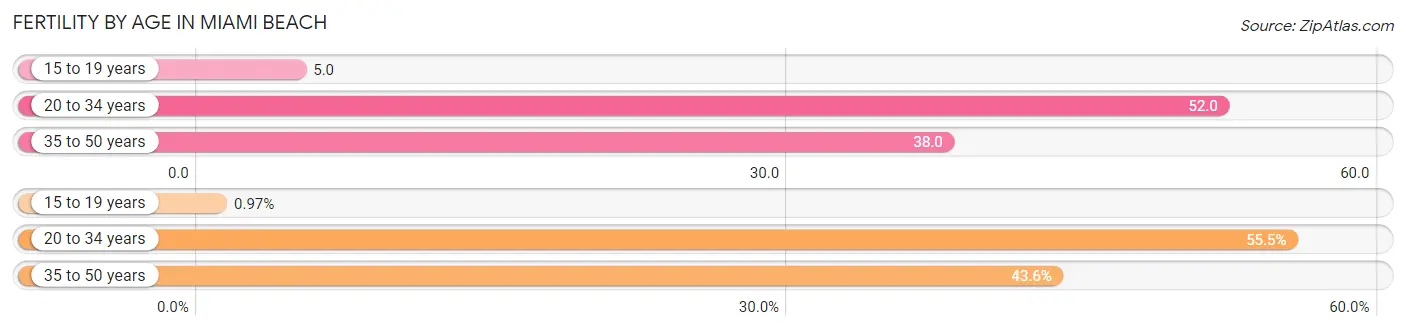
| Age Bracket | Women with Births | Births / 1,000 Women |
| 15 to 19 years | 8 (1.0%) | 5.0 |
| 20 to 34 years | 460 (55.5%) | 52.0 |
| 35 to 50 years | 361 (43.5%) | 38.0 |
| Total | 829 (100.0%) | 42.0 |
Fertility by Age by Marriage Status in Miami Beach
59.8% of women with births (829) in Miami Beach are married. The highest percentage of unmarried women with births falls into 15 to 19 years age bracket with 100.0% of them unmarried at the time of birth, while the lowest percentage of unmarried women with births belong to 35 to 50 years age bracket with 31.9% of them unmarried.
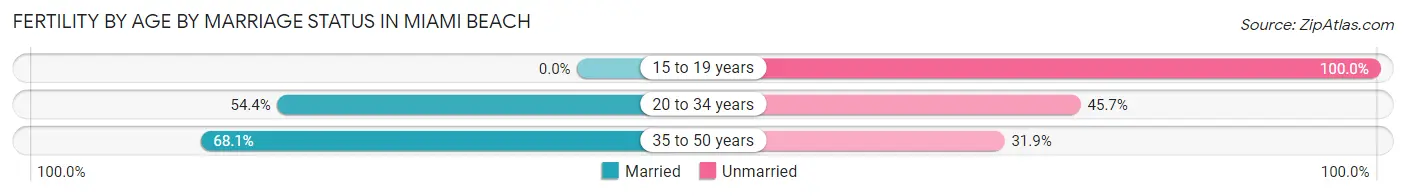
| Age Bracket | Married | Unmarried |
| 15 to 19 years | 0 (0.0%) | 8 (100.0%) |
| 20 to 34 years | 250 (54.3%) | 210 (45.7%) |
| 35 to 50 years | 246 (68.1%) | 115 (31.9%) |
| Total | 496 (59.8%) | 333 (40.2%) |
Fertility by Education in Miami Beach
Average fertility rate in Miami Beach is 42.0 births per 1,000 women. Women with the education attainment of bachelor's degree have the highest fertility rate of 80.0 births per 1,000 women, while women with the education attainment of less than high school have the lowest fertility at 19.0 births per 1,000 women. Women with the education attainment of bachelor's degree represent 57.5% of all women with births.
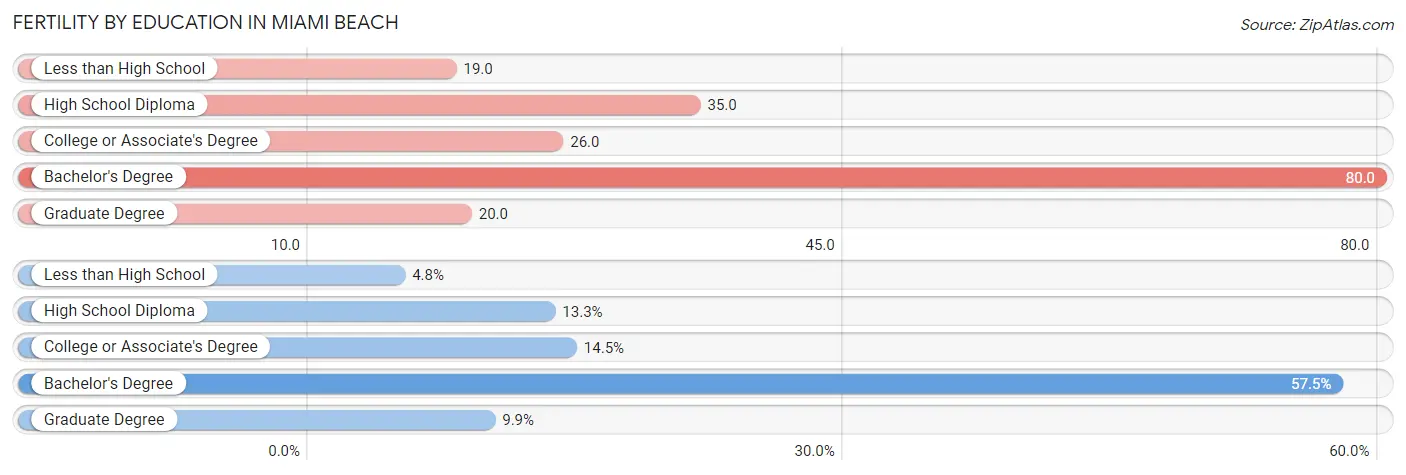
| Educational Attainment | Women with Births | Births / 1,000 Women |
| Less than High School | 40 (4.8%) | 19.0 |
| High School Diploma | 110 (13.3%) | 35.0 |
| College or Associate's Degree | 120 (14.5%) | 26.0 |
| Bachelor's Degree | 477 (57.5%) | 80.0 |
| Graduate Degree | 82 (9.9%) | 20.0 |
| Total | 829 (100.0%) | 42.0 |
Fertility by Education by Marriage Status in Miami Beach
40.2% of women with births in Miami Beach are unmarried. Women with the educational attainment of graduate degree are most likely to be married with 100.0% of them married at childbirth, while women with the educational attainment of high school diploma are least likely to be married with 80.9% of them unmarried at childbirth.
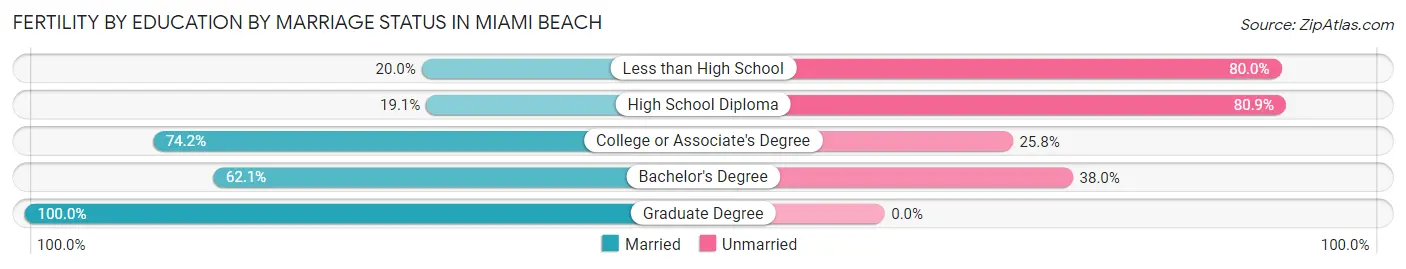
| Educational Attainment | Married | Unmarried |
| Less than High School | 8 (20.0%) | 32 (80.0%) |
| High School Diploma | 21 (19.1%) | 89 (80.9%) |
| College or Associate's Degree | 89 (74.2%) | 31 (25.8%) |
| Bachelor's Degree | 296 (62.1%) | 181 (38.0%) |
| Graduate Degree | 82 (100.0%) | 0 (0.0%) |
| Total | 496 (59.8%) | 333 (40.2%) |
Employment Characteristics in Miami Beach
Employment by Class of Employer in Miami Beach
Among the 46,173 employed individuals in Miami Beach, private company employees (31,265 | 67.7%), self-employed (incorporated) (5,030 | 10.9%), and self-employed (not incorporated) (3,945 | 8.5%) make up the most common classes of employment.
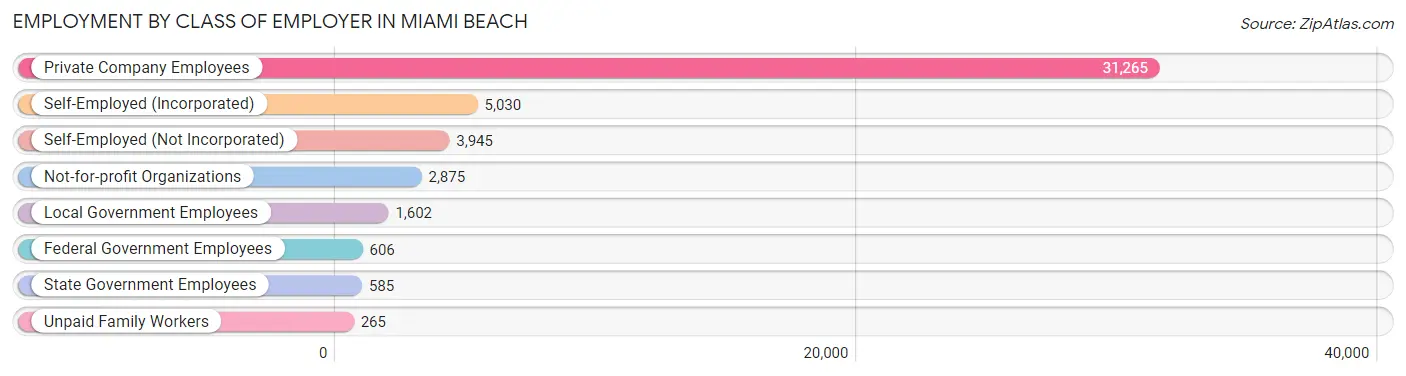
| Employer Class | # Employees | % Employees |
| Private Company Employees | 31,265 | 67.7% |
| Self-Employed (Incorporated) | 5,030 | 10.9% |
| Self-Employed (Not Incorporated) | 3,945 | 8.5% |
| Not-for-profit Organizations | 2,875 | 6.2% |
| Local Government Employees | 1,602 | 3.5% |
| State Government Employees | 585 | 1.3% |
| Federal Government Employees | 606 | 1.3% |
| Unpaid Family Workers | 265 | 0.6% |
| Total | 46,173 | 100.0% |
Employment Status by Age in Miami Beach
According to the labor force statistics for Miami Beach, out of the total population over 16 years of age (71,617), 68.8% or 49,272 individuals are in the labor force, with 4.0% or 1,971 of them unemployed. The age group with the highest labor force participation rate is 35 to 44 years, with 87.8% or 11,955 individuals in the labor force. Within the labor force, the 60 to 64 years age range has the highest percentage of unemployed individuals, with 12.4% or 392 of them being unemployed.
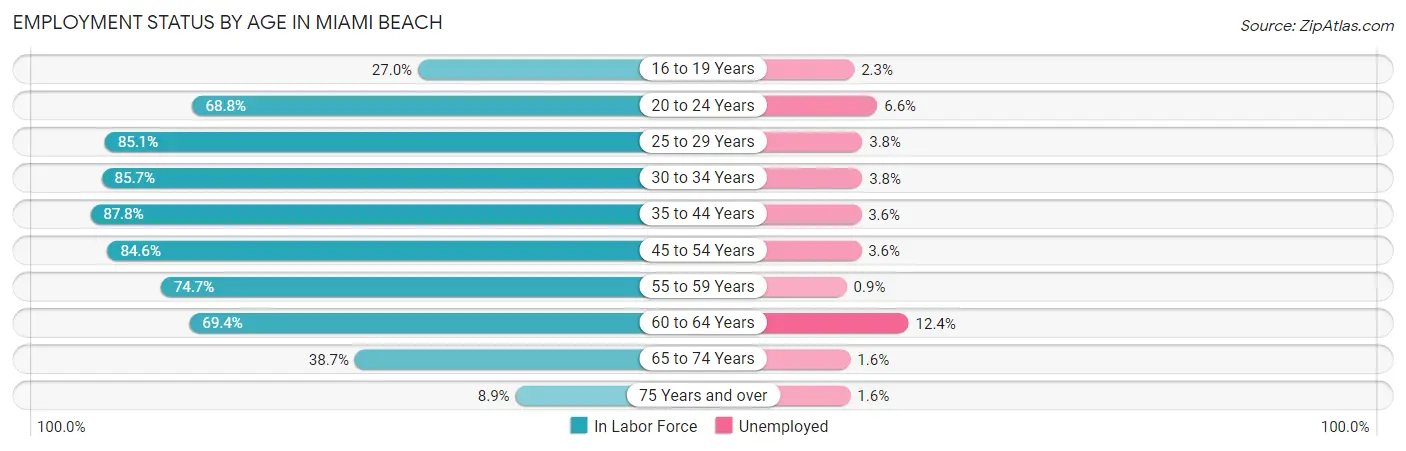
| Age Bracket | In Labor Force | Unemployed |
| 16 to 19 Years | 622 (27.0%) | 14 (2.3%) |
| 20 to 24 Years | 2,442 (68.8%) | 161 (6.6%) |
| 25 to 29 Years | 5,635 (85.1%) | 214 (3.8%) |
| 30 to 34 Years | 6,447 (85.7%) | 245 (3.8%) |
| 35 to 44 Years | 11,955 (87.8%) | 430 (3.6%) |
| 45 to 54 Years | 10,830 (84.6%) | 390 (3.6%) |
| 55 to 59 Years | 4,232 (74.7%) | 38 (0.9%) |
| 60 to 64 Years | 3,158 (69.4%) | 392 (12.4%) |
| 65 to 74 Years | 3,404 (38.7%) | 54 (1.6%) |
| 75 Years and over | 551 (8.9%) | 9 (1.6%) |
| Total | 49,272 (68.8%) | 1,971 (4.0%) |
Employment Status by Educational Attainment in Miami Beach
According to labor force statistics for Miami Beach, 83.2% of individuals (42,247) out of the total population between 25 and 64 years of age (50,778) are in the labor force, with 4.1% or 1,732 of them being unemployed. The group with the highest labor force participation rate are those with the educational attainment of bachelor's degree or higher, with 84.6% or 23,180 individuals in the labor force. Within the labor force, individuals with high school diploma education have the highest percentage of unemployment, with 6.0% or 411 of them being unemployed.
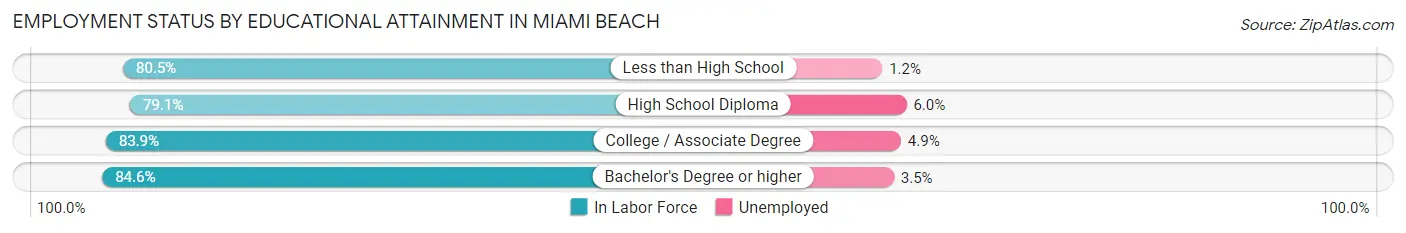
| Educational Attainment | In Labor Force | Unemployed |
| Less than High School | 2,772 (80.5%) | 41 (1.2%) |
| High School Diploma | 6,845 (79.1%) | 519 (6.0%) |
| College / Associate Degree | 9,465 (83.9%) | 553 (4.9%) |
| Bachelor's Degree or higher | 23,180 (84.6%) | 959 (3.5%) |
| Total | 42,247 (83.2%) | 2,082 (4.1%) |
Employment Occupations by Sex in Miami Beach
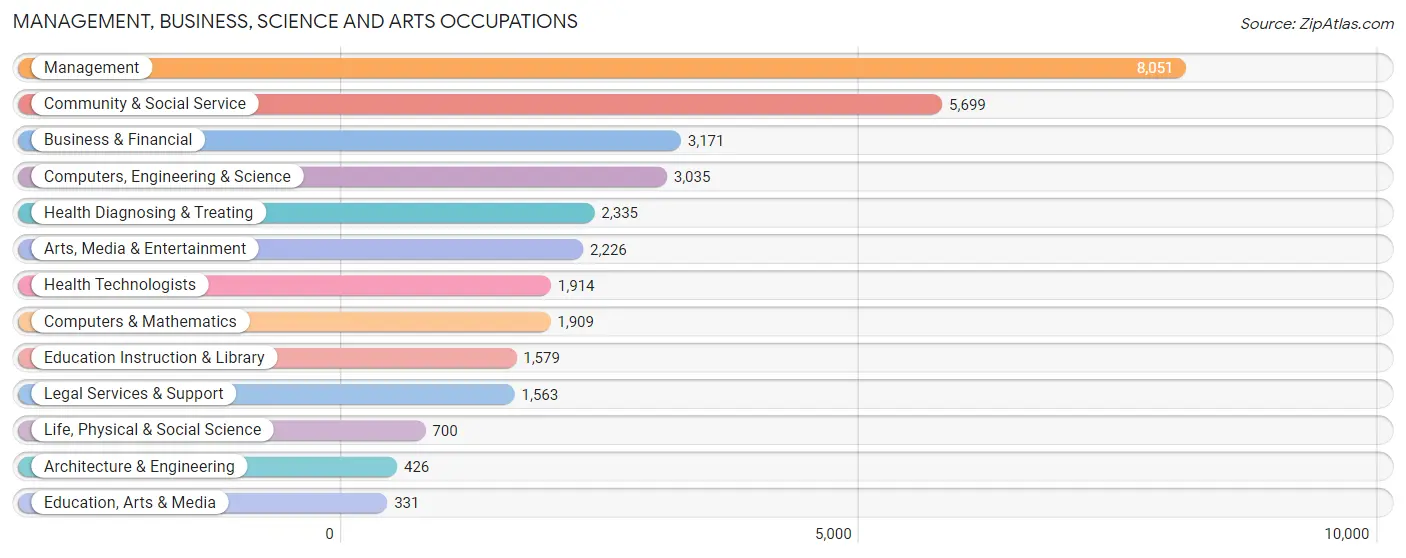
Management, Business, Science and Arts Occupations
The most common Management, Business, Science and Arts occupations in Miami Beach are Management (8,051 | 17.1%), Community & Social Service (5,699 | 12.1%), Business & Financial (3,171 | 6.7%), Computers, Engineering & Science (3,035 | 6.4%), and Health Diagnosing & Treating (2,335 | 4.9%).
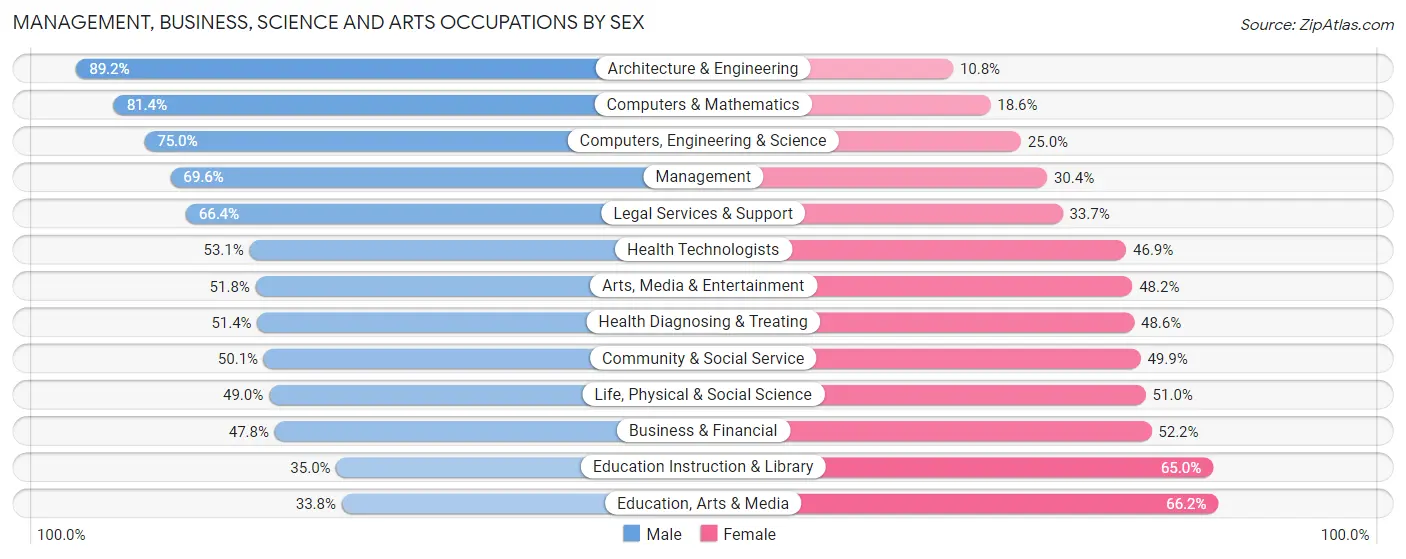
Management, Business, Science and Arts Occupations by Sex
Within the Management, Business, Science and Arts occupations in Miami Beach, the most male-oriented occupations are Architecture & Engineering (89.2%), Computers & Mathematics (81.4%), and Computers, Engineering & Science (75.0%), while the most female-oriented occupations are Education, Arts & Media (66.2%), Education Instruction & Library (65.0%), and Business & Financial (52.2%).
| Occupation | Male | Female |
| Management | 5,602 (69.6%) | 2,449 (30.4%) |
| Business & Financial | 1,516 (47.8%) | 1,655 (52.2%) |
| Computers, Engineering & Science | 2,277 (75.0%) | 758 (25.0%) |
| Computers & Mathematics | 1,554 (81.4%) | 355 (18.6%) |
| Architecture & Engineering | 380 (89.2%) | 46 (10.8%) |
| Life, Physical & Social Science | 343 (49.0%) | 357 (51.0%) |
| Community & Social Service | 2,854 (50.1%) | 2,845 (49.9%) |
| Education, Arts & Media | 112 (33.8%) | 219 (66.2%) |
| Legal Services & Support | 1,037 (66.3%) | 526 (33.7%) |
| Education Instruction & Library | 552 (35.0%) | 1,027 (65.0%) |
| Arts, Media & Entertainment | 1,153 (51.8%) | 1,073 (48.2%) |
| Health Diagnosing & Treating | 1,201 (51.4%) | 1,134 (48.6%) |
| Health Technologists | 1,016 (53.1%) | 898 (46.9%) |
| Total (Category) | 13,450 (60.3%) | 8,841 (39.7%) |
| Total (Overall) | 27,464 (58.2%) | 19,763 (41.8%) |
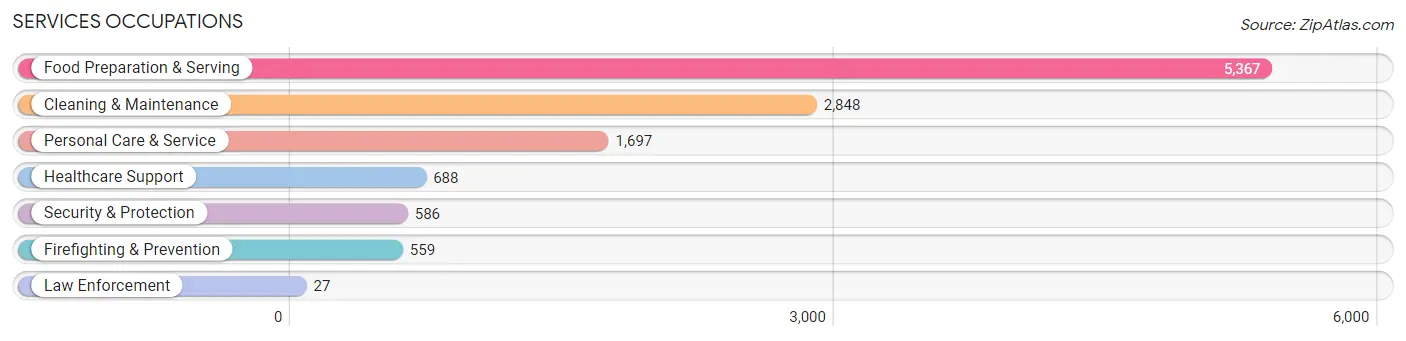
Services Occupations
The most common Services occupations in Miami Beach are Food Preparation & Serving (5,367 | 11.4%), Cleaning & Maintenance (2,848 | 6.0%), Personal Care & Service (1,697 | 3.6%), Healthcare Support (688 | 1.5%), and Security & Protection (586 | 1.2%).
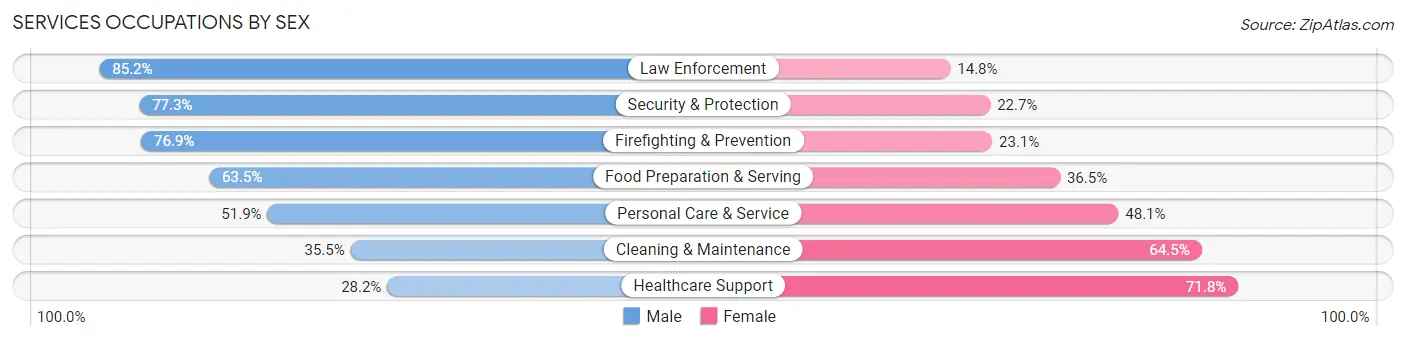
Services Occupations by Sex
Within the Services occupations in Miami Beach, the most male-oriented occupations are Law Enforcement (85.2%), Security & Protection (77.3%), and Firefighting & Prevention (76.9%), while the most female-oriented occupations are Healthcare Support (71.8%), Cleaning & Maintenance (64.5%), and Personal Care & Service (48.1%).
| Occupation | Male | Female |
| Healthcare Support | 194 (28.2%) | 494 (71.8%) |
| Security & Protection | 453 (77.3%) | 133 (22.7%) |
| Firefighting & Prevention | 430 (76.9%) | 129 (23.1%) |
| Law Enforcement | 23 (85.2%) | 4 (14.8%) |
| Food Preparation & Serving | 3,407 (63.5%) | 1,960 (36.5%) |
| Cleaning & Maintenance | 1,010 (35.5%) | 1,838 (64.5%) |
| Personal Care & Service | 881 (51.9%) | 816 (48.1%) |
| Total (Category) | 5,945 (53.1%) | 5,241 (46.9%) |
| Total (Overall) | 27,464 (58.2%) | 19,763 (41.8%) |
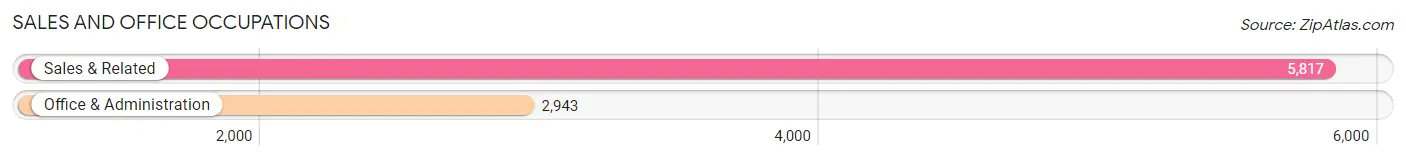
Sales and Office Occupations
The most common Sales and Office occupations in Miami Beach are Sales & Related (5,817 | 12.3%), and Office & Administration (2,943 | 6.2%).
Sales and Office Occupations by Sex
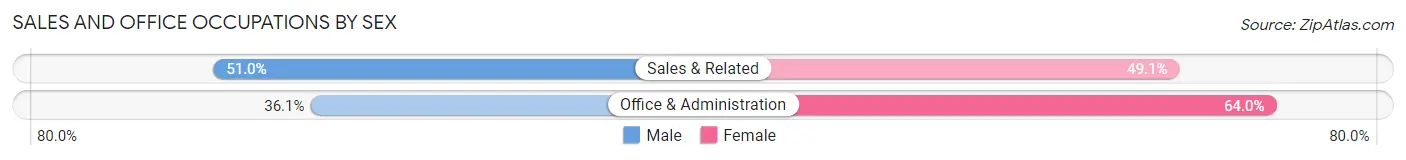
| Occupation | Male | Female |
| Sales & Related | 2,964 (50.9%) | 2,853 (49.0%) |
| Office & Administration | 1,061 (36.0%) | 1,882 (63.9%) |
| Total (Category) | 4,025 (46.0%) | 4,735 (54.0%) |
| Total (Overall) | 27,464 (58.2%) | 19,763 (41.8%) |
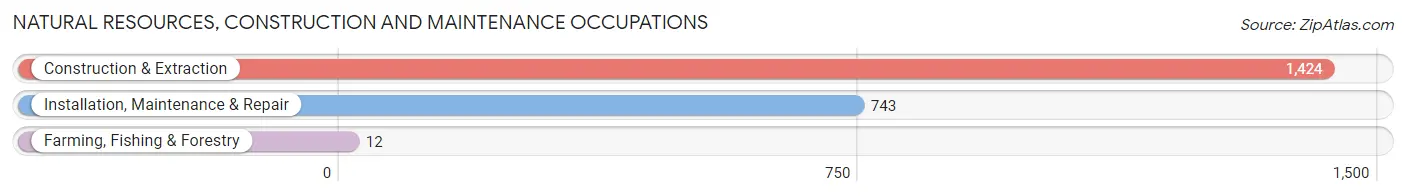
Natural Resources, Construction and Maintenance Occupations
The most common Natural Resources, Construction and Maintenance occupations in Miami Beach are Construction & Extraction (1,424 | 3.0%), Installation, Maintenance & Repair (743 | 1.6%), and Farming, Fishing & Forestry (12 | 0.0%).
Natural Resources, Construction and Maintenance Occupations by Sex
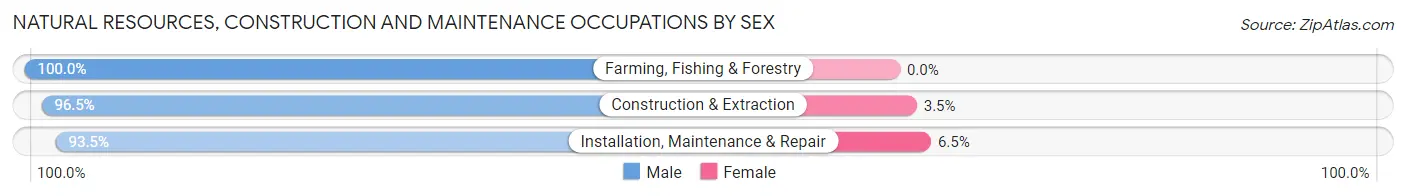
| Occupation | Male | Female |
| Farming, Fishing & Forestry | 12 (100.0%) | 0 (0.0%) |
| Construction & Extraction | 1,374 (96.5%) | 50 (3.5%) |
| Installation, Maintenance & Repair | 695 (93.5%) | 48 (6.5%) |
| Total (Category) | 2,081 (95.5%) | 98 (4.5%) |
| Total (Overall) | 27,464 (58.2%) | 19,763 (41.8%) |
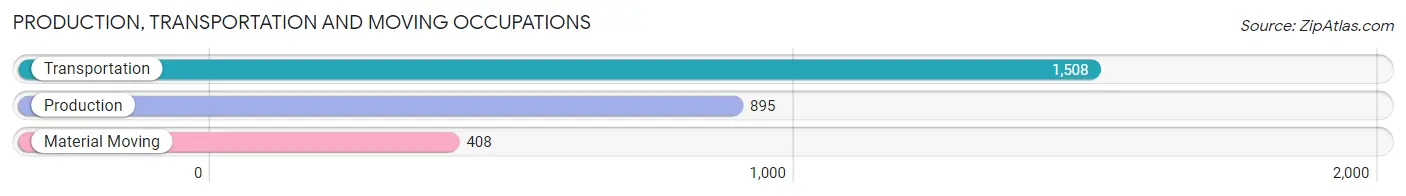
Production, Transportation and Moving Occupations
The most common Production, Transportation and Moving occupations in Miami Beach are Transportation (1,508 | 3.2%), Production (895 | 1.9%), and Material Moving (408 | 0.9%).
Production, Transportation and Moving Occupations by Sex
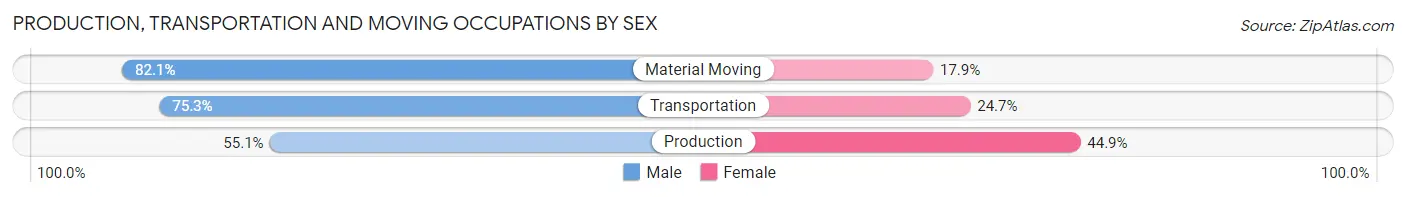
| Occupation | Male | Female |
| Production | 493 (55.1%) | 402 (44.9%) |
| Transportation | 1,135 (75.3%) | 373 (24.7%) |
| Material Moving | 335 (82.1%) | 73 (17.9%) |
| Total (Category) | 1,963 (69.8%) | 848 (30.2%) |
| Total (Overall) | 27,464 (58.2%) | 19,763 (41.8%) |
Employment Industries by Sex in Miami Beach
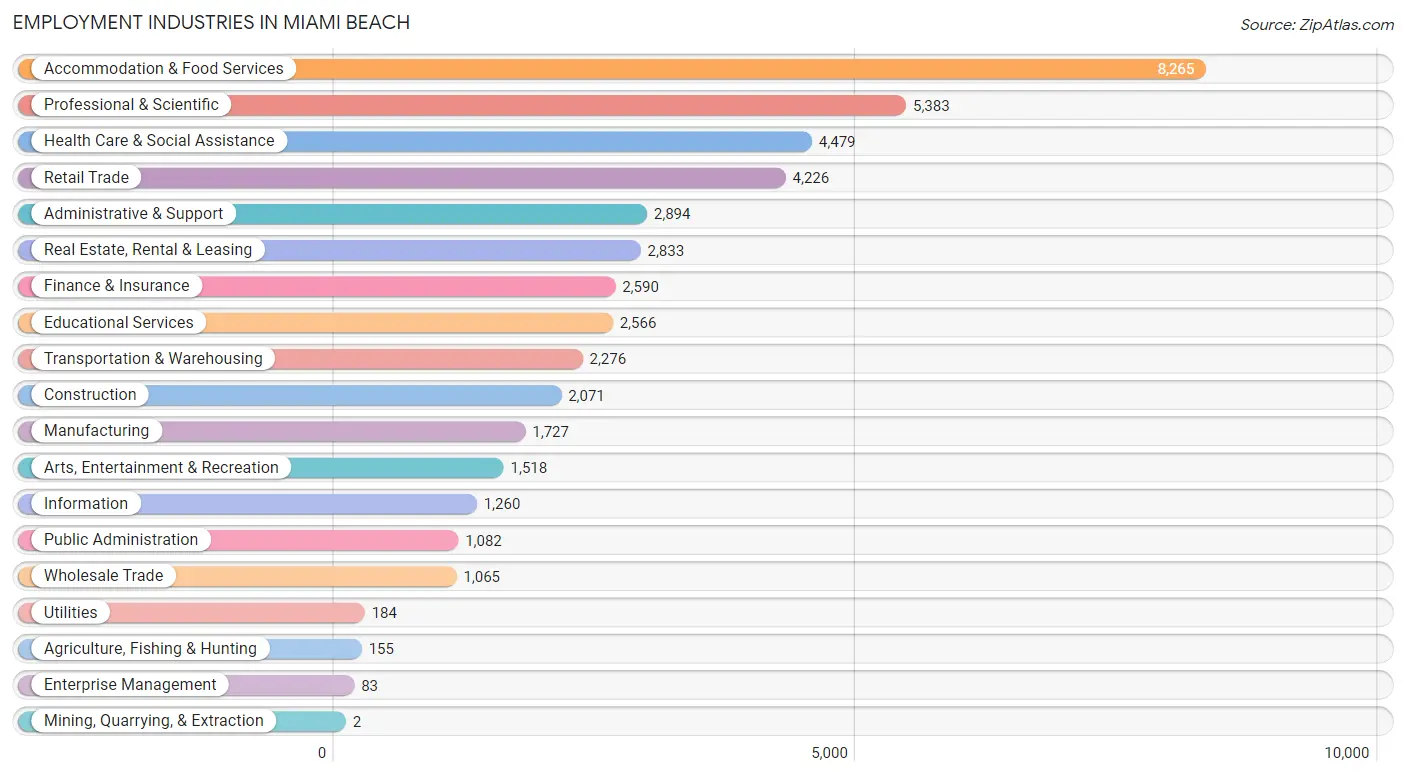
Employment Industries in Miami Beach
The major employment industries in Miami Beach include Accommodation & Food Services (8,265 | 17.5%), Professional & Scientific (5,383 | 11.4%), Health Care & Social Assistance (4,479 | 9.5%), Retail Trade (4,226 | 8.9%), and Administrative & Support (2,894 | 6.1%).
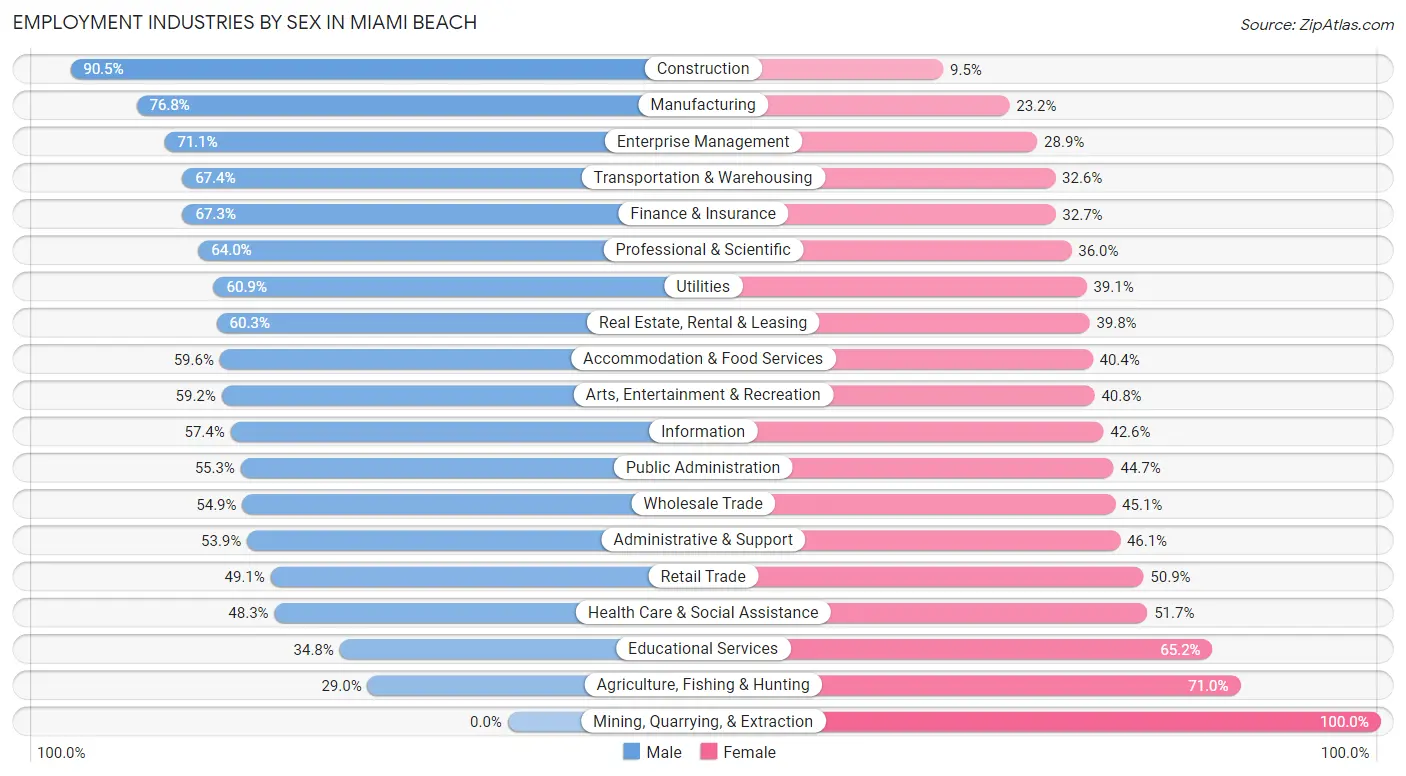
Employment Industries by Sex in Miami Beach
The Miami Beach industries that see more men than women are Construction (90.5%), Manufacturing (76.8%), and Enterprise Management (71.1%), whereas the industries that tend to have a higher number of women are Mining, Quarrying, & Extraction (100.0%), Agriculture, Fishing & Hunting (71.0%), and Educational Services (65.2%).
| Industry | Male | Female |
| Agriculture, Fishing & Hunting | 45 (29.0%) | 110 (71.0%) |
| Mining, Quarrying, & Extraction | 0 (0.0%) | 2 (100.0%) |
| Construction | 1,875 (90.5%) | 196 (9.5%) |
| Manufacturing | 1,327 (76.8%) | 400 (23.2%) |
| Wholesale Trade | 585 (54.9%) | 480 (45.1%) |
| Retail Trade | 2,074 (49.1%) | 2,152 (50.9%) |
| Transportation & Warehousing | 1,533 (67.4%) | 743 (32.6%) |
| Utilities | 112 (60.9%) | 72 (39.1%) |
| Information | 723 (57.4%) | 537 (42.6%) |
| Finance & Insurance | 1,743 (67.3%) | 847 (32.7%) |
| Real Estate, Rental & Leasing | 1,707 (60.3%) | 1,126 (39.8%) |
| Professional & Scientific | 3,446 (64.0%) | 1,937 (36.0%) |
| Enterprise Management | 59 (71.1%) | 24 (28.9%) |
| Administrative & Support | 1,561 (53.9%) | 1,333 (46.1%) |
| Educational Services | 893 (34.8%) | 1,673 (65.2%) |
| Health Care & Social Assistance | 2,163 (48.3%) | 2,316 (51.7%) |
| Arts, Entertainment & Recreation | 899 (59.2%) | 619 (40.8%) |
| Accommodation & Food Services | 4,927 (59.6%) | 3,338 (40.4%) |
| Public Administration | 598 (55.3%) | 484 (44.7%) |
| Total | 27,464 (58.2%) | 19,763 (41.8%) |
Education in Miami Beach
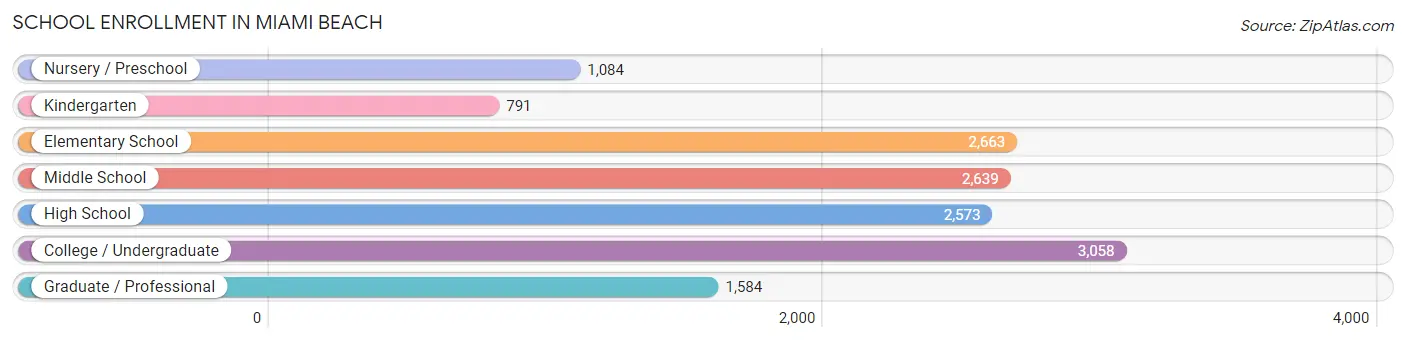
School Enrollment in Miami Beach
The most common levels of schooling among the 14,392 students in Miami Beach are college / undergraduate (3,058 | 21.2%), elementary school (2,663 | 18.5%), and middle school (2,639 | 18.3%).
| School Level | # Students | % Students |
| Nursery / Preschool | 1,084 | 7.5% |
| Kindergarten | 791 | 5.5% |
| Elementary School | 2,663 | 18.5% |
| Middle School | 2,639 | 18.3% |
| High School | 2,573 | 17.9% |
| College / Undergraduate | 3,058 | 21.2% |
| Graduate / Professional | 1,584 | 11.0% |
| Total | 14,392 | 100.0% |
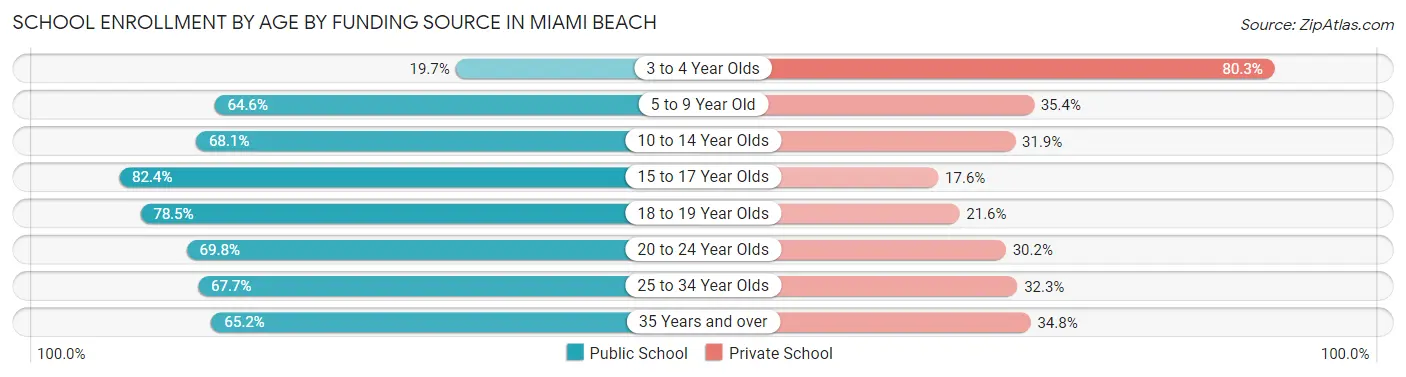
School Enrollment by Age by Funding Source in Miami Beach
Out of a total of 14,392 students who are enrolled in schools in Miami Beach, 4,821 (33.5%) attend a private institution, while the remaining 9,571 (66.5%) are enrolled in public schools. The age group of 3 to 4 year olds has the highest likelihood of being enrolled in private schools, with 716 (80.3% in the age bracket) enrolled. Conversely, the age group of 15 to 17 year olds has the lowest likelihood of being enrolled in a private school, with 1,489 (82.4% in the age bracket) attending a public institution.
| Age Bracket | Public School | Private School |
| 3 to 4 Year Olds | 176 (19.7%) | 716 (80.3%) |
| 5 to 9 Year Old | 2,108 (64.6%) | 1,155 (35.4%) |
| 10 to 14 Year Olds | 2,155 (68.1%) | 1,011 (31.9%) |
| 15 to 17 Year Olds | 1,489 (82.4%) | 318 (17.6%) |
| 18 to 19 Year Olds | 717 (78.4%) | 197 (21.5%) |
| 20 to 24 Year Olds | 770 (69.8%) | 333 (30.2%) |
| 25 to 34 Year Olds | 1,229 (67.7%) | 587 (32.3%) |
| 35 Years and over | 933 (65.2%) | 498 (34.8%) |
| Total | 9,571 (66.5%) | 4,821 (33.5%) |
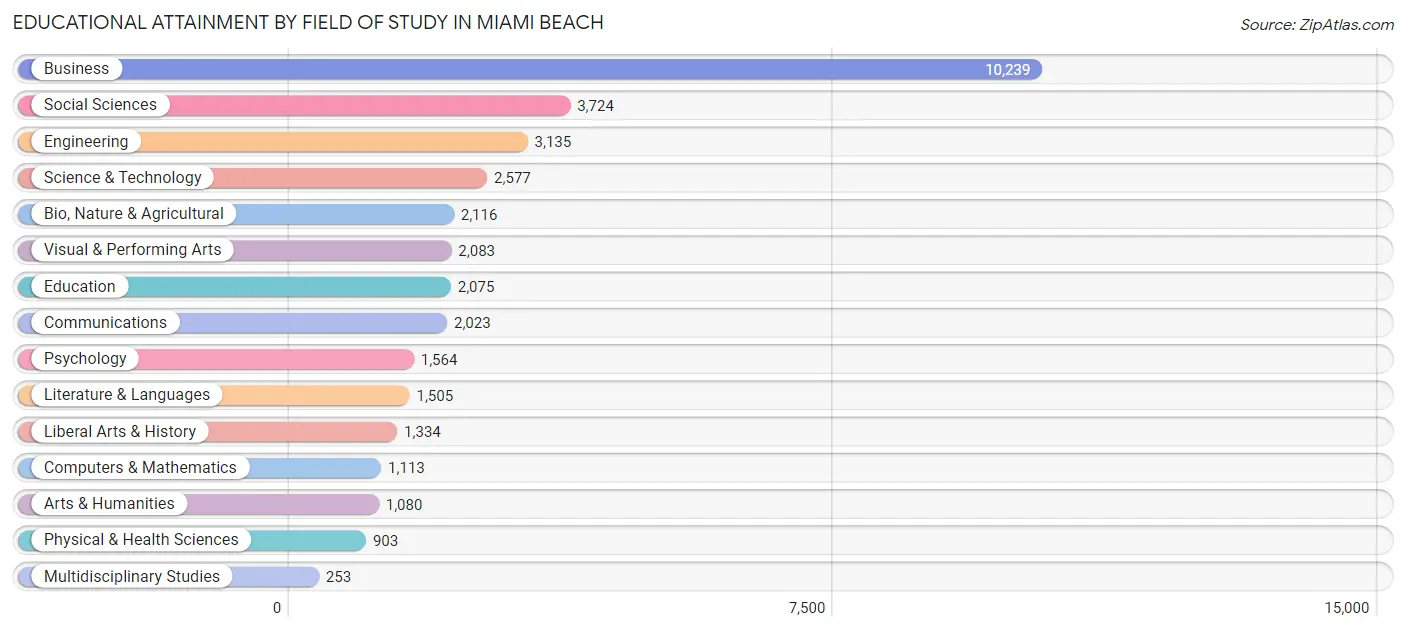
Educational Attainment by Field of Study in Miami Beach
Business (10,239 | 28.7%), social sciences (3,724 | 10.4%), engineering (3,135 | 8.8%), science & technology (2,577 | 7.2%), and bio, nature & agricultural (2,116 | 5.9%) are the most common fields of study among 35,724 individuals in Miami Beach who have obtained a bachelor's degree or higher.
| Field of Study | # Graduates | % Graduates |
| Computers & Mathematics | 1,113 | 3.1% |
| Bio, Nature & Agricultural | 2,116 | 5.9% |
| Physical & Health Sciences | 903 | 2.5% |
| Psychology | 1,564 | 4.4% |
| Social Sciences | 3,724 | 10.4% |
| Engineering | 3,135 | 8.8% |
| Multidisciplinary Studies | 253 | 0.7% |
| Science & Technology | 2,577 | 7.2% |
| Business | 10,239 | 28.7% |
| Education | 2,075 | 5.8% |
| Literature & Languages | 1,505 | 4.2% |
| Liberal Arts & History | 1,334 | 3.7% |
| Visual & Performing Arts | 2,083 | 5.8% |
| Communications | 2,023 | 5.7% |
| Arts & Humanities | 1,080 | 3.0% |
| Total | 35,724 | 100.0% |
Transportation & Commute in Miami Beach
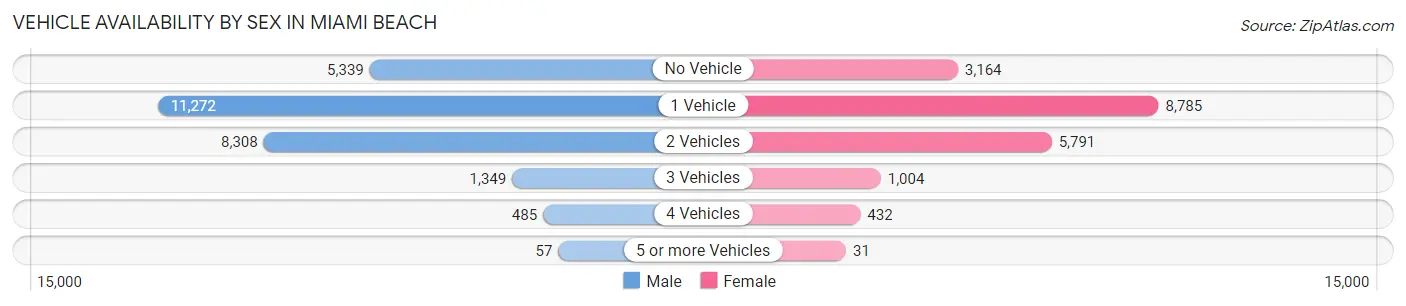
Vehicle Availability by Sex in Miami Beach
The most prevalent vehicle ownership categories in Miami Beach are males with 1 vehicle (11,272, accounting for 42.0%) and females with 1 vehicle (8,785, making up 58.7%).
| Vehicles Available | Male | Female |
| No Vehicle | 5,339 (19.9%) | 3,164 (16.5%) |
| 1 Vehicle | 11,272 (42.0%) | 8,785 (45.7%) |
| 2 Vehicles | 8,308 (31.0%) | 5,791 (30.1%) |
| 3 Vehicles | 1,349 (5.0%) | 1,004 (5.2%) |
| 4 Vehicles | 485 (1.8%) | 432 (2.2%) |
| 5 or more Vehicles | 57 (0.2%) | 31 (0.2%) |
| Total | 26,810 (100.0%) | 19,207 (100.0%) |
Commute Time in Miami Beach
The most frequently occuring commute durations in Miami Beach are 30 to 34 minutes (8,227 commuters, 21.6%), 20 to 24 minutes (6,027 commuters, 15.8%), and 10 to 14 minutes (5,196 commuters, 13.6%).
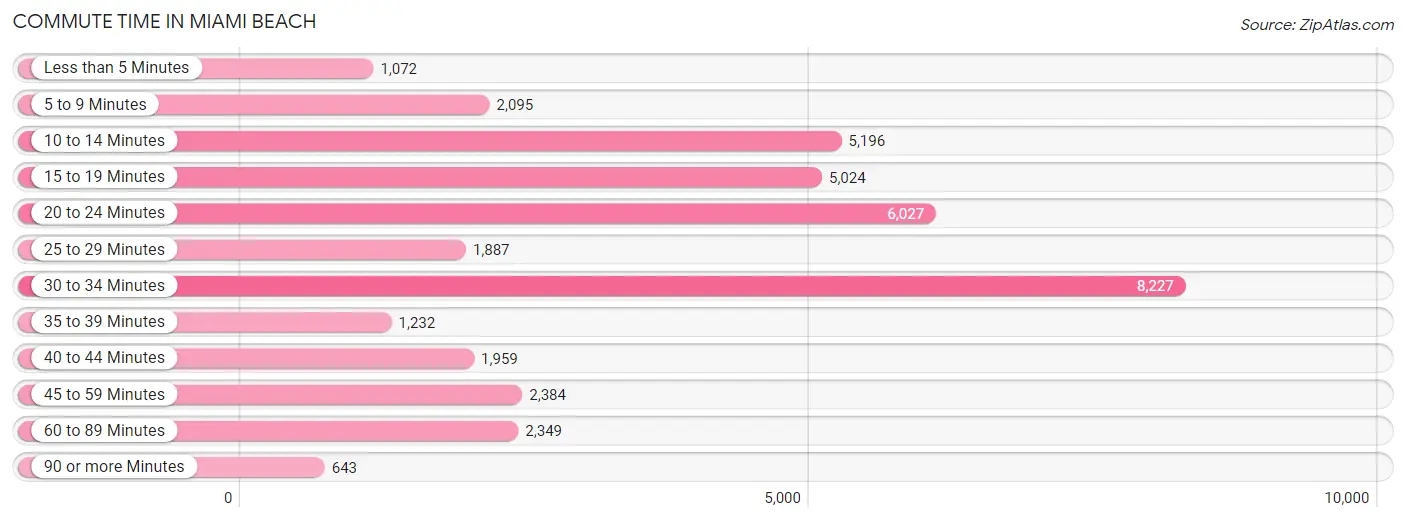
| Commute Time | # Commuters | % Commuters |
| Less than 5 Minutes | 1,072 | 2.8% |
| 5 to 9 Minutes | 2,095 | 5.5% |
| 10 to 14 Minutes | 5,196 | 13.6% |
| 15 to 19 Minutes | 5,024 | 13.2% |
| 20 to 24 Minutes | 6,027 | 15.8% |
| 25 to 29 Minutes | 1,887 | 5.0% |
| 30 to 34 Minutes | 8,227 | 21.6% |
| 35 to 39 Minutes | 1,232 | 3.2% |
| 40 to 44 Minutes | 1,959 | 5.1% |
| 45 to 59 Minutes | 2,384 | 6.3% |
| 60 to 89 Minutes | 2,349 | 6.2% |
| 90 or more Minutes | 643 | 1.7% |
Commute Time by Sex in Miami Beach
The most common commute times in Miami Beach are 30 to 34 minutes (5,128 commuters, 22.9%) for males and 30 to 34 minutes (3,099 commuters, 19.7%) for females.
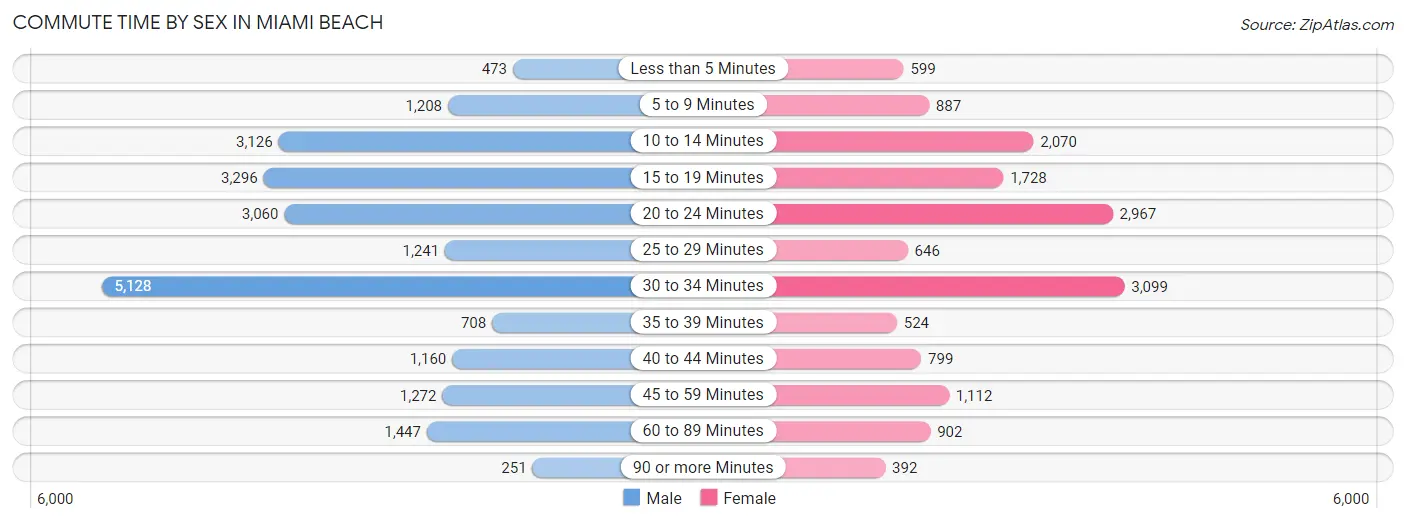
| Commute Time | Male | Female |
| Less than 5 Minutes | 473 (2.1%) | 599 (3.8%) |
| 5 to 9 Minutes | 1,208 (5.4%) | 887 (5.6%) |
| 10 to 14 Minutes | 3,126 (14.0%) | 2,070 (13.2%) |
| 15 to 19 Minutes | 3,296 (14.7%) | 1,728 (11.0%) |
| 20 to 24 Minutes | 3,060 (13.7%) | 2,967 (18.9%) |
| 25 to 29 Minutes | 1,241 (5.6%) | 646 (4.1%) |
| 30 to 34 Minutes | 5,128 (22.9%) | 3,099 (19.7%) |
| 35 to 39 Minutes | 708 (3.2%) | 524 (3.3%) |
| 40 to 44 Minutes | 1,160 (5.2%) | 799 (5.1%) |
| 45 to 59 Minutes | 1,272 (5.7%) | 1,112 (7.1%) |
| 60 to 89 Minutes | 1,447 (6.5%) | 902 (5.7%) |
| 90 or more Minutes | 251 (1.1%) | 392 (2.5%) |
Time of Departure to Work by Sex in Miami Beach
The most frequent times of departure to work in Miami Beach are 8:00 AM to 8:29 AM (3,621, 16.2%) for males and 8:00 AM to 8:29 AM (2,851, 18.1%) for females.
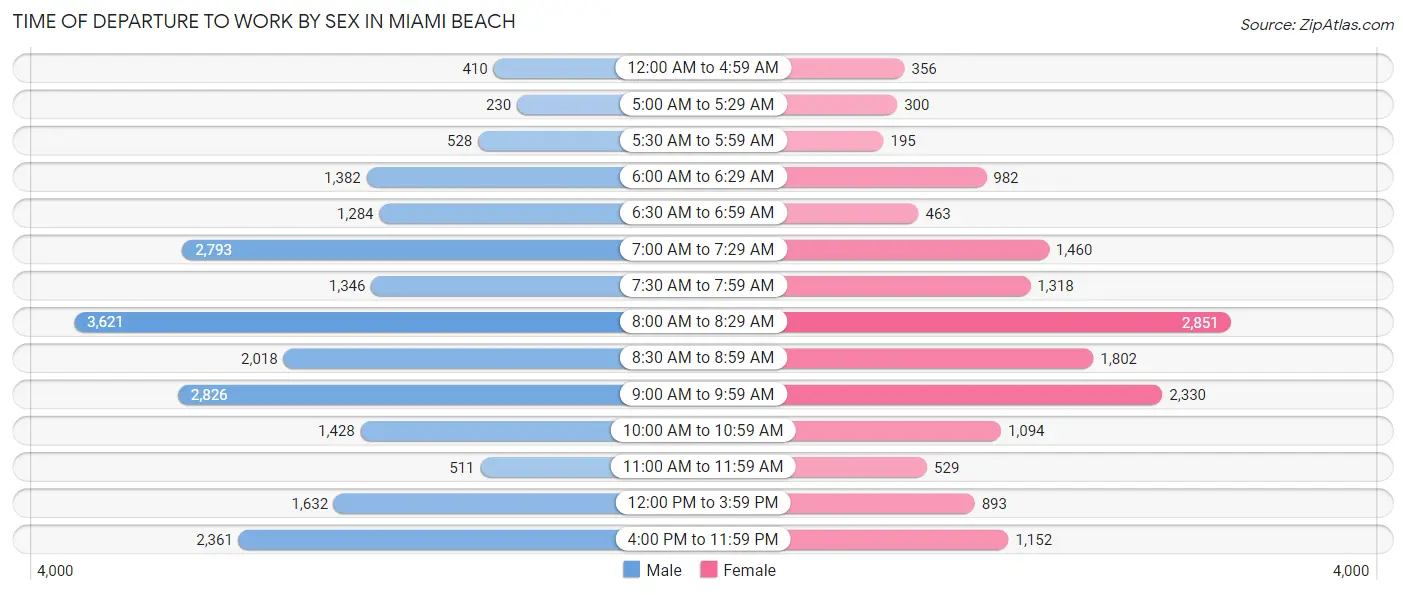
| Time of Departure | Male | Female |
| 12:00 AM to 4:59 AM | 410 (1.8%) | 356 (2.3%) |
| 5:00 AM to 5:29 AM | 230 (1.0%) | 300 (1.9%) |
| 5:30 AM to 5:59 AM | 528 (2.4%) | 195 (1.2%) |
| 6:00 AM to 6:29 AM | 1,382 (6.2%) | 982 (6.2%) |
| 6:30 AM to 6:59 AM | 1,284 (5.7%) | 463 (2.9%) |
| 7:00 AM to 7:29 AM | 2,793 (12.5%) | 1,460 (9.3%) |
| 7:30 AM to 7:59 AM | 1,346 (6.0%) | 1,318 (8.4%) |
| 8:00 AM to 8:29 AM | 3,621 (16.2%) | 2,851 (18.1%) |
| 8:30 AM to 8:59 AM | 2,018 (9.0%) | 1,802 (11.5%) |
| 9:00 AM to 9:59 AM | 2,826 (12.6%) | 2,330 (14.8%) |
| 10:00 AM to 10:59 AM | 1,428 (6.4%) | 1,094 (7.0%) |
| 11:00 AM to 11:59 AM | 511 (2.3%) | 529 (3.4%) |
| 12:00 PM to 3:59 PM | 1,632 (7.3%) | 893 (5.7%) |
| 4:00 PM to 11:59 PM | 2,361 (10.5%) | 1,152 (7.3%) |
| Total | 22,370 (100.0%) | 15,725 (100.0%) |
Housing Occupancy in Miami Beach
Occupancy by Ownership in Miami Beach
Of the total 41,711 dwellings in Miami Beach, owner-occupied units account for 15,422 (37.0%), while renter-occupied units make up 26,289 (63.0%).
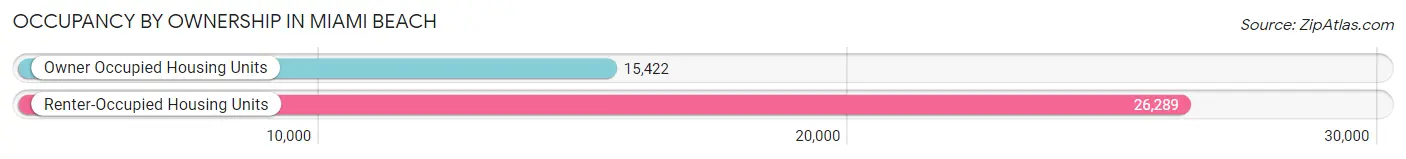
| Occupancy | # Housing Units | % Housing Units |
| Owner Occupied Housing Units | 15,422 | 37.0% |
| Renter-Occupied Housing Units | 26,289 | 63.0% |
| Total Occupied Housing Units | 41,711 | 100.0% |
Occupancy by Household Size in Miami Beach
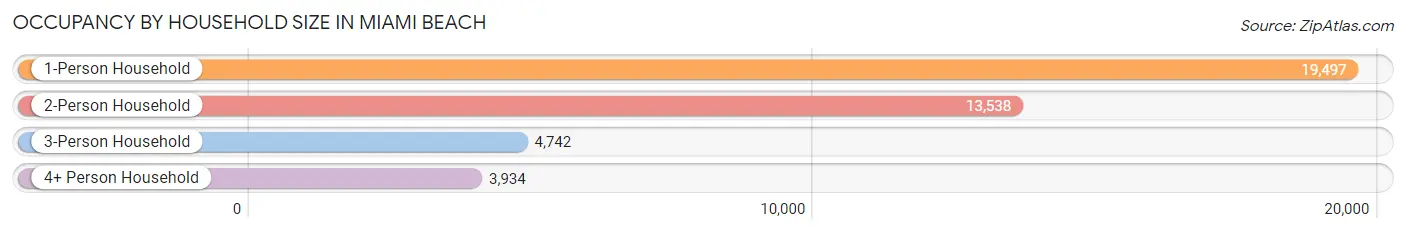
| Household Size | # Housing Units | % Housing Units |
| 1-Person Household | 19,497 | 46.7% |
| 2-Person Household | 13,538 | 32.5% |
| 3-Person Household | 4,742 | 11.4% |
| 4+ Person Household | 3,934 | 9.4% |
| Total Housing Units | 41,711 | 100.0% |
Occupancy by Ownership by Household Size in Miami Beach
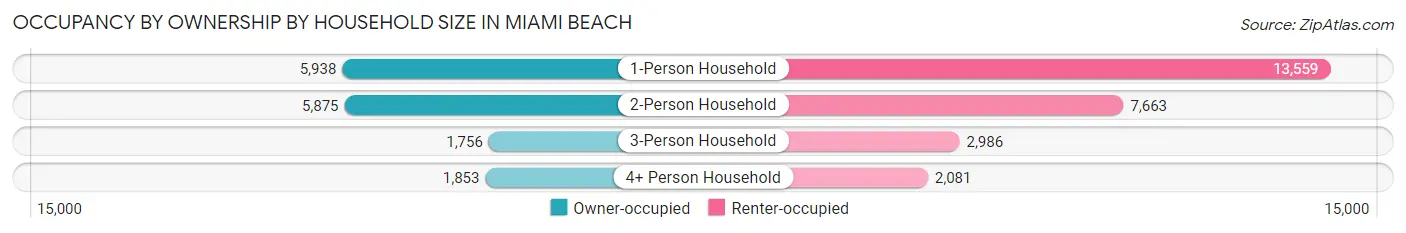
| Household Size | Owner-occupied | Renter-occupied |
| 1-Person Household | 5,938 (30.5%) | 13,559 (69.5%) |
| 2-Person Household | 5,875 (43.4%) | 7,663 (56.6%) |
| 3-Person Household | 1,756 (37.0%) | 2,986 (63.0%) |
| 4+ Person Household | 1,853 (47.1%) | 2,081 (52.9%) |
| Total Housing Units | 15,422 (37.0%) | 26,289 (63.0%) |
Occupancy by Educational Attainment in Miami Beach
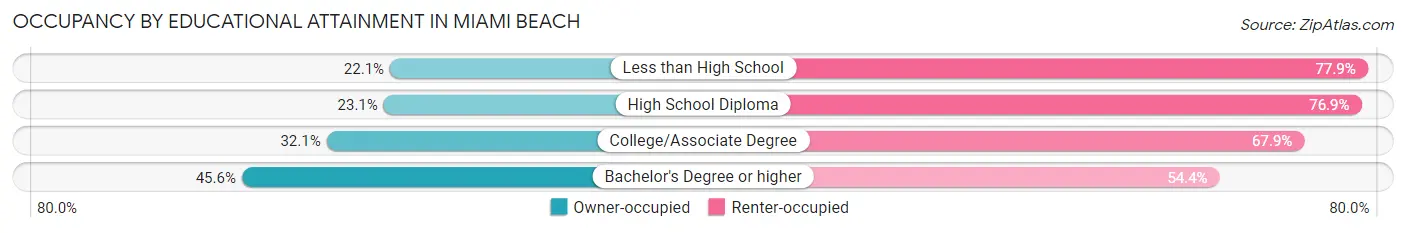
| Household Size | Owner-occupied | Renter-occupied |
| Less than High School | 753 (22.1%) | 2,660 (77.9%) |
| High School Diploma | 1,440 (23.1%) | 4,804 (76.9%) |
| College/Associate Degree | 3,285 (32.1%) | 6,941 (67.9%) |
| Bachelor's Degree or higher | 9,944 (45.6%) | 11,884 (54.4%) |
Occupancy by Age of Householder in Miami Beach
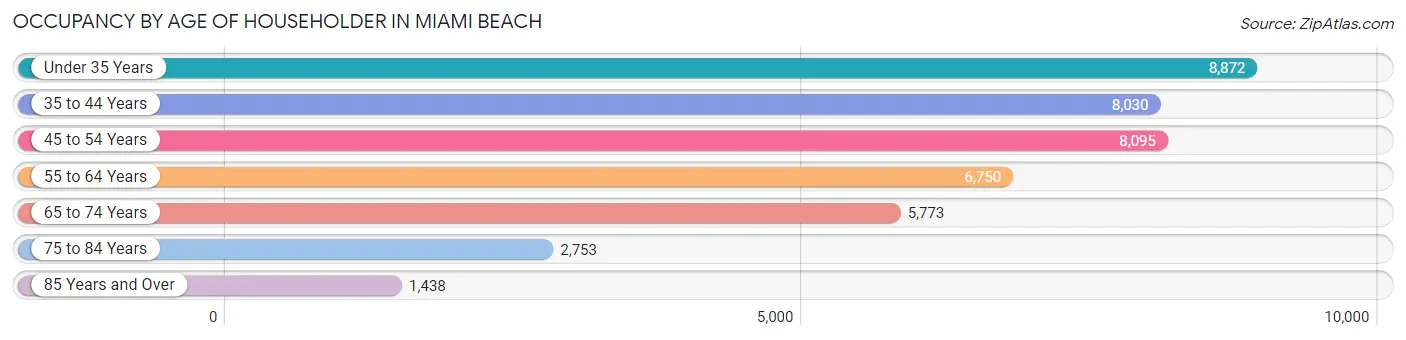
| Age Bracket | # Households | % Households |
| Under 35 Years | 8,872 | 21.3% |
| 35 to 44 Years | 8,030 | 19.3% |
| 45 to 54 Years | 8,095 | 19.4% |
| 55 to 64 Years | 6,750 | 16.2% |
| 65 to 74 Years | 5,773 | 13.8% |
| 75 to 84 Years | 2,753 | 6.6% |
| 85 Years and Over | 1,438 | 3.5% |
| Total | 41,711 | 100.0% |
Housing Finances in Miami Beach
Median Income by Occupancy in Miami Beach
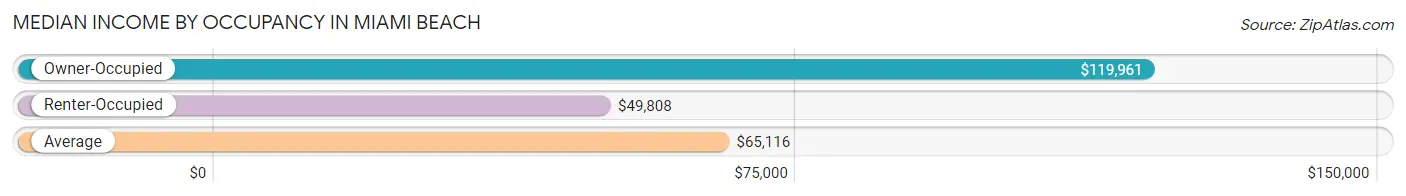
| Occupancy Type | # Households | Median Income |
| Owner-Occupied | 15,422 (37.0%) | $119,961 |
| Renter-Occupied | 26,289 (63.0%) | $49,808 |
| Average | 41,711 (100.0%) | $65,116 |
Occupancy by Householder Income Bracket in Miami Beach
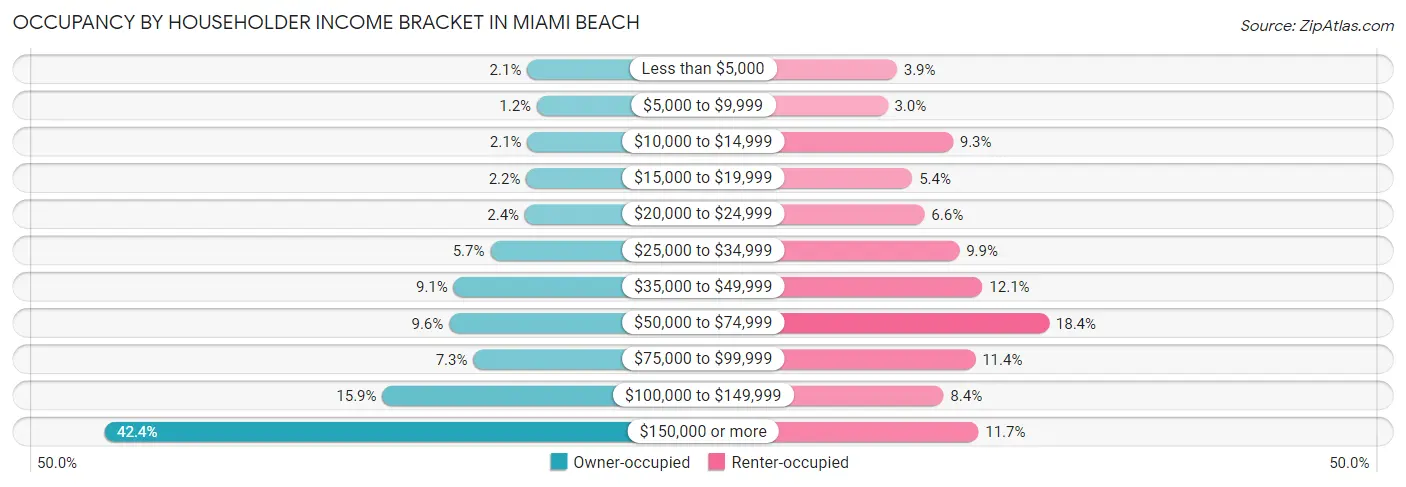
| Income Bracket | Owner-occupied | Renter-occupied |
| Less than $5,000 | 328 (2.1%) | 1,033 (3.9%) |
| $5,000 to $9,999 | 186 (1.2%) | 798 (3.0%) |
| $10,000 to $14,999 | 326 (2.1%) | 2,435 (9.3%) |
| $15,000 to $19,999 | 342 (2.2%) | 1,419 (5.4%) |
| $20,000 to $24,999 | 362 (2.4%) | 1,725 (6.6%) |
| $25,000 to $34,999 | 872 (5.7%) | 2,595 (9.9%) |
| $35,000 to $49,999 | 1,409 (9.1%) | 3,175 (12.1%) |
| $50,000 to $74,999 | 1,476 (9.6%) | 4,840 (18.4%) |
| $75,000 to $99,999 | 1,121 (7.3%) | 2,997 (11.4%) |
| $100,000 to $149,999 | 2,456 (15.9%) | 2,200 (8.4%) |
| $150,000 or more | 6,544 (42.4%) | 3,072 (11.7%) |
| Total | 15,422 (100.0%) | 26,289 (100.0%) |
Monthly Housing Cost Tiers in Miami Beach
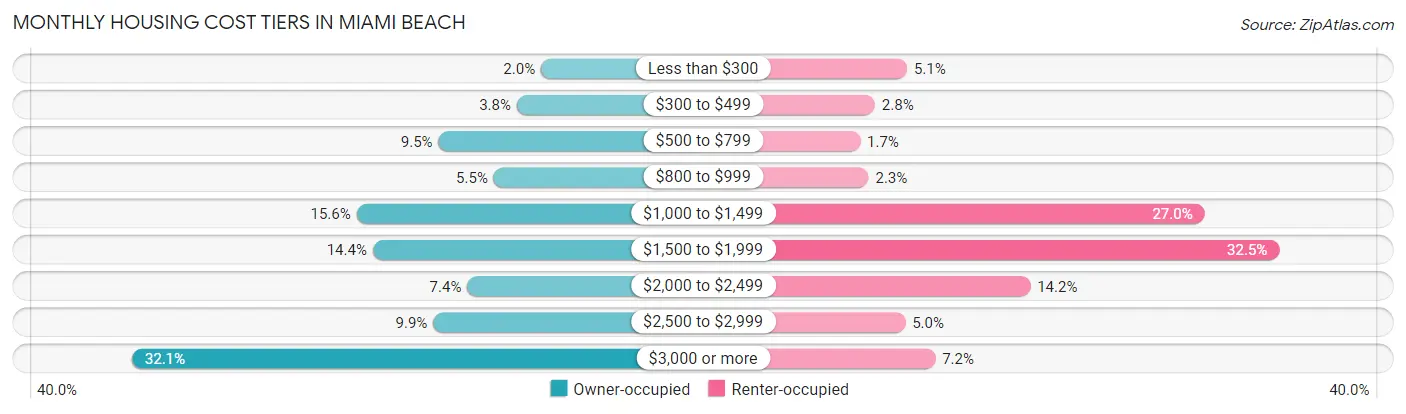
| Monthly Cost | Owner-occupied | Renter-occupied |
| Less than $300 | 304 (2.0%) | 1,346 (5.1%) |
| $300 to $499 | 578 (3.7%) | 725 (2.8%) |
| $500 to $799 | 1,468 (9.5%) | 440 (1.7%) |
| $800 to $999 | 840 (5.4%) | 603 (2.3%) |
| $1,000 to $1,499 | 2,398 (15.5%) | 7,107 (27.0%) |
| $1,500 to $1,999 | 2,214 (14.4%) | 8,551 (32.5%) |
| $2,000 to $2,499 | 1,141 (7.4%) | 3,733 (14.2%) |
| $2,500 to $2,999 | 1,528 (9.9%) | 1,312 (5.0%) |
| $3,000 or more | 4,951 (32.1%) | 1,892 (7.2%) |
| Total | 15,422 (100.0%) | 26,289 (100.0%) |
Physical Housing Characteristics in Miami Beach
Housing Structures in Miami Beach
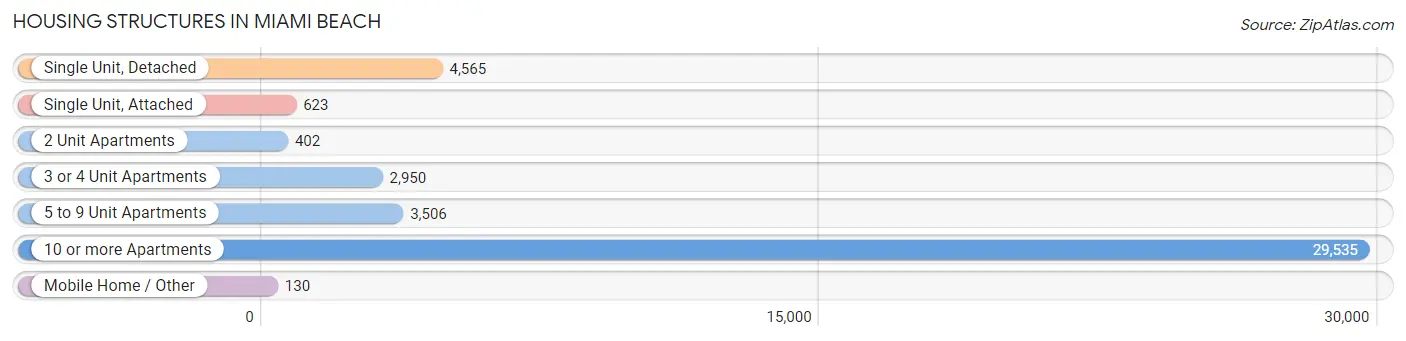
| Structure Type | # Housing Units | % Housing Units |
| Single Unit, Detached | 4,565 | 10.9% |
| Single Unit, Attached | 623 | 1.5% |
| 2 Unit Apartments | 402 | 1.0% |
| 3 or 4 Unit Apartments | 2,950 | 7.1% |
| 5 to 9 Unit Apartments | 3,506 | 8.4% |
| 10 or more Apartments | 29,535 | 70.8% |
| Mobile Home / Other | 130 | 0.3% |
| Total | 41,711 | 100.0% |
Housing Structures by Occupancy in Miami Beach
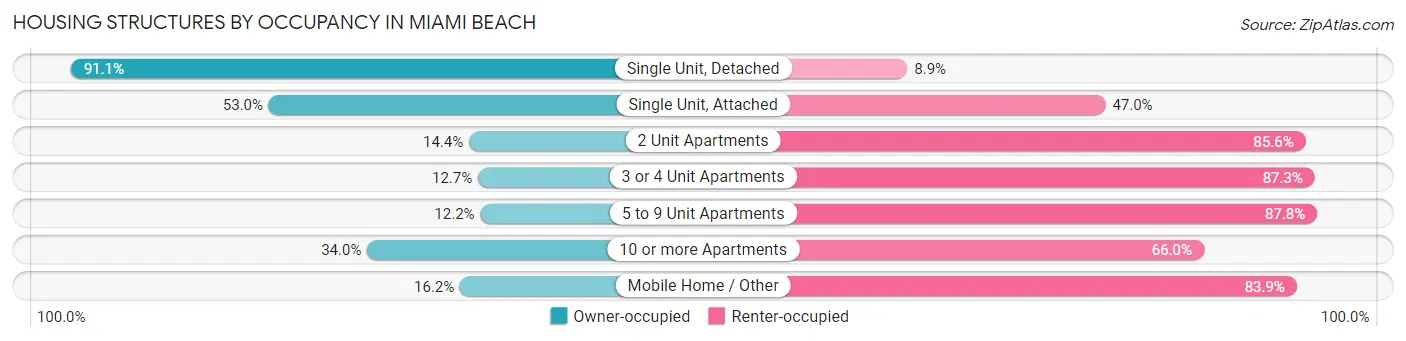
| Structure Type | Owner-occupied | Renter-occupied |
| Single Unit, Detached | 4,159 (91.1%) | 406 (8.9%) |
| Single Unit, Attached | 330 (53.0%) | 293 (47.0%) |
| 2 Unit Apartments | 58 (14.4%) | 344 (85.6%) |
| 3 or 4 Unit Apartments | 374 (12.7%) | 2,576 (87.3%) |
| 5 to 9 Unit Apartments | 429 (12.2%) | 3,077 (87.8%) |
| 10 or more Apartments | 10,051 (34.0%) | 19,484 (66.0%) |
| Mobile Home / Other | 21 (16.2%) | 109 (83.9%) |
| Total | 15,422 (37.0%) | 26,289 (63.0%) |
Housing Structures by Number of Rooms in Miami Beach
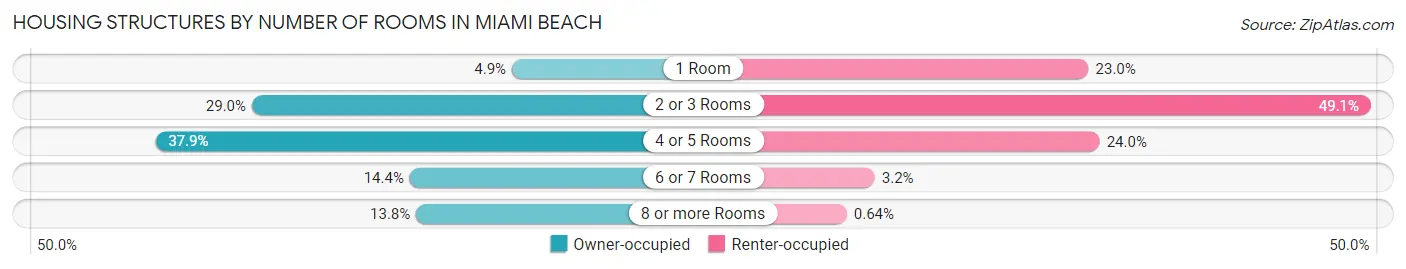
| Number of Rooms | Owner-occupied | Renter-occupied |
| 1 Room | 761 (4.9%) | 6,047 (23.0%) |
| 2 or 3 Rooms | 4,470 (29.0%) | 12,907 (49.1%) |
| 4 or 5 Rooms | 5,848 (37.9%) | 6,318 (24.0%) |
| 6 or 7 Rooms | 2,217 (14.4%) | 848 (3.2%) |
| 8 or more Rooms | 2,126 (13.8%) | 169 (0.6%) |
| Total | 15,422 (100.0%) | 26,289 (100.0%) |
Housing Structure by Heating Type in Miami Beach
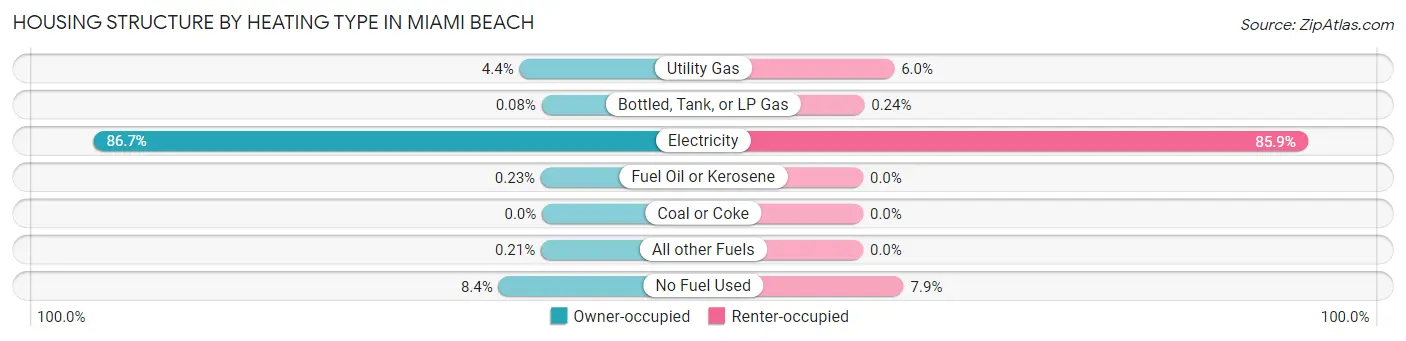
| Heating Type | Owner-occupied | Renter-occupied |
| Utility Gas | 674 (4.4%) | 1,582 (6.0%) |
| Bottled, Tank, or LP Gas | 13 (0.1%) | 63 (0.2%) |
| Electricity | 13,370 (86.7%) | 22,581 (85.9%) |
| Fuel Oil or Kerosene | 35 (0.2%) | 0 (0.0%) |
| Coal or Coke | 0 (0.0%) | 0 (0.0%) |
| All other Fuels | 33 (0.2%) | 0 (0.0%) |
| No Fuel Used | 1,297 (8.4%) | 2,063 (7.9%) |
| Total | 15,422 (100.0%) | 26,289 (100.0%) |
Household Vehicle Usage in Miami Beach
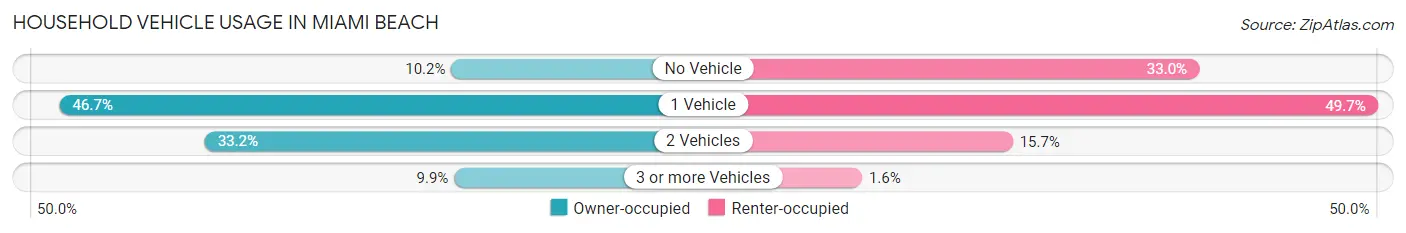
| Vehicles per Household | Owner-occupied | Renter-occupied |
| No Vehicle | 1,569 (10.2%) | 8,685 (33.0%) |
| 1 Vehicle | 7,209 (46.7%) | 13,068 (49.7%) |
| 2 Vehicles | 5,117 (33.2%) | 4,118 (15.7%) |
| 3 or more Vehicles | 1,527 (9.9%) | 418 (1.6%) |
| Total | 15,422 (100.0%) | 26,289 (100.0%) |
Real Estate & Mortgages in Miami Beach
Real Estate and Mortgage Overview in Miami Beach
| Characteristic | Without Mortgage | With Mortgage |
| Housing Units | 7,845 | 7,577 |
| Median Property Value | $521,800 | $546,100 |
| Median Household Income | $95,574 | $3,681 |
| Monthly Housing Costs | $1,256 | $3,904 |
| Real Estate Taxes | $4,510 | $177 |
Property Value by Mortgage Status in Miami Beach
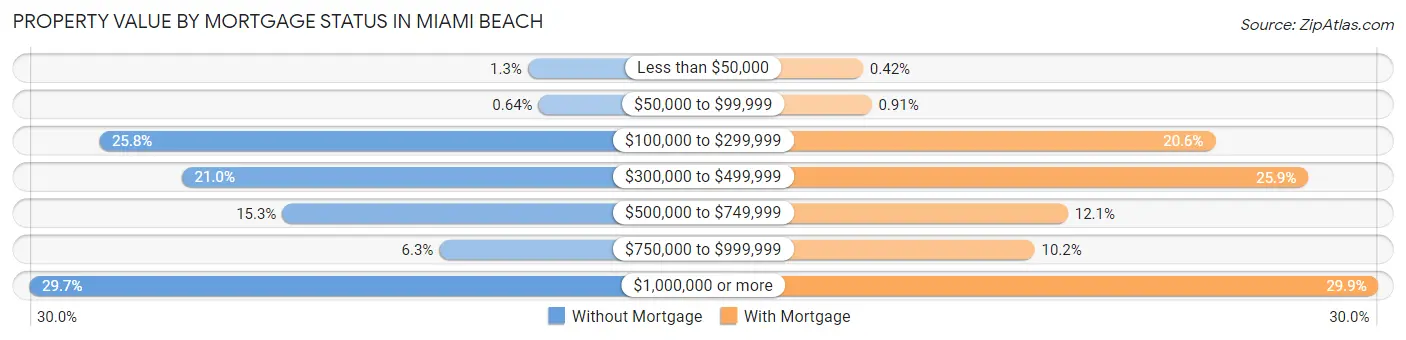
| Property Value | Without Mortgage | With Mortgage |
| Less than $50,000 | 98 (1.3%) | 32 (0.4%) |
| $50,000 to $99,999 | 50 (0.6%) | 69 (0.9%) |
| $100,000 to $299,999 | 2,020 (25.8%) | 1,558 (20.6%) |
| $300,000 to $499,999 | 1,650 (21.0%) | 1,960 (25.9%) |
| $500,000 to $749,999 | 1,199 (15.3%) | 919 (12.1%) |
| $750,000 to $999,999 | 495 (6.3%) | 775 (10.2%) |
| $1,000,000 or more | 2,333 (29.7%) | 2,264 (29.9%) |
| Total | 7,845 (100.0%) | 7,577 (100.0%) |
Household Income by Mortgage Status in Miami Beach
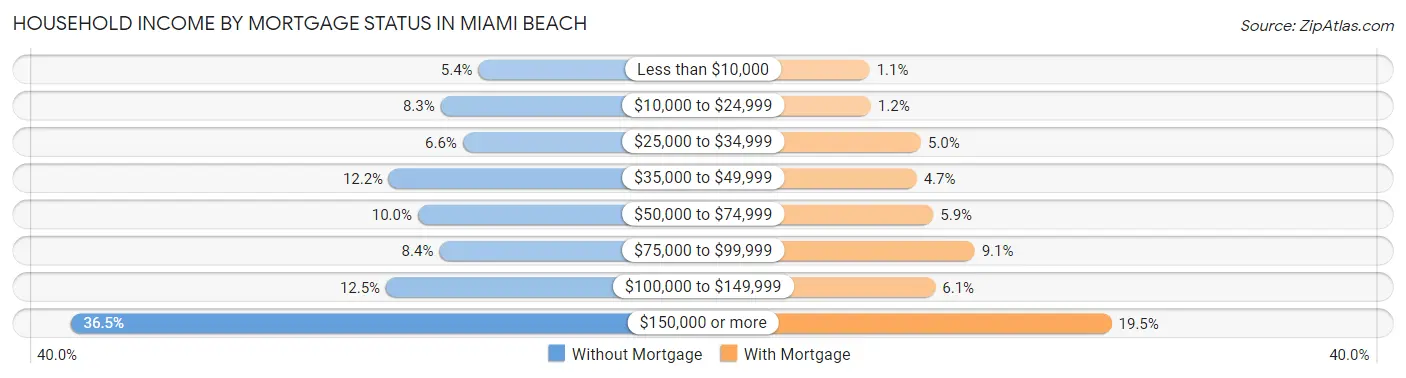
| Household Income | Without Mortgage | With Mortgage |
| Less than $10,000 | 425 (5.4%) | 82 (1.1%) |
| $10,000 to $24,999 | 652 (8.3%) | 89 (1.2%) |
| $25,000 to $34,999 | 519 (6.6%) | 378 (5.0%) |
| $35,000 to $49,999 | 960 (12.2%) | 353 (4.7%) |
| $50,000 to $74,999 | 788 (10.0%) | 449 (5.9%) |
| $75,000 to $99,999 | 660 (8.4%) | 688 (9.1%) |
| $100,000 to $149,999 | 978 (12.5%) | 461 (6.1%) |
| $150,000 or more | 2,863 (36.5%) | 1,478 (19.5%) |
| Total | 7,845 (100.0%) | 7,577 (100.0%) |
Property Value to Household Income Ratio in Miami Beach
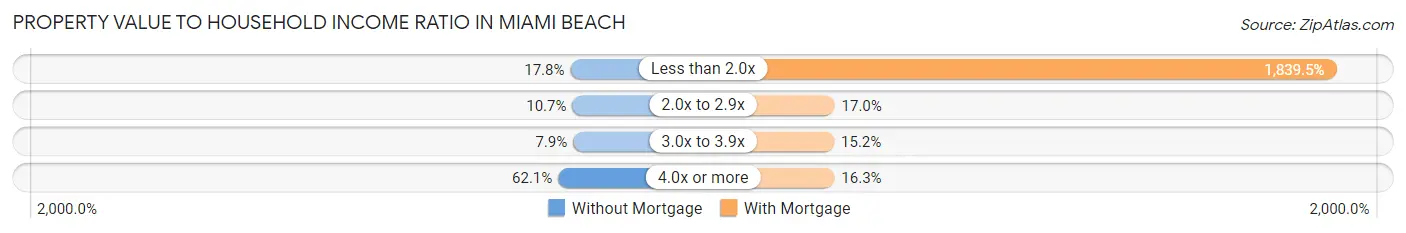
| Value-to-Income Ratio | Without Mortgage | With Mortgage |
| Less than 2.0x | 1,393 (17.8%) | 139,381 (1,839.5%) |
| 2.0x to 2.9x | 841 (10.7%) | 1,291 (17.0%) |
| 3.0x to 3.9x | 621 (7.9%) | 1,152 (15.2%) |
| 4.0x or more | 4,871 (62.1%) | 1,231 (16.3%) |
| Total | 7,845 (100.0%) | 7,577 (100.0%) |
Real Estate Taxes by Mortgage Status in Miami Beach
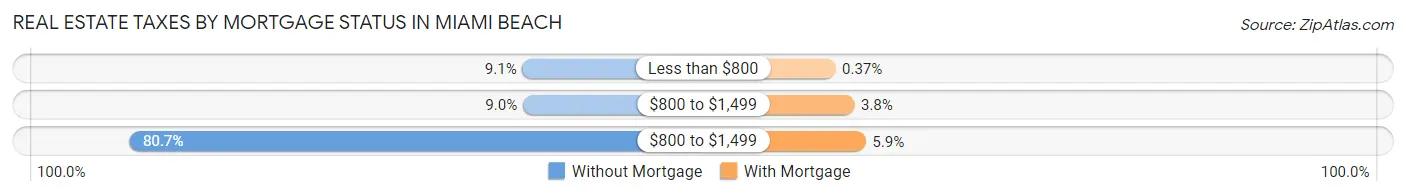
| Property Taxes | Without Mortgage | With Mortgage |
| Less than $800 | 711 (9.1%) | 28 (0.4%) |
| $800 to $1,499 | 704 (9.0%) | 290 (3.8%) |
| $800 to $1,499 | 6,334 (80.7%) | 448 (5.9%) |
| Total | 7,845 (100.0%) | 7,577 (100.0%) |
Health & Disability in Miami Beach
Health Insurance Coverage by Age in Miami Beach
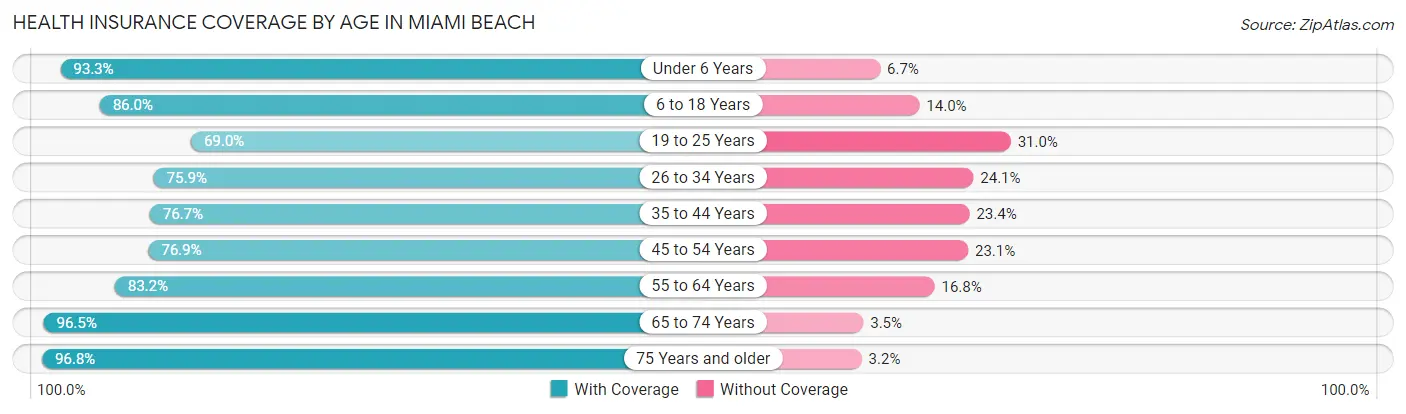
| Age Bracket | With Coverage | Without Coverage |
| Under 6 Years | 4,075 (93.3%) | 291 (6.7%) |
| 6 to 18 Years | 7,031 (86.0%) | 1,146 (14.0%) |
| 19 to 25 Years | 4,038 (69.0%) | 1,817 (31.0%) |
| 26 to 34 Years | 9,313 (75.9%) | 2,953 (24.1%) |
| 35 to 44 Years | 10,436 (76.6%) | 3,180 (23.4%) |
| 45 to 54 Years | 9,832 (76.9%) | 2,948 (23.1%) |
| 55 to 64 Years | 8,457 (83.2%) | 1,711 (16.8%) |
| 65 to 74 Years | 8,365 (96.5%) | 307 (3.5%) |
| 75 Years and older | 5,730 (96.8%) | 192 (3.2%) |
| Total | 67,277 (82.2%) | 14,545 (17.8%) |
Health Insurance Coverage by Citizenship Status in Miami Beach
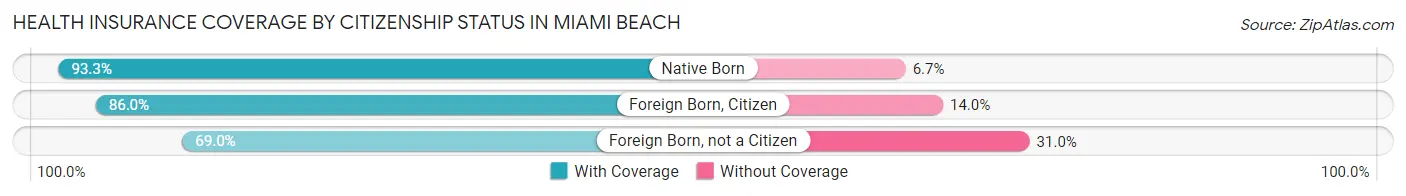
| Citizenship Status | With Coverage | Without Coverage |
| Native Born | 4,075 (93.3%) | 291 (6.7%) |
| Foreign Born, Citizen | 7,031 (86.0%) | 1,146 (14.0%) |
| Foreign Born, not a Citizen | 4,038 (69.0%) | 1,817 (31.0%) |
Health Insurance Coverage by Household Income in Miami Beach
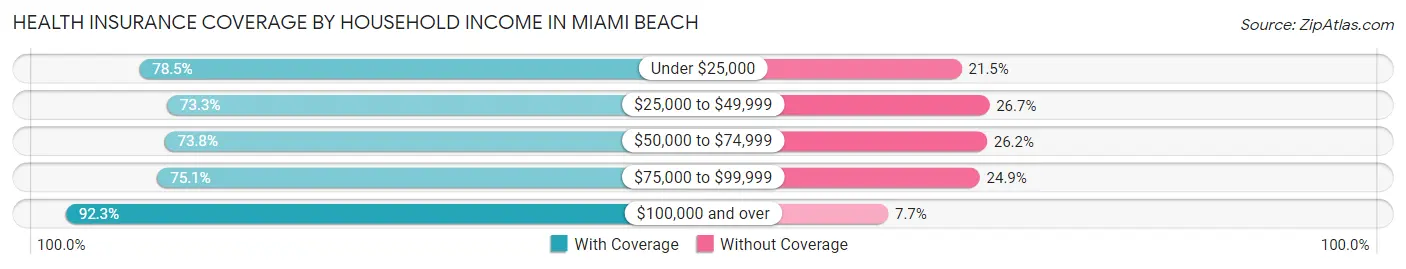
| Household Income | With Coverage | Without Coverage |
| Under $25,000 | 9,229 (78.5%) | 2,529 (21.5%) |
| $25,000 to $49,999 | 10,549 (73.3%) | 3,840 (26.7%) |
| $50,000 to $74,999 | 9,343 (73.8%) | 3,322 (26.2%) |
| $75,000 to $99,999 | 6,509 (75.1%) | 2,156 (24.9%) |
| $100,000 and over | 31,373 (92.3%) | 2,630 (7.7%) |
Public vs Private Health Insurance Coverage by Age in Miami Beach
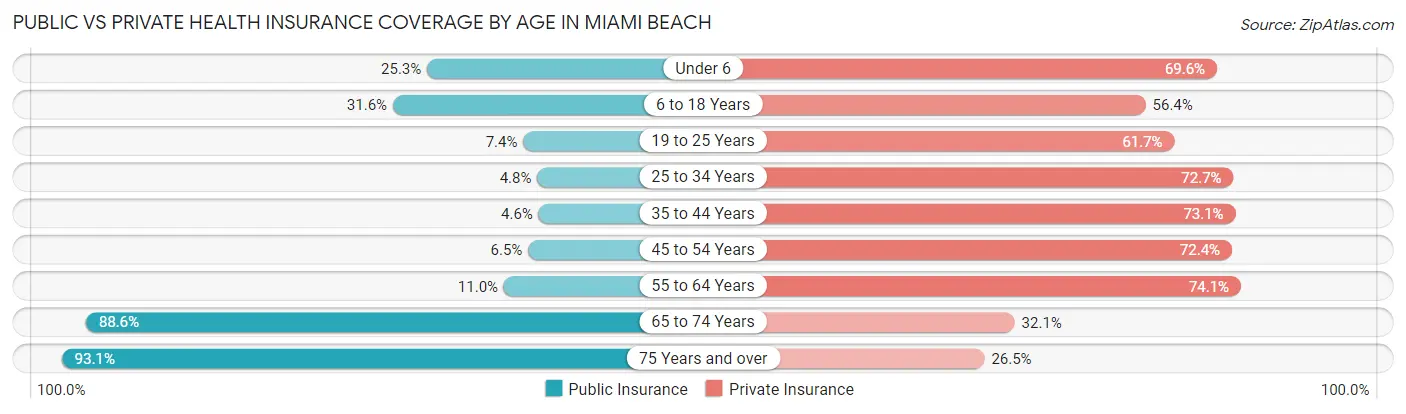
| Age Bracket | Public Insurance | Private Insurance |
| Under 6 | 1,104 (25.3%) | 3,040 (69.6%) |
| 6 to 18 Years | 2,587 (31.6%) | 4,611 (56.4%) |
| 19 to 25 Years | 435 (7.4%) | 3,615 (61.7%) |
| 25 to 34 Years | 592 (4.8%) | 8,915 (72.7%) |
| 35 to 44 Years | 623 (4.6%) | 9,948 (73.1%) |
| 45 to 54 Years | 835 (6.5%) | 9,254 (72.4%) |
| 55 to 64 Years | 1,122 (11.0%) | 7,532 (74.1%) |
| 65 to 74 Years | 7,686 (88.6%) | 2,783 (32.1%) |
| 75 Years and over | 5,515 (93.1%) | 1,568 (26.5%) |
| Total | 20,499 (25.1%) | 51,266 (62.7%) |
Disability Status by Sex by Age in Miami Beach
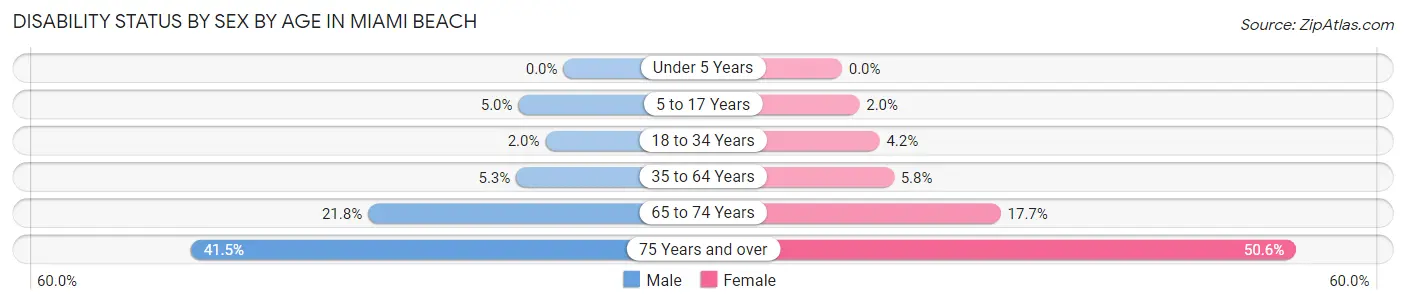
| Age Bracket | Male | Female |
| Under 5 Years | 0 (0.0%) | 0 (0.0%) |
| 5 to 17 Years | 194 (5.0%) | 89 (1.9%) |
| 18 to 34 Years | 185 (2.0%) | 397 (4.2%) |
| 35 to 64 Years | 1,081 (5.3%) | 927 (5.8%) |
| 65 to 74 Years | 886 (21.8%) | 814 (17.7%) |
| 75 Years and over | 1,013 (41.5%) | 1,761 (50.6%) |
Disability Class by Sex by Age in Miami Beach
Disability Class: Hearing Difficulty
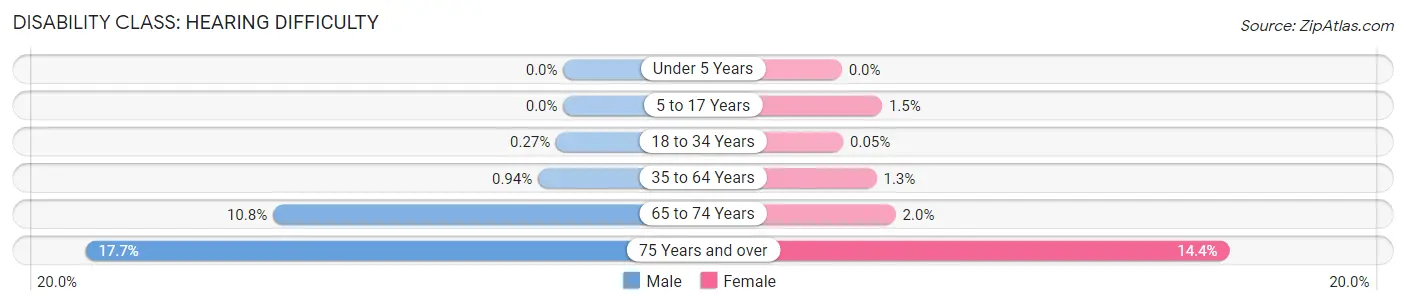
| Age Bracket | Male | Female |
| Under 5 Years | 0 (0.0%) | 0 (0.0%) |
| 5 to 17 Years | 0 (0.0%) | 68 (1.5%) |
| 18 to 34 Years | 25 (0.3%) | 5 (0.1%) |
| 35 to 64 Years | 192 (0.9%) | 207 (1.3%) |
| 65 to 74 Years | 439 (10.8%) | 92 (2.0%) |
| 75 Years and over | 433 (17.7%) | 501 (14.4%) |
Disability Class: Vision Difficulty
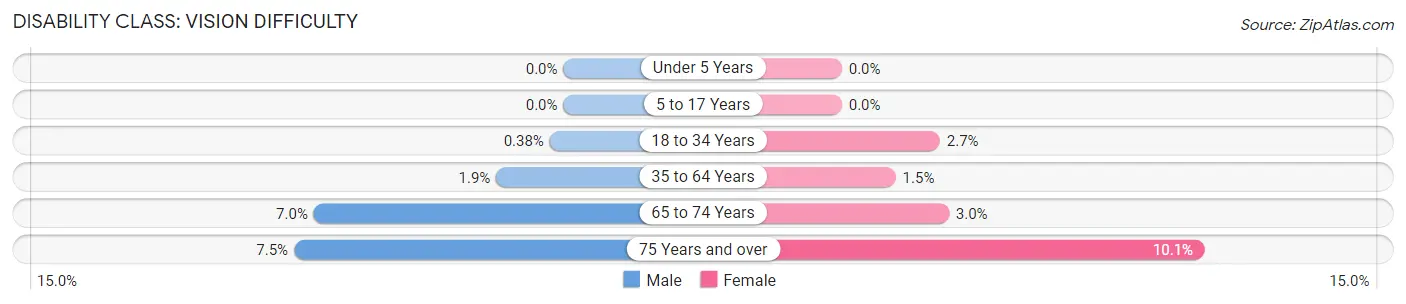
| Age Bracket | Male | Female |
| Under 5 Years | 0 (0.0%) | 0 (0.0%) |
| 5 to 17 Years | 0 (0.0%) | 0 (0.0%) |
| 18 to 34 Years | 35 (0.4%) | 258 (2.7%) |
| 35 to 64 Years | 384 (1.9%) | 240 (1.5%) |
| 65 to 74 Years | 283 (7.0%) | 137 (3.0%) |
| 75 Years and over | 183 (7.5%) | 352 (10.1%) |
Disability Class: Cognitive Difficulty
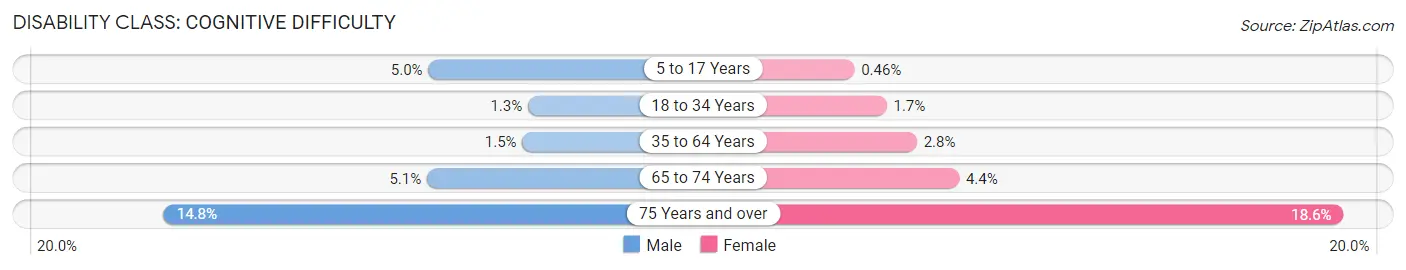
| Age Bracket | Male | Female |
| 5 to 17 Years | 194 (5.0%) | 21 (0.5%) |
| 18 to 34 Years | 121 (1.3%) | 157 (1.7%) |
| 35 to 64 Years | 313 (1.5%) | 446 (2.8%) |
| 65 to 74 Years | 206 (5.1%) | 200 (4.3%) |
| 75 Years and over | 362 (14.8%) | 648 (18.6%) |
Disability Class: Ambulatory Difficulty
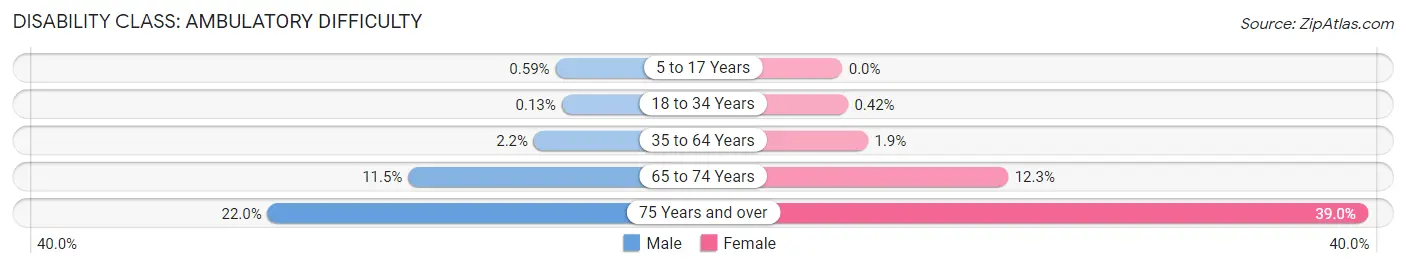
| Age Bracket | Male | Female |
| 5 to 17 Years | 23 (0.6%) | 0 (0.0%) |
| 18 to 34 Years | 12 (0.1%) | 40 (0.4%) |
| 35 to 64 Years | 449 (2.2%) | 307 (1.9%) |
| 65 to 74 Years | 469 (11.5%) | 567 (12.3%) |
| 75 Years and over | 536 (22.0%) | 1,359 (39.0%) |
Disability Class: Self-Care Difficulty
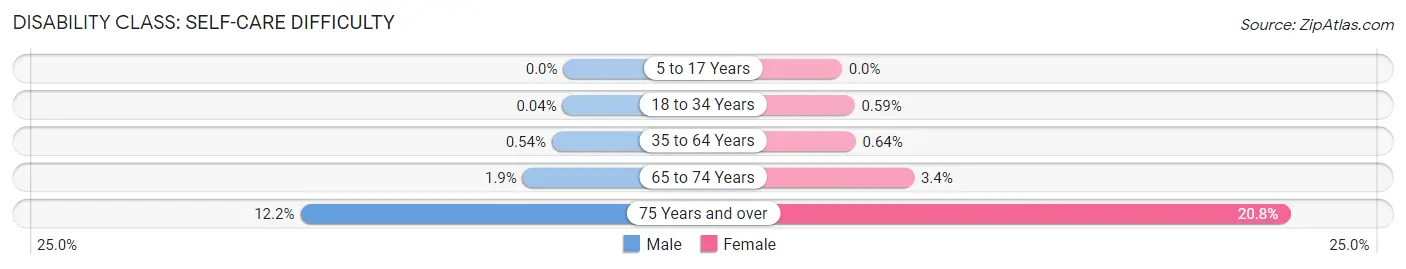
| Age Bracket | Male | Female |
| 5 to 17 Years | 0 (0.0%) | 0 (0.0%) |
| 18 to 34 Years | 4 (0.0%) | 56 (0.6%) |
| 35 to 64 Years | 111 (0.5%) | 103 (0.6%) |
| 65 to 74 Years | 77 (1.9%) | 154 (3.4%) |
| 75 Years and over | 298 (12.2%) | 724 (20.8%) |
Technology Access in Miami Beach
Computing Device Access in Miami Beach
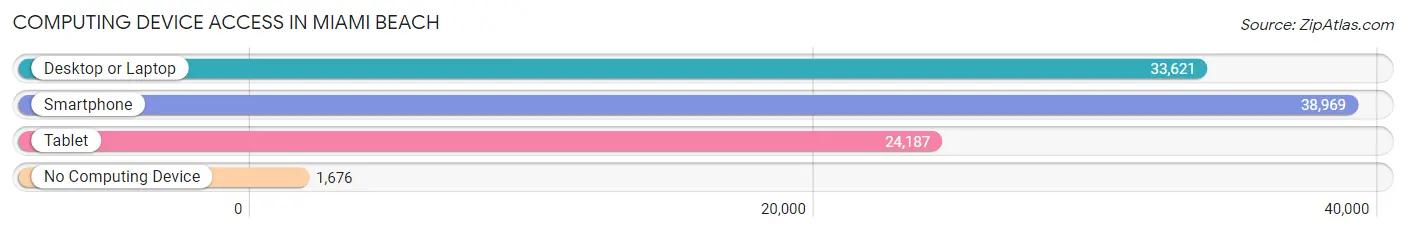
| Device Type | # Households | % Households |
| Desktop or Laptop | 33,621 | 80.6% |
| Smartphone | 38,969 | 93.4% |
| Tablet | 24,187 | 58.0% |
| No Computing Device | 1,676 | 4.0% |
| Total | 41,711 | 100.0% |
Internet Access in Miami Beach
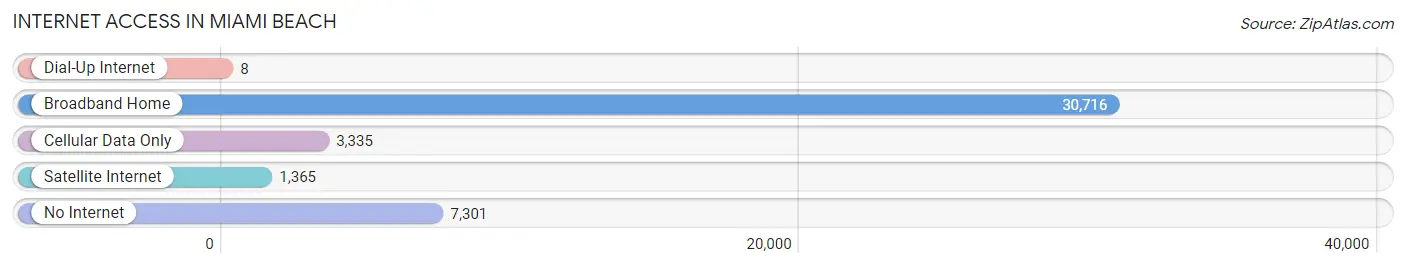
| Internet Type | # Households | % Households |
| Dial-Up Internet | 8 | 0.0% |
| Broadband Home | 30,716 | 73.6% |
| Cellular Data Only | 3,335 | 8.0% |
| Satellite Internet | 1,365 | 3.3% |
| No Internet | 7,301 | 17.5% |
| Total | 41,711 | 100.0% |
Miami Beach Summary
Miami Beach, FL is a city located in Miami-Dade County, Florida, United States. It is a barrier island located between the Atlantic Ocean and Biscayne Bay. The city is known for its beaches, nightlife, and its diverse population. Miami Beach is one of the most popular tourist destinations in the United States, and is home to a variety of cultures and lifestyles.
History
Miami Beach was originally inhabited by the Tequesta Indians, who were the first known inhabitants of the area. The Tequesta Indians were a peaceful tribe that lived in the area for thousands of years before the arrival of Europeans. In 1513, Spanish explorer Juan Ponce de Leon arrived in the area and named it “La Florida”. In the late 1800s, the area was developed by Henry Flagler, who built the Royal Palm Hotel in 1896. Flagler also built the first bridge connecting Miami Beach to the mainland.
In 1915, Miami Beach was incorporated as a city. During the 1920s, the city experienced a period of rapid growth and development, as it became a popular destination for wealthy tourists. The city was also home to a number of celebrities, including Al Capone and Thomas Edison.
In the 1940s, the city experienced a period of decline, as the Great Depression and World War II caused a decrease in tourism. However, the city experienced a resurgence in the 1950s, as it became a popular destination for celebrities and tourists.
Geography
Miami Beach is located on a barrier island between the Atlantic Ocean and Biscayne Bay. The city is bordered by the cities of Miami and Surfside to the west, and by the cities of Bal Harbour and Bay Harbor Islands to the north. The city covers an area of 35.9 square miles, and has a population of 87,779 as of the 2010 census.
The city is divided into several distinct neighborhoods, including South Beach, North Beach, Mid-Beach, and North Bay Village. South Beach is the most popular and well-known neighborhood, and is known for its vibrant nightlife and beaches. North Beach is a quieter neighborhood, and is home to a number of luxury hotels and resorts. Mid-Beach is a residential neighborhood, and is home to a number of historic buildings. North Bay Village is a residential neighborhood located on the northern tip of the island.
Economy
Miami Beach is a major tourist destination, and the city’s economy is heavily reliant on tourism. The city is home to a number of luxury hotels and resorts, as well as a variety of restaurants, bars, and nightclubs. The city is also home to a number of museums, galleries, and other attractions.
The city is also home to a number of corporate headquarters, including Carnival Cruise Lines, Royal Caribbean International, and Norwegian Cruise Line. The city is also home to a number of technology companies, including Microsoft, Oracle, and IBM.
Demographics
As of the 2010 census, the population of Miami Beach was 87,779. The city has a population density of 2,521 people per square mile. The racial makeup of the city is 63.3% White, 22.2% Hispanic or Latino, 10.2% African American, and 4.3% other.
The median household income in Miami Beach is $50,867, and the median family income is $62,945. The city has a poverty rate of 16.3%. The city’s population is well-educated, with 44.3% of residents having a bachelor’s degree or higher.
Conclusion
Miami Beach, FL is a vibrant and diverse city located in Miami-Dade County, Florida. The city is known for its beaches, nightlife, and its diverse population. The city has a long and rich history, and is home to a variety of cultures and lifestyles. The city’s economy is heavily reliant on tourism, and is home to a number of corporate headquarters and technology companies. The city has a population of 87,779, and has a median household income of $50,867. Miami Beach is a popular tourist destination, and is home to a variety of attractions and activities.
Common Questions
What is Per Capita Income in Miami Beach?
Per Capita income in Miami Beach is $69,329.
What is the Median Family Income in Miami Beach?
Median Family Income in Miami Beach is $91,629.
What is the Median Household income in Miami Beach?
Median Household Income in Miami Beach is $65,116.
What is Income or Wage Gap in Miami Beach?
Income or Wage Gap in Miami Beach is 31.3%.
Women in Miami Beach earn 68.7 cents for every dollar earned by a man.
What is Family Income Deficit in Miami Beach?
Family Income Deficit in Miami Beach is $8,234.
Families that are below poverty line in Miami Beach earn $8,234 less on average than the poverty threshold level.
What is Inequality or Gini Index in Miami Beach?
Inequality or Gini Index in Miami Beach is 0.62.
What is the Total Population of Miami Beach?
Total Population of Miami Beach is 82,400.
What is the Total Male Population of Miami Beach?
Total Male Population of Miami Beach is 42,139.
What is the Total Female Population of Miami Beach?
Total Female Population of Miami Beach is 40,261.
What is the Ratio of Males per 100 Females in Miami Beach?
There are 104.66 Males per 100 Females in Miami Beach.
What is the Ratio of Females per 100 Males in Miami Beach?
There are 95.54 Females per 100 Males in Miami Beach.
What is the Median Population Age in Miami Beach?
Median Population Age in Miami Beach is 42.3 Years.
What is the Average Family Size in Miami Beach
Average Family Size in Miami Beach is 2.8 People.
What is the Average Household Size in Miami Beach
Average Household Size in Miami Beach is 1.9 People.
How Large is the Labor Force in Miami Beach?
There are 49,272 People in the Labor Forcein in Miami Beach.
What is the Percentage of People in the Labor Force in Miami Beach?
68.8% of People are in the Labor Force in Miami Beach.
What is the Unemployment Rate in Miami Beach?
Unemployment Rate in Miami Beach is 4.0%.