Stevenson Ranch, CA
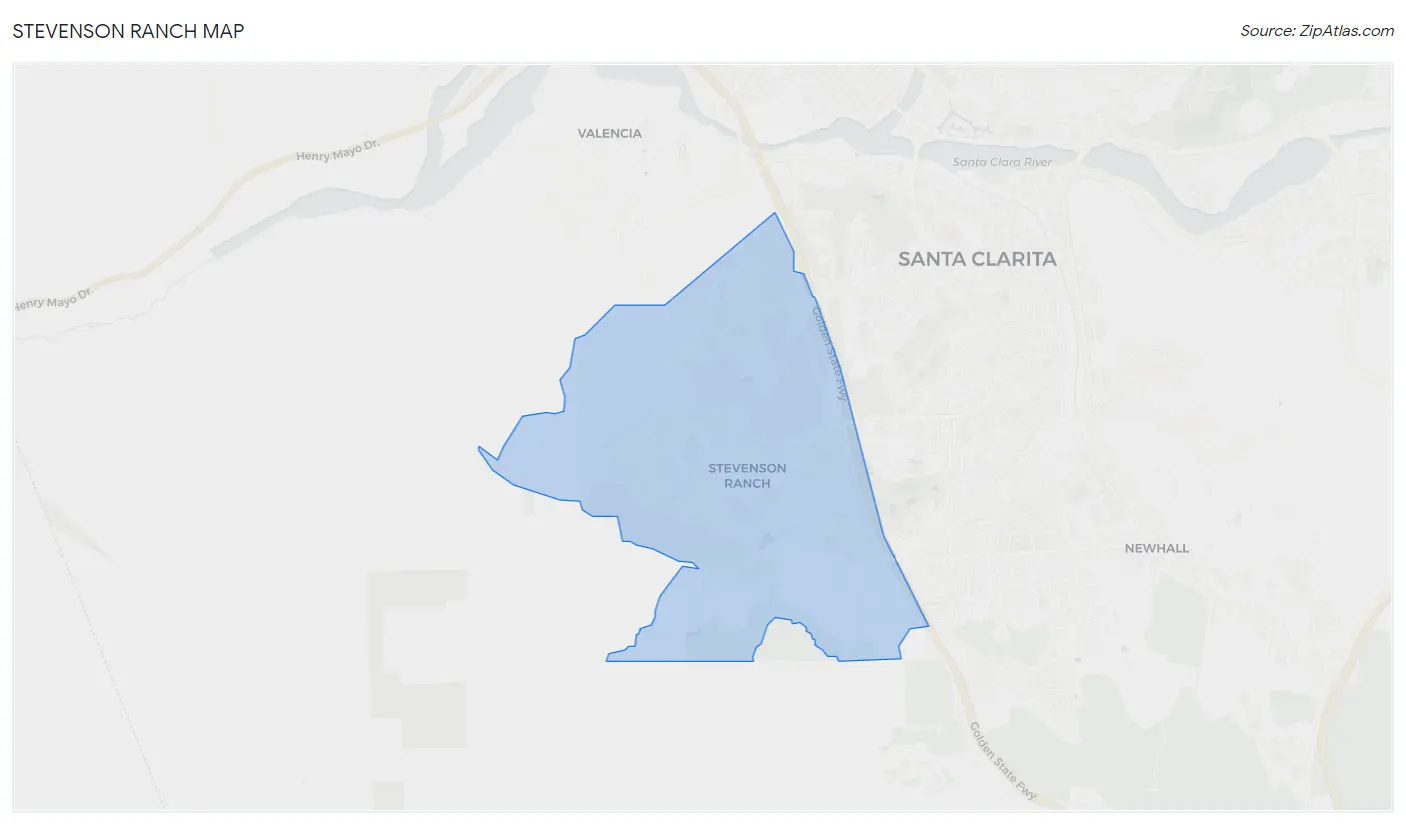
Stevenson Ranch Map
Stevenson Ranch Overview
20,484
TOTAL POPULATION
9,977
MALE POPULATION
10,507
FEMALE POPULATION
94.96
MALES / 100 FEMALES
105.31
FEMALES / 100 MALES
40.6
MEDIAN AGE
3.4
AVG FAMILY SIZE
3.0
AVG HOUSEHOLD SIZE
$60,061
PER CAPITA INCOME
$160,988
AVG FAMILY INCOME
$147,083
AVG HOUSEHOLD INCOME
40.8%
WAGE / INCOME GAP [ % ]
59.2¢/ $1
WAGE / INCOME GAP [ $ ]
0.41
INEQUALITY / GINI INDEX
10,118
LABOR FORCE [ PEOPLE ]
64.3%
PERCENT IN LABOR FORCE
9.3%
UNEMPLOYMENT RATE
Stevenson Ranch Zip Codes
Stevenson Ranch Area Codes
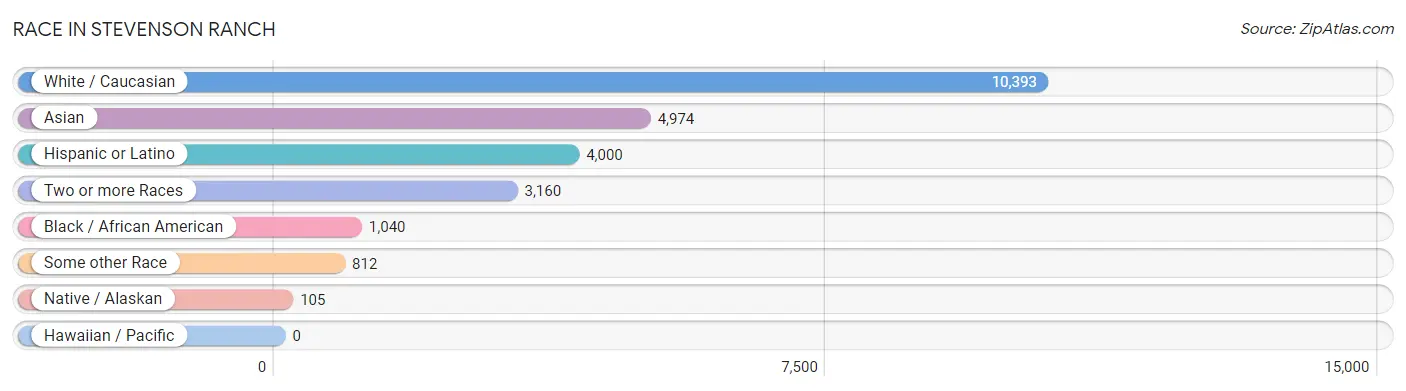
Race in Stevenson Ranch
The most populous races in Stevenson Ranch are White / Caucasian (10,393 | 50.7%), Asian (4,974 | 24.3%), and Hispanic or Latino (4,000 | 19.5%).
| Race | # Population | % Population |
| Asian | 4,974 | 24.3% |
| Black / African American | 1,040 | 5.1% |
| Hawaiian / Pacific | 0 | 0.0% |
| Hispanic or Latino | 4,000 | 19.5% |
| Native / Alaskan | 105 | 0.5% |
| White / Caucasian | 10,393 | 50.7% |
| Two or more Races | 3,160 | 15.4% |
| Some other Race | 812 | 4.0% |
| Total | 20,484 | 100.0% |
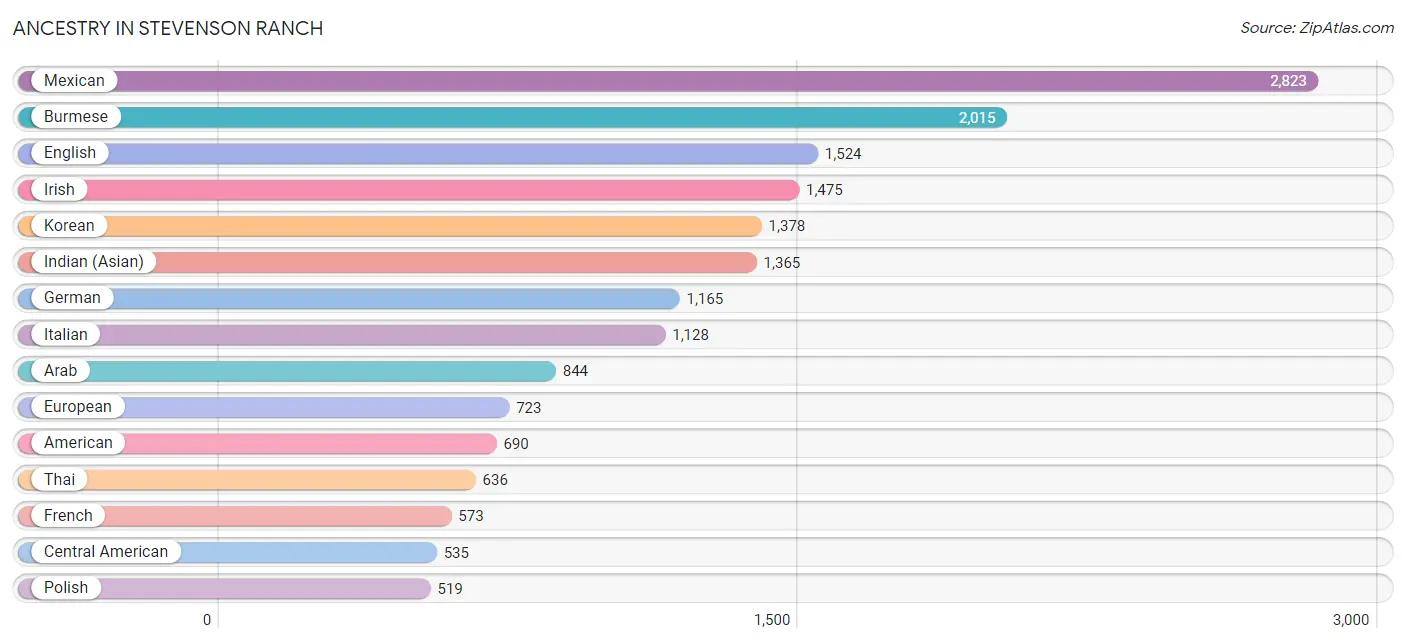
Ancestry in Stevenson Ranch
The most populous ancestries reported in Stevenson Ranch are Mexican (2,823 | 13.8%), Burmese (2,015 | 9.8%), English (1,524 | 7.4%), Irish (1,475 | 7.2%), and Korean (1,378 | 6.7%), together accounting for 45.0% of all Stevenson Ranch residents.
| Ancestry | # Population | % Population |
| Afghan | 14 | 0.1% |
| African | 131 | 0.6% |
| American | 690 | 3.4% |
| Arab | 844 | 4.1% |
| Argentinean | 18 | 0.1% |
| Armenian | 207 | 1.0% |
| Assyrian / Chaldean / Syriac | 103 | 0.5% |
| Austrian | 36 | 0.2% |
| Belgian | 22 | 0.1% |
| Bermudan | 13 | 0.1% |
| Bhutanese | 363 | 1.8% |
| Blackfeet | 48 | 0.2% |
| Brazilian | 16 | 0.1% |
| British | 96 | 0.5% |
| British West Indian | 74 | 0.4% |
| Burmese | 2,015 | 9.8% |
| Canadian | 70 | 0.3% |
| Central American | 535 | 2.6% |
| Cherokee | 67 | 0.3% |
| Chilean | 125 | 0.6% |
| Choctaw | 42 | 0.2% |
| Colombian | 19 | 0.1% |
| Croatian | 22 | 0.1% |
| Cuban | 100 | 0.5% |
| Czech | 133 | 0.6% |
| Danish | 39 | 0.2% |
| Dutch | 222 | 1.1% |
| Eastern European | 95 | 0.5% |
| Ecuadorian | 54 | 0.3% |
| Egyptian | 369 | 1.8% |
| English | 1,524 | 7.4% |
| European | 723 | 3.5% |
| Filipino | 61 | 0.3% |
| Finnish | 70 | 0.3% |
| French | 573 | 2.8% |
| French Canadian | 137 | 0.7% |
| German | 1,165 | 5.7% |
| Greek | 9 | 0.0% |
| Guatemalan | 48 | 0.2% |
| Hungarian | 43 | 0.2% |
| Indian (Asian) | 1,365 | 6.7% |
| Iranian | 365 | 1.8% |
| Iraqi | 10 | 0.1% |
| Irish | 1,475 | 7.2% |
| Israeli | 39 | 0.2% |
| Italian | 1,128 | 5.5% |
| Jamaican | 74 | 0.4% |
| Jordanian | 18 | 0.1% |
| Korean | 1,378 | 6.7% |
| Lebanese | 132 | 0.6% |
| Lithuanian | 59 | 0.3% |
| Mexican | 2,823 | 13.8% |
| Mexican American Indian | 18 | 0.1% |
| Native Hawaiian | 59 | 0.3% |
| Nicaraguan | 6 | 0.0% |
| Northern European | 24 | 0.1% |
| Norwegian | 83 | 0.4% |
| Pakistani | 103 | 0.5% |
| Palestinian | 56 | 0.3% |
| Peruvian | 41 | 0.2% |
| Polish | 519 | 2.5% |
| Portuguese | 146 | 0.7% |
| Puerto Rican | 78 | 0.4% |
| Romanian | 49 | 0.2% |
| Russian | 456 | 2.2% |
| Salvadoran | 481 | 2.4% |
| Scandinavian | 63 | 0.3% |
| Scotch-Irish | 141 | 0.7% |
| Scottish | 269 | 1.3% |
| Slovene | 22 | 0.1% |
| South African | 16 | 0.1% |
| South American | 257 | 1.3% |
| South American Indian | 26 | 0.1% |
| Spaniard | 31 | 0.2% |
| Spanish | 68 | 0.3% |
| Sri Lankan | 15 | 0.1% |
| Subsaharan African | 186 | 0.9% |
| Swedish | 266 | 1.3% |
| Syrian | 196 | 1.0% |
| Thai | 636 | 3.1% |
| Turkish | 75 | 0.4% |
| Ukrainian | 70 | 0.3% |
| Welsh | 68 | 0.3% | View All 83 Rows |
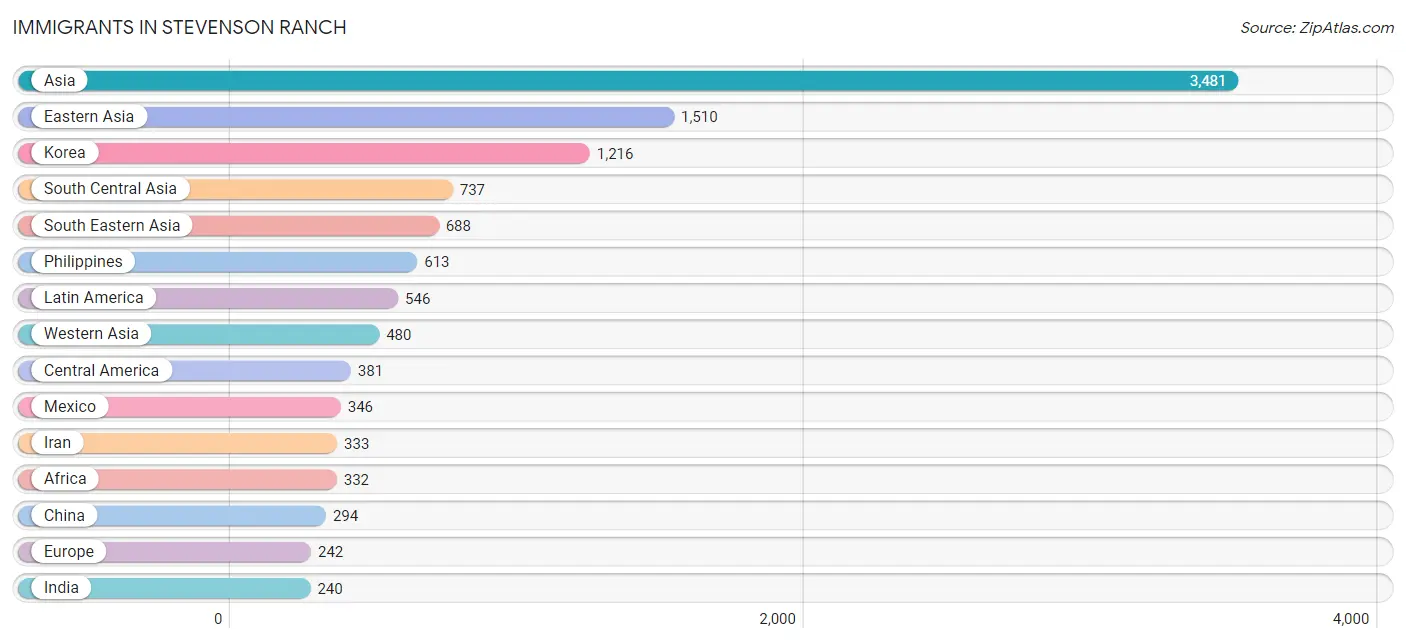
Immigrants in Stevenson Ranch
The most numerous immigrant groups reported in Stevenson Ranch came from Asia (3,481 | 17.0%), Eastern Asia (1,510 | 7.4%), Korea (1,216 | 5.9%), South Central Asia (737 | 3.6%), and South Eastern Asia (688 | 3.4%), together accounting for 37.3% of all Stevenson Ranch residents.
| Immigration Origin | # Population | % Population |
| Afghanistan | 14 | 0.1% |
| Africa | 332 | 1.6% |
| Argentina | 27 | 0.1% |
| Armenia | 80 | 0.4% |
| Asia | 3,481 | 17.0% |
| Austria | 16 | 0.1% |
| Brazil | 19 | 0.1% |
| Canada | 213 | 1.0% |
| Caribbean | 18 | 0.1% |
| Central America | 381 | 1.9% |
| China | 294 | 1.4% |
| Colombia | 19 | 0.1% |
| Cuba | 18 | 0.1% |
| Eastern Africa | 41 | 0.2% |
| Eastern Asia | 1,510 | 7.4% |
| Eastern Europe | 149 | 0.7% |
| Ecuador | 62 | 0.3% |
| Egypt | 174 | 0.9% |
| El Salvador | 17 | 0.1% |
| Europe | 242 | 1.2% |
| Germany | 36 | 0.2% |
| Greece | 9 | 0.0% |
| Guatemala | 18 | 0.1% |
| Hong Kong | 9 | 0.0% |
| India | 240 | 1.2% |
| Iran | 333 | 1.6% |
| Iraq | 40 | 0.2% |
| Ireland | 14 | 0.1% |
| Israel | 30 | 0.2% |
| Kenya | 41 | 0.2% |
| Korea | 1,216 | 5.9% |
| Latin America | 546 | 2.7% |
| Lebanon | 121 | 0.6% |
| Mexico | 346 | 1.7% |
| Moldova | 14 | 0.1% |
| Morocco | 45 | 0.2% |
| Nigeria | 9 | 0.0% |
| Northern Africa | 219 | 1.1% |
| Northern Europe | 32 | 0.2% |
| Pakistan | 63 | 0.3% |
| Peru | 20 | 0.1% |
| Philippines | 613 | 3.0% |
| Poland | 85 | 0.4% |
| Russia | 30 | 0.2% |
| South Africa | 24 | 0.1% |
| South America | 147 | 0.7% |
| South Central Asia | 737 | 3.6% |
| South Eastern Asia | 688 | 3.4% |
| Southern Europe | 9 | 0.0% |
| Sweden | 6 | 0.0% |
| Syria | 186 | 0.9% |
| Taiwan | 161 | 0.8% |
| Thailand | 75 | 0.4% |
| Ukraine | 20 | 0.1% |
| Uzbekistan | 87 | 0.4% |
| Western Africa | 48 | 0.2% |
| Western Asia | 480 | 2.3% |
| Western Europe | 52 | 0.3% | View All 58 Rows |
Sex and Age in Stevenson Ranch
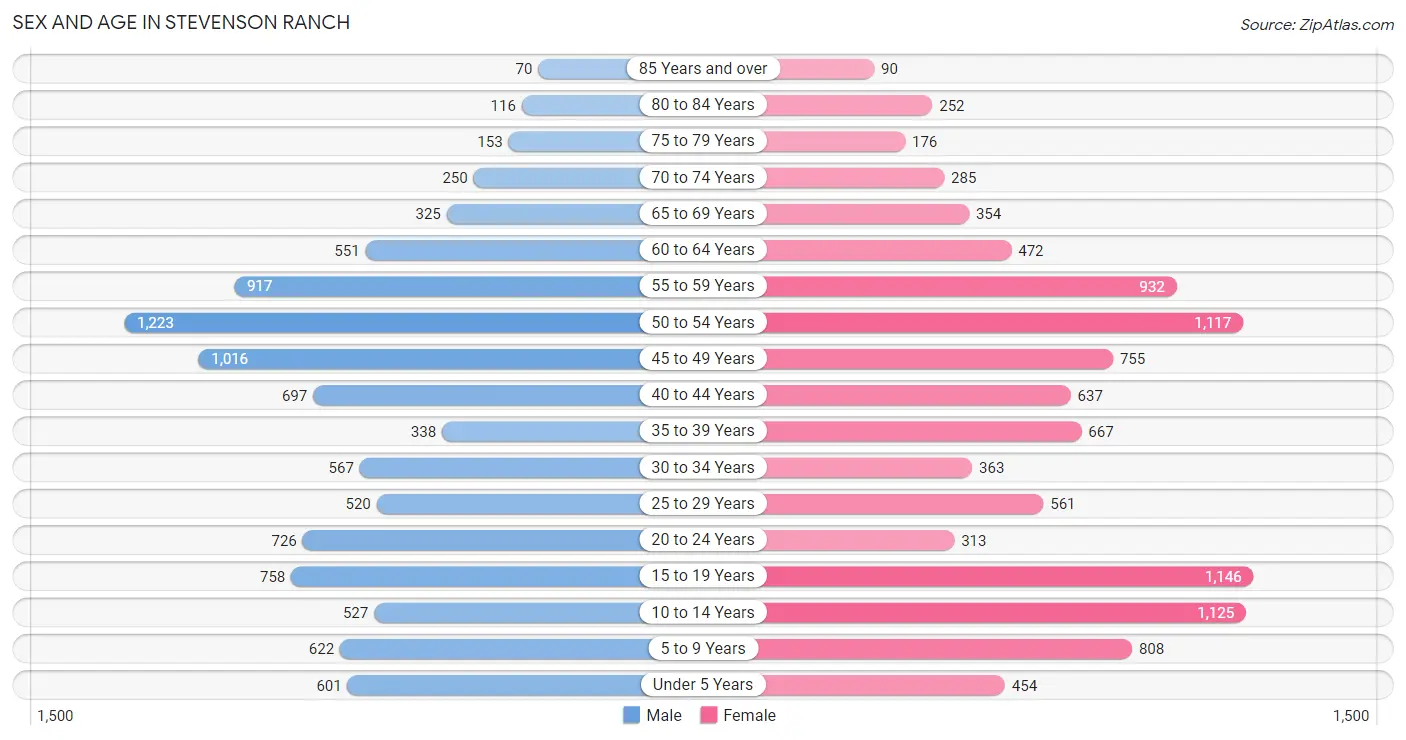
Sex and Age in Stevenson Ranch
The most populous age groups in Stevenson Ranch are 50 to 54 Years (1,223 | 12.3%) for men and 15 to 19 Years (1,146 | 10.9%) for women.
| Age Bracket | Male | Female |
| Under 5 Years | 601 (6.0%) | 454 (4.3%) |
| 5 to 9 Years | 622 (6.2%) | 808 (7.7%) |
| 10 to 14 Years | 527 (5.3%) | 1,125 (10.7%) |
| 15 to 19 Years | 758 (7.6%) | 1,146 (10.9%) |
| 20 to 24 Years | 726 (7.3%) | 313 (3.0%) |
| 25 to 29 Years | 520 (5.2%) | 561 (5.3%) |
| 30 to 34 Years | 567 (5.7%) | 363 (3.5%) |
| 35 to 39 Years | 338 (3.4%) | 667 (6.4%) |
| 40 to 44 Years | 697 (7.0%) | 637 (6.1%) |
| 45 to 49 Years | 1,016 (10.2%) | 755 (7.2%) |
| 50 to 54 Years | 1,223 (12.3%) | 1,117 (10.6%) |
| 55 to 59 Years | 917 (9.2%) | 932 (8.9%) |
| 60 to 64 Years | 551 (5.5%) | 472 (4.5%) |
| 65 to 69 Years | 325 (3.3%) | 354 (3.4%) |
| 70 to 74 Years | 250 (2.5%) | 285 (2.7%) |
| 75 to 79 Years | 153 (1.5%) | 176 (1.7%) |
| 80 to 84 Years | 116 (1.2%) | 252 (2.4%) |
| 85 Years and over | 70 (0.7%) | 90 (0.9%) |
| Total | 9,977 (100.0%) | 10,507 (100.0%) |
Families and Households in Stevenson Ranch
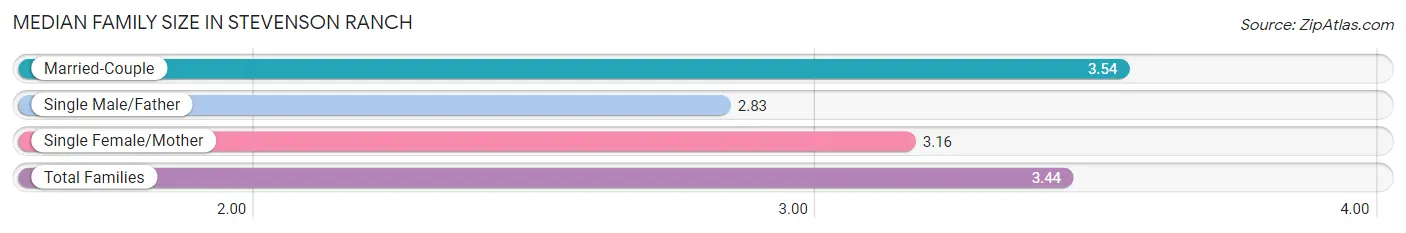
Median Family Size in Stevenson Ranch
The median family size in Stevenson Ranch is 3.44 persons per family, with married-couple families (4,466 | 83.3%) accounting for the largest median family size of 3.54 persons per family. On the other hand, single male/father families (525 | 9.8%) represent the smallest median family size with 2.83 persons per family.
| Family Type | # Families | Family Size |
| Married-Couple | 4,466 (83.3%) | 3.54 |
| Single Male/Father | 525 (9.8%) | 2.83 |
| Single Female/Mother | 371 (6.9%) | 3.16 |
| Total Families | 5,362 (100.0%) | 3.44 |
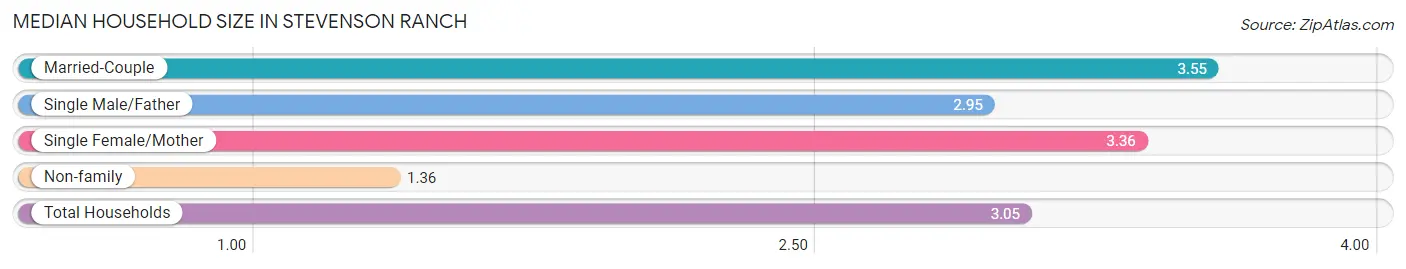
Median Household Size in Stevenson Ranch
The median household size in Stevenson Ranch is 3.05 persons per household, with married-couple households (4,466 | 66.5%) accounting for the largest median household size of 3.55 persons per household. non-family households (1,358 | 20.2%) represent the smallest median household size with 1.36 persons per household.
| Household Type | # Households | Household Size |
| Married-Couple | 4,466 (66.5%) | 3.55 |
| Single Male/Father | 525 (7.8%) | 2.95 |
| Single Female/Mother | 371 (5.5%) | 3.36 |
| Non-family | 1,358 (20.2%) | 1.36 |
| Total Households | 6,720 (100.0%) | 3.05 |
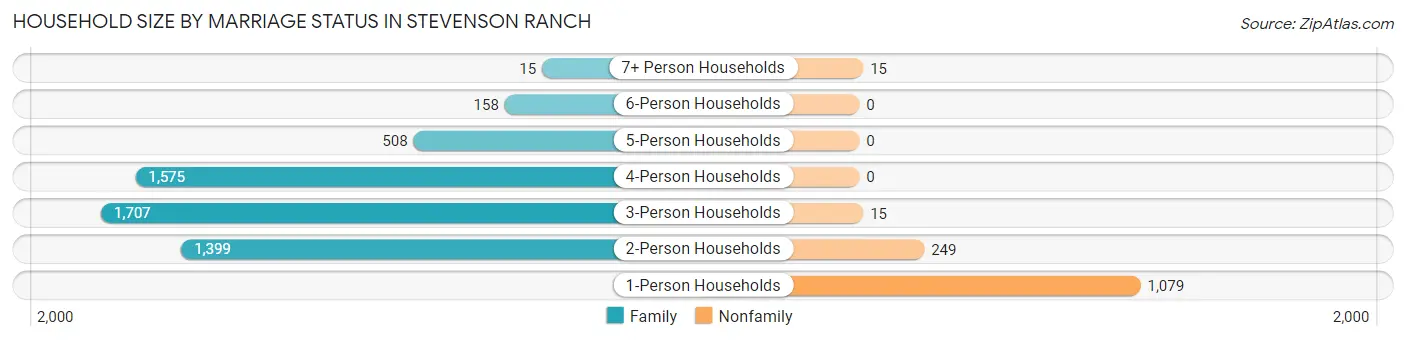
Household Size by Marriage Status in Stevenson Ranch
Out of a total of 6,720 households in Stevenson Ranch, 5,362 (79.8%) are family households, while 1,358 (20.2%) are nonfamily households. The most numerous type of family households are 3-person households, comprising 1,707, and the most common type of nonfamily households are 1-person households, comprising 1,079.
| Household Size | Family Households | Nonfamily Households |
| 1-Person Households | - | 1,079 (16.1%) |
| 2-Person Households | 1,399 (20.8%) | 249 (3.7%) |
| 3-Person Households | 1,707 (25.4%) | 15 (0.2%) |
| 4-Person Households | 1,575 (23.4%) | 0 (0.0%) |
| 5-Person Households | 508 (7.6%) | 0 (0.0%) |
| 6-Person Households | 158 (2.4%) | 0 (0.0%) |
| 7+ Person Households | 15 (0.2%) | 15 (0.2%) |
| Total | 5,362 (79.8%) | 1,358 (20.2%) |
Female Fertility in Stevenson Ranch
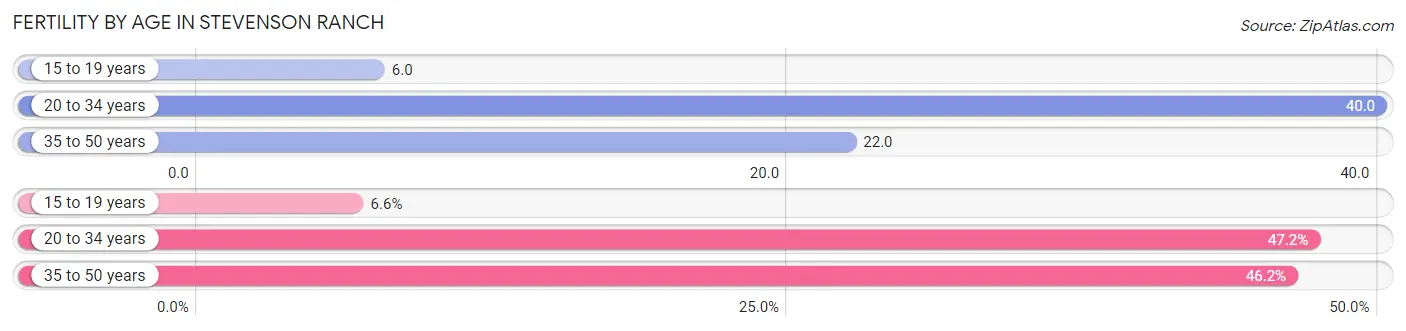
Fertility by Age in Stevenson Ranch
Average fertility rate in Stevenson Ranch is 23.0 births per 1,000 women. Women in the age bracket of 20 to 34 years have the highest fertility rate with 40.0 births per 1,000 women. Women in the age bracket of 20 to 34 years acount for 47.2% of all women with births.
| Age Bracket | Women with Births | Births / 1,000 Women |
| 15 to 19 years | 7 (6.6%) | 6.0 |
| 20 to 34 years | 50 (47.2%) | 40.0 |
| 35 to 50 years | 49 (46.2%) | 22.0 |
| Total | 106 (100.0%) | 23.0 |
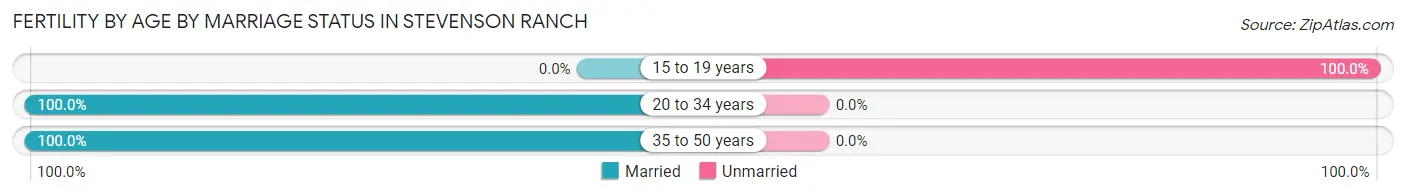
Fertility by Age by Marriage Status in Stevenson Ranch
93.4% of women with births (106) in Stevenson Ranch are married. The highest percentage of unmarried women with births falls into 15 to 19 years age bracket with 100.0% of them unmarried at the time of birth, while the lowest percentage of unmarried women with births belong to 20 to 34 years age bracket with 0.0% of them unmarried.
| Age Bracket | Married | Unmarried |
| 15 to 19 years | 0 (0.0%) | 7 (100.0%) |
| 20 to 34 years | 50 (100.0%) | 0 (0.0%) |
| 35 to 50 years | 49 (100.0%) | 0 (0.0%) |
| Total | 99 (93.4%) | 7 (6.6%) |
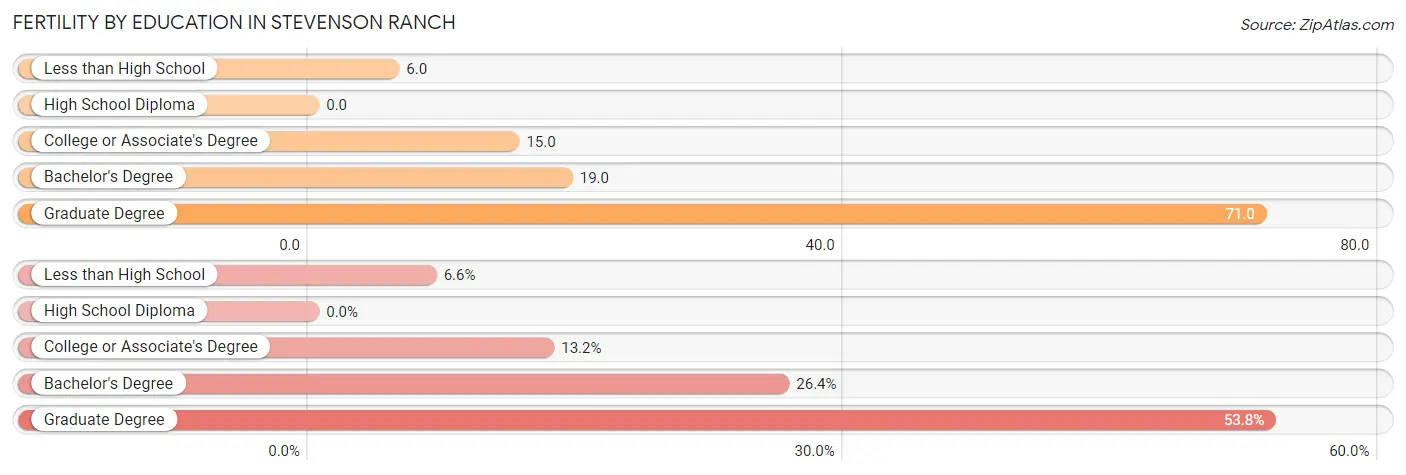
Fertility by Education in Stevenson Ranch
| Educational Attainment | Women with Births | Births / 1,000 Women |
| Less than High School | 7 (6.6%) | 6.0 |
| High School Diploma | 0 (0.0%) | 0.0 |
| College or Associate's Degree | 14 (13.2%) | 15.0 |
| Bachelor's Degree | 28 (26.4%) | 19.0 |
| Graduate Degree | 57 (53.8%) | 71.0 |
| Total | 106 (100.0%) | 23.0 |
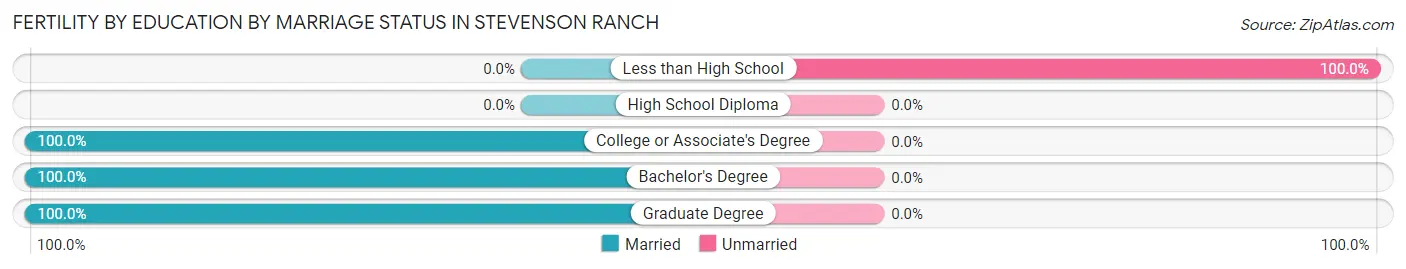
Fertility by Education by Marriage Status in Stevenson Ranch
6.6% of women with births in Stevenson Ranch are unmarried. Women with the educational attainment of college or associate's degree are most likely to be married with 100.0% of them married at childbirth, while women with the educational attainment of less than high school are least likely to be married with 100.0% of them unmarried at childbirth.
| Educational Attainment | Married | Unmarried |
| Less than High School | 0 (0.0%) | 7 (100.0%) |
| High School Diploma | 0 (0.0%) | 0 (0.0%) |
| College or Associate's Degree | 14 (100.0%) | 0 (0.0%) |
| Bachelor's Degree | 28 (100.0%) | 0 (0.0%) |
| Graduate Degree | 57 (100.0%) | 0 (0.0%) |
| Total | 99 (93.4%) | 7 (6.6%) |
Income in Stevenson Ranch
Income Overview in Stevenson Ranch
Per Capita Income in Stevenson Ranch is $60,061, while median incomes of families and households are $160,988 and $147,083 respectively.
| Characteristic | Number | Measure |
| Per Capita Income | 20,484 | $60,061 |
| Median Family Income | 5,362 | $160,988 |
| Mean Family Income | 5,362 | $195,041 |
| Median Household Income | 6,720 | $147,083 |
| Mean Household Income | 6,720 | $180,395 |
| Income Deficit | 5,362 | $0 |
| Wage / Income Gap (%) | 20,484 | 40.80% |
| Wage / Income Gap ($) | 20,484 | 59.20¢ per $1 |
| Gini / Inequality Index | 20,484 | 0.41 |
Earnings by Sex in Stevenson Ranch
Average Earnings in Stevenson Ranch are $77,088, $99,821 for men and $59,092 for women, a difference of 40.8%.
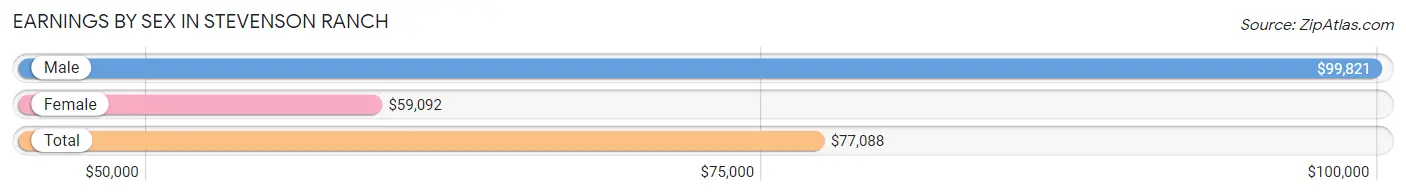
| Sex | Number | Average Earnings |
| Male | 6,011 (59.7%) | $99,821 |
| Female | 4,054 (40.3%) | $59,092 |
| Total | 10,065 (100.0%) | $77,088 |
Earnings by Sex by Income Bracket in Stevenson Ranch
The most common earnings brackets in Stevenson Ranch are $100,000+ for men (3,004 | 50.0%) and $100,000+ for women (1,150 | 28.4%).
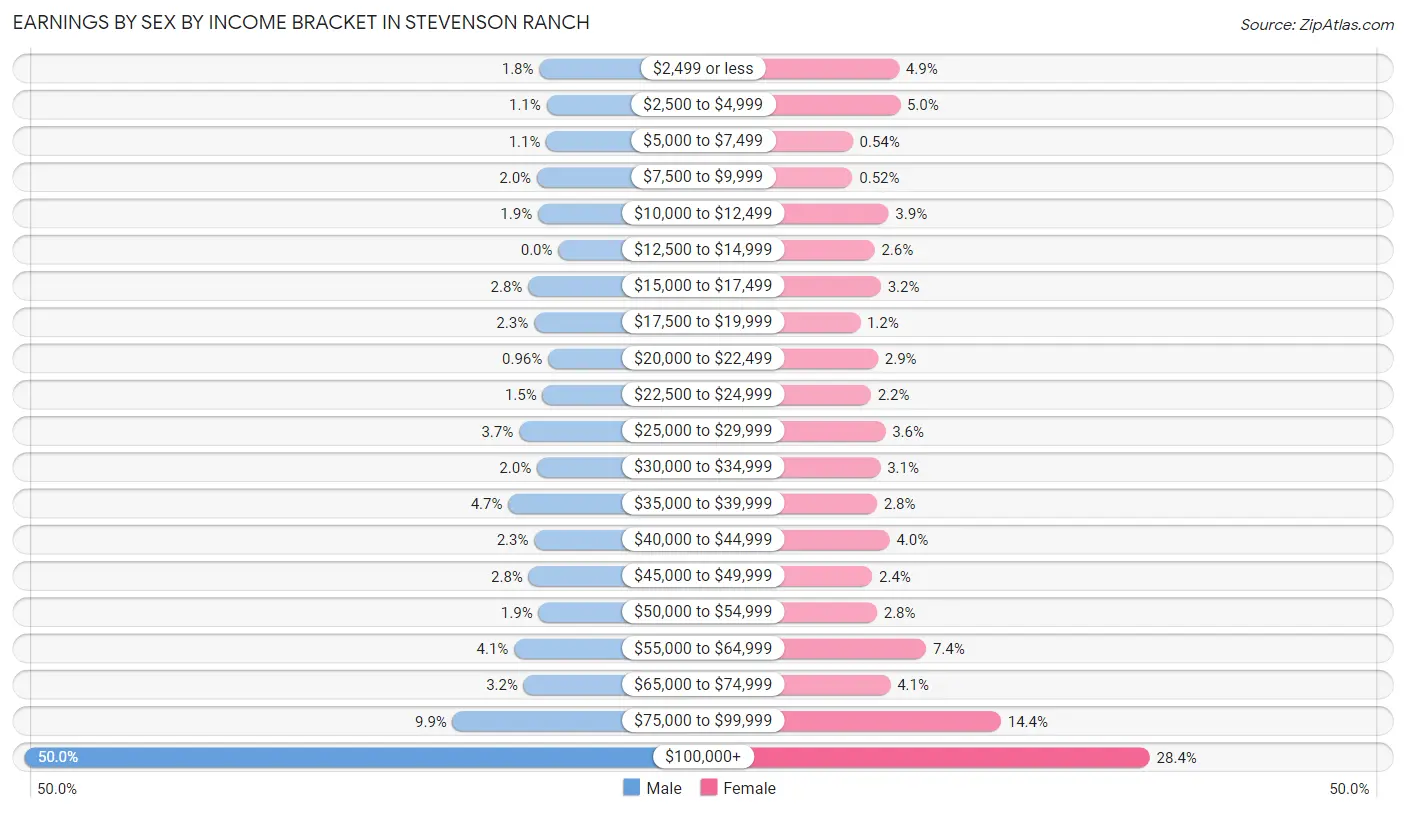
| Income | Male | Female |
| $2,499 or less | 107 (1.8%) | 198 (4.9%) |
| $2,500 to $4,999 | 66 (1.1%) | 202 (5.0%) |
| $5,000 to $7,499 | 68 (1.1%) | 22 (0.5%) |
| $7,500 to $9,999 | 121 (2.0%) | 21 (0.5%) |
| $10,000 to $12,499 | 115 (1.9%) | 158 (3.9%) |
| $12,500 to $14,999 | 0 (0.0%) | 105 (2.6%) |
| $15,000 to $17,499 | 170 (2.8%) | 129 (3.2%) |
| $17,500 to $19,999 | 137 (2.3%) | 50 (1.2%) |
| $20,000 to $22,499 | 58 (1.0%) | 118 (2.9%) |
| $22,500 to $24,999 | 89 (1.5%) | 91 (2.2%) |
| $25,000 to $29,999 | 221 (3.7%) | 146 (3.6%) |
| $30,000 to $34,999 | 120 (2.0%) | 127 (3.1%) |
| $35,000 to $39,999 | 282 (4.7%) | 114 (2.8%) |
| $40,000 to $44,999 | 135 (2.2%) | 162 (4.0%) |
| $45,000 to $49,999 | 167 (2.8%) | 96 (2.4%) |
| $50,000 to $54,999 | 112 (1.9%) | 114 (2.8%) |
| $55,000 to $64,999 | 249 (4.1%) | 301 (7.4%) |
| $65,000 to $74,999 | 195 (3.2%) | 165 (4.1%) |
| $75,000 to $99,999 | 595 (9.9%) | 585 (14.4%) |
| $100,000+ | 3,004 (50.0%) | 1,150 (28.4%) |
| Total | 6,011 (100.0%) | 4,054 (100.0%) |
Earnings by Sex by Educational Attainment in Stevenson Ranch
Average earnings in Stevenson Ranch are $106,633 for men and $68,438 for women, a difference of 35.8%. Men with an educational attainment of graduate degree enjoy the highest average annual earnings of $183,847, while those with high school diploma education earn the least with $43,458. Women with an educational attainment of graduate degree earn the most with the average annual earnings of $95,284, while those with college or associate's degree education have the smallest earnings of $40,473.
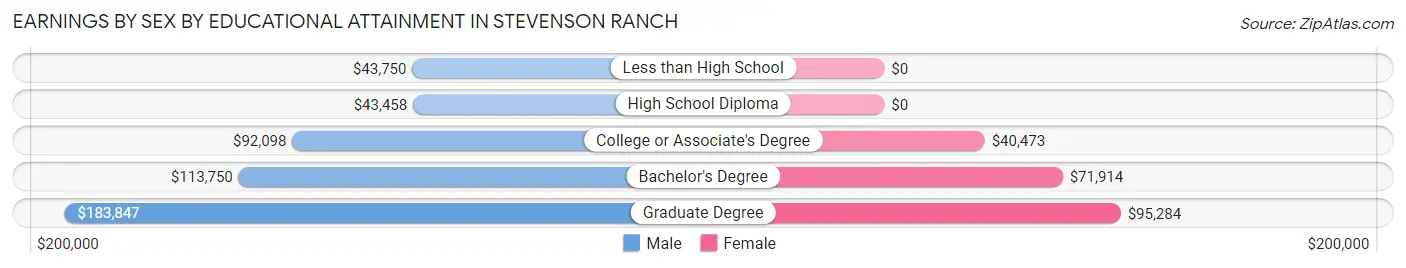
| Educational Attainment | Male Income | Female Income |
| Less than High School | $43,750 | $0 |
| High School Diploma | $43,458 | $0 |
| College or Associate's Degree | $92,098 | $40,473 |
| Bachelor's Degree | $113,750 | $71,914 |
| Graduate Degree | $183,847 | $95,284 |
| Total | $106,633 | $68,438 |
Family Income in Stevenson Ranch
Family Income Brackets in Stevenson Ranch
According to the Stevenson Ranch family income data, there are 2,038 families falling into the $200,000+ income range, which is the most common income bracket and makes up 38.0% of all families.
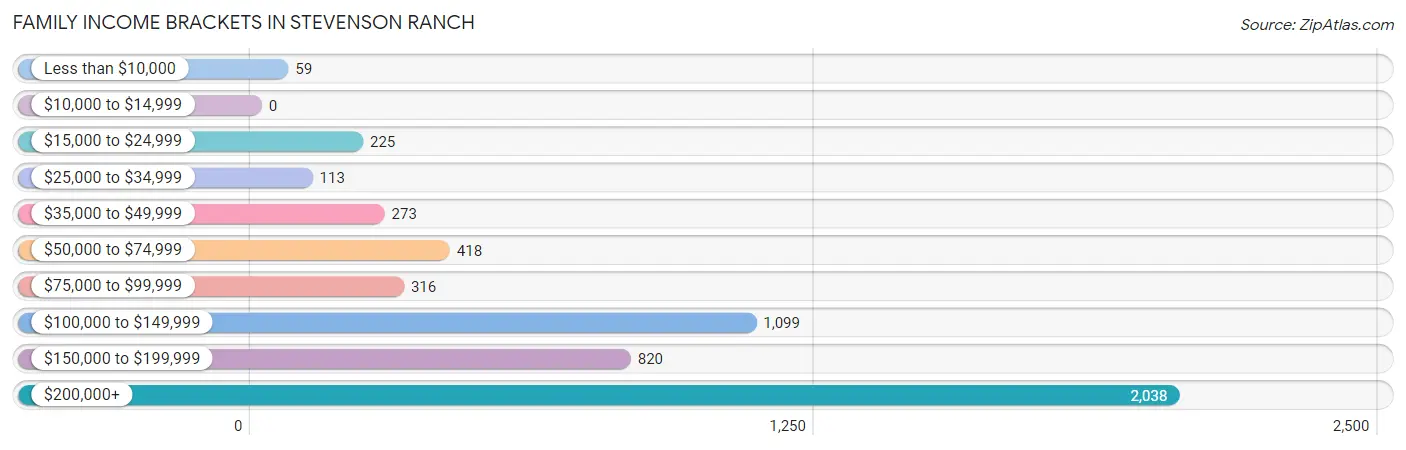
| Income Bracket | # Families | % Families |
| Less than $10,000 | 59 | 1.1% |
| $10,000 to $14,999 | 0 | 0.0% |
| $15,000 to $24,999 | 225 | 4.2% |
| $25,000 to $34,999 | 113 | 2.1% |
| $35,000 to $49,999 | 273 | 5.1% |
| $50,000 to $74,999 | 418 | 7.8% |
| $75,000 to $99,999 | 316 | 5.9% |
| $100,000 to $149,999 | 1,099 | 20.5% |
| $150,000 to $199,999 | 820 | 15.3% |
| $200,000+ | 2,038 | 38.0% |
Family Income by Famaliy Size in Stevenson Ranch
6-person families (158 | 2.9%) account for the highest median family income in Stevenson Ranch with $235,000 per family, while 3-person families (1,643 | 30.6%) have the highest median income of $61,652 per family member.
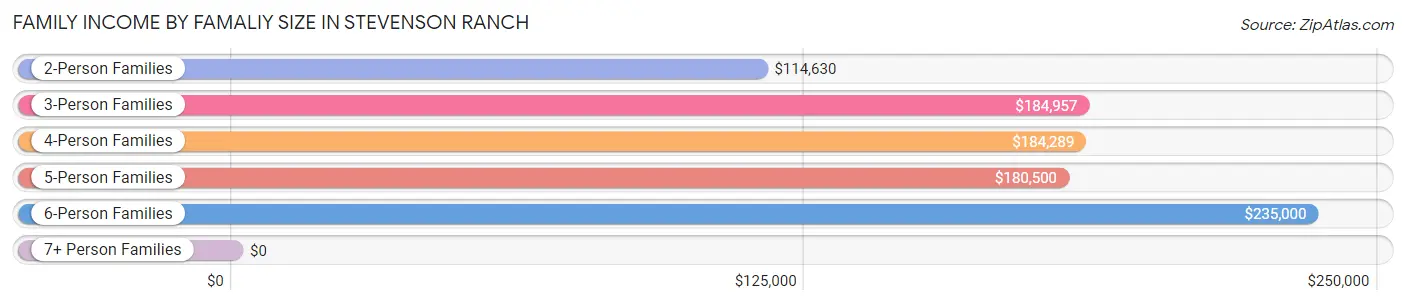
| Income Bracket | # Families | Median Income |
| 2-Person Families | 1,514 (28.2%) | $114,630 |
| 3-Person Families | 1,643 (30.6%) | $184,957 |
| 4-Person Families | 1,530 (28.5%) | $184,289 |
| 5-Person Families | 502 (9.4%) | $180,500 |
| 6-Person Families | 158 (2.9%) | $235,000 |
| 7+ Person Families | 15 (0.3%) | $0 |
| Total | 5,362 (100.0%) | $160,988 |
Family Income by Number of Earners in Stevenson Ranch
The median family income in Stevenson Ranch is $160,988, with families comprising 3+ earners (528) having the highest median family income of $250,001, while families with no earners (340) have the lowest median family income of $41,607, accounting for 9.9% and 6.3% of families, respectively.
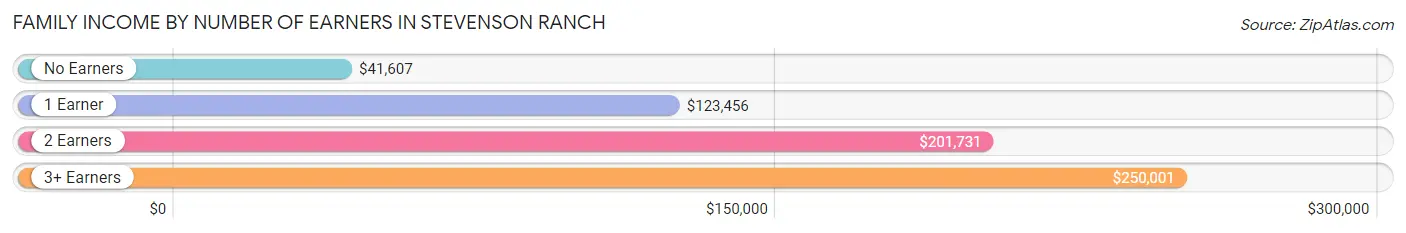
| Number of Earners | # Families | Median Income |
| No Earners | 340 (6.3%) | $41,607 |
| 1 Earner | 2,208 (41.2%) | $123,456 |
| 2 Earners | 2,286 (42.6%) | $201,731 |
| 3+ Earners | 528 (9.9%) | $250,001 |
| Total | 5,362 (100.0%) | $160,988 |
Household Income in Stevenson Ranch
Household Income Brackets in Stevenson Ranch
With 2,372 households falling in the category, the $200,000+ income range is the most frequent in Stevenson Ranch, accounting for 35.3% of all households. In contrast, only 40 households (0.6%) fall into the $10,000 to $14,999 income bracket, making it the least populous group.
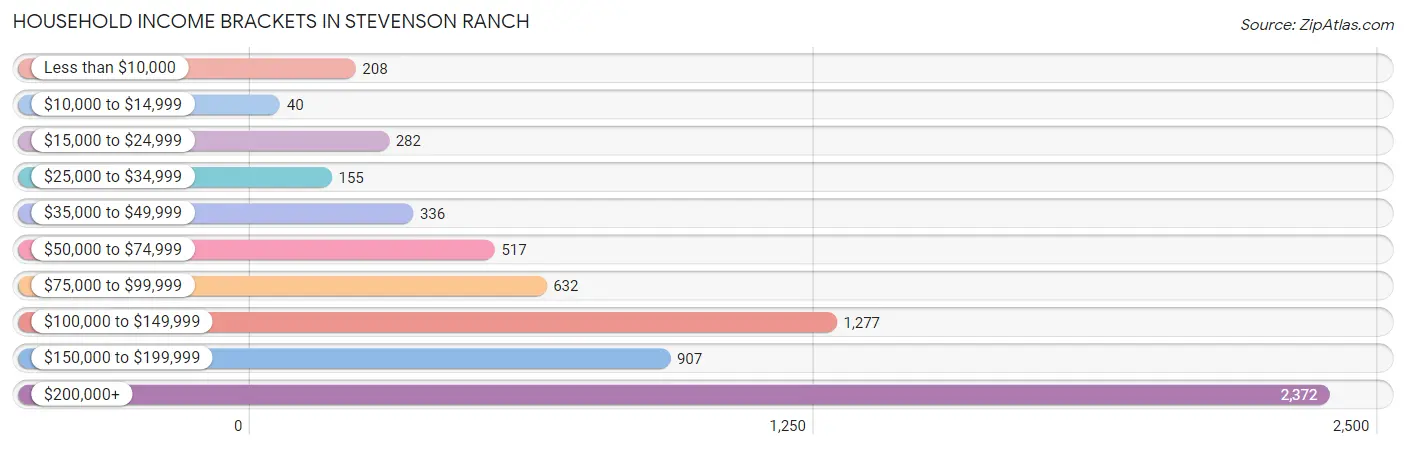
| Income Bracket | # Households | % Households |
| Less than $10,000 | 208 | 3.1% |
| $10,000 to $14,999 | 40 | 0.6% |
| $15,000 to $24,999 | 282 | 4.2% |
| $25,000 to $34,999 | 155 | 2.3% |
| $35,000 to $49,999 | 336 | 5.0% |
| $50,000 to $74,999 | 517 | 7.7% |
| $75,000 to $99,999 | 632 | 9.4% |
| $100,000 to $149,999 | 1,277 | 19.0% |
| $150,000 to $199,999 | 907 | 13.5% |
| $200,000+ | 2,372 | 35.3% |
Household Income by Householder Age in Stevenson Ranch
The median household income in Stevenson Ranch is $147,083, with the highest median household income of $179,076 found in the 45 to 64 years age bracket for the primary householder. A total of 3,703 households (55.1%) fall into this category. Meanwhile, the 15 to 24 years age bracket for the primary householder has the lowest median household income of $0, with 126 households (1.9%) in this group.
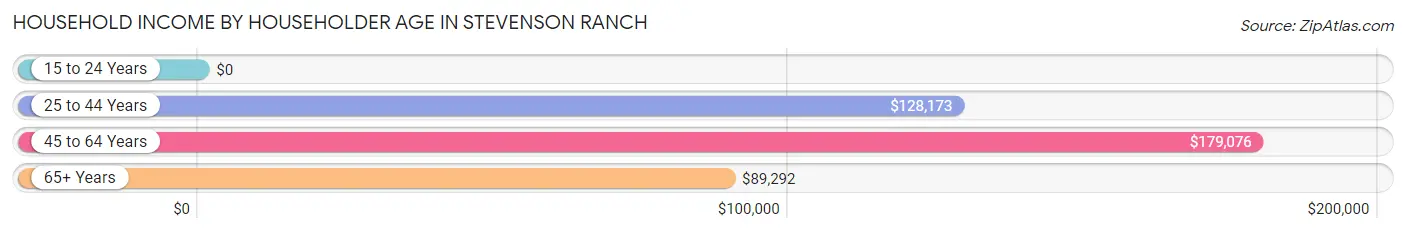
| Income Bracket | # Households | Median Income |
| 15 to 24 Years | 126 (1.9%) | $0 |
| 25 to 44 Years | 2,040 (30.4%) | $128,173 |
| 45 to 64 Years | 3,703 (55.1%) | $179,076 |
| 65+ Years | 851 (12.7%) | $89,292 |
| Total | 6,720 (100.0%) | $147,083 |
Poverty in Stevenson Ranch
Income Below Poverty by Sex and Age in Stevenson Ranch
With 4.8% poverty level for males and 5.1% for females among the residents of Stevenson Ranch, 16 and 17 year old males and 75 year old and over females are the most vulnerable to poverty, with 44 males (13.8%) and 76 females (14.7%) in their respective age groups living below the poverty level.
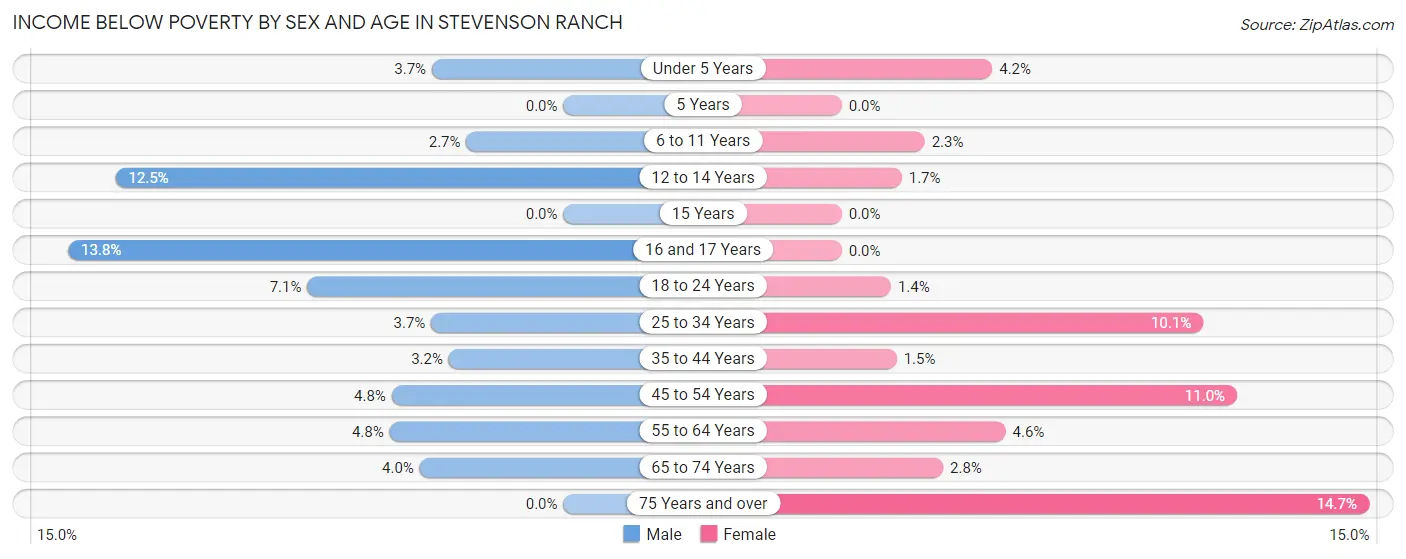
| Age Bracket | Male | Female |
| Under 5 Years | 22 (3.7%) | 19 (4.2%) |
| 5 Years | 0 (0.0%) | 0 (0.0%) |
| 6 to 11 Years | 19 (2.7%) | 27 (2.3%) |
| 12 to 14 Years | 47 (12.5%) | 11 (1.7%) |
| 15 Years | 0 (0.0%) | 0 (0.0%) |
| 16 and 17 Years | 44 (13.8%) | 0 (0.0%) |
| 18 to 24 Years | 76 (7.1%) | 7 (1.4%) |
| 25 to 34 Years | 40 (3.7%) | 93 (10.1%) |
| 35 to 44 Years | 33 (3.2%) | 20 (1.5%) |
| 45 to 54 Years | 107 (4.8%) | 206 (11.0%) |
| 55 to 64 Years | 71 (4.8%) | 64 (4.6%) |
| 65 to 74 Years | 23 (4.0%) | 18 (2.8%) |
| 75 Years and over | 0 (0.0%) | 76 (14.7%) |
| Total | 482 (4.8%) | 541 (5.1%) |
Income Above Poverty by Sex and Age in Stevenson Ranch
According to the poverty statistics in Stevenson Ranch, males aged 5 years and females aged 5 years are the age groups that are most secure financially, with 100.0% of males and 100.0% of females in these age groups living above the poverty line.
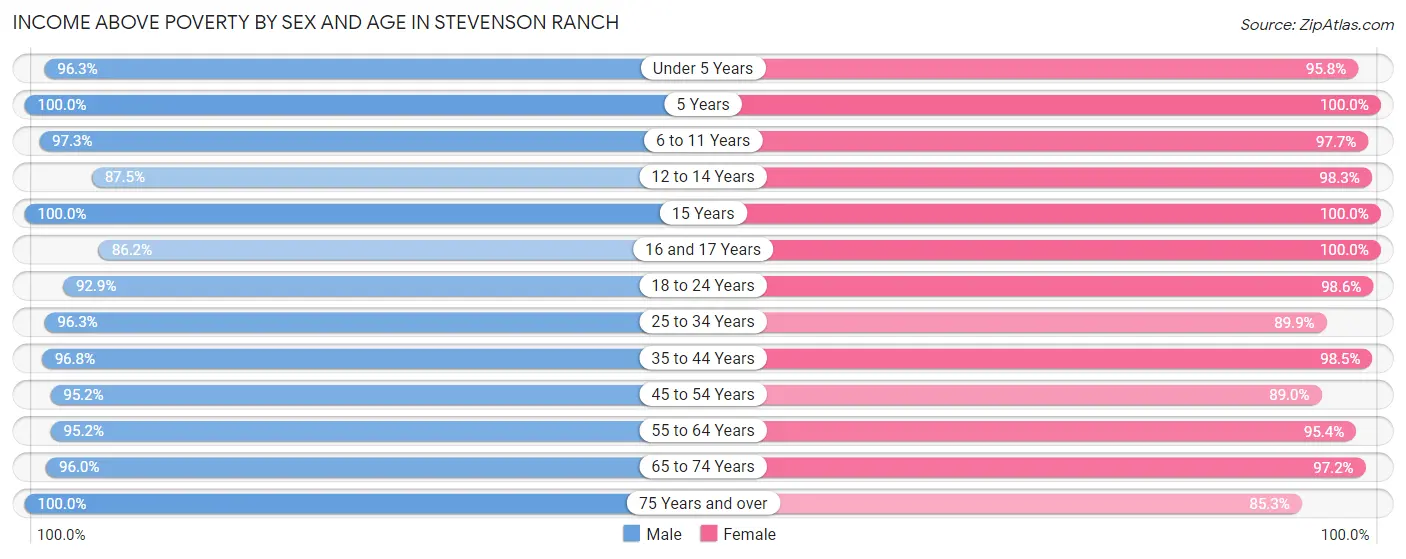
| Age Bracket | Male | Female |
| Under 5 Years | 579 (96.3%) | 435 (95.8%) |
| 5 Years | 68 (100.0%) | 103 (100.0%) |
| 6 to 11 Years | 685 (97.3%) | 1,143 (97.7%) |
| 12 to 14 Years | 330 (87.5%) | 649 (98.3%) |
| 15 Years | 99 (100.0%) | 512 (100.0%) |
| 16 and 17 Years | 275 (86.2%) | 436 (100.0%) |
| 18 to 24 Years | 990 (92.9%) | 504 (98.6%) |
| 25 to 34 Years | 1,047 (96.3%) | 831 (89.9%) |
| 35 to 44 Years | 1,002 (96.8%) | 1,284 (98.5%) |
| 45 to 54 Years | 2,132 (95.2%) | 1,666 (89.0%) |
| 55 to 64 Years | 1,397 (95.2%) | 1,340 (95.4%) |
| 65 to 74 Years | 552 (96.0%) | 621 (97.2%) |
| 75 Years and over | 339 (100.0%) | 442 (85.3%) |
| Total | 9,495 (95.2%) | 9,966 (94.9%) |
Income Below Poverty Among Married-Couple Families in Stevenson Ranch
The poverty statistics for married-couple families in Stevenson Ranch show that 3.6% or 163 of the total 4,466 families live below the poverty line. Families with no children have the highest poverty rate of 5.4%, comprising of 111 families. On the other hand, families with 5 or more children have the lowest poverty rate of 0.0%, which includes 0 families.
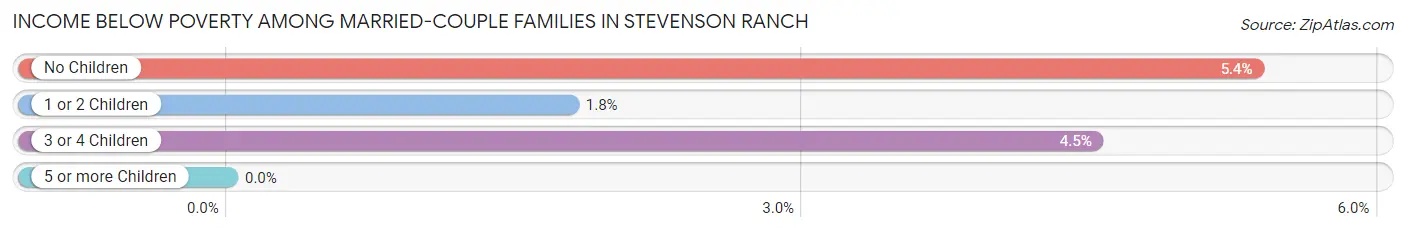
| Children | Above Poverty | Below Poverty |
| No Children | 1,958 (94.6%) | 111 (5.4%) |
| 1 or 2 Children | 1,992 (98.2%) | 36 (1.8%) |
| 3 or 4 Children | 338 (95.5%) | 16 (4.5%) |
| 5 or more Children | 15 (100.0%) | 0 (0.0%) |
| Total | 4,303 (96.4%) | 163 (3.6%) |
Income Below Poverty Among Single-Parent Households in Stevenson Ranch
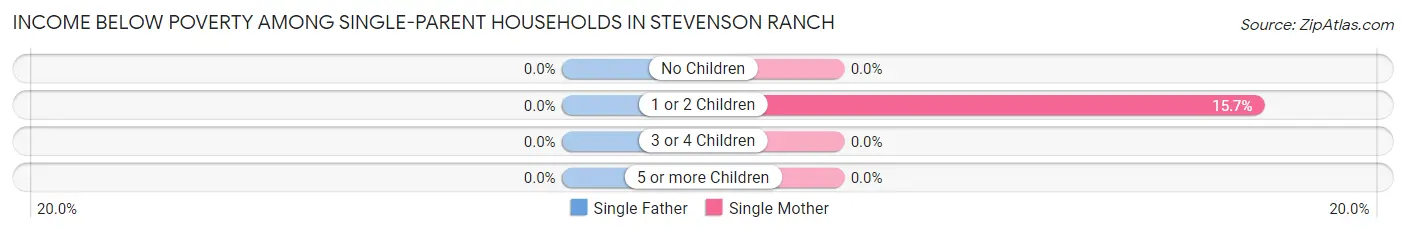
| Children | Single Father | Single Mother |
| No Children | 0 (0.0%) | 0 (0.0%) |
| 1 or 2 Children | 0 (0.0%) | 34 (15.7%) |
| 3 or 4 Children | 0 (0.0%) | 0 (0.0%) |
| 5 or more Children | 0 (0.0%) | 0 (0.0%) |
| Total | 0 (0.0%) | 34 (9.2%) |
Income Below Poverty Among Married-Couple vs Single-Parent Households in Stevenson Ranch
The poverty data for Stevenson Ranch shows that 163 of the married-couple family households (3.6%) and 34 of the single-parent households (3.8%) are living below the poverty level. Within the married-couple family households, those with no children have the highest poverty rate, with 111 households (5.4%) falling below the poverty line. Among the single-parent households, those with 1 or 2 children have the highest poverty rate, with 34 household (7.0%) living below poverty.
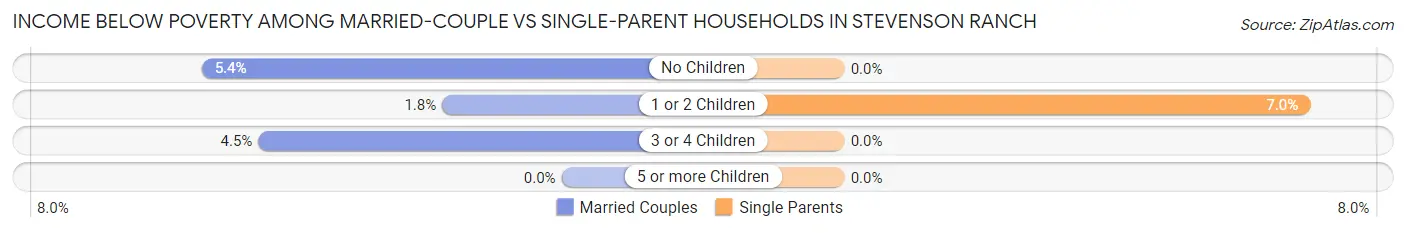
| Children | Married-Couple Families | Single-Parent Households |
| No Children | 111 (5.4%) | 0 (0.0%) |
| 1 or 2 Children | 36 (1.8%) | 34 (7.0%) |
| 3 or 4 Children | 16 (4.5%) | 0 (0.0%) |
| 5 or more Children | 0 (0.0%) | 0 (0.0%) |
| Total | 163 (3.6%) | 34 (3.8%) |
Employment Characteristics in Stevenson Ranch
Employment by Class of Employer in Stevenson Ranch
Among the 8,828 employed individuals in Stevenson Ranch, private company employees (5,331 | 60.4%), self-employed (incorporated) (847 | 9.6%), and local government employees (836 | 9.5%) make up the most common classes of employment.
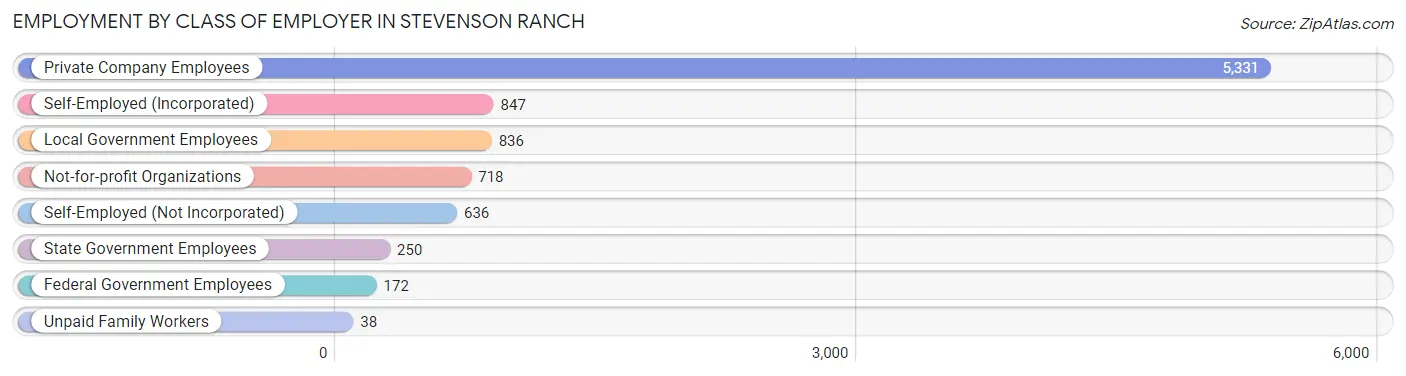
| Employer Class | # Employees | % Employees |
| Private Company Employees | 5,331 | 60.4% |
| Self-Employed (Incorporated) | 847 | 9.6% |
| Self-Employed (Not Incorporated) | 636 | 7.2% |
| Not-for-profit Organizations | 718 | 8.1% |
| Local Government Employees | 836 | 9.5% |
| State Government Employees | 250 | 2.8% |
| Federal Government Employees | 172 | 1.9% |
| Unpaid Family Workers | 38 | 0.4% |
| Total | 8,828 | 100.0% |
Employment Status by Age in Stevenson Ranch
According to the labor force statistics for Stevenson Ranch, out of the total population over 16 years of age (15,736), 64.3% or 10,118 individuals are in the labor force, with 9.3% or 941 of them unemployed. The age group with the highest labor force participation rate is 25 to 29 years, with 88.2% or 953 individuals in the labor force. Within the labor force, the 65 to 74 years age range has the highest percentage of unemployed individuals, with 25.8% or 95 of them being unemployed.
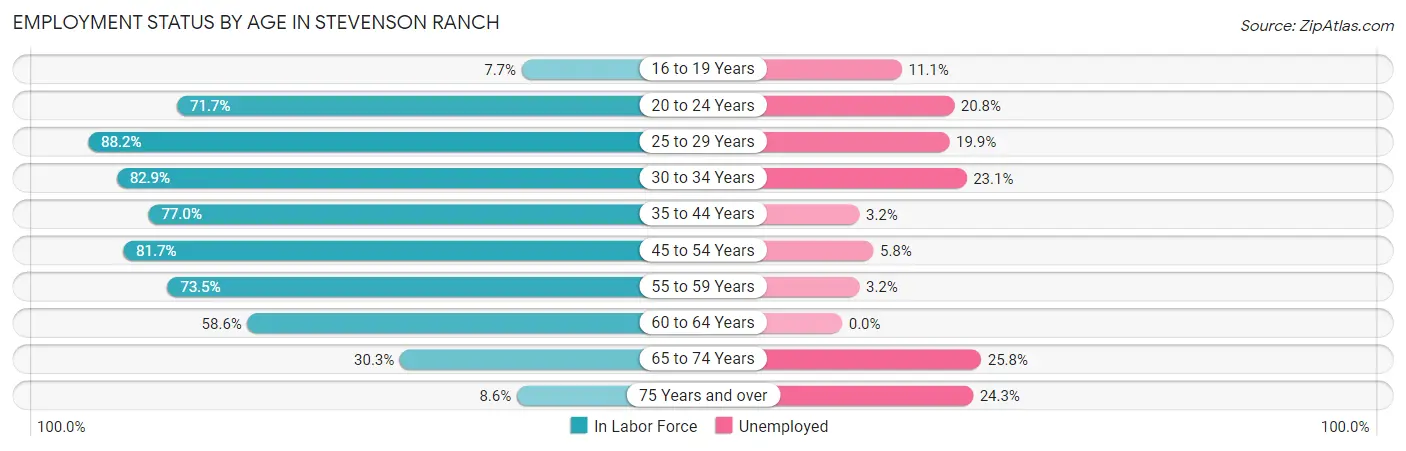
| Age Bracket | In Labor Force | Unemployed |
| 16 to 19 Years | 100 (7.7%) | 11 (11.1%) |
| 20 to 24 Years | 745 (71.7%) | 155 (20.8%) |
| 25 to 29 Years | 953 (88.2%) | 190 (19.9%) |
| 30 to 34 Years | 771 (82.9%) | 178 (23.1%) |
| 35 to 44 Years | 1,801 (77.0%) | 58 (3.2%) |
| 45 to 54 Years | 3,359 (81.7%) | 195 (5.8%) |
| 55 to 59 Years | 1,359 (73.5%) | 43 (3.2%) |
| 60 to 64 Years | 599 (58.6%) | 0 (0.0%) |
| 65 to 74 Years | 368 (30.3%) | 95 (25.8%) |
| 75 Years and over | 74 (8.6%) | 18 (24.3%) |
| Total | 10,118 (64.3%) | 941 (9.3%) |
Employment Status by Educational Attainment in Stevenson Ranch
According to labor force statistics for Stevenson Ranch, 78.0% of individuals (8,840) out of the total population between 25 and 64 years of age (11,333) are in the labor force, with 7.5% or 663 of them being unemployed. The group with the highest labor force participation rate are those with the educational attainment of bachelor's degree or higher, with 81.9% or 5,336 individuals in the labor force. Within the labor force, individuals with college / associate degree education have the highest percentage of unemployment, with 13.5% or 346 of them being unemployed.
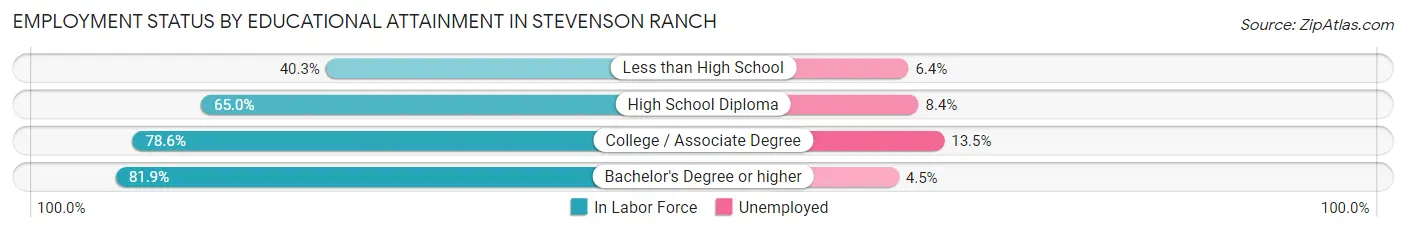
| Educational Attainment | In Labor Force | Unemployed |
| Less than High School | 110 (40.3%) | 17 (6.4%) |
| High School Diploma | 833 (65.0%) | 108 (8.4%) |
| College / Associate Degree | 2,566 (78.6%) | 441 (13.5%) |
| Bachelor's Degree or higher | 5,336 (81.9%) | 293 (4.5%) |
| Total | 8,840 (78.0%) | 850 (7.5%) |
Employment Occupations by Sex in Stevenson Ranch
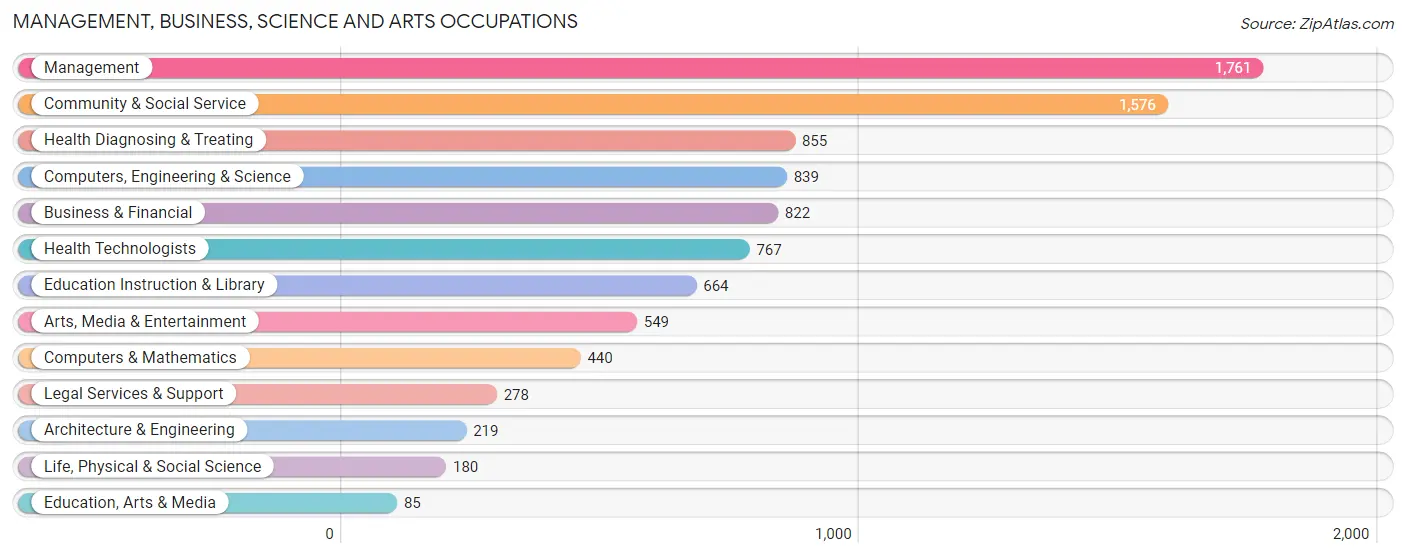
Management, Business, Science and Arts Occupations
The most common Management, Business, Science and Arts occupations in Stevenson Ranch are Management (1,761 | 19.2%), Community & Social Service (1,576 | 17.2%), Health Diagnosing & Treating (855 | 9.3%), Computers, Engineering & Science (839 | 9.1%), and Business & Financial (822 | 8.9%).
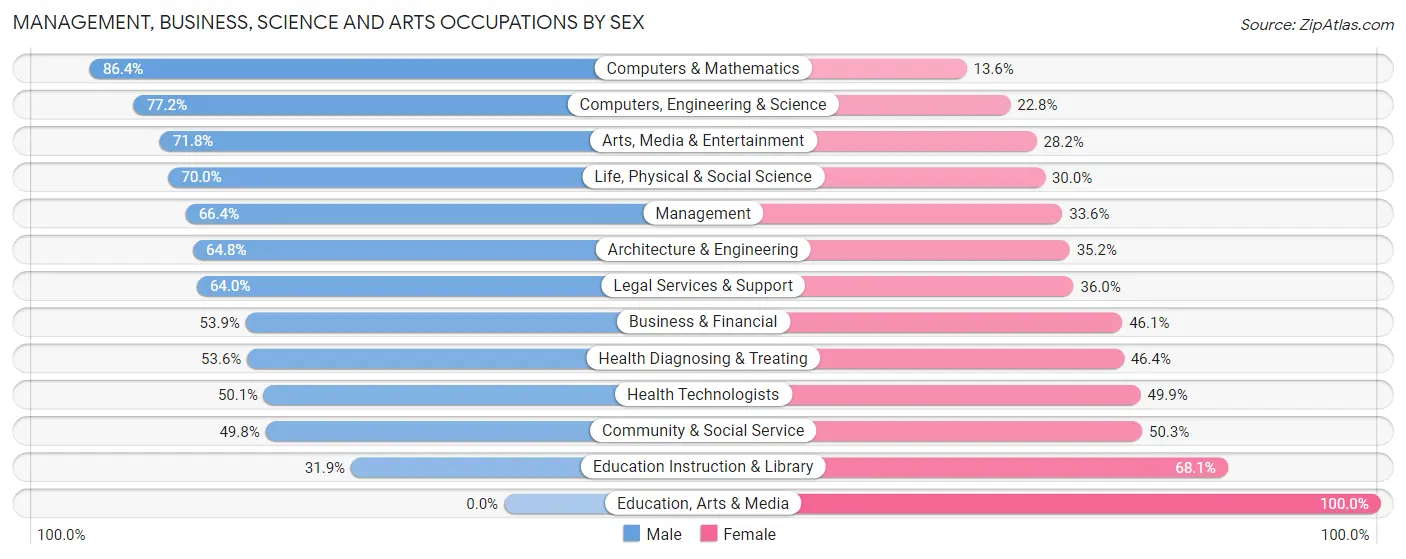
Management, Business, Science and Arts Occupations by Sex
Within the Management, Business, Science and Arts occupations in Stevenson Ranch, the most male-oriented occupations are Computers & Mathematics (86.4%), Computers, Engineering & Science (77.2%), and Arts, Media & Entertainment (71.8%), while the most female-oriented occupations are Education, Arts & Media (100.0%), Education Instruction & Library (68.1%), and Community & Social Service (50.2%).
| Occupation | Male | Female |
| Management | 1,169 (66.4%) | 592 (33.6%) |
| Business & Financial | 443 (53.9%) | 379 (46.1%) |
| Computers, Engineering & Science | 648 (77.2%) | 191 (22.8%) |
| Computers & Mathematics | 380 (86.4%) | 60 (13.6%) |
| Architecture & Engineering | 142 (64.8%) | 77 (35.2%) |
| Life, Physical & Social Science | 126 (70.0%) | 54 (30.0%) |
| Community & Social Service | 784 (49.7%) | 792 (50.2%) |
| Education, Arts & Media | 0 (0.0%) | 85 (100.0%) |
| Legal Services & Support | 178 (64.0%) | 100 (36.0%) |
| Education Instruction & Library | 212 (31.9%) | 452 (68.1%) |
| Arts, Media & Entertainment | 394 (71.8%) | 155 (28.2%) |
| Health Diagnosing & Treating | 458 (53.6%) | 397 (46.4%) |
| Health Technologists | 384 (50.1%) | 383 (49.9%) |
| Total (Category) | 3,502 (59.8%) | 2,351 (40.2%) |
| Total (Overall) | 5,596 (61.0%) | 3,586 (39.1%) |
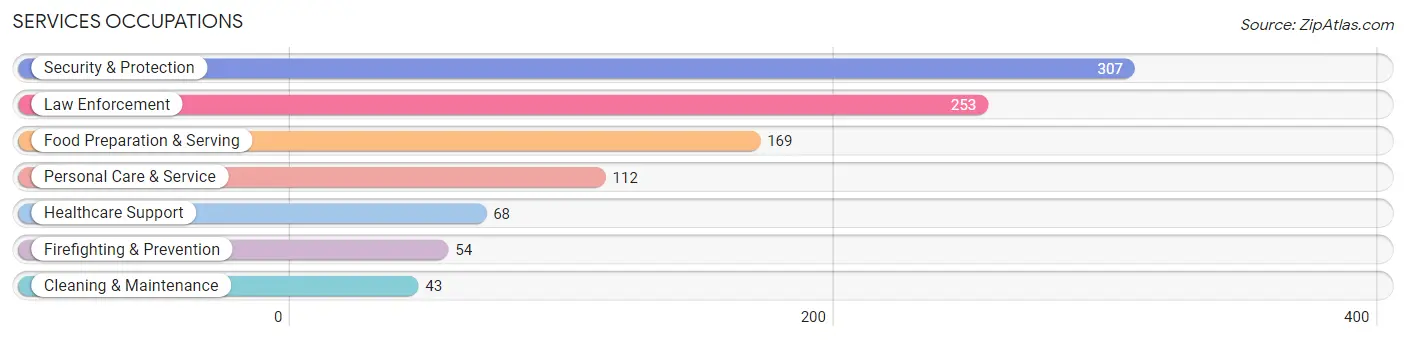
Services Occupations
The most common Services occupations in Stevenson Ranch are Security & Protection (307 | 3.3%), Law Enforcement (253 | 2.8%), Food Preparation & Serving (169 | 1.8%), Personal Care & Service (112 | 1.2%), and Healthcare Support (68 | 0.7%).
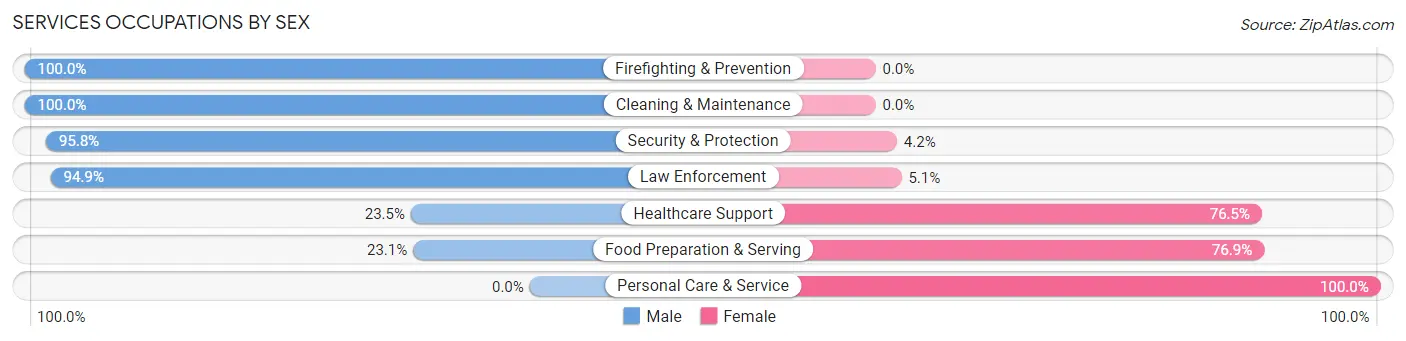
Services Occupations by Sex
Within the Services occupations in Stevenson Ranch, the most male-oriented occupations are Firefighting & Prevention (100.0%), Cleaning & Maintenance (100.0%), and Security & Protection (95.8%), while the most female-oriented occupations are Personal Care & Service (100.0%), Food Preparation & Serving (76.9%), and Healthcare Support (76.5%).
| Occupation | Male | Female |
| Healthcare Support | 16 (23.5%) | 52 (76.5%) |
| Security & Protection | 294 (95.8%) | 13 (4.2%) |
| Firefighting & Prevention | 54 (100.0%) | 0 (0.0%) |
| Law Enforcement | 240 (94.9%) | 13 (5.1%) |
| Food Preparation & Serving | 39 (23.1%) | 130 (76.9%) |
| Cleaning & Maintenance | 43 (100.0%) | 0 (0.0%) |
| Personal Care & Service | 0 (0.0%) | 112 (100.0%) |
| Total (Category) | 392 (56.1%) | 307 (43.9%) |
| Total (Overall) | 5,596 (61.0%) | 3,586 (39.1%) |
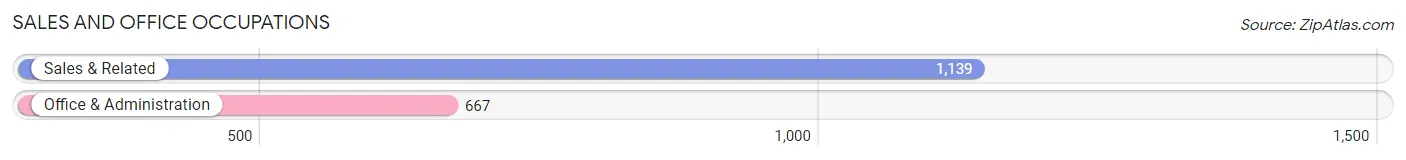
Sales and Office Occupations
The most common Sales and Office occupations in Stevenson Ranch are Sales & Related (1,139 | 12.4%), and Office & Administration (667 | 7.3%).
Sales and Office Occupations by Sex
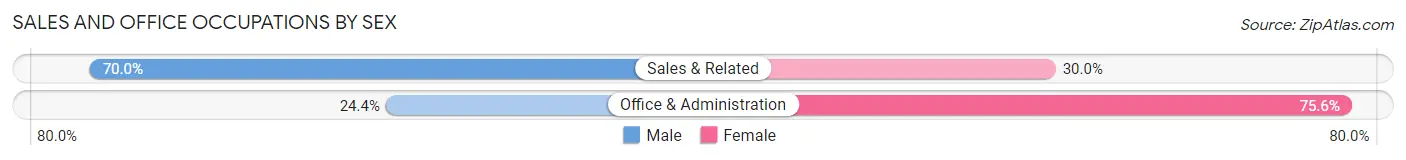
| Occupation | Male | Female |
| Sales & Related | 797 (70.0%) | 342 (30.0%) |
| Office & Administration | 163 (24.4%) | 504 (75.6%) |
| Total (Category) | 960 (53.2%) | 846 (46.8%) |
| Total (Overall) | 5,596 (61.0%) | 3,586 (39.1%) |
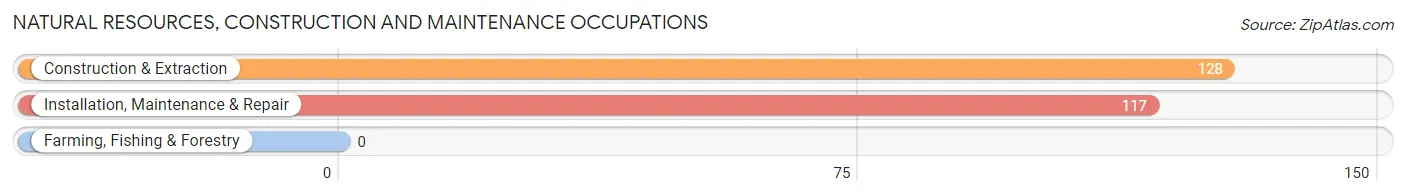
Natural Resources, Construction and Maintenance Occupations
The most common Natural Resources, Construction and Maintenance occupations in Stevenson Ranch are Construction & Extraction (128 | 1.4%), and Installation, Maintenance & Repair (117 | 1.3%).
Natural Resources, Construction and Maintenance Occupations by Sex
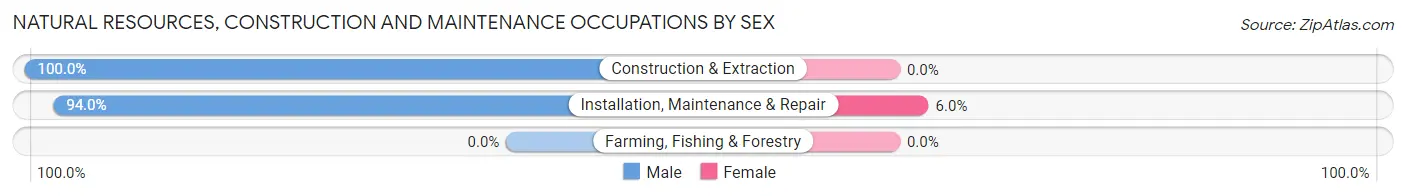
| Occupation | Male | Female |
| Farming, Fishing & Forestry | 0 (0.0%) | 0 (0.0%) |
| Construction & Extraction | 128 (100.0%) | 0 (0.0%) |
| Installation, Maintenance & Repair | 110 (94.0%) | 7 (6.0%) |
| Total (Category) | 238 (97.1%) | 7 (2.9%) |
| Total (Overall) | 5,596 (61.0%) | 3,586 (39.1%) |
Production, Transportation and Moving Occupations
The most common Production, Transportation and Moving occupations in Stevenson Ranch are Production (286 | 3.1%), Transportation (186 | 2.0%), and Material Moving (107 | 1.2%).
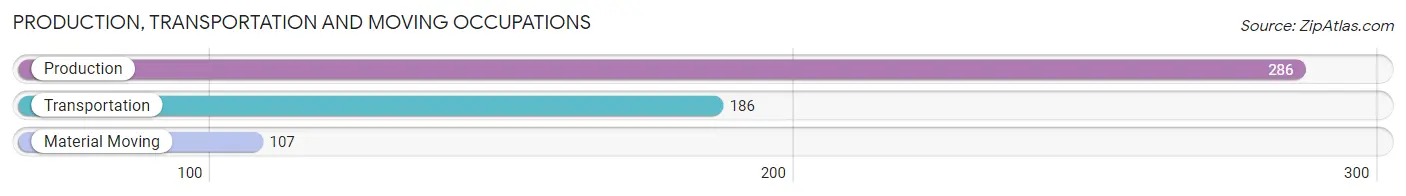
Production, Transportation and Moving Occupations by Sex
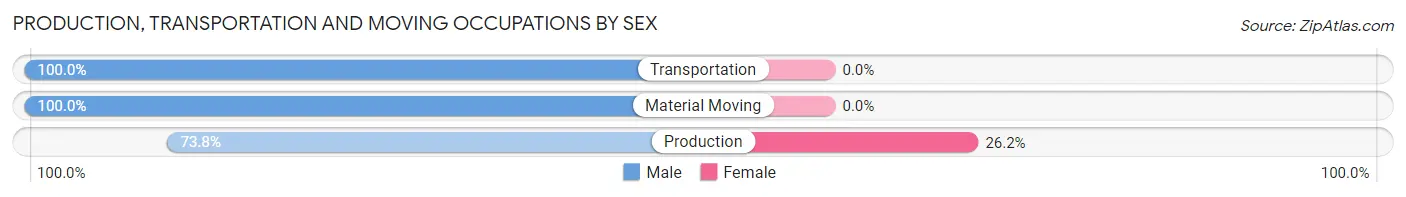
| Occupation | Male | Female |
| Production | 211 (73.8%) | 75 (26.2%) |
| Transportation | 186 (100.0%) | 0 (0.0%) |
| Material Moving | 107 (100.0%) | 0 (0.0%) |
| Total (Category) | 504 (87.1%) | 75 (13.0%) |
| Total (Overall) | 5,596 (61.0%) | 3,586 (39.1%) |
Employment Industries by Sex in Stevenson Ranch
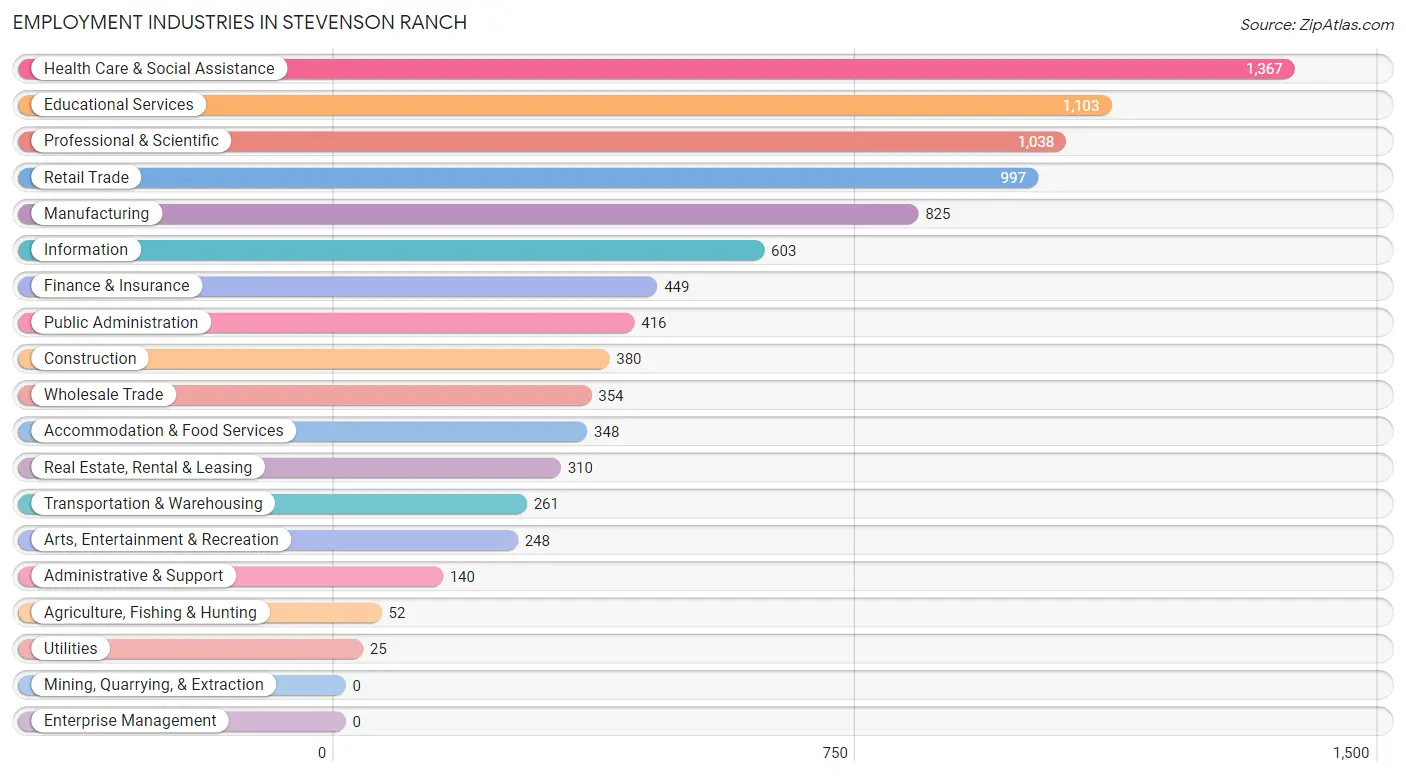
Employment Industries in Stevenson Ranch
The major employment industries in Stevenson Ranch include Health Care & Social Assistance (1,367 | 14.9%), Educational Services (1,103 | 12.0%), Professional & Scientific (1,038 | 11.3%), Retail Trade (997 | 10.9%), and Manufacturing (825 | 9.0%).
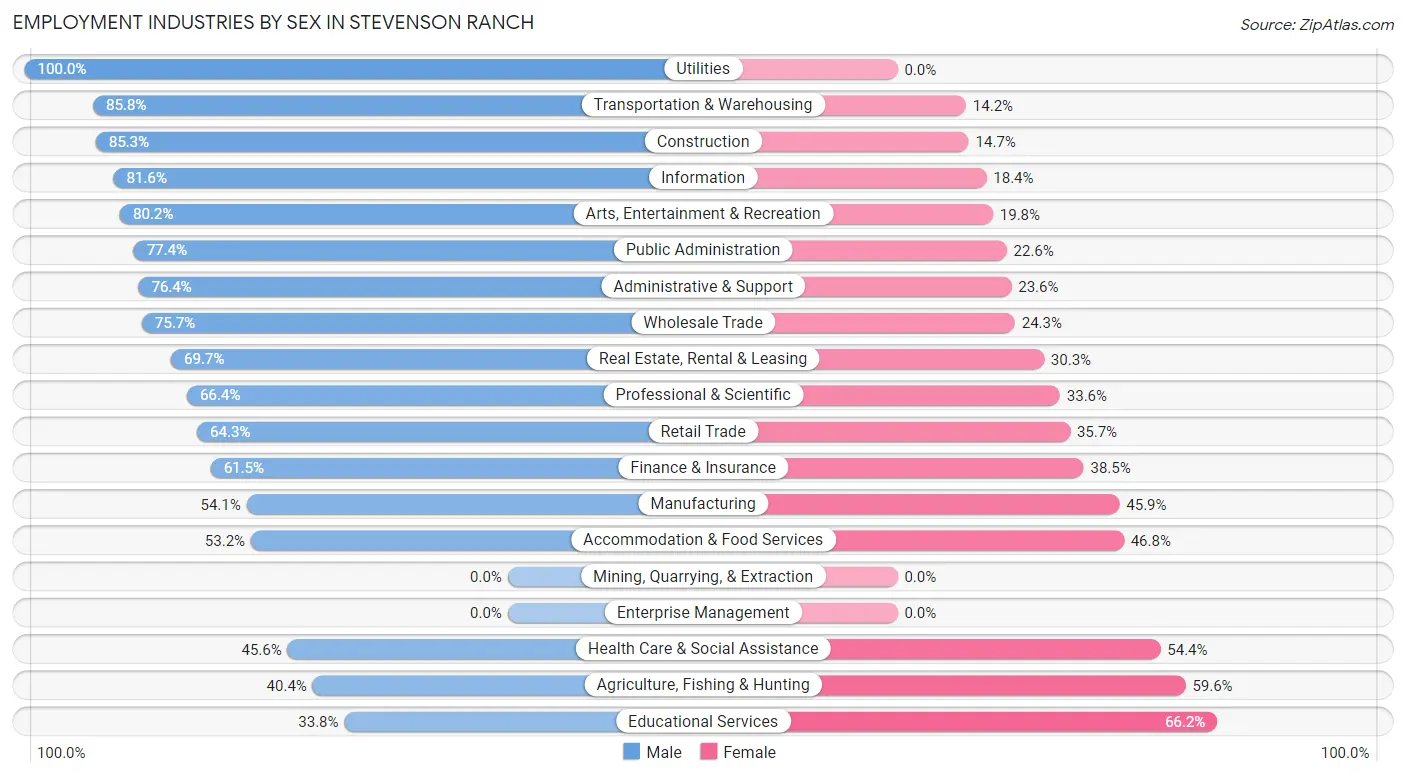
Employment Industries by Sex in Stevenson Ranch
The Stevenson Ranch industries that see more men than women are Utilities (100.0%), Transportation & Warehousing (85.8%), and Construction (85.3%), whereas the industries that tend to have a higher number of women are Educational Services (66.2%), Agriculture, Fishing & Hunting (59.6%), and Health Care & Social Assistance (54.4%).
| Industry | Male | Female |
| Agriculture, Fishing & Hunting | 21 (40.4%) | 31 (59.6%) |
| Mining, Quarrying, & Extraction | 0 (0.0%) | 0 (0.0%) |
| Construction | 324 (85.3%) | 56 (14.7%) |
| Manufacturing | 446 (54.1%) | 379 (45.9%) |
| Wholesale Trade | 268 (75.7%) | 86 (24.3%) |
| Retail Trade | 641 (64.3%) | 356 (35.7%) |
| Transportation & Warehousing | 224 (85.8%) | 37 (14.2%) |
| Utilities | 25 (100.0%) | 0 (0.0%) |
| Information | 492 (81.6%) | 111 (18.4%) |
| Finance & Insurance | 276 (61.5%) | 173 (38.5%) |
| Real Estate, Rental & Leasing | 216 (69.7%) | 94 (30.3%) |
| Professional & Scientific | 689 (66.4%) | 349 (33.6%) |
| Enterprise Management | 0 (0.0%) | 0 (0.0%) |
| Administrative & Support | 107 (76.4%) | 33 (23.6%) |
| Educational Services | 373 (33.8%) | 730 (66.2%) |
| Health Care & Social Assistance | 623 (45.6%) | 744 (54.4%) |
| Arts, Entertainment & Recreation | 199 (80.2%) | 49 (19.8%) |
| Accommodation & Food Services | 185 (53.2%) | 163 (46.8%) |
| Public Administration | 322 (77.4%) | 94 (22.6%) |
| Total | 5,596 (61.0%) | 3,586 (39.1%) |
Education in Stevenson Ranch
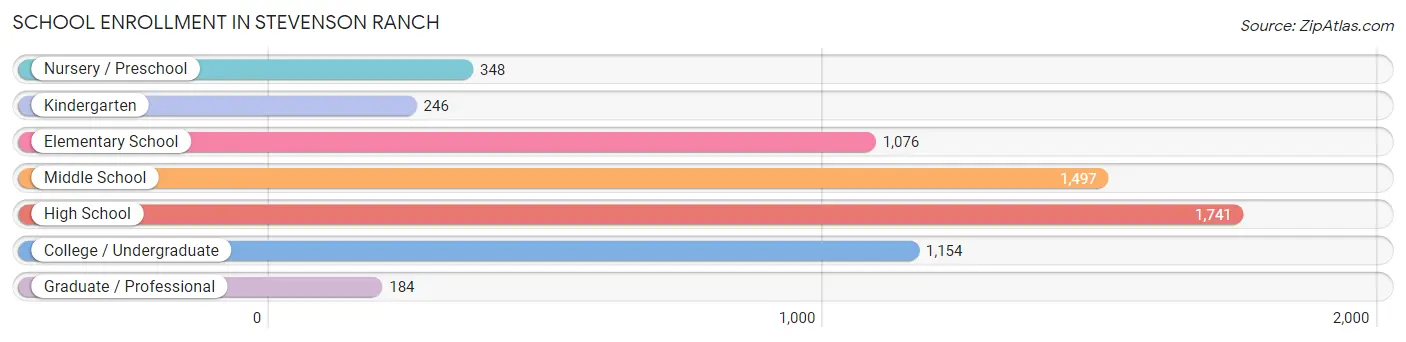
School Enrollment in Stevenson Ranch
The most common levels of schooling among the 6,246 students in Stevenson Ranch are high school (1,741 | 27.9%), middle school (1,497 | 24.0%), and college / undergraduate (1,154 | 18.5%).
| School Level | # Students | % Students |
| Nursery / Preschool | 348 | 5.6% |
| Kindergarten | 246 | 3.9% |
| Elementary School | 1,076 | 17.2% |
| Middle School | 1,497 | 24.0% |
| High School | 1,741 | 27.9% |
| College / Undergraduate | 1,154 | 18.5% |
| Graduate / Professional | 184 | 2.9% |
| Total | 6,246 | 100.0% |
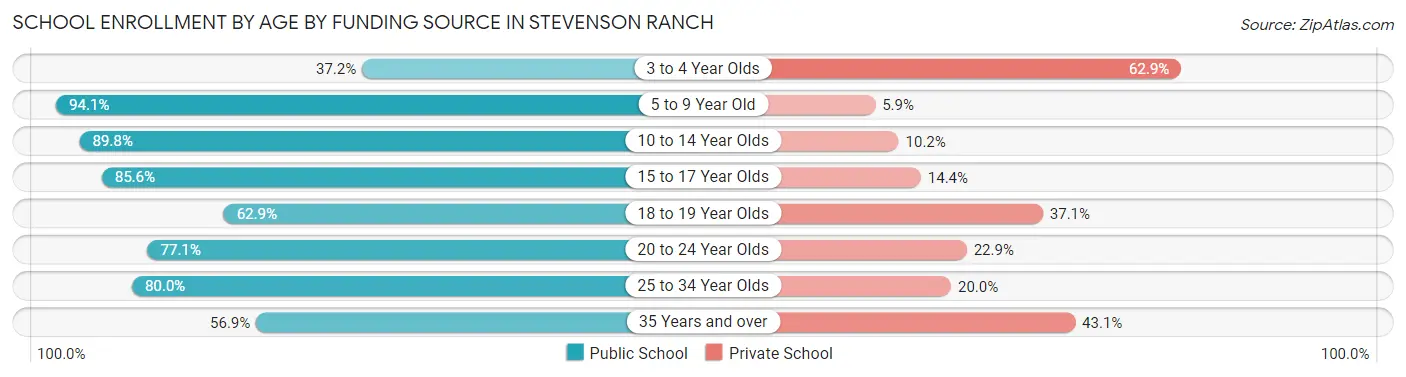
School Enrollment by Age by Funding Source in Stevenson Ranch
Out of a total of 6,246 students who are enrolled in schools in Stevenson Ranch, 1,099 (17.6%) attend a private institution, while the remaining 5,147 (82.4%) are enrolled in public schools. The age group of 3 to 4 year olds has the highest likelihood of being enrolled in private schools, with 159 (62.8% in the age bracket) enrolled. Conversely, the age group of 5 to 9 year old has the lowest likelihood of being enrolled in a private school, with 1,297 (94.1% in the age bracket) attending a public institution.
| Age Bracket | Public School | Private School |
| 3 to 4 Year Olds | 94 (37.1%) | 159 (62.8%) |
| 5 to 9 Year Old | 1,297 (94.1%) | 81 (5.9%) |
| 10 to 14 Year Olds | 1,483 (89.8%) | 169 (10.2%) |
| 15 to 17 Year Olds | 1,155 (85.6%) | 194 (14.4%) |
| 18 to 19 Year Olds | 317 (62.9%) | 187 (37.1%) |
| 20 to 24 Year Olds | 343 (77.1%) | 102 (22.9%) |
| 25 to 34 Year Olds | 276 (80.0%) | 69 (20.0%) |
| 35 Years and over | 182 (56.9%) | 138 (43.1%) |
| Total | 5,147 (82.4%) | 1,099 (17.6%) |
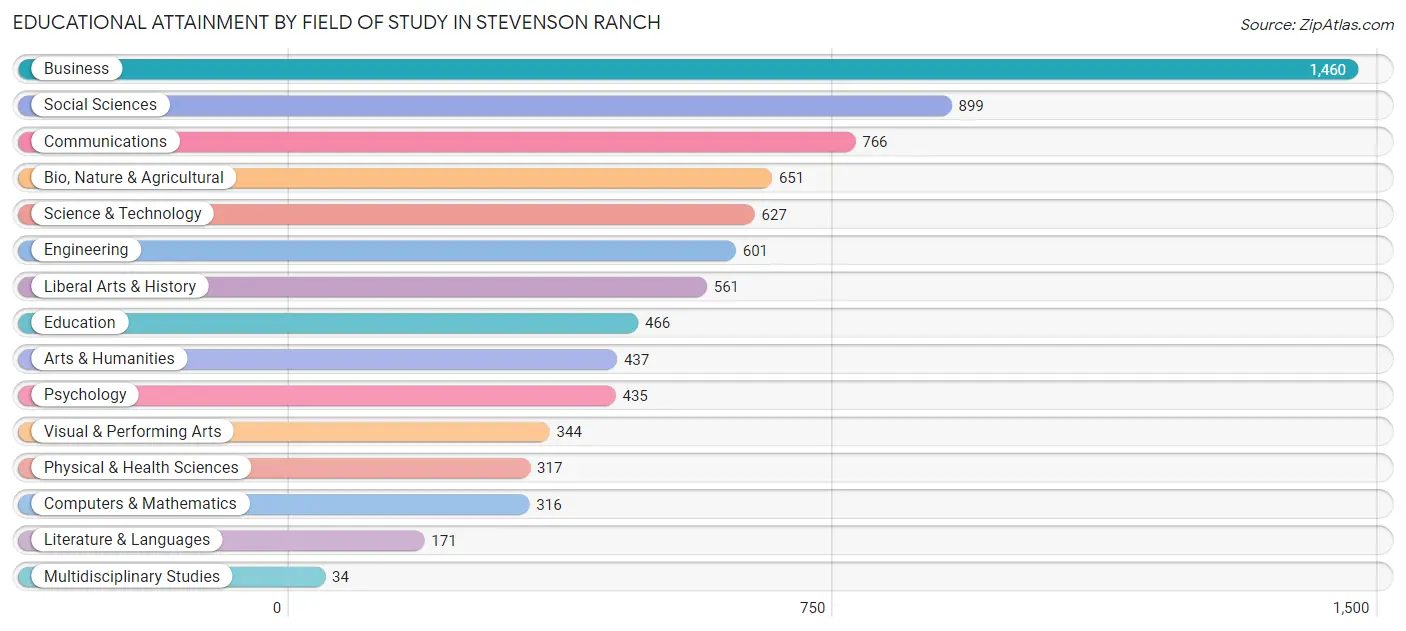
Educational Attainment by Field of Study in Stevenson Ranch
Business (1,460 | 18.1%), social sciences (899 | 11.1%), communications (766 | 9.5%), bio, nature & agricultural (651 | 8.1%), and science & technology (627 | 7.8%) are the most common fields of study among 8,085 individuals in Stevenson Ranch who have obtained a bachelor's degree or higher.
| Field of Study | # Graduates | % Graduates |
| Computers & Mathematics | 316 | 3.9% |
| Bio, Nature & Agricultural | 651 | 8.1% |
| Physical & Health Sciences | 317 | 3.9% |
| Psychology | 435 | 5.4% |
| Social Sciences | 899 | 11.1% |
| Engineering | 601 | 7.4% |
| Multidisciplinary Studies | 34 | 0.4% |
| Science & Technology | 627 | 7.8% |
| Business | 1,460 | 18.1% |
| Education | 466 | 5.8% |
| Literature & Languages | 171 | 2.1% |
| Liberal Arts & History | 561 | 6.9% |
| Visual & Performing Arts | 344 | 4.3% |
| Communications | 766 | 9.5% |
| Arts & Humanities | 437 | 5.4% |
| Total | 8,085 | 100.0% |
Transportation & Commute in Stevenson Ranch
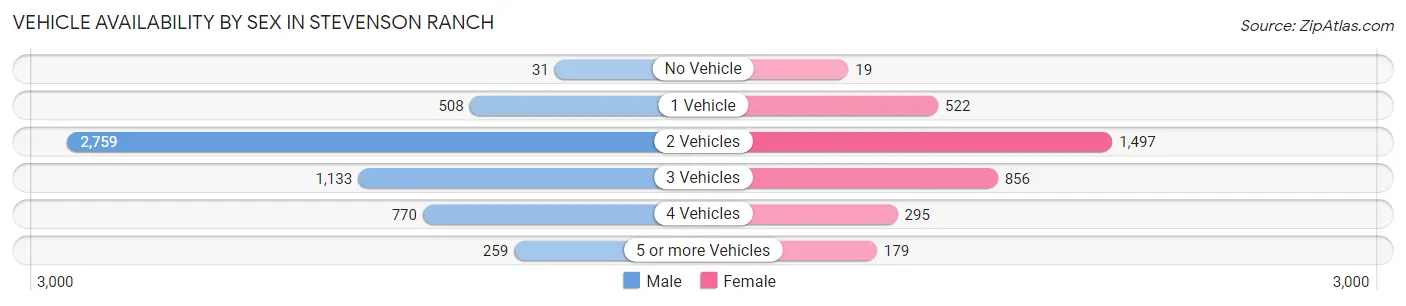
Vehicle Availability by Sex in Stevenson Ranch
The most prevalent vehicle ownership categories in Stevenson Ranch are males with 2 vehicles (2,759, accounting for 50.5%) and females with 2 vehicles (1,497, making up 81.9%).
| Vehicles Available | Male | Female |
| No Vehicle | 31 (0.6%) | 19 (0.6%) |
| 1 Vehicle | 508 (9.3%) | 522 (15.5%) |
| 2 Vehicles | 2,759 (50.5%) | 1,497 (44.5%) |
| 3 Vehicles | 1,133 (20.7%) | 856 (25.4%) |
| 4 Vehicles | 770 (14.1%) | 295 (8.8%) |
| 5 or more Vehicles | 259 (4.7%) | 179 (5.3%) |
| Total | 5,460 (100.0%) | 3,368 (100.0%) |
Commute Time in Stevenson Ranch
The most frequently occuring commute durations in Stevenson Ranch are 45 to 59 minutes (1,134 commuters, 16.1%), 60 to 89 minutes (1,074 commuters, 15.3%), and 10 to 14 minutes (1,008 commuters, 14.3%).
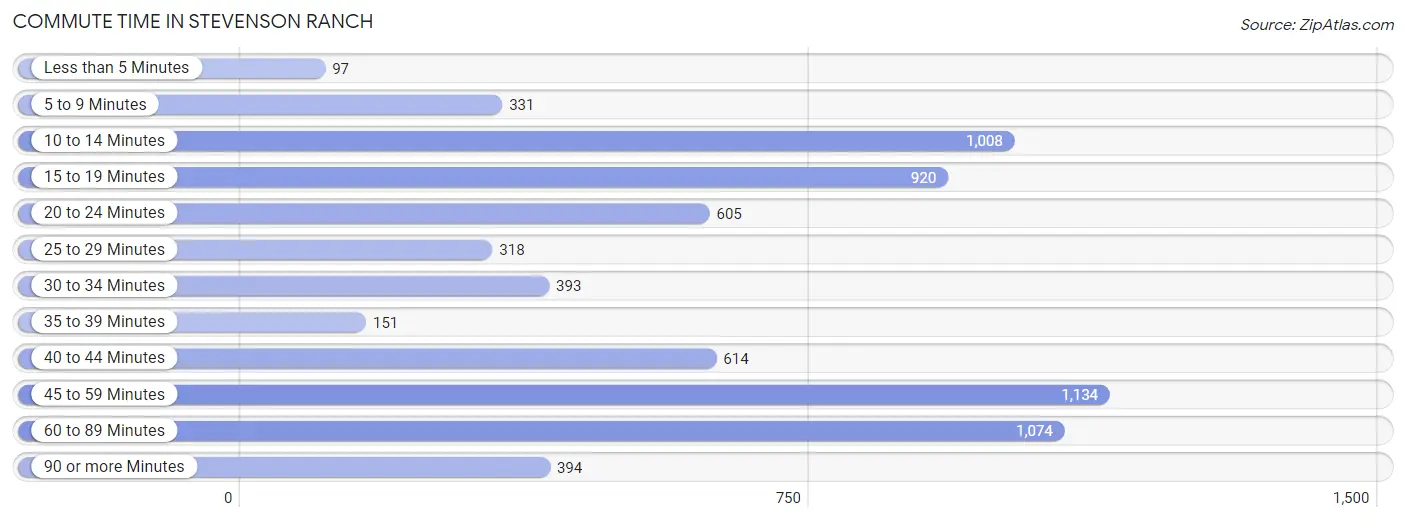
| Commute Time | # Commuters | % Commuters |
| Less than 5 Minutes | 97 | 1.4% |
| 5 to 9 Minutes | 331 | 4.7% |
| 10 to 14 Minutes | 1,008 | 14.3% |
| 15 to 19 Minutes | 920 | 13.1% |
| 20 to 24 Minutes | 605 | 8.6% |
| 25 to 29 Minutes | 318 | 4.5% |
| 30 to 34 Minutes | 393 | 5.6% |
| 35 to 39 Minutes | 151 | 2.1% |
| 40 to 44 Minutes | 614 | 8.7% |
| 45 to 59 Minutes | 1,134 | 16.1% |
| 60 to 89 Minutes | 1,074 | 15.3% |
| 90 or more Minutes | 394 | 5.6% |
Commute Time by Sex in Stevenson Ranch
The most common commute times in Stevenson Ranch are 60 to 89 minutes (864 commuters, 19.6%) for males and 10 to 14 minutes (514 commuters, 19.6%) for females.
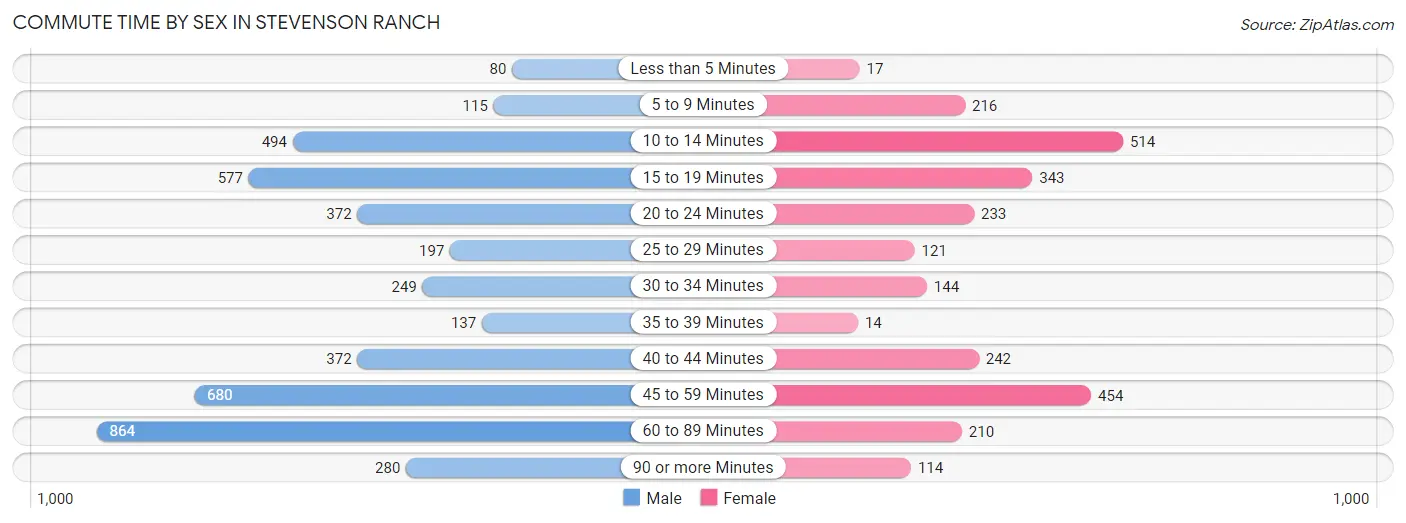
| Commute Time | Male | Female |
| Less than 5 Minutes | 80 (1.8%) | 17 (0.6%) |
| 5 to 9 Minutes | 115 (2.6%) | 216 (8.2%) |
| 10 to 14 Minutes | 494 (11.2%) | 514 (19.6%) |
| 15 to 19 Minutes | 577 (13.1%) | 343 (13.1%) |
| 20 to 24 Minutes | 372 (8.4%) | 233 (8.9%) |
| 25 to 29 Minutes | 197 (4.5%) | 121 (4.6%) |
| 30 to 34 Minutes | 249 (5.6%) | 144 (5.5%) |
| 35 to 39 Minutes | 137 (3.1%) | 14 (0.5%) |
| 40 to 44 Minutes | 372 (8.4%) | 242 (9.2%) |
| 45 to 59 Minutes | 680 (15.4%) | 454 (17.3%) |
| 60 to 89 Minutes | 864 (19.6%) | 210 (8.0%) |
| 90 or more Minutes | 280 (6.3%) | 114 (4.3%) |
Time of Departure to Work by Sex in Stevenson Ranch
The most frequent times of departure to work in Stevenson Ranch are 8:00 AM to 8:29 AM (669, 15.1%) for males and 7:30 AM to 7:59 AM (491, 18.7%) for females.
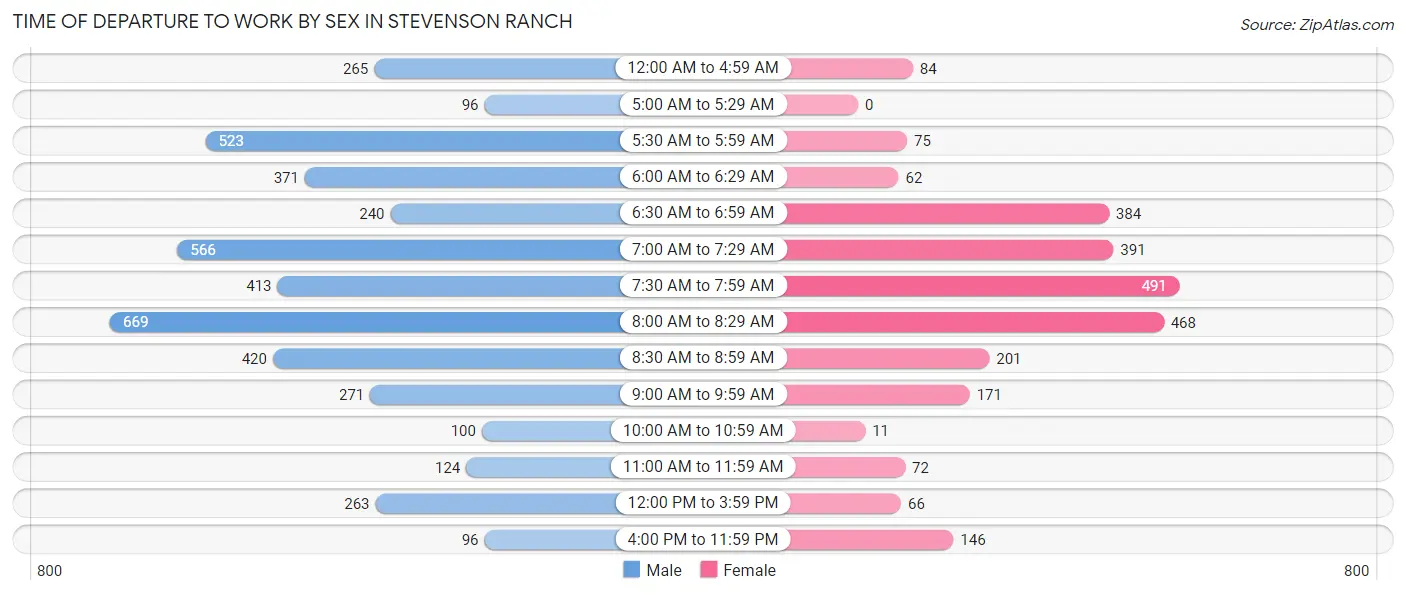
| Time of Departure | Male | Female |
| 12:00 AM to 4:59 AM | 265 (6.0%) | 84 (3.2%) |
| 5:00 AM to 5:29 AM | 96 (2.2%) | 0 (0.0%) |
| 5:30 AM to 5:59 AM | 523 (11.8%) | 75 (2.9%) |
| 6:00 AM to 6:29 AM | 371 (8.4%) | 62 (2.4%) |
| 6:30 AM to 6:59 AM | 240 (5.4%) | 384 (14.6%) |
| 7:00 AM to 7:29 AM | 566 (12.8%) | 391 (14.9%) |
| 7:30 AM to 7:59 AM | 413 (9.3%) | 491 (18.7%) |
| 8:00 AM to 8:29 AM | 669 (15.1%) | 468 (17.8%) |
| 8:30 AM to 8:59 AM | 420 (9.5%) | 201 (7.7%) |
| 9:00 AM to 9:59 AM | 271 (6.1%) | 171 (6.5%) |
| 10:00 AM to 10:59 AM | 100 (2.3%) | 11 (0.4%) |
| 11:00 AM to 11:59 AM | 124 (2.8%) | 72 (2.8%) |
| 12:00 PM to 3:59 PM | 263 (5.9%) | 66 (2.5%) |
| 4:00 PM to 11:59 PM | 96 (2.2%) | 146 (5.6%) |
| Total | 4,417 (100.0%) | 2,622 (100.0%) |
Housing Occupancy in Stevenson Ranch
Occupancy by Ownership in Stevenson Ranch
Of the total 6,720 dwellings in Stevenson Ranch, owner-occupied units account for 4,234 (63.0%), while renter-occupied units make up 2,486 (37.0%).
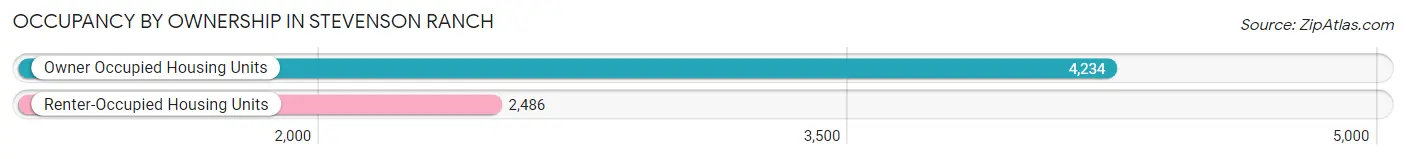
| Occupancy | # Housing Units | % Housing Units |
| Owner Occupied Housing Units | 4,234 | 63.0% |
| Renter-Occupied Housing Units | 2,486 | 37.0% |
| Total Occupied Housing Units | 6,720 | 100.0% |
Occupancy by Household Size in Stevenson Ranch
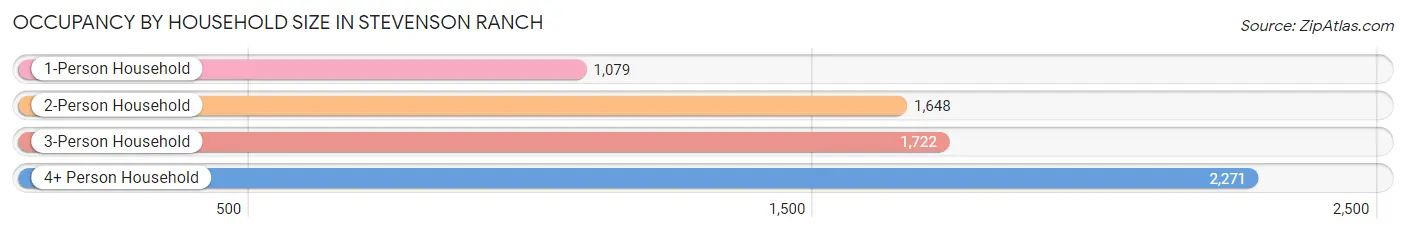
| Household Size | # Housing Units | % Housing Units |
| 1-Person Household | 1,079 | 16.1% |
| 2-Person Household | 1,648 | 24.5% |
| 3-Person Household | 1,722 | 25.6% |
| 4+ Person Household | 2,271 | 33.8% |
| Total Housing Units | 6,720 | 100.0% |
Occupancy by Ownership by Household Size in Stevenson Ranch
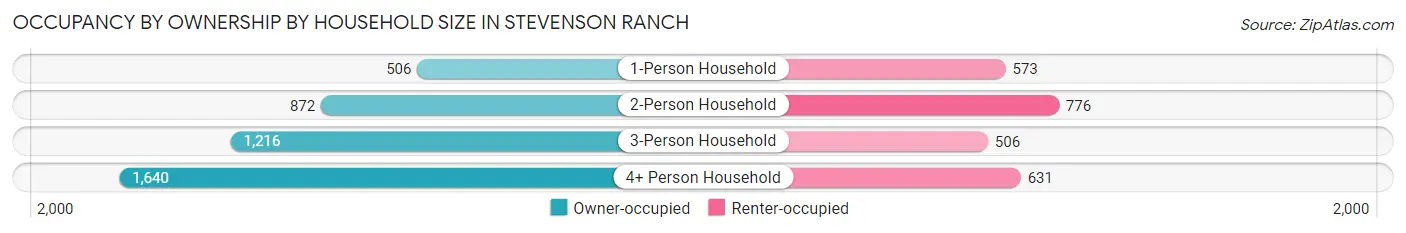
| Household Size | Owner-occupied | Renter-occupied |
| 1-Person Household | 506 (46.9%) | 573 (53.1%) |
| 2-Person Household | 872 (52.9%) | 776 (47.1%) |
| 3-Person Household | 1,216 (70.6%) | 506 (29.4%) |
| 4+ Person Household | 1,640 (72.2%) | 631 (27.8%) |
| Total Housing Units | 4,234 (63.0%) | 2,486 (37.0%) |
Occupancy by Educational Attainment in Stevenson Ranch
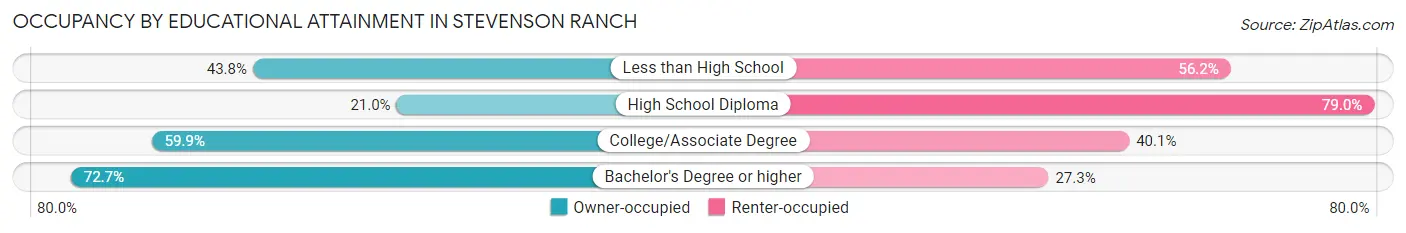
| Household Size | Owner-occupied | Renter-occupied |
| Less than High School | 60 (43.8%) | 77 (56.2%) |
| High School Diploma | 156 (21.0%) | 586 (79.0%) |
| College/Associate Degree | 1,059 (59.9%) | 710 (40.1%) |
| Bachelor's Degree or higher | 2,959 (72.7%) | 1,113 (27.3%) |
Occupancy by Age of Householder in Stevenson Ranch
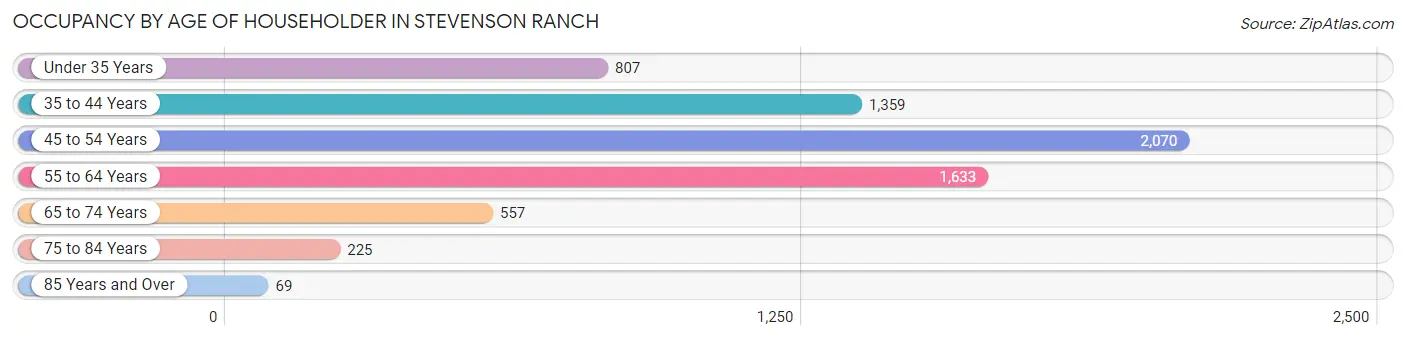
| Age Bracket | # Households | % Households |
| Under 35 Years | 807 | 12.0% |
| 35 to 44 Years | 1,359 | 20.2% |
| 45 to 54 Years | 2,070 | 30.8% |
| 55 to 64 Years | 1,633 | 24.3% |
| 65 to 74 Years | 557 | 8.3% |
| 75 to 84 Years | 225 | 3.4% |
| 85 Years and Over | 69 | 1.0% |
| Total | 6,720 | 100.0% |
Housing Finances in Stevenson Ranch
Median Income by Occupancy in Stevenson Ranch
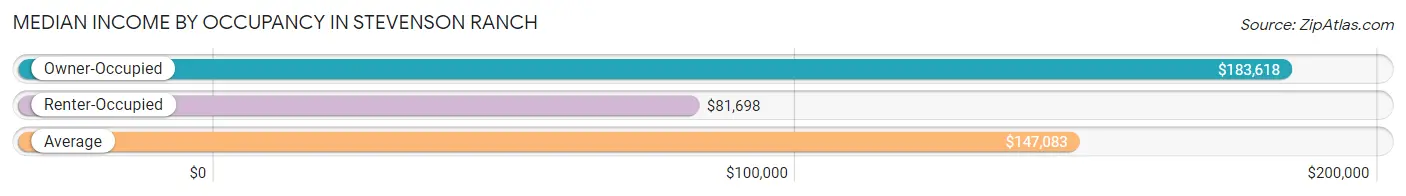
| Occupancy Type | # Households | Median Income |
| Owner-Occupied | 4,234 (63.0%) | $183,618 |
| Renter-Occupied | 2,486 (37.0%) | $81,698 |
| Average | 6,720 (100.0%) | $147,083 |
Occupancy by Householder Income Bracket in Stevenson Ranch
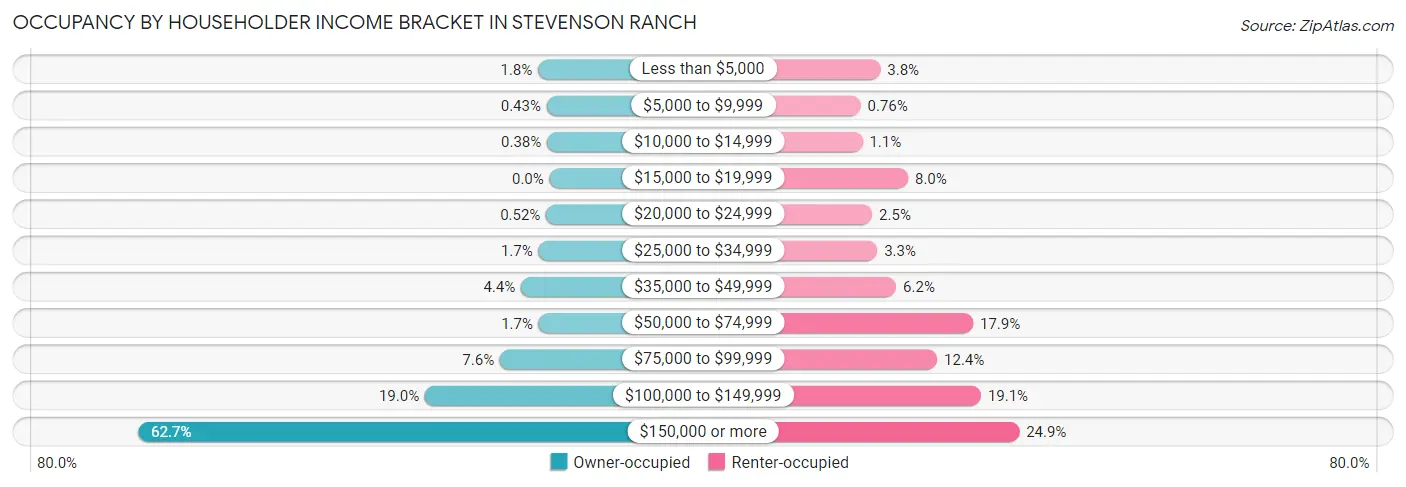
| Income Bracket | Owner-occupied | Renter-occupied |
| Less than $5,000 | 74 (1.8%) | 94 (3.8%) |
| $5,000 to $9,999 | 18 (0.4%) | 19 (0.8%) |
| $10,000 to $14,999 | 16 (0.4%) | 26 (1.1%) |
| $15,000 to $19,999 | 0 (0.0%) | 199 (8.0%) |
| $20,000 to $24,999 | 22 (0.5%) | 63 (2.5%) |
| $25,000 to $34,999 | 71 (1.7%) | 82 (3.3%) |
| $35,000 to $49,999 | 184 (4.3%) | 154 (6.2%) |
| $50,000 to $74,999 | 70 (1.7%) | 445 (17.9%) |
| $75,000 to $99,999 | 320 (7.6%) | 309 (12.4%) |
| $100,000 to $149,999 | 804 (19.0%) | 475 (19.1%) |
| $150,000 or more | 2,655 (62.7%) | 620 (24.9%) |
| Total | 4,234 (100.0%) | 2,486 (100.0%) |
Monthly Housing Cost Tiers in Stevenson Ranch
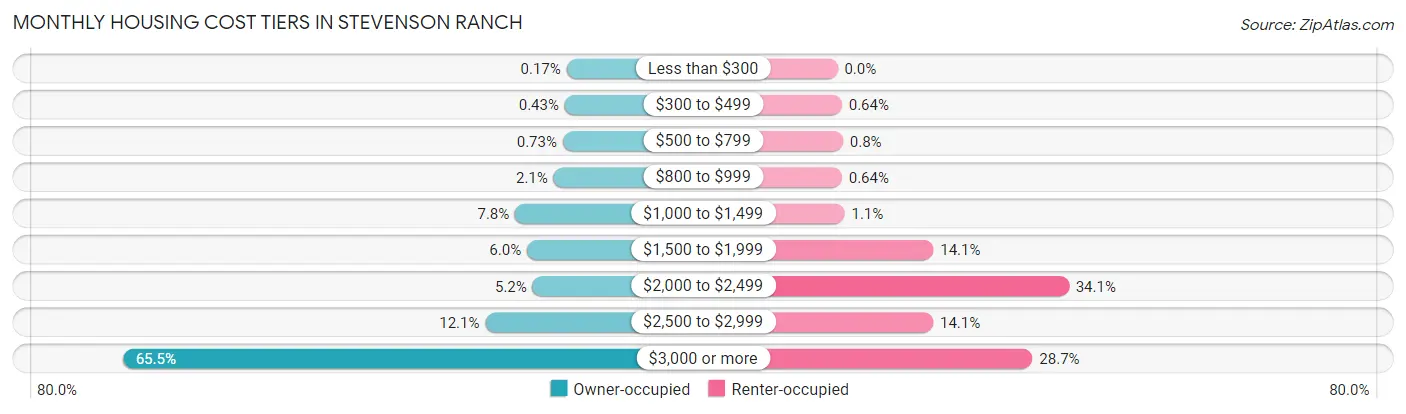
| Monthly Cost | Owner-occupied | Renter-occupied |
| Less than $300 | 7 (0.2%) | 0 (0.0%) |
| $300 to $499 | 18 (0.4%) | 16 (0.6%) |
| $500 to $799 | 31 (0.7%) | 20 (0.8%) |
| $800 to $999 | 88 (2.1%) | 16 (0.6%) |
| $1,000 to $1,499 | 328 (7.7%) | 26 (1.1%) |
| $1,500 to $1,999 | 254 (6.0%) | 351 (14.1%) |
| $2,000 to $2,499 | 219 (5.2%) | 847 (34.1%) |
| $2,500 to $2,999 | 514 (12.1%) | 350 (14.1%) |
| $3,000 or more | 2,775 (65.5%) | 714 (28.7%) |
| Total | 4,234 (100.0%) | 2,486 (100.0%) |
Physical Housing Characteristics in Stevenson Ranch
Housing Structures in Stevenson Ranch
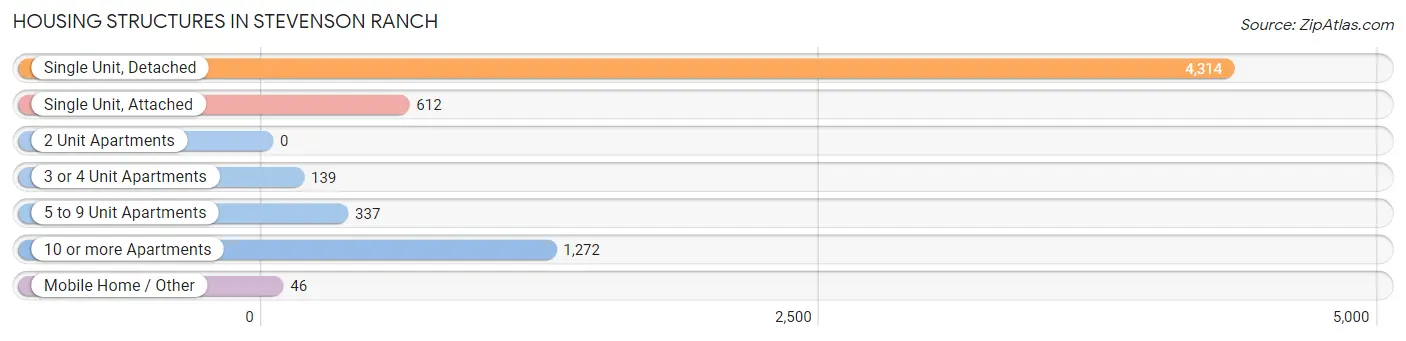
| Structure Type | # Housing Units | % Housing Units |
| Single Unit, Detached | 4,314 | 64.2% |
| Single Unit, Attached | 612 | 9.1% |
| 2 Unit Apartments | 0 | 0.0% |
| 3 or 4 Unit Apartments | 139 | 2.1% |
| 5 to 9 Unit Apartments | 337 | 5.0% |
| 10 or more Apartments | 1,272 | 18.9% |
| Mobile Home / Other | 46 | 0.7% |
| Total | 6,720 | 100.0% |
Housing Structures by Occupancy in Stevenson Ranch
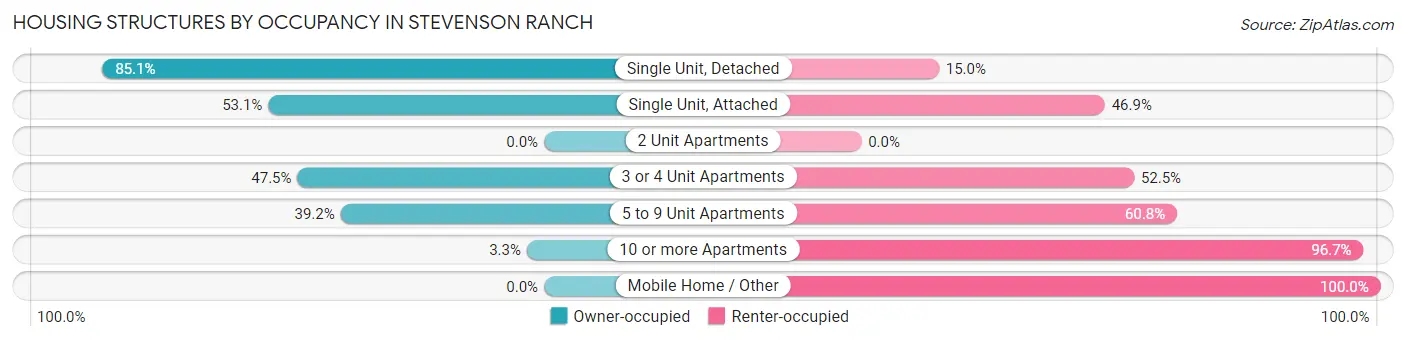
| Structure Type | Owner-occupied | Renter-occupied |
| Single Unit, Detached | 3,669 (85.1%) | 645 (14.9%) |
| Single Unit, Attached | 325 (53.1%) | 287 (46.9%) |
| 2 Unit Apartments | 0 (0.0%) | 0 (0.0%) |
| 3 or 4 Unit Apartments | 66 (47.5%) | 73 (52.5%) |
| 5 to 9 Unit Apartments | 132 (39.2%) | 205 (60.8%) |
| 10 or more Apartments | 42 (3.3%) | 1,230 (96.7%) |
| Mobile Home / Other | 0 (0.0%) | 46 (100.0%) |
| Total | 4,234 (63.0%) | 2,486 (37.0%) |
Housing Structures by Number of Rooms in Stevenson Ranch
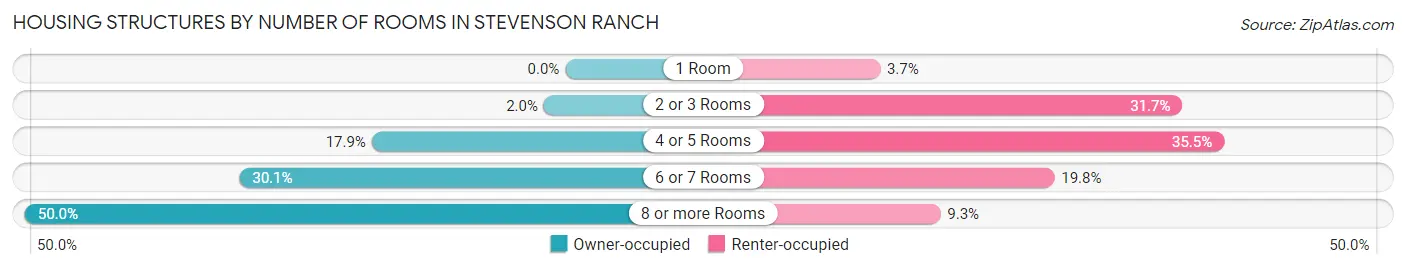
| Number of Rooms | Owner-occupied | Renter-occupied |
| 1 Room | 0 (0.0%) | 92 (3.7%) |
| 2 or 3 Rooms | 84 (2.0%) | 787 (31.7%) |
| 4 or 5 Rooms | 758 (17.9%) | 883 (35.5%) |
| 6 or 7 Rooms | 1,276 (30.1%) | 493 (19.8%) |
| 8 or more Rooms | 2,116 (50.0%) | 231 (9.3%) |
| Total | 4,234 (100.0%) | 2,486 (100.0%) |
Housing Structure by Heating Type in Stevenson Ranch
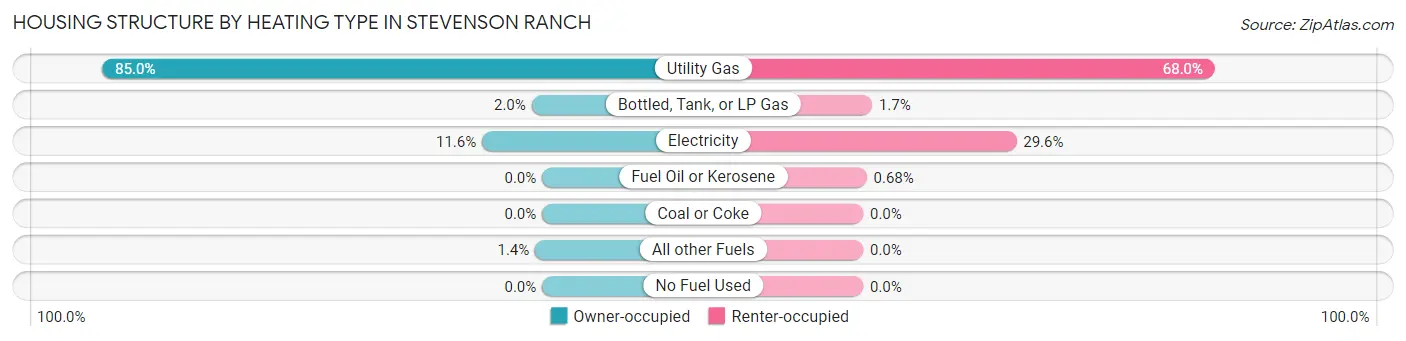
| Heating Type | Owner-occupied | Renter-occupied |
| Utility Gas | 3,600 (85.0%) | 1,690 (68.0%) |
| Bottled, Tank, or LP Gas | 86 (2.0%) | 43 (1.7%) |
| Electricity | 491 (11.6%) | 736 (29.6%) |
| Fuel Oil or Kerosene | 0 (0.0%) | 17 (0.7%) |
| Coal or Coke | 0 (0.0%) | 0 (0.0%) |
| All other Fuels | 57 (1.3%) | 0 (0.0%) |
| No Fuel Used | 0 (0.0%) | 0 (0.0%) |
| Total | 4,234 (100.0%) | 2,486 (100.0%) |
Household Vehicle Usage in Stevenson Ranch
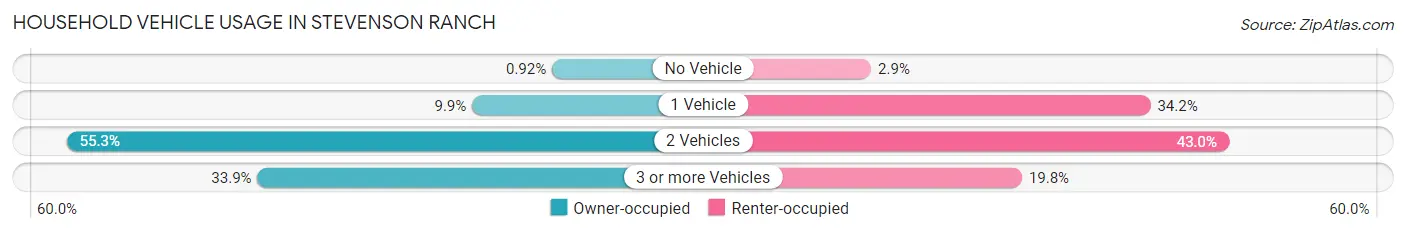
| Vehicles per Household | Owner-occupied | Renter-occupied |
| No Vehicle | 39 (0.9%) | 73 (2.9%) |
| 1 Vehicle | 418 (9.9%) | 851 (34.2%) |
| 2 Vehicles | 2,341 (55.3%) | 1,069 (43.0%) |
| 3 or more Vehicles | 1,436 (33.9%) | 493 (19.8%) |
| Total | 4,234 (100.0%) | 2,486 (100.0%) |
Real Estate & Mortgages in Stevenson Ranch
Real Estate and Mortgage Overview in Stevenson Ranch
| Characteristic | Without Mortgage | With Mortgage |
| Housing Units | 617 | 3,617 |
| Median Property Value | $927,500 | $975,500 |
| Median Household Income | $140,781 | $2,378 |
| Monthly Housing Costs | $1,268 | $2,749 |
| Real Estate Taxes | $9,153 | $8 |
Property Value by Mortgage Status in Stevenson Ranch
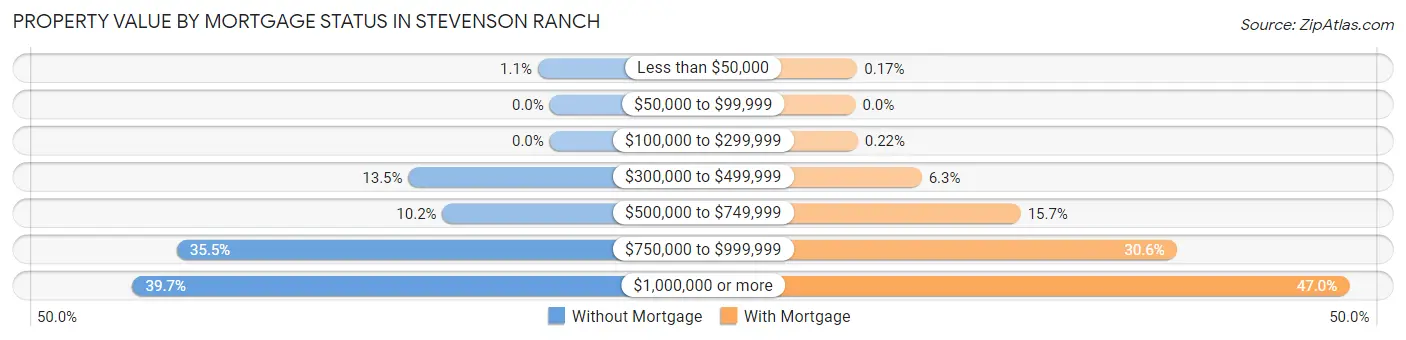
| Property Value | Without Mortgage | With Mortgage |
| Less than $50,000 | 7 (1.1%) | 6 (0.2%) |
| $50,000 to $99,999 | 0 (0.0%) | 0 (0.0%) |
| $100,000 to $299,999 | 0 (0.0%) | 8 (0.2%) |
| $300,000 to $499,999 | 83 (13.5%) | 228 (6.3%) |
| $500,000 to $749,999 | 63 (10.2%) | 569 (15.7%) |
| $750,000 to $999,999 | 219 (35.5%) | 1,106 (30.6%) |
| $1,000,000 or more | 245 (39.7%) | 1,700 (47.0%) |
| Total | 617 (100.0%) | 3,617 (100.0%) |
Household Income by Mortgage Status in Stevenson Ranch
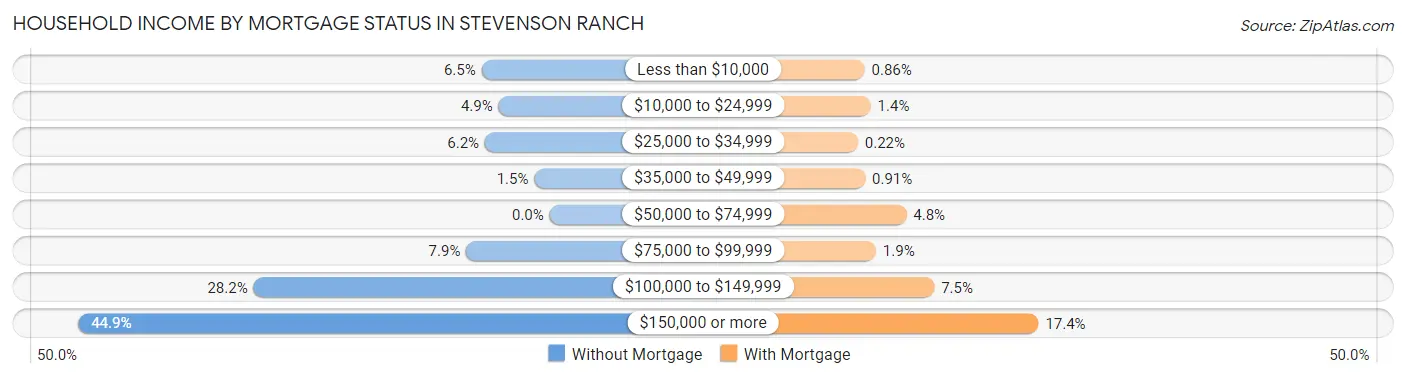
| Household Income | Without Mortgage | With Mortgage |
| Less than $10,000 | 40 (6.5%) | 31 (0.9%) |
| $10,000 to $24,999 | 30 (4.9%) | 52 (1.4%) |
| $25,000 to $34,999 | 38 (6.2%) | 8 (0.2%) |
| $35,000 to $49,999 | 9 (1.5%) | 33 (0.9%) |
| $50,000 to $74,999 | 0 (0.0%) | 175 (4.8%) |
| $75,000 to $99,999 | 49 (7.9%) | 70 (1.9%) |
| $100,000 to $149,999 | 174 (28.2%) | 271 (7.5%) |
| $150,000 or more | 277 (44.9%) | 630 (17.4%) |
| Total | 617 (100.0%) | 3,617 (100.0%) |
Property Value to Household Income Ratio in Stevenson Ranch
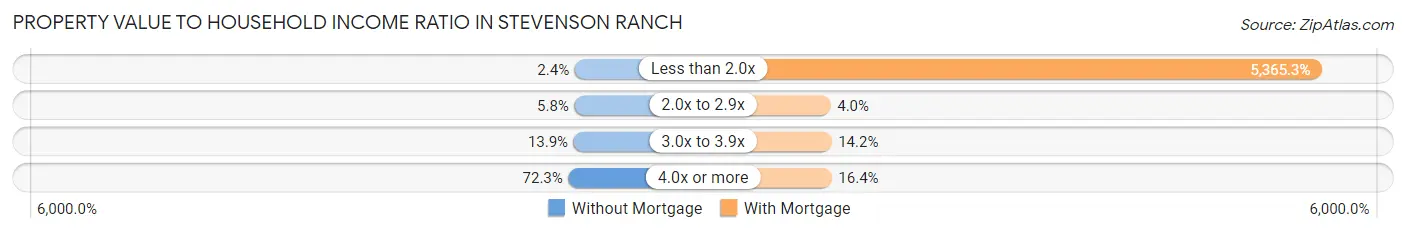
| Value-to-Income Ratio | Without Mortgage | With Mortgage |
| Less than 2.0x | 15 (2.4%) | 194,063 (5,365.3%) |
| 2.0x to 2.9x | 36 (5.8%) | 145 (4.0%) |
| 3.0x to 3.9x | 86 (13.9%) | 514 (14.2%) |
| 4.0x or more | 446 (72.3%) | 592 (16.4%) |
| Total | 617 (100.0%) | 3,617 (100.0%) |
Real Estate Taxes by Mortgage Status in Stevenson Ranch
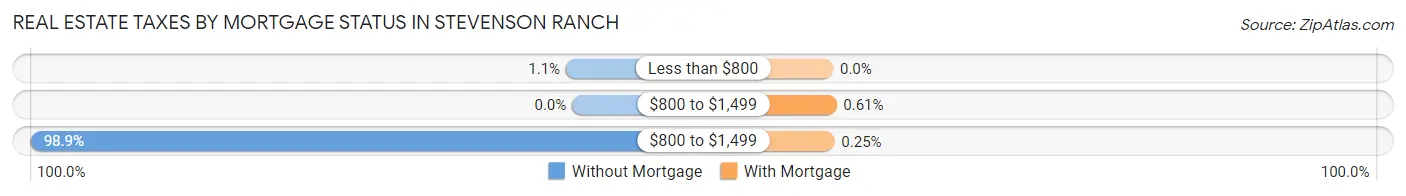
| Property Taxes | Without Mortgage | With Mortgage |
| Less than $800 | 7 (1.1%) | 0 (0.0%) |
| $800 to $1,499 | 0 (0.0%) | 22 (0.6%) |
| $800 to $1,499 | 610 (98.9%) | 9 (0.3%) |
| Total | 617 (100.0%) | 3,617 (100.0%) |
Health & Disability in Stevenson Ranch
Health Insurance Coverage by Age in Stevenson Ranch
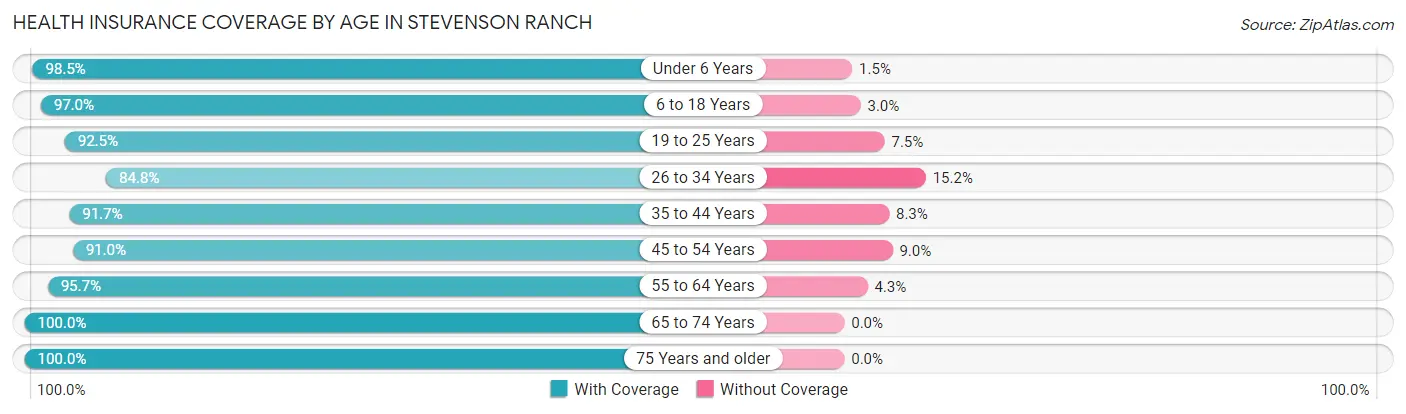
| Age Bracket | With Coverage | Without Coverage |
| Under 6 Years | 1,208 (98.5%) | 18 (1.5%) |
| 6 to 18 Years | 4,443 (97.0%) | 139 (3.0%) |
| 19 to 25 Years | 1,368 (92.5%) | 111 (7.5%) |
| 26 to 34 Years | 1,530 (84.8%) | 274 (15.2%) |
| 35 to 44 Years | 2,144 (91.7%) | 195 (8.3%) |
| 45 to 54 Years | 3,742 (91.0%) | 369 (9.0%) |
| 55 to 64 Years | 2,748 (95.7%) | 124 (4.3%) |
| 65 to 74 Years | 1,214 (100.0%) | 0 (0.0%) |
| 75 Years and older | 857 (100.0%) | 0 (0.0%) |
| Total | 19,254 (94.0%) | 1,230 (6.0%) |
Health Insurance Coverage by Citizenship Status in Stevenson Ranch
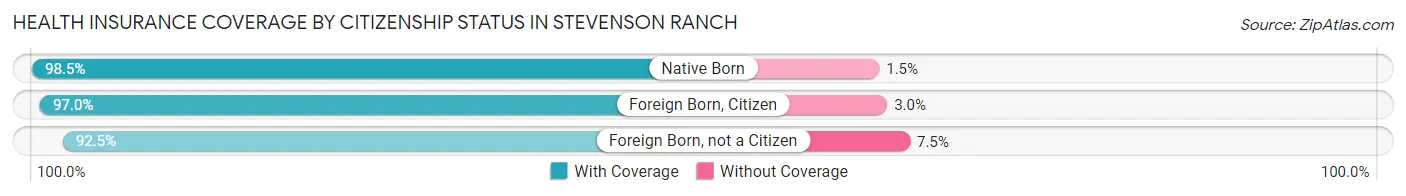
| Citizenship Status | With Coverage | Without Coverage |
| Native Born | 1,208 (98.5%) | 18 (1.5%) |
| Foreign Born, Citizen | 4,443 (97.0%) | 139 (3.0%) |
| Foreign Born, not a Citizen | 1,368 (92.5%) | 111 (7.5%) |
Health Insurance Coverage by Household Income in Stevenson Ranch
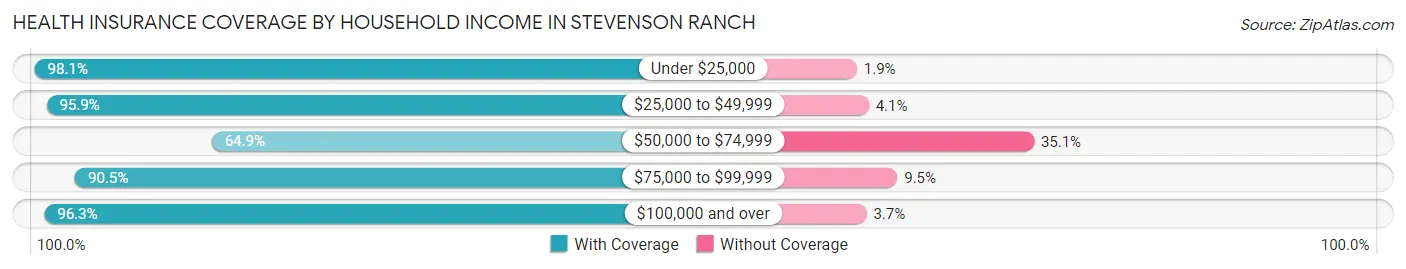
| Household Income | With Coverage | Without Coverage |
| Under $25,000 | 986 (98.1%) | 19 (1.9%) |
| $25,000 to $49,999 | 1,451 (95.9%) | 62 (4.1%) |
| $50,000 to $74,999 | 839 (64.9%) | 453 (35.1%) |
| $75,000 to $99,999 | 1,264 (90.5%) | 132 (9.5%) |
| $100,000 and over | 14,714 (96.3%) | 564 (3.7%) |
Public vs Private Health Insurance Coverage by Age in Stevenson Ranch
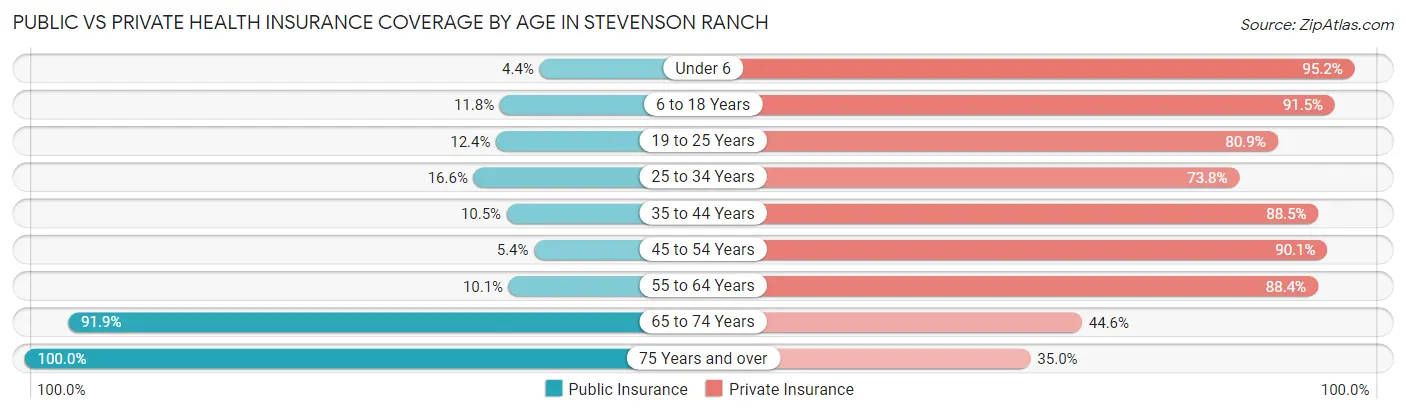
| Age Bracket | Public Insurance | Private Insurance |
| Under 6 | 54 (4.4%) | 1,167 (95.2%) |
| 6 to 18 Years | 539 (11.8%) | 4,194 (91.5%) |
| 19 to 25 Years | 184 (12.4%) | 1,196 (80.9%) |
| 25 to 34 Years | 300 (16.6%) | 1,331 (73.8%) |
| 35 to 44 Years | 245 (10.5%) | 2,069 (88.5%) |
| 45 to 54 Years | 221 (5.4%) | 3,705 (90.1%) |
| 55 to 64 Years | 290 (10.1%) | 2,538 (88.4%) |
| 65 to 74 Years | 1,116 (91.9%) | 541 (44.6%) |
| 75 Years and over | 857 (100.0%) | 300 (35.0%) |
| Total | 3,806 (18.6%) | 17,041 (83.2%) |
Disability Status by Sex by Age in Stevenson Ranch
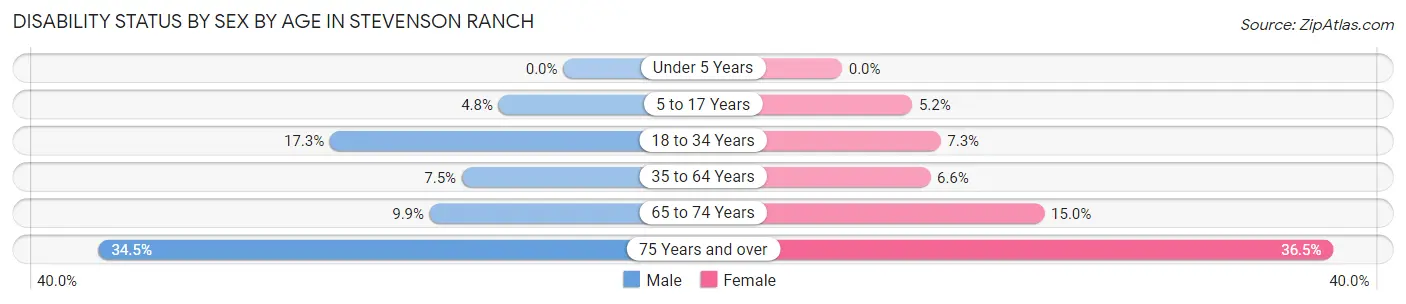
| Age Bracket | Male | Female |
| Under 5 Years | 0 (0.0%) | 0 (0.0%) |
| 5 to 17 Years | 75 (4.8%) | 150 (5.2%) |
| 18 to 34 Years | 373 (17.3%) | 105 (7.3%) |
| 35 to 64 Years | 357 (7.5%) | 300 (6.6%) |
| 65 to 74 Years | 57 (9.9%) | 96 (15.0%) |
| 75 Years and over | 117 (34.5%) | 189 (36.5%) |
Disability Class by Sex by Age in Stevenson Ranch
Disability Class: Hearing Difficulty
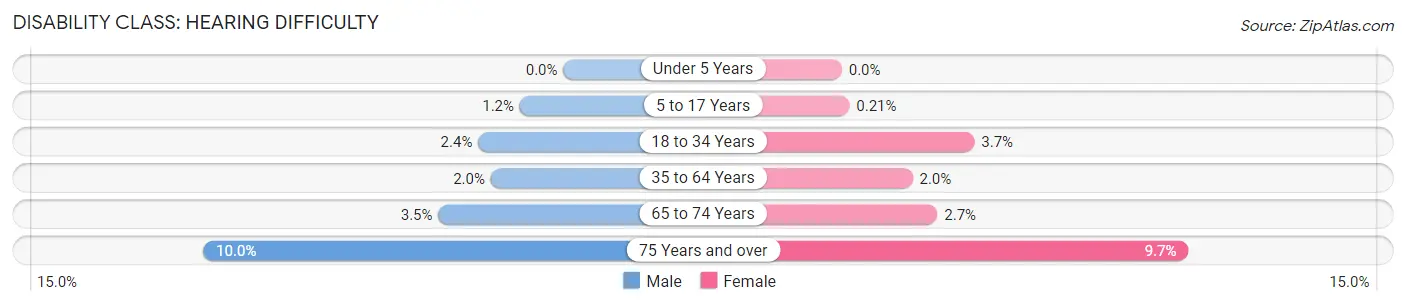
| Age Bracket | Male | Female |
| Under 5 Years | 0 (0.0%) | 0 (0.0%) |
| 5 to 17 Years | 19 (1.2%) | 6 (0.2%) |
| 18 to 34 Years | 51 (2.4%) | 53 (3.7%) |
| 35 to 64 Years | 96 (2.0%) | 90 (2.0%) |
| 65 to 74 Years | 20 (3.5%) | 17 (2.7%) |
| 75 Years and over | 34 (10.0%) | 50 (9.7%) |
Disability Class: Vision Difficulty
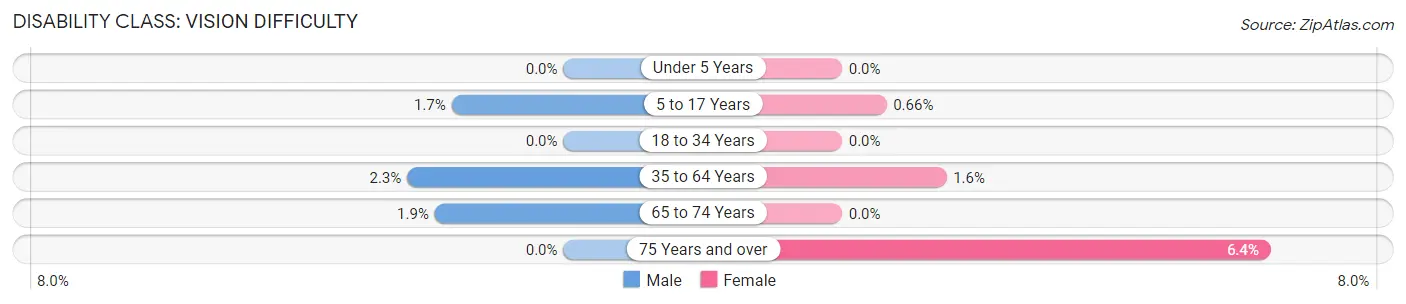
| Age Bracket | Male | Female |
| Under 5 Years | 0 (0.0%) | 0 (0.0%) |
| 5 to 17 Years | 26 (1.7%) | 19 (0.7%) |
| 18 to 34 Years | 0 (0.0%) | 0 (0.0%) |
| 35 to 64 Years | 110 (2.3%) | 71 (1.5%) |
| 65 to 74 Years | 11 (1.9%) | 0 (0.0%) |
| 75 Years and over | 0 (0.0%) | 33 (6.4%) |
Disability Class: Cognitive Difficulty
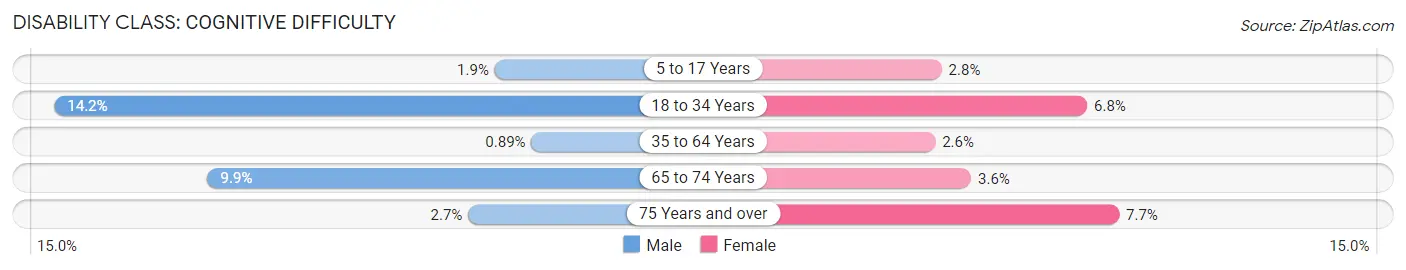
| Age Bracket | Male | Female |
| 5 to 17 Years | 30 (1.9%) | 80 (2.8%) |
| 18 to 34 Years | 305 (14.2%) | 98 (6.8%) |
| 35 to 64 Years | 42 (0.9%) | 119 (2.6%) |
| 65 to 74 Years | 57 (9.9%) | 23 (3.6%) |
| 75 Years and over | 9 (2.6%) | 40 (7.7%) |
Disability Class: Ambulatory Difficulty
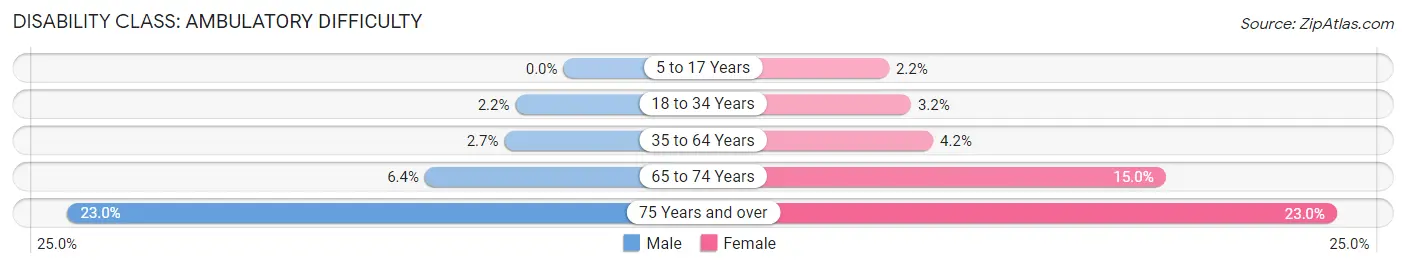
| Age Bracket | Male | Female |
| 5 to 17 Years | 0 (0.0%) | 63 (2.2%) |
| 18 to 34 Years | 48 (2.2%) | 46 (3.2%) |
| 35 to 64 Years | 130 (2.7%) | 194 (4.2%) |
| 65 to 74 Years | 37 (6.4%) | 96 (15.0%) |
| 75 Years and over | 78 (23.0%) | 119 (23.0%) |
Disability Class: Self-Care Difficulty
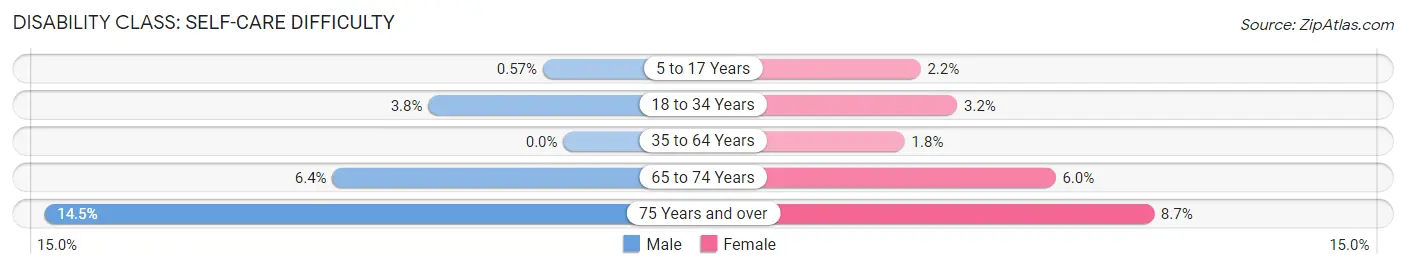
| Age Bracket | Male | Female |
| 5 to 17 Years | 9 (0.6%) | 63 (2.2%) |
| 18 to 34 Years | 81 (3.8%) | 46 (3.2%) |
| 35 to 64 Years | 0 (0.0%) | 80 (1.8%) |
| 65 to 74 Years | 37 (6.4%) | 38 (5.9%) |
| 75 Years and over | 49 (14.4%) | 45 (8.7%) |
Technology Access in Stevenson Ranch
Computing Device Access in Stevenson Ranch
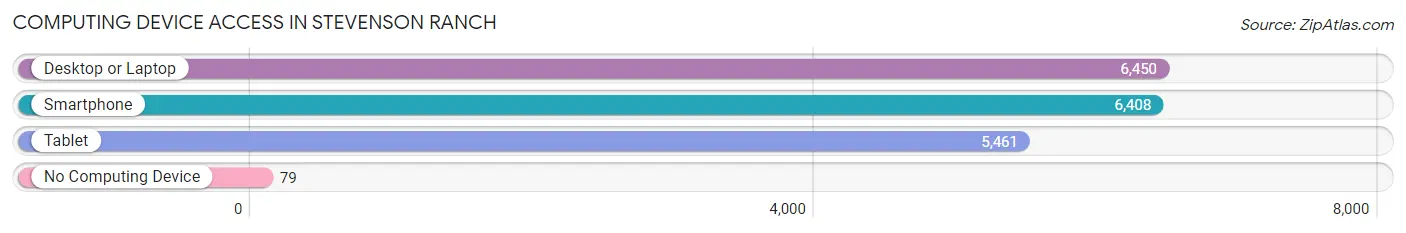
| Device Type | # Households | % Households |
| Desktop or Laptop | 6,450 | 96.0% |
| Smartphone | 6,408 | 95.4% |
| Tablet | 5,461 | 81.3% |
| No Computing Device | 79 | 1.2% |
| Total | 6,720 | 100.0% |
Internet Access in Stevenson Ranch
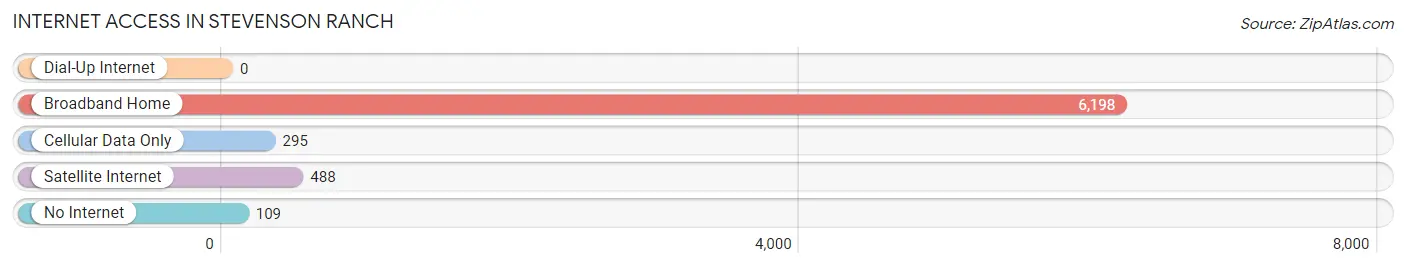
| Internet Type | # Households | % Households |
| Dial-Up Internet | 0 | 0.0% |
| Broadband Home | 6,198 | 92.2% |
| Cellular Data Only | 295 | 4.4% |
| Satellite Internet | 488 | 7.3% |
| No Internet | 109 | 1.6% |
| Total | 6,720 | 100.0% |
Stevenson Ranch Summary
Stevenson Ranch is an unincorporated community located in the Santa Clarita Valley of Los Angeles County, California. It is located in the foothills of the Santa Susana Mountains, approximately 25 miles northwest of downtown Los Angeles. The community is bordered by the cities of Santa Clarita and Valencia. The population of Stevenson Ranch was estimated to be 17,407 in 2019.
History
The area now known as Stevenson Ranch was originally inhabited by the Tataviam people, a Native American tribe that lived in the area for thousands of years. The land was later acquired by the Mexican government in 1834 and was part of the Rancho San Francisco land grant. In 1846, the land was acquired by the United States government as part of the Mexican Cession.
In 1868, the land was purchased by Benjamin D. Wilson, a former mayor of Los Angeles. Wilson used the land for cattle ranching and farming. In the late 19th century, the land was acquired by the Stevenson family, who continued to use the land for cattle ranching and farming.
In the 1950s, the land was acquired by the Newhall Land and Farming Company, who began to develop the area into a residential community. The first homes were built in the late 1960s and the community was officially established in 1987.
Geography
Stevenson Ranch is located in the Santa Clarita Valley of Los Angeles County, California. It is located in the foothills of the Santa Susana Mountains, approximately 25 miles northwest of downtown Los Angeles. The community is bordered by the cities of Santa Clarita and Valencia.
The area is characterized by rolling hills and valleys, with elevations ranging from 1,000 to 2,000 feet. The area is home to several parks, including the Stevenson Ranch Community Park, the Stevenson Ranch Dog Park, and the Stevenson Ranch Nature Trail.
Economy
The economy of Stevenson Ranch is largely driven by the retail and service industries. The area is home to several shopping centers, including the Stevenson Ranch Town Center, the Stevenson Ranch Marketplace, and the Stevenson Ranch Shopping Center.
The area is also home to several corporate offices, including the headquarters of the William S. Hart Union High School District, the headquarters of the Santa Clarita Valley Sheriff's Station, and the headquarters of the Santa Clarita Valley Water Agency.
Demographics
As of 2019, the population of Stevenson Ranch was estimated to be 17,407. The racial makeup of the community was 75.3% White, 11.2% Hispanic or Latino, 8.2% Asian, and 5.3% African American. The median household income was $112,945, and the median age was 37.7 years.
Common Questions
What is the Total Population of Stevenson Ranch?
Total Population of Stevenson Ranch is 20,484.
What is the Total Male Population of Stevenson Ranch?
Total Male Population of Stevenson Ranch is 9,977.
What is the Total Female Population of Stevenson Ranch?
Total Female Population of Stevenson Ranch is 10,507.
What is the Ratio of Males per 100 Females in Stevenson Ranch?
There are 94.96 Males per 100 Females in Stevenson Ranch.
What is the Ratio of Females per 100 Males in Stevenson Ranch?
There are 105.31 Females per 100 Males in Stevenson Ranch.
What is the Median Population Age in Stevenson Ranch?
Median Population Age in Stevenson Ranch is 40.6 Years.
What is the Average Family Size in Stevenson Ranch
Average Family Size in Stevenson Ranch is 3.4 People.
What is the Average Household Size in Stevenson Ranch
Average Household Size in Stevenson Ranch is 3.0 People.
What is Per Capita Income in Stevenson Ranch?
Per Capita income in Stevenson Ranch is $60,061.
What is the Median Family Income in Stevenson Ranch?
Median Family Income in Stevenson Ranch is $160,988.
What is the Median Household income in Stevenson Ranch?
Median Household Income in Stevenson Ranch is $147,083.
What is Income or Wage Gap in Stevenson Ranch?
Income or Wage Gap in Stevenson Ranch is 40.8%.
Women in Stevenson Ranch earn 59.2 cents for every dollar earned by a man.
What is Inequality or Gini Index in Stevenson Ranch?
Inequality or Gini Index in Stevenson Ranch is 0.41.
How Large is the Labor Force in Stevenson Ranch?
There are 10,118 People in the Labor Forcein in Stevenson Ranch.
What is the Percentage of People in the Labor Force in Stevenson Ranch?
64.3% of People are in the Labor Force in Stevenson Ranch.
What is the Unemployment Rate in Stevenson Ranch?
Unemployment Rate in Stevenson Ranch is 9.3%.