Oakton, VA Map & Demographics
Oakton Map
Oakton Overview
$78,264
PER CAPITA INCOME
$190,068
AVG FAMILY INCOME
$158,343
AVG HOUSEHOLD INCOME
31.9%
WAGE / INCOME GAP [ % ]
68.1¢/ $1
WAGE / INCOME GAP [ $ ]
0.43
INEQUALITY / GINI INDEX
36,529
TOTAL POPULATION
18,234
MALE POPULATION
18,295
FEMALE POPULATION
99.67
MALES / 100 FEMALES
100.33
FEMALES / 100 MALES
39.5
MEDIAN AGE
3.2
AVG FAMILY SIZE
2.6
AVG HOUSEHOLD SIZE
20,808
LABOR FORCE [ PEOPLE ]
70.0%
PERCENT IN LABOR FORCE
3.3%
UNEMPLOYMENT RATE
Oakton Zip Codes
Income in Oakton
Income Overview in Oakton
Per Capita Income in Oakton is $78,264, while median incomes of families and households are $190,068 and $158,343 respectively.
| Characteristic | Number | Measure |
| Per Capita Income | 36,529 | $78,264 |
| Median Family Income | 9,194 | $190,068 |
| Mean Family Income | 9,194 | $234,169 |
| Median Household Income | 14,071 | $158,343 |
| Mean Household Income | 14,071 | $200,537 |
| Income Deficit | 9,194 | $0 |
| Wage / Income Gap (%) | 36,529 | 31.87% |
| Wage / Income Gap ($) | 36,529 | 68.13¢ per $1 |
| Gini / Inequality Index | 36,529 | 0.43 |
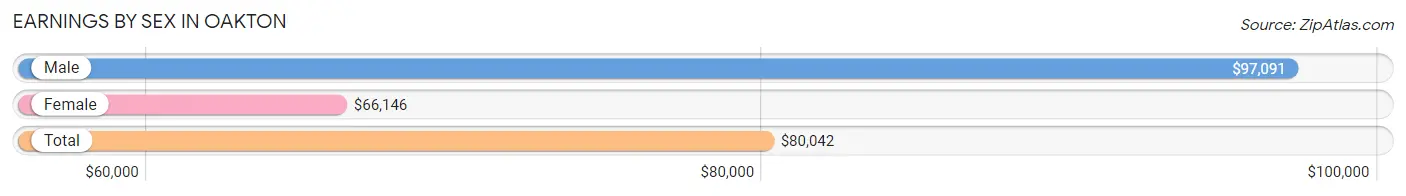
Earnings by Sex in Oakton
Average Earnings in Oakton are $80,042, $97,091 for men and $66,146 for women, a difference of 31.9%.
| Sex | Number | Average Earnings |
| Male | 11,624 (53.9%) | $97,091 |
| Female | 9,934 (46.1%) | $66,146 |
| Total | 21,558 (100.0%) | $80,042 |
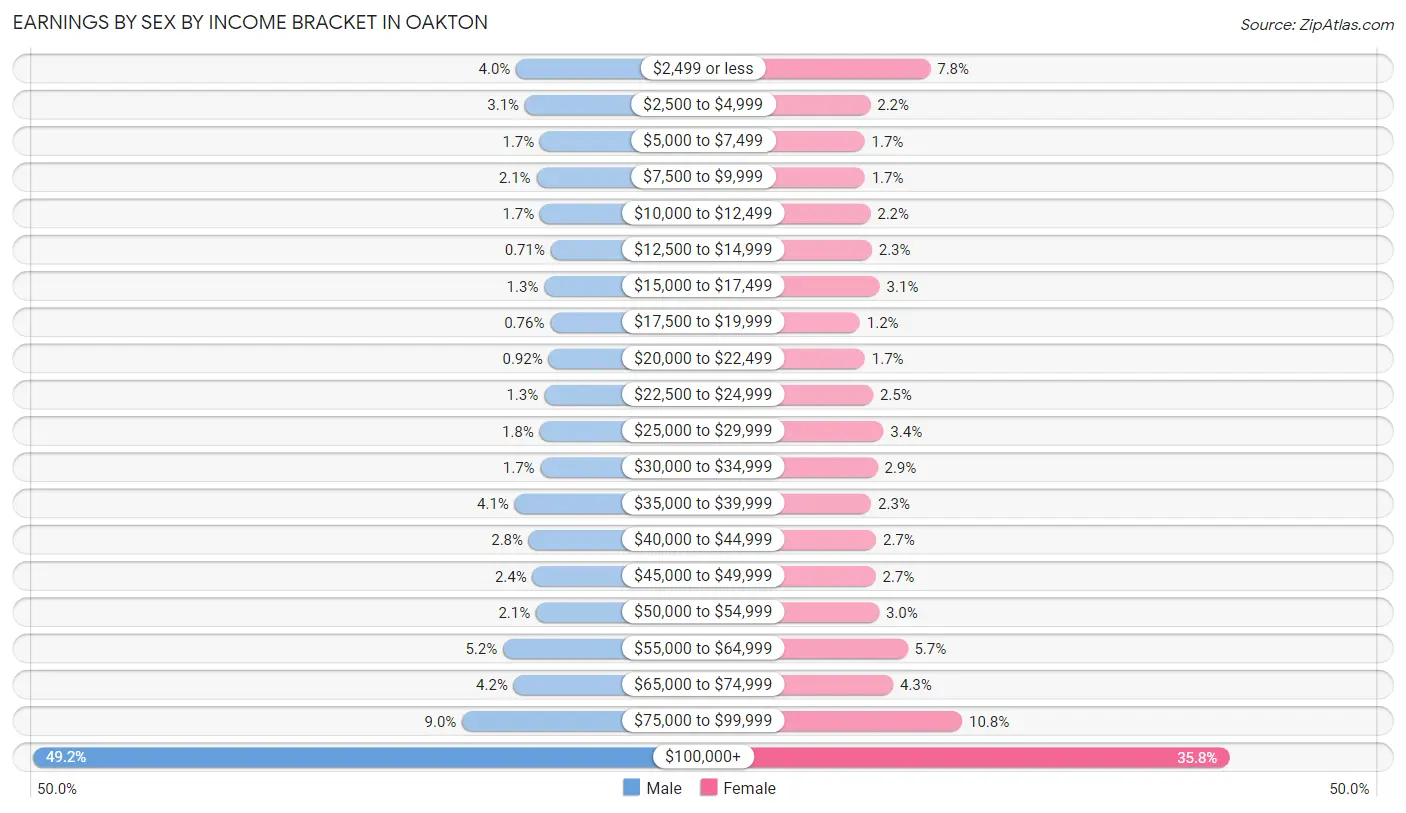
Earnings by Sex by Income Bracket in Oakton
The most common earnings brackets in Oakton are $100,000+ for men (5,721 | 49.2%) and $100,000+ for women (3,558 | 35.8%).
| Income | Male | Female |
| $2,499 or less | 459 (4.0%) | 777 (7.8%) |
| $2,500 to $4,999 | 364 (3.1%) | 219 (2.2%) |
| $5,000 to $7,499 | 199 (1.7%) | 166 (1.7%) |
| $7,500 to $9,999 | 238 (2.1%) | 167 (1.7%) |
| $10,000 to $12,499 | 199 (1.7%) | 219 (2.2%) |
| $12,500 to $14,999 | 83 (0.7%) | 232 (2.3%) |
| $15,000 to $17,499 | 154 (1.3%) | 306 (3.1%) |
| $17,500 to $19,999 | 88 (0.8%) | 121 (1.2%) |
| $20,000 to $22,499 | 107 (0.9%) | 168 (1.7%) |
| $22,500 to $24,999 | 156 (1.3%) | 243 (2.5%) |
| $25,000 to $29,999 | 205 (1.8%) | 341 (3.4%) |
| $30,000 to $34,999 | 195 (1.7%) | 286 (2.9%) |
| $35,000 to $39,999 | 476 (4.1%) | 226 (2.3%) |
| $40,000 to $44,999 | 321 (2.8%) | 272 (2.7%) |
| $45,000 to $49,999 | 281 (2.4%) | 267 (2.7%) |
| $50,000 to $54,999 | 243 (2.1%) | 299 (3.0%) |
| $55,000 to $64,999 | 602 (5.2%) | 564 (5.7%) |
| $65,000 to $74,999 | 486 (4.2%) | 430 (4.3%) |
| $75,000 to $99,999 | 1,047 (9.0%) | 1,073 (10.8%) |
| $100,000+ | 5,721 (49.2%) | 3,558 (35.8%) |
| Total | 11,624 (100.0%) | 9,934 (100.0%) |
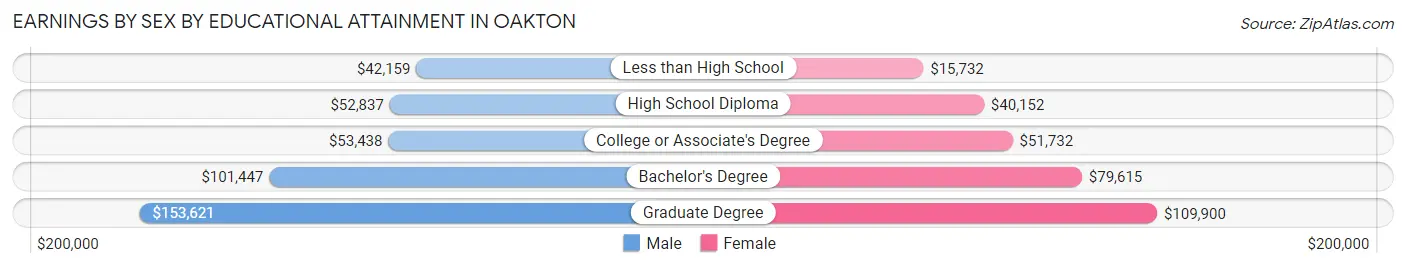
Earnings by Sex by Educational Attainment in Oakton
Average earnings in Oakton are $112,509 for men and $78,758 for women, a difference of 30.0%. Men with an educational attainment of graduate degree enjoy the highest average annual earnings of $153,621, while those with less than high school education earn the least with $42,159. Women with an educational attainment of graduate degree earn the most with the average annual earnings of $109,900, while those with less than high school education have the smallest earnings of $15,732.
| Educational Attainment | Male Income | Female Income |
| Less than High School | $42,159 | $15,732 |
| High School Diploma | $52,837 | $40,152 |
| College or Associate's Degree | $53,438 | $51,732 |
| Bachelor's Degree | $101,447 | $79,615 |
| Graduate Degree | $153,621 | $109,900 |
| Total | $112,509 | $78,758 |
Family Income in Oakton
Family Income Brackets in Oakton
According to the Oakton family income data, there are 4,275 families falling into the $200,000+ income range, which is the most common income bracket and makes up 46.5% of all families. Conversely, the $10,000 to $14,999 income bracket is the least frequent group with only 74 families (0.8%) belonging to this category.
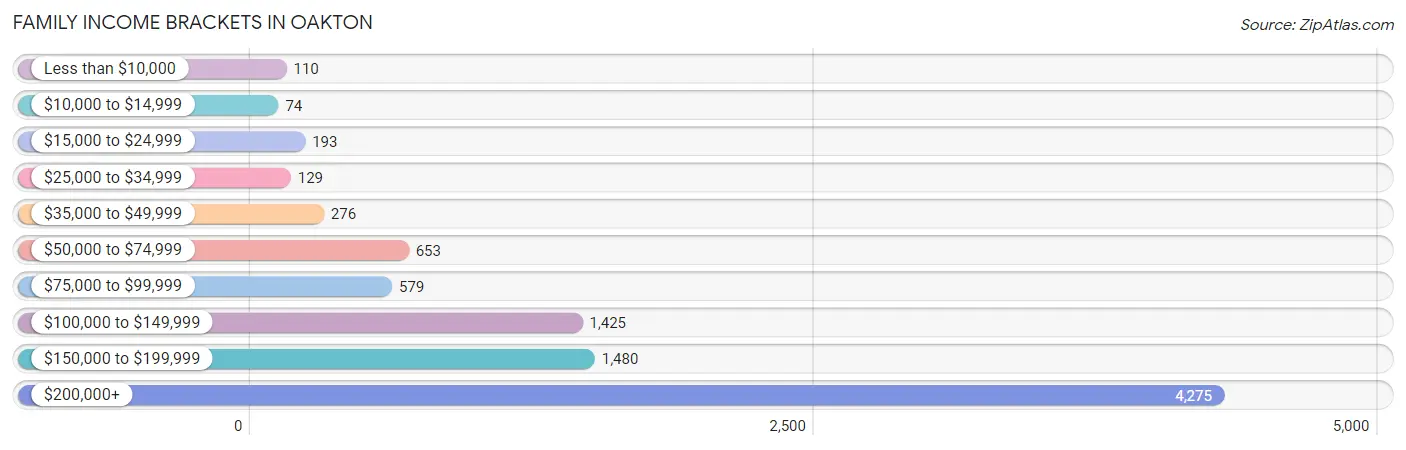
| Income Bracket | # Families | % Families |
| Less than $10,000 | 110 | 1.2% |
| $10,000 to $14,999 | 74 | 0.8% |
| $15,000 to $24,999 | 193 | 2.1% |
| $25,000 to $34,999 | 129 | 1.4% |
| $35,000 to $49,999 | 276 | 3.0% |
| $50,000 to $74,999 | 653 | 7.1% |
| $75,000 to $99,999 | 579 | 6.3% |
| $100,000 to $149,999 | 1,425 | 15.5% |
| $150,000 to $199,999 | 1,480 | 16.1% |
| $200,000+ | 4,275 | 46.5% |
Family Income by Famaliy Size in Oakton
7+ person families (160 | 1.7%) account for the highest median family income in Oakton with $250,001 per family, while 2-person families (4,026 | 43.8%) have the highest median income of $79,536 per family member.
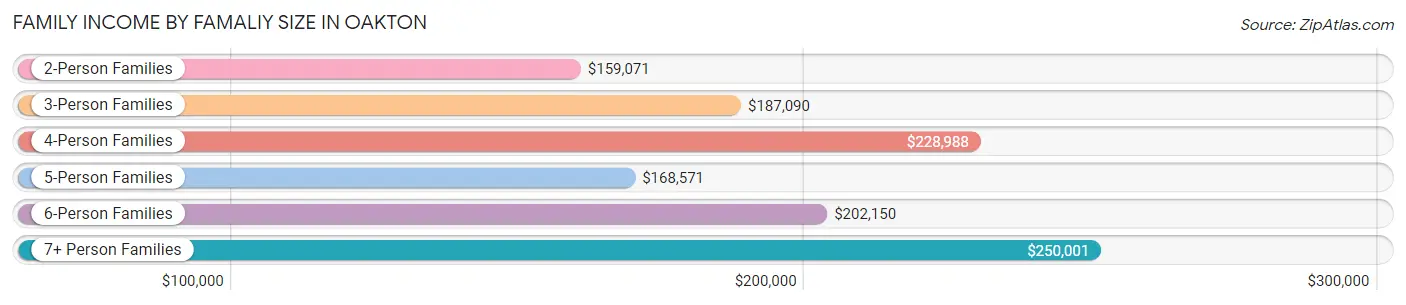
| Income Bracket | # Families | Median Income |
| 2-Person Families | 4,026 (43.8%) | $159,071 |
| 3-Person Families | 2,140 (23.3%) | $187,090 |
| 4-Person Families | 1,971 (21.4%) | $228,988 |
| 5-Person Families | 690 (7.5%) | $168,571 |
| 6-Person Families | 207 (2.2%) | $202,150 |
| 7+ Person Families | 160 (1.7%) | $250,001 |
| Total | 9,194 (100.0%) | $190,068 |
Family Income by Number of Earners in Oakton
The median family income in Oakton is $190,068, with families comprising 2 earners (4,846) having the highest median family income of $226,895, while families with no earners (765) have the lowest median family income of $116,776, accounting for 52.7% and 8.3% of families, respectively.
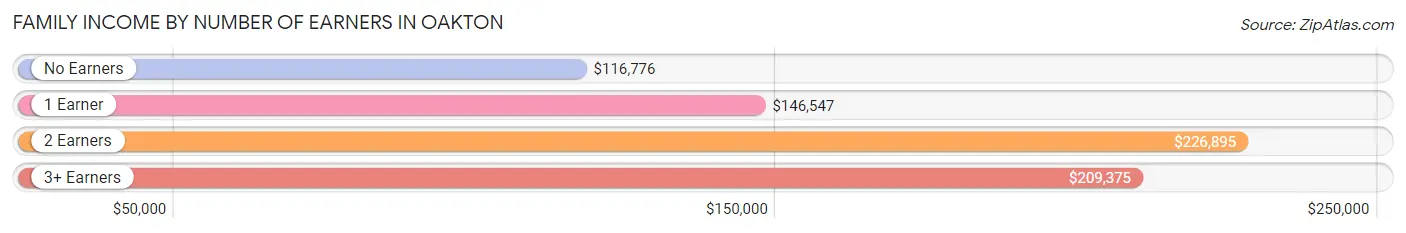
| Number of Earners | # Families | Median Income |
| No Earners | 765 (8.3%) | $116,776 |
| 1 Earner | 2,407 (26.2%) | $146,547 |
| 2 Earners | 4,846 (52.7%) | $226,895 |
| 3+ Earners | 1,176 (12.8%) | $209,375 |
| Total | 9,194 (100.0%) | $190,068 |
Household Income in Oakton
Household Income Brackets in Oakton
With 5,108 households falling in the category, the $200,000+ income range is the most frequent in Oakton, accounting for 36.3% of all households. In contrast, only 56 households (0.4%) fall into the $10,000 to $14,999 income bracket, making it the least populous group.
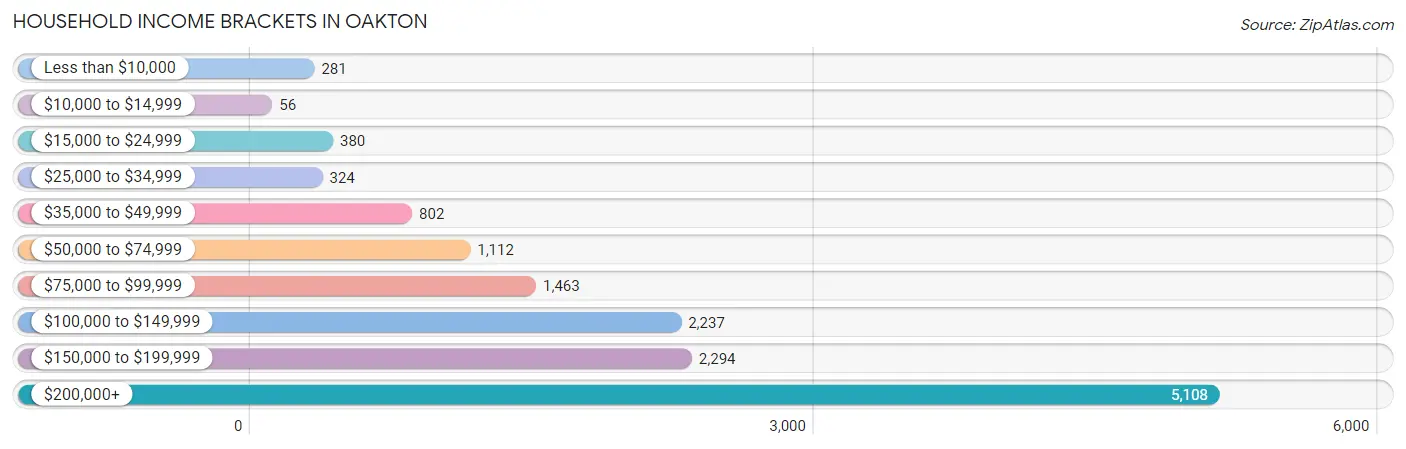
| Income Bracket | # Households | % Households |
| Less than $10,000 | 281 | 2.0% |
| $10,000 to $14,999 | 56 | 0.4% |
| $15,000 to $24,999 | 380 | 2.7% |
| $25,000 to $34,999 | 324 | 2.3% |
| $35,000 to $49,999 | 802 | 5.7% |
| $50,000 to $74,999 | 1,112 | 7.9% |
| $75,000 to $99,999 | 1,463 | 10.4% |
| $100,000 to $149,999 | 2,237 | 15.9% |
| $150,000 to $199,999 | 2,294 | 16.3% |
| $200,000+ | 5,108 | 36.3% |
Household Income by Householder Age in Oakton
The median household income in Oakton is $158,343, with the highest median household income of $177,560 found in the 45 to 64 years age bracket for the primary householder. A total of 5,403 households (38.4%) fall into this category. Meanwhile, the 15 to 24 years age bracket for the primary householder has the lowest median household income of $0, with 266 households (1.9%) in this group.
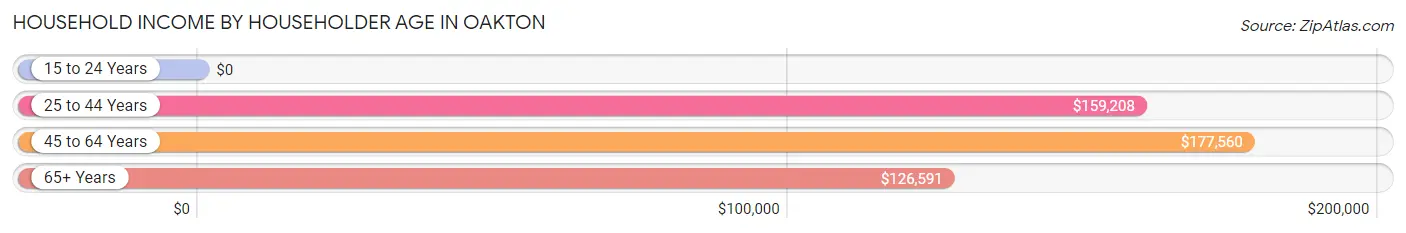
| Income Bracket | # Households | Median Income |
| 15 to 24 Years | 266 (1.9%) | $0 |
| 25 to 44 Years | 4,938 (35.1%) | $159,208 |
| 45 to 64 Years | 5,403 (38.4%) | $177,560 |
| 65+ Years | 3,464 (24.6%) | $126,591 |
| Total | 14,071 (100.0%) | $158,343 |
Poverty in Oakton
Income Below Poverty by Sex and Age in Oakton
With 5.1% poverty level for males and 4.5% for females among the residents of Oakton, 18 to 24 year old males and 16 and 17 year old females are the most vulnerable to poverty, with 339 males (21.2%) and 86 females (16.2%) in their respective age groups living below the poverty level.
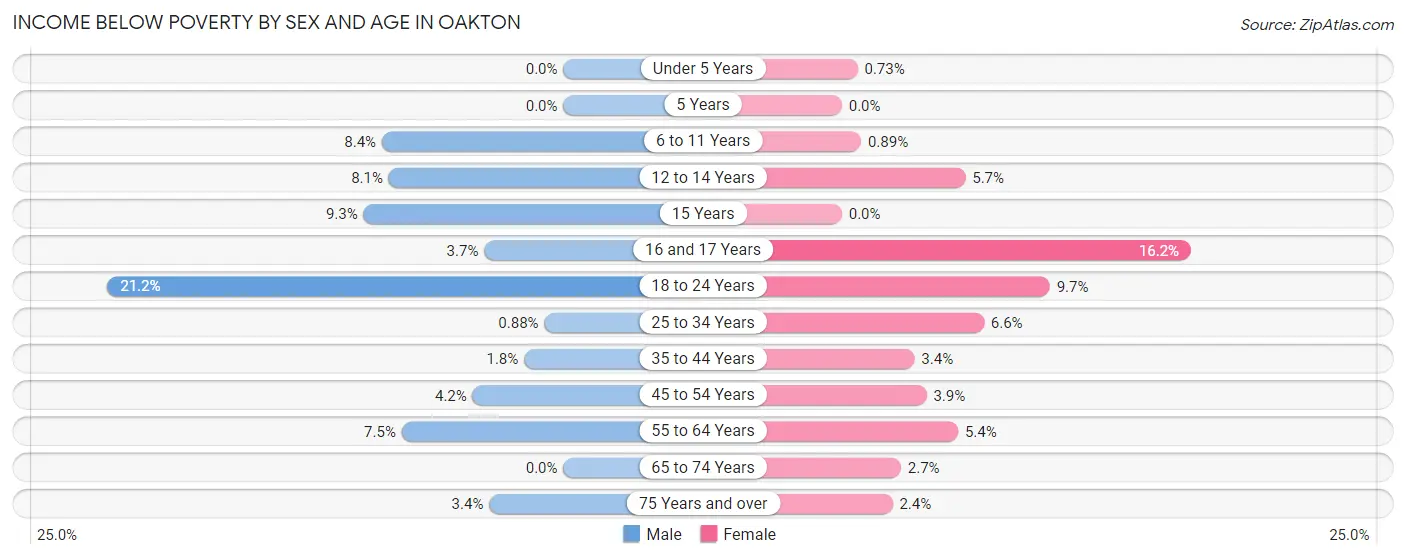
| Age Bracket | Male | Female |
| Under 5 Years | 0 (0.0%) | 7 (0.7%) |
| 5 Years | 0 (0.0%) | 0 (0.0%) |
| 6 to 11 Years | 92 (8.4%) | 12 (0.9%) |
| 12 to 14 Years | 66 (8.1%) | 33 (5.7%) |
| 15 Years | 33 (9.3%) | 0 (0.0%) |
| 16 and 17 Years | 22 (3.7%) | 86 (16.2%) |
| 18 to 24 Years | 339 (21.2%) | 135 (9.7%) |
| 25 to 34 Years | 23 (0.9%) | 160 (6.6%) |
| 35 to 44 Years | 49 (1.8%) | 86 (3.4%) |
| 45 to 54 Years | 109 (4.2%) | 112 (3.9%) |
| 55 to 64 Years | 161 (7.5%) | 113 (5.4%) |
| 65 to 74 Years | 0 (0.0%) | 48 (2.7%) |
| 75 Years and over | 35 (3.4%) | 30 (2.4%) |
| Total | 929 (5.1%) | 822 (4.5%) |
Income Above Poverty by Sex and Age in Oakton
According to the poverty statistics in Oakton, males aged under 5 years and females aged 5 years are the age groups that are most secure financially, with 100.0% of males and 100.0% of females in these age groups living above the poverty line.
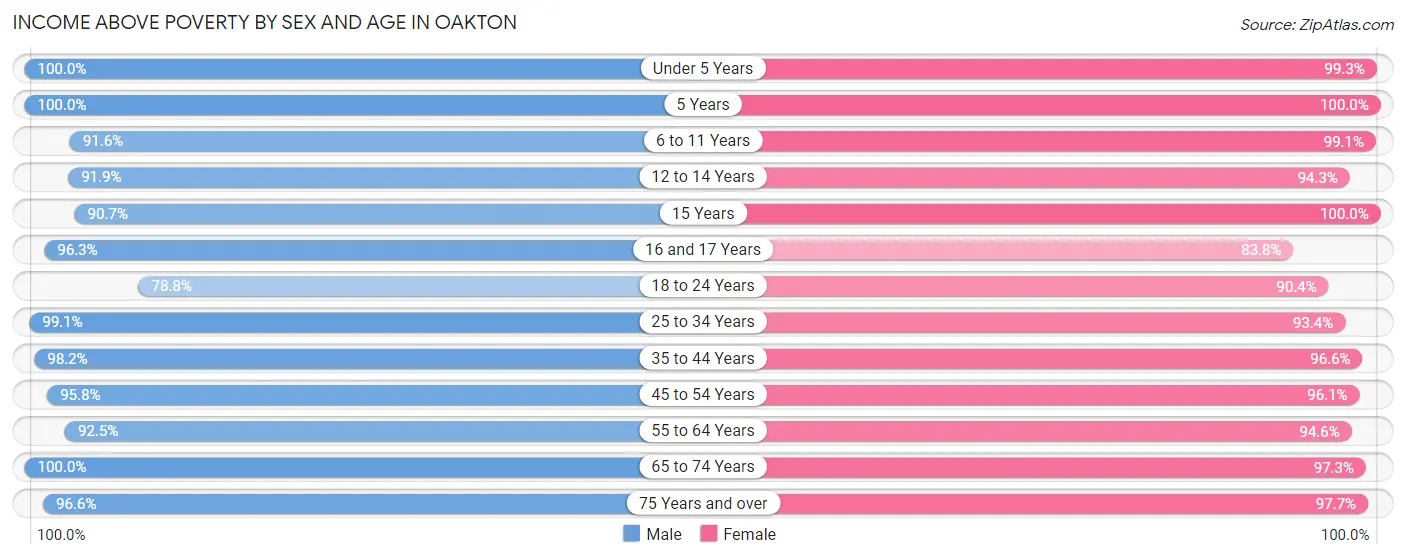
| Age Bracket | Male | Female |
| Under 5 Years | 910 (100.0%) | 956 (99.3%) |
| 5 Years | 177 (100.0%) | 231 (100.0%) |
| 6 to 11 Years | 1,001 (91.6%) | 1,332 (99.1%) |
| 12 to 14 Years | 749 (91.9%) | 543 (94.3%) |
| 15 Years | 323 (90.7%) | 255 (100.0%) |
| 16 and 17 Years | 577 (96.3%) | 445 (83.8%) |
| 18 to 24 Years | 1,263 (78.8%) | 1,264 (90.3%) |
| 25 to 34 Years | 2,585 (99.1%) | 2,267 (93.4%) |
| 35 to 44 Years | 2,648 (98.2%) | 2,465 (96.6%) |
| 45 to 54 Years | 2,482 (95.8%) | 2,737 (96.1%) |
| 55 to 64 Years | 1,985 (92.5%) | 1,985 (94.6%) |
| 65 to 74 Years | 1,577 (100.0%) | 1,704 (97.3%) |
| 75 Years and over | 981 (96.6%) | 1,247 (97.7%) |
| Total | 17,258 (94.9%) | 17,431 (95.5%) |
Income Below Poverty Among Married-Couple Families in Oakton
The poverty statistics for married-couple families in Oakton show that 1.1% or 84 of the total 7,655 families live below the poverty line. Families with 1 or 2 children have the highest poverty rate of 2.2%, comprising of 60 families. On the other hand, families with 3 or 4 children have the lowest poverty rate of 0.0%, which includes 0 families.
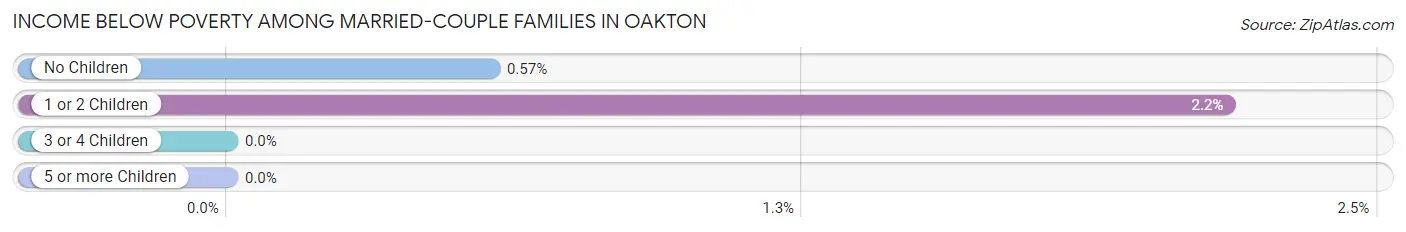
| Children | Above Poverty | Below Poverty |
| No Children | 4,153 (99.4%) | 24 (0.6%) |
| 1 or 2 Children | 2,711 (97.8%) | 60 (2.2%) |
| 3 or 4 Children | 697 (100.0%) | 0 (0.0%) |
| 5 or more Children | 10 (100.0%) | 0 (0.0%) |
| Total | 7,571 (98.9%) | 84 (1.1%) |
Income Below Poverty Among Single-Parent Households in Oakton
According to the poverty data in Oakton, 8.6% or 50 single-father households and 15.6% or 149 single-mother households are living below the poverty line. Among single-father households, those with 1 or 2 children have the highest poverty rate, with 50 households (15.5%) experiencing poverty. Likewise, among single-mother households, those with 1 or 2 children have the highest poverty rate, with 99 households (21.8%) falling below the poverty line.
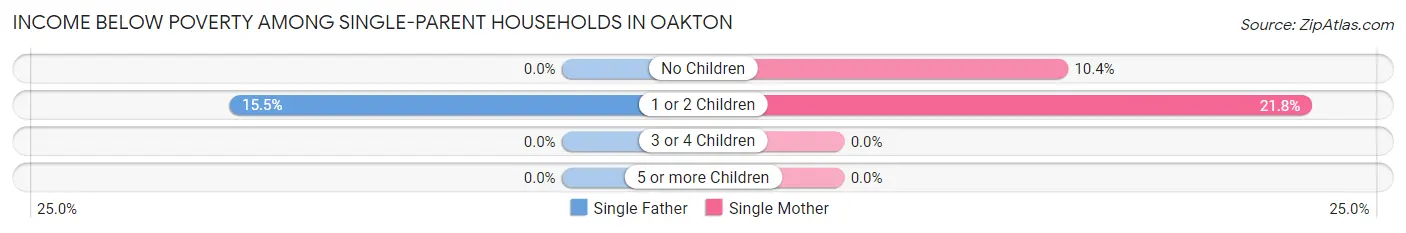
| Children | Single Father | Single Mother |
| No Children | 0 (0.0%) | 50 (10.4%) |
| 1 or 2 Children | 50 (15.5%) | 99 (21.8%) |
| 3 or 4 Children | 0 (0.0%) | 0 (0.0%) |
| 5 or more Children | 0 (0.0%) | 0 (0.0%) |
| Total | 50 (8.6%) | 149 (15.6%) |
Income Below Poverty Among Married-Couple vs Single-Parent Households in Oakton
The poverty data for Oakton shows that 84 of the married-couple family households (1.1%) and 199 of the single-parent households (12.9%) are living below the poverty level. Within the married-couple family households, those with 1 or 2 children have the highest poverty rate, with 60 households (2.2%) falling below the poverty line. Among the single-parent households, those with 1 or 2 children have the highest poverty rate, with 149 household (19.2%) living below poverty.
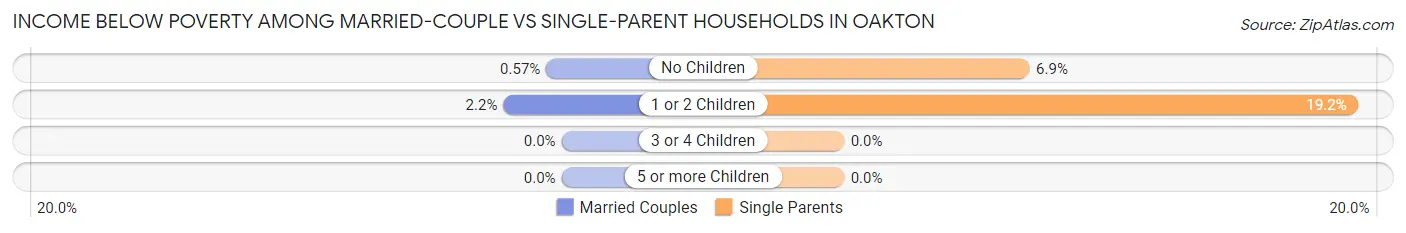
| Children | Married-Couple Families | Single-Parent Households |
| No Children | 24 (0.6%) | 50 (6.9%) |
| 1 or 2 Children | 60 (2.2%) | 149 (19.2%) |
| 3 or 4 Children | 0 (0.0%) | 0 (0.0%) |
| 5 or more Children | 0 (0.0%) | 0 (0.0%) |
| Total | 84 (1.1%) | 199 (12.9%) |
Race in Oakton
The most populous races in Oakton are White / Caucasian (21,109 | 57.8%), Asian (8,644 | 23.7%), and Hispanic or Latino (4,244 | 11.6%).
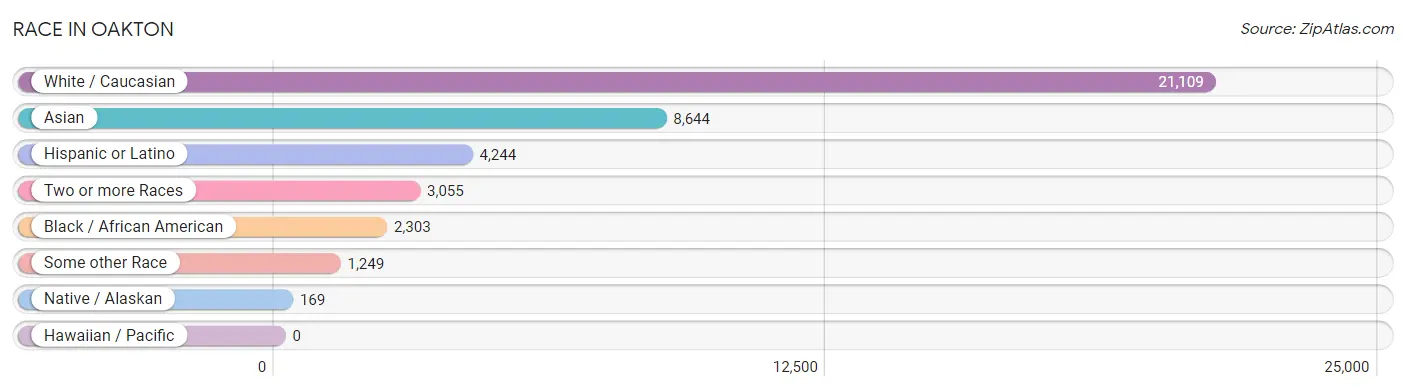
| Race | # Population | % Population |
| Asian | 8,644 | 23.7% |
| Black / African American | 2,303 | 6.3% |
| Hawaiian / Pacific | 0 | 0.0% |
| Hispanic or Latino | 4,244 | 11.6% |
| Native / Alaskan | 169 | 0.5% |
| White / Caucasian | 21,109 | 57.8% |
| Two or more Races | 3,055 | 8.4% |
| Some other Race | 1,249 | 3.4% |
| Total | 36,529 | 100.0% |
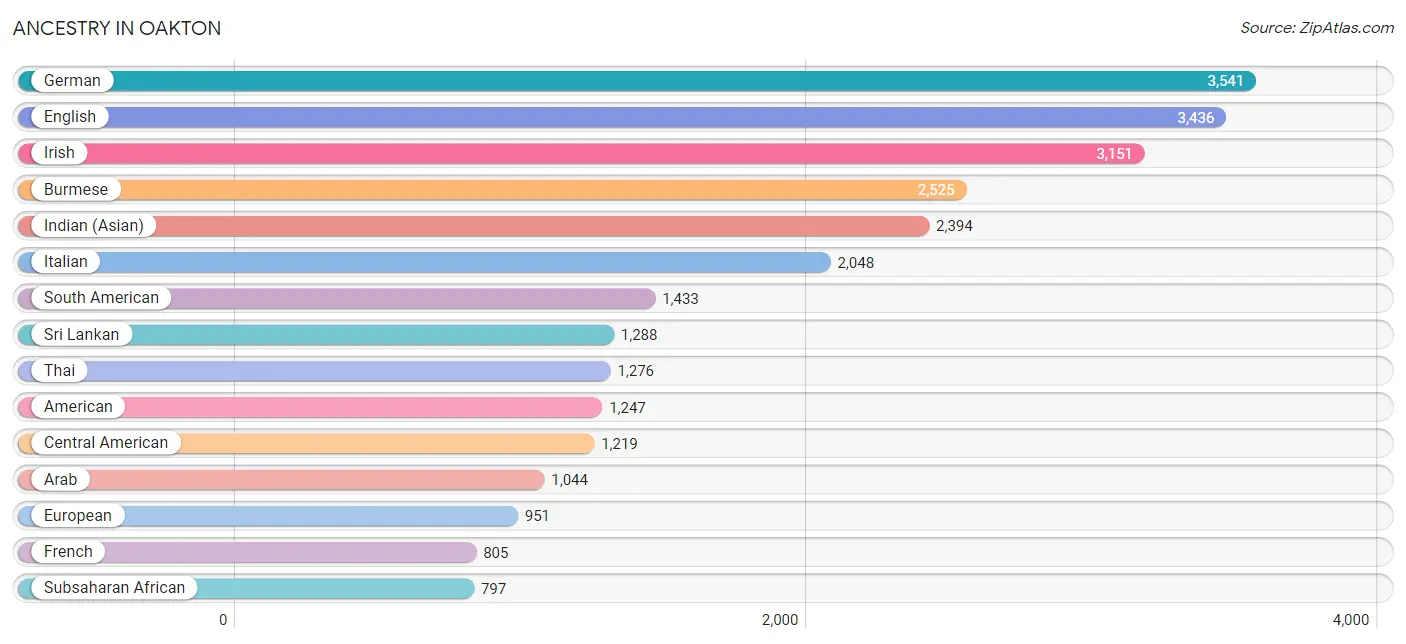
Ancestry in Oakton
The most populous ancestries reported in Oakton are German (3,541 | 9.7%), English (3,436 | 9.4%), Irish (3,151 | 8.6%), Burmese (2,525 | 6.9%), and Indian (Asian) (2,394 | 6.6%), together accounting for 41.2% of all Oakton residents.
| Ancestry | # Population | % Population |
| Afghan | 115 | 0.3% |
| African | 203 | 0.6% |
| Albanian | 78 | 0.2% |
| American | 1,247 | 3.4% |
| Arab | 1,044 | 2.9% |
| Argentinean | 54 | 0.2% |
| Armenian | 57 | 0.2% |
| Australian | 42 | 0.1% |
| Austrian | 143 | 0.4% |
| Barbadian | 16 | 0.0% |
| Belgian | 109 | 0.3% |
| Bhutanese | 339 | 0.9% |
| Bolivian | 326 | 0.9% |
| Brazilian | 85 | 0.2% |
| British | 317 | 0.9% |
| Bulgarian | 3 | 0.0% |
| Burmese | 2,525 | 6.9% |
| Canadian | 65 | 0.2% |
| Celtic | 18 | 0.1% |
| Central American | 1,219 | 3.3% |
| Central American Indian | 45 | 0.1% |
| Cherokee | 82 | 0.2% |
| Chickasaw | 15 | 0.0% |
| Chilean | 43 | 0.1% |
| Colombian | 346 | 0.9% |
| Costa Rican | 9 | 0.0% |
| Creek | 8 | 0.0% |
| Croatian | 28 | 0.1% |
| Cuban | 130 | 0.4% |
| Czech | 322 | 0.9% |
| Czechoslovakian | 20 | 0.1% |
| Danish | 144 | 0.4% |
| Dutch | 202 | 0.5% |
| Eastern European | 278 | 0.8% |
| Ecuadorian | 70 | 0.2% |
| Egyptian | 349 | 1.0% |
| English | 3,436 | 9.4% |
| Ethiopian | 442 | 1.2% |
| European | 951 | 2.6% |
| Filipino | 45 | 0.1% |
| Finnish | 61 | 0.2% |
| French | 805 | 2.2% |
| French Canadian | 47 | 0.1% |
| German | 3,541 | 9.7% |
| Greek | 357 | 1.0% |
| Guatemalan | 309 | 0.9% |
| Honduran | 148 | 0.4% |
| Hungarian | 215 | 0.6% |
| Indian (Asian) | 2,394 | 6.6% |
| Iranian | 278 | 0.8% |
| Iraqi | 92 | 0.3% |
| Irish | 3,151 | 8.6% |
| Iroquois | 28 | 0.1% |
| Israeli | 1 | 0.0% |
| Italian | 2,048 | 5.6% |
| Jamaican | 28 | 0.1% |
| Japanese | 89 | 0.2% |
| Korean | 683 | 1.9% |
| Laotian | 50 | 0.1% |
| Latvian | 51 | 0.1% |
| Lebanese | 67 | 0.2% |
| Lithuanian | 61 | 0.2% |
| Macedonian | 26 | 0.1% |
| Malaysian | 87 | 0.2% |
| Mexican | 577 | 1.6% |
| Mongolian | 97 | 0.3% |
| Moroccan | 14 | 0.0% |
| Native Hawaiian | 11 | 0.0% |
| New Zealander | 8 | 0.0% |
| Nicaraguan | 35 | 0.1% |
| Nigerian | 10 | 0.0% |
| Northern European | 29 | 0.1% |
| Norwegian | 313 | 0.9% |
| Pakistani | 83 | 0.2% |
| Palestinian | 191 | 0.5% |
| Panamanian | 23 | 0.1% |
| Peruvian | 430 | 1.2% |
| Polish | 778 | 2.1% |
| Portuguese | 133 | 0.4% |
| Puerto Rican | 345 | 0.9% |
| Romanian | 119 | 0.3% |
| Russian | 478 | 1.3% |
| Salvadoran | 695 | 1.9% |
| Scandinavian | 112 | 0.3% |
| Scotch-Irish | 328 | 0.9% |
| Scottish | 499 | 1.4% |
| Serbian | 32 | 0.1% |
| Slavic | 160 | 0.4% |
| Slovak | 88 | 0.2% |
| Somali | 106 | 0.3% |
| South African | 10 | 0.0% |
| South American | 1,433 | 3.9% |
| South American Indian | 46 | 0.1% |
| Spaniard | 356 | 1.0% |
| Spanish | 75 | 0.2% |
| Sri Lankan | 1,288 | 3.5% |
| Subsaharan African | 797 | 2.2% |
| Swedish | 364 | 1.0% |
| Swiss | 217 | 0.6% |
| Syrian | 110 | 0.3% |
| Thai | 1,276 | 3.5% |
| Turkish | 324 | 0.9% |
| Ukrainian | 80 | 0.2% |
| Venezuelan | 94 | 0.3% |
| Vietnamese | 199 | 0.5% |
| Welsh | 184 | 0.5% |
| West Indian | 76 | 0.2% | View All 107 Rows |
Immigrants in Oakton
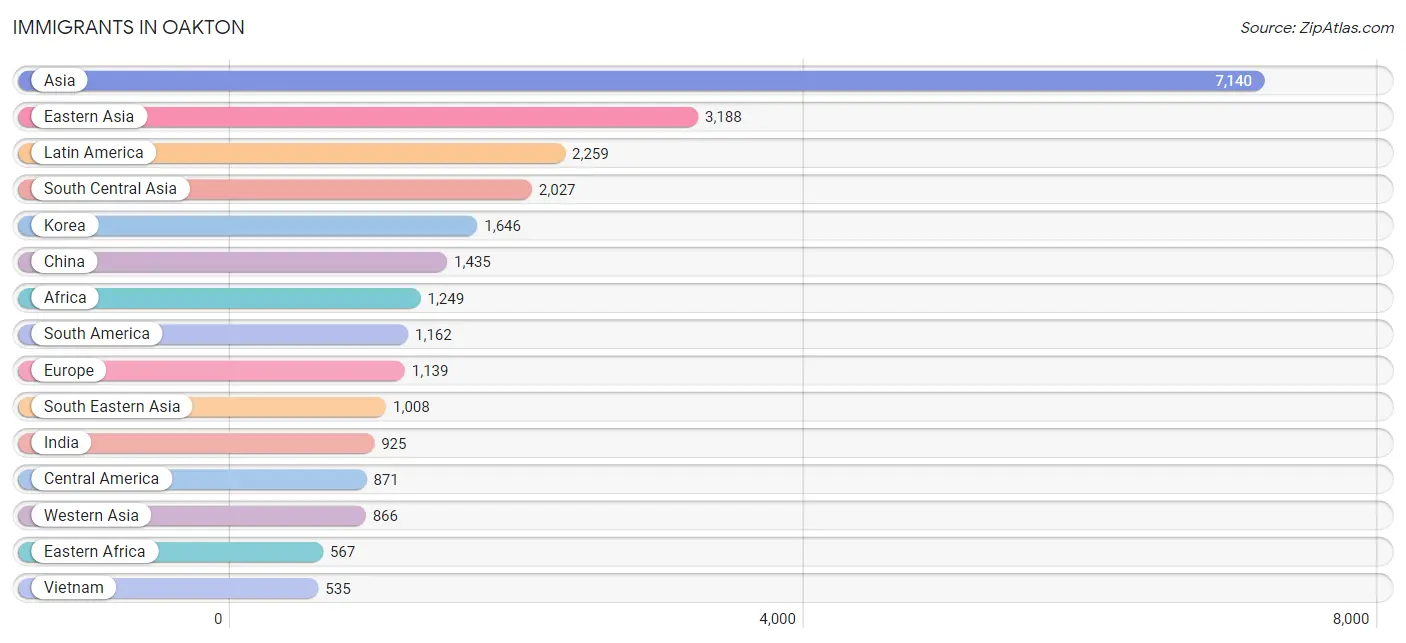
The most numerous immigrant groups reported in Oakton came from Asia (7,140 | 19.6%), Eastern Asia (3,188 | 8.7%), Latin America (2,259 | 6.2%), South Central Asia (2,027 | 5.6%), and Korea (1,646 | 4.5%), together accounting for 44.5% of all Oakton residents.
| Immigration Origin | # Population | % Population |
| Afghanistan | 73 | 0.2% |
| Africa | 1,249 | 3.4% |
| Albania | 20 | 0.1% |
| Argentina | 12 | 0.0% |
| Armenia | 135 | 0.4% |
| Asia | 7,140 | 19.6% |
| Australia | 82 | 0.2% |
| Austria | 15 | 0.0% |
| Bangladesh | 127 | 0.4% |
| Barbados | 42 | 0.1% |
| Belarus | 9 | 0.0% |
| Belgium | 39 | 0.1% |
| Bolivia | 263 | 0.7% |
| Brazil | 125 | 0.3% |
| Bulgaria | 3 | 0.0% |
| Cambodia | 54 | 0.2% |
| Cameroon | 17 | 0.1% |
| Canada | 57 | 0.2% |
| Caribbean | 226 | 0.6% |
| Central America | 871 | 2.4% |
| Chile | 31 | 0.1% |
| China | 1,435 | 3.9% |
| Colombia | 237 | 0.6% |
| Costa Rica | 9 | 0.0% |
| Cuba | 85 | 0.2% |
| Czechoslovakia | 7 | 0.0% |
| Eastern Africa | 567 | 1.5% |
| Eastern Asia | 3,188 | 8.7% |
| Eastern Europe | 452 | 1.2% |
| Ecuador | 33 | 0.1% |
| Egypt | 461 | 1.3% |
| El Salvador | 451 | 1.2% |
| England | 71 | 0.2% |
| Eritrea | 58 | 0.2% |
| Ethiopia | 459 | 1.3% |
| Europe | 1,139 | 3.1% |
| France | 10 | 0.0% |
| Germany | 106 | 0.3% |
| Ghana | 68 | 0.2% |
| Greece | 68 | 0.2% |
| Guatemala | 79 | 0.2% |
| Honduras | 135 | 0.4% |
| Hong Kong | 52 | 0.1% |
| India | 925 | 2.5% |
| Indonesia | 35 | 0.1% |
| Iran | 199 | 0.5% |
| Iraq | 96 | 0.3% |
| Ireland | 22 | 0.1% |
| Israel | 42 | 0.1% |
| Italy | 40 | 0.1% |
| Jamaica | 22 | 0.1% |
| Japan | 107 | 0.3% |
| Jordan | 14 | 0.0% |
| Kenya | 3 | 0.0% |
| Korea | 1,646 | 4.5% |
| Laos | 43 | 0.1% |
| Latin America | 2,259 | 6.2% |
| Latvia | 21 | 0.1% |
| Lebanon | 32 | 0.1% |
| Malaysia | 34 | 0.1% |
| Mexico | 182 | 0.5% |
| Middle Africa | 17 | 0.1% |
| Morocco | 14 | 0.0% |
| Nepal | 409 | 1.1% |
| Netherlands | 53 | 0.2% |
| Northern Africa | 491 | 1.3% |
| Northern Europe | 258 | 0.7% |
| Oceania | 97 | 0.3% |
| Pakistan | 156 | 0.4% |
| Panama | 15 | 0.0% |
| Peru | 457 | 1.3% |
| Philippines | 277 | 0.8% |
| Poland | 40 | 0.1% |
| Portugal | 23 | 0.1% |
| Romania | 122 | 0.3% |
| Russia | 71 | 0.2% |
| Saudi Arabia | 75 | 0.2% |
| Scotland | 12 | 0.0% |
| Serbia | 32 | 0.1% |
| Somalia | 15 | 0.0% |
| South Africa | 10 | 0.0% |
| South America | 1,162 | 3.2% |
| South Central Asia | 2,027 | 5.6% |
| South Eastern Asia | 1,008 | 2.8% |
| Southern Europe | 179 | 0.5% |
| Spain | 48 | 0.1% |
| St. Vincent and the Grenadines | 44 | 0.1% |
| Sweden | 14 | 0.0% |
| Switzerland | 27 | 0.1% |
| Syria | 115 | 0.3% |
| Taiwan | 106 | 0.3% |
| Thailand | 24 | 0.1% |
| Trinidad and Tobago | 33 | 0.1% |
| Turkey | 217 | 0.6% |
| Uganda | 32 | 0.1% |
| Ukraine | 77 | 0.2% |
| Uzbekistan | 8 | 0.0% |
| Venezuela | 4 | 0.0% |
| Vietnam | 535 | 1.5% |
| Western Africa | 77 | 0.2% |
| Western Asia | 866 | 2.4% |
| Western Europe | 250 | 0.7% | View All 102 Rows |
Sex and Age in Oakton
Sex and Age in Oakton
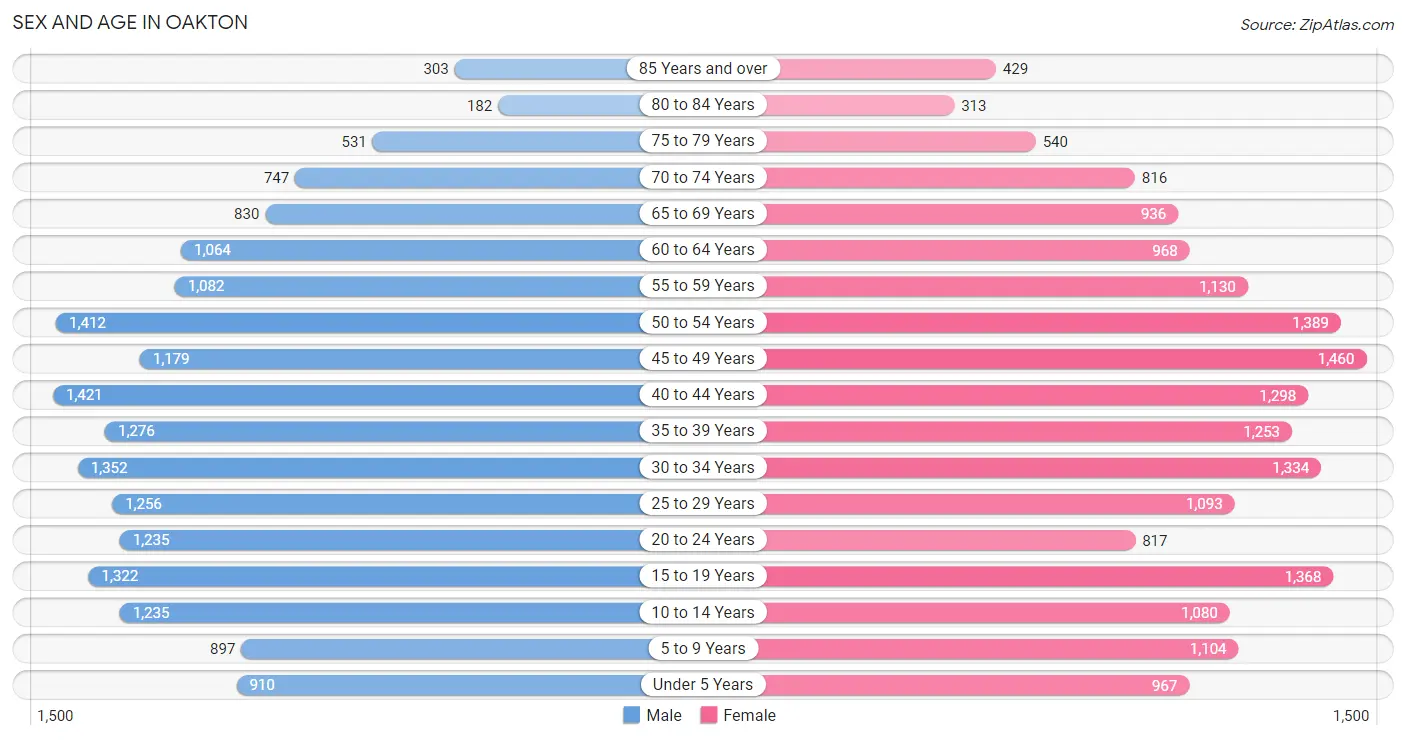
The most populous age groups in Oakton are 40 to 44 Years (1,421 | 7.8%) for men and 45 to 49 Years (1,460 | 8.0%) for women.
| Age Bracket | Male | Female |
| Under 5 Years | 910 (5.0%) | 967 (5.3%) |
| 5 to 9 Years | 897 (4.9%) | 1,104 (6.0%) |
| 10 to 14 Years | 1,235 (6.8%) | 1,080 (5.9%) |
| 15 to 19 Years | 1,322 (7.2%) | 1,368 (7.5%) |
| 20 to 24 Years | 1,235 (6.8%) | 817 (4.5%) |
| 25 to 29 Years | 1,256 (6.9%) | 1,093 (6.0%) |
| 30 to 34 Years | 1,352 (7.4%) | 1,334 (7.3%) |
| 35 to 39 Years | 1,276 (7.0%) | 1,253 (6.9%) |
| 40 to 44 Years | 1,421 (7.8%) | 1,298 (7.1%) |
| 45 to 49 Years | 1,179 (6.5%) | 1,460 (8.0%) |
| 50 to 54 Years | 1,412 (7.7%) | 1,389 (7.6%) |
| 55 to 59 Years | 1,082 (5.9%) | 1,130 (6.2%) |
| 60 to 64 Years | 1,064 (5.8%) | 968 (5.3%) |
| 65 to 69 Years | 830 (4.5%) | 936 (5.1%) |
| 70 to 74 Years | 747 (4.1%) | 816 (4.5%) |
| 75 to 79 Years | 531 (2.9%) | 540 (2.9%) |
| 80 to 84 Years | 182 (1.0%) | 313 (1.7%) |
| 85 Years and over | 303 (1.7%) | 429 (2.3%) |
| Total | 18,234 (100.0%) | 18,295 (100.0%) |
Families and Households in Oakton
Median Family Size in Oakton
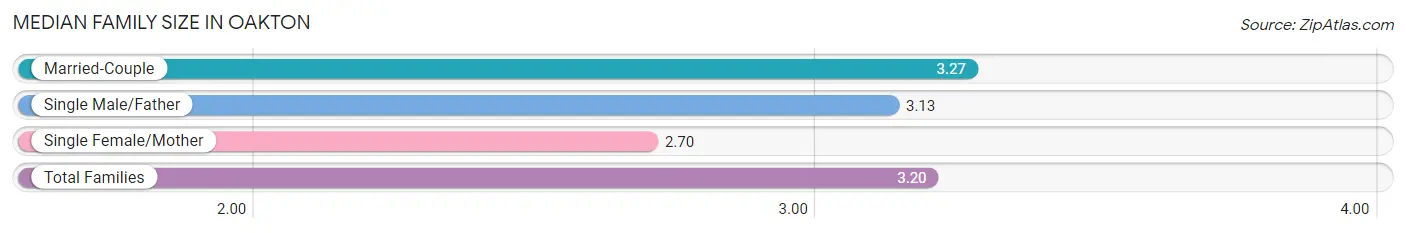
The median family size in Oakton is 3.20 persons per family, with married-couple families (7,655 | 83.3%) accounting for the largest median family size of 3.27 persons per family. On the other hand, single female/mother families (954 | 10.4%) represent the smallest median family size with 2.70 persons per family.
| Family Type | # Families | Family Size |
| Married-Couple | 7,655 (83.3%) | 3.27 |
| Single Male/Father | 585 (6.4%) | 3.13 |
| Single Female/Mother | 954 (10.4%) | 2.70 |
| Total Families | 9,194 (100.0%) | 3.20 |
Median Household Size in Oakton
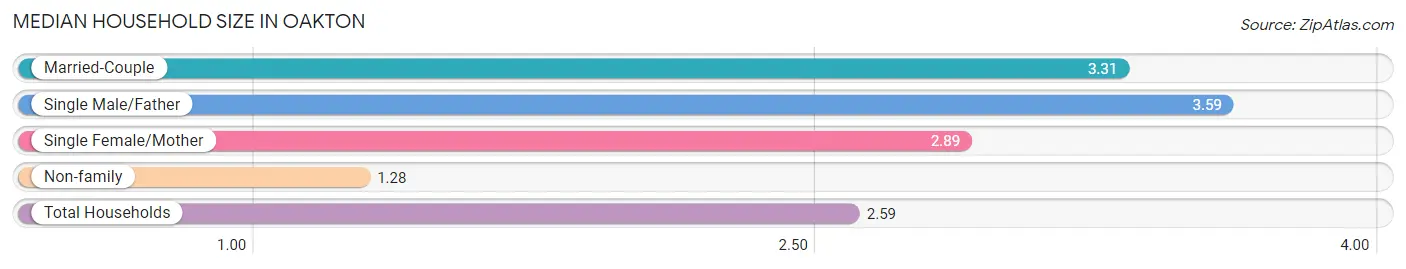
The median household size in Oakton is 2.59 persons per household, with single male/father households (585 | 4.2%) accounting for the largest median household size of 3.59 persons per household. non-family households (4,877 | 34.7%) represent the smallest median household size with 1.28 persons per household.
| Household Type | # Households | Household Size |
| Married-Couple | 7,655 (54.4%) | 3.31 |
| Single Male/Father | 585 (4.2%) | 3.59 |
| Single Female/Mother | 954 (6.8%) | 2.89 |
| Non-family | 4,877 (34.7%) | 1.28 |
| Total Households | 14,071 (100.0%) | 2.59 |
Household Size by Marriage Status in Oakton
Out of a total of 14,071 households in Oakton, 9,194 (65.3%) are family households, while 4,877 (34.7%) are nonfamily households. The most numerous type of family households are 2-person households, comprising 3,879, and the most common type of nonfamily households are 1-person households, comprising 3,843.
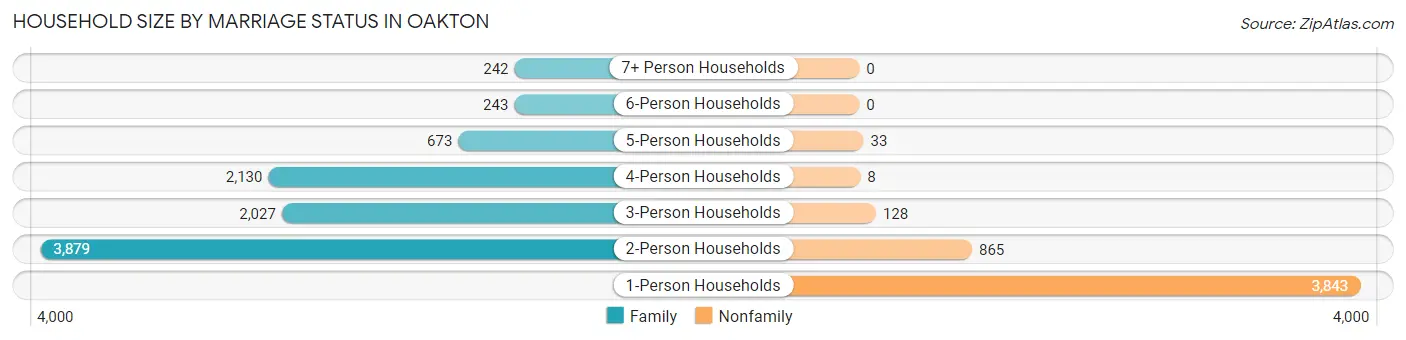
| Household Size | Family Households | Nonfamily Households |
| 1-Person Households | - | 3,843 (27.3%) |
| 2-Person Households | 3,879 (27.6%) | 865 (6.1%) |
| 3-Person Households | 2,027 (14.4%) | 128 (0.9%) |
| 4-Person Households | 2,130 (15.1%) | 8 (0.1%) |
| 5-Person Households | 673 (4.8%) | 33 (0.2%) |
| 6-Person Households | 243 (1.7%) | 0 (0.0%) |
| 7+ Person Households | 242 (1.7%) | 0 (0.0%) |
| Total | 9,194 (65.3%) | 4,877 (34.7%) |
Female Fertility in Oakton
Fertility by Age in Oakton
Average fertility rate in Oakton is 42.0 births per 1,000 women. Women in the age bracket of 35 to 50 years have the highest fertility rate with 50.0 births per 1,000 women. Women in the age bracket of 35 to 50 years acount for 58.5% of all women with births.
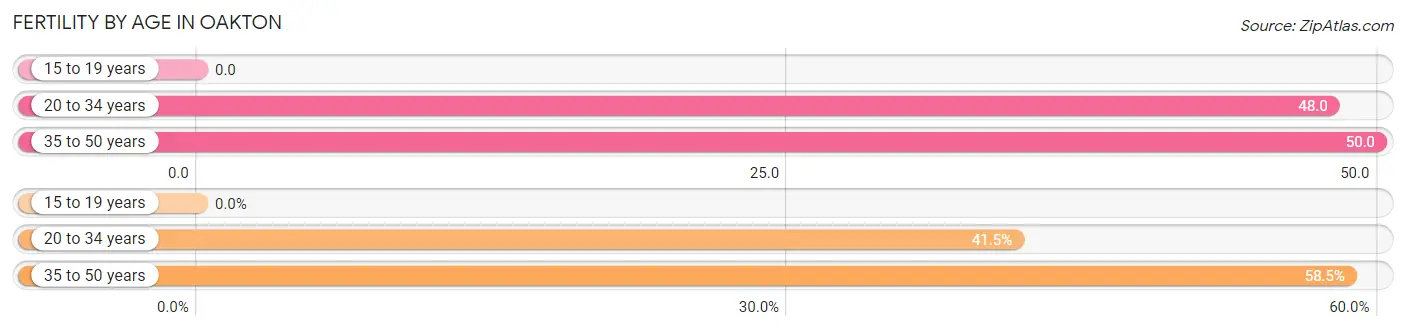
| Age Bracket | Women with Births | Births / 1,000 Women |
| 15 to 19 years | 0 (0.0%) | 0.0 |
| 20 to 34 years | 157 (41.5%) | 48.0 |
| 35 to 50 years | 221 (58.5%) | 50.0 |
| Total | 378 (100.0%) | 42.0 |
Fertility by Age by Marriage Status in Oakton
84.4% of women with births (378) in Oakton are married. The highest percentage of unmarried women with births falls into 35 to 50 years age bracket with 20.8% of them unmarried at the time of birth, while the lowest percentage of unmarried women with births belong to 20 to 34 years age bracket with 8.3% of them unmarried.
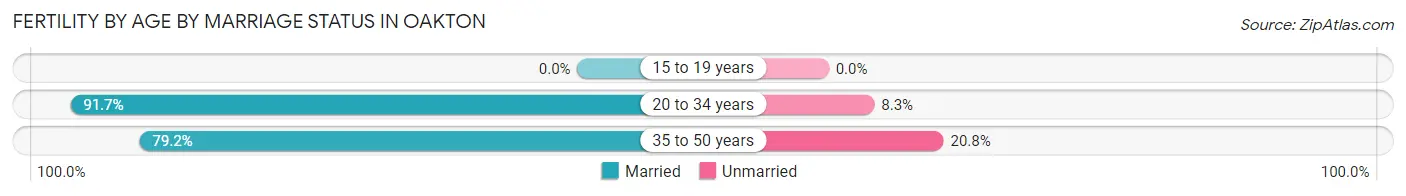
| Age Bracket | Married | Unmarried |
| 15 to 19 years | 0 (0.0%) | 0 (0.0%) |
| 20 to 34 years | 144 (91.7%) | 13 (8.3%) |
| 35 to 50 years | 175 (79.2%) | 46 (20.8%) |
| Total | 319 (84.4%) | 59 (15.6%) |
Fertility by Education in Oakton
Average fertility rate in Oakton is 42.0 births per 1,000 women. Women with the education attainment of graduate degree have the highest fertility rate of 82.0 births per 1,000 women, while women with the education attainment of less than high school have the lowest fertility at 9.0 births per 1,000 women. Women with the education attainment of graduate degree represent 61.1% of all women with births.
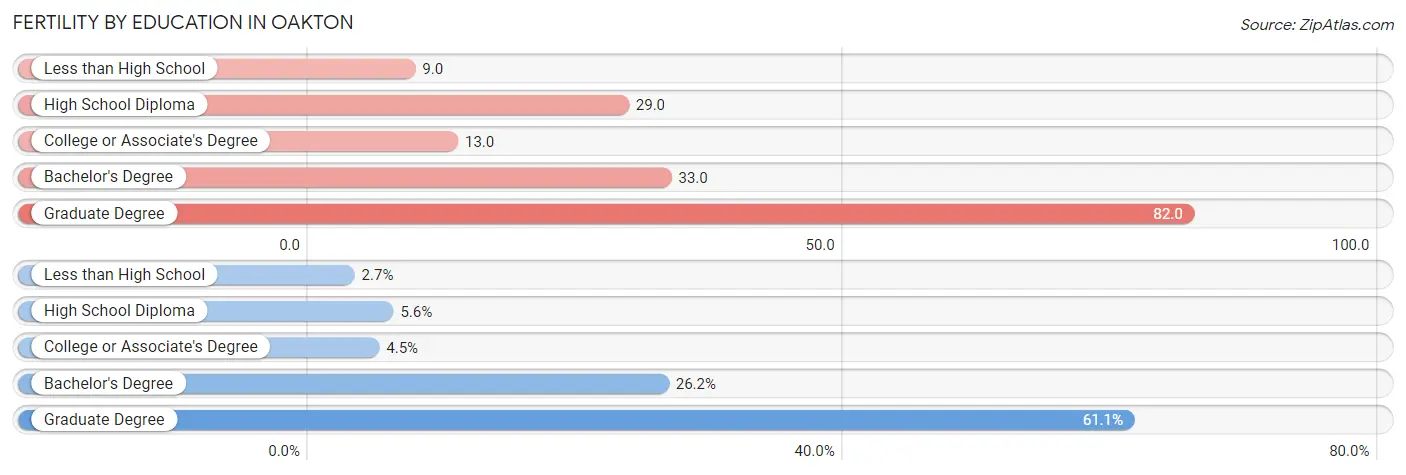
| Educational Attainment | Women with Births | Births / 1,000 Women |
| Less than High School | 10 (2.6%) | 9.0 |
| High School Diploma | 21 (5.6%) | 29.0 |
| College or Associate's Degree | 17 (4.5%) | 13.0 |
| Bachelor's Degree | 99 (26.2%) | 33.0 |
| Graduate Degree | 231 (61.1%) | 82.0 |
| Total | 378 (100.0%) | 42.0 |
Fertility by Education by Marriage Status in Oakton
15.6% of women with births in Oakton are unmarried. Women with the educational attainment of less than high school are most likely to be married with 100.0% of them married at childbirth, while women with the educational attainment of college or associate's degree are least likely to be married with 100.0% of them unmarried at childbirth.
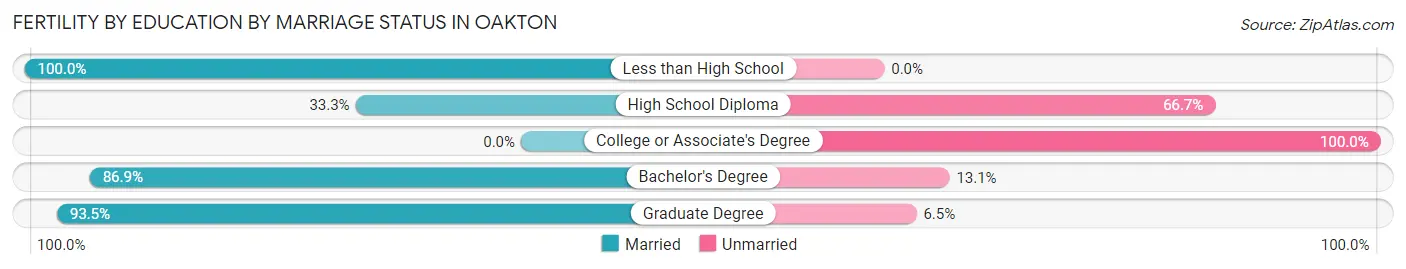
| Educational Attainment | Married | Unmarried |
| Less than High School | 10 (100.0%) | 0 (0.0%) |
| High School Diploma | 7 (33.3%) | 14 (66.7%) |
| College or Associate's Degree | 0 (0.0%) | 17 (100.0%) |
| Bachelor's Degree | 86 (86.9%) | 13 (13.1%) |
| Graduate Degree | 216 (93.5%) | 15 (6.5%) |
| Total | 319 (84.4%) | 59 (15.6%) |
Employment Characteristics in Oakton
Employment by Class of Employer in Oakton
Among the 19,796 employed individuals in Oakton, private company employees (11,298 | 57.1%), federal government employees (3,282 | 16.6%), and not-for-profit organizations (1,827 | 9.2%) make up the most common classes of employment.
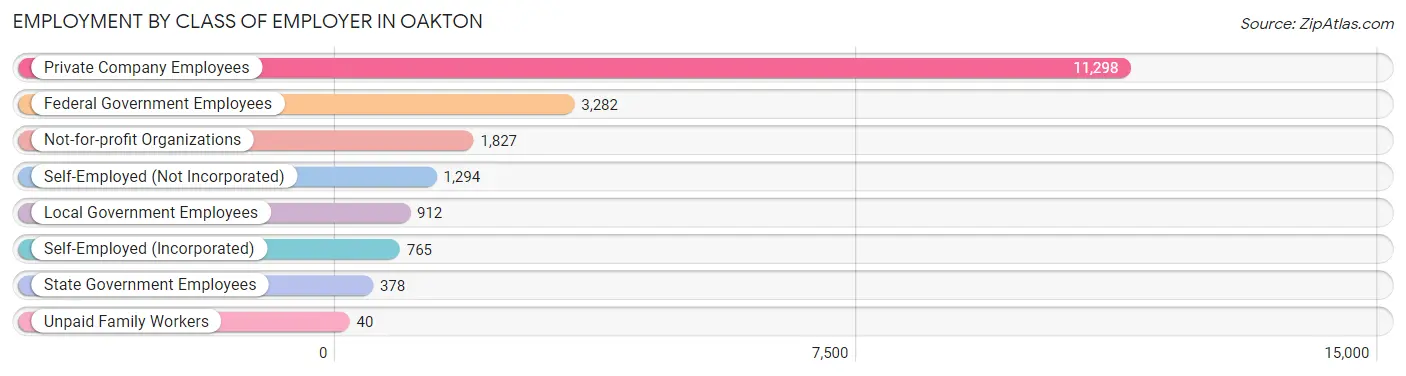
| Employer Class | # Employees | % Employees |
| Private Company Employees | 11,298 | 57.1% |
| Self-Employed (Incorporated) | 765 | 3.9% |
| Self-Employed (Not Incorporated) | 1,294 | 6.5% |
| Not-for-profit Organizations | 1,827 | 9.2% |
| Local Government Employees | 912 | 4.6% |
| State Government Employees | 378 | 1.9% |
| Federal Government Employees | 3,282 | 16.6% |
| Unpaid Family Workers | 40 | 0.2% |
| Total | 19,796 | 100.0% |
Employment Status by Age in Oakton
According to the labor force statistics for Oakton, out of the total population over 16 years of age (29,725), 70.0% or 20,808 individuals are in the labor force, with 3.3% or 687 of them unemployed. The age group with the highest labor force participation rate is 25 to 29 years, with 93.4% or 2,194 individuals in the labor force. Within the labor force, the 16 to 19 years age range has the highest percentage of unemployed individuals, with 21.8% or 162 of them being unemployed.
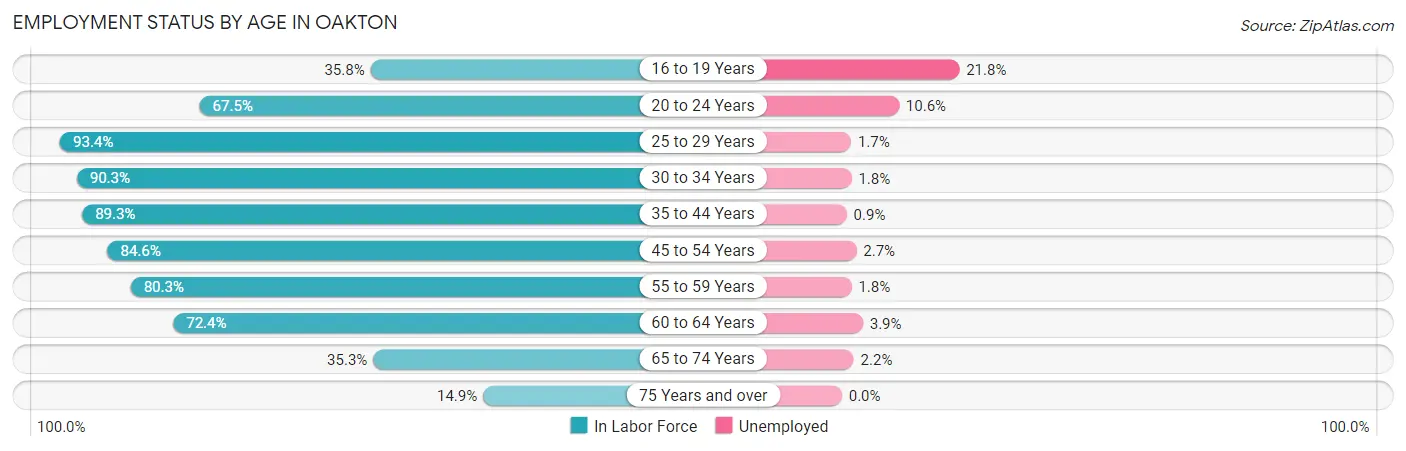
| Age Bracket | In Labor Force | Unemployed |
| 16 to 19 Years | 744 (35.8%) | 162 (21.8%) |
| 20 to 24 Years | 1,385 (67.5%) | 147 (10.6%) |
| 25 to 29 Years | 2,194 (93.4%) | 37 (1.7%) |
| 30 to 34 Years | 2,425 (90.3%) | 44 (1.8%) |
| 35 to 44 Years | 4,686 (89.3%) | 42 (0.9%) |
| 45 to 54 Years | 4,602 (84.6%) | 124 (2.7%) |
| 55 to 59 Years | 1,776 (80.3%) | 32 (1.8%) |
| 60 to 64 Years | 1,471 (72.4%) | 57 (3.9%) |
| 65 to 74 Years | 1,175 (35.3%) | 26 (2.2%) |
| 75 Years and over | 342 (14.9%) | 0 (0.0%) |
| Total | 20,808 (70.0%) | 687 (3.3%) |
Employment Status by Educational Attainment in Oakton
According to labor force statistics for Oakton, 85.9% of individuals (17,152) out of the total population between 25 and 64 years of age (19,967) are in the labor force, with 2.0% or 343 of them being unemployed. The group with the highest labor force participation rate are those with the educational attainment of bachelor's degree or higher, with 89.7% or 13,529 individuals in the labor force. Within the labor force, individuals with college / associate degree education have the highest percentage of unemployment, with 3.6% or 73 of them being unemployed.
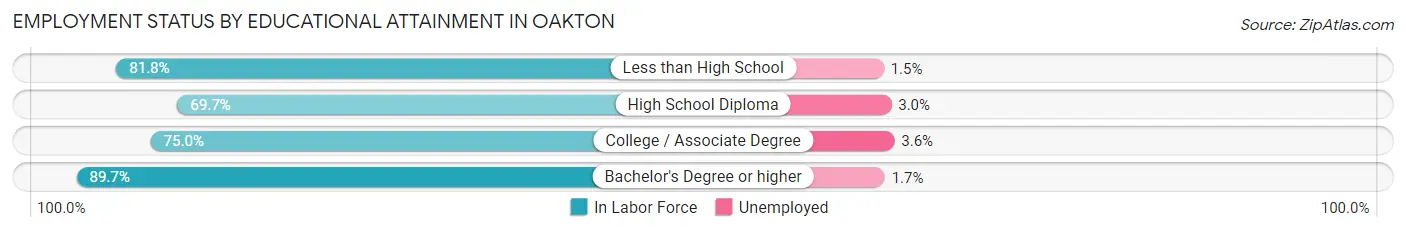
| Educational Attainment | In Labor Force | Unemployed |
| Less than High School | 544 (81.8%) | 10 (1.5%) |
| High School Diploma | 1,046 (69.7%) | 45 (3.0%) |
| College / Associate Degree | 2,040 (75.0%) | 98 (3.6%) |
| Bachelor's Degree or higher | 13,529 (89.7%) | 256 (1.7%) |
| Total | 17,152 (85.9%) | 399 (2.0%) |
Employment Occupations by Sex in Oakton
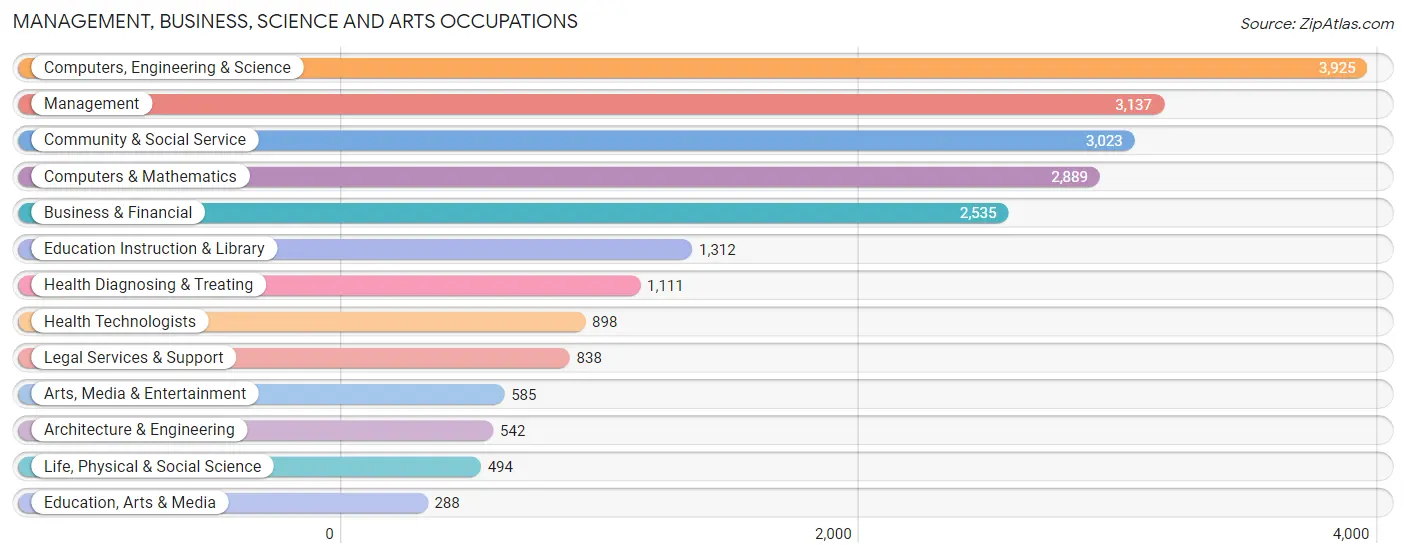
Management, Business, Science and Arts Occupations
The most common Management, Business, Science and Arts occupations in Oakton are Computers, Engineering & Science (3,925 | 19.7%), Management (3,137 | 15.7%), Community & Social Service (3,023 | 15.1%), Computers & Mathematics (2,889 | 14.5%), and Business & Financial (2,535 | 12.7%).
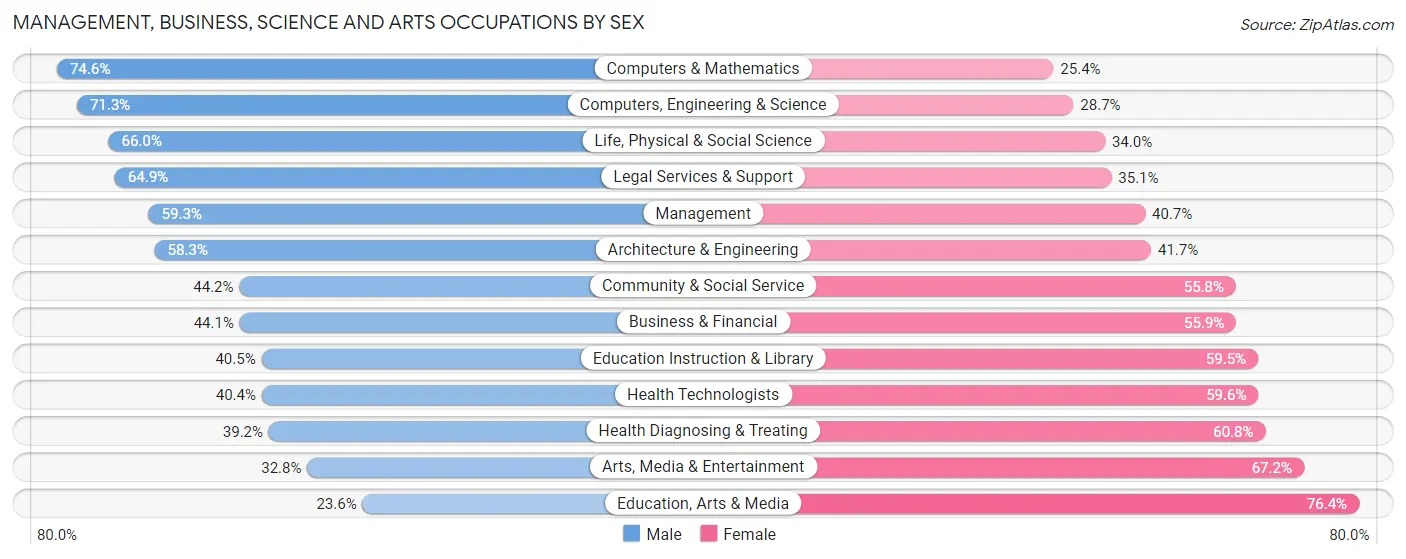
Management, Business, Science and Arts Occupations by Sex
Within the Management, Business, Science and Arts occupations in Oakton, the most male-oriented occupations are Computers & Mathematics (74.6%), Computers, Engineering & Science (71.3%), and Life, Physical & Social Science (66.0%), while the most female-oriented occupations are Education, Arts & Media (76.4%), Arts, Media & Entertainment (67.2%), and Health Diagnosing & Treating (60.8%).
| Occupation | Male | Female |
| Management | 1,860 (59.3%) | 1,277 (40.7%) |
| Business & Financial | 1,118 (44.1%) | 1,417 (55.9%) |
| Computers, Engineering & Science | 2,797 (71.3%) | 1,128 (28.7%) |
| Computers & Mathematics | 2,155 (74.6%) | 734 (25.4%) |
| Architecture & Engineering | 316 (58.3%) | 226 (41.7%) |
| Life, Physical & Social Science | 326 (66.0%) | 168 (34.0%) |
| Community & Social Service | 1,335 (44.2%) | 1,688 (55.8%) |
| Education, Arts & Media | 68 (23.6%) | 220 (76.4%) |
| Legal Services & Support | 544 (64.9%) | 294 (35.1%) |
| Education Instruction & Library | 531 (40.5%) | 781 (59.5%) |
| Arts, Media & Entertainment | 192 (32.8%) | 393 (67.2%) |
| Health Diagnosing & Treating | 436 (39.2%) | 675 (60.8%) |
| Health Technologists | 363 (40.4%) | 535 (59.6%) |
| Total (Category) | 7,546 (55.0%) | 6,185 (45.0%) |
| Total (Overall) | 10,753 (53.9%) | 9,205 (46.1%) |
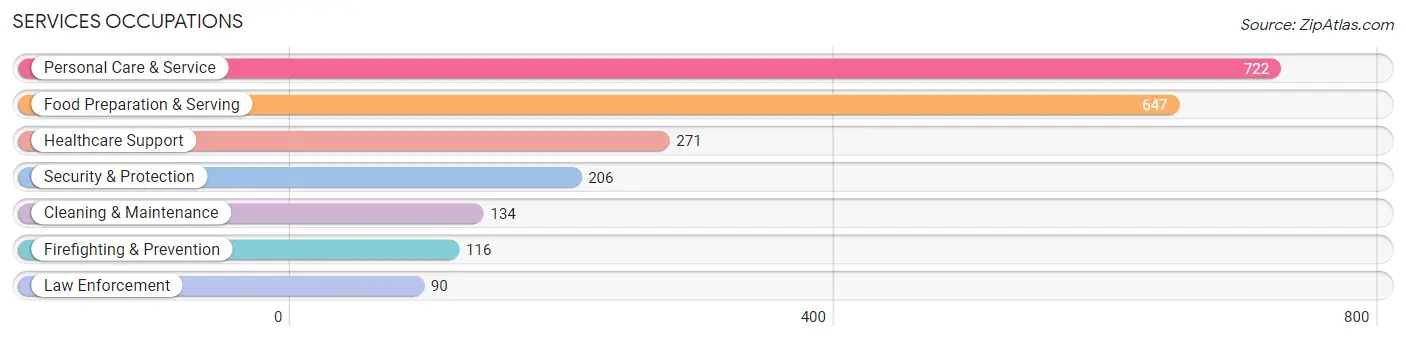
Services Occupations
The most common Services occupations in Oakton are Personal Care & Service (722 | 3.6%), Food Preparation & Serving (647 | 3.2%), Healthcare Support (271 | 1.4%), Security & Protection (206 | 1.0%), and Cleaning & Maintenance (134 | 0.7%).
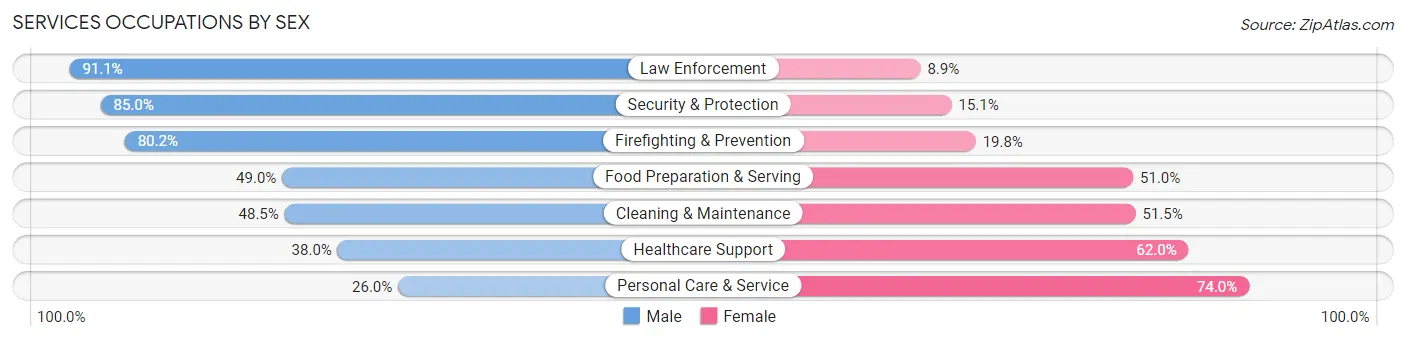
Services Occupations by Sex
Within the Services occupations in Oakton, the most male-oriented occupations are Law Enforcement (91.1%), Security & Protection (85.0%), and Firefighting & Prevention (80.2%), while the most female-oriented occupations are Personal Care & Service (74.0%), Healthcare Support (62.0%), and Cleaning & Maintenance (51.5%).
| Occupation | Male | Female |
| Healthcare Support | 103 (38.0%) | 168 (62.0%) |
| Security & Protection | 175 (85.0%) | 31 (15.0%) |
| Firefighting & Prevention | 93 (80.2%) | 23 (19.8%) |
| Law Enforcement | 82 (91.1%) | 8 (8.9%) |
| Food Preparation & Serving | 317 (49.0%) | 330 (51.0%) |
| Cleaning & Maintenance | 65 (48.5%) | 69 (51.5%) |
| Personal Care & Service | 188 (26.0%) | 534 (74.0%) |
| Total (Category) | 848 (42.8%) | 1,132 (57.2%) |
| Total (Overall) | 10,753 (53.9%) | 9,205 (46.1%) |
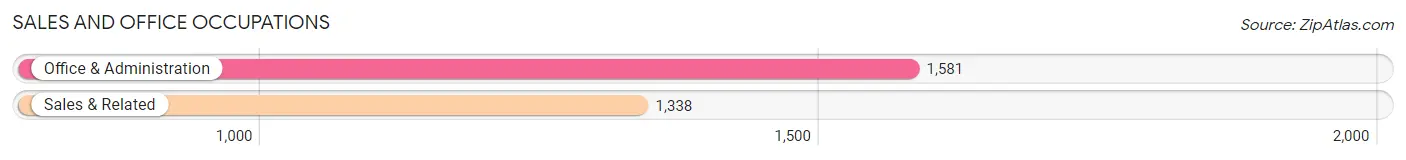
Sales and Office Occupations
The most common Sales and Office occupations in Oakton are Office & Administration (1,581 | 7.9%), and Sales & Related (1,338 | 6.7%).
Sales and Office Occupations by Sex
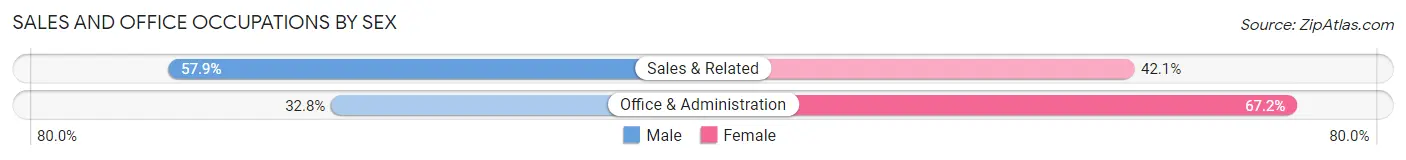
| Occupation | Male | Female |
| Sales & Related | 775 (57.9%) | 563 (42.1%) |
| Office & Administration | 519 (32.8%) | 1,062 (67.2%) |
| Total (Category) | 1,294 (44.3%) | 1,625 (55.7%) |
| Total (Overall) | 10,753 (53.9%) | 9,205 (46.1%) |
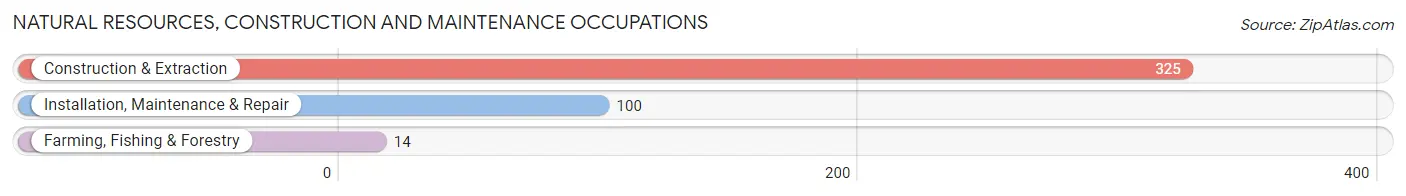
Natural Resources, Construction and Maintenance Occupations
The most common Natural Resources, Construction and Maintenance occupations in Oakton are Construction & Extraction (325 | 1.6%), Installation, Maintenance & Repair (100 | 0.5%), and Farming, Fishing & Forestry (14 | 0.1%).
Natural Resources, Construction and Maintenance Occupations by Sex
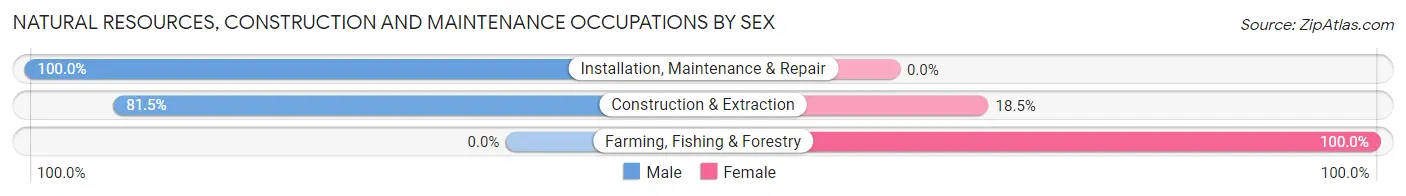
| Occupation | Male | Female |
| Farming, Fishing & Forestry | 0 (0.0%) | 14 (100.0%) |
| Construction & Extraction | 265 (81.5%) | 60 (18.5%) |
| Installation, Maintenance & Repair | 100 (100.0%) | 0 (0.0%) |
| Total (Category) | 365 (83.1%) | 74 (16.9%) |
| Total (Overall) | 10,753 (53.9%) | 9,205 (46.1%) |
Production, Transportation and Moving Occupations
The most common Production, Transportation and Moving occupations in Oakton are Transportation (432 | 2.2%), Production (261 | 1.3%), and Material Moving (196 | 1.0%).
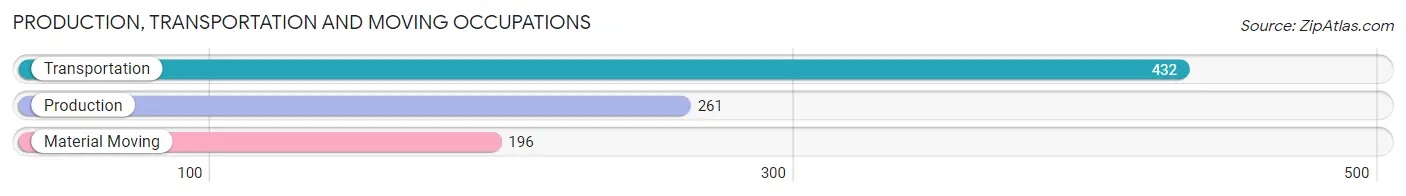
Production, Transportation and Moving Occupations by Sex
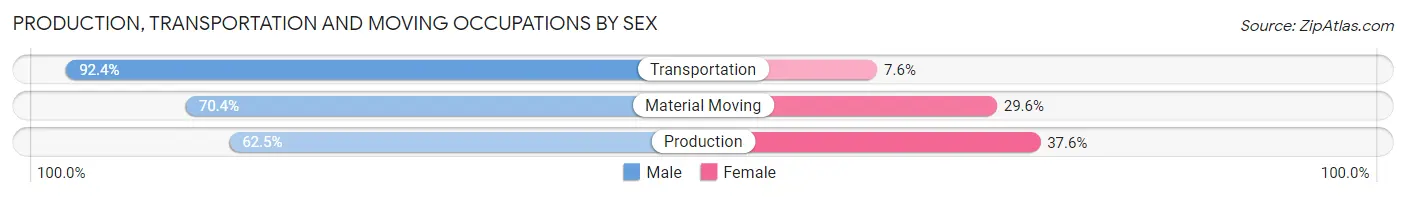
| Occupation | Male | Female |
| Production | 163 (62.5%) | 98 (37.6%) |
| Transportation | 399 (92.4%) | 33 (7.6%) |
| Material Moving | 138 (70.4%) | 58 (29.6%) |
| Total (Category) | 700 (78.7%) | 189 (21.3%) |
| Total (Overall) | 10,753 (53.9%) | 9,205 (46.1%) |
Employment Industries by Sex in Oakton
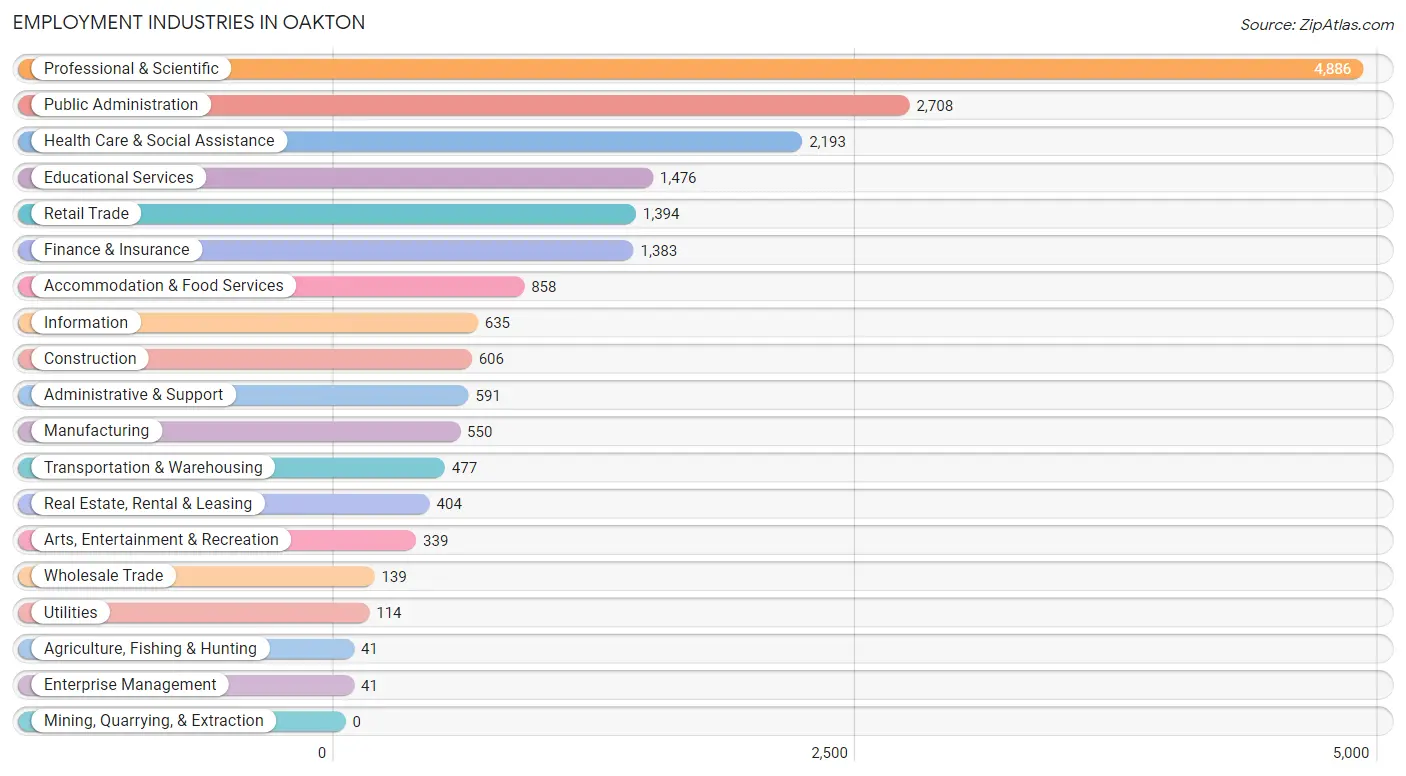
Employment Industries in Oakton
The major employment industries in Oakton include Professional & Scientific (4,886 | 24.5%), Public Administration (2,708 | 13.6%), Health Care & Social Assistance (2,193 | 11.0%), Educational Services (1,476 | 7.4%), and Retail Trade (1,394 | 7.0%).
Employment Industries by Sex in Oakton
The Oakton industries that see more men than women are Wholesale Trade (90.6%), Manufacturing (79.6%), and Transportation & Warehousing (79.0%), whereas the industries that tend to have a higher number of women are Enterprise Management (100.0%), Utilities (85.1%), and Educational Services (69.2%).
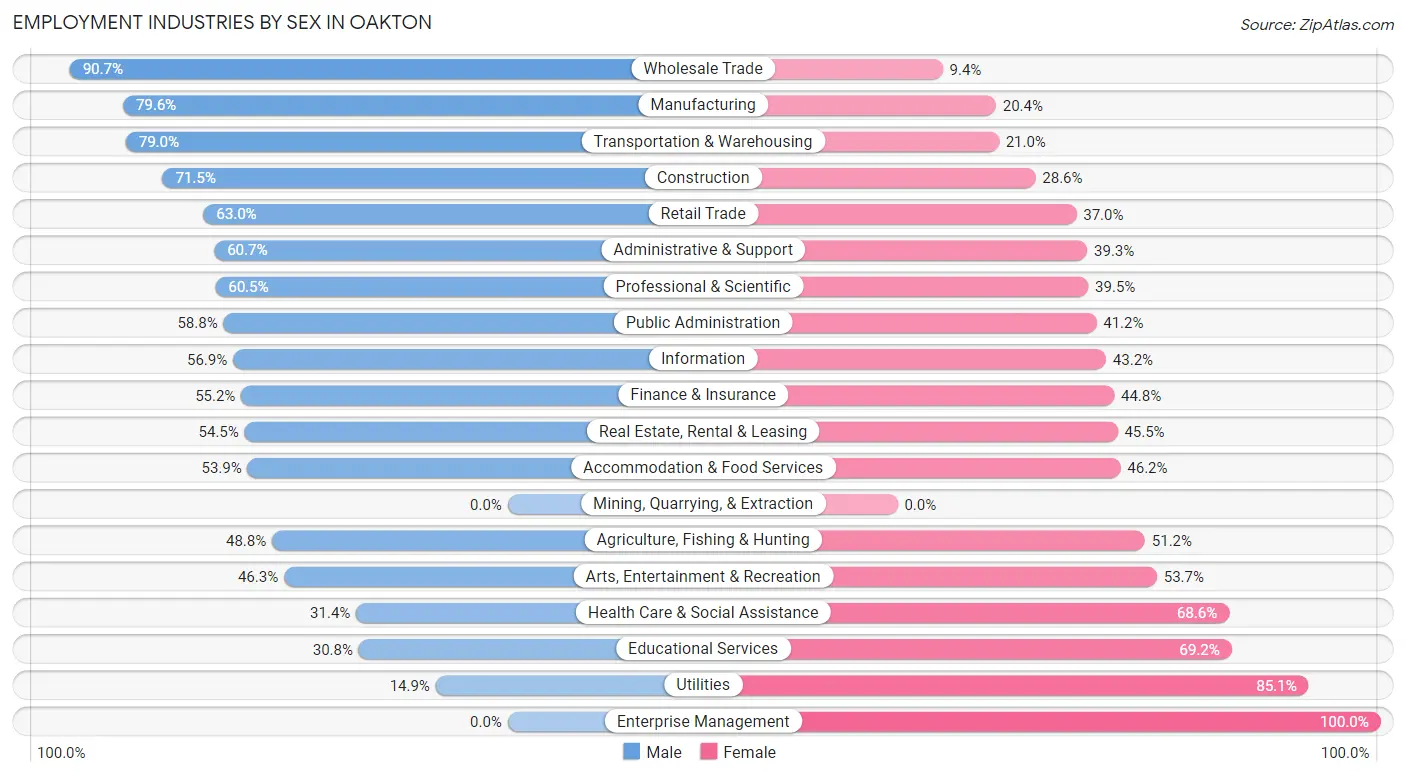
| Industry | Male | Female |
| Agriculture, Fishing & Hunting | 20 (48.8%) | 21 (51.2%) |
| Mining, Quarrying, & Extraction | 0 (0.0%) | 0 (0.0%) |
| Construction | 433 (71.5%) | 173 (28.5%) |
| Manufacturing | 438 (79.6%) | 112 (20.4%) |
| Wholesale Trade | 126 (90.6%) | 13 (9.3%) |
| Retail Trade | 878 (63.0%) | 516 (37.0%) |
| Transportation & Warehousing | 377 (79.0%) | 100 (21.0%) |
| Utilities | 17 (14.9%) | 97 (85.1%) |
| Information | 361 (56.9%) | 274 (43.1%) |
| Finance & Insurance | 763 (55.2%) | 620 (44.8%) |
| Real Estate, Rental & Leasing | 220 (54.5%) | 184 (45.5%) |
| Professional & Scientific | 2,957 (60.5%) | 1,929 (39.5%) |
| Enterprise Management | 0 (0.0%) | 41 (100.0%) |
| Administrative & Support | 359 (60.7%) | 232 (39.3%) |
| Educational Services | 455 (30.8%) | 1,021 (69.2%) |
| Health Care & Social Assistance | 688 (31.4%) | 1,505 (68.6%) |
| Arts, Entertainment & Recreation | 157 (46.3%) | 182 (53.7%) |
| Accommodation & Food Services | 462 (53.8%) | 396 (46.2%) |
| Public Administration | 1,593 (58.8%) | 1,115 (41.2%) |
| Total | 10,753 (53.9%) | 9,205 (46.1%) |
Education in Oakton
School Enrollment in Oakton
The most common levels of schooling among the 9,941 students in Oakton are high school (2,392 | 24.1%), college / undergraduate (2,211 | 22.2%), and middle school (1,835 | 18.5%).
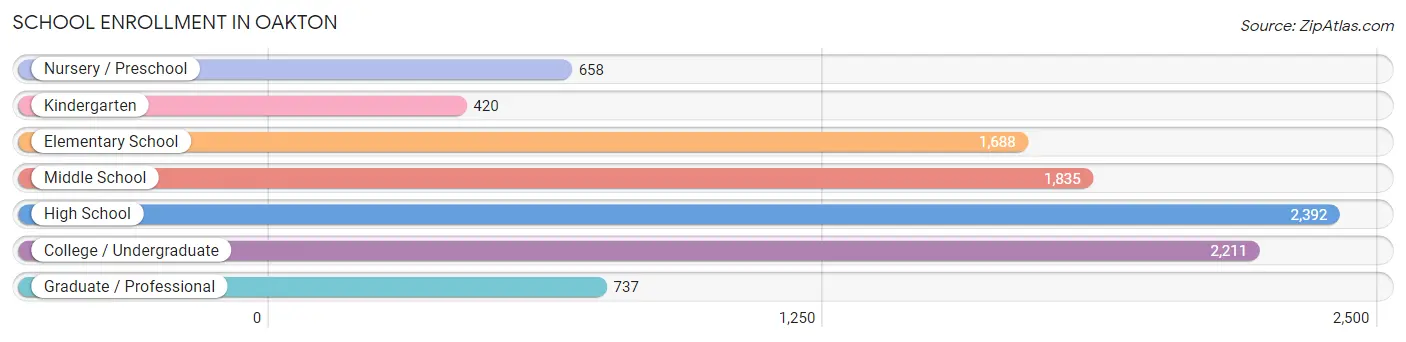
| School Level | # Students | % Students |
| Nursery / Preschool | 658 | 6.6% |
| Kindergarten | 420 | 4.2% |
| Elementary School | 1,688 | 17.0% |
| Middle School | 1,835 | 18.5% |
| High School | 2,392 | 24.1% |
| College / Undergraduate | 2,211 | 22.2% |
| Graduate / Professional | 737 | 7.4% |
| Total | 9,941 | 100.0% |
School Enrollment by Age by Funding Source in Oakton
Out of a total of 9,941 students who are enrolled in schools in Oakton, 1,760 (17.7%) attend a private institution, while the remaining 8,181 (82.3%) are enrolled in public schools. The age group of 3 to 4 year olds has the highest likelihood of being enrolled in private schools, with 460 (77.8% in the age bracket) enrolled. Conversely, the age group of 20 to 24 year olds has the lowest likelihood of being enrolled in a private school, with 948 (91.8% in the age bracket) attending a public institution.
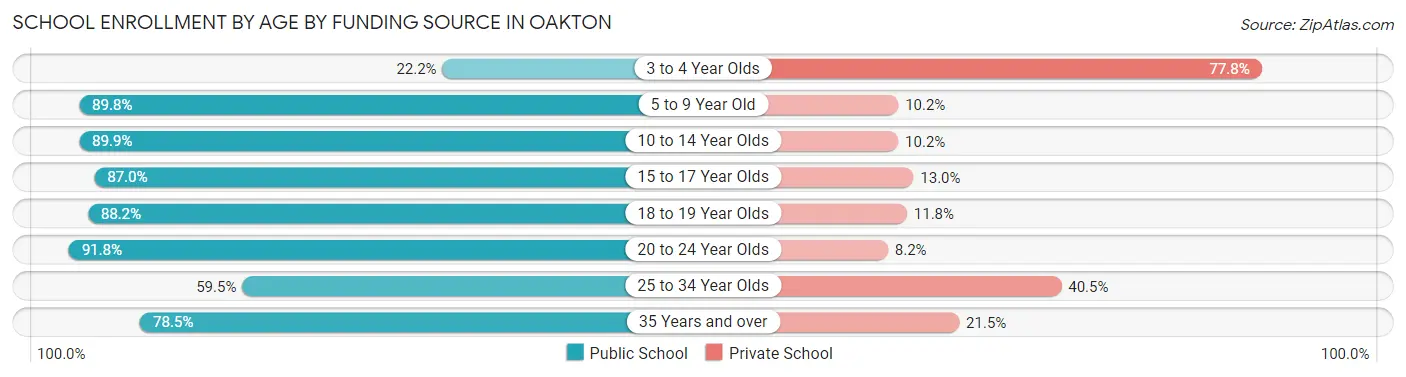
| Age Bracket | Public School | Private School |
| 3 to 4 Year Olds | 131 (22.2%) | 460 (77.8%) |
| 5 to 9 Year Old | 1,760 (89.8%) | 199 (10.2%) |
| 10 to 14 Year Olds | 2,072 (89.8%) | 234 (10.2%) |
| 15 to 17 Year Olds | 1,481 (87.0%) | 221 (13.0%) |
| 18 to 19 Year Olds | 772 (88.2%) | 103 (11.8%) |
| 20 to 24 Year Olds | 948 (91.8%) | 85 (8.2%) |
| 25 to 34 Year Olds | 443 (59.5%) | 302 (40.5%) |
| 35 Years and over | 573 (78.5%) | 157 (21.5%) |
| Total | 8,181 (82.3%) | 1,760 (17.7%) |
Educational Attainment by Field of Study in Oakton
Business (3,911 | 19.0%), social sciences (2,947 | 14.3%), computers & mathematics (1,818 | 8.8%), engineering (1,690 | 8.2%), and literature & languages (1,589 | 7.7%) are the most common fields of study among 20,547 individuals in Oakton who have obtained a bachelor's degree or higher.
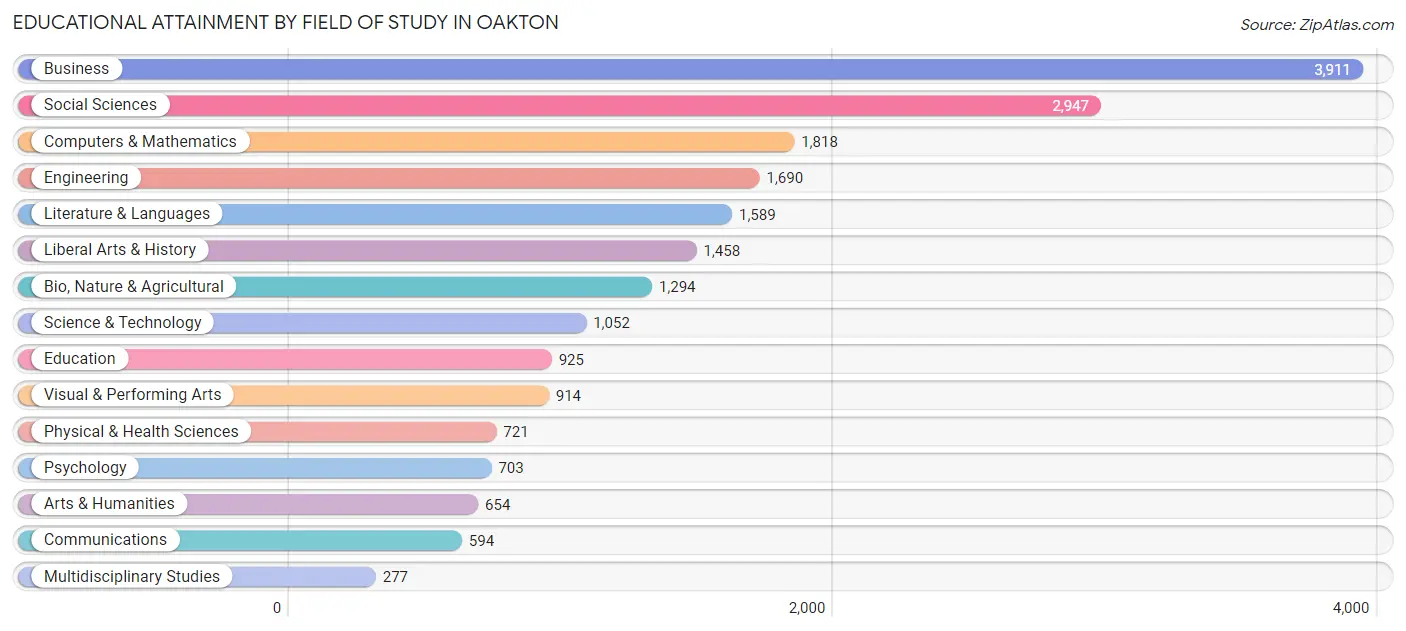
| Field of Study | # Graduates | % Graduates |
| Computers & Mathematics | 1,818 | 8.8% |
| Bio, Nature & Agricultural | 1,294 | 6.3% |
| Physical & Health Sciences | 721 | 3.5% |
| Psychology | 703 | 3.4% |
| Social Sciences | 2,947 | 14.3% |
| Engineering | 1,690 | 8.2% |
| Multidisciplinary Studies | 277 | 1.3% |
| Science & Technology | 1,052 | 5.1% |
| Business | 3,911 | 19.0% |
| Education | 925 | 4.5% |
| Literature & Languages | 1,589 | 7.7% |
| Liberal Arts & History | 1,458 | 7.1% |
| Visual & Performing Arts | 914 | 4.4% |
| Communications | 594 | 2.9% |
| Arts & Humanities | 654 | 3.2% |
| Total | 20,547 | 100.0% |
Transportation & Commute in Oakton
Vehicle Availability by Sex in Oakton
The most prevalent vehicle ownership categories in Oakton are males with 2 vehicles (5,275, accounting for 49.2%) and females with 2 vehicles (4,177, making up 58.2%).
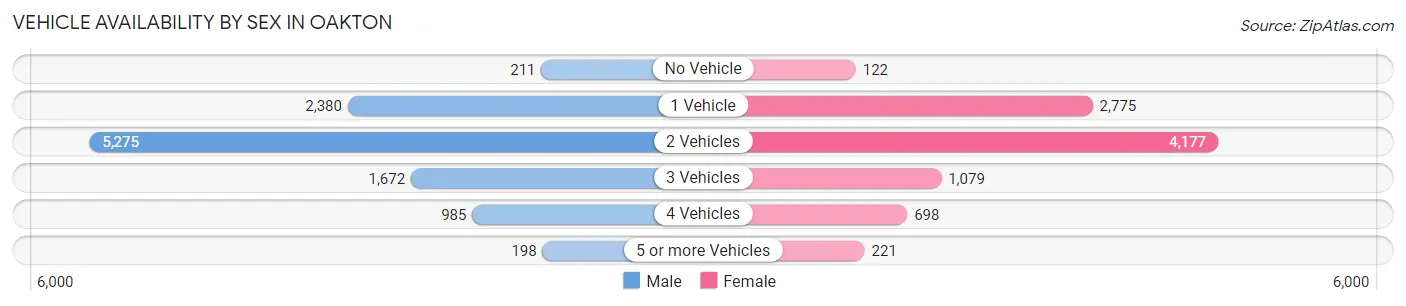
| Vehicles Available | Male | Female |
| No Vehicle | 211 (2.0%) | 122 (1.3%) |
| 1 Vehicle | 2,380 (22.2%) | 2,775 (30.6%) |
| 2 Vehicles | 5,275 (49.2%) | 4,177 (46.0%) |
| 3 Vehicles | 1,672 (15.6%) | 1,079 (11.9%) |
| 4 Vehicles | 985 (9.2%) | 698 (7.7%) |
| 5 or more Vehicles | 198 (1.8%) | 221 (2.4%) |
| Total | 10,721 (100.0%) | 9,072 (100.0%) |
Commute Time in Oakton
The most frequently occuring commute durations in Oakton are 30 to 34 minutes (2,554 commuters, 17.4%), 20 to 24 minutes (2,079 commuters, 14.2%), and 45 to 59 minutes (2,066 commuters, 14.1%).
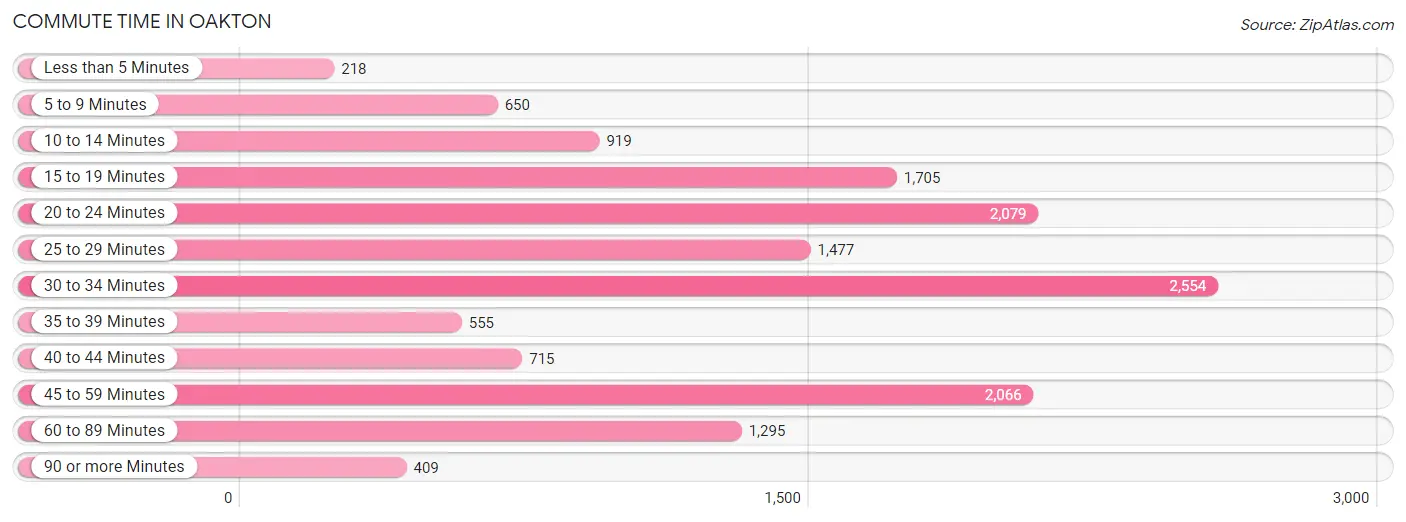
| Commute Time | # Commuters | % Commuters |
| Less than 5 Minutes | 218 | 1.5% |
| 5 to 9 Minutes | 650 | 4.4% |
| 10 to 14 Minutes | 919 | 6.3% |
| 15 to 19 Minutes | 1,705 | 11.6% |
| 20 to 24 Minutes | 2,079 | 14.2% |
| 25 to 29 Minutes | 1,477 | 10.1% |
| 30 to 34 Minutes | 2,554 | 17.4% |
| 35 to 39 Minutes | 555 | 3.8% |
| 40 to 44 Minutes | 715 | 4.9% |
| 45 to 59 Minutes | 2,066 | 14.1% |
| 60 to 89 Minutes | 1,295 | 8.8% |
| 90 or more Minutes | 409 | 2.8% |
Commute Time by Sex in Oakton
The most common commute times in Oakton are 30 to 34 minutes (1,286 commuters, 16.2%) for males and 30 to 34 minutes (1,268 commuters, 18.9%) for females.
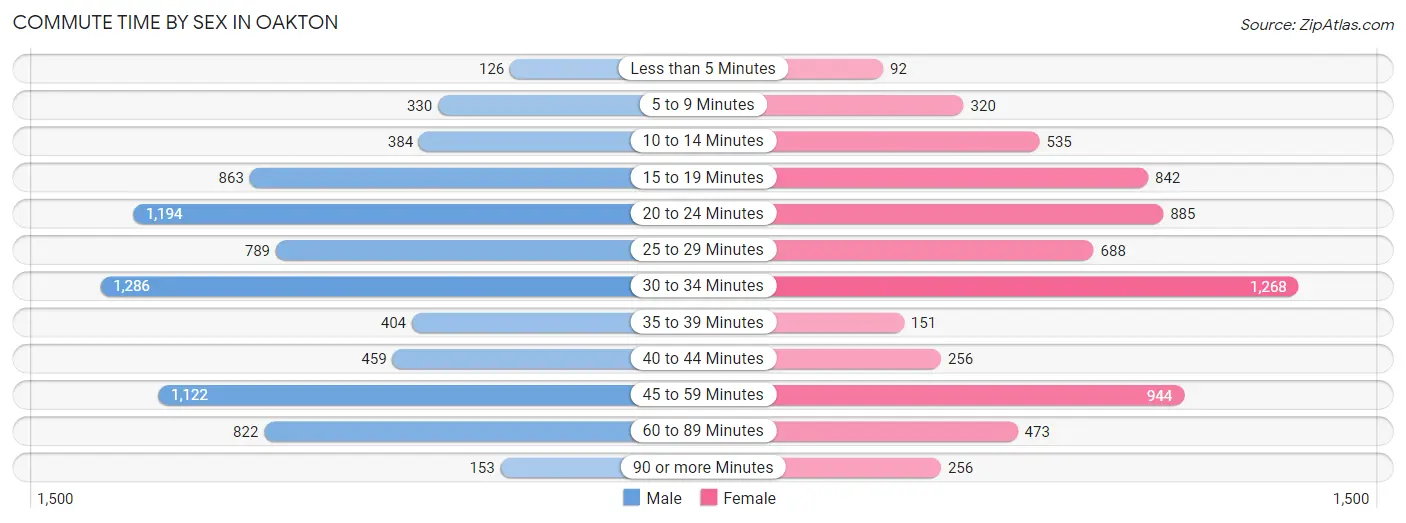
| Commute Time | Male | Female |
| Less than 5 Minutes | 126 (1.6%) | 92 (1.4%) |
| 5 to 9 Minutes | 330 (4.2%) | 320 (4.8%) |
| 10 to 14 Minutes | 384 (4.8%) | 535 (8.0%) |
| 15 to 19 Minutes | 863 (10.9%) | 842 (12.6%) |
| 20 to 24 Minutes | 1,194 (15.0%) | 885 (13.2%) |
| 25 to 29 Minutes | 789 (10.0%) | 688 (10.2%) |
| 30 to 34 Minutes | 1,286 (16.2%) | 1,268 (18.9%) |
| 35 to 39 Minutes | 404 (5.1%) | 151 (2.2%) |
| 40 to 44 Minutes | 459 (5.8%) | 256 (3.8%) |
| 45 to 59 Minutes | 1,122 (14.1%) | 944 (14.1%) |
| 60 to 89 Minutes | 822 (10.4%) | 473 (7.0%) |
| 90 or more Minutes | 153 (1.9%) | 256 (3.8%) |
Time of Departure to Work by Sex in Oakton
The most frequent times of departure to work in Oakton are 8:00 AM to 8:29 AM (1,399, 17.6%) for males and 8:00 AM to 8:29 AM (1,211, 18.0%) for females.
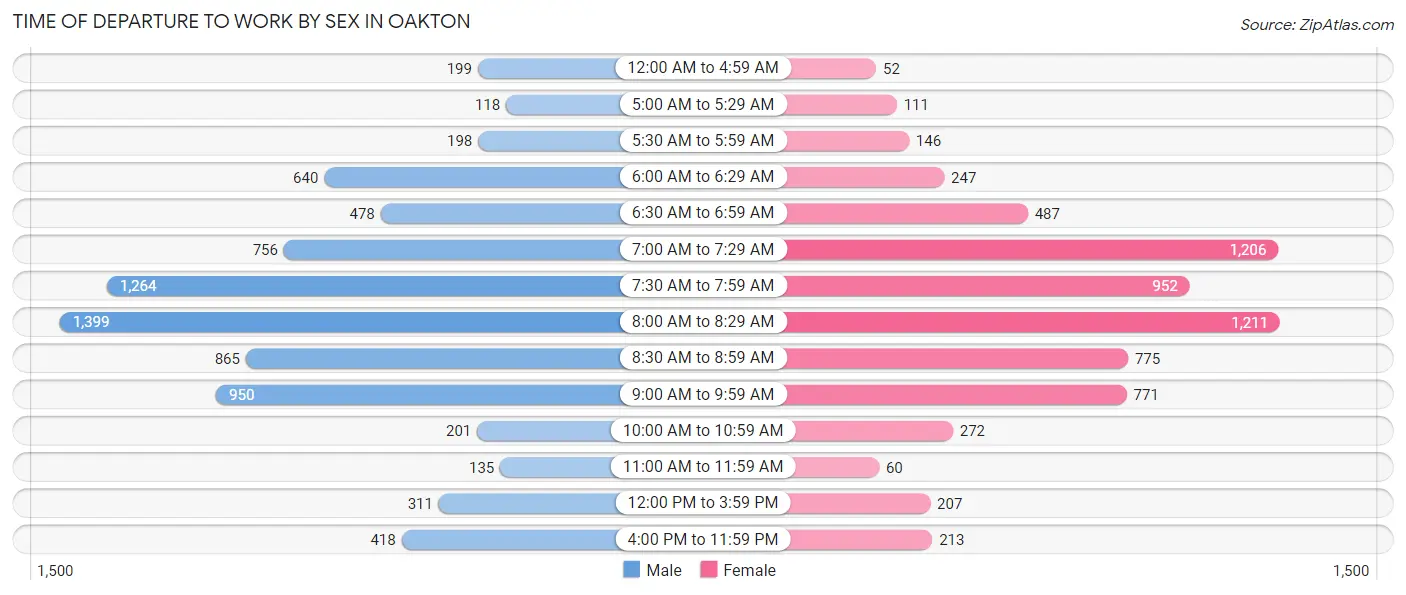
| Time of Departure | Male | Female |
| 12:00 AM to 4:59 AM | 199 (2.5%) | 52 (0.8%) |
| 5:00 AM to 5:29 AM | 118 (1.5%) | 111 (1.7%) |
| 5:30 AM to 5:59 AM | 198 (2.5%) | 146 (2.2%) |
| 6:00 AM to 6:29 AM | 640 (8.1%) | 247 (3.7%) |
| 6:30 AM to 6:59 AM | 478 (6.0%) | 487 (7.3%) |
| 7:00 AM to 7:29 AM | 756 (9.5%) | 1,206 (18.0%) |
| 7:30 AM to 7:59 AM | 1,264 (15.9%) | 952 (14.2%) |
| 8:00 AM to 8:29 AM | 1,399 (17.6%) | 1,211 (18.0%) |
| 8:30 AM to 8:59 AM | 865 (10.9%) | 775 (11.6%) |
| 9:00 AM to 9:59 AM | 950 (12.0%) | 771 (11.5%) |
| 10:00 AM to 10:59 AM | 201 (2.5%) | 272 (4.1%) |
| 11:00 AM to 11:59 AM | 135 (1.7%) | 60 (0.9%) |
| 12:00 PM to 3:59 PM | 311 (3.9%) | 207 (3.1%) |
| 4:00 PM to 11:59 PM | 418 (5.3%) | 213 (3.2%) |
| Total | 7,932 (100.0%) | 6,710 (100.0%) |
Housing Occupancy in Oakton
Occupancy by Ownership in Oakton
Of the total 14,071 dwellings in Oakton, owner-occupied units account for 9,487 (67.4%), while renter-occupied units make up 4,584 (32.6%).
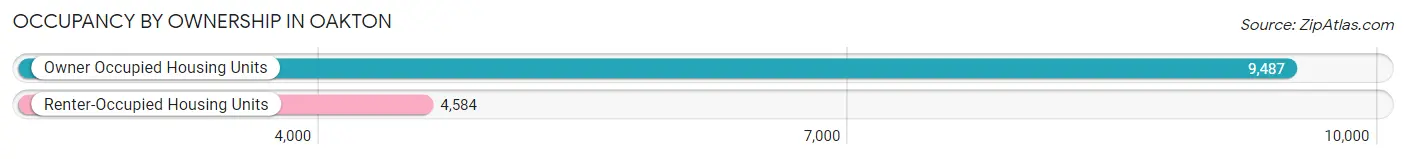
| Occupancy | # Housing Units | % Housing Units |
| Owner Occupied Housing Units | 9,487 | 67.4% |
| Renter-Occupied Housing Units | 4,584 | 32.6% |
| Total Occupied Housing Units | 14,071 | 100.0% |
Occupancy by Household Size in Oakton
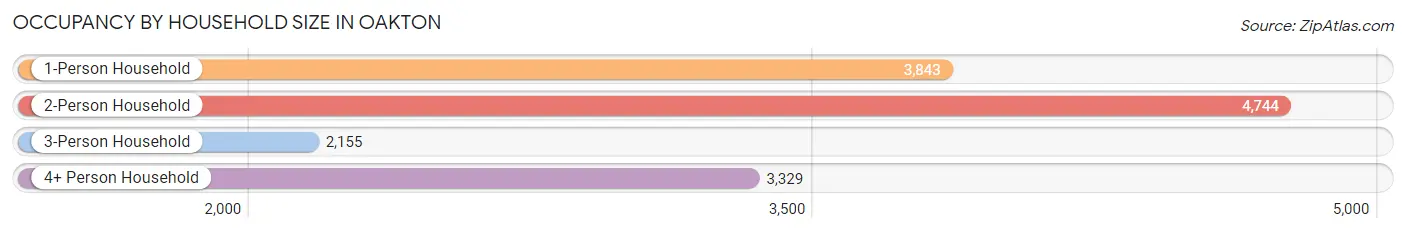
| Household Size | # Housing Units | % Housing Units |
| 1-Person Household | 3,843 | 27.3% |
| 2-Person Household | 4,744 | 33.7% |
| 3-Person Household | 2,155 | 15.3% |
| 4+ Person Household | 3,329 | 23.7% |
| Total Housing Units | 14,071 | 100.0% |
Occupancy by Ownership by Household Size in Oakton
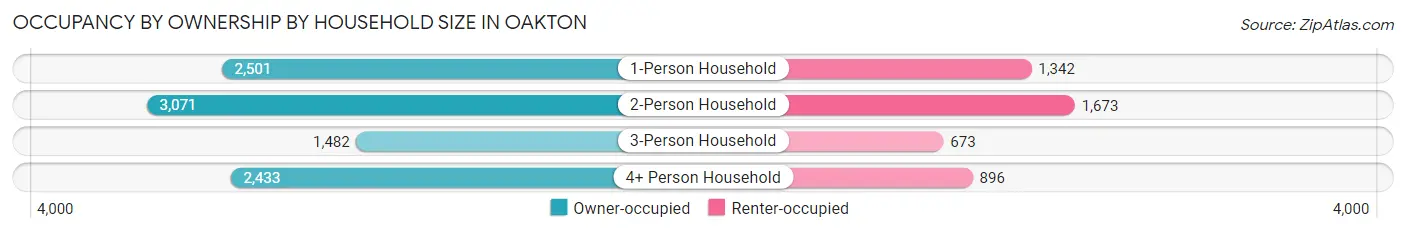
| Household Size | Owner-occupied | Renter-occupied |
| 1-Person Household | 2,501 (65.1%) | 1,342 (34.9%) |
| 2-Person Household | 3,071 (64.7%) | 1,673 (35.3%) |
| 3-Person Household | 1,482 (68.8%) | 673 (31.2%) |
| 4+ Person Household | 2,433 (73.1%) | 896 (26.9%) |
| Total Housing Units | 9,487 (67.4%) | 4,584 (32.6%) |
Occupancy by Educational Attainment in Oakton
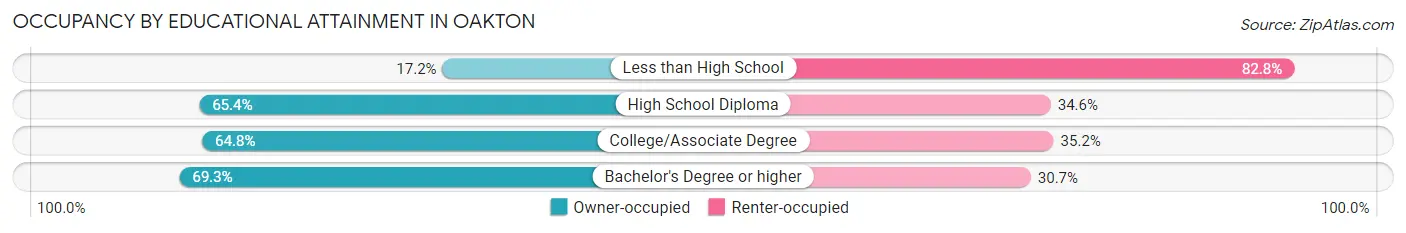
| Household Size | Owner-occupied | Renter-occupied |
| Less than High School | 46 (17.2%) | 222 (82.8%) |
| High School Diploma | 723 (65.4%) | 383 (34.6%) |
| College/Associate Degree | 1,212 (64.8%) | 658 (35.2%) |
| Bachelor's Degree or higher | 7,506 (69.3%) | 3,321 (30.7%) |
Occupancy by Age of Householder in Oakton
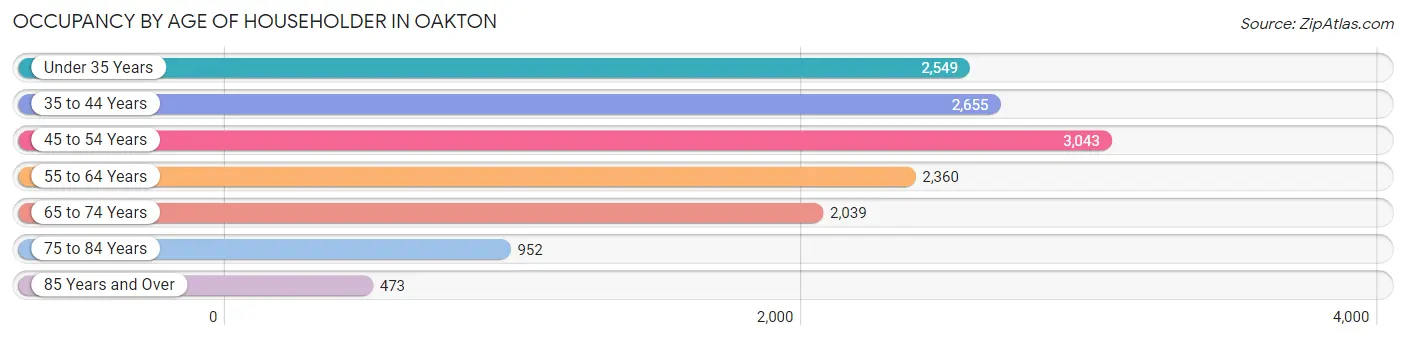
| Age Bracket | # Households | % Households |
| Under 35 Years | 2,549 | 18.1% |
| 35 to 44 Years | 2,655 | 18.9% |
| 45 to 54 Years | 3,043 | 21.6% |
| 55 to 64 Years | 2,360 | 16.8% |
| 65 to 74 Years | 2,039 | 14.5% |
| 75 to 84 Years | 952 | 6.8% |
| 85 Years and Over | 473 | 3.4% |
| Total | 14,071 | 100.0% |
Housing Finances in Oakton
Median Income by Occupancy in Oakton
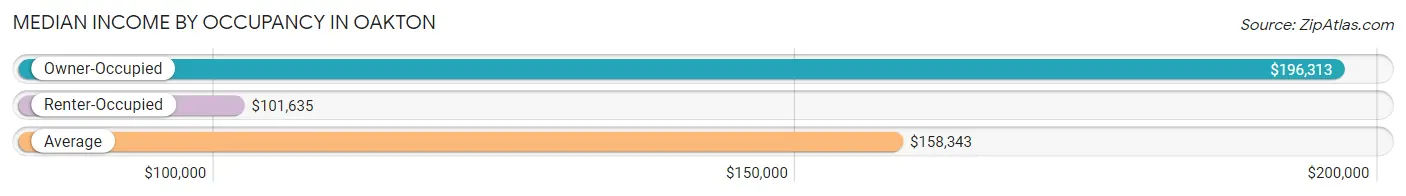
| Occupancy Type | # Households | Median Income |
| Owner-Occupied | 9,487 (67.4%) | $196,313 |
| Renter-Occupied | 4,584 (32.6%) | $101,635 |
| Average | 14,071 (100.0%) | $158,343 |
Occupancy by Householder Income Bracket in Oakton
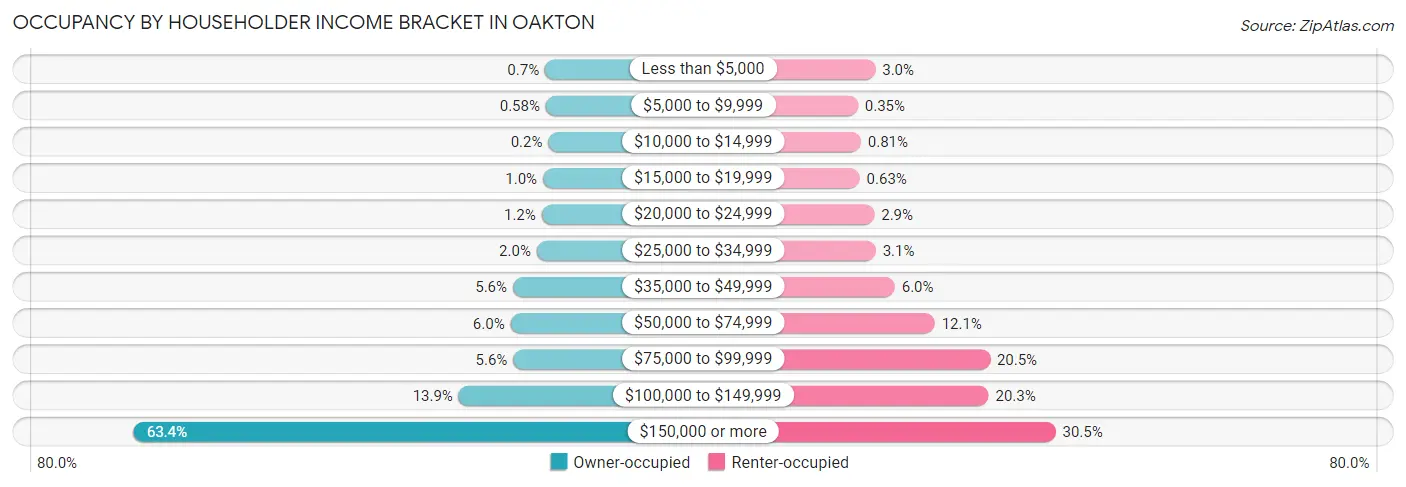
| Income Bracket | Owner-occupied | Renter-occupied |
| Less than $5,000 | 66 (0.7%) | 138 (3.0%) |
| $5,000 to $9,999 | 55 (0.6%) | 16 (0.4%) |
| $10,000 to $14,999 | 19 (0.2%) | 37 (0.8%) |
| $15,000 to $19,999 | 97 (1.0%) | 29 (0.6%) |
| $20,000 to $24,999 | 116 (1.2%) | 131 (2.9%) |
| $25,000 to $34,999 | 186 (2.0%) | 141 (3.1%) |
| $35,000 to $49,999 | 531 (5.6%) | 274 (6.0%) |
| $50,000 to $74,999 | 565 (6.0%) | 553 (12.1%) |
| $75,000 to $99,999 | 527 (5.6%) | 939 (20.5%) |
| $100,000 to $149,999 | 1,314 (13.9%) | 929 (20.3%) |
| $150,000 or more | 6,011 (63.4%) | 1,397 (30.5%) |
| Total | 9,487 (100.0%) | 4,584 (100.0%) |
Monthly Housing Cost Tiers in Oakton
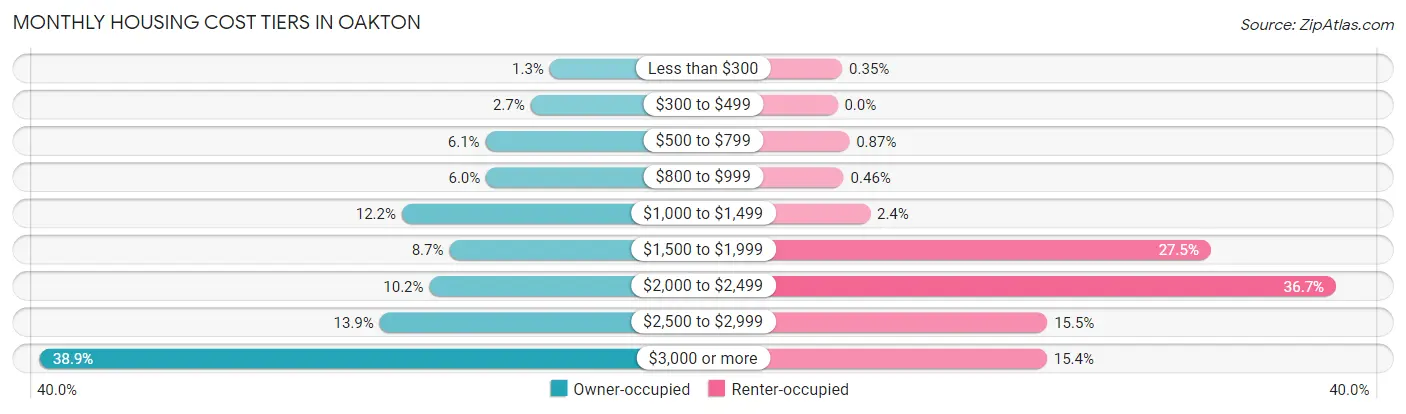
| Monthly Cost | Owner-occupied | Renter-occupied |
| Less than $300 | 126 (1.3%) | 16 (0.4%) |
| $300 to $499 | 260 (2.7%) | 0 (0.0%) |
| $500 to $799 | 575 (6.1%) | 40 (0.9%) |
| $800 to $999 | 570 (6.0%) | 21 (0.5%) |
| $1,000 to $1,499 | 1,159 (12.2%) | 110 (2.4%) |
| $1,500 to $1,999 | 827 (8.7%) | 1,260 (27.5%) |
| $2,000 to $2,499 | 967 (10.2%) | 1,683 (36.7%) |
| $2,500 to $2,999 | 1,315 (13.9%) | 708 (15.4%) |
| $3,000 or more | 3,688 (38.9%) | 707 (15.4%) |
| Total | 9,487 (100.0%) | 4,584 (100.0%) |
Physical Housing Characteristics in Oakton
Housing Structures in Oakton
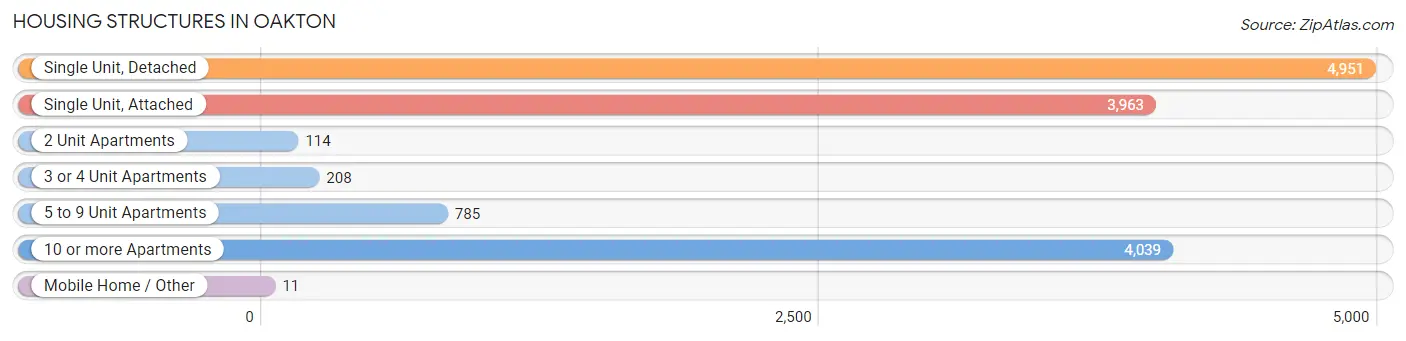
| Structure Type | # Housing Units | % Housing Units |
| Single Unit, Detached | 4,951 | 35.2% |
| Single Unit, Attached | 3,963 | 28.2% |
| 2 Unit Apartments | 114 | 0.8% |
| 3 or 4 Unit Apartments | 208 | 1.5% |
| 5 to 9 Unit Apartments | 785 | 5.6% |
| 10 or more Apartments | 4,039 | 28.7% |
| Mobile Home / Other | 11 | 0.1% |
| Total | 14,071 | 100.0% |
Housing Structures by Occupancy in Oakton
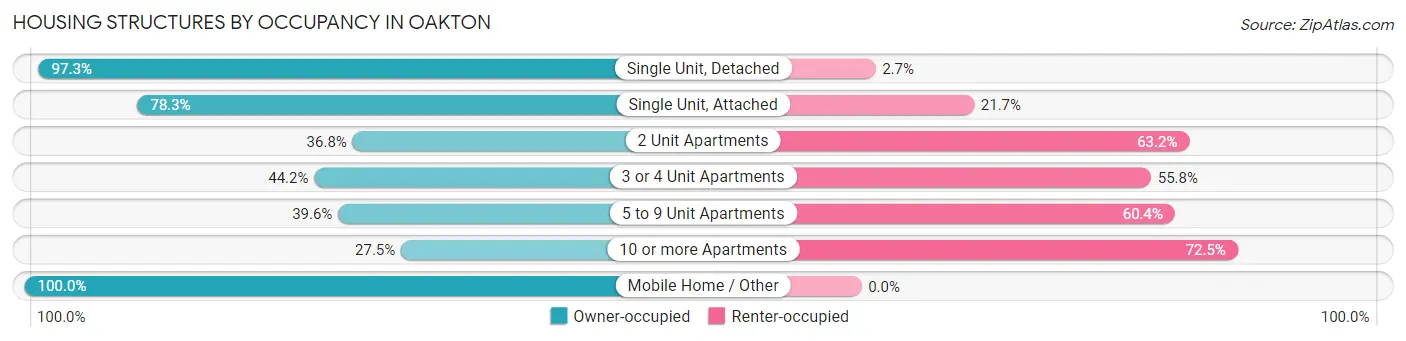
| Structure Type | Owner-occupied | Renter-occupied |
| Single Unit, Detached | 4,817 (97.3%) | 134 (2.7%) |
| Single Unit, Attached | 3,103 (78.3%) | 860 (21.7%) |
| 2 Unit Apartments | 42 (36.8%) | 72 (63.2%) |
| 3 or 4 Unit Apartments | 92 (44.2%) | 116 (55.8%) |
| 5 to 9 Unit Apartments | 311 (39.6%) | 474 (60.4%) |
| 10 or more Apartments | 1,111 (27.5%) | 2,928 (72.5%) |
| Mobile Home / Other | 11 (100.0%) | 0 (0.0%) |
| Total | 9,487 (67.4%) | 4,584 (32.6%) |
Housing Structures by Number of Rooms in Oakton
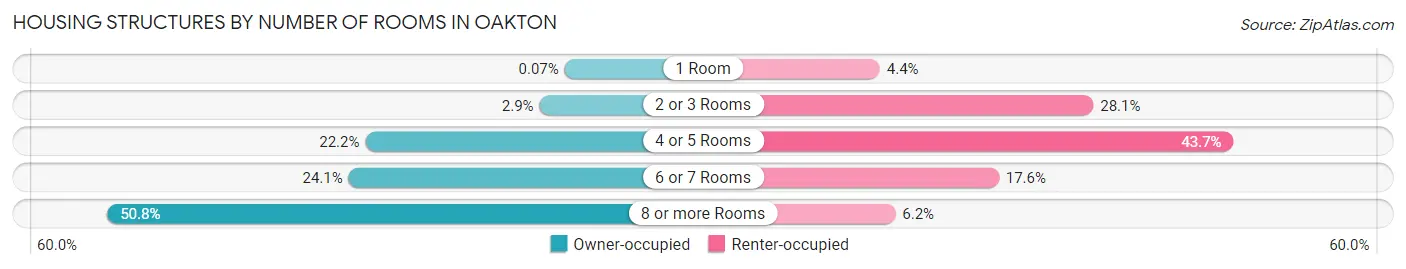
| Number of Rooms | Owner-occupied | Renter-occupied |
| 1 Room | 7 (0.1%) | 203 (4.4%) |
| 2 or 3 Rooms | 271 (2.9%) | 1,289 (28.1%) |
| 4 or 5 Rooms | 2,105 (22.2%) | 2,002 (43.7%) |
| 6 or 7 Rooms | 2,282 (24.0%) | 808 (17.6%) |
| 8 or more Rooms | 4,822 (50.8%) | 282 (6.1%) |
| Total | 9,487 (100.0%) | 4,584 (100.0%) |
Housing Structure by Heating Type in Oakton
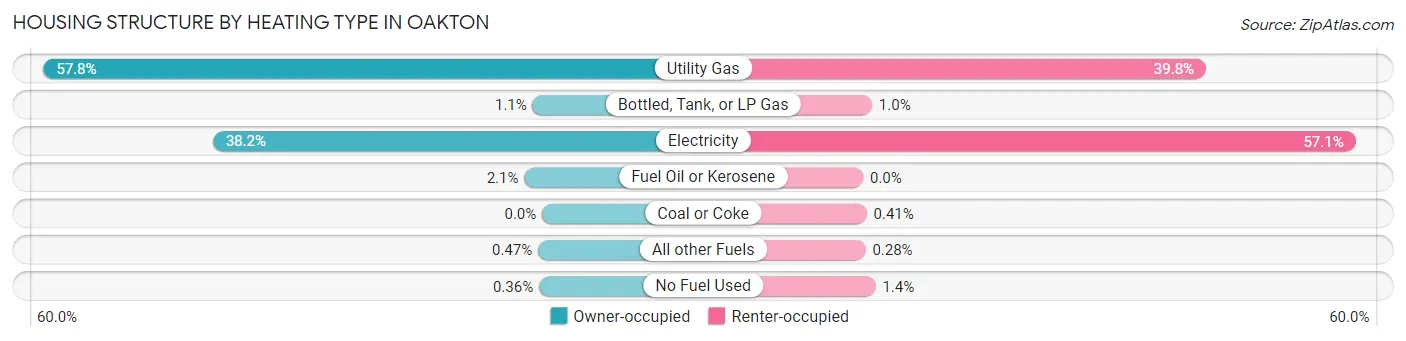
| Heating Type | Owner-occupied | Renter-occupied |
| Utility Gas | 5,486 (57.8%) | 1,822 (39.8%) |
| Bottled, Tank, or LP Gas | 104 (1.1%) | 47 (1.0%) |
| Electricity | 3,623 (38.2%) | 2,617 (57.1%) |
| Fuel Oil or Kerosene | 195 (2.1%) | 0 (0.0%) |
| Coal or Coke | 0 (0.0%) | 19 (0.4%) |
| All other Fuels | 45 (0.5%) | 13 (0.3%) |
| No Fuel Used | 34 (0.4%) | 66 (1.4%) |
| Total | 9,487 (100.0%) | 4,584 (100.0%) |
Household Vehicle Usage in Oakton
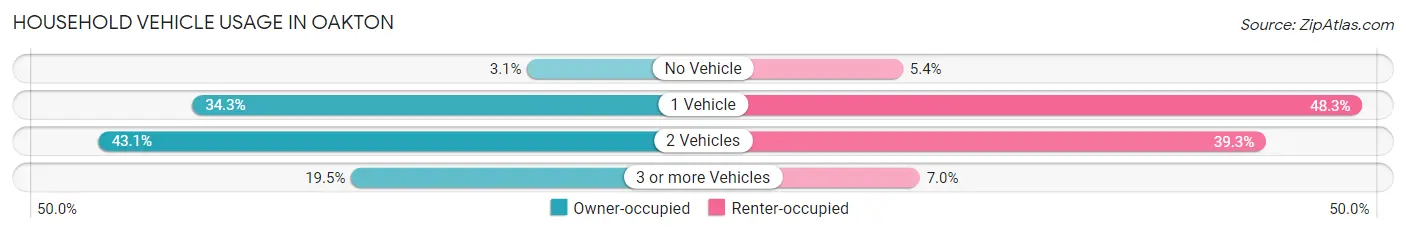
| Vehicles per Household | Owner-occupied | Renter-occupied |
| No Vehicle | 291 (3.1%) | 248 (5.4%) |
| 1 Vehicle | 3,258 (34.3%) | 2,214 (48.3%) |
| 2 Vehicles | 4,087 (43.1%) | 1,802 (39.3%) |
| 3 or more Vehicles | 1,851 (19.5%) | 320 (7.0%) |
| Total | 9,487 (100.0%) | 4,584 (100.0%) |
Real Estate & Mortgages in Oakton
Real Estate and Mortgage Overview in Oakton
| Characteristic | Without Mortgage | With Mortgage |
| Housing Units | 2,769 | 6,718 |
| Median Property Value | $701,100 | $789,400 |
| Median Household Income | $124,375 | $4,759 |
| Monthly Housing Costs | $972 | $3,669 |
| Real Estate Taxes | $7,322 | $78 |
Property Value by Mortgage Status in Oakton
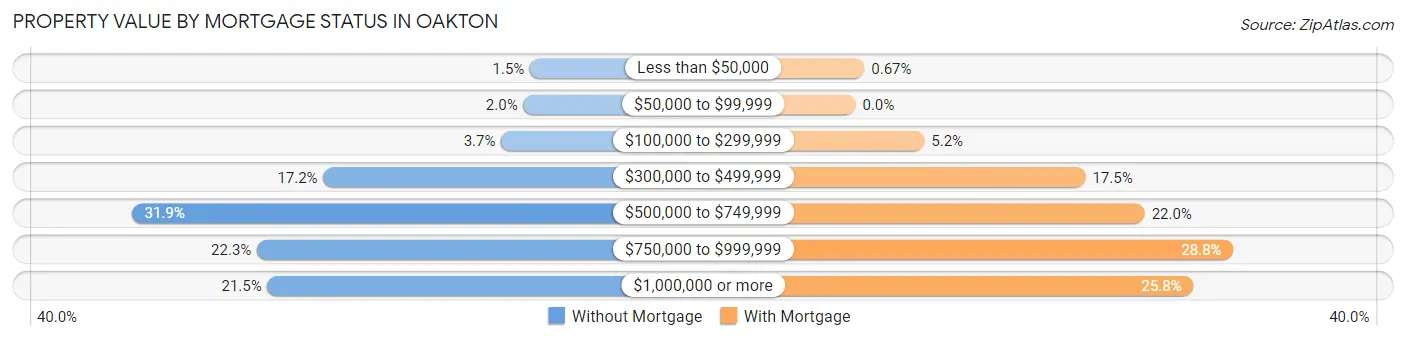
| Property Value | Without Mortgage | With Mortgage |
| Less than $50,000 | 41 (1.5%) | 45 (0.7%) |
| $50,000 to $99,999 | 55 (2.0%) | 0 (0.0%) |
| $100,000 to $299,999 | 102 (3.7%) | 352 (5.2%) |
| $300,000 to $499,999 | 477 (17.2%) | 1,177 (17.5%) |
| $500,000 to $749,999 | 882 (31.9%) | 1,480 (22.0%) |
| $750,000 to $999,999 | 617 (22.3%) | 1,934 (28.8%) |
| $1,000,000 or more | 595 (21.5%) | 1,730 (25.8%) |
| Total | 2,769 (100.0%) | 6,718 (100.0%) |
Household Income by Mortgage Status in Oakton
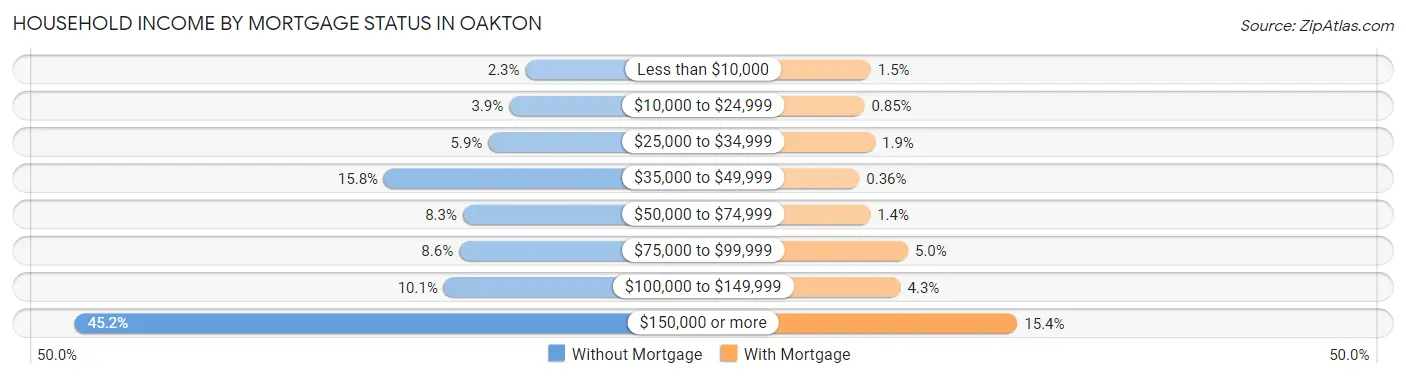
| Household Income | Without Mortgage | With Mortgage |
| Less than $10,000 | 64 (2.3%) | 98 (1.5%) |
| $10,000 to $24,999 | 107 (3.9%) | 57 (0.9%) |
| $25,000 to $34,999 | 162 (5.9%) | 125 (1.9%) |
| $35,000 to $49,999 | 437 (15.8%) | 24 (0.4%) |
| $50,000 to $74,999 | 229 (8.3%) | 94 (1.4%) |
| $75,000 to $99,999 | 239 (8.6%) | 336 (5.0%) |
| $100,000 to $149,999 | 279 (10.1%) | 288 (4.3%) |
| $150,000 or more | 1,252 (45.2%) | 1,035 (15.4%) |
| Total | 2,769 (100.0%) | 6,718 (100.0%) |
Property Value to Household Income Ratio in Oakton
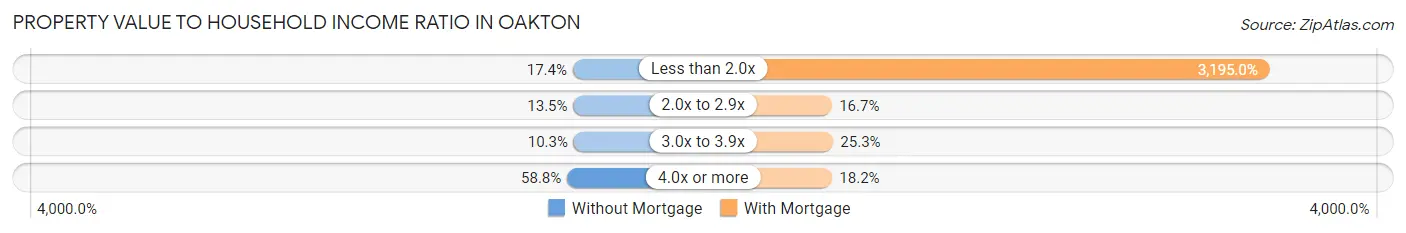
| Value-to-Income Ratio | Without Mortgage | With Mortgage |
| Less than 2.0x | 481 (17.4%) | 214,640 (3,195.0%) |
| 2.0x to 2.9x | 375 (13.5%) | 1,122 (16.7%) |
| 3.0x to 3.9x | 286 (10.3%) | 1,697 (25.3%) |
| 4.0x or more | 1,627 (58.8%) | 1,220 (18.2%) |
| Total | 2,769 (100.0%) | 6,718 (100.0%) |
Real Estate Taxes by Mortgage Status in Oakton
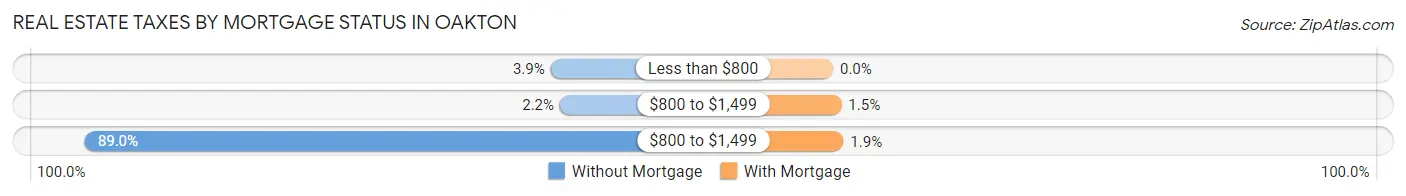
| Property Taxes | Without Mortgage | With Mortgage |
| Less than $800 | 109 (3.9%) | 0 (0.0%) |
| $800 to $1,499 | 62 (2.2%) | 103 (1.5%) |
| $800 to $1,499 | 2,464 (89.0%) | 127 (1.9%) |
| Total | 2,769 (100.0%) | 6,718 (100.0%) |
Health & Disability in Oakton
Health Insurance Coverage by Age in Oakton
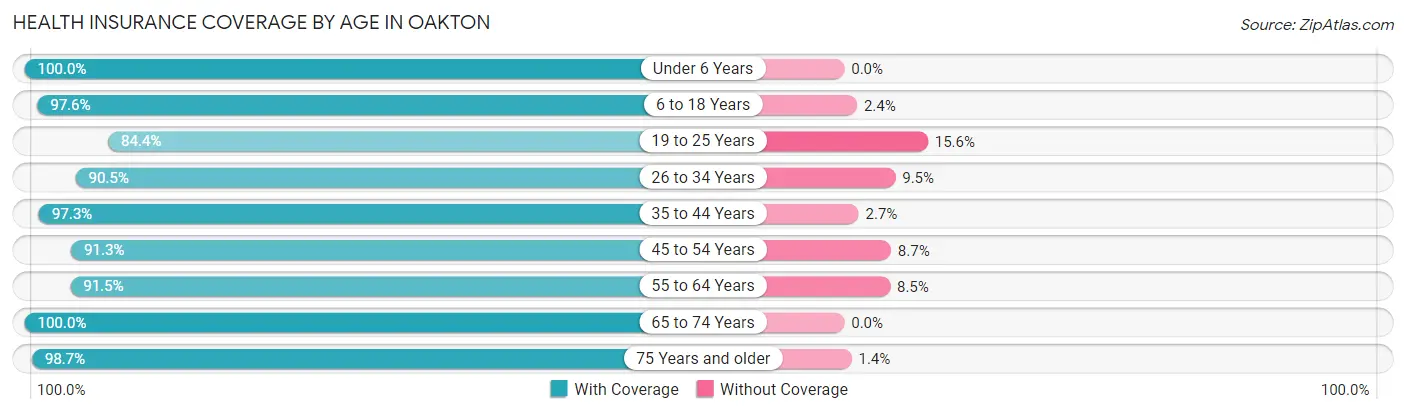
| Age Bracket | With Coverage | Without Coverage |
| Under 6 Years | 2,285 (100.0%) | 0 (0.0%) |
| 6 to 18 Years | 5,944 (97.6%) | 144 (2.4%) |
| 19 to 25 Years | 2,770 (84.4%) | 511 (15.6%) |
| 26 to 34 Years | 3,892 (90.5%) | 409 (9.5%) |
| 35 to 44 Years | 5,002 (97.3%) | 137 (2.7%) |
| 45 to 54 Years | 4,936 (91.3%) | 470 (8.7%) |
| 55 to 64 Years | 3,869 (91.5%) | 361 (8.5%) |
| 65 to 74 Years | 3,329 (100.0%) | 0 (0.0%) |
| 75 Years and older | 2,262 (98.7%) | 31 (1.3%) |
| Total | 34,289 (94.3%) | 2,063 (5.7%) |
Health Insurance Coverage by Citizenship Status in Oakton
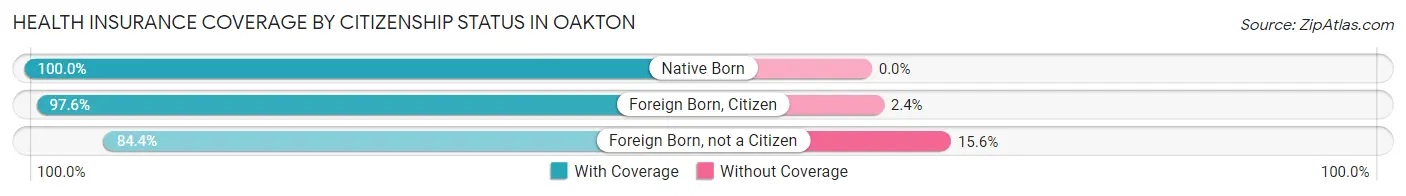
| Citizenship Status | With Coverage | Without Coverage |
| Native Born | 2,285 (100.0%) | 0 (0.0%) |
| Foreign Born, Citizen | 5,944 (97.6%) | 144 (2.4%) |
| Foreign Born, not a Citizen | 2,770 (84.4%) | 511 (15.6%) |
Health Insurance Coverage by Household Income in Oakton
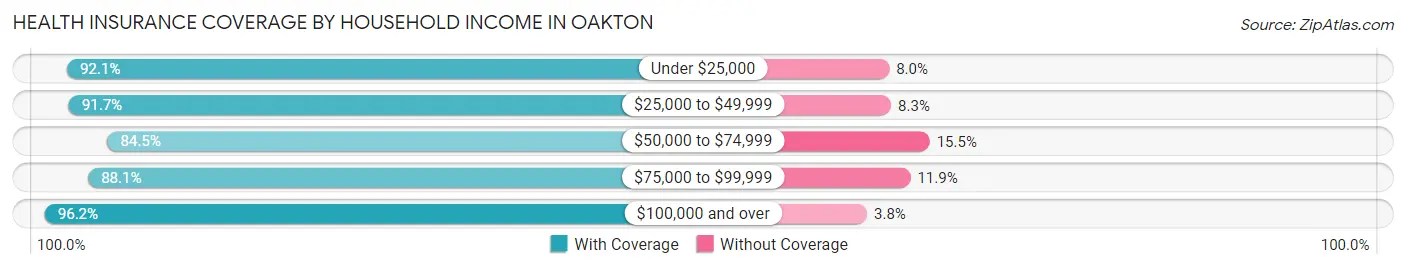
| Household Income | With Coverage | Without Coverage |
| Under $25,000 | 1,112 (92.0%) | 96 (8.0%) |
| $25,000 to $49,999 | 2,184 (91.7%) | 198 (8.3%) |
| $50,000 to $74,999 | 1,908 (84.5%) | 351 (15.5%) |
| $75,000 to $99,999 | 2,723 (88.1%) | 369 (11.9%) |
| $100,000 and over | 26,336 (96.2%) | 1,040 (3.8%) |
Public vs Private Health Insurance Coverage by Age in Oakton
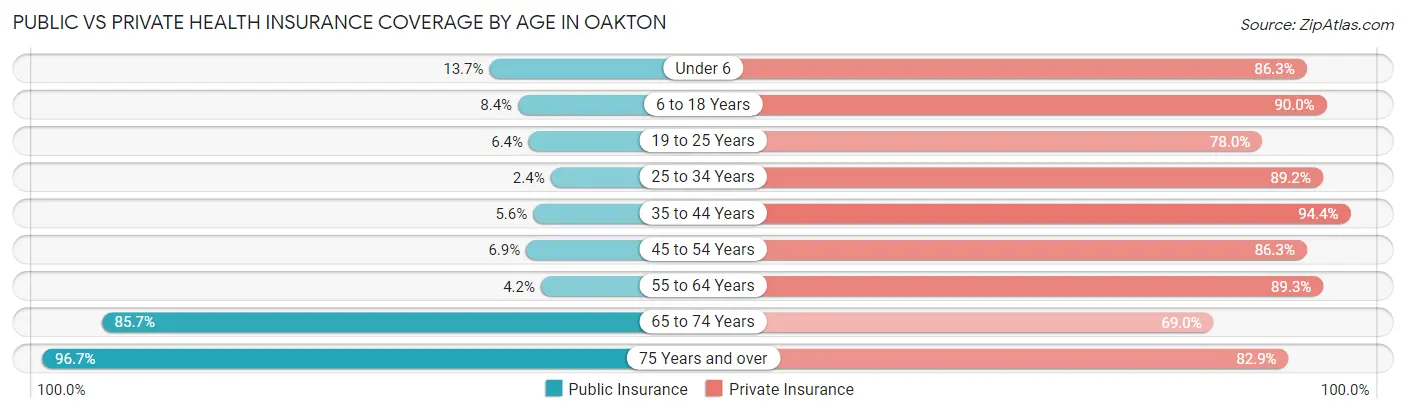
| Age Bracket | Public Insurance | Private Insurance |
| Under 6 | 314 (13.7%) | 1,971 (86.3%) |
| 6 to 18 Years | 513 (8.4%) | 5,476 (89.9%) |
| 19 to 25 Years | 210 (6.4%) | 2,560 (78.0%) |
| 25 to 34 Years | 103 (2.4%) | 3,838 (89.2%) |
| 35 to 44 Years | 289 (5.6%) | 4,851 (94.4%) |
| 45 to 54 Years | 374 (6.9%) | 4,665 (86.3%) |
| 55 to 64 Years | 177 (4.2%) | 3,779 (89.3%) |
| 65 to 74 Years | 2,853 (85.7%) | 2,297 (69.0%) |
| 75 Years and over | 2,218 (96.7%) | 1,901 (82.9%) |
| Total | 7,051 (19.4%) | 31,338 (86.2%) |
Disability Status by Sex by Age in Oakton
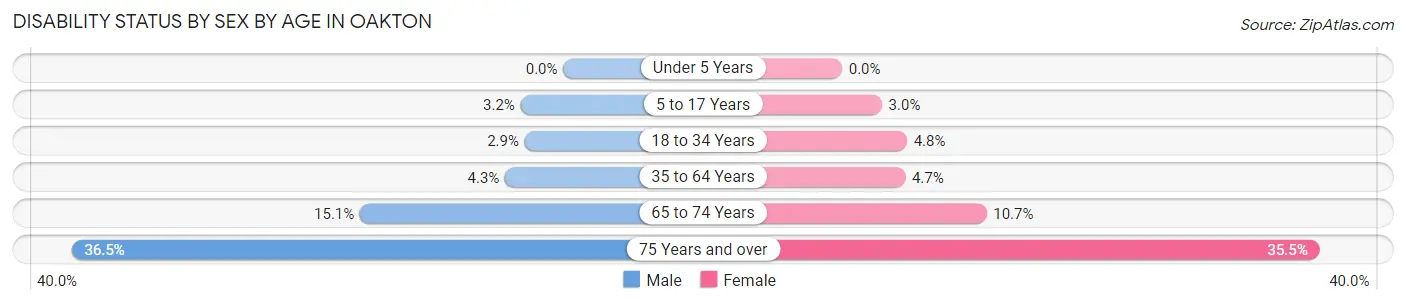
| Age Bracket | Male | Female |
| Under 5 Years | 0 (0.0%) | 0 (0.0%) |
| 5 to 17 Years | 98 (3.2%) | 88 (3.0%) |
| 18 to 34 Years | 120 (2.9%) | 184 (4.8%) |
| 35 to 64 Years | 317 (4.3%) | 349 (4.7%) |
| 65 to 74 Years | 238 (15.1%) | 188 (10.7%) |
| 75 Years and over | 371 (36.5%) | 453 (35.5%) |
Disability Class by Sex by Age in Oakton
Disability Class: Hearing Difficulty
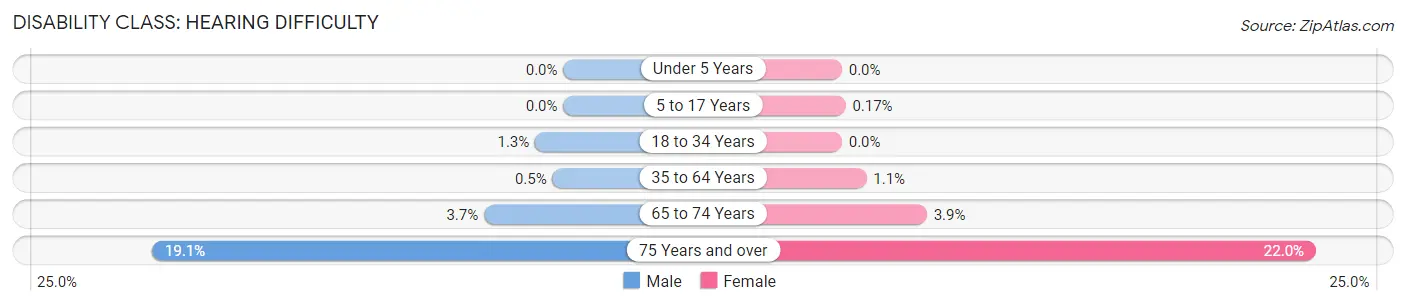
| Age Bracket | Male | Female |
| Under 5 Years | 0 (0.0%) | 0 (0.0%) |
| 5 to 17 Years | 0 (0.0%) | 5 (0.2%) |
| 18 to 34 Years | 55 (1.3%) | 0 (0.0%) |
| 35 to 64 Years | 37 (0.5%) | 85 (1.1%) |
| 65 to 74 Years | 58 (3.7%) | 69 (3.9%) |
| 75 Years and over | 194 (19.1%) | 281 (22.0%) |
Disability Class: Vision Difficulty
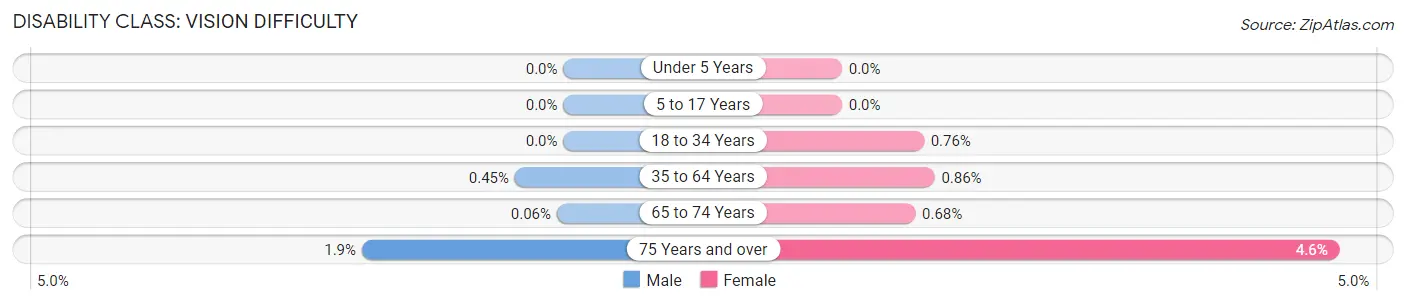
| Age Bracket | Male | Female |
| Under 5 Years | 0 (0.0%) | 0 (0.0%) |
| 5 to 17 Years | 0 (0.0%) | 0 (0.0%) |
| 18 to 34 Years | 0 (0.0%) | 29 (0.8%) |
| 35 to 64 Years | 33 (0.4%) | 64 (0.9%) |
| 65 to 74 Years | 1 (0.1%) | 12 (0.7%) |
| 75 Years and over | 19 (1.9%) | 59 (4.6%) |
Disability Class: Cognitive Difficulty
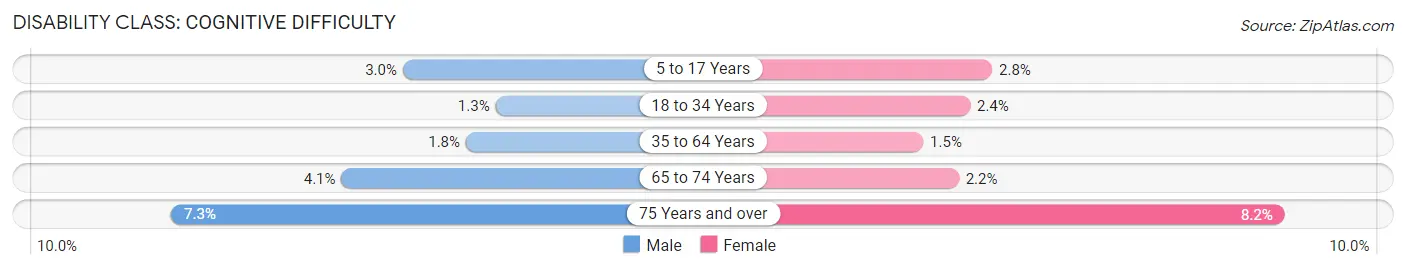
| Age Bracket | Male | Female |
| 5 to 17 Years | 92 (3.0%) | 83 (2.8%) |
| 18 to 34 Years | 53 (1.3%) | 91 (2.4%) |
| 35 to 64 Years | 133 (1.8%) | 112 (1.5%) |
| 65 to 74 Years | 65 (4.1%) | 38 (2.2%) |
| 75 Years and over | 74 (7.3%) | 105 (8.2%) |
Disability Class: Ambulatory Difficulty
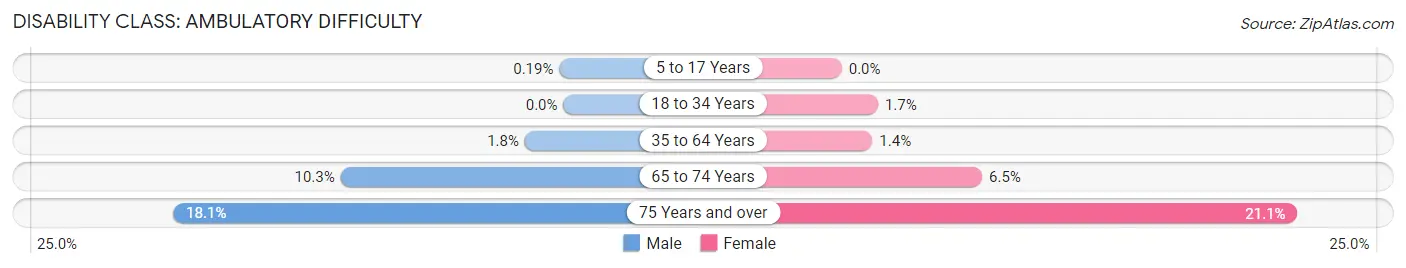
| Age Bracket | Male | Female |
| 5 to 17 Years | 6 (0.2%) | 0 (0.0%) |
| 18 to 34 Years | 0 (0.0%) | 64 (1.7%) |
| 35 to 64 Years | 131 (1.8%) | 106 (1.4%) |
| 65 to 74 Years | 163 (10.3%) | 114 (6.5%) |
| 75 Years and over | 184 (18.1%) | 270 (21.1%) |
Disability Class: Self-Care Difficulty
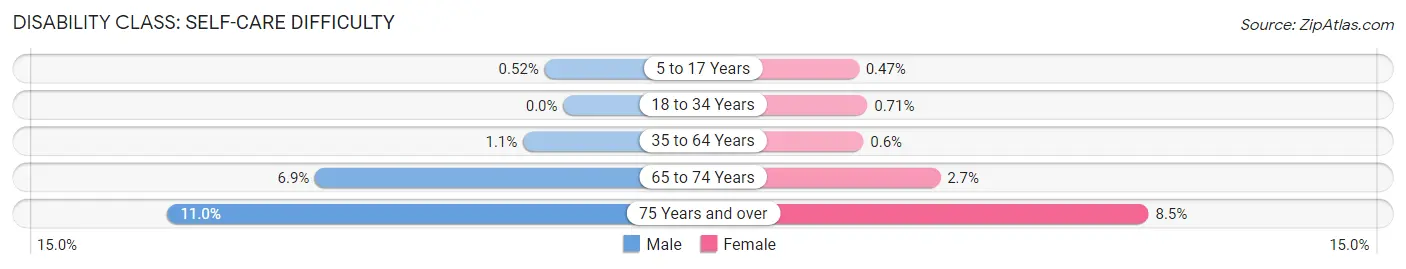
| Age Bracket | Male | Female |
| 5 to 17 Years | 16 (0.5%) | 14 (0.5%) |
| 18 to 34 Years | 0 (0.0%) | 27 (0.7%) |
| 35 to 64 Years | 82 (1.1%) | 45 (0.6%) |
| 65 to 74 Years | 109 (6.9%) | 48 (2.7%) |
| 75 Years and over | 112 (11.0%) | 109 (8.5%) |
Technology Access in Oakton
Computing Device Access in Oakton
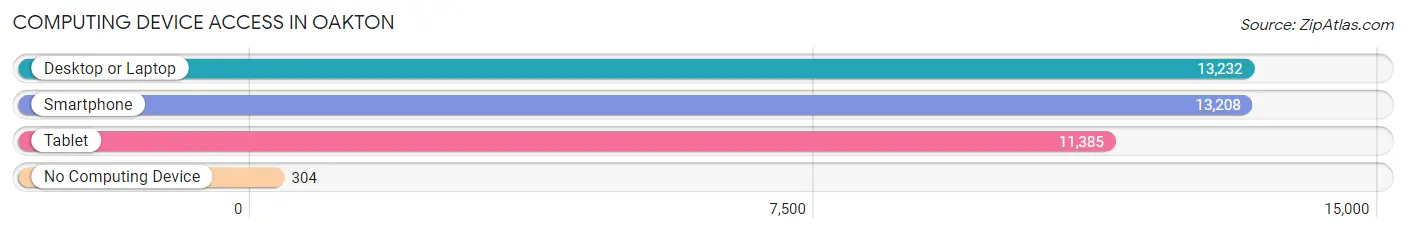
| Device Type | # Households | % Households |
| Desktop or Laptop | 13,232 | 94.0% |
| Smartphone | 13,208 | 93.9% |
| Tablet | 11,385 | 80.9% |
| No Computing Device | 304 | 2.2% |
| Total | 14,071 | 100.0% |
Internet Access in Oakton
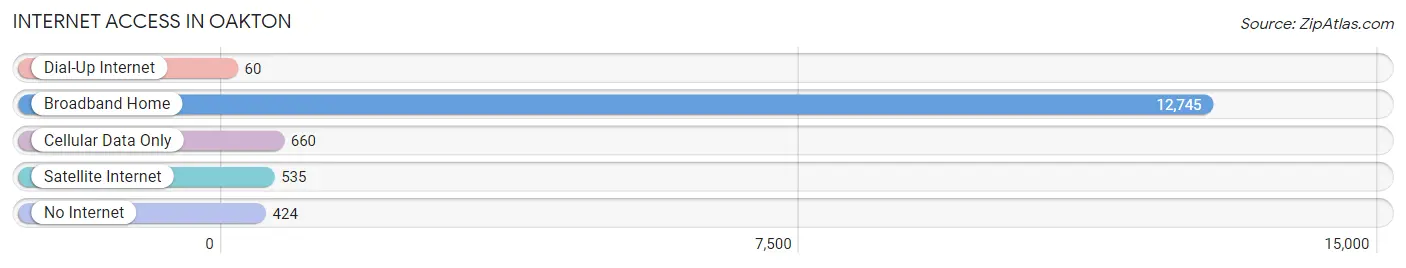
| Internet Type | # Households | % Households |
| Dial-Up Internet | 60 | 0.4% |
| Broadband Home | 12,745 | 90.6% |
| Cellular Data Only | 660 | 4.7% |
| Satellite Internet | 535 | 3.8% |
| No Internet | 424 | 3.0% |
| Total | 14,071 | 100.0% |
Oakton Summary
Oakton, Virginia is a census-designated place (CDP) located in Fairfax County, Virginia. It is situated approximately 20 miles west of Washington, D.C. and is part of the Washington metropolitan area. The population of Oakton was 34,166 at the 2010 census.
Geography
Oakton is located at 38°51'25" North, 77°19'45" West (38.856944, -77.329445). According to the United States Census Bureau, the CDP has a total area of 11.2 square miles, of which 11.1 square miles is land and 0.1 square miles is water.
Oakton is bordered by Vienna to the north, Fairfax to the east, Wolf Trap to the south, and Fair Lakes to the west. The area is served by Interstate 66, which runs east-west through the center of the CDP, and by the Dulles Toll Road, which runs north-south along the western edge of the CDP.
History
The area now known as Oakton was originally inhabited by Native Americans, including the Doeg and Piscataway tribes. The first European settlers arrived in the area in the late 1700s. The area was originally known as "Oak Town" due to the abundance of oak trees in the area. The name was eventually shortened to "Oakton".
In 1864, during the Civil War, the Battle of Oakton was fought in the area. The battle was a Confederate victory, and resulted in the Union forces retreating to Washington, D.C.
In the late 1800s, Oakton began to develop as a rural farming community. The area was served by the Washington and Old Dominion Railroad, which ran through the center of the CDP.
In the early 1900s, Oakton began to develop as a suburban community. The area was served by the Washington and Old Dominion Railroad, which ran through the center of the CDP. The railroad was eventually replaced by the Washington Metro in the 1970s.
Economy
Oakton is a primarily residential community, with a few small businesses located in the area. The largest employer in the area is the Fairfax County Government, which employs over 10,000 people in the area. Other major employers include the Fairfax County Public Schools, the Fairfax County Police Department, and the Fairfax County Fire and Rescue Department.
Demographics
As of the 2010 census, there were 34,166 people, 11,945 households, and 9,072 families residing in the CDP. The population density was 3,072.2 people per square mile. The racial makeup of the CDP was 74.2% White, 11.3% African American, 0.3% Native American, 10.7% Asian, 0.1% Pacific Islander, 1.3% from other races, and 2.3% from two or more races. Hispanic or Latino of any race were 5.2% of the population.
The median income for a household in the CDP was $117,837, and the median income for a family was $133,945. Males had a median income of $90,945 versus $60,945 for females. The per capita income for the CDP was $50,945. About 2.3% of families and 3.7% of the population were below the poverty line, including 4.2% of those under age 18 and 2.2% of those age 65 or over.
Conclusion
Oakton, Virginia is a census-designated place located in Fairfax County, Virginia. It is situated approximately 20 miles west of Washington, D.C. and is part of the Washington metropolitan area. The population of Oakton was 34,166 at the 2010 census. The area is primarily residential, with a few small businesses located in the area. The largest employer in the area is the Fairfax County Government. The racial makeup of the CDP was 74.2% White, 11.3% African American, 0.3% Native American, 10.7% Asian, 0.1% Pacific Islander, 1.3% from other races, and 2.3% from two or more races. The median income for a household in the CDP was $117,837, and the median income for a family was $133,945. Oakton is a vibrant community with a rich history and a bright future.
Common Questions
What is Per Capita Income in Oakton?
Per Capita income in Oakton is $78,264.
What is the Median Family Income in Oakton?
Median Family Income in Oakton is $190,068.
What is the Median Household income in Oakton?
Median Household Income in Oakton is $158,343.
What is Income or Wage Gap in Oakton?
Income or Wage Gap in Oakton is 31.9%.
Women in Oakton earn 68.1 cents for every dollar earned by a man.
What is Inequality or Gini Index in Oakton?
Inequality or Gini Index in Oakton is 0.43.
What is the Total Population of Oakton?
Total Population of Oakton is 36,529.
What is the Total Male Population of Oakton?
Total Male Population of Oakton is 18,234.
What is the Total Female Population of Oakton?
Total Female Population of Oakton is 18,295.
What is the Ratio of Males per 100 Females in Oakton?
There are 99.67 Males per 100 Females in Oakton.
What is the Ratio of Females per 100 Males in Oakton?
There are 100.33 Females per 100 Males in Oakton.
What is the Median Population Age in Oakton?
Median Population Age in Oakton is 39.5 Years.
What is the Average Family Size in Oakton
Average Family Size in Oakton is 3.2 People.
What is the Average Household Size in Oakton
Average Household Size in Oakton is 2.6 People.
How Large is the Labor Force in Oakton?
There are 20,808 People in the Labor Forcein in Oakton.
What is the Percentage of People in the Labor Force in Oakton?
70.0% of People are in the Labor Force in Oakton.
What is the Unemployment Rate in Oakton?
Unemployment Rate in Oakton is 3.3%.