Madison Heights, MI Map & Demographics
Madison Heights Map
Madison Heights Overview
$37,113
PER CAPITA INCOME
$75,505
AVG FAMILY INCOME
$63,224
AVG HOUSEHOLD INCOME
23.6%
WAGE / INCOME GAP [ % ]
76.4¢/ $1
WAGE / INCOME GAP [ $ ]
0.40
INEQUALITY / GINI INDEX
28,521
TOTAL POPULATION
14,048
MALE POPULATION
14,473
FEMALE POPULATION
97.06
MALES / 100 FEMALES
103.03
FEMALES / 100 MALES
40.5
MEDIAN AGE
3.0
AVG FAMILY SIZE
2.1
AVG HOUSEHOLD SIZE
16,857
LABOR FORCE [ PEOPLE ]
68.8%
PERCENT IN LABOR FORCE
3.6%
UNEMPLOYMENT RATE
Madison Heights Zip Codes
Madison Heights Area Codes
Income in Madison Heights
Income Overview in Madison Heights
Per Capita Income in Madison Heights is $37,113, while median incomes of families and households are $75,505 and $63,224 respectively.
| Characteristic | Number | Measure |
| Per Capita Income | 28,521 | $37,113 |
| Median Family Income | 6,387 | $75,505 |
| Mean Family Income | 6,387 | $91,351 |
| Median Household Income | 13,459 | $63,224 |
| Mean Household Income | 13,459 | $76,670 |
| Income Deficit | 6,387 | $0 |
| Wage / Income Gap (%) | 28,521 | 23.64% |
| Wage / Income Gap ($) | 28,521 | 76.36¢ per $1 |
| Gini / Inequality Index | 28,521 | 0.40 |
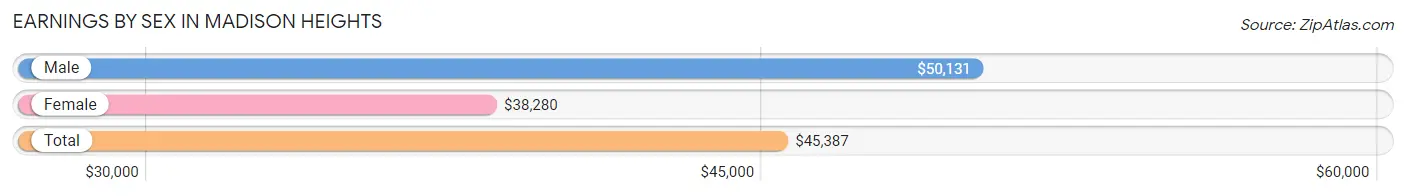
Earnings by Sex in Madison Heights
Average Earnings in Madison Heights are $45,387, $50,131 for men and $38,280 for women, a difference of 23.6%.
| Sex | Number | Average Earnings |
| Male | 9,149 (53.6%) | $50,131 |
| Female | 7,928 (46.4%) | $38,280 |
| Total | 17,077 (100.0%) | $45,387 |
Earnings by Sex by Income Bracket in Madison Heights
The most common earnings brackets in Madison Heights are $100,000+ for men (1,087 | 11.9%) and $75,000 to $99,999 for women (951 | 12.0%).
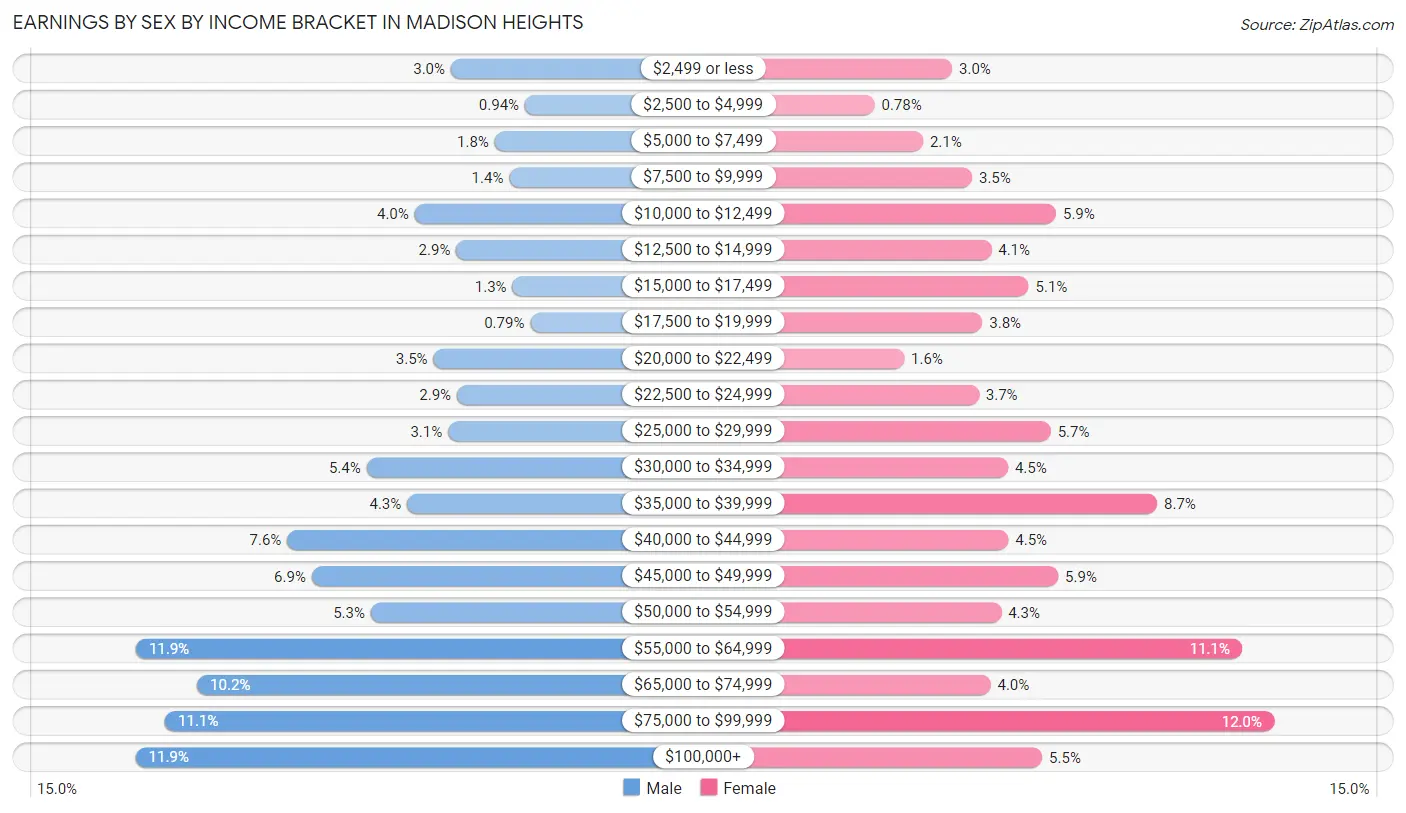
| Income | Male | Female |
| $2,499 or less | 276 (3.0%) | 235 (3.0%) |
| $2,500 to $4,999 | 86 (0.9%) | 62 (0.8%) |
| $5,000 to $7,499 | 164 (1.8%) | 170 (2.1%) |
| $7,500 to $9,999 | 126 (1.4%) | 279 (3.5%) |
| $10,000 to $12,499 | 370 (4.0%) | 466 (5.9%) |
| $12,500 to $14,999 | 263 (2.9%) | 322 (4.1%) |
| $15,000 to $17,499 | 118 (1.3%) | 405 (5.1%) |
| $17,500 to $19,999 | 72 (0.8%) | 302 (3.8%) |
| $20,000 to $22,499 | 321 (3.5%) | 128 (1.6%) |
| $22,500 to $24,999 | 261 (2.9%) | 294 (3.7%) |
| $25,000 to $29,999 | 284 (3.1%) | 454 (5.7%) |
| $30,000 to $34,999 | 493 (5.4%) | 359 (4.5%) |
| $35,000 to $39,999 | 389 (4.3%) | 691 (8.7%) |
| $40,000 to $44,999 | 697 (7.6%) | 360 (4.5%) |
| $45,000 to $49,999 | 634 (6.9%) | 471 (5.9%) |
| $50,000 to $54,999 | 482 (5.3%) | 344 (4.3%) |
| $55,000 to $64,999 | 1,086 (11.9%) | 880 (11.1%) |
| $65,000 to $74,999 | 929 (10.2%) | 320 (4.0%) |
| $75,000 to $99,999 | 1,011 (11.1%) | 951 (12.0%) |
| $100,000+ | 1,087 (11.9%) | 435 (5.5%) |
| Total | 9,149 (100.0%) | 7,928 (100.0%) |
Earnings by Sex by Educational Attainment in Madison Heights
Average earnings in Madison Heights are $55,665 for men and $41,683 for women, a difference of 25.1%. Men with an educational attainment of bachelor's degree enjoy the highest average annual earnings of $69,366, while those with less than high school education earn the least with $31,492. Women with an educational attainment of graduate degree earn the most with the average annual earnings of $63,722, while those with less than high school education have the smallest earnings of $25,288.
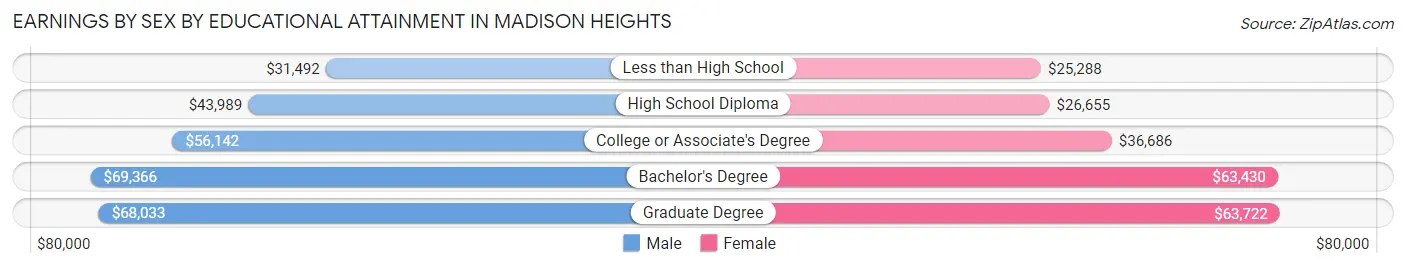
| Educational Attainment | Male Income | Female Income |
| Less than High School | $31,492 | $25,288 |
| High School Diploma | $43,989 | $26,655 |
| College or Associate's Degree | $56,142 | $36,686 |
| Bachelor's Degree | $69,366 | $63,430 |
| Graduate Degree | $68,033 | $63,722 |
| Total | $55,665 | $41,683 |
Family Income in Madison Heights
Family Income Brackets in Madison Heights
According to the Madison Heights family income data, there are 1,699 families falling into the $100,000 to $149,999 income range, which is the most common income bracket and makes up 26.6% of all families. Conversely, the less than $10,000 income bracket is the least frequent group with only 121 families (1.9%) belonging to this category.
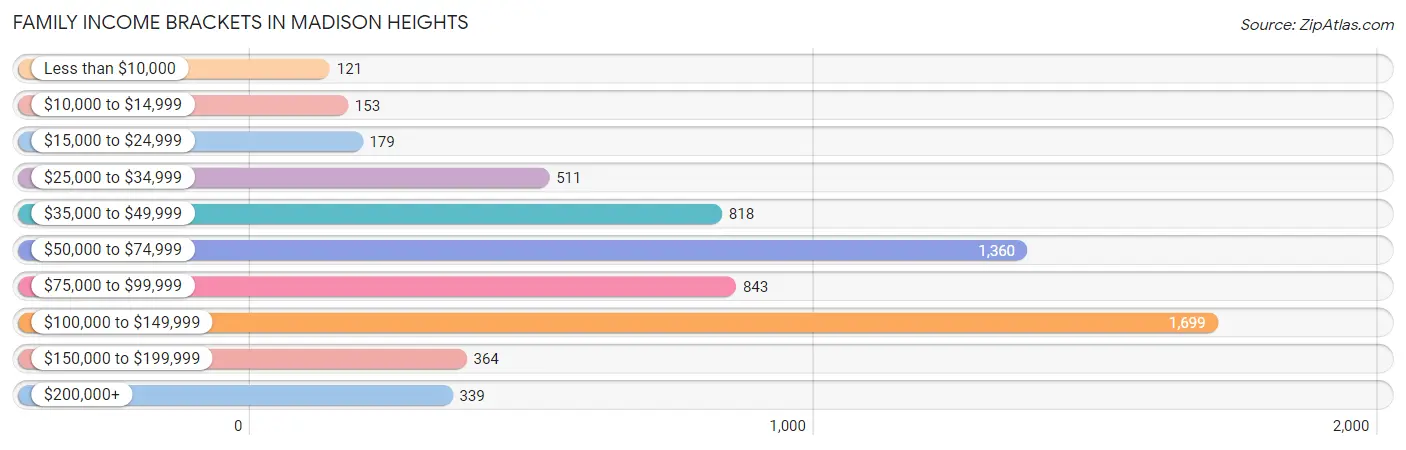
| Income Bracket | # Families | % Families |
| Less than $10,000 | 121 | 1.9% |
| $10,000 to $14,999 | 153 | 2.4% |
| $15,000 to $24,999 | 179 | 2.8% |
| $25,000 to $34,999 | 511 | 8.0% |
| $35,000 to $49,999 | 818 | 12.8% |
| $50,000 to $74,999 | 1,360 | 21.3% |
| $75,000 to $99,999 | 843 | 13.2% |
| $100,000 to $149,999 | 1,699 | 26.6% |
| $150,000 to $199,999 | 364 | 5.7% |
| $200,000+ | 339 | 5.3% |
Family Income by Famaliy Size in Madison Heights
6-person families (152 | 2.4%) account for the highest median family income in Madison Heights with $235,187 per family, while 6-person families (152 | 2.4%) have the highest median income of $39,198 per family member.
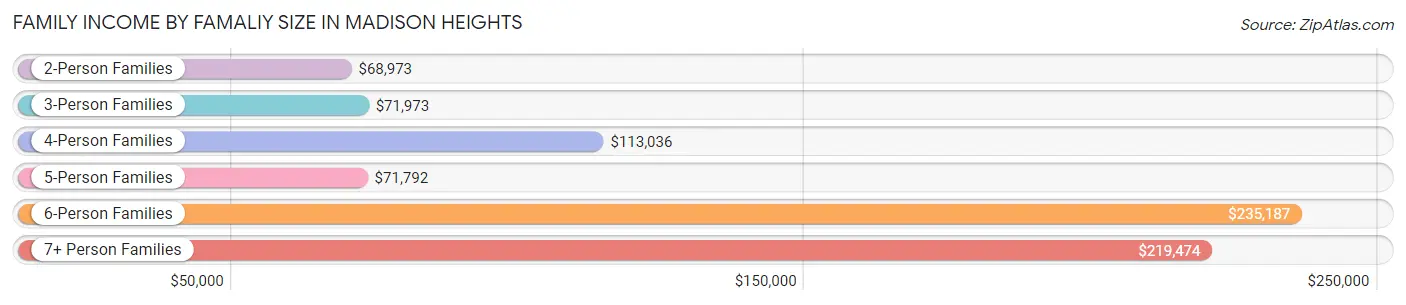
| Income Bracket | # Families | Median Income |
| 2-Person Families | 3,250 (50.9%) | $68,973 |
| 3-Person Families | 1,467 (23.0%) | $71,973 |
| 4-Person Families | 1,124 (17.6%) | $113,036 |
| 5-Person Families | 330 (5.2%) | $71,792 |
| 6-Person Families | 152 (2.4%) | $235,187 |
| 7+ Person Families | 64 (1.0%) | $219,474 |
| Total | 6,387 (100.0%) | $75,505 |
Family Income by Number of Earners in Madison Heights
The median family income in Madison Heights is $75,505, with families comprising 3+ earners (670) having the highest median family income of $127,273, while families with no earners (981) have the lowest median family income of $40,804, accounting for 10.5% and 15.4% of families, respectively.
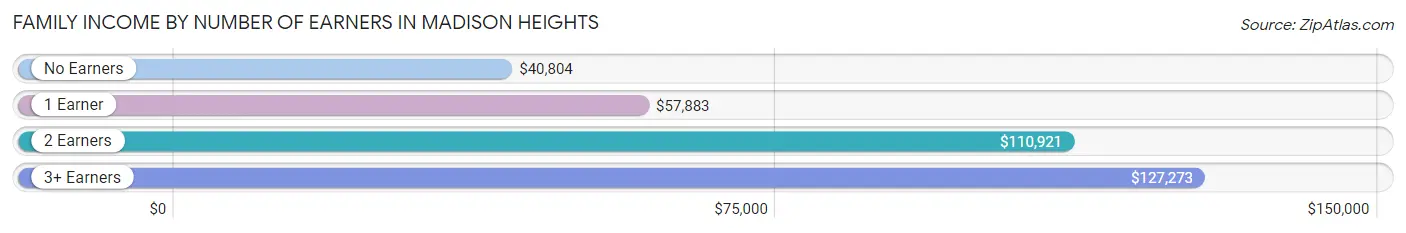
| Number of Earners | # Families | Median Income |
| No Earners | 981 (15.4%) | $40,804 |
| 1 Earner | 1,876 (29.4%) | $57,883 |
| 2 Earners | 2,860 (44.8%) | $110,921 |
| 3+ Earners | 670 (10.5%) | $127,273 |
| Total | 6,387 (100.0%) | $75,505 |
Household Income in Madison Heights
Household Income Brackets in Madison Heights
With 2,894 households falling in the category, the $50,000 to $74,999 income range is the most frequent in Madison Heights, accounting for 21.5% of all households. In contrast, only 404 households (3.0%) fall into the $200,000+ income bracket, making it the least populous group.
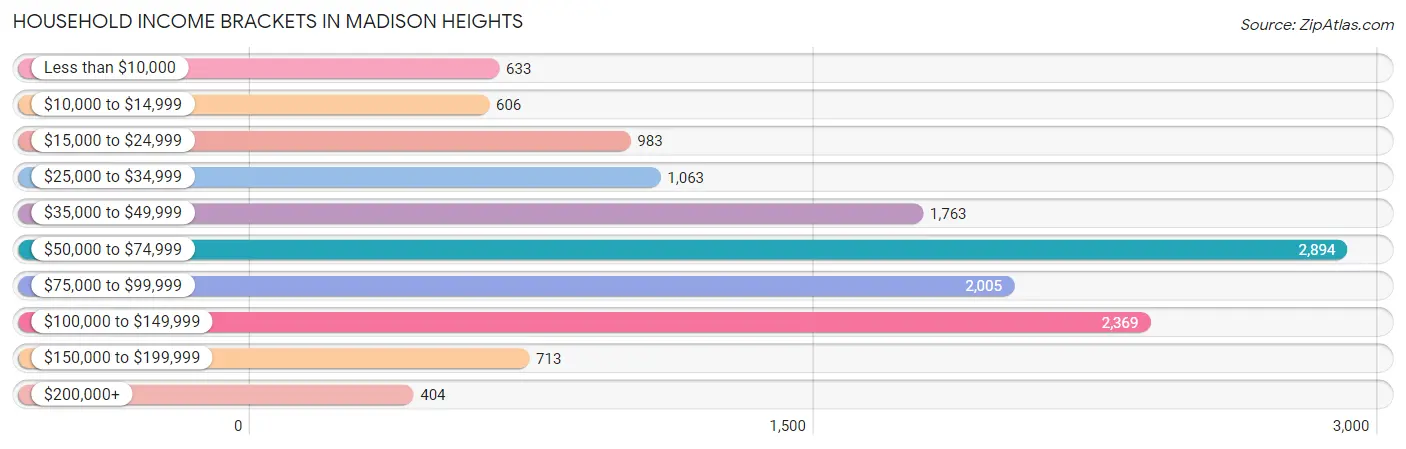
| Income Bracket | # Households | % Households |
| Less than $10,000 | 633 | 4.7% |
| $10,000 to $14,999 | 606 | 4.5% |
| $15,000 to $24,999 | 983 | 7.3% |
| $25,000 to $34,999 | 1,063 | 7.9% |
| $35,000 to $49,999 | 1,763 | 13.1% |
| $50,000 to $74,999 | 2,894 | 21.5% |
| $75,000 to $99,999 | 2,005 | 14.9% |
| $100,000 to $149,999 | 2,369 | 17.6% |
| $150,000 to $199,999 | 713 | 5.3% |
| $200,000+ | 404 | 3.0% |
Household Income by Householder Age in Madison Heights
The median household income in Madison Heights is $63,224, with the highest median household income of $73,772 found in the 25 to 44 years age bracket for the primary householder. A total of 4,926 households (36.6%) fall into this category. Meanwhile, the 65+ years age bracket for the primary householder has the lowest median household income of $37,310, with 3,299 households (24.5%) in this group.
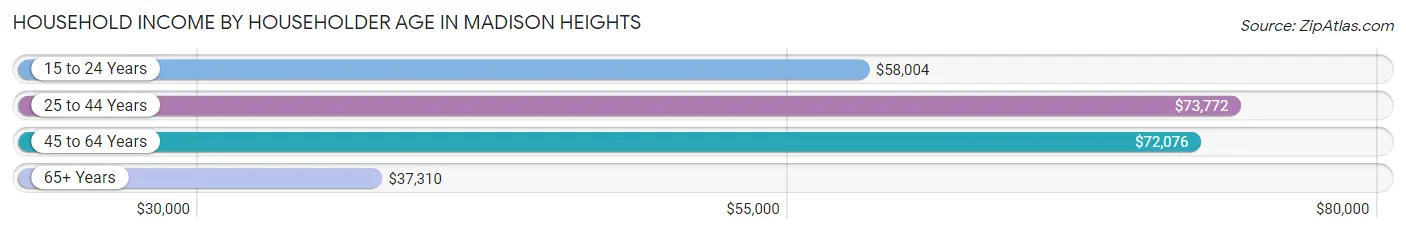
| Income Bracket | # Households | Median Income |
| 15 to 24 Years | 573 (4.3%) | $58,004 |
| 25 to 44 Years | 4,926 (36.6%) | $73,772 |
| 45 to 64 Years | 4,661 (34.6%) | $72,076 |
| 65+ Years | 3,299 (24.5%) | $37,310 |
| Total | 13,459 (100.0%) | $63,224 |
Poverty in Madison Heights
Income Below Poverty by Sex and Age in Madison Heights
With 10.2% poverty level for males and 13.8% for females among the residents of Madison Heights, 15 year old males and 16 and 17 year old females are the most vulnerable to poverty, with 22 males (75.9%) and 100 females (42.5%) in their respective age groups living below the poverty level.
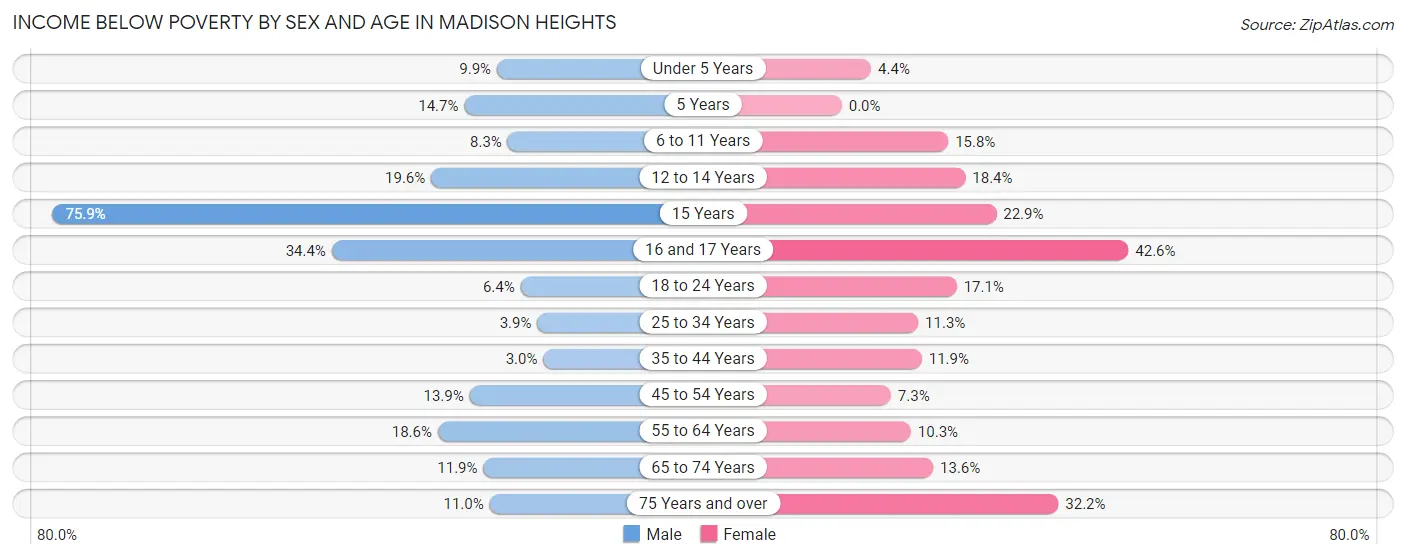
| Age Bracket | Male | Female |
| Under 5 Years | 50 (9.9%) | 23 (4.4%) |
| 5 Years | 15 (14.7%) | 0 (0.0%) |
| 6 to 11 Years | 57 (8.3%) | 142 (15.8%) |
| 12 to 14 Years | 99 (19.6%) | 78 (18.3%) |
| 15 Years | 22 (75.9%) | 39 (22.9%) |
| 16 and 17 Years | 97 (34.4%) | 100 (42.5%) |
| 18 to 24 Years | 84 (6.4%) | 179 (17.1%) |
| 25 to 34 Years | 115 (3.9%) | 268 (11.3%) |
| 35 to 44 Years | 53 (3.0%) | 208 (11.9%) |
| 45 to 54 Years | 300 (13.9%) | 159 (7.3%) |
| 55 to 64 Years | 313 (18.6%) | 189 (10.3%) |
| 65 to 74 Years | 136 (11.9%) | 221 (13.6%) |
| 75 Years and over | 91 (11.0%) | 373 (32.2%) |
| Total | 1,432 (10.2%) | 1,979 (13.8%) |
Income Above Poverty by Sex and Age in Madison Heights
According to the poverty statistics in Madison Heights, males aged 35 to 44 years and females aged 5 years are the age groups that are most secure financially, with 97.0% of males and 100.0% of females in these age groups living above the poverty line.
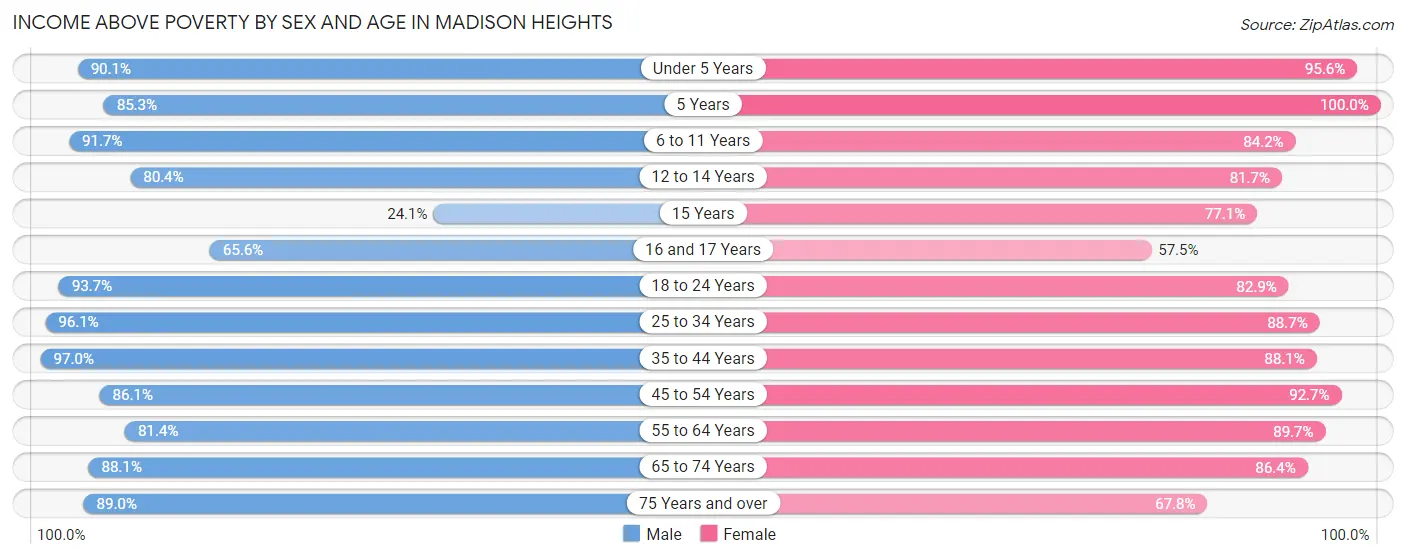
| Age Bracket | Male | Female |
| Under 5 Years | 457 (90.1%) | 505 (95.6%) |
| 5 Years | 87 (85.3%) | 101 (100.0%) |
| 6 to 11 Years | 632 (91.7%) | 757 (84.2%) |
| 12 to 14 Years | 405 (80.4%) | 347 (81.7%) |
| 15 Years | 7 (24.1%) | 131 (77.1%) |
| 16 and 17 Years | 185 (65.6%) | 135 (57.5%) |
| 18 to 24 Years | 1,239 (93.6%) | 870 (82.9%) |
| 25 to 34 Years | 2,856 (96.1%) | 2,095 (88.7%) |
| 35 to 44 Years | 1,726 (97.0%) | 1,543 (88.1%) |
| 45 to 54 Years | 1,853 (86.1%) | 2,023 (92.7%) |
| 55 to 64 Years | 1,366 (81.4%) | 1,654 (89.7%) |
| 65 to 74 Years | 1,009 (88.1%) | 1,409 (86.4%) |
| 75 Years and over | 739 (89.0%) | 787 (67.8%) |
| Total | 12,561 (89.8%) | 12,357 (86.2%) |
Income Below Poverty Among Married-Couple Families in Madison Heights
The poverty statistics for married-couple families in Madison Heights show that 6.9% or 313 of the total 4,570 families live below the poverty line. Families with 3 or 4 children have the highest poverty rate of 18.0%, comprising of 39 families. On the other hand, families with 5 or more children have the lowest poverty rate of 0.0%, which includes 0 families.
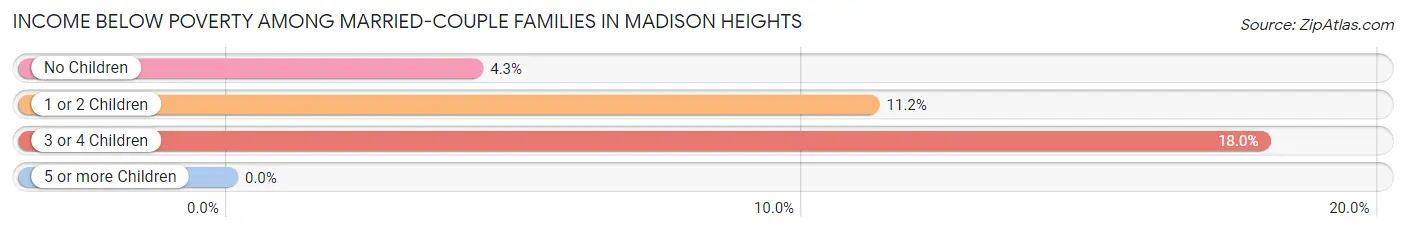
| Children | Above Poverty | Below Poverty |
| No Children | 2,915 (95.7%) | 130 (4.3%) |
| 1 or 2 Children | 1,145 (88.8%) | 144 (11.2%) |
| 3 or 4 Children | 178 (82.0%) | 39 (18.0%) |
| 5 or more Children | 19 (100.0%) | 0 (0.0%) |
| Total | 4,257 (93.1%) | 313 (6.9%) |
Income Below Poverty Among Single-Parent Households in Madison Heights
According to the poverty data in Madison Heights, 4.0% or 18 single-father households and 10.9% or 149 single-mother households are living below the poverty line. Among single-father households, those with no children have the highest poverty rate, with 10 households (5.7%) experiencing poverty. Likewise, among single-mother households, those with 3 or 4 children have the highest poverty rate, with 62 households (100.0%) falling below the poverty line.
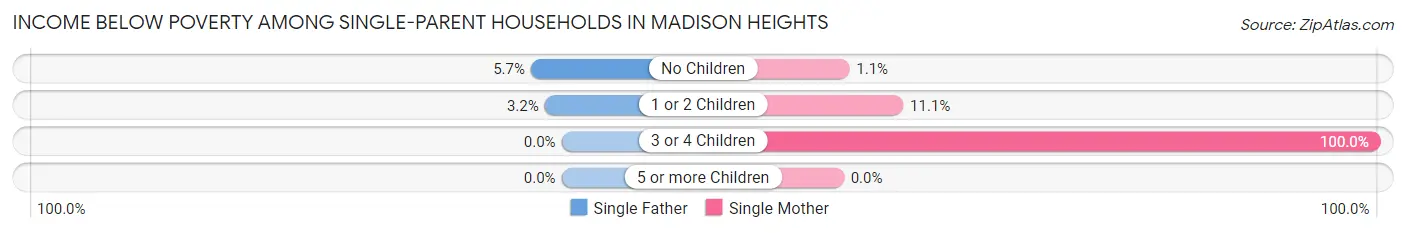
| Children | Single Father | Single Mother |
| No Children | 10 (5.7%) | 6 (1.1%) |
| 1 or 2 Children | 8 (3.2%) | 81 (11.1%) |
| 3 or 4 Children | 0 (0.0%) | 62 (100.0%) |
| 5 or more Children | 0 (0.0%) | 0 (0.0%) |
| Total | 18 (4.0%) | 149 (10.9%) |
Income Below Poverty Among Married-Couple vs Single-Parent Households in Madison Heights
The poverty data for Madison Heights shows that 313 of the married-couple family households (6.9%) and 167 of the single-parent households (9.2%) are living below the poverty level. Within the married-couple family households, those with 3 or 4 children have the highest poverty rate, with 39 households (18.0%) falling below the poverty line. Among the single-parent households, those with 3 or 4 children have the highest poverty rate, with 62 household (76.5%) living below poverty.
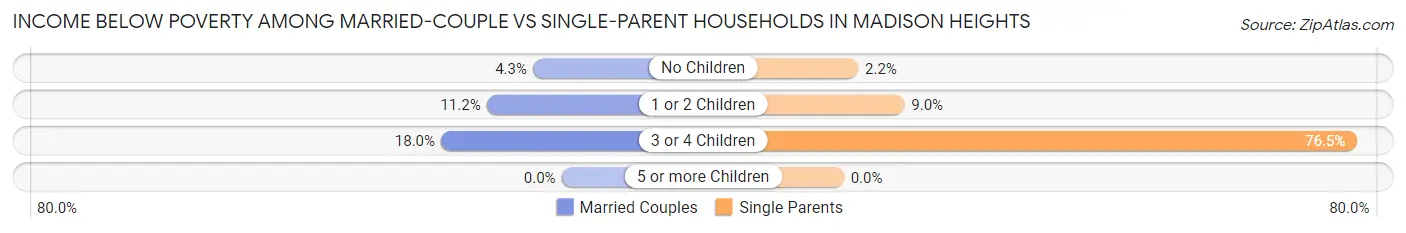
| Children | Married-Couple Families | Single-Parent Households |
| No Children | 130 (4.3%) | 16 (2.1%) |
| 1 or 2 Children | 144 (11.2%) | 89 (9.0%) |
| 3 or 4 Children | 39 (18.0%) | 62 (76.5%) |
| 5 or more Children | 0 (0.0%) | 0 (0.0%) |
| Total | 313 (6.9%) | 167 (9.2%) |
Race in Madison Heights
The most populous races in Madison Heights are White / Caucasian (23,340 | 81.8%), Black / African American (2,094 | 7.3%), and Asian (1,822 | 6.4%).
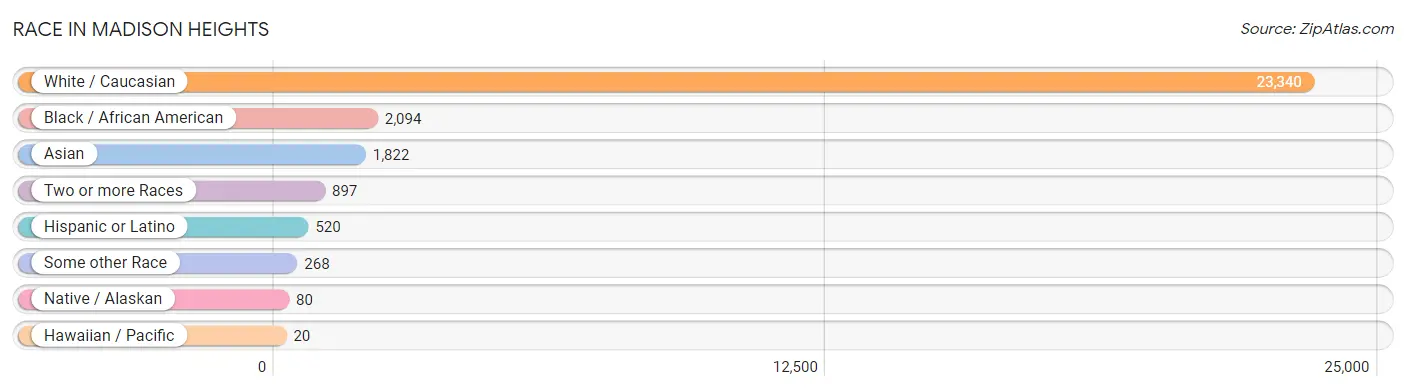
| Race | # Population | % Population |
| Asian | 1,822 | 6.4% |
| Black / African American | 2,094 | 7.3% |
| Hawaiian / Pacific | 20 | 0.1% |
| Hispanic or Latino | 520 | 1.8% |
| Native / Alaskan | 80 | 0.3% |
| White / Caucasian | 23,340 | 81.8% |
| Two or more Races | 897 | 3.2% |
| Some other Race | 268 | 0.9% |
| Total | 28,521 | 100.0% |
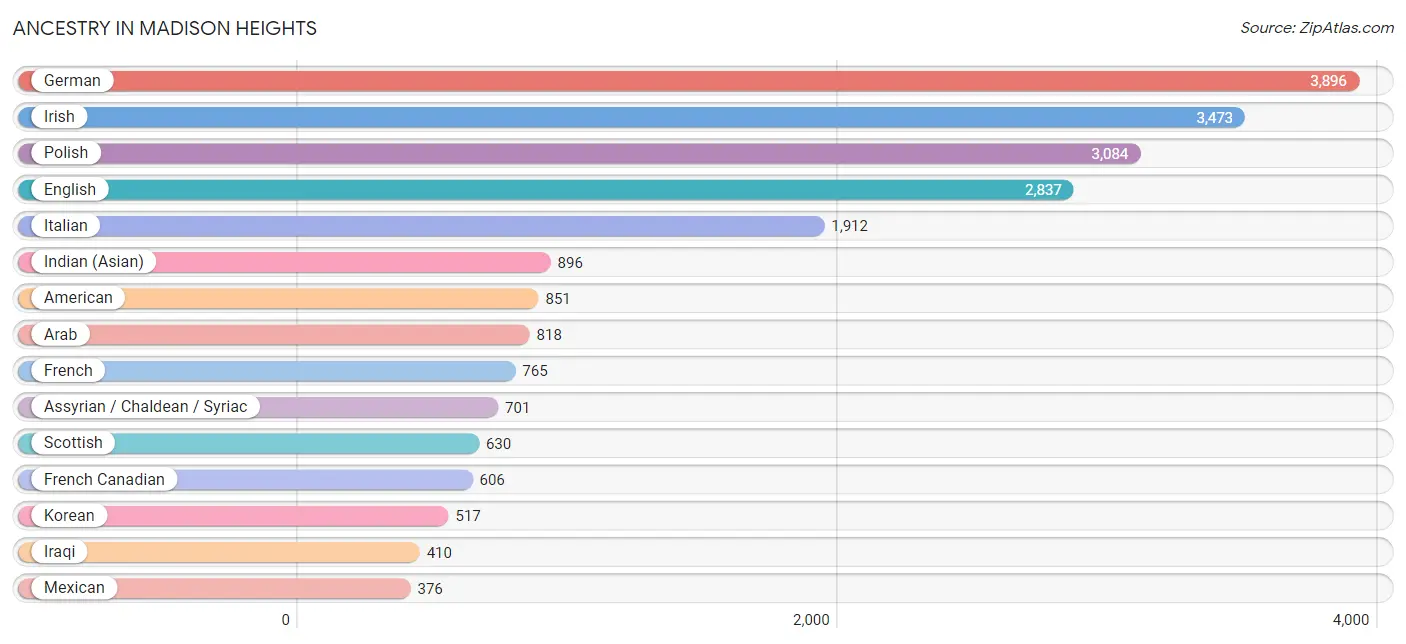
Ancestry in Madison Heights
The most populous ancestries reported in Madison Heights are German (3,896 | 13.7%), Irish (3,473 | 12.2%), Polish (3,084 | 10.8%), English (2,837 | 10.0%), and Italian (1,912 | 6.7%), together accounting for 53.3% of all Madison Heights residents.
| Ancestry | # Population | % Population |
| African | 41 | 0.1% |
| Albanian | 145 | 0.5% |
| American | 851 | 3.0% |
| Arab | 818 | 2.9% |
| Armenian | 224 | 0.8% |
| Assyrian / Chaldean / Syriac | 701 | 2.5% |
| Australian | 17 | 0.1% |
| Austrian | 23 | 0.1% |
| Belgian | 123 | 0.4% |
| Bhutanese | 31 | 0.1% |
| British | 140 | 0.5% |
| Burmese | 171 | 0.6% |
| Cajun | 16 | 0.1% |
| Canadian | 218 | 0.8% |
| Central American | 13 | 0.1% |
| Central American Indian | 18 | 0.1% |
| Cherokee | 78 | 0.3% |
| Chilean | 36 | 0.1% |
| Croatian | 27 | 0.1% |
| Czech | 38 | 0.1% |
| Danish | 17 | 0.1% |
| Dutch | 195 | 0.7% |
| Eastern European | 236 | 0.8% |
| Egyptian | 69 | 0.2% |
| English | 2,837 | 10.0% |
| European | 340 | 1.2% |
| Finnish | 167 | 0.6% |
| French | 765 | 2.7% |
| French Canadian | 606 | 2.1% |
| German | 3,896 | 13.7% |
| Ghanaian | 19 | 0.1% |
| Greek | 117 | 0.4% |
| Hungarian | 189 | 0.7% |
| Indian (Asian) | 896 | 3.1% |
| Iraqi | 410 | 1.4% |
| Irish | 3,473 | 12.2% |
| Israeli | 13 | 0.1% |
| Italian | 1,912 | 6.7% |
| Korean | 517 | 1.8% |
| Latvian | 20 | 0.1% |
| Lebanese | 135 | 0.5% |
| Lithuanian | 81 | 0.3% |
| Lumbee | 47 | 0.2% |
| Macedonian | 141 | 0.5% |
| Malaysian | 9 | 0.0% |
| Mexican | 376 | 1.3% |
| Mongolian | 9 | 0.0% |
| Native Hawaiian | 7 | 0.0% |
| Nigerian | 19 | 0.1% |
| Northern European | 8 | 0.0% |
| Norwegian | 175 | 0.6% |
| Pakistani | 14 | 0.1% |
| Polish | 3,084 | 10.8% |
| Puerto Rican | 63 | 0.2% |
| Romanian | 258 | 0.9% |
| Russian | 170 | 0.6% |
| Salvadoran | 13 | 0.1% |
| Samoan | 20 | 0.1% |
| Scandinavian | 29 | 0.1% |
| Scotch-Irish | 180 | 0.6% |
| Scottish | 630 | 2.2% |
| Slovak | 99 | 0.4% |
| Slovene | 200 | 0.7% |
| South American | 36 | 0.1% |
| Spanish American | 14 | 0.1% |
| Sri Lankan | 289 | 1.0% |
| Subsaharan African | 60 | 0.2% |
| Swedish | 169 | 0.6% |
| Syrian | 40 | 0.1% |
| Thai | 191 | 0.7% |
| Trinidadian and Tobagonian | 21 | 0.1% |
| Ukrainian | 82 | 0.3% |
| Welsh | 118 | 0.4% |
| Yugoslavian | 11 | 0.0% | View All 74 Rows |
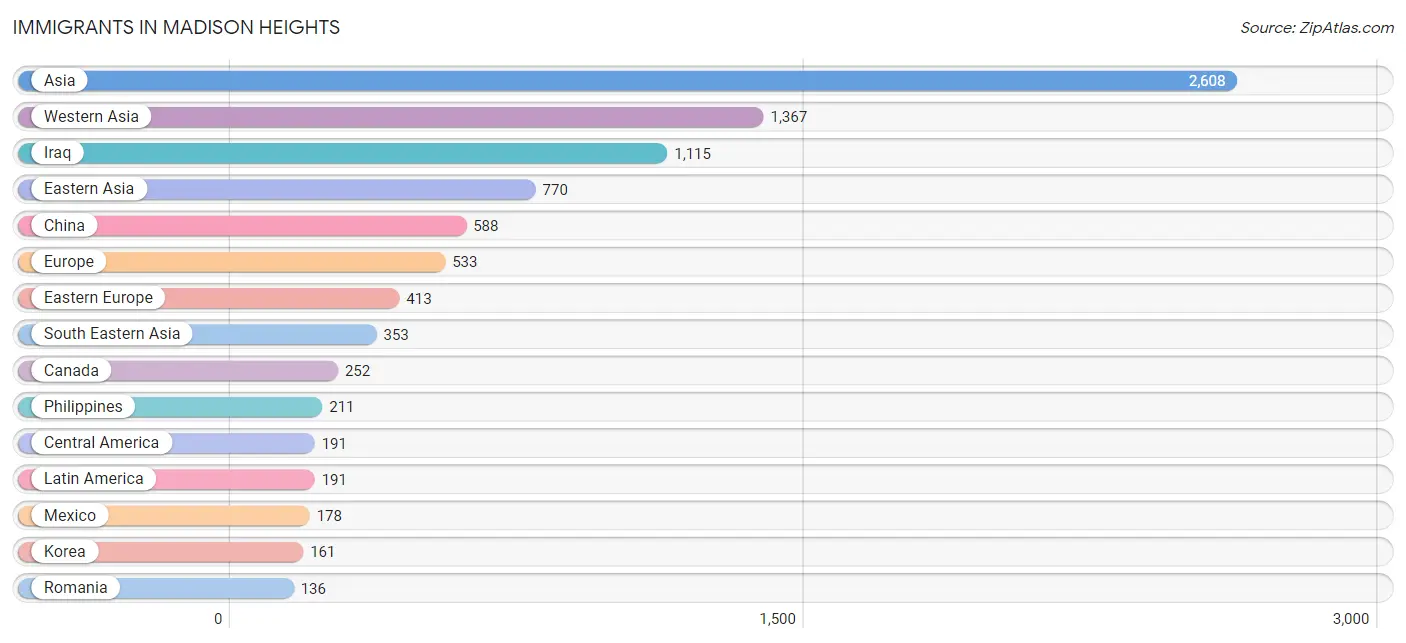
Immigrants in Madison Heights
The most numerous immigrant groups reported in Madison Heights came from Asia (2,608 | 9.1%), Western Asia (1,367 | 4.8%), Iraq (1,115 | 3.9%), Eastern Asia (770 | 2.7%), and China (588 | 2.1%), together accounting for 22.6% of all Madison Heights residents.
| Immigration Origin | # Population | % Population |
| Africa | 73 | 0.3% |
| Albania | 65 | 0.2% |
| Armenia | 108 | 0.4% |
| Asia | 2,608 | 9.1% |
| Australia | 23 | 0.1% |
| Bangladesh | 35 | 0.1% |
| Bosnia and Herzegovina | 126 | 0.4% |
| Canada | 252 | 0.9% |
| Central America | 191 | 0.7% |
| China | 588 | 2.1% |
| Eastern Africa | 20 | 0.1% |
| Eastern Asia | 770 | 2.7% |
| Eastern Europe | 413 | 1.5% |
| Egypt | 24 | 0.1% |
| El Salvador | 13 | 0.1% |
| England | 43 | 0.2% |
| Ethiopia | 20 | 0.1% |
| Europe | 533 | 1.9% |
| Germany | 51 | 0.2% |
| Hong Kong | 37 | 0.1% |
| India | 83 | 0.3% |
| Iraq | 1,115 | 3.9% |
| Ireland | 26 | 0.1% |
| Japan | 21 | 0.1% |
| Jordan | 28 | 0.1% |
| Korea | 161 | 0.6% |
| Latin America | 191 | 0.7% |
| Lebanon | 60 | 0.2% |
| Malaysia | 9 | 0.0% |
| Mexico | 178 | 0.6% |
| North Macedonia | 14 | 0.1% |
| Northern Africa | 40 | 0.1% |
| Northern Europe | 69 | 0.2% |
| Oceania | 23 | 0.1% |
| Philippines | 211 | 0.7% |
| Poland | 7 | 0.0% |
| Romania | 136 | 0.5% |
| Russia | 50 | 0.2% |
| Serbia | 15 | 0.1% |
| South Africa | 13 | 0.1% |
| South Central Asia | 118 | 0.4% |
| South Eastern Asia | 353 | 1.2% |
| Sudan | 16 | 0.1% |
| Syria | 37 | 0.1% |
| Thailand | 9 | 0.0% |
| Vietnam | 124 | 0.4% |
| Western Asia | 1,367 | 4.8% |
| Western Europe | 51 | 0.2% | View All 48 Rows |
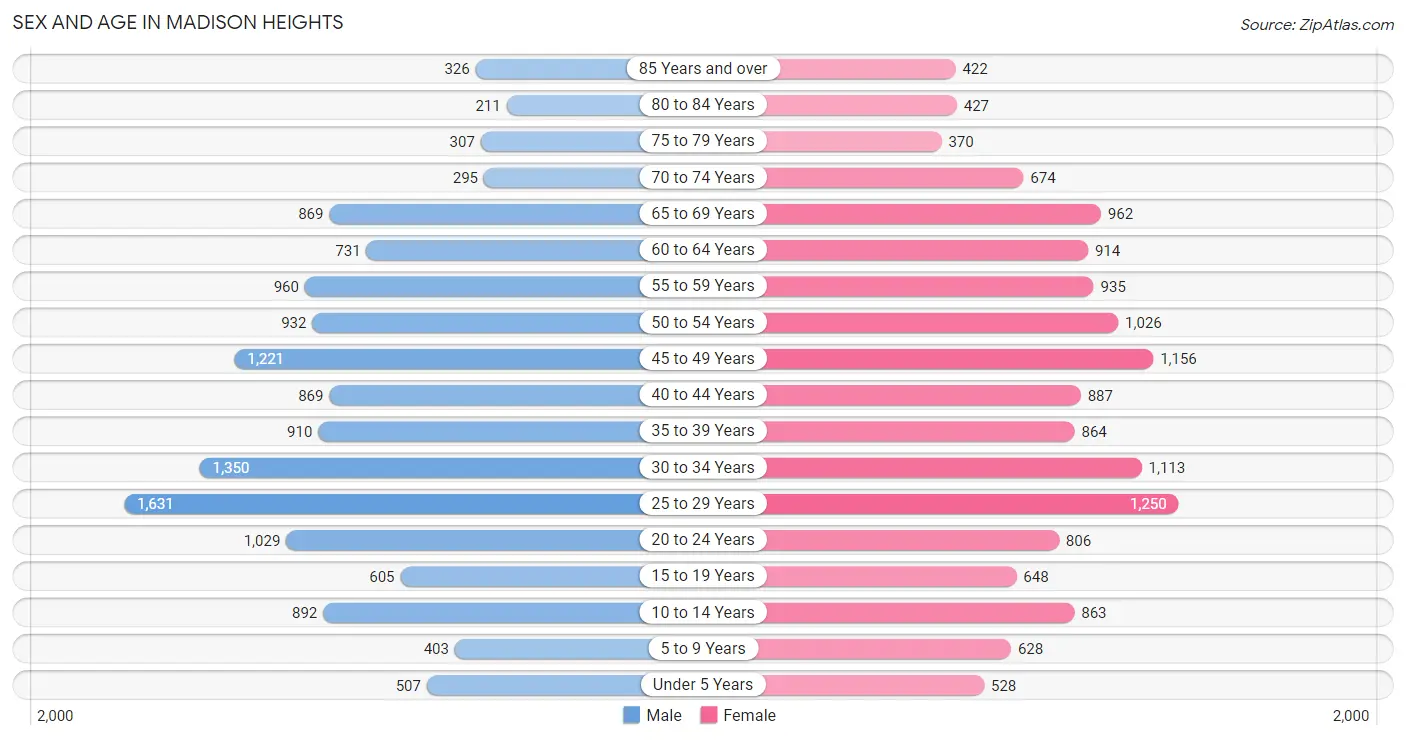
Sex and Age in Madison Heights
Sex and Age in Madison Heights
The most populous age groups in Madison Heights are 25 to 29 Years (1,631 | 11.6%) for men and 25 to 29 Years (1,250 | 8.6%) for women.
| Age Bracket | Male | Female |
| Under 5 Years | 507 (3.6%) | 528 (3.6%) |
| 5 to 9 Years | 403 (2.9%) | 628 (4.3%) |
| 10 to 14 Years | 892 (6.4%) | 863 (6.0%) |
| 15 to 19 Years | 605 (4.3%) | 648 (4.5%) |
| 20 to 24 Years | 1,029 (7.3%) | 806 (5.6%) |
| 25 to 29 Years | 1,631 (11.6%) | 1,250 (8.6%) |
| 30 to 34 Years | 1,350 (9.6%) | 1,113 (7.7%) |
| 35 to 39 Years | 910 (6.5%) | 864 (6.0%) |
| 40 to 44 Years | 869 (6.2%) | 887 (6.1%) |
| 45 to 49 Years | 1,221 (8.7%) | 1,156 (8.0%) |
| 50 to 54 Years | 932 (6.6%) | 1,026 (7.1%) |
| 55 to 59 Years | 960 (6.8%) | 935 (6.5%) |
| 60 to 64 Years | 731 (5.2%) | 914 (6.3%) |
| 65 to 69 Years | 869 (6.2%) | 962 (6.7%) |
| 70 to 74 Years | 295 (2.1%) | 674 (4.7%) |
| 75 to 79 Years | 307 (2.2%) | 370 (2.6%) |
| 80 to 84 Years | 211 (1.5%) | 427 (2.9%) |
| 85 Years and over | 326 (2.3%) | 422 (2.9%) |
| Total | 14,048 (100.0%) | 14,473 (100.0%) |
Families and Households in Madison Heights
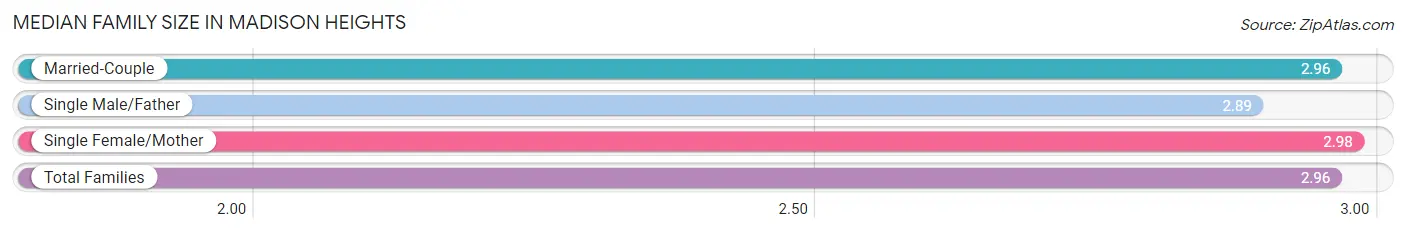
Median Family Size in Madison Heights
The median family size in Madison Heights is 2.96 persons per family, with single female/mother families (1,370 | 21.4%) accounting for the largest median family size of 2.98 persons per family. On the other hand, single male/father families (447 | 7.0%) represent the smallest median family size with 2.89 persons per family.
| Family Type | # Families | Family Size |
| Married-Couple | 4,570 (71.6%) | 2.96 |
| Single Male/Father | 447 (7.0%) | 2.89 |
| Single Female/Mother | 1,370 (21.4%) | 2.98 |
| Total Families | 6,387 (100.0%) | 2.96 |
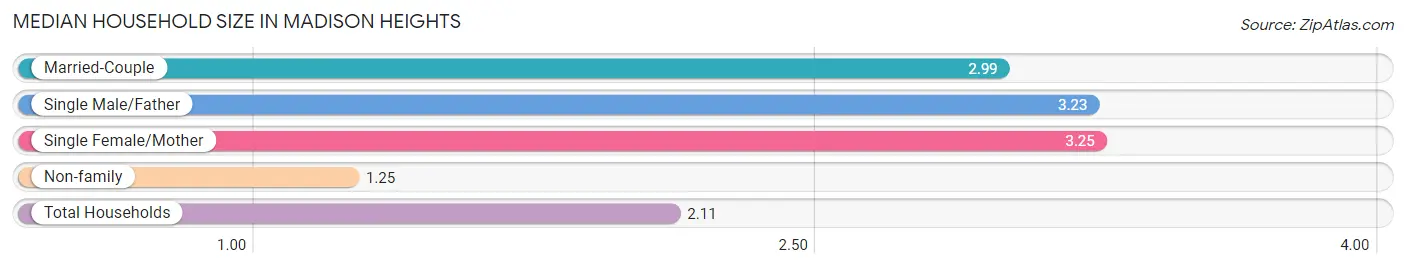
Median Household Size in Madison Heights
The median household size in Madison Heights is 2.11 persons per household, with single female/mother households (1,370 | 10.2%) accounting for the largest median household size of 3.25 persons per household. non-family households (7,072 | 52.5%) represent the smallest median household size with 1.25 persons per household.
| Household Type | # Households | Household Size |
| Married-Couple | 4,570 (34.0%) | 2.99 |
| Single Male/Father | 447 (3.3%) | 3.23 |
| Single Female/Mother | 1,370 (10.2%) | 3.25 |
| Non-family | 7,072 (52.5%) | 1.25 |
| Total Households | 13,459 (100.0%) | 2.11 |
Household Size by Marriage Status in Madison Heights
Out of a total of 13,459 households in Madison Heights, 6,387 (47.5%) are family households, while 7,072 (52.5%) are nonfamily households. The most numerous type of family households are 2-person households, comprising 3,061, and the most common type of nonfamily households are 1-person households, comprising 5,571.
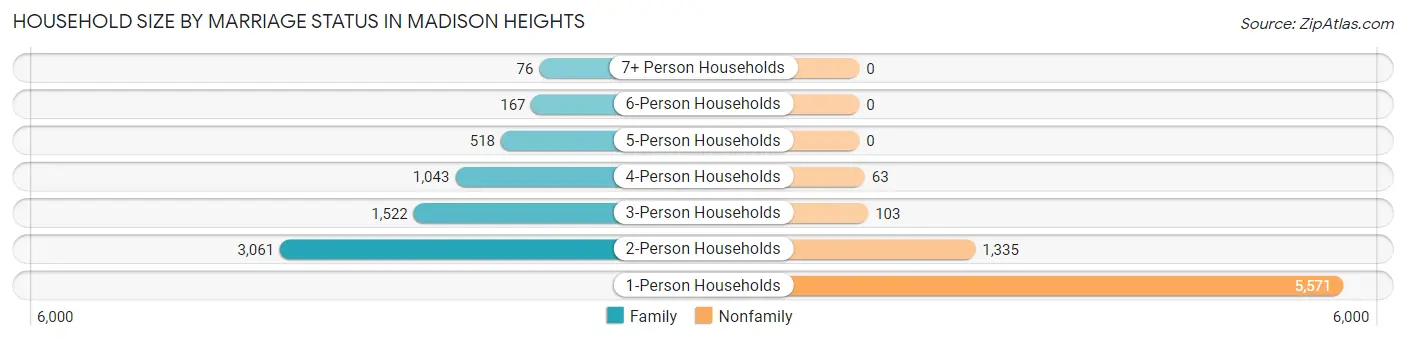
| Household Size | Family Households | Nonfamily Households |
| 1-Person Households | - | 5,571 (41.4%) |
| 2-Person Households | 3,061 (22.7%) | 1,335 (9.9%) |
| 3-Person Households | 1,522 (11.3%) | 103 (0.8%) |
| 4-Person Households | 1,043 (7.7%) | 63 (0.5%) |
| 5-Person Households | 518 (3.8%) | 0 (0.0%) |
| 6-Person Households | 167 (1.2%) | 0 (0.0%) |
| 7+ Person Households | 76 (0.6%) | 0 (0.0%) |
| Total | 6,387 (47.5%) | 7,072 (52.5%) |
Female Fertility in Madison Heights
Fertility by Age in Madison Heights
Average fertility rate in Madison Heights is 52.0 births per 1,000 women. Women in the age bracket of 15 to 19 years have the highest fertility rate with 196.0 births per 1,000 women. Women in the age bracket of 20 to 34 years acount for 51.4% of all women with births.
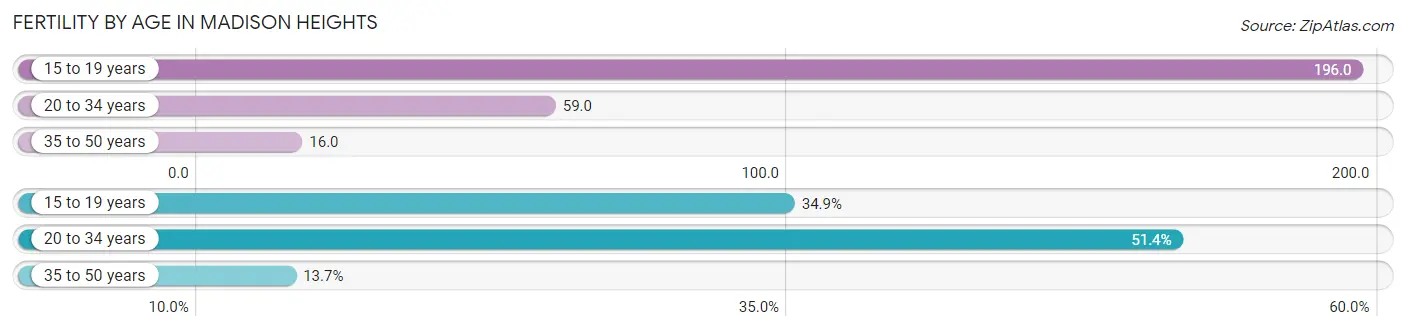
| Age Bracket | Women with Births | Births / 1,000 Women |
| 15 to 19 years | 127 (34.9%) | 196.0 |
| 20 to 34 years | 187 (51.4%) | 59.0 |
| 35 to 50 years | 50 (13.7%) | 16.0 |
| Total | 364 (100.0%) | 52.0 |
Fertility by Age by Marriage Status in Madison Heights
35.2% of women with births (364) in Madison Heights are married. The highest percentage of unmarried women with births falls into 15 to 19 years age bracket with 100.0% of them unmarried at the time of birth, while the lowest percentage of unmarried women with births belong to 35 to 50 years age bracket with 0.0% of them unmarried.
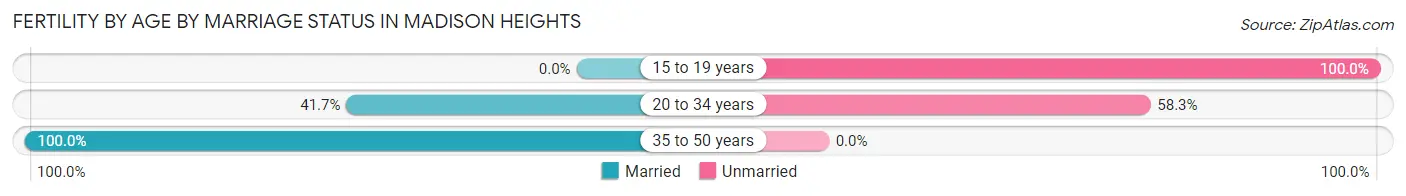
| Age Bracket | Married | Unmarried |
| 15 to 19 years | 0 (0.0%) | 127 (100.0%) |
| 20 to 34 years | 78 (41.7%) | 109 (58.3%) |
| 35 to 50 years | 50 (100.0%) | 0 (0.0%) |
| Total | 128 (35.2%) | 236 (64.8%) |
Fertility by Education in Madison Heights
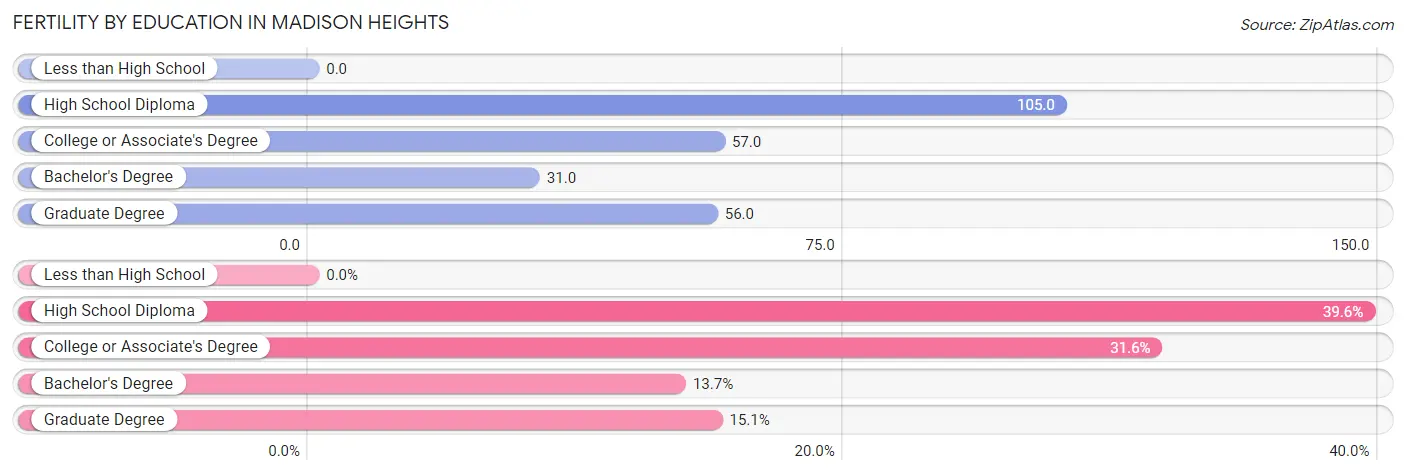
| Educational Attainment | Women with Births | Births / 1,000 Women |
| Less than High School | 0 (0.0%) | 0.0 |
| High School Diploma | 144 (39.6%) | 105.0 |
| College or Associate's Degree | 115 (31.6%) | 57.0 |
| Bachelor's Degree | 50 (13.7%) | 31.0 |
| Graduate Degree | 55 (15.1%) | 56.0 |
| Total | 364 (100.0%) | 52.0 |
Fertility by Education by Marriage Status in Madison Heights
64.8% of women with births in Madison Heights are unmarried. Women with the educational attainment of graduate degree are most likely to be married with 87.3% of them married at childbirth, while women with the educational attainment of high school diploma are least likely to be married with 88.2% of them unmarried at childbirth.
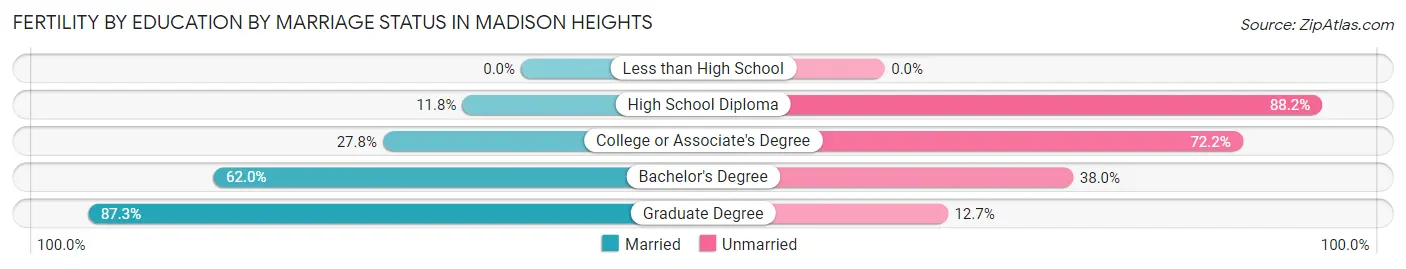
| Educational Attainment | Married | Unmarried |
| Less than High School | 0 (0.0%) | 0 (0.0%) |
| High School Diploma | 17 (11.8%) | 127 (88.2%) |
| College or Associate's Degree | 32 (27.8%) | 83 (72.2%) |
| Bachelor's Degree | 31 (62.0%) | 19 (38.0%) |
| Graduate Degree | 48 (87.3%) | 7 (12.7%) |
| Total | 128 (35.2%) | 236 (64.8%) |
Employment Characteristics in Madison Heights
Employment by Class of Employer in Madison Heights
Among the 15,414 employed individuals in Madison Heights, private company employees (11,937 | 77.4%), not-for-profit organizations (1,514 | 9.8%), and self-employed (not incorporated) (792 | 5.1%) make up the most common classes of employment.
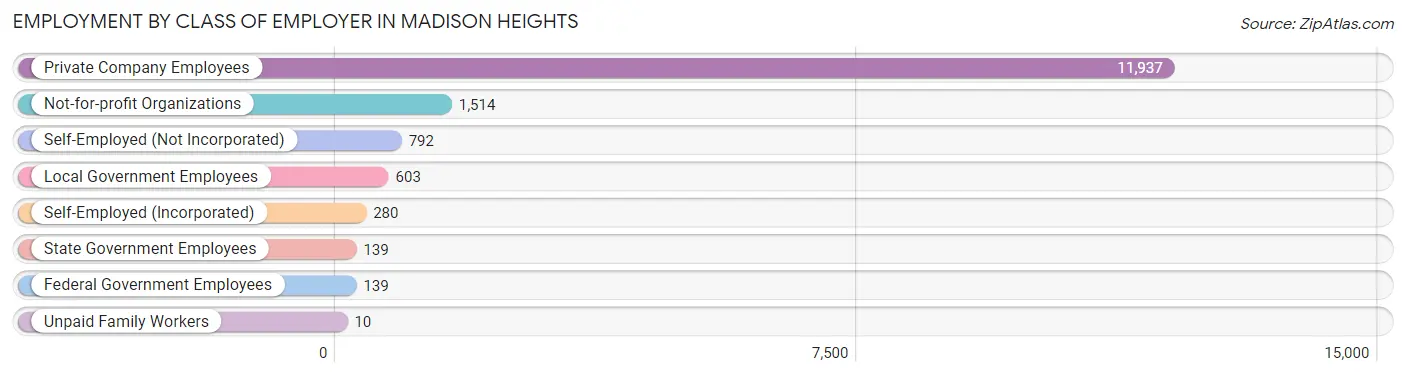
| Employer Class | # Employees | % Employees |
| Private Company Employees | 11,937 | 77.4% |
| Self-Employed (Incorporated) | 280 | 1.8% |
| Self-Employed (Not Incorporated) | 792 | 5.1% |
| Not-for-profit Organizations | 1,514 | 9.8% |
| Local Government Employees | 603 | 3.9% |
| State Government Employees | 139 | 0.9% |
| Federal Government Employees | 139 | 0.9% |
| Unpaid Family Workers | 10 | 0.1% |
| Total | 15,414 | 100.0% |
Employment Status by Age in Madison Heights
According to the labor force statistics for Madison Heights, out of the total population over 16 years of age (24,501), 68.8% or 16,857 individuals are in the labor force, with 3.6% or 607 of them unemployed. The age group with the highest labor force participation rate is 25 to 29 years, with 93.5% or 2,694 individuals in the labor force. Within the labor force, the 75 years and over age range has the highest percentage of unemployed individuals, with 11.9% or 8 of them being unemployed.
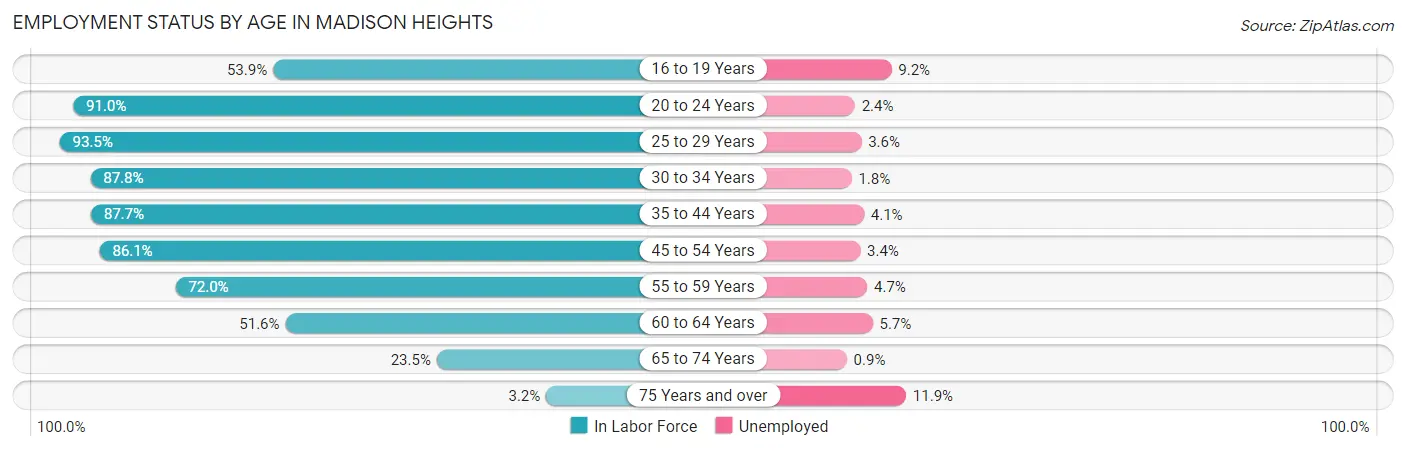
| Age Bracket | In Labor Force | Unemployed |
| 16 to 19 Years | 568 (53.9%) | 52 (9.2%) |
| 20 to 24 Years | 1,670 (91.0%) | 40 (2.4%) |
| 25 to 29 Years | 2,694 (93.5%) | 97 (3.6%) |
| 30 to 34 Years | 2,163 (87.8%) | 39 (1.8%) |
| 35 to 44 Years | 3,096 (87.7%) | 127 (4.1%) |
| 45 to 54 Years | 3,732 (86.1%) | 127 (3.4%) |
| 55 to 59 Years | 1,364 (72.0%) | 64 (4.7%) |
| 60 to 64 Years | 849 (51.6%) | 48 (5.7%) |
| 65 to 74 Years | 658 (23.5%) | 6 (0.9%) |
| 75 Years and over | 66 (3.2%) | 8 (11.9%) |
| Total | 16,857 (68.8%) | 607 (3.6%) |
Employment Status by Educational Attainment in Madison Heights
According to labor force statistics for Madison Heights, 83.0% of individuals (13,902) out of the total population between 25 and 64 years of age (16,749) are in the labor force, with 3.6% or 500 of them being unemployed. The group with the highest labor force participation rate are those with the educational attainment of bachelor's degree or higher, with 92.7% or 5,746 individuals in the labor force. Within the labor force, individuals with high school diploma education have the highest percentage of unemployment, with 6.8% or 209 of them being unemployed.
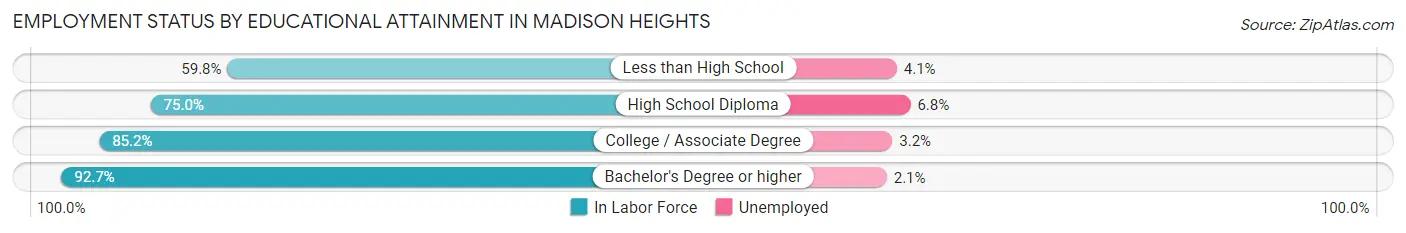
| Educational Attainment | In Labor Force | Unemployed |
| Less than High School | 983 (59.8%) | 67 (4.1%) |
| High School Diploma | 3,080 (75.0%) | 279 (6.8%) |
| College / Associate Degree | 4,091 (85.2%) | 154 (3.2%) |
| Bachelor's Degree or higher | 5,746 (92.7%) | 130 (2.1%) |
| Total | 13,902 (83.0%) | 603 (3.6%) |
Employment Occupations by Sex in Madison Heights
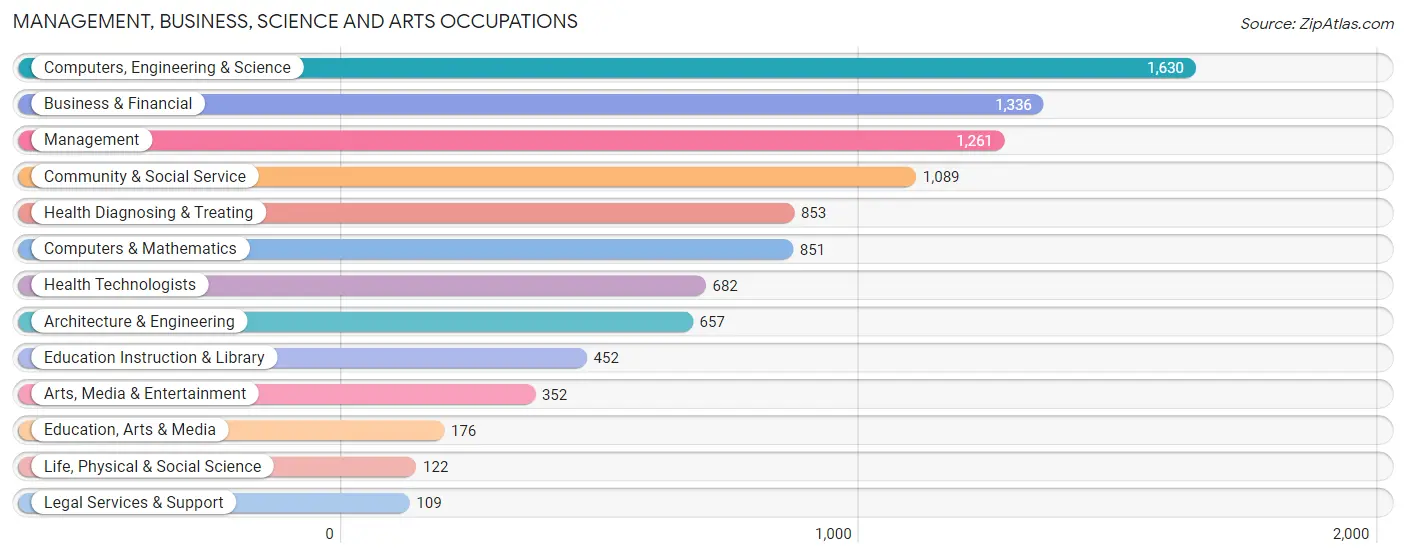
Management, Business, Science and Arts Occupations
The most common Management, Business, Science and Arts occupations in Madison Heights are Computers, Engineering & Science (1,630 | 10.0%), Business & Financial (1,336 | 8.2%), Management (1,261 | 7.8%), Community & Social Service (1,089 | 6.7%), and Health Diagnosing & Treating (853 | 5.2%).
Management, Business, Science and Arts Occupations by Sex
Within the Management, Business, Science and Arts occupations in Madison Heights, the most male-oriented occupations are Architecture & Engineering (85.7%), Computers & Mathematics (82.6%), and Computers, Engineering & Science (82.2%), while the most female-oriented occupations are Health Diagnosing & Treating (76.4%), Health Technologists (75.4%), and Education Instruction & Library (66.6%).
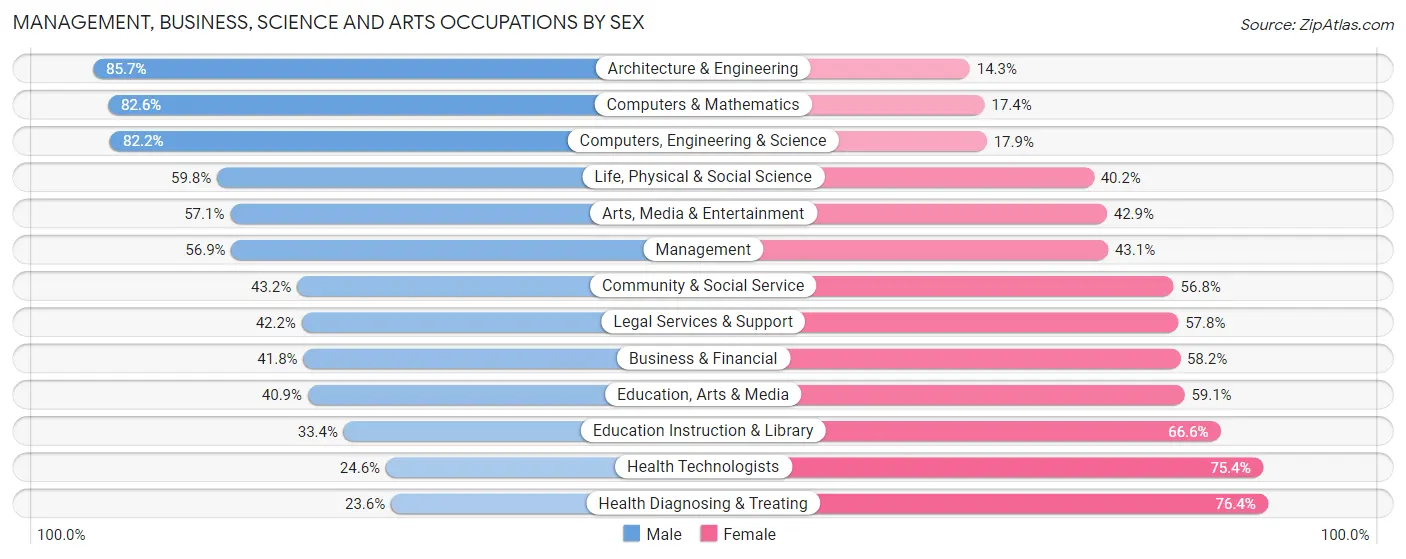
| Occupation | Male | Female |
| Management | 717 (56.9%) | 544 (43.1%) |
| Business & Financial | 559 (41.8%) | 777 (58.2%) |
| Computers, Engineering & Science | 1,339 (82.2%) | 291 (17.8%) |
| Computers & Mathematics | 703 (82.6%) | 148 (17.4%) |
| Architecture & Engineering | 563 (85.7%) | 94 (14.3%) |
| Life, Physical & Social Science | 73 (59.8%) | 49 (40.2%) |
| Community & Social Service | 470 (43.2%) | 619 (56.8%) |
| Education, Arts & Media | 72 (40.9%) | 104 (59.1%) |
| Legal Services & Support | 46 (42.2%) | 63 (57.8%) |
| Education Instruction & Library | 151 (33.4%) | 301 (66.6%) |
| Arts, Media & Entertainment | 201 (57.1%) | 151 (42.9%) |
| Health Diagnosing & Treating | 201 (23.6%) | 652 (76.4%) |
| Health Technologists | 168 (24.6%) | 514 (75.4%) |
| Total (Category) | 3,286 (53.3%) | 2,883 (46.7%) |
| Total (Overall) | 8,801 (54.1%) | 7,454 (45.9%) |
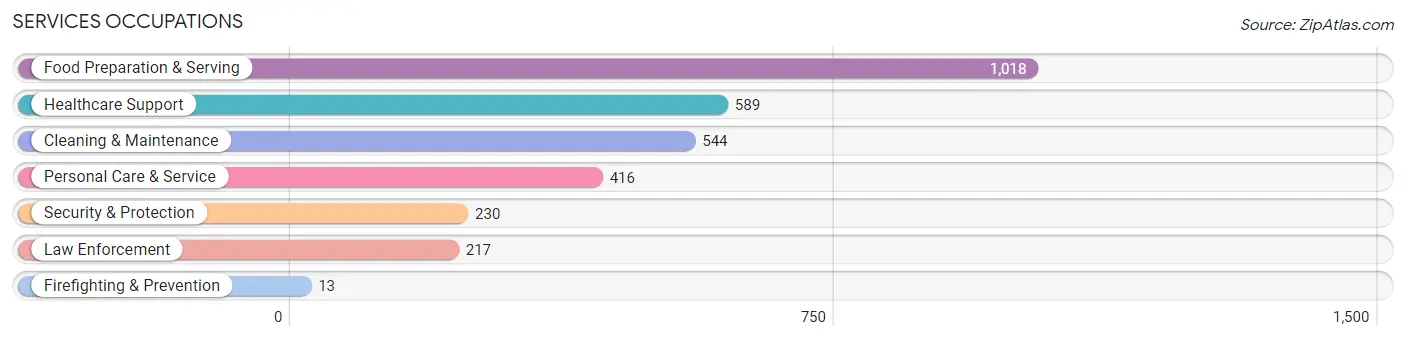
Services Occupations
The most common Services occupations in Madison Heights are Food Preparation & Serving (1,018 | 6.3%), Healthcare Support (589 | 3.6%), Cleaning & Maintenance (544 | 3.4%), Personal Care & Service (416 | 2.6%), and Security & Protection (230 | 1.4%).
Services Occupations by Sex
Within the Services occupations in Madison Heights, the most male-oriented occupations are Law Enforcement (90.8%), Security & Protection (85.7%), and Cleaning & Maintenance (58.1%), while the most female-oriented occupations are Firefighting & Prevention (100.0%), Healthcare Support (87.6%), and Personal Care & Service (63.7%).
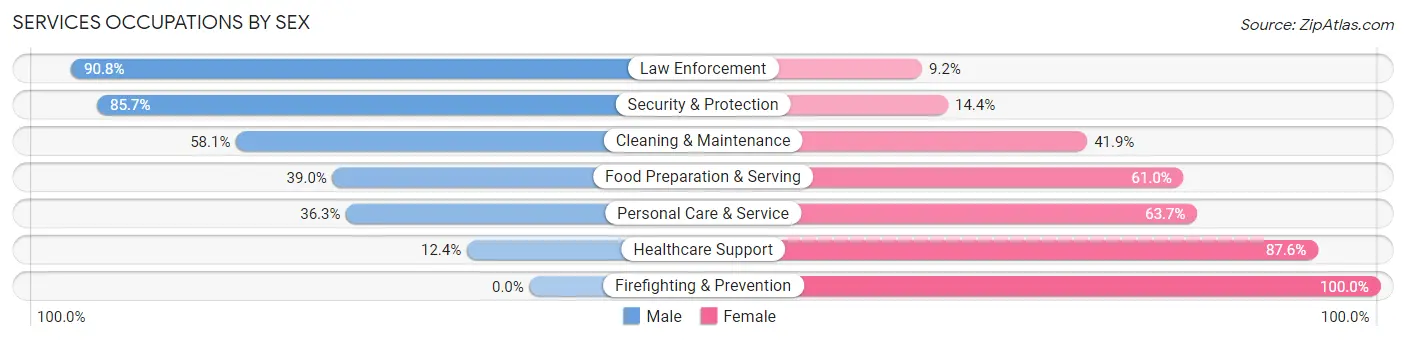
| Occupation | Male | Female |
| Healthcare Support | 73 (12.4%) | 516 (87.6%) |
| Security & Protection | 197 (85.7%) | 33 (14.3%) |
| Firefighting & Prevention | 0 (0.0%) | 13 (100.0%) |
| Law Enforcement | 197 (90.8%) | 20 (9.2%) |
| Food Preparation & Serving | 397 (39.0%) | 621 (61.0%) |
| Cleaning & Maintenance | 316 (58.1%) | 228 (41.9%) |
| Personal Care & Service | 151 (36.3%) | 265 (63.7%) |
| Total (Category) | 1,134 (40.5%) | 1,663 (59.5%) |
| Total (Overall) | 8,801 (54.1%) | 7,454 (45.9%) |
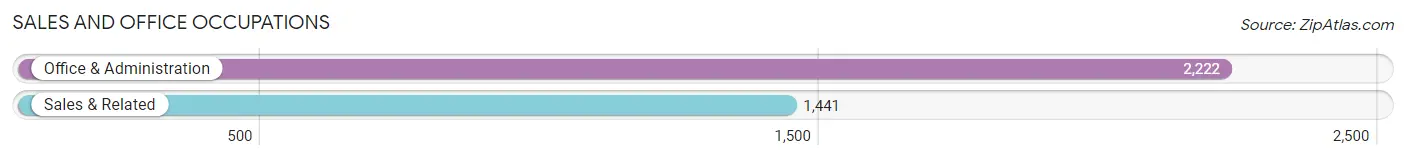
Sales and Office Occupations
The most common Sales and Office occupations in Madison Heights are Office & Administration (2,222 | 13.7%), and Sales & Related (1,441 | 8.9%).
Sales and Office Occupations by Sex
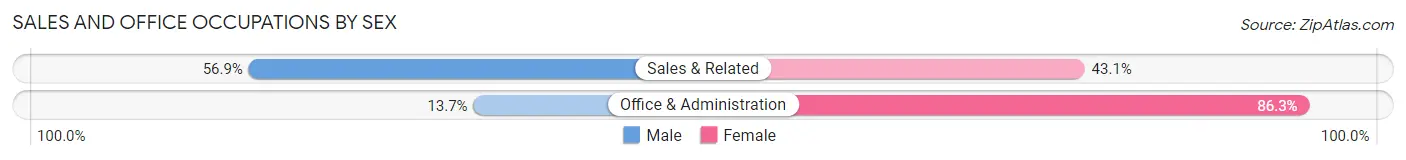
| Occupation | Male | Female |
| Sales & Related | 820 (56.9%) | 621 (43.1%) |
| Office & Administration | 304 (13.7%) | 1,918 (86.3%) |
| Total (Category) | 1,124 (30.7%) | 2,539 (69.3%) |
| Total (Overall) | 8,801 (54.1%) | 7,454 (45.9%) |
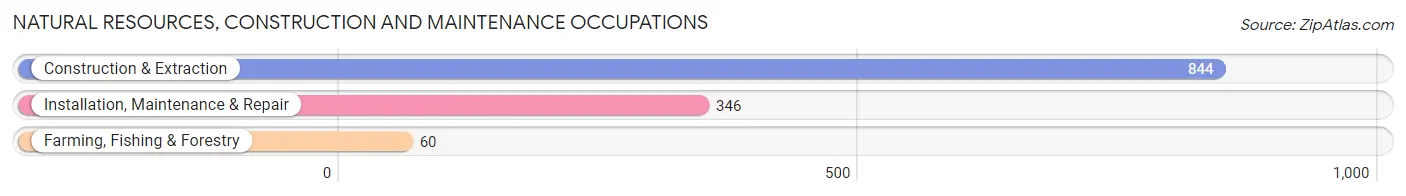
Natural Resources, Construction and Maintenance Occupations
The most common Natural Resources, Construction and Maintenance occupations in Madison Heights are Construction & Extraction (844 | 5.2%), Installation, Maintenance & Repair (346 | 2.1%), and Farming, Fishing & Forestry (60 | 0.4%).
Natural Resources, Construction and Maintenance Occupations by Sex
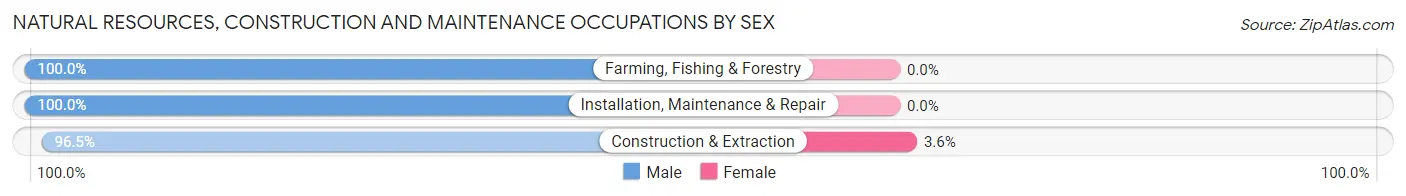
| Occupation | Male | Female |
| Farming, Fishing & Forestry | 60 (100.0%) | 0 (0.0%) |
| Construction & Extraction | 814 (96.5%) | 30 (3.5%) |
| Installation, Maintenance & Repair | 346 (100.0%) | 0 (0.0%) |
| Total (Category) | 1,220 (97.6%) | 30 (2.4%) |
| Total (Overall) | 8,801 (54.1%) | 7,454 (45.9%) |
Production, Transportation and Moving Occupations
The most common Production, Transportation and Moving occupations in Madison Heights are Production (1,453 | 8.9%), Material Moving (566 | 3.5%), and Transportation (357 | 2.2%).
Production, Transportation and Moving Occupations by Sex
| Occupation | Male | Female |
| Production | 1,182 (81.4%) | 271 (18.6%) |
| Transportation | 340 (95.2%) | 17 (4.8%) |
| Material Moving | 515 (91.0%) | 51 (9.0%) |
| Total (Category) | 2,037 (85.7%) | 339 (14.3%) |
| Total (Overall) | 8,801 (54.1%) | 7,454 (45.9%) |
Employment Industries by Sex in Madison Heights
Employment Industries in Madison Heights
The major employment industries in Madison Heights include Manufacturing (2,965 | 18.2%), Health Care & Social Assistance (2,278 | 14.0%), Professional & Scientific (1,717 | 10.6%), Retail Trade (1,702 | 10.5%), and Construction (1,108 | 6.8%).
Employment Industries by Sex in Madison Heights
The Madison Heights industries that see more men than women are Agriculture, Fishing & Hunting (100.0%), Mining, Quarrying, & Extraction (100.0%), and Enterprise Management (100.0%), whereas the industries that tend to have a higher number of women are Health Care & Social Assistance (82.8%), Educational Services (73.2%), and Professional & Scientific (53.9%).
| Industry | Male | Female |
| Agriculture, Fishing & Hunting | 60 (100.0%) | 0 (0.0%) |
| Mining, Quarrying, & Extraction | 35 (100.0%) | 0 (0.0%) |
| Construction | 932 (84.1%) | 176 (15.9%) |
| Manufacturing | 2,286 (77.1%) | 679 (22.9%) |
| Wholesale Trade | 436 (78.7%) | 118 (21.3%) |
| Retail Trade | 917 (53.9%) | 785 (46.1%) |
| Transportation & Warehousing | 280 (60.7%) | 181 (39.3%) |
| Utilities | 0 (0.0%) | 0 (0.0%) |
| Information | 92 (48.4%) | 98 (51.6%) |
| Finance & Insurance | 504 (50.5%) | 494 (49.5%) |
| Real Estate, Rental & Leasing | 228 (76.5%) | 70 (23.5%) |
| Professional & Scientific | 792 (46.1%) | 925 (53.9%) |
| Enterprise Management | 15 (100.0%) | 0 (0.0%) |
| Administrative & Support | 345 (62.3%) | 209 (37.7%) |
| Educational Services | 243 (26.9%) | 662 (73.2%) |
| Health Care & Social Assistance | 391 (17.2%) | 1,887 (82.8%) |
| Arts, Entertainment & Recreation | 239 (78.4%) | 66 (21.6%) |
| Accommodation & Food Services | 522 (48.4%) | 557 (51.6%) |
| Public Administration | 264 (62.4%) | 159 (37.6%) |
| Total | 8,801 (54.1%) | 7,454 (45.9%) |
Education in Madison Heights
School Enrollment in Madison Heights
The most common levels of schooling among the 4,871 students in Madison Heights are middle school (1,425 | 29.2%), high school (957 | 19.7%), and college / undergraduate (867 | 17.8%).
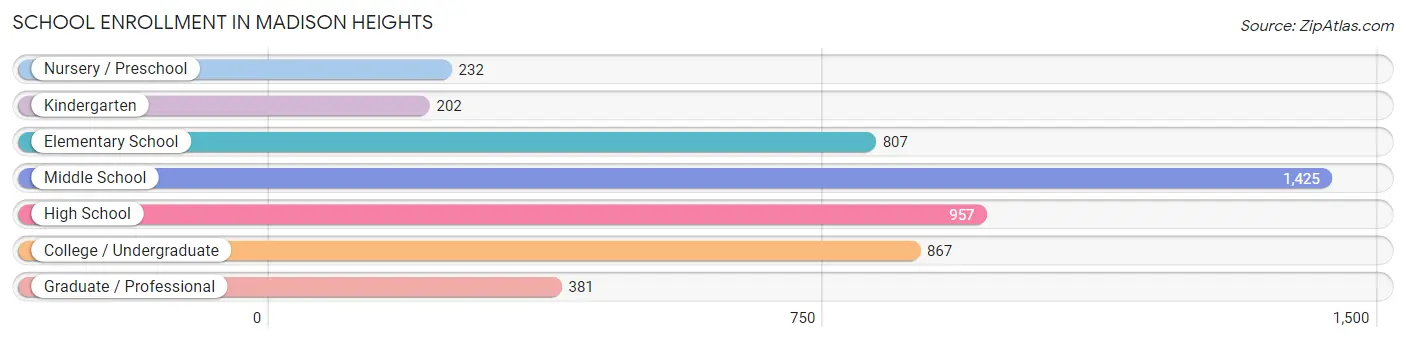
| School Level | # Students | % Students |
| Nursery / Preschool | 232 | 4.8% |
| Kindergarten | 202 | 4.2% |
| Elementary School | 807 | 16.6% |
| Middle School | 1,425 | 29.2% |
| High School | 957 | 19.7% |
| College / Undergraduate | 867 | 17.8% |
| Graduate / Professional | 381 | 7.8% |
| Total | 4,871 | 100.0% |
School Enrollment by Age by Funding Source in Madison Heights
Out of a total of 4,871 students who are enrolled in schools in Madison Heights, 585 (12.0%) attend a private institution, while the remaining 4,286 (88.0%) are enrolled in public schools. The age group of 3 to 4 year olds has the highest likelihood of being enrolled in private schools, with 56 (49.6% in the age bracket) enrolled. Conversely, the age group of 10 to 14 year olds has the lowest likelihood of being enrolled in a private school, with 1,623 (95.3% in the age bracket) attending a public institution.
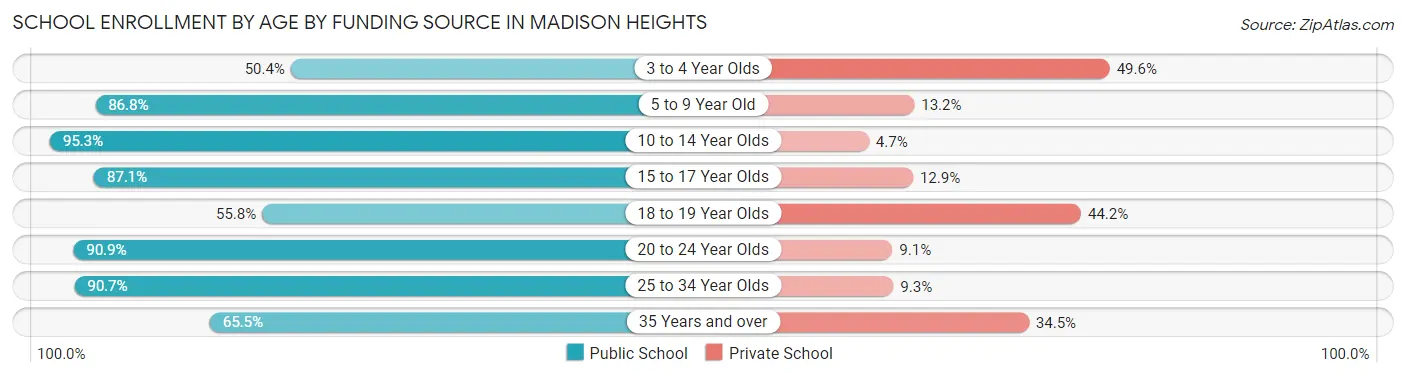
| Age Bracket | Public School | Private School |
| 3 to 4 Year Olds | 57 (50.4%) | 56 (49.6%) |
| 5 to 9 Year Old | 884 (86.8%) | 134 (13.2%) |
| 10 to 14 Year Olds | 1,623 (95.3%) | 80 (4.7%) |
| 15 to 17 Year Olds | 587 (87.1%) | 87 (12.9%) |
| 18 to 19 Year Olds | 82 (55.8%) | 65 (44.2%) |
| 20 to 24 Year Olds | 541 (90.9%) | 54 (9.1%) |
| 25 to 34 Year Olds | 382 (90.7%) | 39 (9.3%) |
| 35 Years and over | 131 (65.5%) | 69 (34.5%) |
| Total | 4,286 (88.0%) | 585 (12.0%) |
Educational Attainment by Field of Study in Madison Heights
Business (2,010 | 27.8%), engineering (984 | 13.6%), communications (650 | 9.0%), education (510 | 7.1%), and science & technology (478 | 6.6%) are the most common fields of study among 7,219 individuals in Madison Heights who have obtained a bachelor's degree or higher.
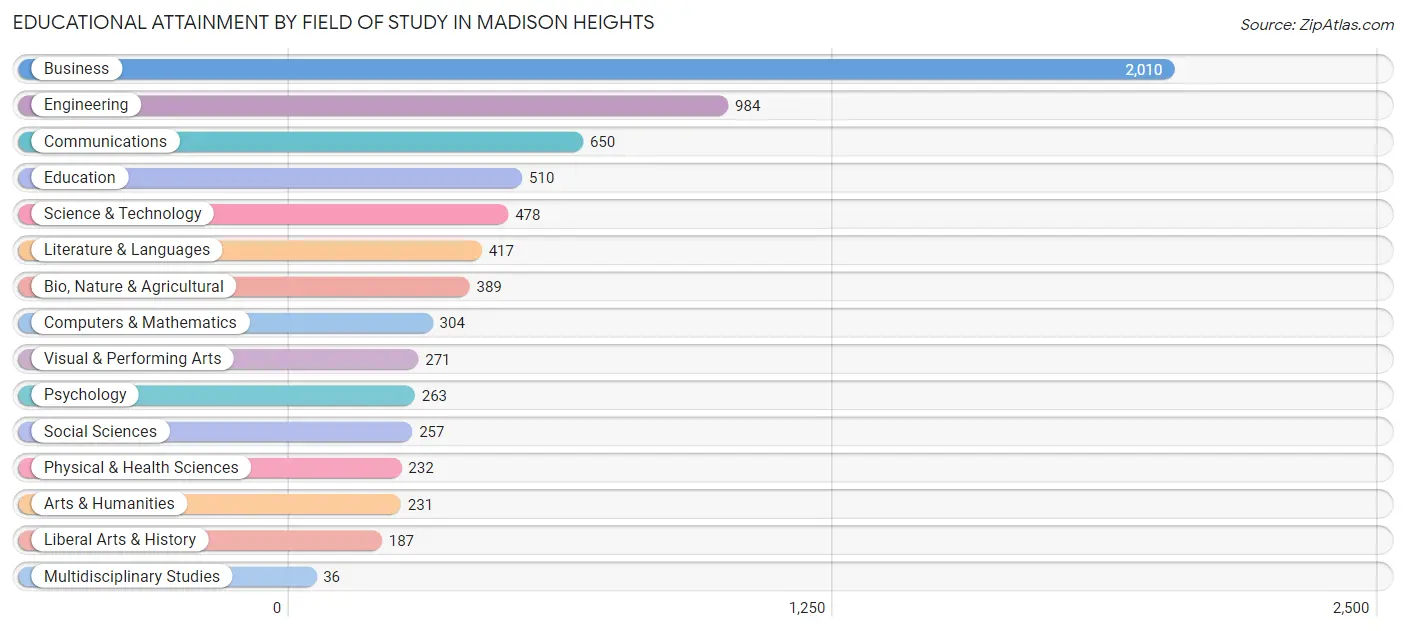
| Field of Study | # Graduates | % Graduates |
| Computers & Mathematics | 304 | 4.2% |
| Bio, Nature & Agricultural | 389 | 5.4% |
| Physical & Health Sciences | 232 | 3.2% |
| Psychology | 263 | 3.6% |
| Social Sciences | 257 | 3.6% |
| Engineering | 984 | 13.6% |
| Multidisciplinary Studies | 36 | 0.5% |
| Science & Technology | 478 | 6.6% |
| Business | 2,010 | 27.8% |
| Education | 510 | 7.1% |
| Literature & Languages | 417 | 5.8% |
| Liberal Arts & History | 187 | 2.6% |
| Visual & Performing Arts | 271 | 3.7% |
| Communications | 650 | 9.0% |
| Arts & Humanities | 231 | 3.2% |
| Total | 7,219 | 100.0% |
Transportation & Commute in Madison Heights
Vehicle Availability by Sex in Madison Heights
The most prevalent vehicle ownership categories in Madison Heights are males with 2 vehicles (3,543, accounting for 42.9%) and females with 2 vehicles (3,200, making up 49.5%).
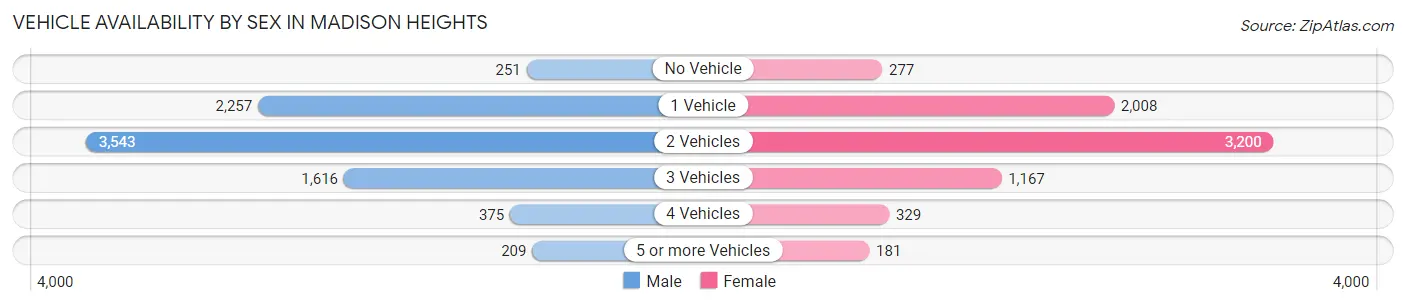
| Vehicles Available | Male | Female |
| No Vehicle | 251 (3.0%) | 277 (3.9%) |
| 1 Vehicle | 2,257 (27.4%) | 2,008 (28.0%) |
| 2 Vehicles | 3,543 (42.9%) | 3,200 (44.7%) |
| 3 Vehicles | 1,616 (19.6%) | 1,167 (16.3%) |
| 4 Vehicles | 375 (4.5%) | 329 (4.6%) |
| 5 or more Vehicles | 209 (2.5%) | 181 (2.5%) |
| Total | 8,251 (100.0%) | 7,162 (100.0%) |
Commute Time in Madison Heights
The most frequently occuring commute durations in Madison Heights are 15 to 19 minutes (2,779 commuters, 20.6%), 30 to 34 minutes (2,522 commuters, 18.7%), and 20 to 24 minutes (2,395 commuters, 17.8%).
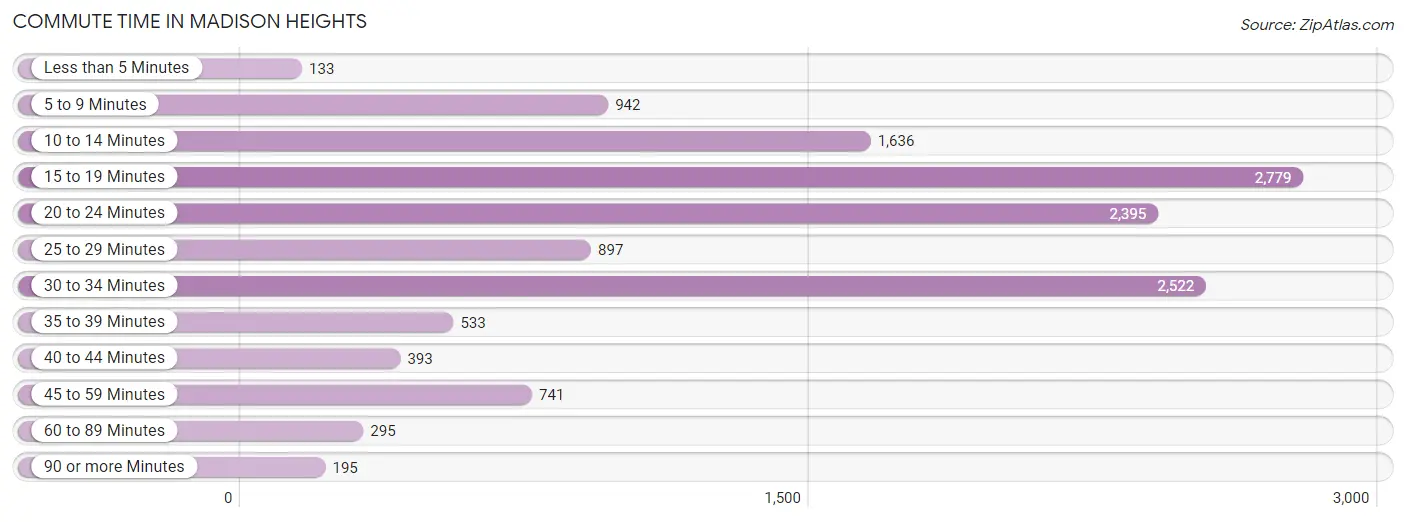
| Commute Time | # Commuters | % Commuters |
| Less than 5 Minutes | 133 | 1.0% |
| 5 to 9 Minutes | 942 | 7.0% |
| 10 to 14 Minutes | 1,636 | 12.1% |
| 15 to 19 Minutes | 2,779 | 20.6% |
| 20 to 24 Minutes | 2,395 | 17.8% |
| 25 to 29 Minutes | 897 | 6.7% |
| 30 to 34 Minutes | 2,522 | 18.7% |
| 35 to 39 Minutes | 533 | 4.0% |
| 40 to 44 Minutes | 393 | 2.9% |
| 45 to 59 Minutes | 741 | 5.5% |
| 60 to 89 Minutes | 295 | 2.2% |
| 90 or more Minutes | 195 | 1.5% |
Commute Time by Sex in Madison Heights
The most common commute times in Madison Heights are 20 to 24 minutes (1,487 commuters, 20.9%) for males and 15 to 19 minutes (1,336 commuters, 21.1%) for females.

| Commute Time | Male | Female |
| Less than 5 Minutes | 21 (0.3%) | 112 (1.8%) |
| 5 to 9 Minutes | 494 (6.9%) | 448 (7.1%) |
| 10 to 14 Minutes | 743 (10.4%) | 893 (14.1%) |
| 15 to 19 Minutes | 1,443 (20.3%) | 1,336 (21.1%) |
| 20 to 24 Minutes | 1,487 (20.9%) | 908 (14.3%) |
| 25 to 29 Minutes | 437 (6.1%) | 460 (7.2%) |
| 30 to 34 Minutes | 1,318 (18.5%) | 1,204 (19.0%) |
| 35 to 39 Minutes | 399 (5.6%) | 134 (2.1%) |
| 40 to 44 Minutes | 243 (3.4%) | 150 (2.4%) |
| 45 to 59 Minutes | 344 (4.8%) | 397 (6.3%) |
| 60 to 89 Minutes | 113 (1.6%) | 182 (2.9%) |
| 90 or more Minutes | 77 (1.1%) | 118 (1.9%) |
Time of Departure to Work by Sex in Madison Heights
The most frequent times of departure to work in Madison Heights are 6:30 AM to 6:59 AM (867, 12.2%) for males and 8:00 AM to 8:29 AM (1,158, 18.3%) for females.
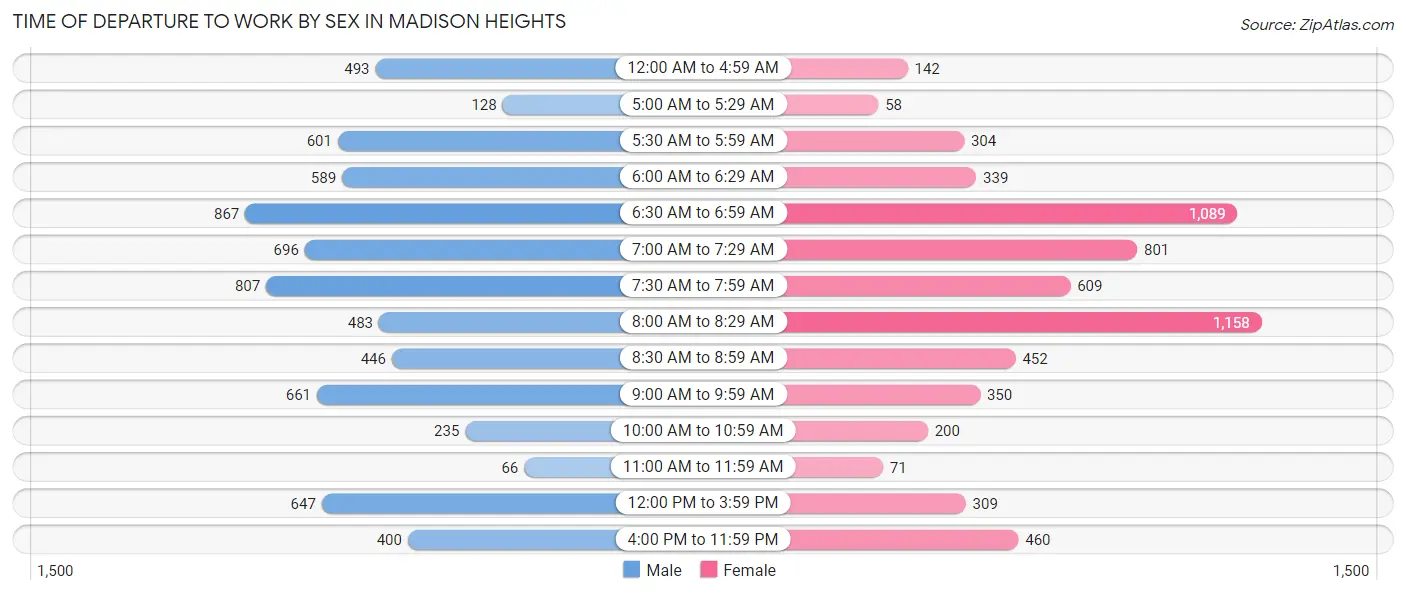
| Time of Departure | Male | Female |
| 12:00 AM to 4:59 AM | 493 (6.9%) | 142 (2.2%) |
| 5:00 AM to 5:29 AM | 128 (1.8%) | 58 (0.9%) |
| 5:30 AM to 5:59 AM | 601 (8.4%) | 304 (4.8%) |
| 6:00 AM to 6:29 AM | 589 (8.3%) | 339 (5.3%) |
| 6:30 AM to 6:59 AM | 867 (12.2%) | 1,089 (17.2%) |
| 7:00 AM to 7:29 AM | 696 (9.8%) | 801 (12.6%) |
| 7:30 AM to 7:59 AM | 807 (11.3%) | 609 (9.6%) |
| 8:00 AM to 8:29 AM | 483 (6.8%) | 1,158 (18.3%) |
| 8:30 AM to 8:59 AM | 446 (6.3%) | 452 (7.1%) |
| 9:00 AM to 9:59 AM | 661 (9.3%) | 350 (5.5%) |
| 10:00 AM to 10:59 AM | 235 (3.3%) | 200 (3.2%) |
| 11:00 AM to 11:59 AM | 66 (0.9%) | 71 (1.1%) |
| 12:00 PM to 3:59 PM | 647 (9.1%) | 309 (4.9%) |
| 4:00 PM to 11:59 PM | 400 (5.6%) | 460 (7.2%) |
| Total | 7,119 (100.0%) | 6,342 (100.0%) |
Housing Occupancy in Madison Heights
Occupancy by Ownership in Madison Heights
Of the total 13,459 dwellings in Madison Heights, owner-occupied units account for 8,408 (62.5%), while renter-occupied units make up 5,051 (37.5%).
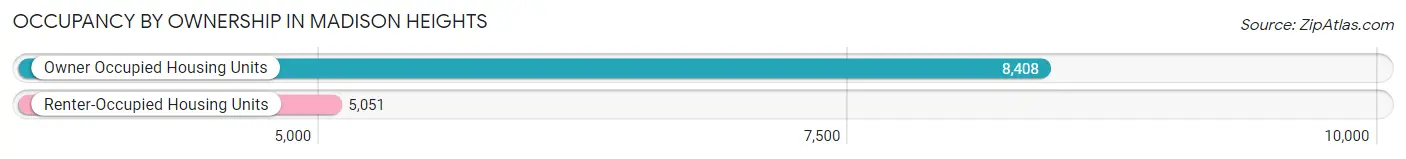
| Occupancy | # Housing Units | % Housing Units |
| Owner Occupied Housing Units | 8,408 | 62.5% |
| Renter-Occupied Housing Units | 5,051 | 37.5% |
| Total Occupied Housing Units | 13,459 | 100.0% |
Occupancy by Household Size in Madison Heights
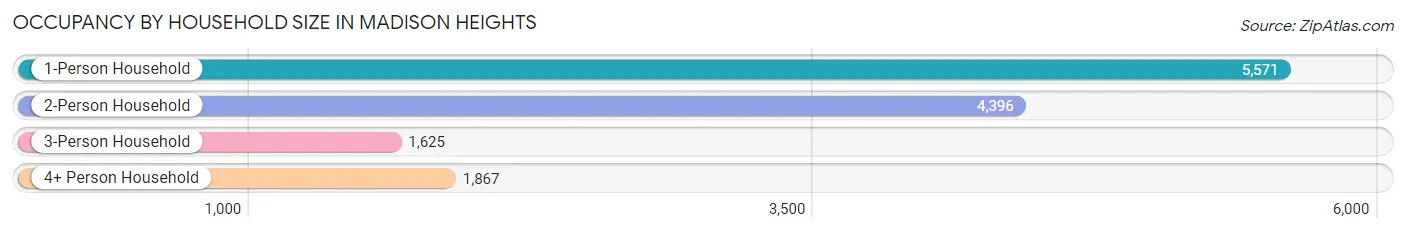
| Household Size | # Housing Units | % Housing Units |
| 1-Person Household | 5,571 | 41.4% |
| 2-Person Household | 4,396 | 32.7% |
| 3-Person Household | 1,625 | 12.1% |
| 4+ Person Household | 1,867 | 13.9% |
| Total Housing Units | 13,459 | 100.0% |
Occupancy by Ownership by Household Size in Madison Heights
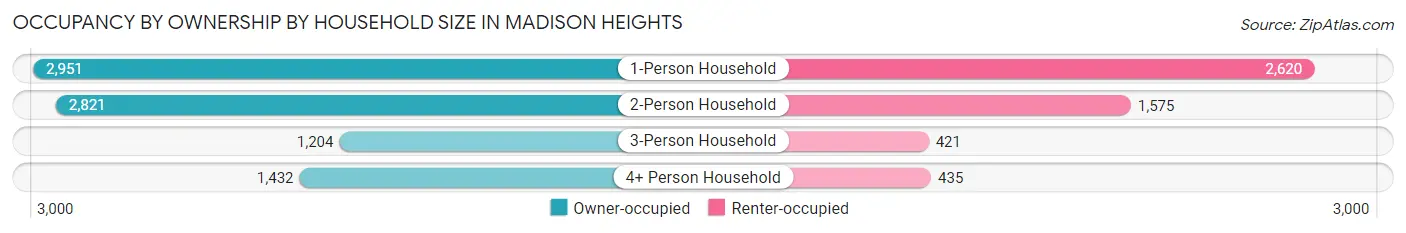
| Household Size | Owner-occupied | Renter-occupied |
| 1-Person Household | 2,951 (53.0%) | 2,620 (47.0%) |
| 2-Person Household | 2,821 (64.2%) | 1,575 (35.8%) |
| 3-Person Household | 1,204 (74.1%) | 421 (25.9%) |
| 4+ Person Household | 1,432 (76.7%) | 435 (23.3%) |
| Total Housing Units | 8,408 (62.5%) | 5,051 (37.5%) |
Occupancy by Educational Attainment in Madison Heights
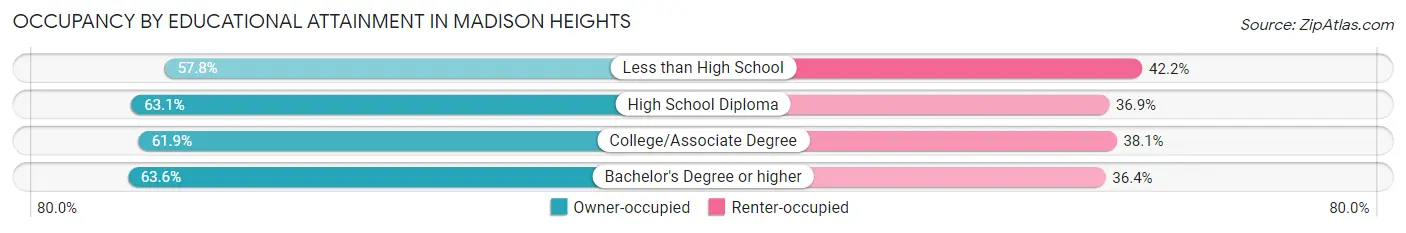
| Household Size | Owner-occupied | Renter-occupied |
| Less than High School | 655 (57.8%) | 478 (42.2%) |
| High School Diploma | 2,257 (63.1%) | 1,321 (36.9%) |
| College/Associate Degree | 2,520 (61.9%) | 1,552 (38.1%) |
| Bachelor's Degree or higher | 2,976 (63.6%) | 1,700 (36.4%) |
Occupancy by Age of Householder in Madison Heights
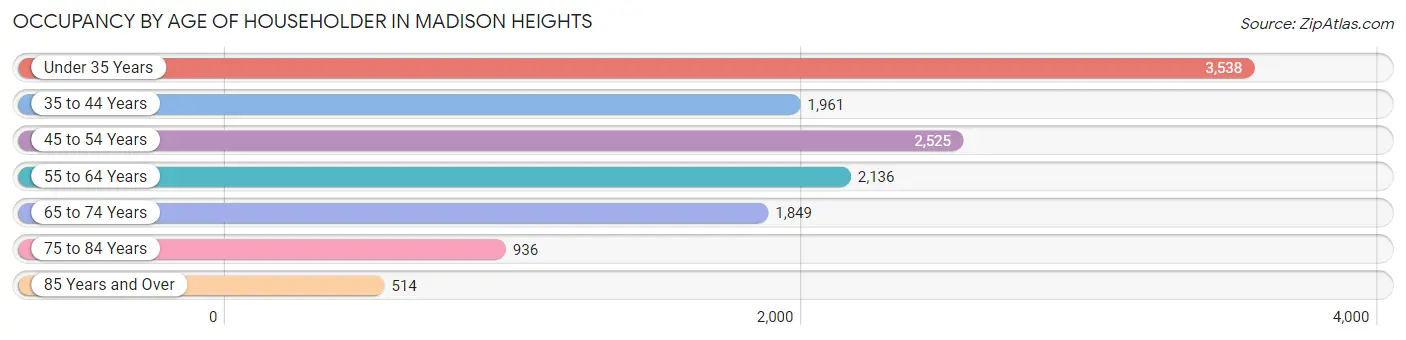
| Age Bracket | # Households | % Households |
| Under 35 Years | 3,538 | 26.3% |
| 35 to 44 Years | 1,961 | 14.6% |
| 45 to 54 Years | 2,525 | 18.8% |
| 55 to 64 Years | 2,136 | 15.9% |
| 65 to 74 Years | 1,849 | 13.7% |
| 75 to 84 Years | 936 | 7.0% |
| 85 Years and Over | 514 | 3.8% |
| Total | 13,459 | 100.0% |
Housing Finances in Madison Heights
Median Income by Occupancy in Madison Heights

| Occupancy Type | # Households | Median Income |
| Owner-Occupied | 8,408 (62.5%) | $71,864 |
| Renter-Occupied | 5,051 (37.5%) | $48,634 |
| Average | 13,459 (100.0%) | $63,224 |
Occupancy by Householder Income Bracket in Madison Heights
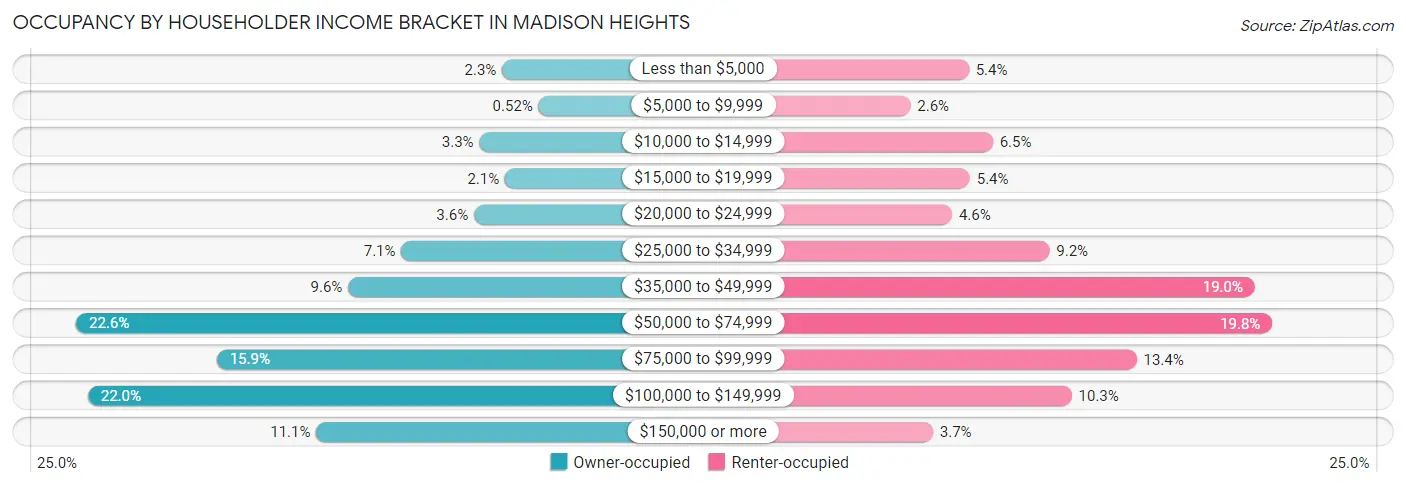
| Income Bracket | Owner-occupied | Renter-occupied |
| Less than $5,000 | 190 (2.3%) | 272 (5.4%) |
| $5,000 to $9,999 | 44 (0.5%) | 132 (2.6%) |
| $10,000 to $14,999 | 281 (3.3%) | 330 (6.5%) |
| $15,000 to $19,999 | 178 (2.1%) | 275 (5.4%) |
| $20,000 to $24,999 | 303 (3.6%) | 232 (4.6%) |
| $25,000 to $34,999 | 594 (7.1%) | 466 (9.2%) |
| $35,000 to $49,999 | 806 (9.6%) | 960 (19.0%) |
| $50,000 to $74,999 | 1,896 (22.6%) | 1,002 (19.8%) |
| $75,000 to $99,999 | 1,333 (15.9%) | 676 (13.4%) |
| $100,000 to $149,999 | 1,849 (22.0%) | 520 (10.3%) |
| $150,000 or more | 934 (11.1%) | 186 (3.7%) |
| Total | 8,408 (100.0%) | 5,051 (100.0%) |
Monthly Housing Cost Tiers in Madison Heights
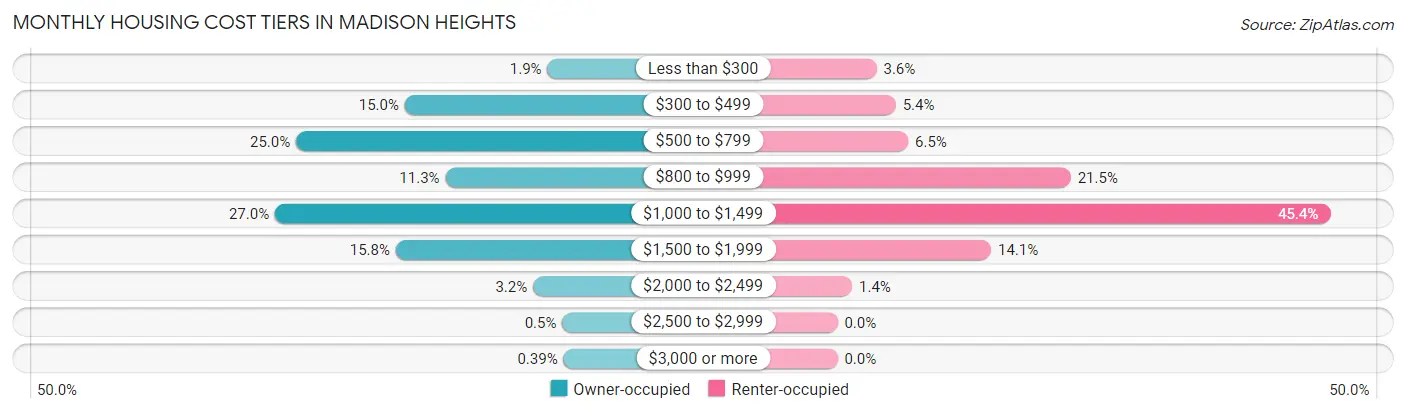
| Monthly Cost | Owner-occupied | Renter-occupied |
| Less than $300 | 157 (1.9%) | 182 (3.6%) |
| $300 to $499 | 1,261 (15.0%) | 271 (5.4%) |
| $500 to $799 | 2,103 (25.0%) | 329 (6.5%) |
| $800 to $999 | 947 (11.3%) | 1,085 (21.5%) |
| $1,000 to $1,499 | 2,266 (27.0%) | 2,291 (45.4%) |
| $1,500 to $1,999 | 1,331 (15.8%) | 714 (14.1%) |
| $2,000 to $2,499 | 268 (3.2%) | 68 (1.3%) |
| $2,500 to $2,999 | 42 (0.5%) | 0 (0.0%) |
| $3,000 or more | 33 (0.4%) | 0 (0.0%) |
| Total | 8,408 (100.0%) | 5,051 (100.0%) |
Physical Housing Characteristics in Madison Heights
Housing Structures in Madison Heights
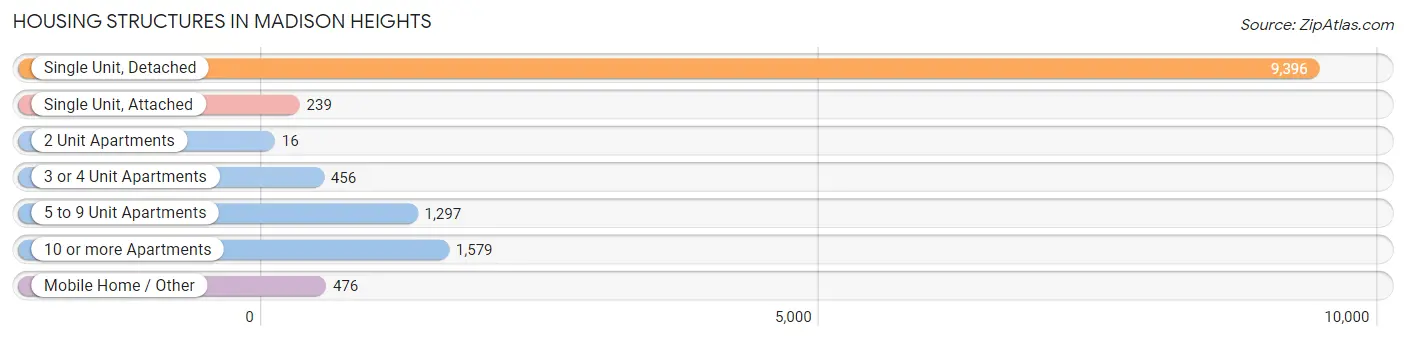
| Structure Type | # Housing Units | % Housing Units |
| Single Unit, Detached | 9,396 | 69.8% |
| Single Unit, Attached | 239 | 1.8% |
| 2 Unit Apartments | 16 | 0.1% |
| 3 or 4 Unit Apartments | 456 | 3.4% |
| 5 to 9 Unit Apartments | 1,297 | 9.6% |
| 10 or more Apartments | 1,579 | 11.7% |
| Mobile Home / Other | 476 | 3.5% |
| Total | 13,459 | 100.0% |
Housing Structures by Occupancy in Madison Heights
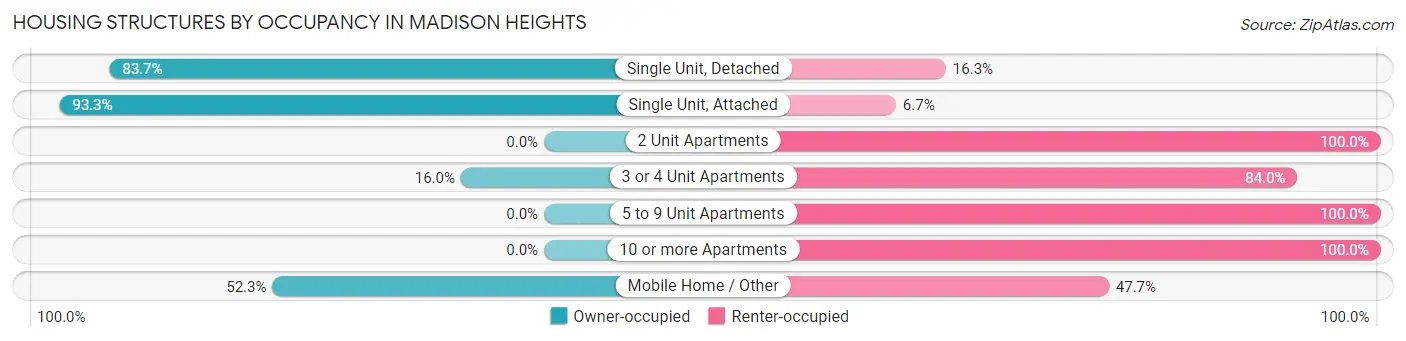
| Structure Type | Owner-occupied | Renter-occupied |
| Single Unit, Detached | 7,863 (83.7%) | 1,533 (16.3%) |
| Single Unit, Attached | 223 (93.3%) | 16 (6.7%) |
| 2 Unit Apartments | 0 (0.0%) | 16 (100.0%) |
| 3 or 4 Unit Apartments | 73 (16.0%) | 383 (84.0%) |
| 5 to 9 Unit Apartments | 0 (0.0%) | 1,297 (100.0%) |
| 10 or more Apartments | 0 (0.0%) | 1,579 (100.0%) |
| Mobile Home / Other | 249 (52.3%) | 227 (47.7%) |
| Total | 8,408 (62.5%) | 5,051 (37.5%) |
Housing Structures by Number of Rooms in Madison Heights
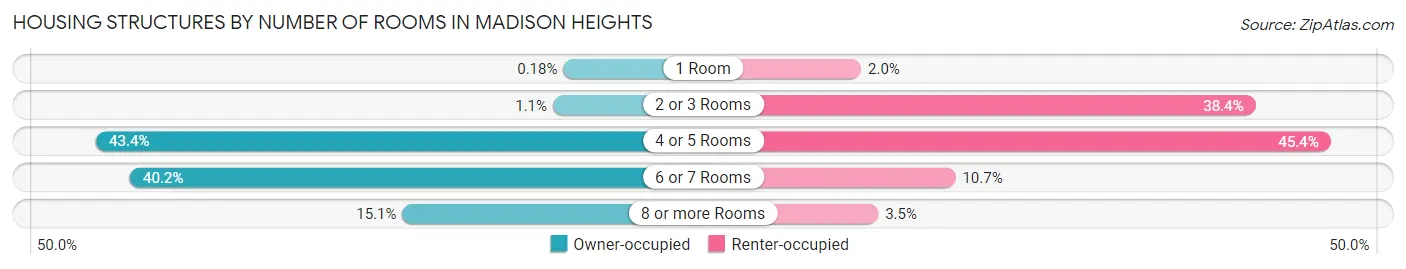
| Number of Rooms | Owner-occupied | Renter-occupied |
| 1 Room | 15 (0.2%) | 99 (2.0%) |
| 2 or 3 Rooms | 96 (1.1%) | 1,941 (38.4%) |
| 4 or 5 Rooms | 3,647 (43.4%) | 2,292 (45.4%) |
| 6 or 7 Rooms | 3,383 (40.2%) | 540 (10.7%) |
| 8 or more Rooms | 1,267 (15.1%) | 179 (3.5%) |
| Total | 8,408 (100.0%) | 5,051 (100.0%) |
Housing Structure by Heating Type in Madison Heights
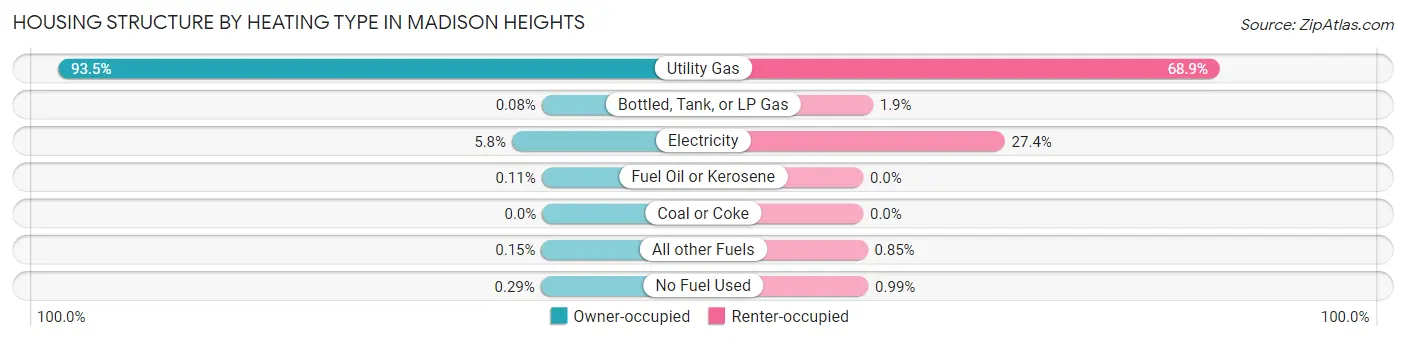
| Heating Type | Owner-occupied | Renter-occupied |
| Utility Gas | 7,864 (93.5%) | 3,481 (68.9%) |
| Bottled, Tank, or LP Gas | 7 (0.1%) | 95 (1.9%) |
| Electricity | 491 (5.8%) | 1,382 (27.4%) |
| Fuel Oil or Kerosene | 9 (0.1%) | 0 (0.0%) |
| Coal or Coke | 0 (0.0%) | 0 (0.0%) |
| All other Fuels | 13 (0.2%) | 43 (0.9%) |
| No Fuel Used | 24 (0.3%) | 50 (1.0%) |
| Total | 8,408 (100.0%) | 5,051 (100.0%) |
Household Vehicle Usage in Madison Heights
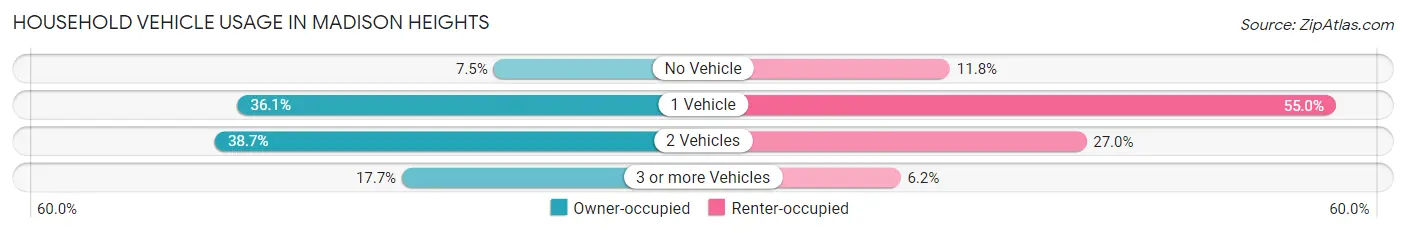
| Vehicles per Household | Owner-occupied | Renter-occupied |
| No Vehicle | 627 (7.5%) | 594 (11.8%) |
| 1 Vehicle | 3,039 (36.1%) | 2,777 (55.0%) |
| 2 Vehicles | 3,251 (38.7%) | 1,366 (27.0%) |
| 3 or more Vehicles | 1,491 (17.7%) | 314 (6.2%) |
| Total | 8,408 (100.0%) | 5,051 (100.0%) |
Real Estate & Mortgages in Madison Heights
Real Estate and Mortgage Overview in Madison Heights
| Characteristic | Without Mortgage | With Mortgage |
| Housing Units | 3,132 | 5,276 |
| Median Property Value | $167,100 | $176,000 |
| Median Household Income | $55,134 | $716 |
| Monthly Housing Costs | $527 | $19 |
| Real Estate Taxes | $2,495 | $156 |
Property Value by Mortgage Status in Madison Heights
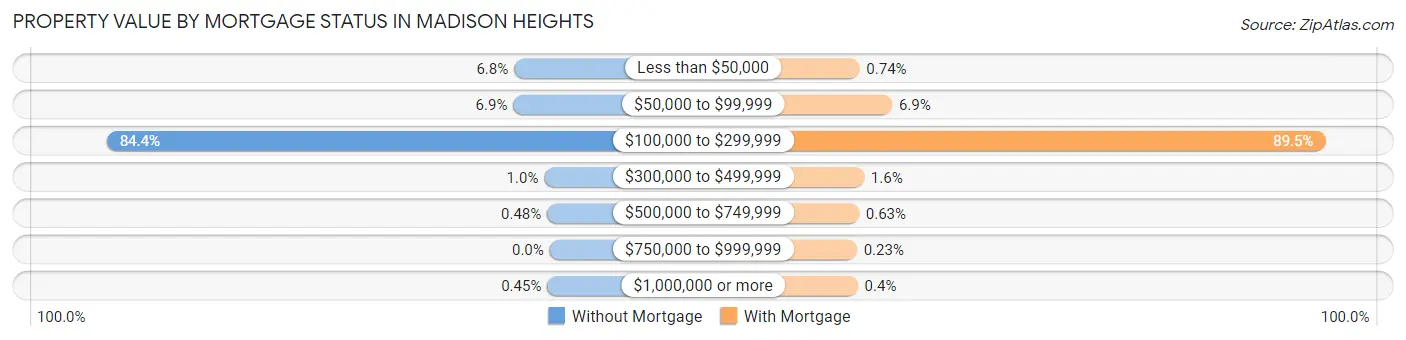
| Property Value | Without Mortgage | With Mortgage |
| Less than $50,000 | 212 (6.8%) | 39 (0.7%) |
| $50,000 to $99,999 | 217 (6.9%) | 366 (6.9%) |
| $100,000 to $299,999 | 2,642 (84.4%) | 4,721 (89.5%) |
| $300,000 to $499,999 | 32 (1.0%) | 84 (1.6%) |
| $500,000 to $749,999 | 15 (0.5%) | 33 (0.6%) |
| $750,000 to $999,999 | 0 (0.0%) | 12 (0.2%) |
| $1,000,000 or more | 14 (0.4%) | 21 (0.4%) |
| Total | 3,132 (100.0%) | 5,276 (100.0%) |
Household Income by Mortgage Status in Madison Heights
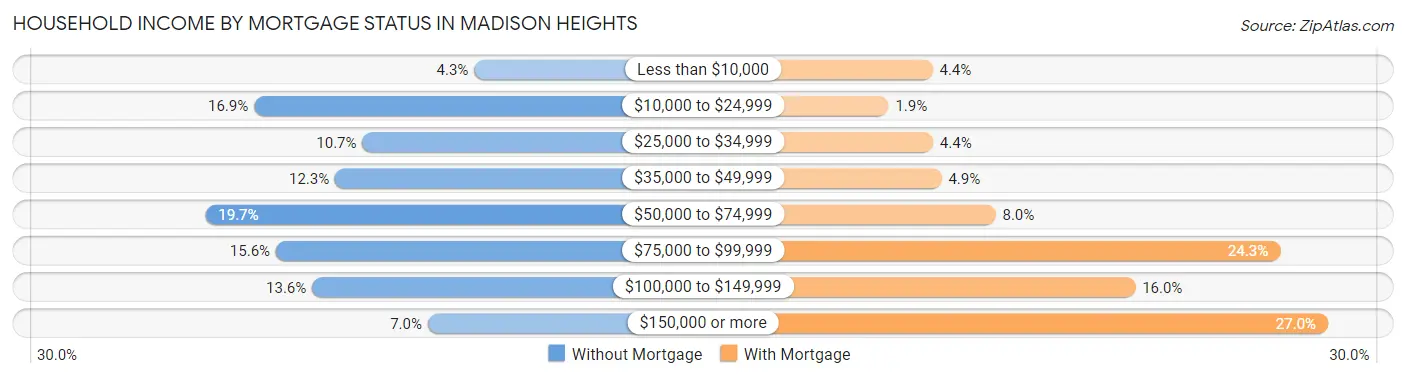
| Household Income | Without Mortgage | With Mortgage |
| Less than $10,000 | 135 (4.3%) | 232 (4.4%) |
| $10,000 to $24,999 | 529 (16.9%) | 99 (1.9%) |
| $25,000 to $34,999 | 335 (10.7%) | 233 (4.4%) |
| $35,000 to $49,999 | 384 (12.3%) | 259 (4.9%) |
| $50,000 to $74,999 | 616 (19.7%) | 422 (8.0%) |
| $75,000 to $99,999 | 490 (15.6%) | 1,280 (24.3%) |
| $100,000 to $149,999 | 425 (13.6%) | 843 (16.0%) |
| $150,000 or more | 218 (7.0%) | 1,424 (27.0%) |
| Total | 3,132 (100.0%) | 5,276 (100.0%) |
Property Value to Household Income Ratio in Madison Heights
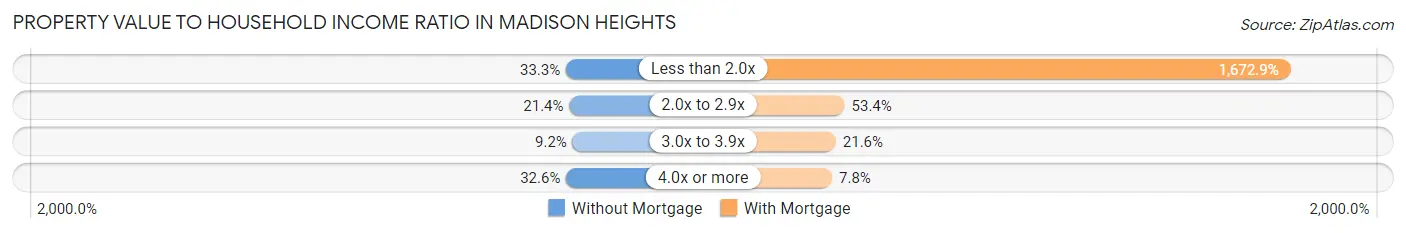
| Value-to-Income Ratio | Without Mortgage | With Mortgage |
| Less than 2.0x | 1,043 (33.3%) | 88,260 (1,672.9%) |
| 2.0x to 2.9x | 670 (21.4%) | 2,818 (53.4%) |
| 3.0x to 3.9x | 288 (9.2%) | 1,137 (21.5%) |
| 4.0x or more | 1,022 (32.6%) | 413 (7.8%) |
| Total | 3,132 (100.0%) | 5,276 (100.0%) |
Real Estate Taxes by Mortgage Status in Madison Heights
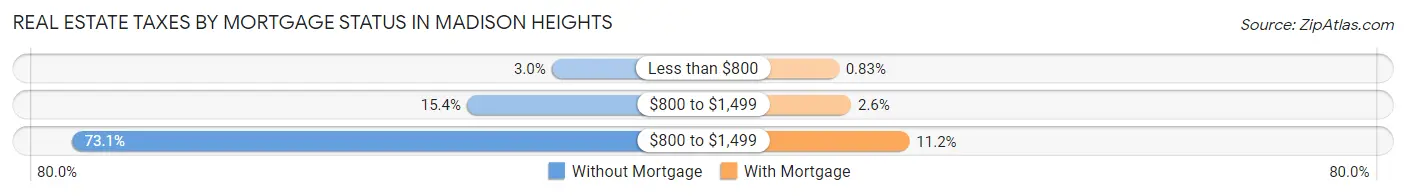
| Property Taxes | Without Mortgage | With Mortgage |
| Less than $800 | 94 (3.0%) | 44 (0.8%) |
| $800 to $1,499 | 482 (15.4%) | 139 (2.6%) |
| $800 to $1,499 | 2,290 (73.1%) | 589 (11.2%) |
| Total | 3,132 (100.0%) | 5,276 (100.0%) |
Health & Disability in Madison Heights
Health Insurance Coverage by Age in Madison Heights
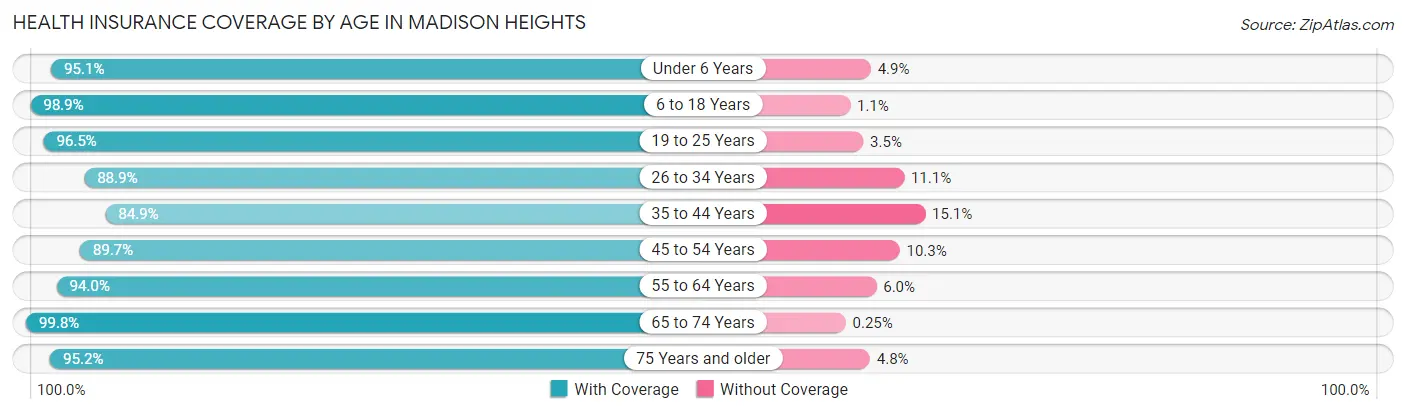
| Age Bracket | With Coverage | Without Coverage |
| Under 6 Years | 1,177 (95.1%) | 61 (4.9%) |
| 6 to 18 Years | 3,420 (98.9%) | 37 (1.1%) |
| 19 to 25 Years | 2,603 (96.5%) | 95 (3.5%) |
| 26 to 34 Years | 4,310 (88.9%) | 540 (11.1%) |
| 35 to 44 Years | 2,998 (84.9%) | 532 (15.1%) |
| 45 to 54 Years | 3,888 (89.7%) | 447 (10.3%) |
| 55 to 64 Years | 3,312 (94.0%) | 210 (6.0%) |
| 65 to 74 Years | 2,768 (99.8%) | 7 (0.3%) |
| 75 Years and older | 1,895 (95.2%) | 95 (4.8%) |
| Total | 26,371 (92.9%) | 2,024 (7.1%) |
Health Insurance Coverage by Citizenship Status in Madison Heights
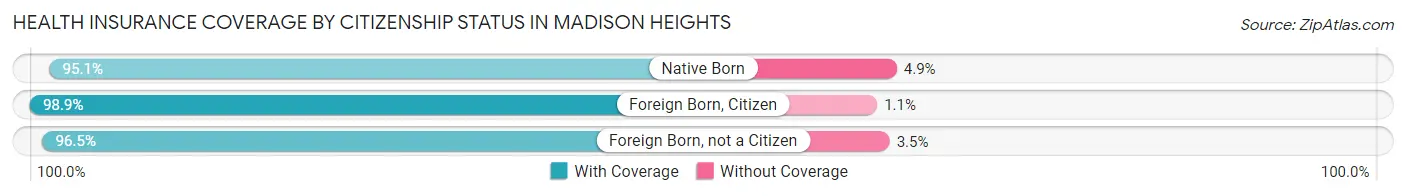
| Citizenship Status | With Coverage | Without Coverage |
| Native Born | 1,177 (95.1%) | 61 (4.9%) |
| Foreign Born, Citizen | 3,420 (98.9%) | 37 (1.1%) |
| Foreign Born, not a Citizen | 2,603 (96.5%) | 95 (3.5%) |
Health Insurance Coverage by Household Income in Madison Heights
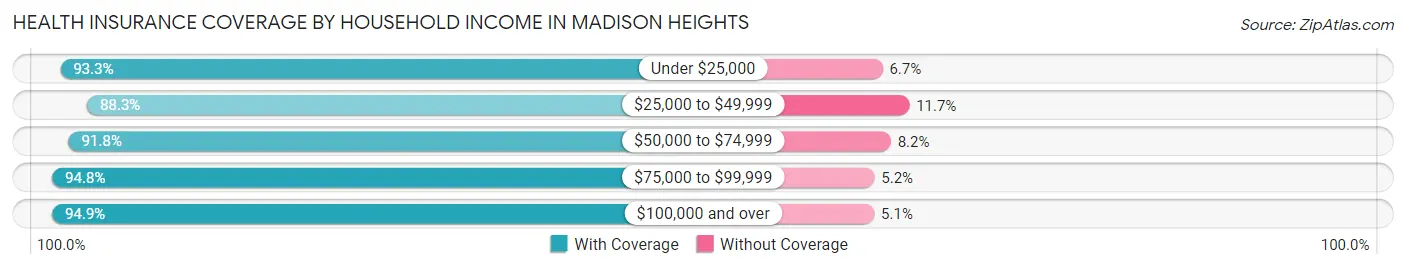
| Household Income | With Coverage | Without Coverage |
| Under $25,000 | 2,876 (93.3%) | 206 (6.7%) |
| $25,000 to $49,999 | 4,413 (88.3%) | 584 (11.7%) |
| $50,000 to $74,999 | 5,666 (91.8%) | 508 (8.2%) |
| $75,000 to $99,999 | 3,766 (94.8%) | 205 (5.2%) |
| $100,000 and over | 9,638 (94.9%) | 521 (5.1%) |
Public vs Private Health Insurance Coverage by Age in Madison Heights
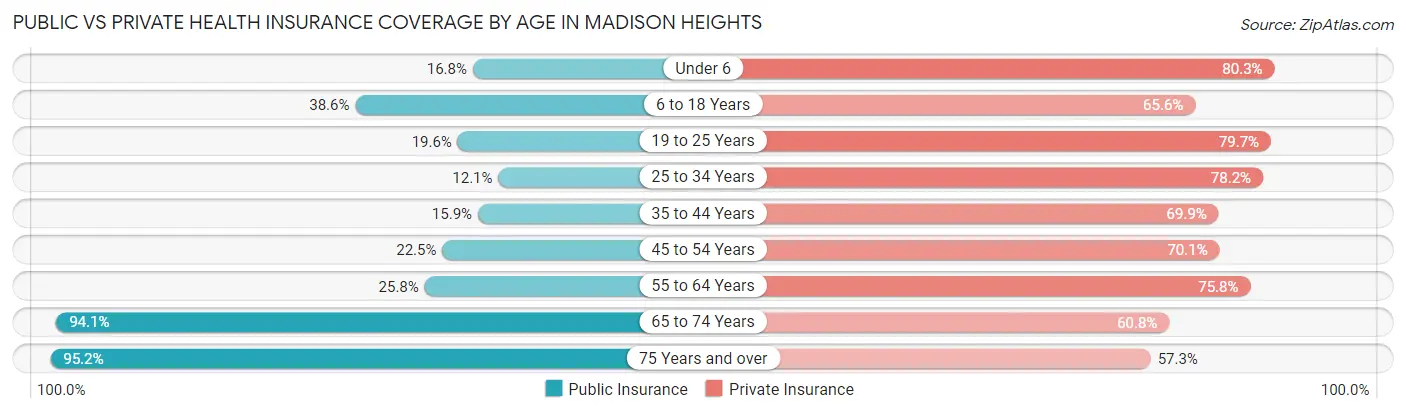
| Age Bracket | Public Insurance | Private Insurance |
| Under 6 | 208 (16.8%) | 994 (80.3%) |
| 6 to 18 Years | 1,335 (38.6%) | 2,267 (65.6%) |
| 19 to 25 Years | 529 (19.6%) | 2,149 (79.6%) |
| 25 to 34 Years | 585 (12.1%) | 3,791 (78.2%) |
| 35 to 44 Years | 560 (15.9%) | 2,469 (69.9%) |
| 45 to 54 Years | 974 (22.5%) | 3,039 (70.1%) |
| 55 to 64 Years | 907 (25.8%) | 2,670 (75.8%) |
| 65 to 74 Years | 2,612 (94.1%) | 1,686 (60.8%) |
| 75 Years and over | 1,895 (95.2%) | 1,141 (57.3%) |
| Total | 9,605 (33.8%) | 20,206 (71.2%) |
Disability Status by Sex by Age in Madison Heights
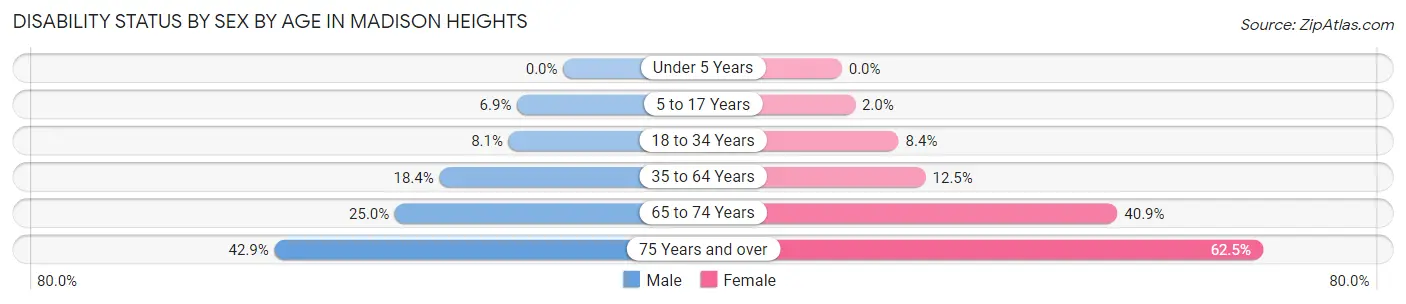
| Age Bracket | Male | Female |
| Under 5 Years | 0 (0.0%) | 0 (0.0%) |
| 5 to 17 Years | 110 (6.9%) | 37 (1.9%) |
| 18 to 34 Years | 348 (8.1%) | 288 (8.4%) |
| 35 to 64 Years | 1,032 (18.4%) | 719 (12.4%) |
| 65 to 74 Years | 286 (25.0%) | 667 (40.9%) |
| 75 Years and over | 356 (42.9%) | 725 (62.5%) |
Disability Class by Sex by Age in Madison Heights
Disability Class: Hearing Difficulty
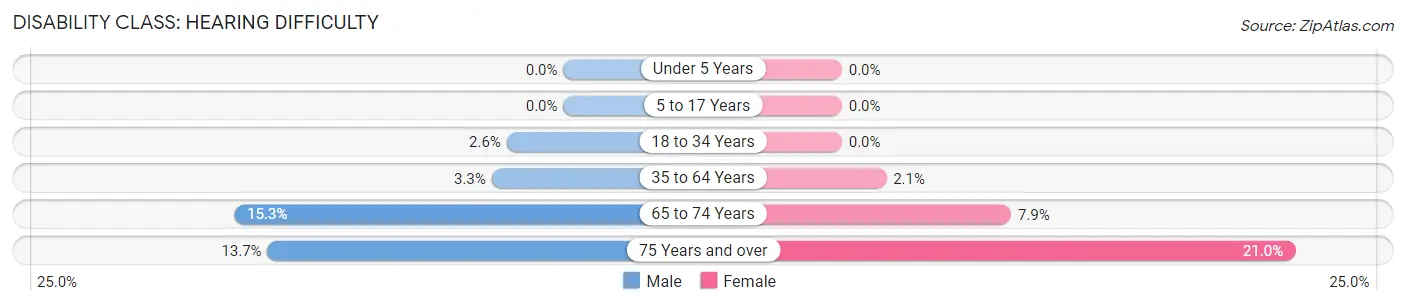
| Age Bracket | Male | Female |
| Under 5 Years | 0 (0.0%) | 0 (0.0%) |
| 5 to 17 Years | 0 (0.0%) | 0 (0.0%) |
| 18 to 34 Years | 113 (2.6%) | 0 (0.0%) |
| 35 to 64 Years | 187 (3.3%) | 119 (2.1%) |
| 65 to 74 Years | 175 (15.3%) | 128 (7.9%) |
| 75 Years and over | 114 (13.7%) | 244 (21.0%) |
Disability Class: Vision Difficulty
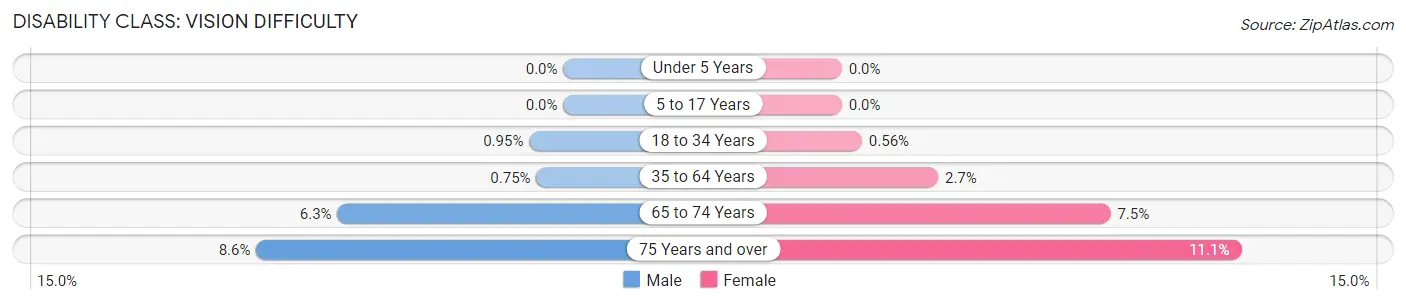
| Age Bracket | Male | Female |
| Under 5 Years | 0 (0.0%) | 0 (0.0%) |
| 5 to 17 Years | 0 (0.0%) | 0 (0.0%) |
| 18 to 34 Years | 41 (0.9%) | 19 (0.6%) |
| 35 to 64 Years | 42 (0.7%) | 155 (2.7%) |
| 65 to 74 Years | 72 (6.3%) | 122 (7.5%) |
| 75 Years and over | 71 (8.6%) | 129 (11.1%) |
Disability Class: Cognitive Difficulty
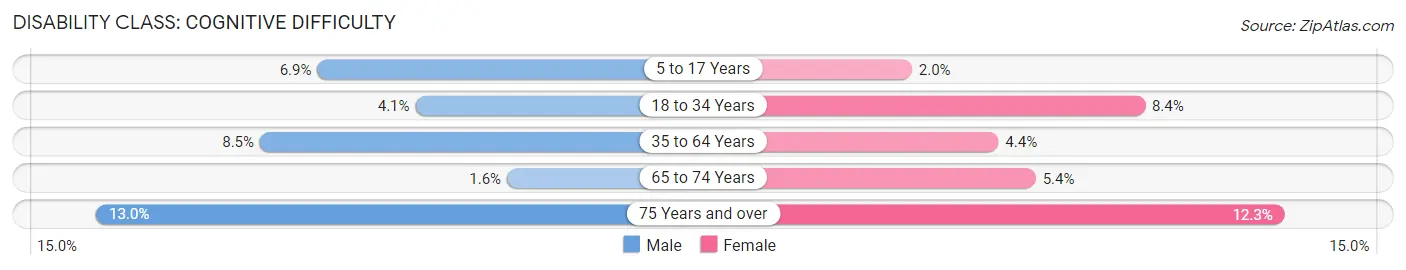
| Age Bracket | Male | Female |
| 5 to 17 Years | 110 (6.9%) | 37 (1.9%) |
| 18 to 34 Years | 177 (4.1%) | 288 (8.4%) |
| 35 to 64 Years | 474 (8.5%) | 252 (4.4%) |
| 65 to 74 Years | 18 (1.6%) | 88 (5.4%) |
| 75 Years and over | 108 (13.0%) | 143 (12.3%) |
Disability Class: Ambulatory Difficulty
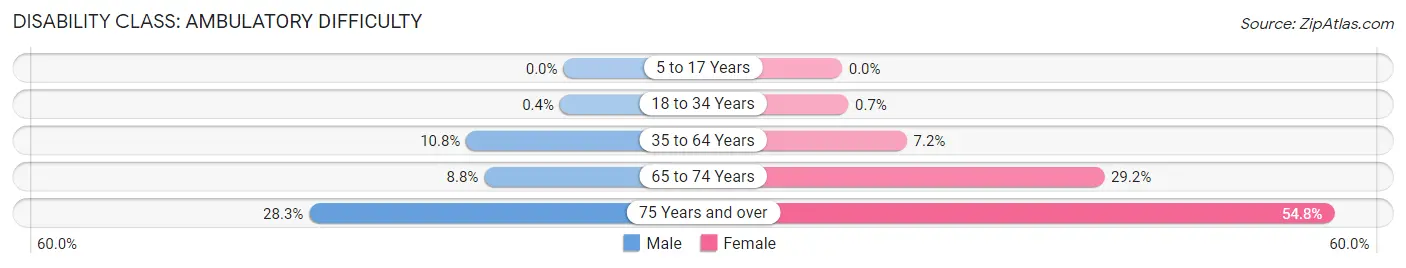
| Age Bracket | Male | Female |
| 5 to 17 Years | 0 (0.0%) | 0 (0.0%) |
| 18 to 34 Years | 17 (0.4%) | 24 (0.7%) |
| 35 to 64 Years | 607 (10.8%) | 417 (7.2%) |
| 65 to 74 Years | 101 (8.8%) | 476 (29.2%) |
| 75 Years and over | 235 (28.3%) | 636 (54.8%) |
Disability Class: Self-Care Difficulty
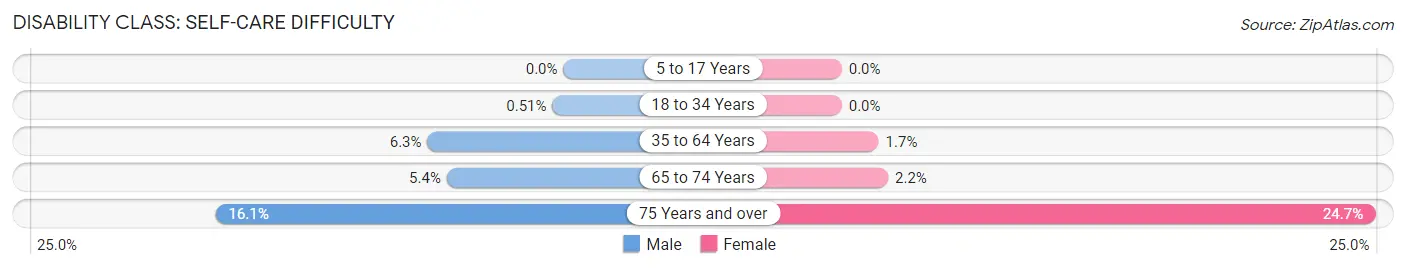
| Age Bracket | Male | Female |
| 5 to 17 Years | 0 (0.0%) | 0 (0.0%) |
| 18 to 34 Years | 22 (0.5%) | 0 (0.0%) |
| 35 to 64 Years | 354 (6.3%) | 99 (1.7%) |
| 65 to 74 Years | 62 (5.4%) | 35 (2.1%) |
| 75 Years and over | 134 (16.1%) | 287 (24.7%) |
Technology Access in Madison Heights
Computing Device Access in Madison Heights
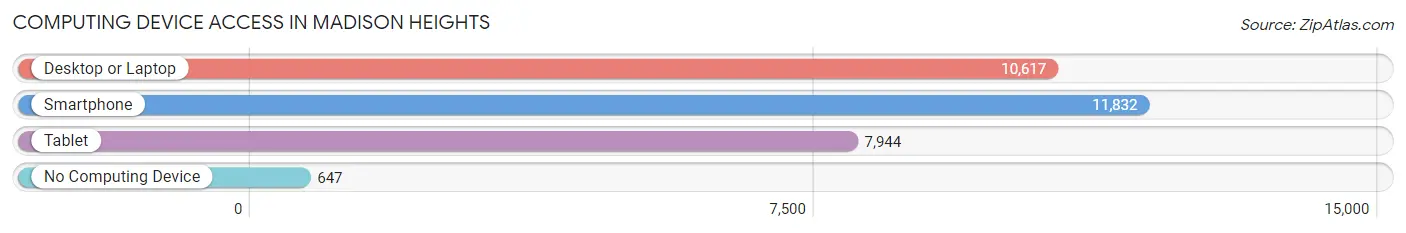
| Device Type | # Households | % Households |
| Desktop or Laptop | 10,617 | 78.9% |
| Smartphone | 11,832 | 87.9% |
| Tablet | 7,944 | 59.0% |
| No Computing Device | 647 | 4.8% |
| Total | 13,459 | 100.0% |
Internet Access in Madison Heights
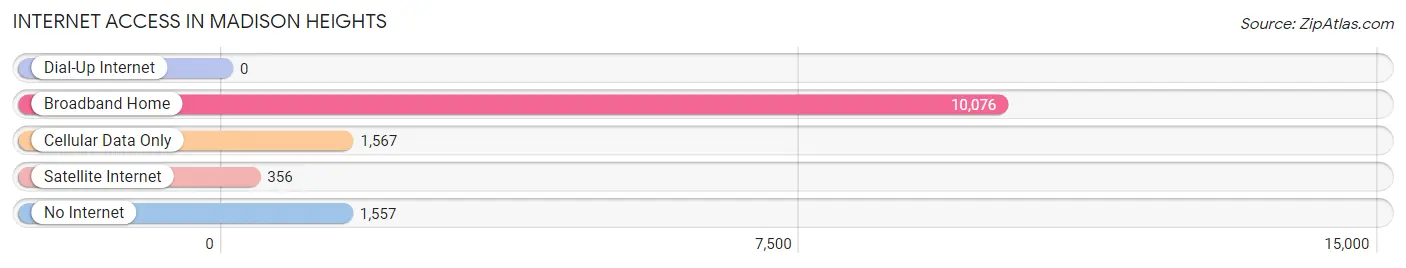
| Internet Type | # Households | % Households |
| Dial-Up Internet | 0 | 0.0% |
| Broadband Home | 10,076 | 74.9% |
| Cellular Data Only | 1,567 | 11.6% |
| Satellite Internet | 356 | 2.6% |
| No Internet | 1,557 | 11.6% |
| Total | 13,459 | 100.0% |
Madison Heights Summary
History
The city of Madison Heights, Michigan is located in Oakland County, approximately 15 miles north of Detroit. The city was first settled in 1818 by a group of settlers from New York. The city was originally known as "Eaton's Corners" after the first settler, John Eaton. The city was renamed Madison Heights in 1875 after the nearby Madison Township.
The city was incorporated in 1955 and has since grown to a population of over 30,000. Madison Heights is a diverse city with a mix of residential, commercial, and industrial areas. The city is home to several large employers, including Chrysler, General Motors, and the Detroit Medical Center.
Geography
Madison Heights is located in Oakland County, Michigan, approximately 15 miles north of Detroit. The city is situated on the western edge of the Detroit metropolitan area. The city is bordered by Royal Oak to the north, Troy to the east, and Ferndale to the south.
The city has a total area of 4.7 square miles, of which 4.6 square miles is land and 0.1 square miles is water. The city is located on the Huron River, which flows through the city and is a major source of recreation for the area.
Economy
Madison Heights is home to several large employers, including Chrysler, General Motors, and the Detroit Medical Center. The city is also home to several smaller businesses, including restaurants, retail stores, and professional services.
The city has a strong manufacturing base, with several automotive and aerospace companies located in the city. The city is also home to several technology companies, including software development and IT services.
The city has a median household income of $50,000, which is slightly higher than the national average. The city also has a low unemployment rate of 4.2%, which is lower than the national average.
Demographics
As of the 2010 census, Madison Heights had a population of 29,694. The racial makeup of the city was 79.2% White, 11.3% African American, 0.4% Native American, 2.3% Asian, 0.1% Pacific Islander, 4.2% from other races, and 2.5% from two or more races. Hispanic or Latino of any race were 8.2% of the population.
The median age in Madison Heights was 40.2 years. 22.2% of residents were under the age of 18; 8.2% were between the ages of 18 and 24; 25.2% were from 25 to 44; 28.2% were from 45 to 64; and 16.2% were 65 years of age or older. The gender makeup of the city was 48.2% male and 51.8% female.
The median income for a household in Madison Heights was $50,000, and the median income for a family was $58,000. The per capita income for the city was $25,000. About 8.2% of families and 10.2% of the population were below the poverty line, including 14.2% of those under age 18 and 6.2% of those age 65 or over.
Common Questions
What is Per Capita Income in Madison Heights?
Per Capita income in Madison Heights is $37,113.
What is the Median Family Income in Madison Heights?
Median Family Income in Madison Heights is $75,505.
What is the Median Household income in Madison Heights?
Median Household Income in Madison Heights is $63,224.
What is Income or Wage Gap in Madison Heights?
Income or Wage Gap in Madison Heights is 23.6%.
Women in Madison Heights earn 76.4 cents for every dollar earned by a man.
What is Inequality or Gini Index in Madison Heights?
Inequality or Gini Index in Madison Heights is 0.40.
What is the Total Population of Madison Heights?
Total Population of Madison Heights is 28,521.
What is the Total Male Population of Madison Heights?
Total Male Population of Madison Heights is 14,048.
What is the Total Female Population of Madison Heights?
Total Female Population of Madison Heights is 14,473.
What is the Ratio of Males per 100 Females in Madison Heights?
There are 97.06 Males per 100 Females in Madison Heights.
What is the Ratio of Females per 100 Males in Madison Heights?
There are 103.03 Females per 100 Males in Madison Heights.
What is the Median Population Age in Madison Heights?
Median Population Age in Madison Heights is 40.5 Years.
What is the Average Family Size in Madison Heights
Average Family Size in Madison Heights is 3.0 People.
What is the Average Household Size in Madison Heights
Average Household Size in Madison Heights is 2.1 People.
How Large is the Labor Force in Madison Heights?
There are 16,857 People in the Labor Forcein in Madison Heights.
What is the Percentage of People in the Labor Force in Madison Heights?
68.8% of People are in the Labor Force in Madison Heights.
What is the Unemployment Rate in Madison Heights?
Unemployment Rate in Madison Heights is 3.6%.