La Crescenta Montrose, CA Map & Demographics
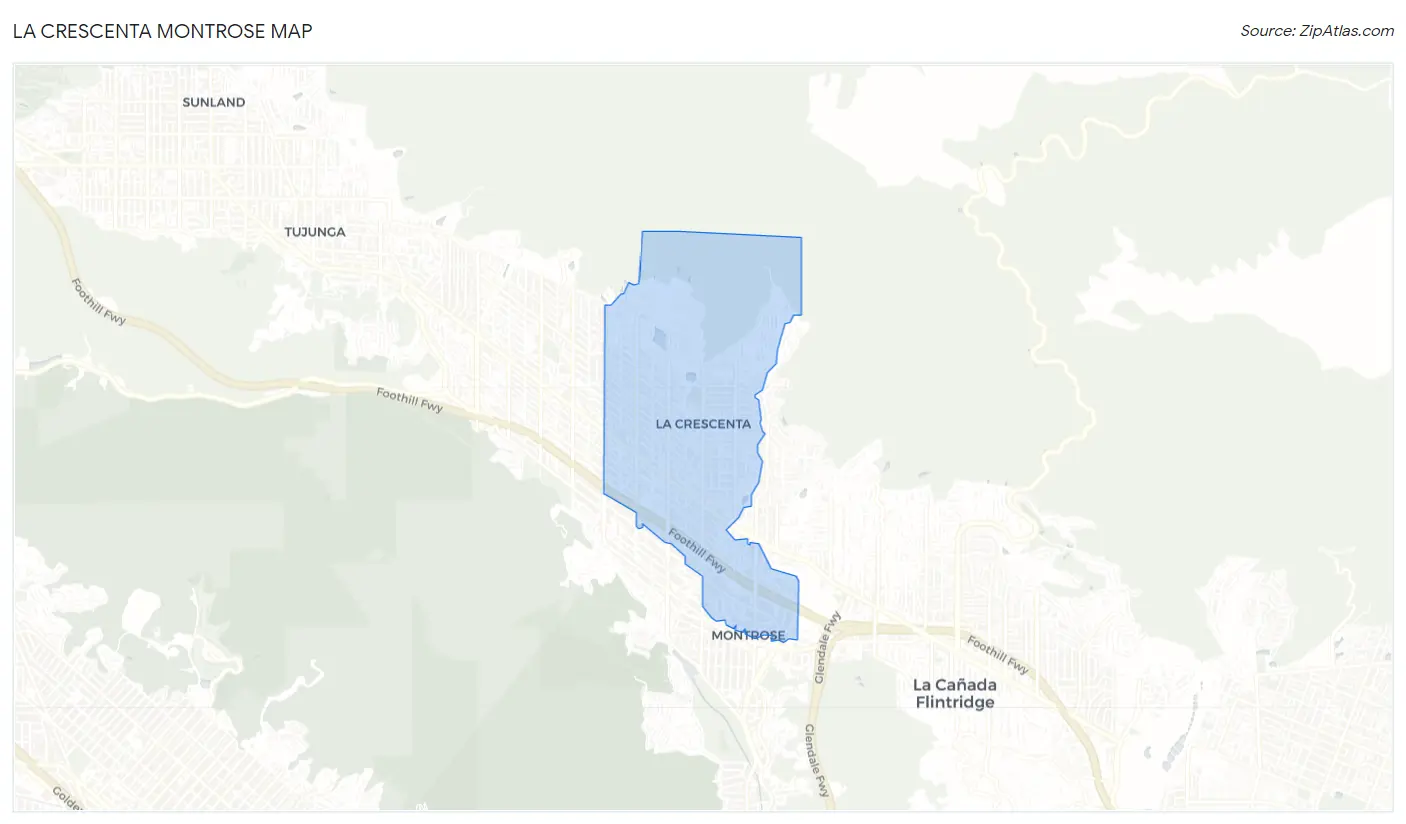
La Crescenta Montrose Map
La Crescenta Montrose Overview
$54,376
PER CAPITA INCOME
$156,346
AVG FAMILY INCOME
$115,734
AVG HOUSEHOLD INCOME
33.9%
WAGE / INCOME GAP [ % ]
66.1¢/ $1
WAGE / INCOME GAP [ $ ]
0.46
INEQUALITY / GINI INDEX
20,092
TOTAL POPULATION
9,696
MALE POPULATION
10,396
FEMALE POPULATION
93.27
MALES / 100 FEMALES
107.22
FEMALES / 100 MALES
42.1
MEDIAN AGE
3.5
AVG FAMILY SIZE
2.8
AVG HOUSEHOLD SIZE
10,238
LABOR FORCE [ PEOPLE ]
65.2%
PERCENT IN LABOR FORCE
7.5%
UNEMPLOYMENT RATE
Income in La Crescenta Montrose
Income Overview in La Crescenta Montrose
Per Capita Income in La Crescenta Montrose is $54,376, while median incomes of families and households are $156,346 and $115,734 respectively.
| Characteristic | Number | Measure |
| Per Capita Income | 20,092 | $54,376 |
| Median Family Income | 4,970 | $156,346 |
| Mean Family Income | 4,970 | $180,766 |
| Median Household Income | 7,259 | $115,734 |
| Mean Household Income | 7,259 | $147,357 |
| Income Deficit | 4,970 | $0 |
| Wage / Income Gap (%) | 20,092 | 33.91% |
| Wage / Income Gap ($) | 20,092 | 66.09¢ per $1 |
| Gini / Inequality Index | 20,092 | 0.46 |
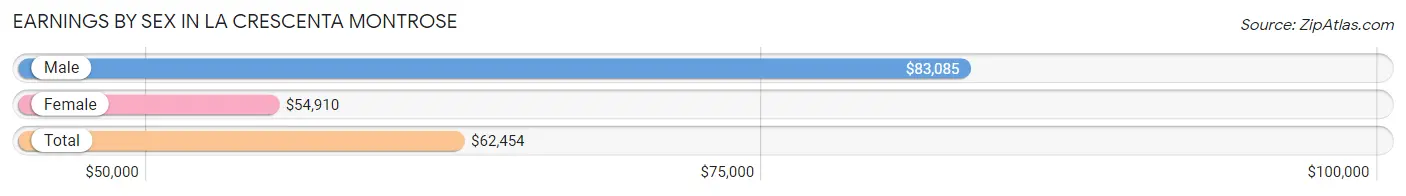
Earnings by Sex in La Crescenta Montrose
Average Earnings in La Crescenta Montrose are $62,454, $83,085 for men and $54,910 for women, a difference of 33.9%.
| Sex | Number | Average Earnings |
| Male | 5,180 (48.7%) | $83,085 |
| Female | 5,453 (51.3%) | $54,910 |
| Total | 10,633 (100.0%) | $62,454 |
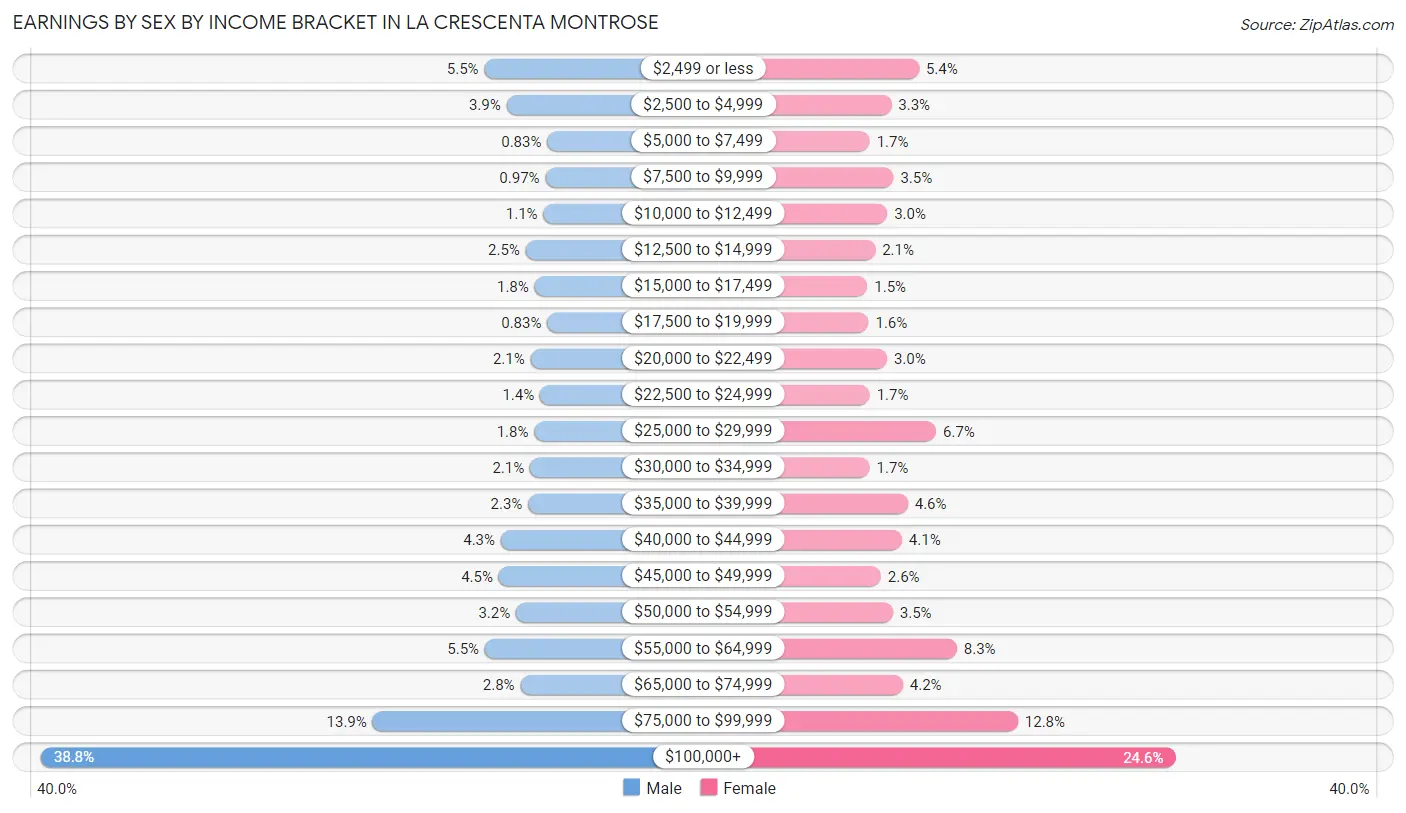
Earnings by Sex by Income Bracket in La Crescenta Montrose
The most common earnings brackets in La Crescenta Montrose are $100,000+ for men (2,009 | 38.8%) and $100,000+ for women (1,342 | 24.6%).
| Income | Male | Female |
| $2,499 or less | 287 (5.5%) | 295 (5.4%) |
| $2,500 to $4,999 | 201 (3.9%) | 182 (3.3%) |
| $5,000 to $7,499 | 43 (0.8%) | 94 (1.7%) |
| $7,500 to $9,999 | 50 (1.0%) | 191 (3.5%) |
| $10,000 to $12,499 | 58 (1.1%) | 165 (3.0%) |
| $12,500 to $14,999 | 127 (2.5%) | 116 (2.1%) |
| $15,000 to $17,499 | 92 (1.8%) | 84 (1.5%) |
| $17,500 to $19,999 | 43 (0.8%) | 89 (1.6%) |
| $20,000 to $22,499 | 108 (2.1%) | 164 (3.0%) |
| $22,500 to $24,999 | 71 (1.4%) | 94 (1.7%) |
| $25,000 to $29,999 | 93 (1.8%) | 365 (6.7%) |
| $30,000 to $34,999 | 110 (2.1%) | 93 (1.7%) |
| $35,000 to $39,999 | 117 (2.3%) | 249 (4.6%) |
| $40,000 to $44,999 | 223 (4.3%) | 225 (4.1%) |
| $45,000 to $49,999 | 231 (4.5%) | 139 (2.5%) |
| $50,000 to $54,999 | 164 (3.2%) | 188 (3.5%) |
| $55,000 to $64,999 | 285 (5.5%) | 450 (8.3%) |
| $65,000 to $74,999 | 147 (2.8%) | 229 (4.2%) |
| $75,000 to $99,999 | 721 (13.9%) | 699 (12.8%) |
| $100,000+ | 2,009 (38.8%) | 1,342 (24.6%) |
| Total | 5,180 (100.0%) | 5,453 (100.0%) |
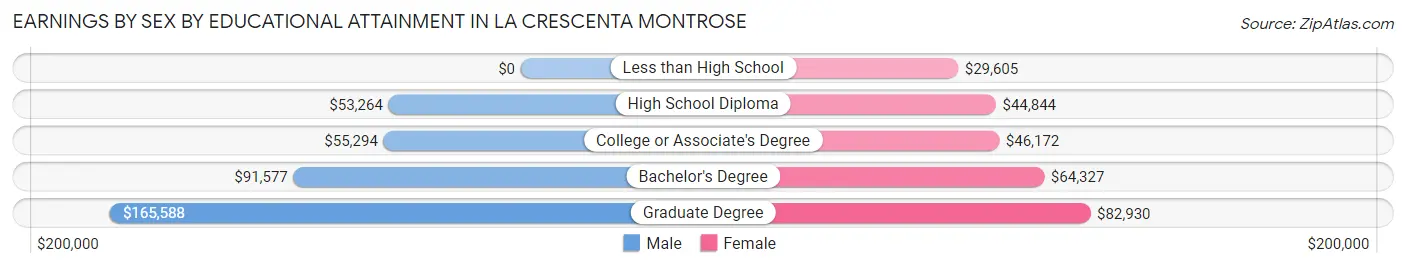
Earnings by Sex by Educational Attainment in La Crescenta Montrose
Average earnings in La Crescenta Montrose are $89,344 for men and $60,313 for women, a difference of 32.5%. Men with an educational attainment of graduate degree enjoy the highest average annual earnings of $165,588, while those with high school diploma education earn the least with $53,264. Women with an educational attainment of graduate degree earn the most with the average annual earnings of $82,930, while those with less than high school education have the smallest earnings of $29,605.
| Educational Attainment | Male Income | Female Income |
| Less than High School | - | - |
| High School Diploma | $53,264 | $44,844 |
| College or Associate's Degree | $55,294 | $46,172 |
| Bachelor's Degree | $91,577 | $64,327 |
| Graduate Degree | $165,588 | $82,930 |
| Total | $89,344 | $60,313 |
Family Income in La Crescenta Montrose
Family Income Brackets in La Crescenta Montrose
According to the La Crescenta Montrose family income data, there are 1,794 families falling into the $200,000+ income range, which is the most common income bracket and makes up 36.1% of all families. Conversely, the $10,000 to $14,999 income bracket is the least frequent group with only 15 families (0.3%) belonging to this category.
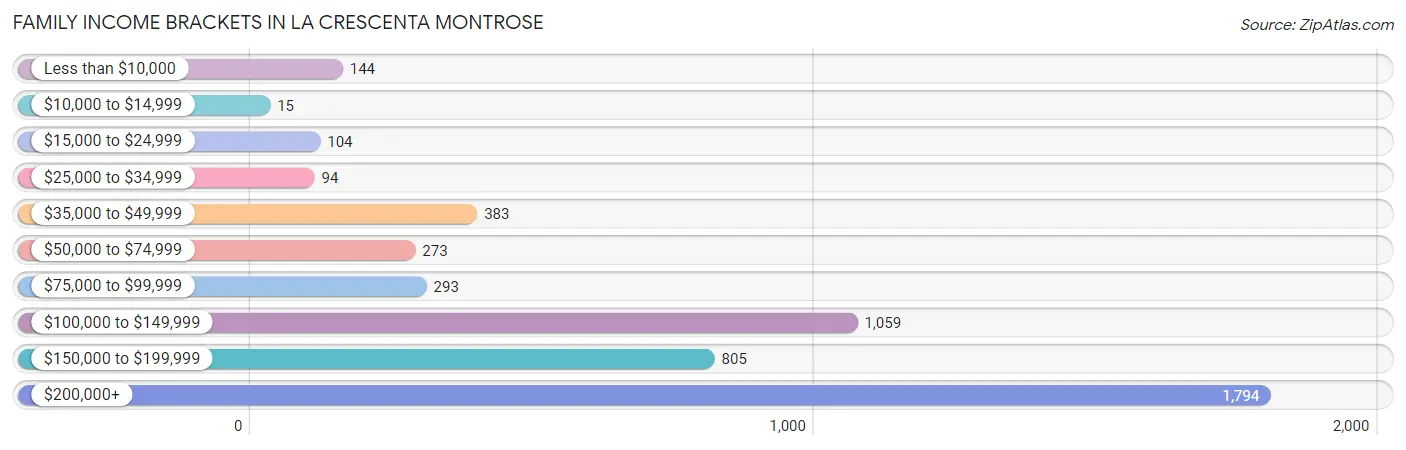
| Income Bracket | # Families | % Families |
| Less than $10,000 | 144 | 2.9% |
| $10,000 to $14,999 | 15 | 0.3% |
| $15,000 to $24,999 | 104 | 2.1% |
| $25,000 to $34,999 | 94 | 1.9% |
| $35,000 to $49,999 | 383 | 7.7% |
| $50,000 to $74,999 | 273 | 5.5% |
| $75,000 to $99,999 | 293 | 5.9% |
| $100,000 to $149,999 | 1,059 | 21.3% |
| $150,000 to $199,999 | 805 | 16.2% |
| $200,000+ | 1,794 | 36.1% |
Family Income by Famaliy Size in La Crescenta Montrose
7+ person families (95 | 1.9%) account for the highest median family income in La Crescenta Montrose with $243,173 per family, while 3-person families (1,160 | 23.3%) have the highest median income of $56,012 per family member.
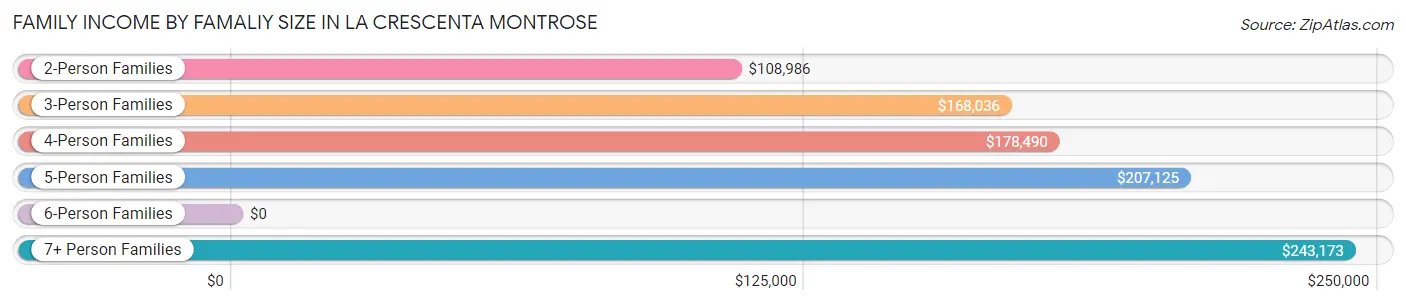
| Income Bracket | # Families | Median Income |
| 2-Person Families | 1,703 (34.3%) | $108,986 |
| 3-Person Families | 1,160 (23.3%) | $168,036 |
| 4-Person Families | 1,470 (29.6%) | $178,490 |
| 5-Person Families | 341 (6.9%) | $207,125 |
| 6-Person Families | 201 (4.0%) | $0 |
| 7+ Person Families | 95 (1.9%) | $243,173 |
| Total | 4,970 (100.0%) | $156,346 |
Family Income by Number of Earners in La Crescenta Montrose
The median family income in La Crescenta Montrose is $156,346, with families comprising 3+ earners (851) having the highest median family income of $204,861, while families with no earners (640) have the lowest median family income of $70,500, accounting for 17.1% and 12.9% of families, respectively.
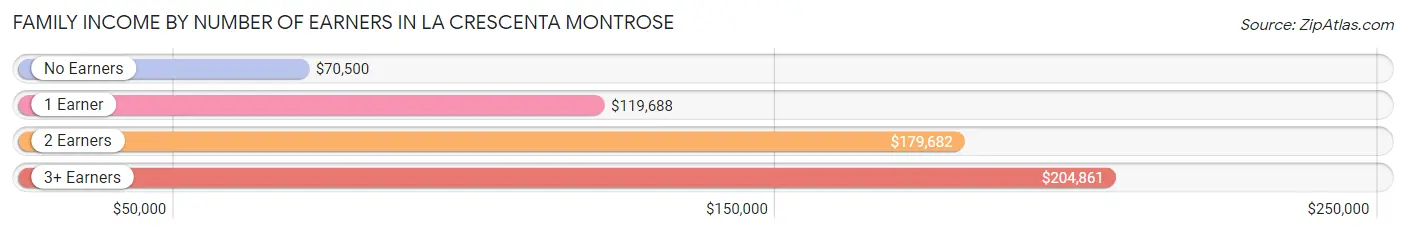
| Number of Earners | # Families | Median Income |
| No Earners | 640 (12.9%) | $70,500 |
| 1 Earner | 1,332 (26.8%) | $119,688 |
| 2 Earners | 2,147 (43.2%) | $179,682 |
| 3+ Earners | 851 (17.1%) | $204,861 |
| Total | 4,970 (100.0%) | $156,346 |
Household Income in La Crescenta Montrose
Household Income Brackets in La Crescenta Montrose
With 1,989 households falling in the category, the $200,000+ income range is the most frequent in La Crescenta Montrose, accounting for 27.4% of all households. In contrast, only 181 households (2.5%) fall into the $10,000 to $14,999 income bracket, making it the least populous group.
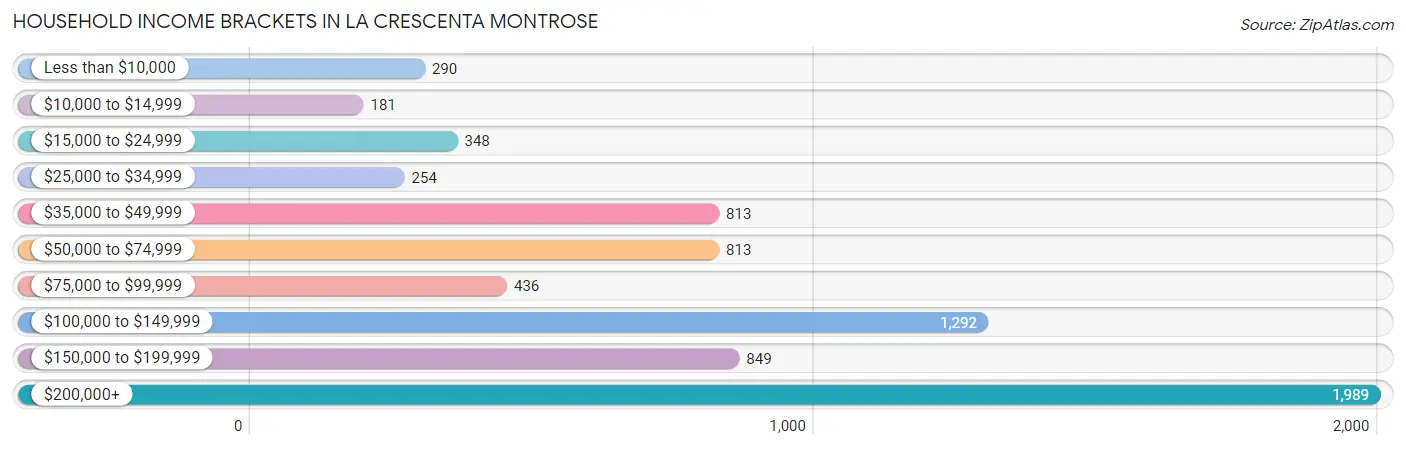
| Income Bracket | # Households | % Households |
| Less than $10,000 | 290 | 4.0% |
| $10,000 to $14,999 | 181 | 2.5% |
| $15,000 to $24,999 | 348 | 4.8% |
| $25,000 to $34,999 | 254 | 3.5% |
| $35,000 to $49,999 | 813 | 11.2% |
| $50,000 to $74,999 | 813 | 11.2% |
| $75,000 to $99,999 | 436 | 6.0% |
| $100,000 to $149,999 | 1,292 | 17.8% |
| $150,000 to $199,999 | 849 | 11.7% |
| $200,000+ | 1,989 | 27.4% |
Household Income by Householder Age in La Crescenta Montrose
The median household income in La Crescenta Montrose is $115,734, with the highest median household income of $144,327 found in the 25 to 44 years age bracket for the primary householder. A total of 1,913 households (26.4%) fall into this category. Meanwhile, the 15 to 24 years age bracket for the primary householder has the lowest median household income of $0, with 26 households (0.4%) in this group.
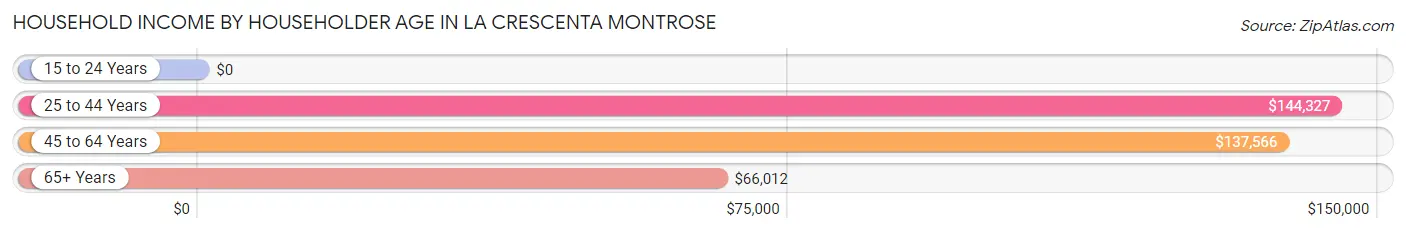
| Income Bracket | # Households | Median Income |
| 15 to 24 Years | 26 (0.4%) | $0 |
| 25 to 44 Years | 1,913 (26.4%) | $144,327 |
| 45 to 64 Years | 3,064 (42.2%) | $137,566 |
| 65+ Years | 2,256 (31.1%) | $66,012 |
| Total | 7,259 (100.0%) | $115,734 |
Poverty in La Crescenta Montrose
Income Below Poverty by Sex and Age in La Crescenta Montrose
With 4.8% poverty level for males and 7.3% for females among the residents of La Crescenta Montrose, 6 to 11 year old males and 15 year old females are the most vulnerable to poverty, with 112 males (12.0%) and 16 females (18.0%) in their respective age groups living below the poverty level.
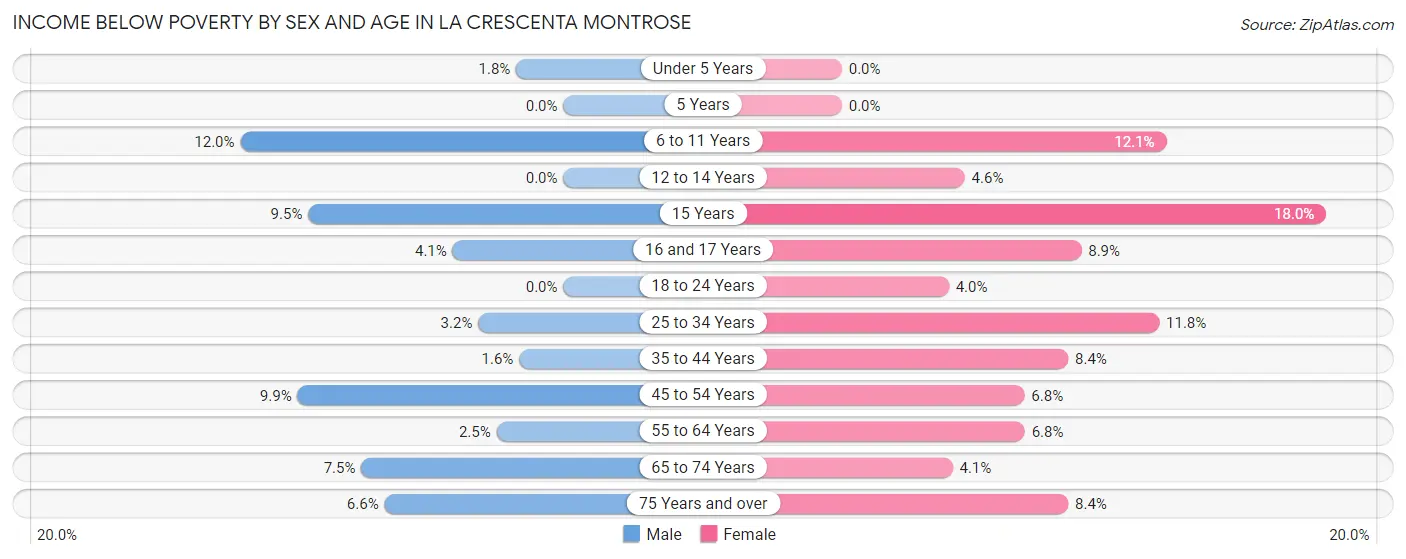
| Age Bracket | Male | Female |
| Under 5 Years | 8 (1.8%) | 0 (0.0%) |
| 5 Years | 0 (0.0%) | 0 (0.0%) |
| 6 to 11 Years | 112 (12.0%) | 93 (12.0%) |
| 12 to 14 Years | 0 (0.0%) | 21 (4.6%) |
| 15 Years | 9 (9.5%) | 16 (18.0%) |
| 16 and 17 Years | 14 (4.1%) | 16 (8.9%) |
| 18 to 24 Years | 0 (0.0%) | 23 (4.0%) |
| 25 to 34 Years | 24 (3.2%) | 130 (11.8%) |
| 35 to 44 Years | 22 (1.6%) | 139 (8.4%) |
| 45 to 54 Years | 132 (9.9%) | 97 (6.8%) |
| 55 to 64 Years | 34 (2.5%) | 93 (6.8%) |
| 65 to 74 Years | 76 (7.5%) | 45 (4.1%) |
| 75 Years and over | 30 (6.6%) | 88 (8.4%) |
| Total | 461 (4.8%) | 761 (7.3%) |
Income Above Poverty by Sex and Age in La Crescenta Montrose
According to the poverty statistics in La Crescenta Montrose, males aged 5 years and females aged under 5 years are the age groups that are most secure financially, with 100.0% of males and 100.0% of females in these age groups living above the poverty line.
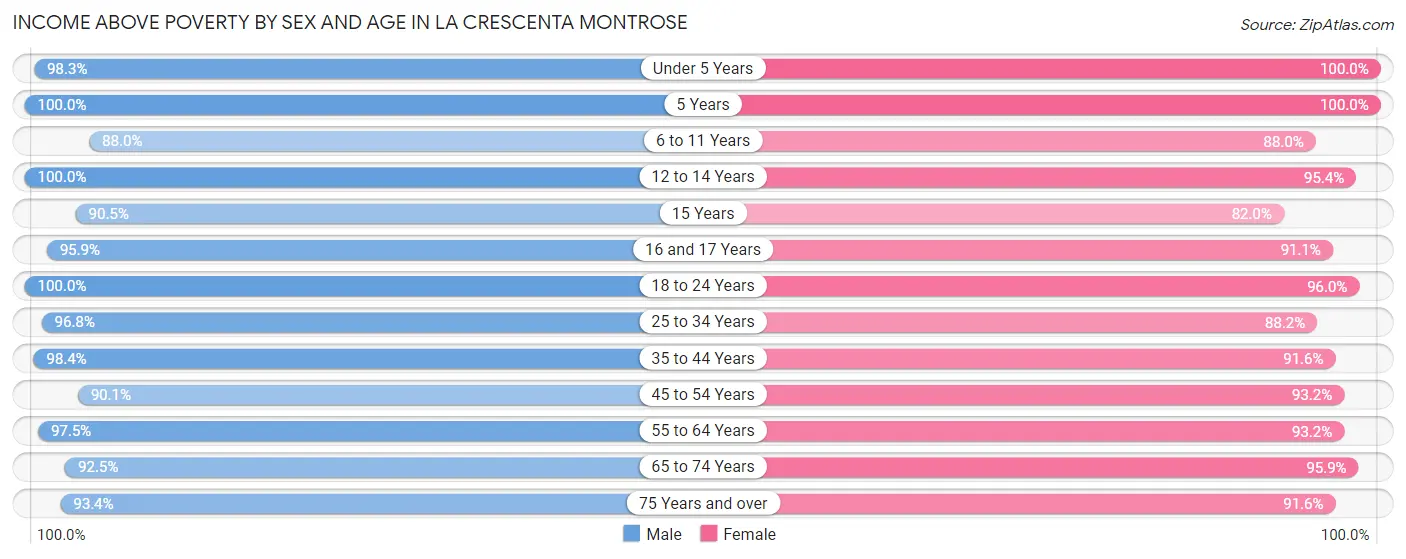
| Age Bracket | Male | Female |
| Under 5 Years | 448 (98.3%) | 474 (100.0%) |
| 5 Years | 235 (100.0%) | 129 (100.0%) |
| 6 to 11 Years | 822 (88.0%) | 679 (87.9%) |
| 12 to 14 Years | 702 (100.0%) | 440 (95.4%) |
| 15 Years | 86 (90.5%) | 73 (82.0%) |
| 16 and 17 Years | 327 (95.9%) | 164 (91.1%) |
| 18 to 24 Years | 627 (100.0%) | 557 (96.0%) |
| 25 to 34 Years | 736 (96.8%) | 974 (88.2%) |
| 35 to 44 Years | 1,316 (98.4%) | 1,516 (91.6%) |
| 45 to 54 Years | 1,206 (90.1%) | 1,333 (93.2%) |
| 55 to 64 Years | 1,337 (97.5%) | 1,276 (93.2%) |
| 65 to 74 Years | 938 (92.5%) | 1,051 (95.9%) |
| 75 Years and over | 422 (93.4%) | 960 (91.6%) |
| Total | 9,202 (95.2%) | 9,626 (92.7%) |
Income Below Poverty Among Married-Couple Families in La Crescenta Montrose
The poverty statistics for married-couple families in La Crescenta Montrose show that 4.6% or 184 of the total 4,010 families live below the poverty line. Families with no children have the highest poverty rate of 5.8%, comprising of 112 families. On the other hand, families with 5 or more children have the lowest poverty rate of 0.0%, which includes 0 families.
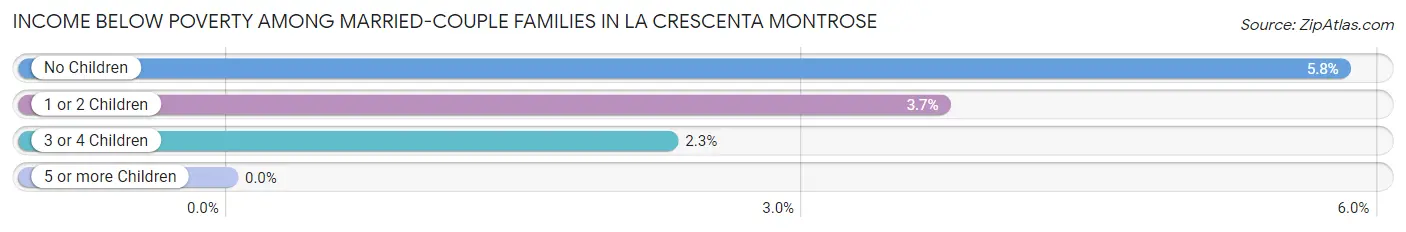
| Children | Above Poverty | Below Poverty |
| No Children | 1,816 (94.2%) | 112 (5.8%) |
| 1 or 2 Children | 1,657 (96.3%) | 64 (3.7%) |
| 3 or 4 Children | 340 (97.7%) | 8 (2.3%) |
| 5 or more Children | 13 (100.0%) | 0 (0.0%) |
| Total | 3,826 (95.4%) | 184 (4.6%) |
Income Below Poverty Among Single-Parent Households in La Crescenta Montrose
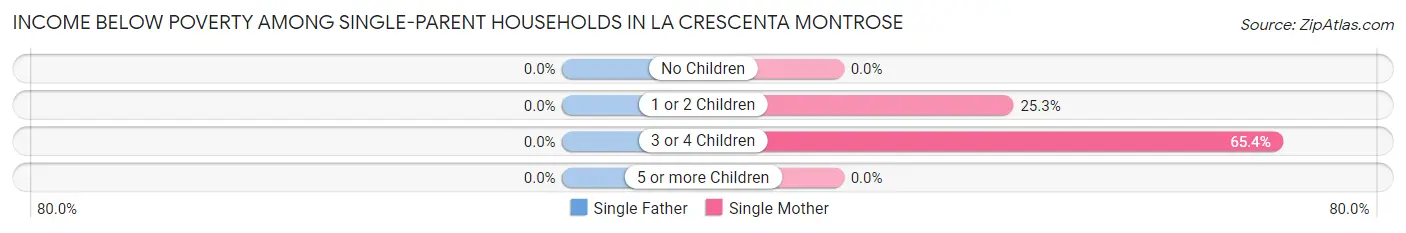
| Children | Single Father | Single Mother |
| No Children | 0 (0.0%) | 0 (0.0%) |
| 1 or 2 Children | 0 (0.0%) | 42 (25.3%) |
| 3 or 4 Children | 0 (0.0%) | 17 (65.4%) |
| 5 or more Children | 0 (0.0%) | 0 (0.0%) |
| Total | 0 (0.0%) | 59 (7.8%) |
Income Below Poverty Among Married-Couple vs Single-Parent Households in La Crescenta Montrose
The poverty data for La Crescenta Montrose shows that 184 of the married-couple family households (4.6%) and 59 of the single-parent households (6.1%) are living below the poverty level. Within the married-couple family households, those with no children have the highest poverty rate, with 112 households (5.8%) falling below the poverty line. Among the single-parent households, those with 3 or 4 children have the highest poverty rate, with 17 household (65.4%) living below poverty.
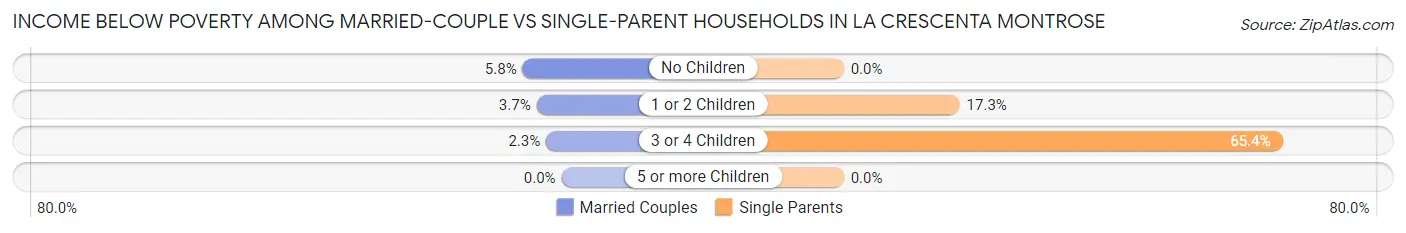
| Children | Married-Couple Families | Single-Parent Households |
| No Children | 112 (5.8%) | 0 (0.0%) |
| 1 or 2 Children | 64 (3.7%) | 42 (17.3%) |
| 3 or 4 Children | 8 (2.3%) | 17 (65.4%) |
| 5 or more Children | 0 (0.0%) | 0 (0.0%) |
| Total | 184 (4.6%) | 59 (6.1%) |
Race in La Crescenta Montrose
The most populous races in La Crescenta Montrose are White / Caucasian (11,324 | 56.4%), Asian (5,355 | 26.7%), and Hispanic or Latino (3,440 | 17.1%).
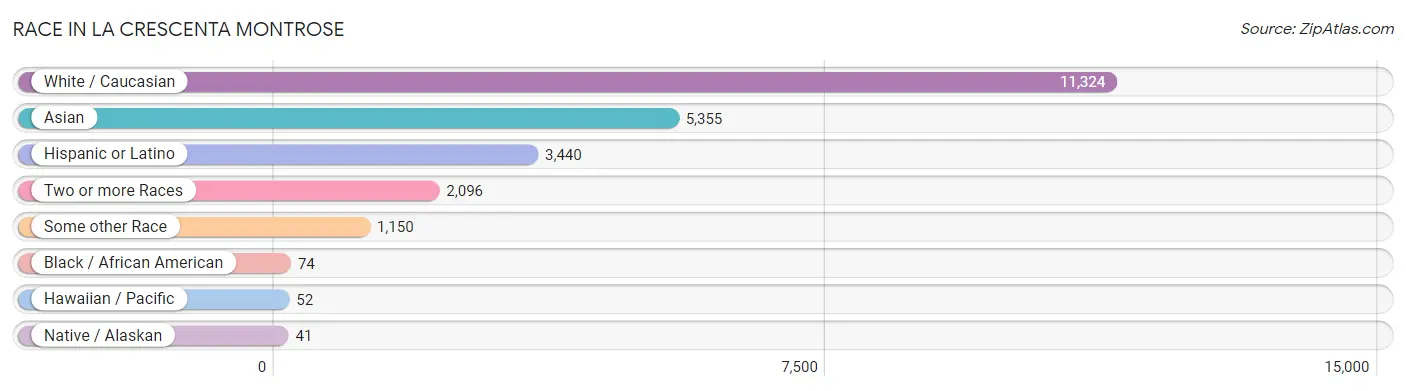
| Race | # Population | % Population |
| Asian | 5,355 | 26.7% |
| Black / African American | 74 | 0.4% |
| Hawaiian / Pacific | 52 | 0.3% |
| Hispanic or Latino | 3,440 | 17.1% |
| Native / Alaskan | 41 | 0.2% |
| White / Caucasian | 11,324 | 56.4% |
| Two or more Races | 2,096 | 10.4% |
| Some other Race | 1,150 | 5.7% |
| Total | 20,092 | 100.0% |
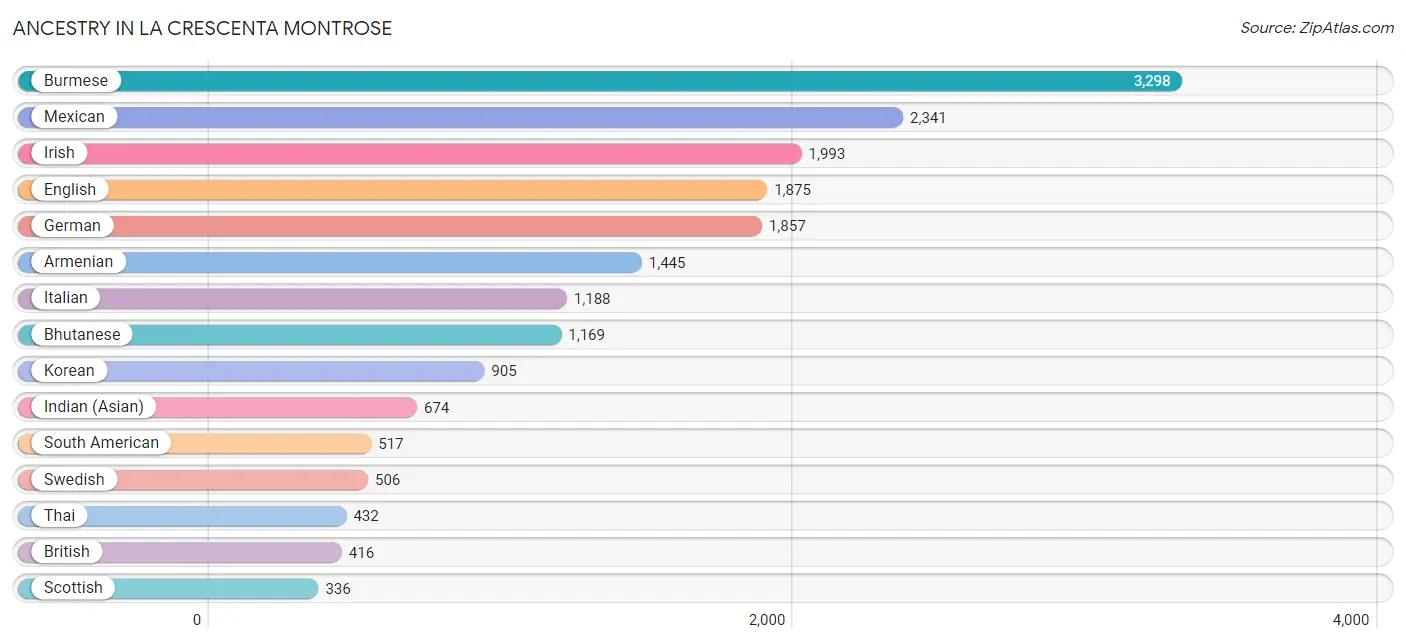
Ancestry in La Crescenta Montrose
The most populous ancestries reported in La Crescenta Montrose are Burmese (3,298 | 16.4%), Mexican (2,341 | 11.7%), Irish (1,993 | 9.9%), English (1,875 | 9.3%), and German (1,857 | 9.2%), together accounting for 56.6% of all La Crescenta Montrose residents.
| Ancestry | # Population | % Population |
| African | 11 | 0.1% |
| American | 263 | 1.3% |
| Arab | 237 | 1.2% |
| Argentinean | 44 | 0.2% |
| Armenian | 1,445 | 7.2% |
| Australian | 30 | 0.2% |
| Basque | 13 | 0.1% |
| Bhutanese | 1,169 | 5.8% |
| Blackfeet | 9 | 0.0% |
| Brazilian | 107 | 0.5% |
| British | 416 | 2.1% |
| Bulgarian | 42 | 0.2% |
| Burmese | 3,298 | 16.4% |
| Canadian | 46 | 0.2% |
| Central American | 186 | 0.9% |
| Central American Indian | 15 | 0.1% |
| Cherokee | 66 | 0.3% |
| Chinese | 15 | 0.1% |
| Colombian | 65 | 0.3% |
| Croatian | 67 | 0.3% |
| Cuban | 49 | 0.2% |
| Czech | 49 | 0.2% |
| Czechoslovakian | 19 | 0.1% |
| Danish | 59 | 0.3% |
| Dutch | 77 | 0.4% |
| Eastern European | 171 | 0.9% |
| Ecuadorian | 63 | 0.3% |
| Egyptian | 96 | 0.5% |
| English | 1,875 | 9.3% |
| European | 97 | 0.5% |
| Finnish | 37 | 0.2% |
| French | 216 | 1.1% |
| French Canadian | 59 | 0.3% |
| German | 1,857 | 9.2% |
| Greek | 33 | 0.2% |
| Guatemalan | 31 | 0.2% |
| Haitian | 9 | 0.0% |
| Indian (Asian) | 674 | 3.4% |
| Iranian | 242 | 1.2% |
| Irish | 1,993 | 9.9% |
| Iroquois | 57 | 0.3% |
| Italian | 1,188 | 5.9% |
| Japanese | 37 | 0.2% |
| Kenyan | 6 | 0.0% |
| Korean | 905 | 4.5% |
| Laotian | 16 | 0.1% |
| Lebanese | 64 | 0.3% |
| Lithuanian | 35 | 0.2% |
| Mexican | 2,341 | 11.7% |
| Mexican American Indian | 75 | 0.4% |
| Nicaraguan | 114 | 0.6% |
| Northern European | 76 | 0.4% |
| Norwegian | 113 | 0.6% |
| Palestinian | 55 | 0.3% |
| Panamanian | 13 | 0.1% |
| Peruvian | 98 | 0.5% |
| Polish | 324 | 1.6% |
| Portuguese | 31 | 0.2% |
| Puerto Rican | 74 | 0.4% |
| Romanian | 265 | 1.3% |
| Russian | 120 | 0.6% |
| Salvadoran | 28 | 0.1% |
| Scandinavian | 67 | 0.3% |
| Scotch-Irish | 59 | 0.3% |
| Scottish | 336 | 1.7% |
| Slovak | 11 | 0.1% |
| Slovene | 34 | 0.2% |
| South American | 517 | 2.6% |
| Spaniard | 229 | 1.1% |
| Spanish | 8 | 0.0% |
| Sri Lankan | 115 | 0.6% |
| Subsaharan African | 17 | 0.1% |
| Swedish | 506 | 2.5% |
| Swiss | 23 | 0.1% |
| Thai | 432 | 2.1% |
| Venezuelan | 247 | 1.2% |
| Welsh | 117 | 0.6% |
| Yugoslavian | 27 | 0.1% | View All 78 Rows |
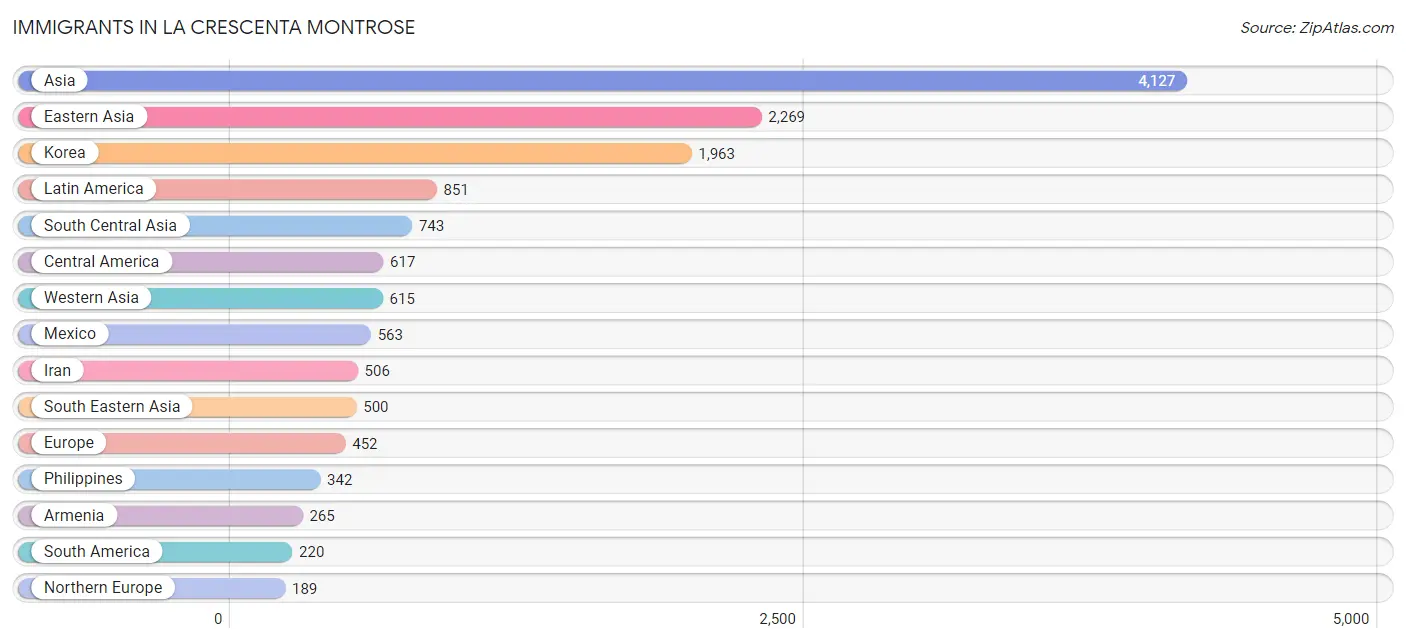
Immigrants in La Crescenta Montrose
The most numerous immigrant groups reported in La Crescenta Montrose came from Asia (4,127 | 20.5%), Eastern Asia (2,269 | 11.3%), Korea (1,963 | 9.8%), Latin America (851 | 4.2%), and South Central Asia (743 | 3.7%), together accounting for 49.5% of all La Crescenta Montrose residents.
| Immigration Origin | # Population | % Population |
| Africa | 188 | 0.9% |
| Armenia | 265 | 1.3% |
| Asia | 4,127 | 20.5% |
| Australia | 88 | 0.4% |
| Bangladesh | 133 | 0.7% |
| Brazil | 64 | 0.3% |
| Bulgaria | 29 | 0.1% |
| Cambodia | 15 | 0.1% |
| Canada | 125 | 0.6% |
| Caribbean | 14 | 0.1% |
| Central America | 617 | 3.1% |
| China | 154 | 0.8% |
| Colombia | 8 | 0.0% |
| Cuba | 14 | 0.1% |
| Eastern Africa | 35 | 0.2% |
| Eastern Asia | 2,269 | 11.3% |
| Eastern Europe | 170 | 0.9% |
| Ecuador | 55 | 0.3% |
| Egypt | 106 | 0.5% |
| El Salvador | 13 | 0.1% |
| England | 24 | 0.1% |
| Europe | 452 | 2.2% |
| France | 24 | 0.1% |
| Germany | 21 | 0.1% |
| Guatemala | 15 | 0.1% |
| Hong Kong | 13 | 0.1% |
| India | 104 | 0.5% |
| Indonesia | 16 | 0.1% |
| Iran | 506 | 2.5% |
| Iraq | 46 | 0.2% |
| Israel | 66 | 0.3% |
| Italy | 8 | 0.0% |
| Japan | 152 | 0.8% |
| Kenya | 35 | 0.2% |
| Korea | 1,963 | 9.8% |
| Kuwait | 24 | 0.1% |
| Latin America | 851 | 4.2% |
| Lebanon | 173 | 0.9% |
| Malaysia | 23 | 0.1% |
| Mexico | 563 | 2.8% |
| Nicaragua | 26 | 0.1% |
| Northern Africa | 106 | 0.5% |
| Northern Europe | 189 | 0.9% |
| Oceania | 88 | 0.4% |
| Peru | 43 | 0.2% |
| Philippines | 342 | 1.7% |
| Romania | 116 | 0.6% |
| Russia | 25 | 0.1% |
| South America | 220 | 1.1% |
| South Central Asia | 743 | 3.7% |
| South Eastern Asia | 500 | 2.5% |
| Southern Europe | 48 | 0.2% |
| Spain | 40 | 0.2% |
| Taiwan | 6 | 0.0% |
| Turkey | 41 | 0.2% |
| Venezuela | 50 | 0.3% |
| Vietnam | 104 | 0.5% |
| Western Asia | 615 | 3.1% |
| Western Europe | 45 | 0.2% | View All 59 Rows |
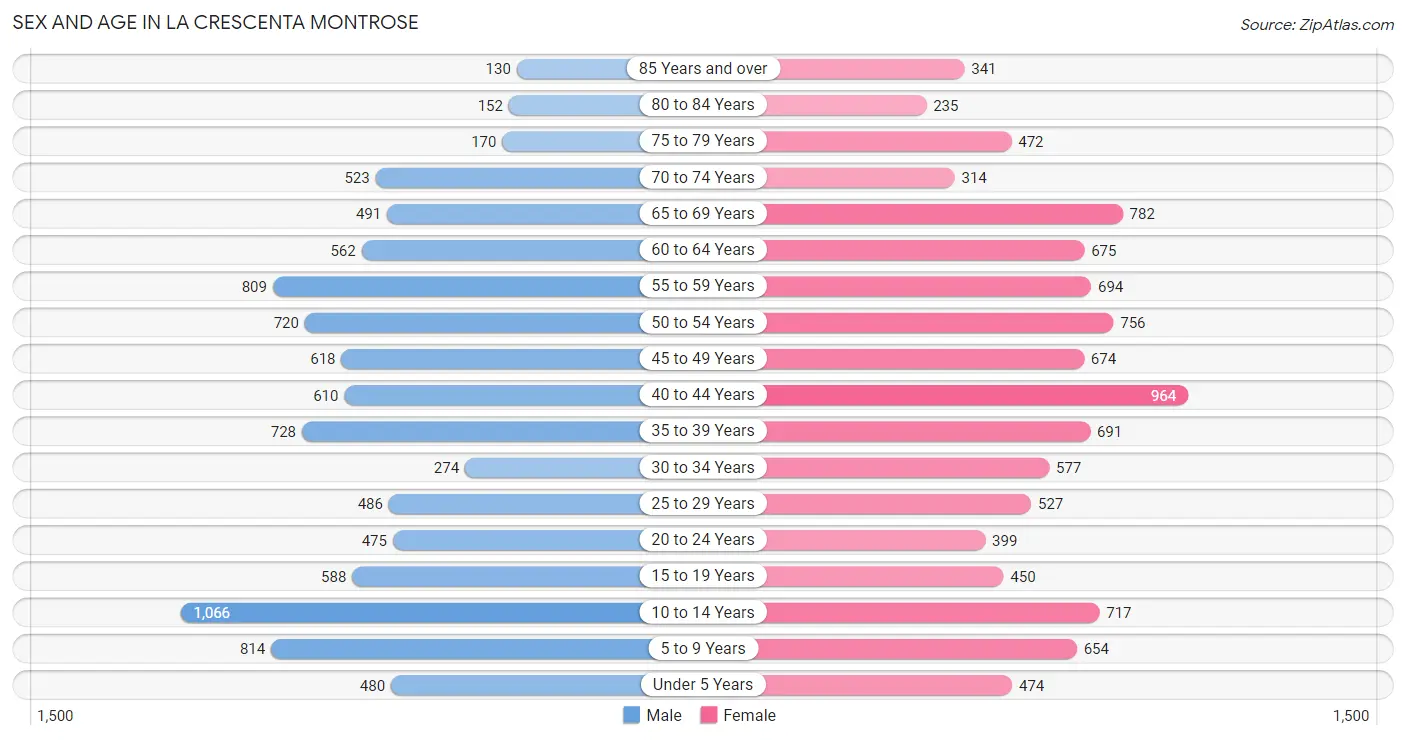
Sex and Age in La Crescenta Montrose
Sex and Age in La Crescenta Montrose
The most populous age groups in La Crescenta Montrose are 10 to 14 Years (1,066 | 11.0%) for men and 40 to 44 Years (964 | 9.3%) for women.
| Age Bracket | Male | Female |
| Under 5 Years | 480 (5.0%) | 474 (4.6%) |
| 5 to 9 Years | 814 (8.4%) | 654 (6.3%) |
| 10 to 14 Years | 1,066 (11.0%) | 717 (6.9%) |
| 15 to 19 Years | 588 (6.1%) | 450 (4.3%) |
| 20 to 24 Years | 475 (4.9%) | 399 (3.8%) |
| 25 to 29 Years | 486 (5.0%) | 527 (5.1%) |
| 30 to 34 Years | 274 (2.8%) | 577 (5.6%) |
| 35 to 39 Years | 728 (7.5%) | 691 (6.7%) |
| 40 to 44 Years | 610 (6.3%) | 964 (9.3%) |
| 45 to 49 Years | 618 (6.4%) | 674 (6.5%) |
| 50 to 54 Years | 720 (7.4%) | 756 (7.3%) |
| 55 to 59 Years | 809 (8.3%) | 694 (6.7%) |
| 60 to 64 Years | 562 (5.8%) | 675 (6.5%) |
| 65 to 69 Years | 491 (5.1%) | 782 (7.5%) |
| 70 to 74 Years | 523 (5.4%) | 314 (3.0%) |
| 75 to 79 Years | 170 (1.8%) | 472 (4.5%) |
| 80 to 84 Years | 152 (1.6%) | 235 (2.3%) |
| 85 Years and over | 130 (1.3%) | 341 (3.3%) |
| Total | 9,696 (100.0%) | 10,396 (100.0%) |
Families and Households in La Crescenta Montrose
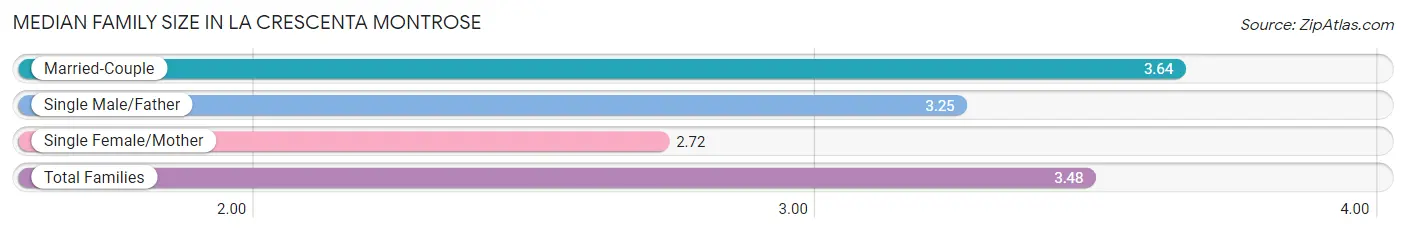
Median Family Size in La Crescenta Montrose
The median family size in La Crescenta Montrose is 3.48 persons per family, with married-couple families (4,010 | 80.7%) accounting for the largest median family size of 3.64 persons per family. On the other hand, single female/mother families (755 | 15.2%) represent the smallest median family size with 2.72 persons per family.
| Family Type | # Families | Family Size |
| Married-Couple | 4,010 (80.7%) | 3.64 |
| Single Male/Father | 205 (4.1%) | 3.25 |
| Single Female/Mother | 755 (15.2%) | 2.72 |
| Total Families | 4,970 (100.0%) | 3.48 |
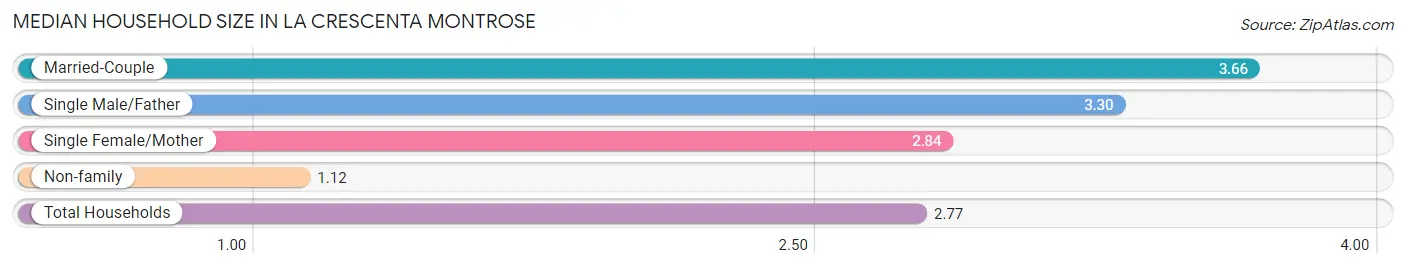
Median Household Size in La Crescenta Montrose
The median household size in La Crescenta Montrose is 2.77 persons per household, with married-couple households (4,010 | 55.2%) accounting for the largest median household size of 3.66 persons per household. non-family households (2,289 | 31.5%) represent the smallest median household size with 1.12 persons per household.
| Household Type | # Households | Household Size |
| Married-Couple | 4,010 (55.2%) | 3.66 |
| Single Male/Father | 205 (2.8%) | 3.30 |
| Single Female/Mother | 755 (10.4%) | 2.84 |
| Non-family | 2,289 (31.5%) | 1.12 |
| Total Households | 7,259 (100.0%) | 2.77 |
Household Size by Marriage Status in La Crescenta Montrose
Out of a total of 7,259 households in La Crescenta Montrose, 4,970 (68.5%) are family households, while 2,289 (31.5%) are nonfamily households. The most numerous type of family households are 2-person households, comprising 1,628, and the most common type of nonfamily households are 1-person households, comprising 2,044.
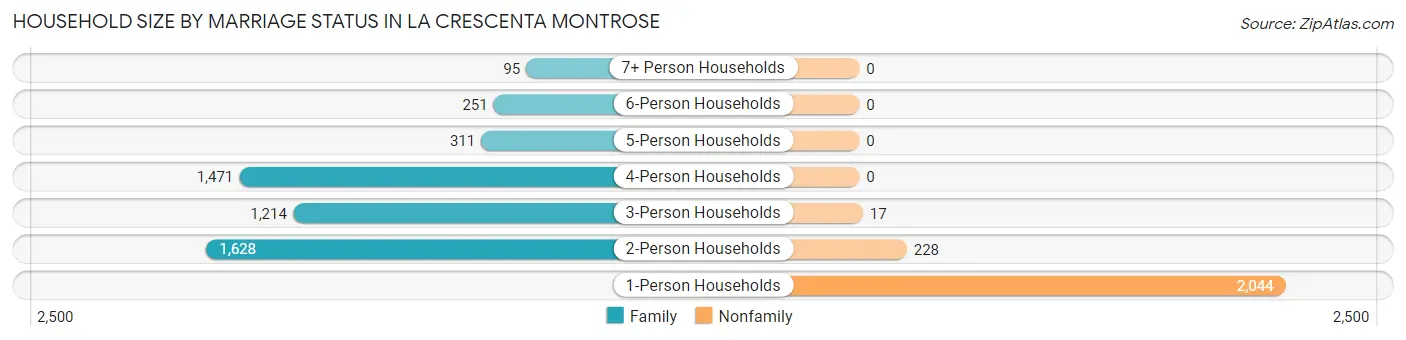
| Household Size | Family Households | Nonfamily Households |
| 1-Person Households | - | 2,044 (28.2%) |
| 2-Person Households | 1,628 (22.4%) | 228 (3.1%) |
| 3-Person Households | 1,214 (16.7%) | 17 (0.2%) |
| 4-Person Households | 1,471 (20.3%) | 0 (0.0%) |
| 5-Person Households | 311 (4.3%) | 0 (0.0%) |
| 6-Person Households | 251 (3.5%) | 0 (0.0%) |
| 7+ Person Households | 95 (1.3%) | 0 (0.0%) |
| Total | 4,970 (68.5%) | 2,289 (31.5%) |
Female Fertility in La Crescenta Montrose
Fertility by Age in La Crescenta Montrose
Average fertility rate in La Crescenta Montrose is 43.0 births per 1,000 women. Women in the age bracket of 20 to 34 years have the highest fertility rate with 55.0 births per 1,000 women. Women in the age bracket of 35 to 50 years acount for 56.8% of all women with births.
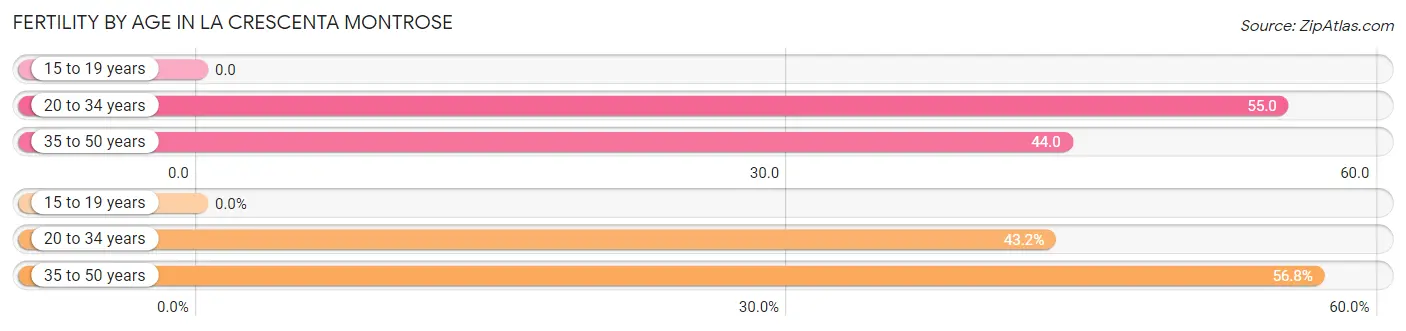
| Age Bracket | Women with Births | Births / 1,000 Women |
| 15 to 19 years | 0 (0.0%) | 0.0 |
| 20 to 34 years | 82 (43.2%) | 55.0 |
| 35 to 50 years | 108 (56.8%) | 44.0 |
| Total | 190 (100.0%) | 43.0 |
Fertility by Age by Marriage Status in La Crescenta Montrose
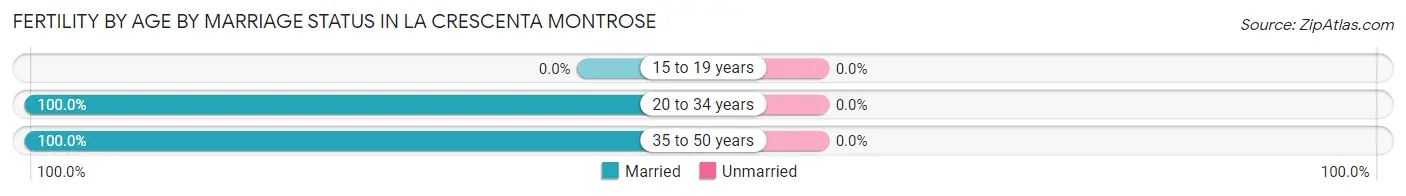
| Age Bracket | Married | Unmarried |
| 15 to 19 years | 0 (0.0%) | 0 (0.0%) |
| 20 to 34 years | 82 (100.0%) | 0 (0.0%) |
| 35 to 50 years | 108 (100.0%) | 0 (0.0%) |
| Total | 190 (100.0%) | 0 (0.0%) |
Fertility by Education in La Crescenta Montrose
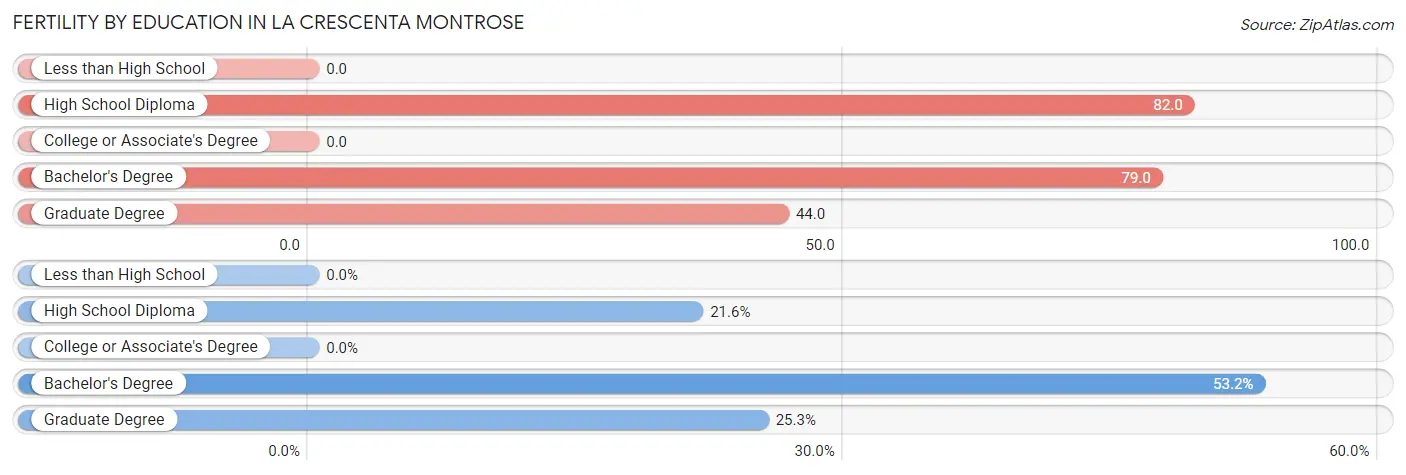
| Educational Attainment | Women with Births | Births / 1,000 Women |
| Less than High School | 0 (0.0%) | 0.0 |
| High School Diploma | 41 (21.6%) | 82.0 |
| College or Associate's Degree | 0 (0.0%) | 0.0 |
| Bachelor's Degree | 101 (53.2%) | 79.0 |
| Graduate Degree | 48 (25.3%) | 44.0 |
| Total | 190 (100.0%) | 43.0 |
Fertility by Education by Marriage Status in La Crescenta Montrose
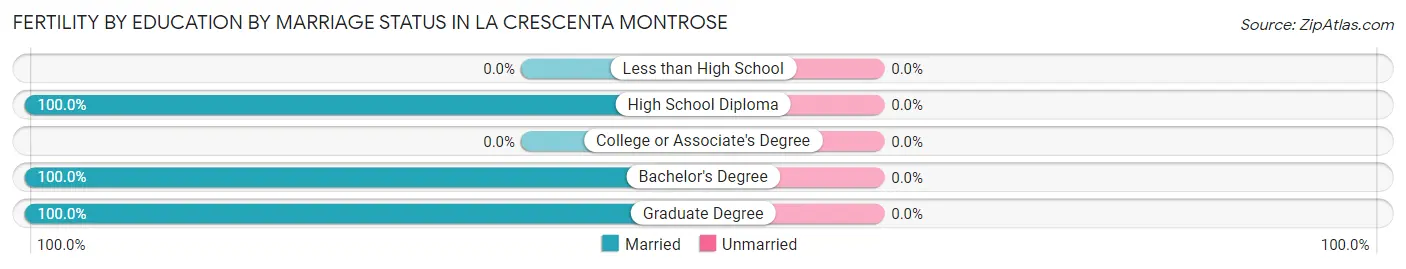
| Educational Attainment | Married | Unmarried |
| Less than High School | 0 (0.0%) | 0 (0.0%) |
| High School Diploma | 41 (100.0%) | 0 (0.0%) |
| College or Associate's Degree | 0 (0.0%) | 0 (0.0%) |
| Bachelor's Degree | 101 (100.0%) | 0 (0.0%) |
| Graduate Degree | 48 (100.0%) | 0 (0.0%) |
| Total | 190 (100.0%) | 0 (0.0%) |
Employment Characteristics in La Crescenta Montrose
Employment by Class of Employer in La Crescenta Montrose
Among the 9,267 employed individuals in La Crescenta Montrose, private company employees (5,475 | 59.1%), local government employees (996 | 10.7%), and not-for-profit organizations (844 | 9.1%) make up the most common classes of employment.
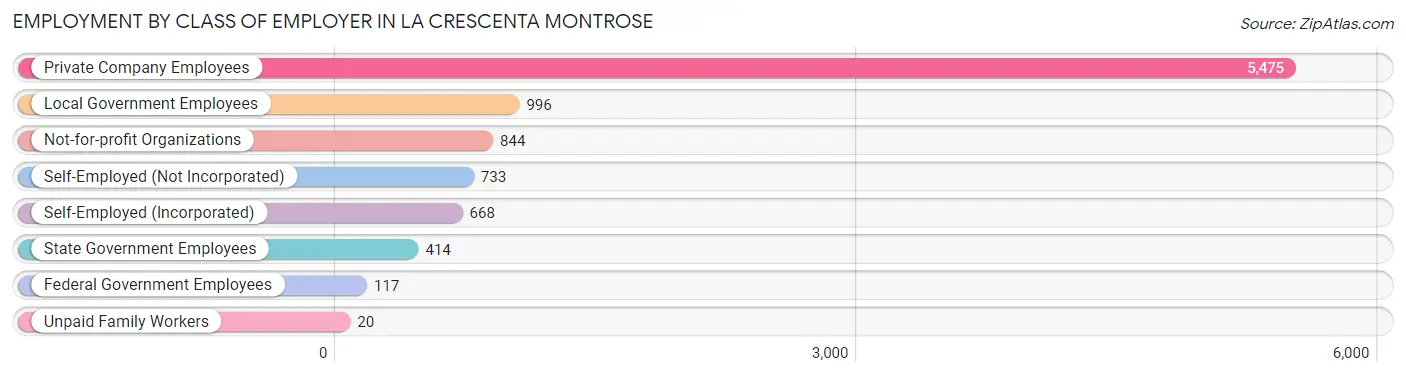
| Employer Class | # Employees | % Employees |
| Private Company Employees | 5,475 | 59.1% |
| Self-Employed (Incorporated) | 668 | 7.2% |
| Self-Employed (Not Incorporated) | 733 | 7.9% |
| Not-for-profit Organizations | 844 | 9.1% |
| Local Government Employees | 996 | 10.7% |
| State Government Employees | 414 | 4.5% |
| Federal Government Employees | 117 | 1.3% |
| Unpaid Family Workers | 20 | 0.2% |
| Total | 9,267 | 100.0% |
Employment Status by Age in La Crescenta Montrose
According to the labor force statistics for La Crescenta Montrose, out of the total population over 16 years of age (15,703), 65.2% or 10,238 individuals are in the labor force, with 7.5% or 768 of them unemployed. The age group with the highest labor force participation rate is 25 to 29 years, with 90.1% or 913 individuals in the labor force. Within the labor force, the 20 to 24 years age range has the highest percentage of unemployed individuals, with 15.0% or 79 of them being unemployed.
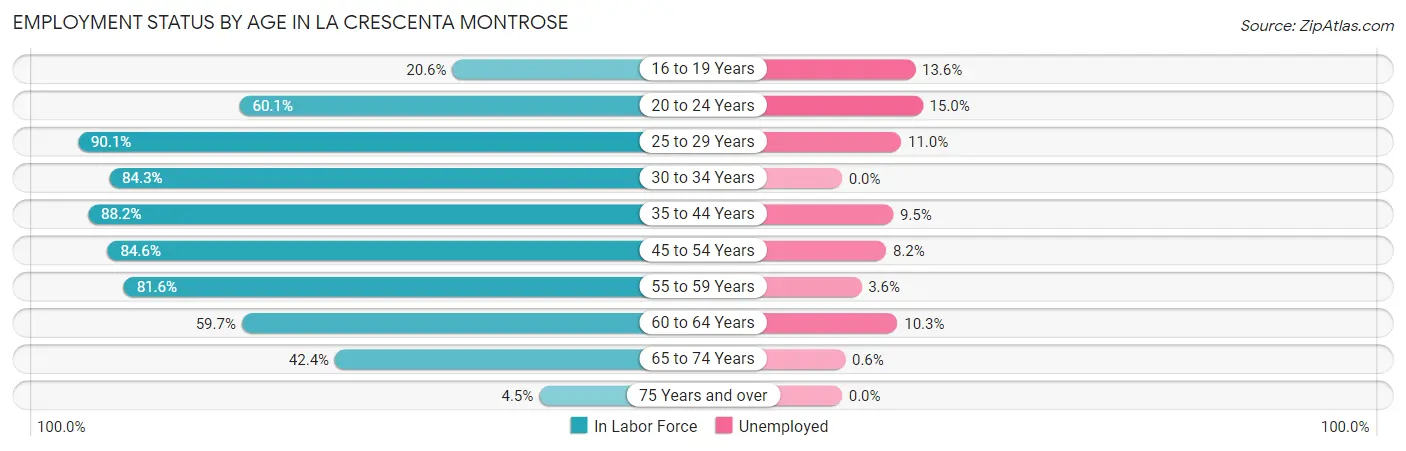
| Age Bracket | In Labor Force | Unemployed |
| 16 to 19 Years | 176 (20.6%) | 24 (13.6%) |
| 20 to 24 Years | 525 (60.1%) | 79 (15.0%) |
| 25 to 29 Years | 913 (90.1%) | 100 (11.0%) |
| 30 to 34 Years | 717 (84.3%) | 0 (0.0%) |
| 35 to 44 Years | 2,640 (88.2%) | 251 (9.5%) |
| 45 to 54 Years | 2,342 (84.6%) | 192 (8.2%) |
| 55 to 59 Years | 1,226 (81.6%) | 44 (3.6%) |
| 60 to 64 Years | 738 (59.7%) | 76 (10.3%) |
| 65 to 74 Years | 895 (42.4%) | 5 (0.6%) |
| 75 Years and over | 68 (4.5%) | 0 (0.0%) |
| Total | 10,238 (65.2%) | 768 (7.5%) |
Employment Status by Educational Attainment in La Crescenta Montrose
According to labor force statistics for La Crescenta Montrose, 82.7% of individuals (8,572) out of the total population between 25 and 64 years of age (10,365) are in the labor force, with 7.7% or 660 of them being unemployed. The group with the highest labor force participation rate are those with the educational attainment of bachelor's degree or higher, with 87.2% or 5,246 individuals in the labor force. Within the labor force, individuals with high school diploma education have the highest percentage of unemployment, with 8.1% or 86 of them being unemployed.
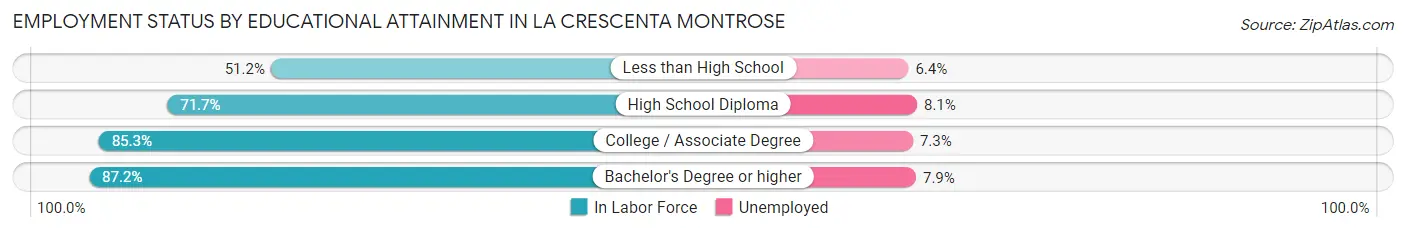
| Educational Attainment | In Labor Force | Unemployed |
| Less than High School | 267 (51.2%) | 33 (6.4%) |
| High School Diploma | 1,060 (71.7%) | 120 (8.1%) |
| College / Associate Degree | 2,004 (85.3%) | 171 (7.3%) |
| Bachelor's Degree or higher | 5,246 (87.2%) | 475 (7.9%) |
| Total | 8,572 (82.7%) | 798 (7.7%) |
Employment Occupations by Sex in La Crescenta Montrose
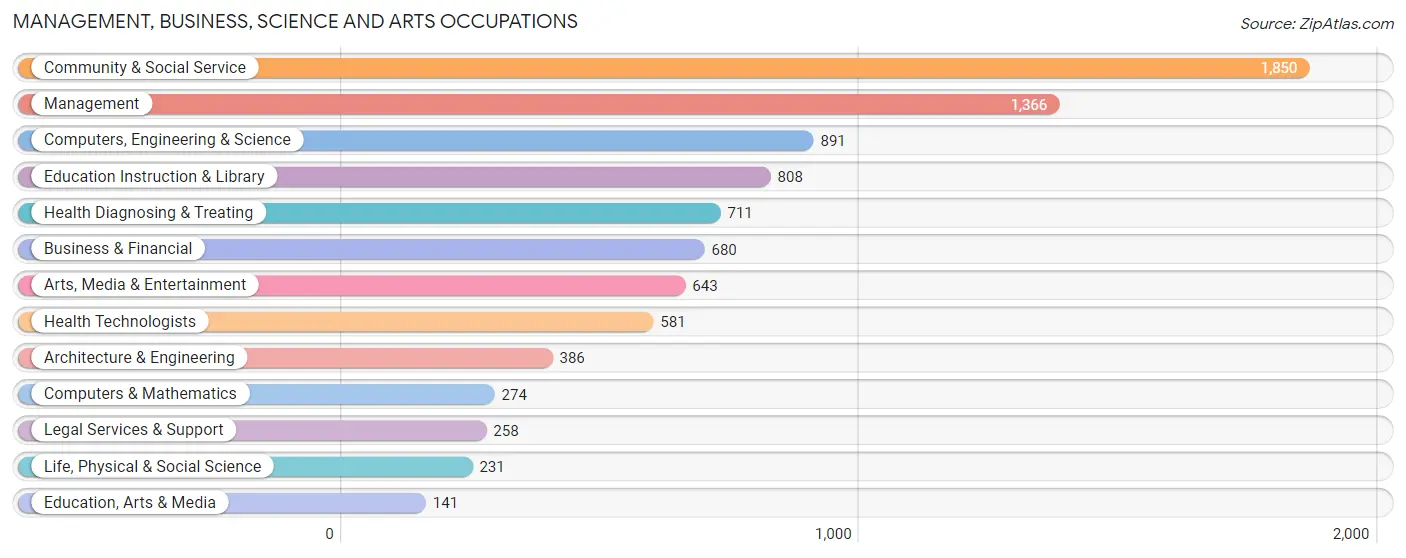
Management, Business, Science and Arts Occupations
The most common Management, Business, Science and Arts occupations in La Crescenta Montrose are Community & Social Service (1,850 | 19.5%), Management (1,366 | 14.4%), Computers, Engineering & Science (891 | 9.4%), Education Instruction & Library (808 | 8.5%), and Health Diagnosing & Treating (711 | 7.5%).
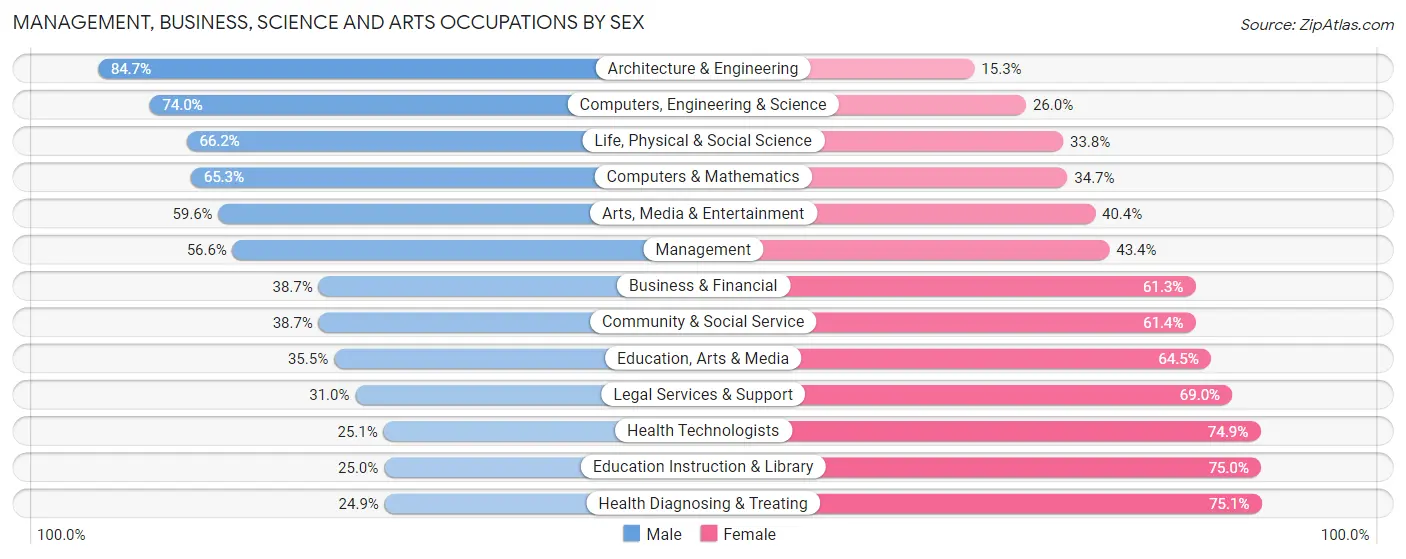
Management, Business, Science and Arts Occupations by Sex
Within the Management, Business, Science and Arts occupations in La Crescenta Montrose, the most male-oriented occupations are Architecture & Engineering (84.7%), Computers, Engineering & Science (74.0%), and Life, Physical & Social Science (66.2%), while the most female-oriented occupations are Health Diagnosing & Treating (75.1%), Education Instruction & Library (75.0%), and Health Technologists (74.9%).
| Occupation | Male | Female |
| Management | 773 (56.6%) | 593 (43.4%) |
| Business & Financial | 263 (38.7%) | 417 (61.3%) |
| Computers, Engineering & Science | 659 (74.0%) | 232 (26.0%) |
| Computers & Mathematics | 179 (65.3%) | 95 (34.7%) |
| Architecture & Engineering | 327 (84.7%) | 59 (15.3%) |
| Life, Physical & Social Science | 153 (66.2%) | 78 (33.8%) |
| Community & Social Service | 715 (38.7%) | 1,135 (61.4%) |
| Education, Arts & Media | 50 (35.5%) | 91 (64.5%) |
| Legal Services & Support | 80 (31.0%) | 178 (69.0%) |
| Education Instruction & Library | 202 (25.0%) | 606 (75.0%) |
| Arts, Media & Entertainment | 383 (59.6%) | 260 (40.4%) |
| Health Diagnosing & Treating | 177 (24.9%) | 534 (75.1%) |
| Health Technologists | 146 (25.1%) | 435 (74.9%) |
| Total (Category) | 2,587 (47.0%) | 2,911 (52.9%) |
| Total (Overall) | 4,558 (48.1%) | 4,910 (51.9%) |
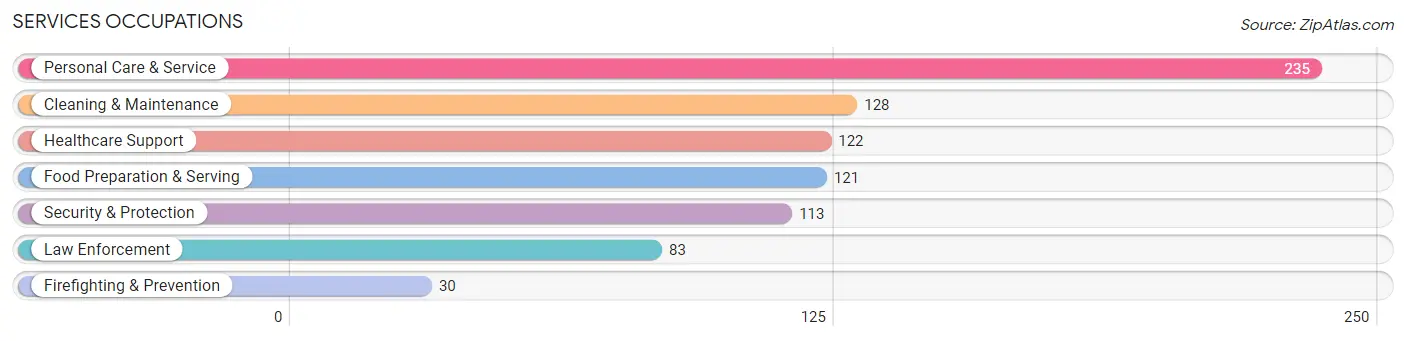
Services Occupations
The most common Services occupations in La Crescenta Montrose are Personal Care & Service (235 | 2.5%), Cleaning & Maintenance (128 | 1.3%), Healthcare Support (122 | 1.3%), Food Preparation & Serving (121 | 1.3%), and Security & Protection (113 | 1.2%).
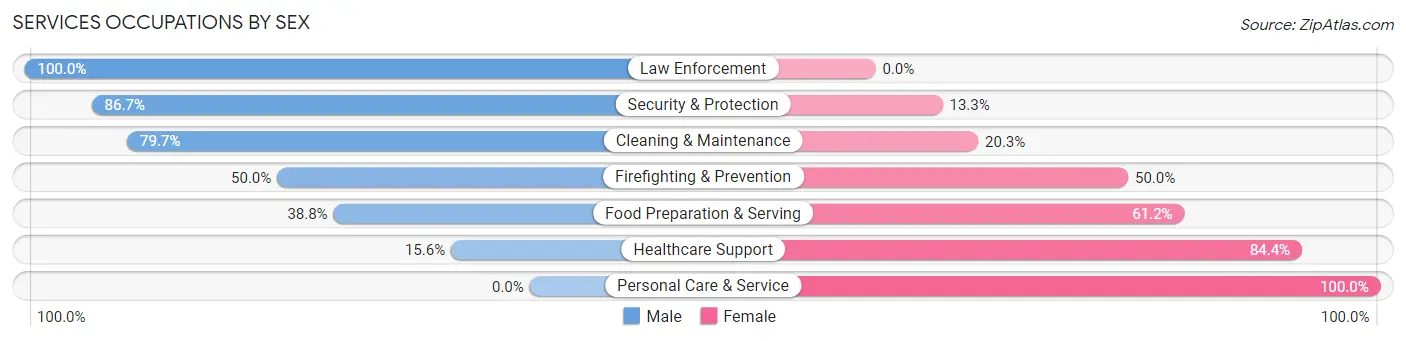
Services Occupations by Sex
Within the Services occupations in La Crescenta Montrose, the most male-oriented occupations are Law Enforcement (100.0%), Security & Protection (86.7%), and Cleaning & Maintenance (79.7%), while the most female-oriented occupations are Personal Care & Service (100.0%), Healthcare Support (84.4%), and Food Preparation & Serving (61.2%).
| Occupation | Male | Female |
| Healthcare Support | 19 (15.6%) | 103 (84.4%) |
| Security & Protection | 98 (86.7%) | 15 (13.3%) |
| Firefighting & Prevention | 15 (50.0%) | 15 (50.0%) |
| Law Enforcement | 83 (100.0%) | 0 (0.0%) |
| Food Preparation & Serving | 47 (38.8%) | 74 (61.2%) |
| Cleaning & Maintenance | 102 (79.7%) | 26 (20.3%) |
| Personal Care & Service | 0 (0.0%) | 235 (100.0%) |
| Total (Category) | 266 (37.0%) | 453 (63.0%) |
| Total (Overall) | 4,558 (48.1%) | 4,910 (51.9%) |
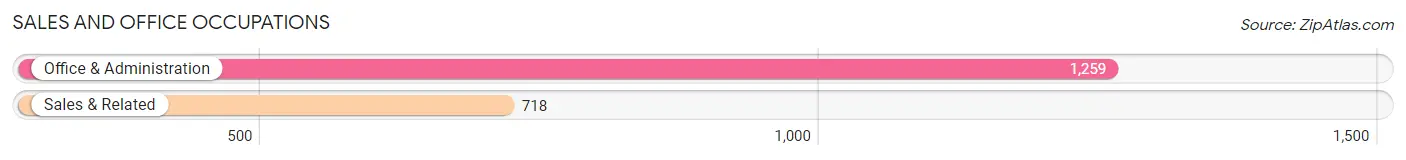
Sales and Office Occupations
The most common Sales and Office occupations in La Crescenta Montrose are Office & Administration (1,259 | 13.3%), and Sales & Related (718 | 7.6%).
Sales and Office Occupations by Sex
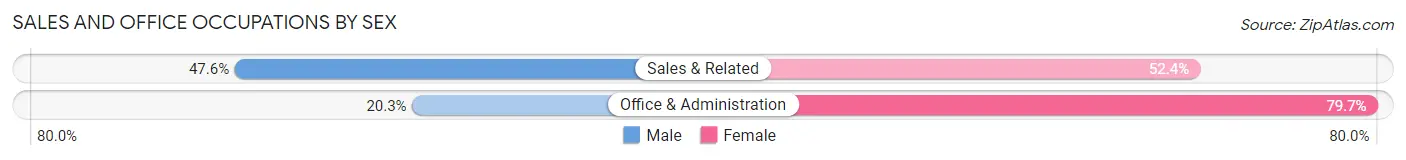
| Occupation | Male | Female |
| Sales & Related | 342 (47.6%) | 376 (52.4%) |
| Office & Administration | 256 (20.3%) | 1,003 (79.7%) |
| Total (Category) | 598 (30.2%) | 1,379 (69.8%) |
| Total (Overall) | 4,558 (48.1%) | 4,910 (51.9%) |
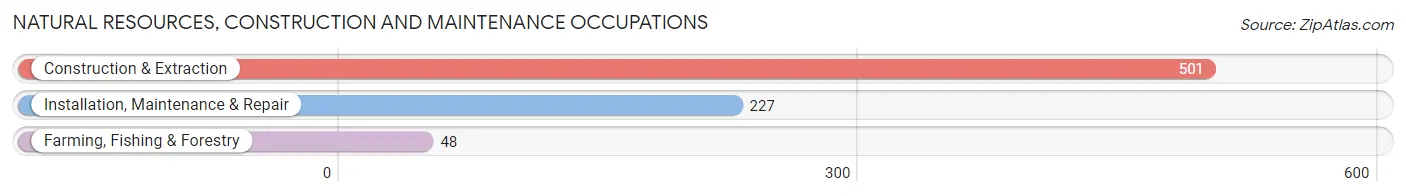
Natural Resources, Construction and Maintenance Occupations
The most common Natural Resources, Construction and Maintenance occupations in La Crescenta Montrose are Construction & Extraction (501 | 5.3%), Installation, Maintenance & Repair (227 | 2.4%), and Farming, Fishing & Forestry (48 | 0.5%).
Natural Resources, Construction and Maintenance Occupations by Sex
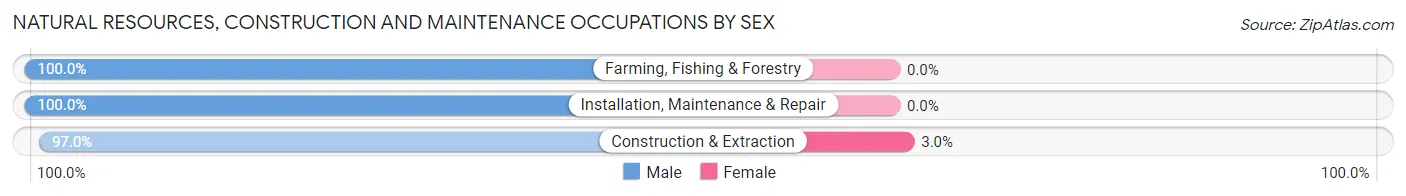
| Occupation | Male | Female |
| Farming, Fishing & Forestry | 48 (100.0%) | 0 (0.0%) |
| Construction & Extraction | 486 (97.0%) | 15 (3.0%) |
| Installation, Maintenance & Repair | 227 (100.0%) | 0 (0.0%) |
| Total (Category) | 761 (98.1%) | 15 (1.9%) |
| Total (Overall) | 4,558 (48.1%) | 4,910 (51.9%) |
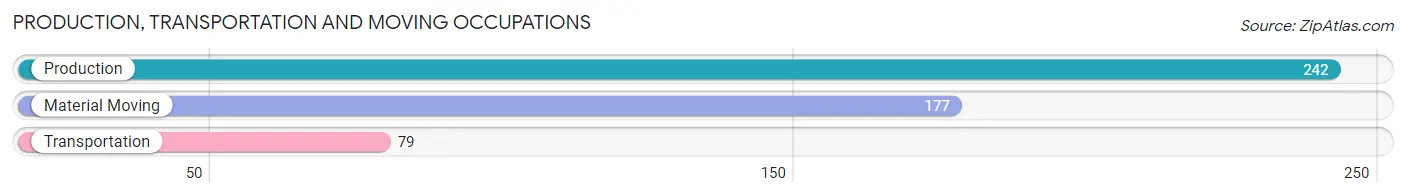
Production, Transportation and Moving Occupations
The most common Production, Transportation and Moving occupations in La Crescenta Montrose are Production (242 | 2.6%), Material Moving (177 | 1.9%), and Transportation (79 | 0.8%).
Production, Transportation and Moving Occupations by Sex
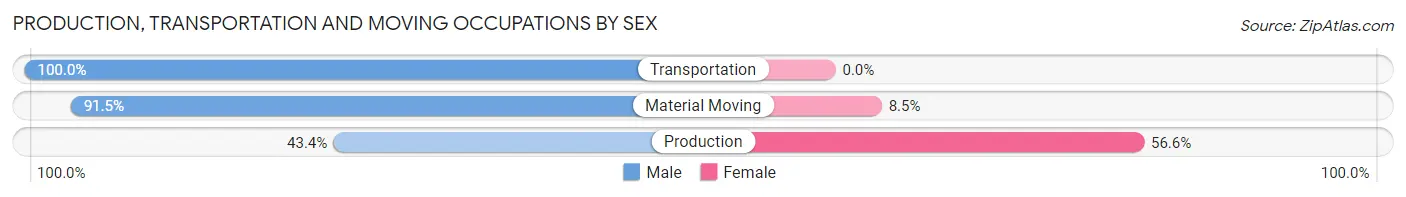
| Occupation | Male | Female |
| Production | 105 (43.4%) | 137 (56.6%) |
| Transportation | 79 (100.0%) | 0 (0.0%) |
| Material Moving | 162 (91.5%) | 15 (8.5%) |
| Total (Category) | 346 (69.5%) | 152 (30.5%) |
| Total (Overall) | 4,558 (48.1%) | 4,910 (51.9%) |
Employment Industries by Sex in La Crescenta Montrose
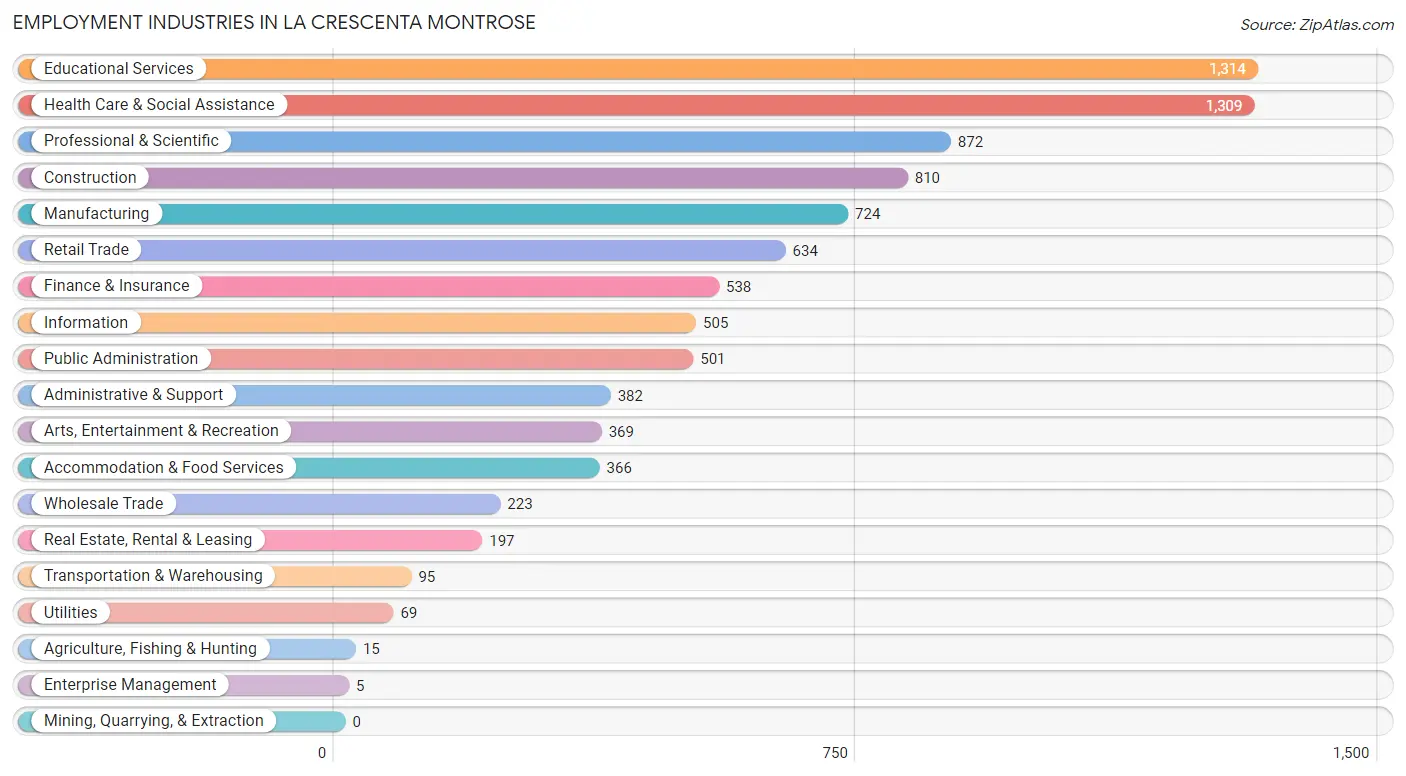
Employment Industries in La Crescenta Montrose
The major employment industries in La Crescenta Montrose include Educational Services (1,314 | 13.9%), Health Care & Social Assistance (1,309 | 13.8%), Professional & Scientific (872 | 9.2%), Construction (810 | 8.6%), and Manufacturing (724 | 7.6%).
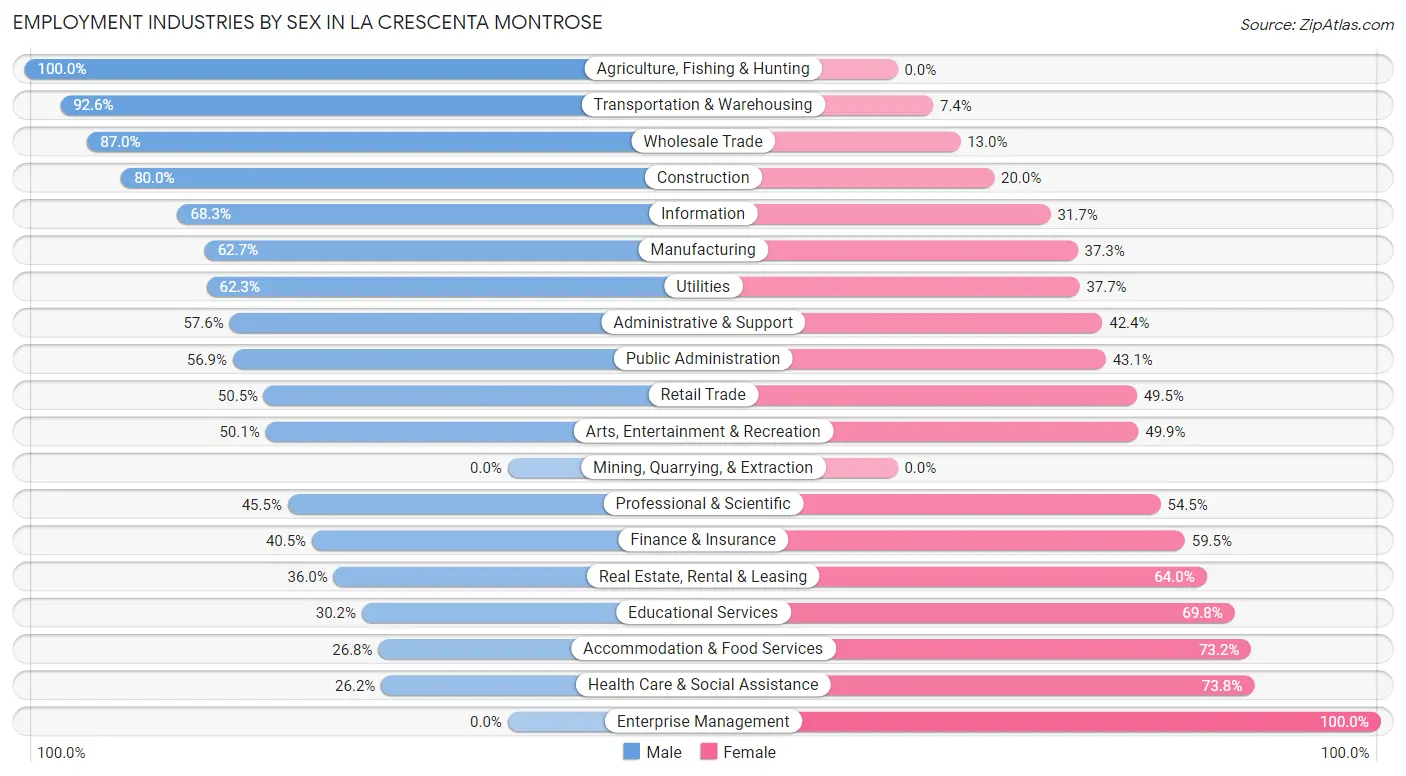
Employment Industries by Sex in La Crescenta Montrose
The La Crescenta Montrose industries that see more men than women are Agriculture, Fishing & Hunting (100.0%), Transportation & Warehousing (92.6%), and Wholesale Trade (87.0%), whereas the industries that tend to have a higher number of women are Enterprise Management (100.0%), Health Care & Social Assistance (73.8%), and Accommodation & Food Services (73.2%).
| Industry | Male | Female |
| Agriculture, Fishing & Hunting | 15 (100.0%) | 0 (0.0%) |
| Mining, Quarrying, & Extraction | 0 (0.0%) | 0 (0.0%) |
| Construction | 648 (80.0%) | 162 (20.0%) |
| Manufacturing | 454 (62.7%) | 270 (37.3%) |
| Wholesale Trade | 194 (87.0%) | 29 (13.0%) |
| Retail Trade | 320 (50.5%) | 314 (49.5%) |
| Transportation & Warehousing | 88 (92.6%) | 7 (7.4%) |
| Utilities | 43 (62.3%) | 26 (37.7%) |
| Information | 345 (68.3%) | 160 (31.7%) |
| Finance & Insurance | 218 (40.5%) | 320 (59.5%) |
| Real Estate, Rental & Leasing | 71 (36.0%) | 126 (64.0%) |
| Professional & Scientific | 397 (45.5%) | 475 (54.5%) |
| Enterprise Management | 0 (0.0%) | 5 (100.0%) |
| Administrative & Support | 220 (57.6%) | 162 (42.4%) |
| Educational Services | 397 (30.2%) | 917 (69.8%) |
| Health Care & Social Assistance | 343 (26.2%) | 966 (73.8%) |
| Arts, Entertainment & Recreation | 185 (50.1%) | 184 (49.9%) |
| Accommodation & Food Services | 98 (26.8%) | 268 (73.2%) |
| Public Administration | 285 (56.9%) | 216 (43.1%) |
| Total | 4,558 (48.1%) | 4,910 (51.9%) |
Education in La Crescenta Montrose
School Enrollment in La Crescenta Montrose
The most common levels of schooling among the 5,645 students in La Crescenta Montrose are middle school (1,250 | 22.1%), high school (1,138 | 20.2%), and elementary school (1,121 | 19.9%).
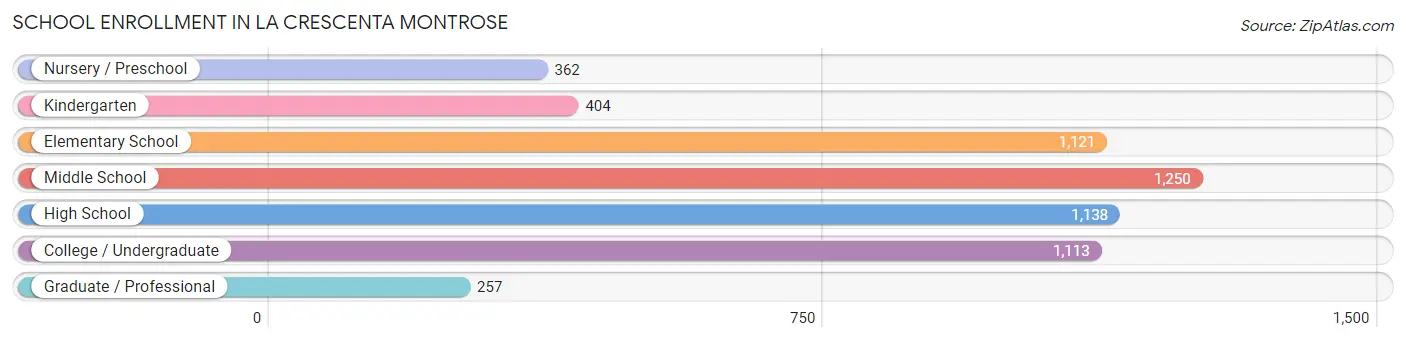
| School Level | # Students | % Students |
| Nursery / Preschool | 362 | 6.4% |
| Kindergarten | 404 | 7.2% |
| Elementary School | 1,121 | 19.9% |
| Middle School | 1,250 | 22.1% |
| High School | 1,138 | 20.2% |
| College / Undergraduate | 1,113 | 19.7% |
| Graduate / Professional | 257 | 4.5% |
| Total | 5,645 | 100.0% |
School Enrollment by Age by Funding Source in La Crescenta Montrose
Out of a total of 5,645 students who are enrolled in schools in La Crescenta Montrose, 739 (13.1%) attend a private institution, while the remaining 4,906 (86.9%) are enrolled in public schools. The age group of 3 to 4 year olds has the highest likelihood of being enrolled in private schools, with 239 (75.6% in the age bracket) enrolled. Conversely, the age group of 10 to 14 year olds has the lowest likelihood of being enrolled in a private school, with 1,713 (96.7% in the age bracket) attending a public institution.
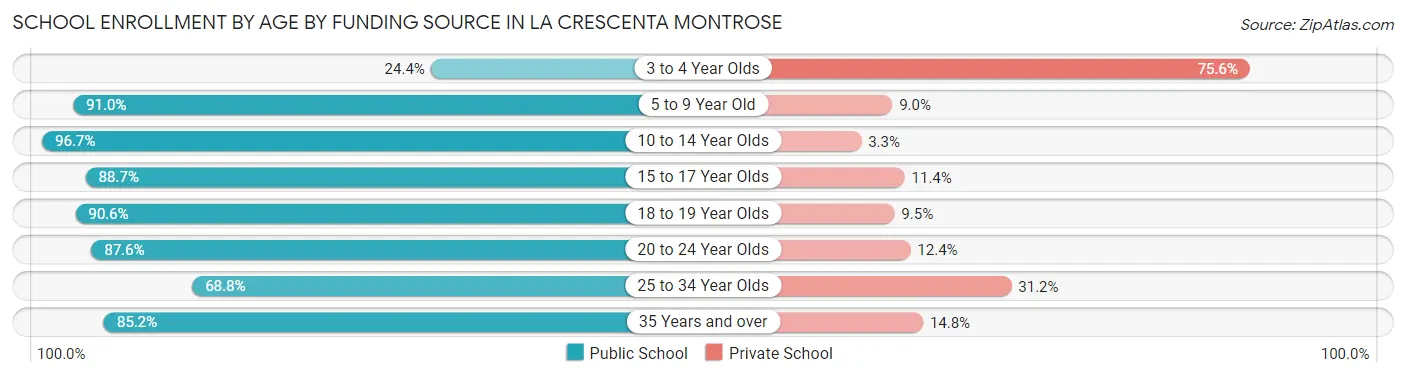
| Age Bracket | Public School | Private School |
| 3 to 4 Year Olds | 77 (24.4%) | 239 (75.6%) |
| 5 to 9 Year Old | 1,237 (91.0%) | 123 (9.0%) |
| 10 to 14 Year Olds | 1,713 (96.7%) | 58 (3.3%) |
| 15 to 17 Year Olds | 625 (88.6%) | 80 (11.4%) |
| 18 to 19 Year Olds | 249 (90.5%) | 26 (9.5%) |
| 20 to 24 Year Olds | 493 (87.6%) | 70 (12.4%) |
| 25 to 34 Year Olds | 185 (68.8%) | 84 (31.2%) |
| 35 Years and over | 329 (85.2%) | 57 (14.8%) |
| Total | 4,906 (86.9%) | 739 (13.1%) |
Educational Attainment by Field of Study in La Crescenta Montrose
Business (1,209 | 15.4%), engineering (920 | 11.7%), social sciences (821 | 10.4%), science & technology (738 | 9.4%), and visual & performing arts (682 | 8.7%) are the most common fields of study among 7,857 individuals in La Crescenta Montrose who have obtained a bachelor's degree or higher.
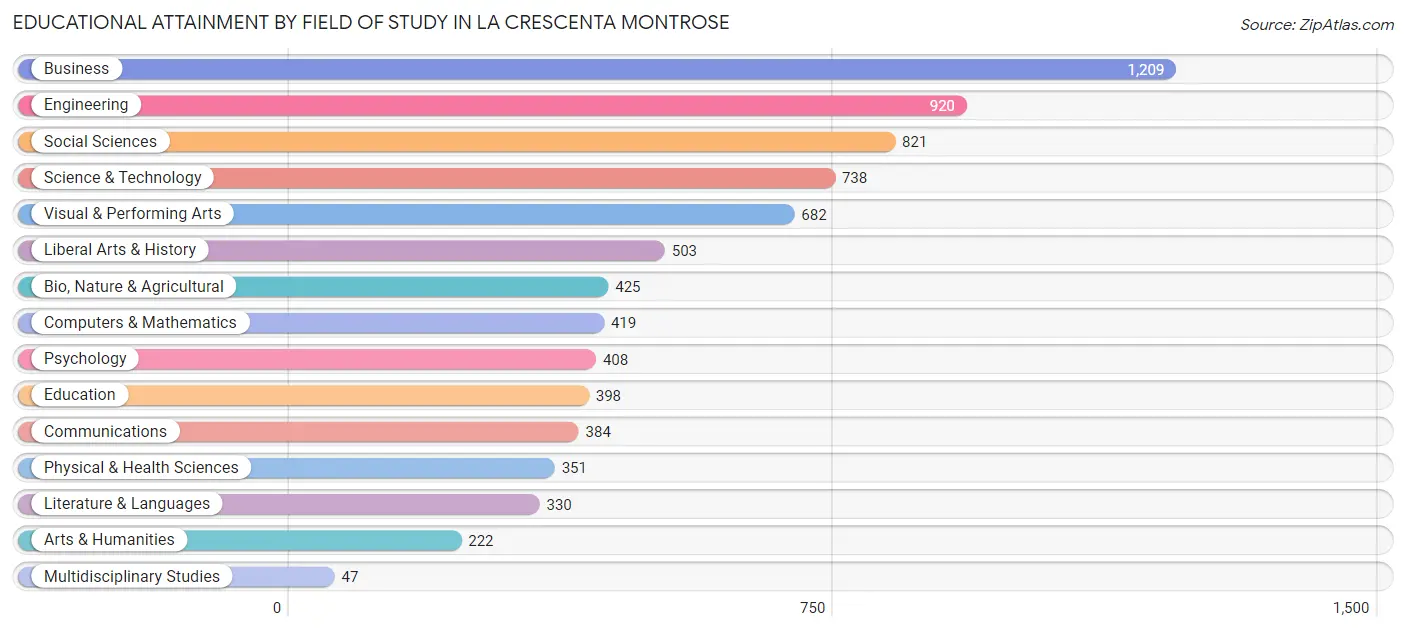
| Field of Study | # Graduates | % Graduates |
| Computers & Mathematics | 419 | 5.3% |
| Bio, Nature & Agricultural | 425 | 5.4% |
| Physical & Health Sciences | 351 | 4.5% |
| Psychology | 408 | 5.2% |
| Social Sciences | 821 | 10.4% |
| Engineering | 920 | 11.7% |
| Multidisciplinary Studies | 47 | 0.6% |
| Science & Technology | 738 | 9.4% |
| Business | 1,209 | 15.4% |
| Education | 398 | 5.1% |
| Literature & Languages | 330 | 4.2% |
| Liberal Arts & History | 503 | 6.4% |
| Visual & Performing Arts | 682 | 8.7% |
| Communications | 384 | 4.9% |
| Arts & Humanities | 222 | 2.8% |
| Total | 7,857 | 100.0% |
Transportation & Commute in La Crescenta Montrose
Vehicle Availability by Sex in La Crescenta Montrose
The most prevalent vehicle ownership categories in La Crescenta Montrose are males with 2 vehicles (1,766, accounting for 39.6%) and females with 2 vehicles (1,842, making up 36.8%).
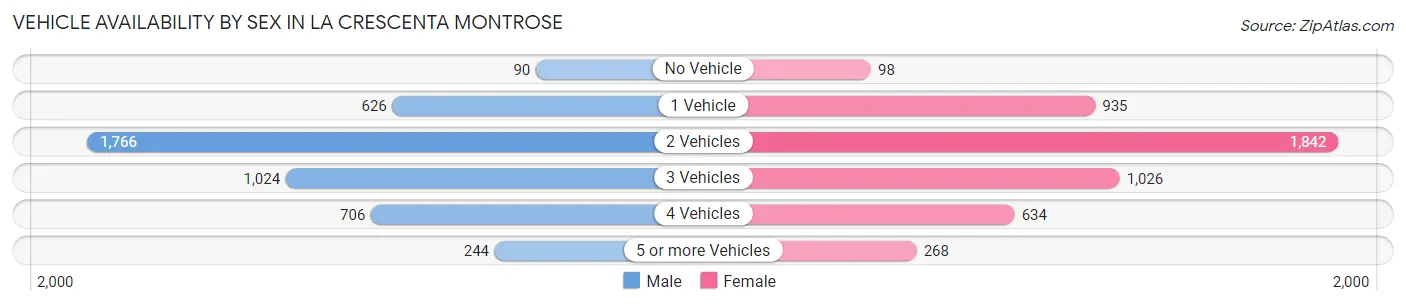
| Vehicles Available | Male | Female |
| No Vehicle | 90 (2.0%) | 98 (2.0%) |
| 1 Vehicle | 626 (14.1%) | 935 (19.5%) |
| 2 Vehicles | 1,766 (39.6%) | 1,842 (38.4%) |
| 3 Vehicles | 1,024 (23.0%) | 1,026 (21.4%) |
| 4 Vehicles | 706 (15.8%) | 634 (13.2%) |
| 5 or more Vehicles | 244 (5.5%) | 268 (5.6%) |
| Total | 4,456 (100.0%) | 4,803 (100.0%) |
Commute Time in La Crescenta Montrose
The most frequently occuring commute durations in La Crescenta Montrose are 30 to 34 minutes (1,544 commuters, 19.7%), 20 to 24 minutes (1,150 commuters, 14.7%), and 45 to 59 minutes (1,006 commuters, 12.8%).
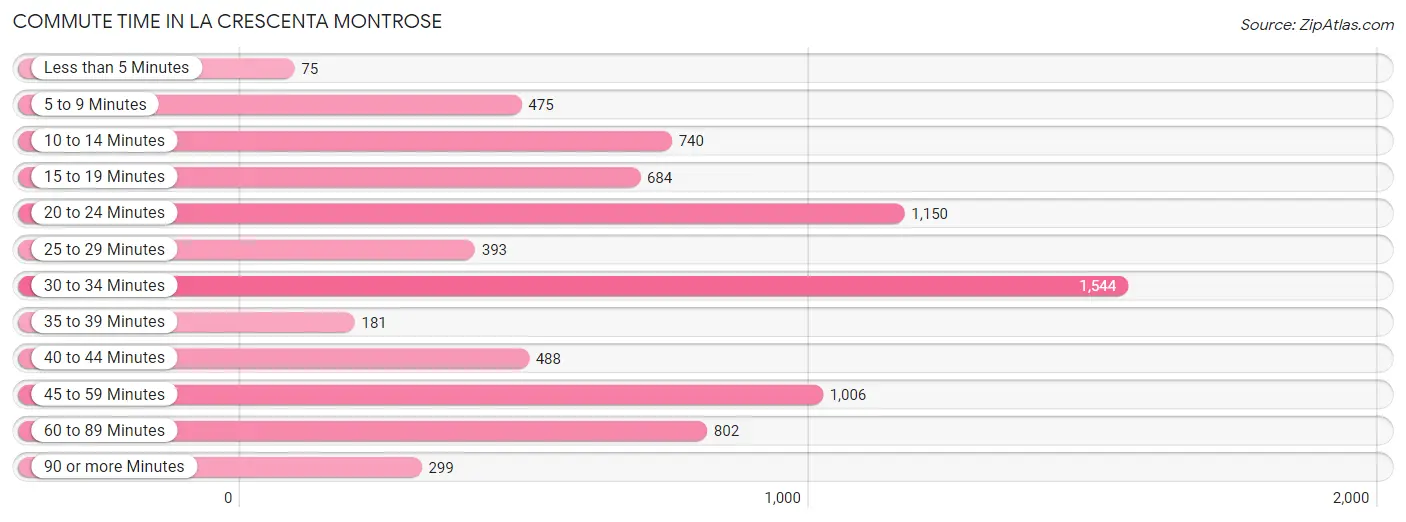
| Commute Time | # Commuters | % Commuters |
| Less than 5 Minutes | 75 | 1.0% |
| 5 to 9 Minutes | 475 | 6.1% |
| 10 to 14 Minutes | 740 | 9.4% |
| 15 to 19 Minutes | 684 | 8.7% |
| 20 to 24 Minutes | 1,150 | 14.7% |
| 25 to 29 Minutes | 393 | 5.0% |
| 30 to 34 Minutes | 1,544 | 19.7% |
| 35 to 39 Minutes | 181 | 2.3% |
| 40 to 44 Minutes | 488 | 6.2% |
| 45 to 59 Minutes | 1,006 | 12.8% |
| 60 to 89 Minutes | 802 | 10.2% |
| 90 or more Minutes | 299 | 3.8% |
Commute Time by Sex in La Crescenta Montrose
The most common commute times in La Crescenta Montrose are 30 to 34 minutes (954 commuters, 24.2%) for males and 30 to 34 minutes (590 commuters, 15.1%) for females.
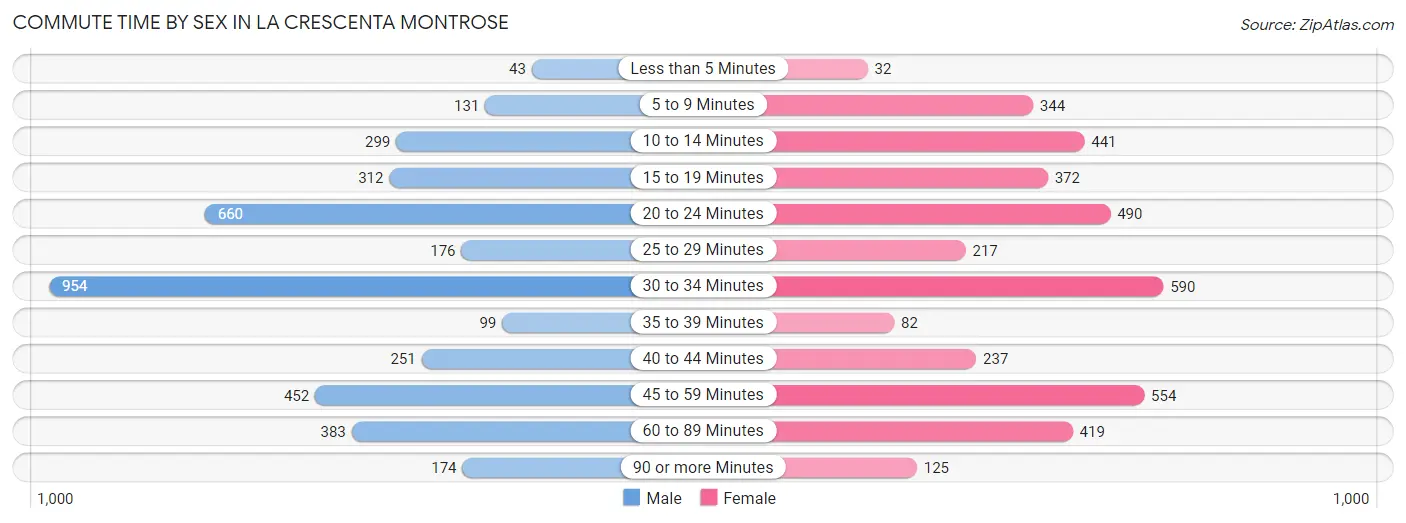
| Commute Time | Male | Female |
| Less than 5 Minutes | 43 (1.1%) | 32 (0.8%) |
| 5 to 9 Minutes | 131 (3.3%) | 344 (8.8%) |
| 10 to 14 Minutes | 299 (7.6%) | 441 (11.3%) |
| 15 to 19 Minutes | 312 (7.9%) | 372 (9.5%) |
| 20 to 24 Minutes | 660 (16.8%) | 490 (12.6%) |
| 25 to 29 Minutes | 176 (4.5%) | 217 (5.6%) |
| 30 to 34 Minutes | 954 (24.2%) | 590 (15.1%) |
| 35 to 39 Minutes | 99 (2.5%) | 82 (2.1%) |
| 40 to 44 Minutes | 251 (6.4%) | 237 (6.1%) |
| 45 to 59 Minutes | 452 (11.5%) | 554 (14.2%) |
| 60 to 89 Minutes | 383 (9.7%) | 419 (10.7%) |
| 90 or more Minutes | 174 (4.4%) | 125 (3.2%) |
Time of Departure to Work by Sex in La Crescenta Montrose
The most frequent times of departure to work in La Crescenta Montrose are 8:00 AM to 8:29 AM (603, 15.3%) for males and 8:00 AM to 8:29 AM (819, 21.0%) for females.
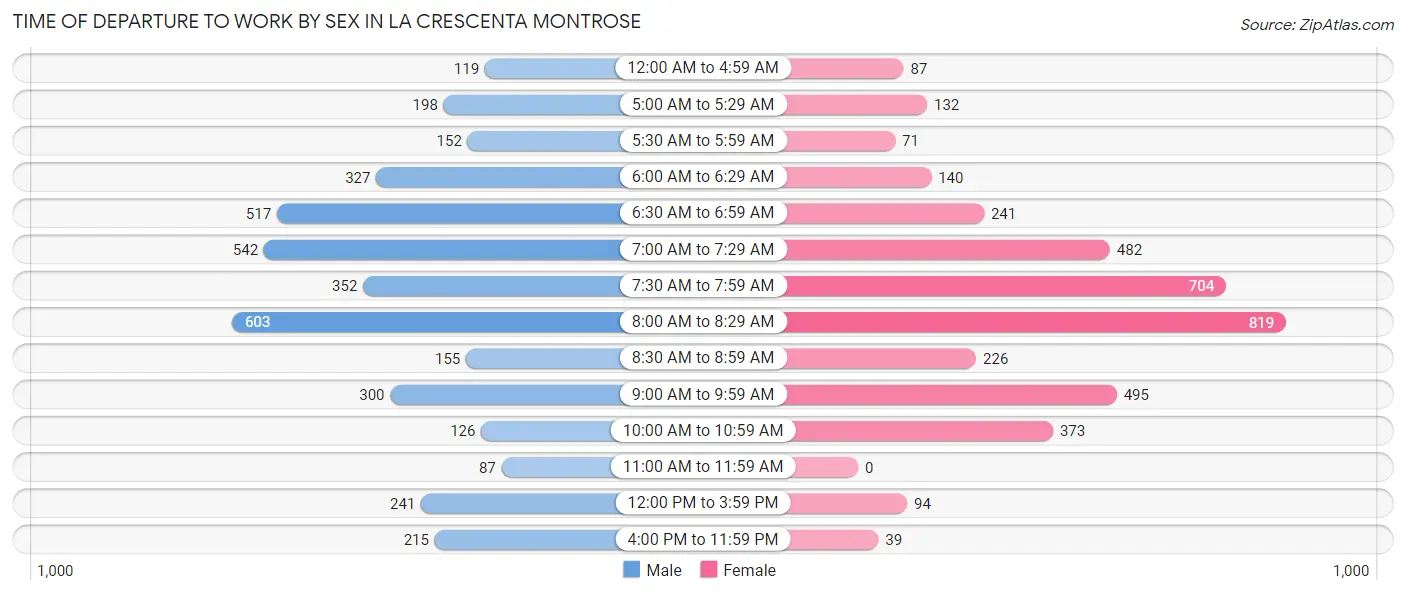
| Time of Departure | Male | Female |
| 12:00 AM to 4:59 AM | 119 (3.0%) | 87 (2.2%) |
| 5:00 AM to 5:29 AM | 198 (5.0%) | 132 (3.4%) |
| 5:30 AM to 5:59 AM | 152 (3.9%) | 71 (1.8%) |
| 6:00 AM to 6:29 AM | 327 (8.3%) | 140 (3.6%) |
| 6:30 AM to 6:59 AM | 517 (13.1%) | 241 (6.2%) |
| 7:00 AM to 7:29 AM | 542 (13.8%) | 482 (12.3%) |
| 7:30 AM to 7:59 AM | 352 (8.9%) | 704 (18.0%) |
| 8:00 AM to 8:29 AM | 603 (15.3%) | 819 (21.0%) |
| 8:30 AM to 8:59 AM | 155 (3.9%) | 226 (5.8%) |
| 9:00 AM to 9:59 AM | 300 (7.6%) | 495 (12.7%) |
| 10:00 AM to 10:59 AM | 126 (3.2%) | 373 (9.6%) |
| 11:00 AM to 11:59 AM | 87 (2.2%) | 0 (0.0%) |
| 12:00 PM to 3:59 PM | 241 (6.1%) | 94 (2.4%) |
| 4:00 PM to 11:59 PM | 215 (5.5%) | 39 (1.0%) |
| Total | 3,934 (100.0%) | 3,903 (100.0%) |
Housing Occupancy in La Crescenta Montrose
Occupancy by Ownership in La Crescenta Montrose
Of the total 7,259 dwellings in La Crescenta Montrose, owner-occupied units account for 4,304 (59.3%), while renter-occupied units make up 2,955 (40.7%).
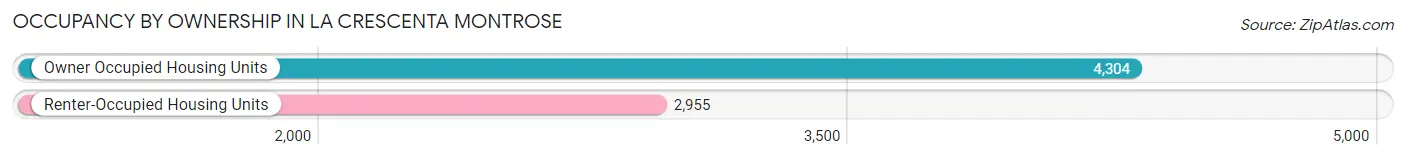
| Occupancy | # Housing Units | % Housing Units |
| Owner Occupied Housing Units | 4,304 | 59.3% |
| Renter-Occupied Housing Units | 2,955 | 40.7% |
| Total Occupied Housing Units | 7,259 | 100.0% |
Occupancy by Household Size in La Crescenta Montrose
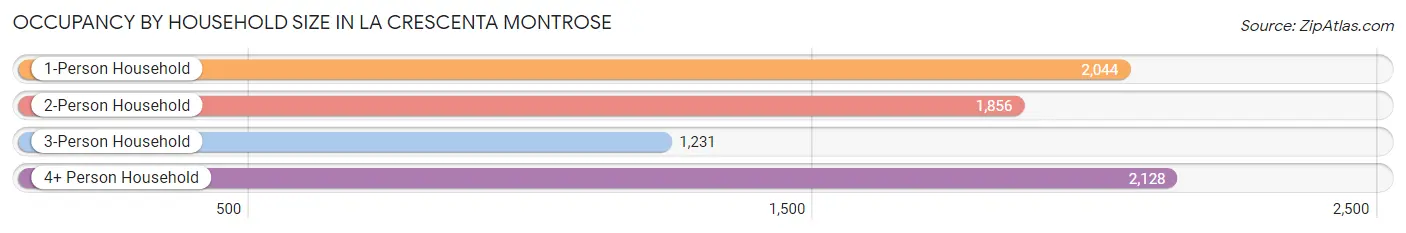
| Household Size | # Housing Units | % Housing Units |
| 1-Person Household | 2,044 | 28.2% |
| 2-Person Household | 1,856 | 25.6% |
| 3-Person Household | 1,231 | 17.0% |
| 4+ Person Household | 2,128 | 29.3% |
| Total Housing Units | 7,259 | 100.0% |
Occupancy by Ownership by Household Size in La Crescenta Montrose
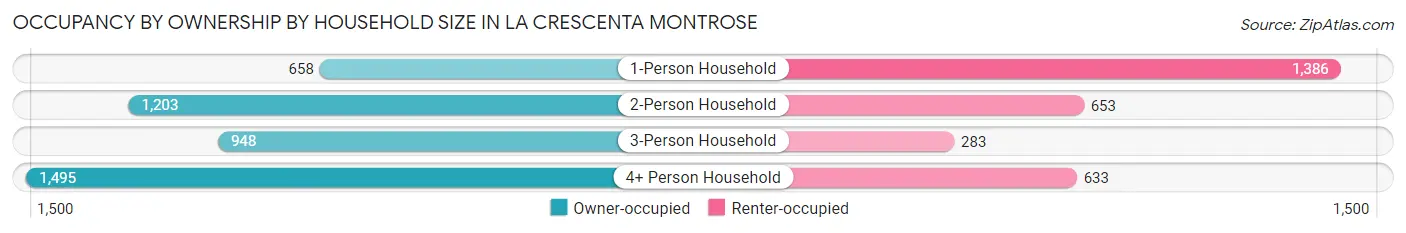
| Household Size | Owner-occupied | Renter-occupied |
| 1-Person Household | 658 (32.2%) | 1,386 (67.8%) |
| 2-Person Household | 1,203 (64.8%) | 653 (35.2%) |
| 3-Person Household | 948 (77.0%) | 283 (23.0%) |
| 4+ Person Household | 1,495 (70.3%) | 633 (29.7%) |
| Total Housing Units | 4,304 (59.3%) | 2,955 (40.7%) |
Occupancy by Educational Attainment in La Crescenta Montrose
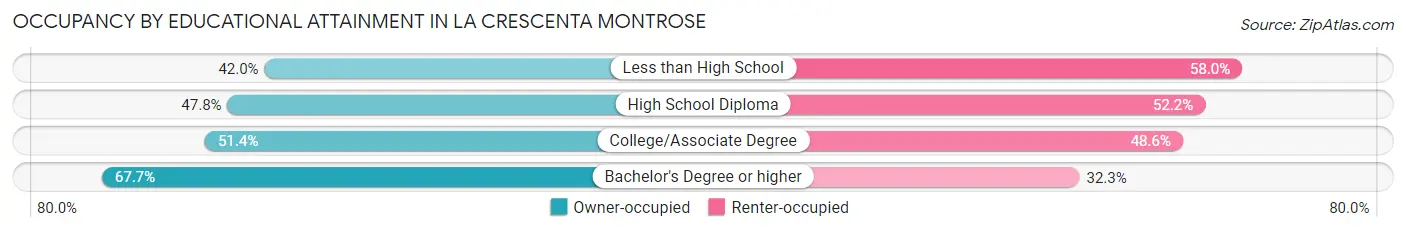
| Household Size | Owner-occupied | Renter-occupied |
| Less than High School | 141 (42.0%) | 195 (58.0%) |
| High School Diploma | 539 (47.8%) | 588 (52.2%) |
| College/Associate Degree | 949 (51.4%) | 898 (48.6%) |
| Bachelor's Degree or higher | 2,675 (67.7%) | 1,274 (32.3%) |
Occupancy by Age of Householder in La Crescenta Montrose
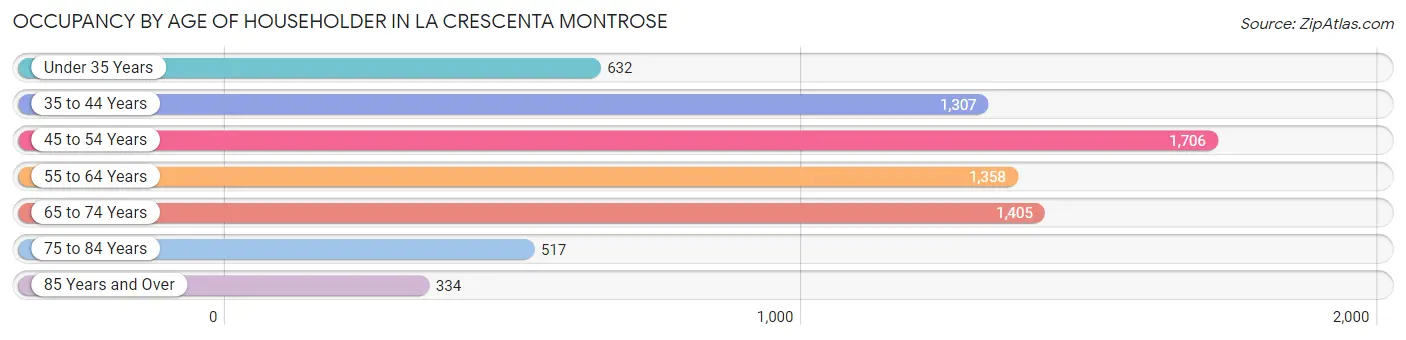
| Age Bracket | # Households | % Households |
| Under 35 Years | 632 | 8.7% |
| 35 to 44 Years | 1,307 | 18.0% |
| 45 to 54 Years | 1,706 | 23.5% |
| 55 to 64 Years | 1,358 | 18.7% |
| 65 to 74 Years | 1,405 | 19.4% |
| 75 to 84 Years | 517 | 7.1% |
| 85 Years and Over | 334 | 4.6% |
| Total | 7,259 | 100.0% |
Housing Finances in La Crescenta Montrose
Median Income by Occupancy in La Crescenta Montrose
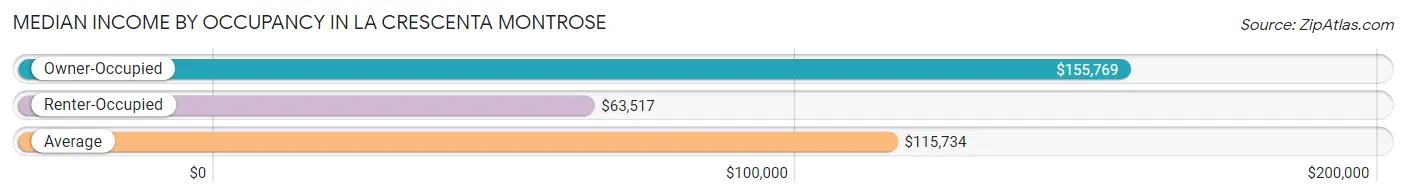
| Occupancy Type | # Households | Median Income |
| Owner-Occupied | 4,304 (59.3%) | $155,769 |
| Renter-Occupied | 2,955 (40.7%) | $63,517 |
| Average | 7,259 (100.0%) | $115,734 |
Occupancy by Householder Income Bracket in La Crescenta Montrose
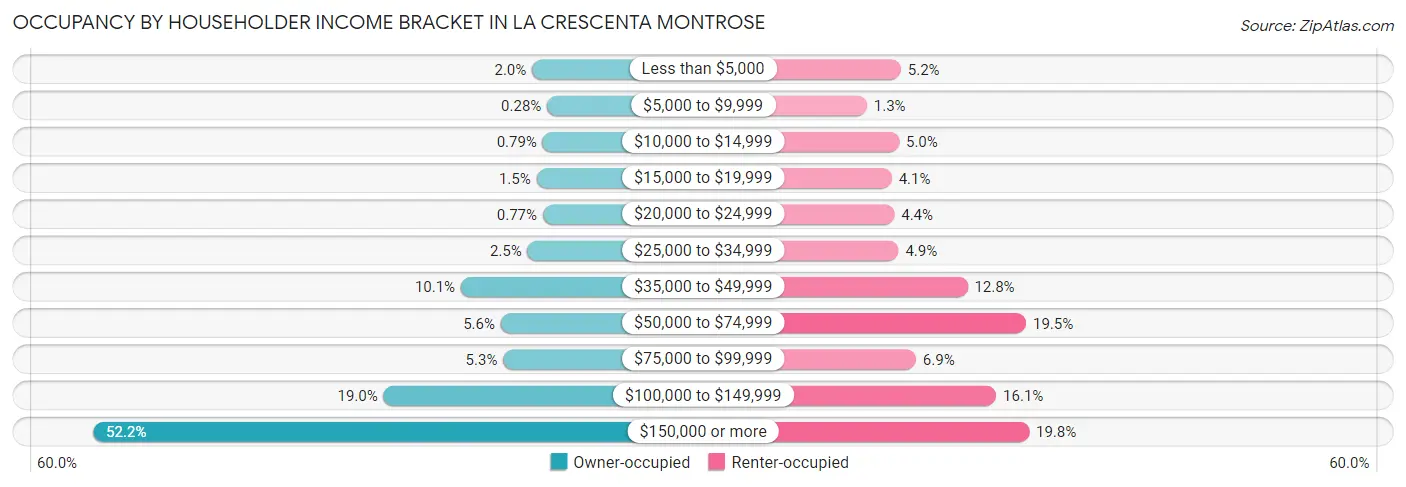
| Income Bracket | Owner-occupied | Renter-occupied |
| Less than $5,000 | 86 (2.0%) | 153 (5.2%) |
| $5,000 to $9,999 | 12 (0.3%) | 38 (1.3%) |
| $10,000 to $14,999 | 34 (0.8%) | 147 (5.0%) |
| $15,000 to $19,999 | 64 (1.5%) | 122 (4.1%) |
| $20,000 to $24,999 | 33 (0.8%) | 131 (4.4%) |
| $25,000 to $34,999 | 108 (2.5%) | 145 (4.9%) |
| $35,000 to $49,999 | 436 (10.1%) | 378 (12.8%) |
| $50,000 to $74,999 | 240 (5.6%) | 576 (19.5%) |
| $75,000 to $99,999 | 228 (5.3%) | 204 (6.9%) |
| $100,000 to $149,999 | 817 (19.0%) | 475 (16.1%) |
| $150,000 or more | 2,246 (52.2%) | 586 (19.8%) |
| Total | 4,304 (100.0%) | 2,955 (100.0%) |
Monthly Housing Cost Tiers in La Crescenta Montrose
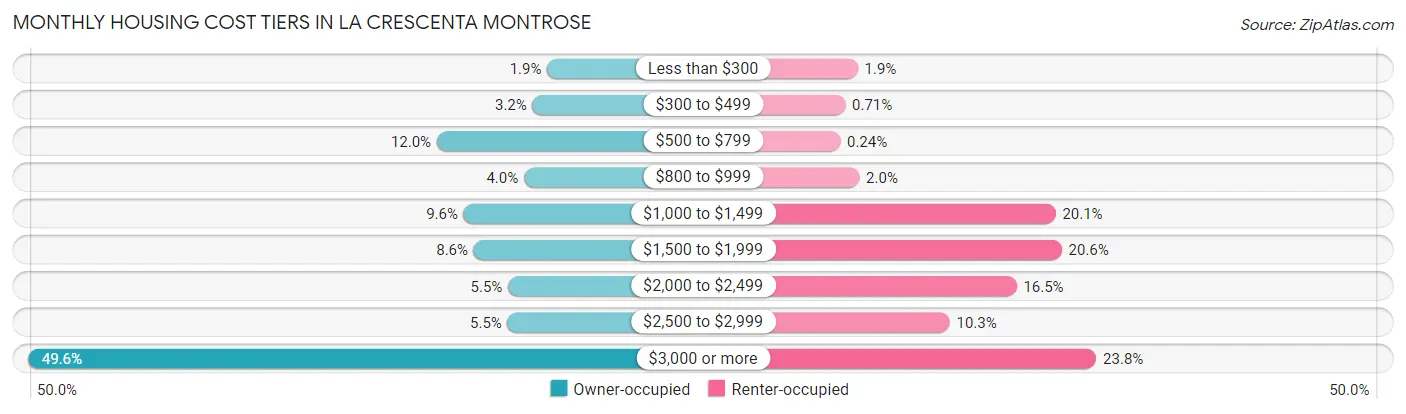
| Monthly Cost | Owner-occupied | Renter-occupied |
| Less than $300 | 81 (1.9%) | 55 (1.9%) |
| $300 to $499 | 139 (3.2%) | 21 (0.7%) |
| $500 to $799 | 518 (12.0%) | 7 (0.2%) |
| $800 to $999 | 173 (4.0%) | 59 (2.0%) |
| $1,000 to $1,499 | 412 (9.6%) | 593 (20.1%) |
| $1,500 to $1,999 | 372 (8.6%) | 610 (20.6%) |
| $2,000 to $2,499 | 236 (5.5%) | 487 (16.5%) |
| $2,500 to $2,999 | 238 (5.5%) | 305 (10.3%) |
| $3,000 or more | 2,135 (49.6%) | 704 (23.8%) |
| Total | 4,304 (100.0%) | 2,955 (100.0%) |
Physical Housing Characteristics in La Crescenta Montrose
Housing Structures in La Crescenta Montrose
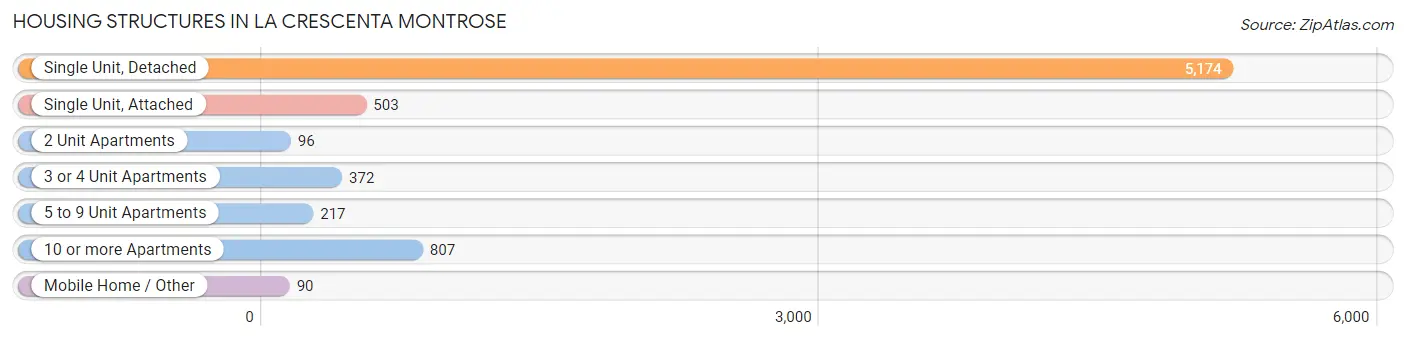
| Structure Type | # Housing Units | % Housing Units |
| Single Unit, Detached | 5,174 | 71.3% |
| Single Unit, Attached | 503 | 6.9% |
| 2 Unit Apartments | 96 | 1.3% |
| 3 or 4 Unit Apartments | 372 | 5.1% |
| 5 to 9 Unit Apartments | 217 | 3.0% |
| 10 or more Apartments | 807 | 11.1% |
| Mobile Home / Other | 90 | 1.2% |
| Total | 7,259 | 100.0% |
Housing Structures by Occupancy in La Crescenta Montrose
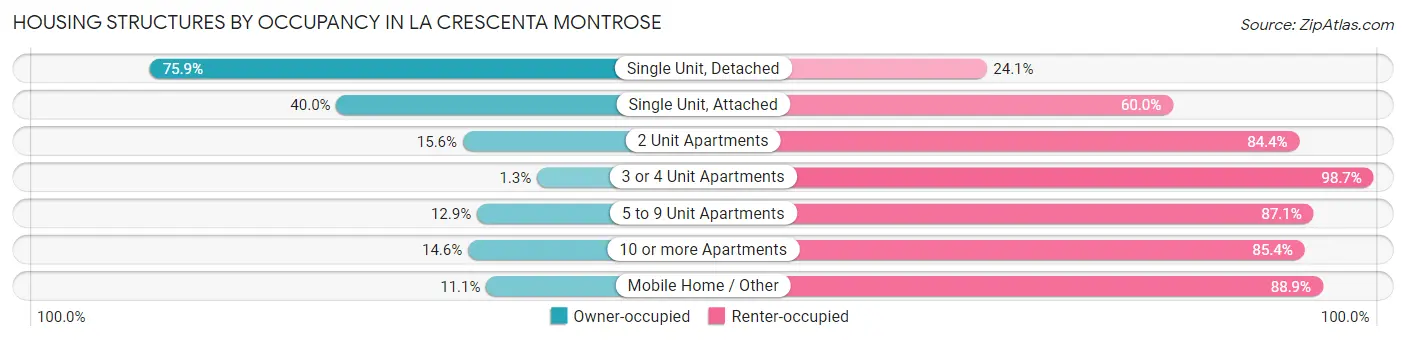
| Structure Type | Owner-occupied | Renter-occupied |
| Single Unit, Detached | 3,927 (75.9%) | 1,247 (24.1%) |
| Single Unit, Attached | 201 (40.0%) | 302 (60.0%) |
| 2 Unit Apartments | 15 (15.6%) | 81 (84.4%) |
| 3 or 4 Unit Apartments | 5 (1.3%) | 367 (98.7%) |
| 5 to 9 Unit Apartments | 28 (12.9%) | 189 (87.1%) |
| 10 or more Apartments | 118 (14.6%) | 689 (85.4%) |
| Mobile Home / Other | 10 (11.1%) | 80 (88.9%) |
| Total | 4,304 (59.3%) | 2,955 (40.7%) |
Housing Structures by Number of Rooms in La Crescenta Montrose
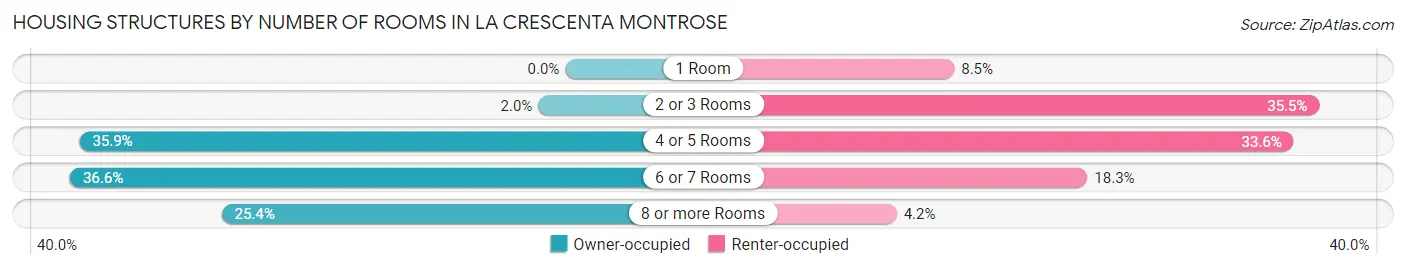
| Number of Rooms | Owner-occupied | Renter-occupied |
| 1 Room | 0 (0.0%) | 250 (8.5%) |
| 2 or 3 Rooms | 86 (2.0%) | 1,048 (35.5%) |
| 4 or 5 Rooms | 1,547 (35.9%) | 992 (33.6%) |
| 6 or 7 Rooms | 1,577 (36.6%) | 541 (18.3%) |
| 8 or more Rooms | 1,094 (25.4%) | 124 (4.2%) |
| Total | 4,304 (100.0%) | 2,955 (100.0%) |
Housing Structure by Heating Type in La Crescenta Montrose
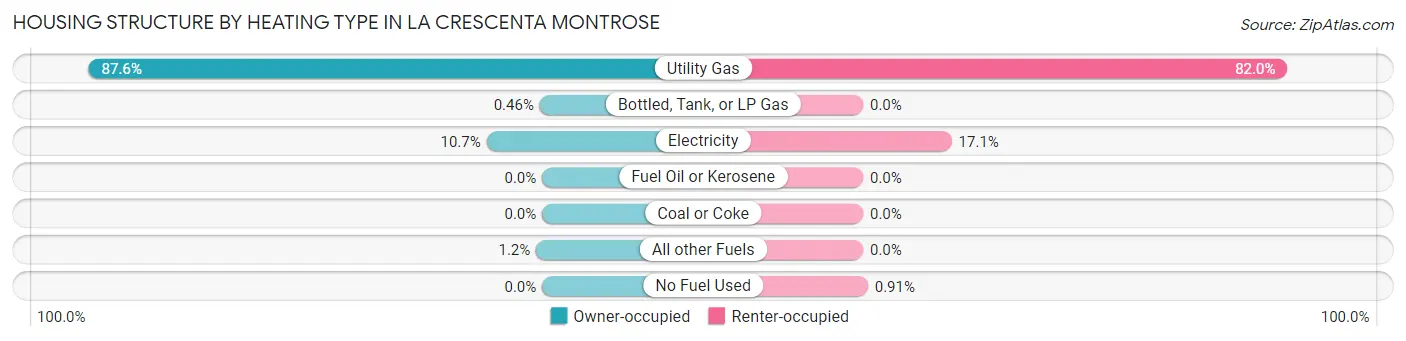
| Heating Type | Owner-occupied | Renter-occupied |
| Utility Gas | 3,772 (87.6%) | 2,422 (82.0%) |
| Bottled, Tank, or LP Gas | 20 (0.5%) | 0 (0.0%) |
| Electricity | 462 (10.7%) | 506 (17.1%) |
| Fuel Oil or Kerosene | 0 (0.0%) | 0 (0.0%) |
| Coal or Coke | 0 (0.0%) | 0 (0.0%) |
| All other Fuels | 50 (1.2%) | 0 (0.0%) |
| No Fuel Used | 0 (0.0%) | 27 (0.9%) |
| Total | 4,304 (100.0%) | 2,955 (100.0%) |
Household Vehicle Usage in La Crescenta Montrose
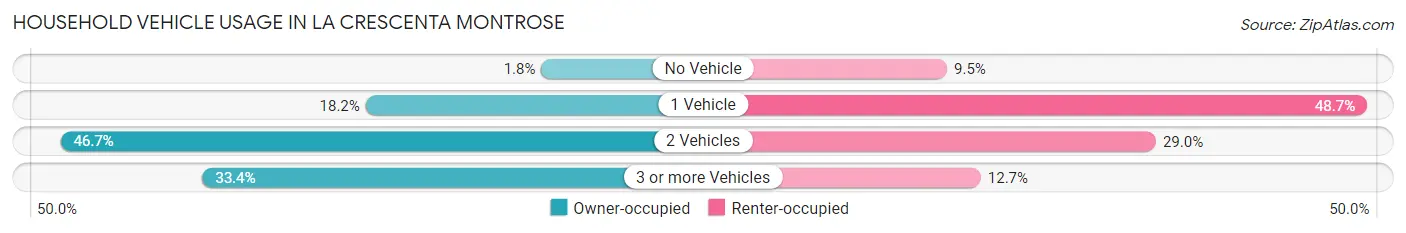
| Vehicles per Household | Owner-occupied | Renter-occupied |
| No Vehicle | 76 (1.8%) | 282 (9.5%) |
| 1 Vehicle | 782 (18.2%) | 1,440 (48.7%) |
| 2 Vehicles | 2,008 (46.7%) | 858 (29.0%) |
| 3 or more Vehicles | 1,438 (33.4%) | 375 (12.7%) |
| Total | 4,304 (100.0%) | 2,955 (100.0%) |
Real Estate & Mortgages in La Crescenta Montrose
Real Estate and Mortgage Overview in La Crescenta Montrose
| Characteristic | Without Mortgage | With Mortgage |
| Housing Units | 1,290 | 3,014 |
| Median Property Value | $991,500 | $1,125,900 |
| Median Household Income | $102,194 | $1,837 |
| Monthly Housing Costs | $846 | $2,093 |
| Real Estate Taxes | $4,918 | $45 |
Property Value by Mortgage Status in La Crescenta Montrose
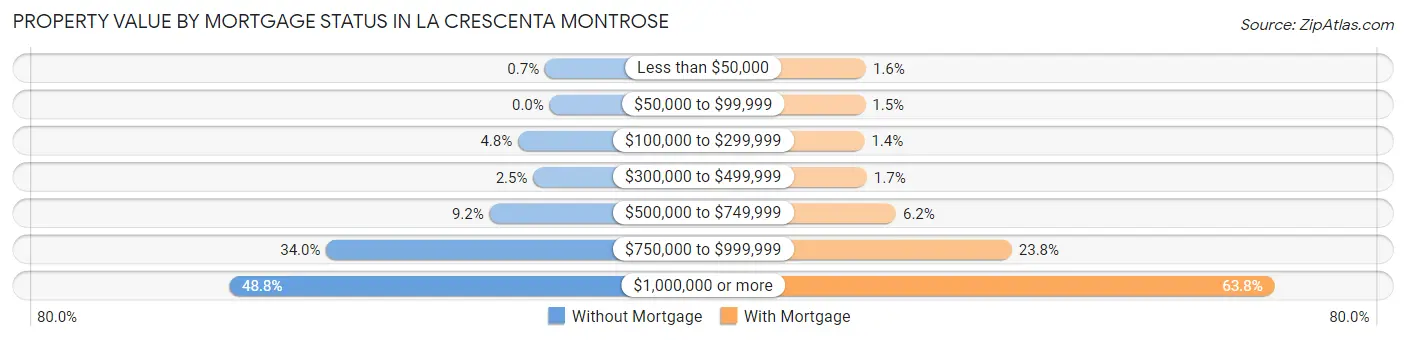
| Property Value | Without Mortgage | With Mortgage |
| Less than $50,000 | 9 (0.7%) | 48 (1.6%) |
| $50,000 to $99,999 | 0 (0.0%) | 45 (1.5%) |
| $100,000 to $299,999 | 62 (4.8%) | 41 (1.4%) |
| $300,000 to $499,999 | 32 (2.5%) | 52 (1.7%) |
| $500,000 to $749,999 | 118 (9.1%) | 186 (6.2%) |
| $750,000 to $999,999 | 439 (34.0%) | 718 (23.8%) |
| $1,000,000 or more | 630 (48.8%) | 1,924 (63.8%) |
| Total | 1,290 (100.0%) | 3,014 (100.0%) |
Household Income by Mortgage Status in La Crescenta Montrose
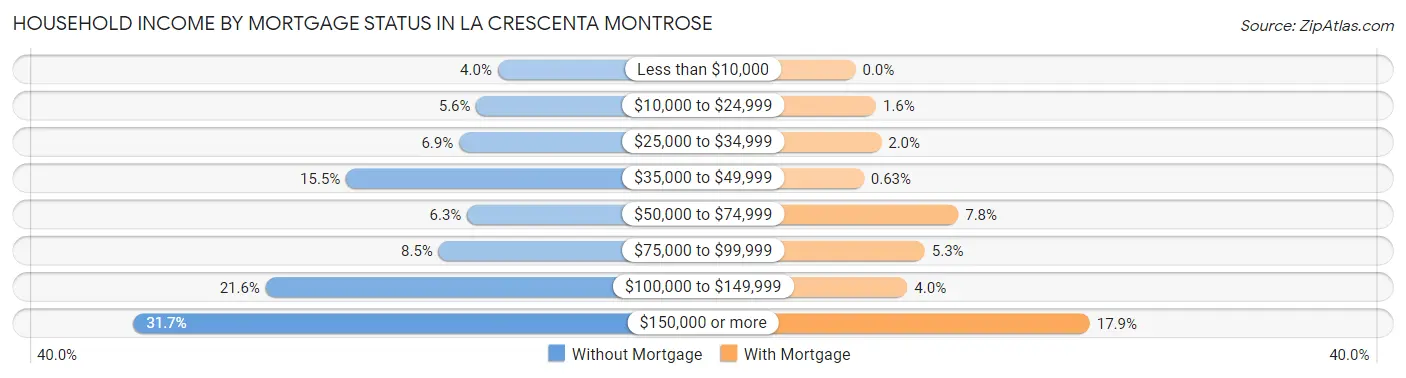
| Household Income | Without Mortgage | With Mortgage |
| Less than $10,000 | 51 (4.0%) | 0 (0.0%) |
| $10,000 to $24,999 | 72 (5.6%) | 47 (1.6%) |
| $25,000 to $34,999 | 89 (6.9%) | 59 (2.0%) |
| $35,000 to $49,999 | 200 (15.5%) | 19 (0.6%) |
| $50,000 to $74,999 | 81 (6.3%) | 236 (7.8%) |
| $75,000 to $99,999 | 109 (8.5%) | 159 (5.3%) |
| $100,000 to $149,999 | 279 (21.6%) | 119 (4.0%) |
| $150,000 or more | 409 (31.7%) | 538 (17.8%) |
| Total | 1,290 (100.0%) | 3,014 (100.0%) |
Property Value to Household Income Ratio in La Crescenta Montrose
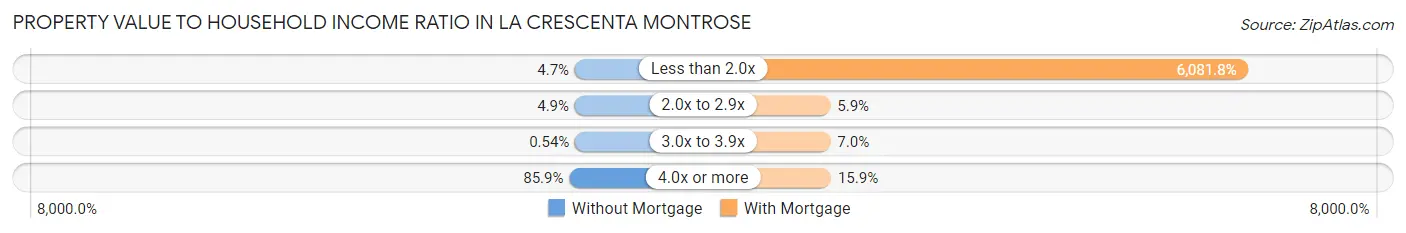
| Value-to-Income Ratio | Without Mortgage | With Mortgage |
| Less than 2.0x | 61 (4.7%) | 183,304 (6,081.8%) |
| 2.0x to 2.9x | 63 (4.9%) | 177 (5.9%) |
| 3.0x to 3.9x | 7 (0.5%) | 210 (7.0%) |
| 4.0x or more | 1,108 (85.9%) | 479 (15.9%) |
| Total | 1,290 (100.0%) | 3,014 (100.0%) |
Real Estate Taxes by Mortgage Status in La Crescenta Montrose
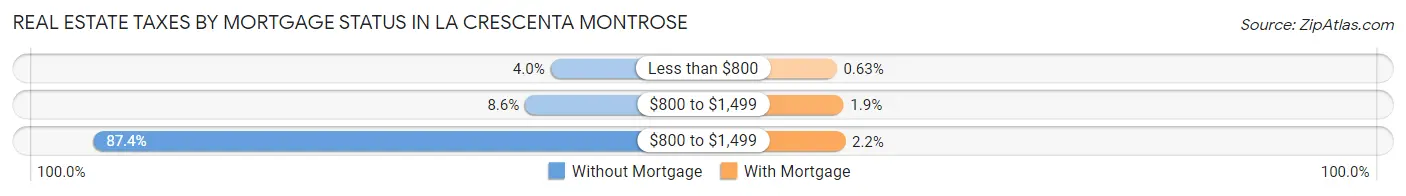
| Property Taxes | Without Mortgage | With Mortgage |
| Less than $800 | 51 (4.0%) | 19 (0.6%) |
| $800 to $1,499 | 111 (8.6%) | 57 (1.9%) |
| $800 to $1,499 | 1,128 (87.4%) | 66 (2.2%) |
| Total | 1,290 (100.0%) | 3,014 (100.0%) |
Health & Disability in La Crescenta Montrose
Health Insurance Coverage by Age in La Crescenta Montrose
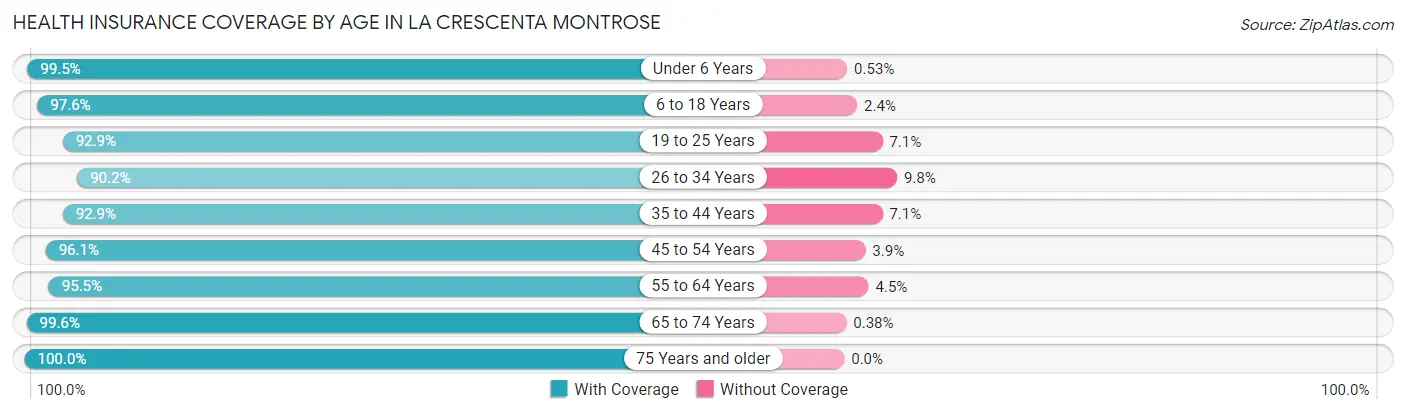
| Age Bracket | With Coverage | Without Coverage |
| Under 6 Years | 1,311 (99.5%) | 7 (0.5%) |
| 6 to 18 Years | 3,666 (97.6%) | 90 (2.4%) |
| 19 to 25 Years | 1,082 (92.9%) | 83 (7.1%) |
| 26 to 34 Years | 1,571 (90.2%) | 171 (9.8%) |
| 35 to 44 Years | 2,780 (92.9%) | 213 (7.1%) |
| 45 to 54 Years | 2,659 (96.1%) | 109 (3.9%) |
| 55 to 64 Years | 2,616 (95.5%) | 124 (4.5%) |
| 65 to 74 Years | 2,102 (99.6%) | 8 (0.4%) |
| 75 Years and older | 1,500 (100.0%) | 0 (0.0%) |
| Total | 19,287 (96.0%) | 805 (4.0%) |
Health Insurance Coverage by Citizenship Status in La Crescenta Montrose
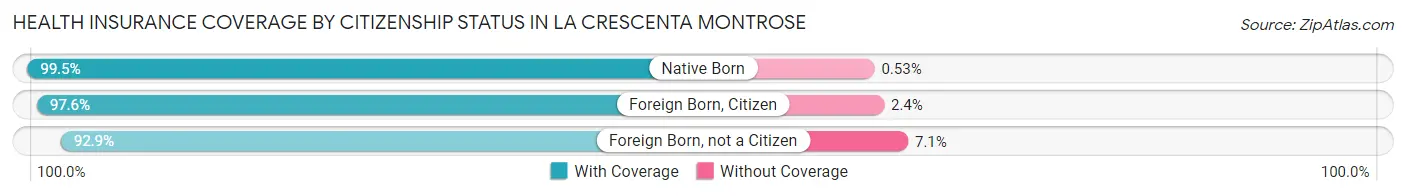
| Citizenship Status | With Coverage | Without Coverage |
| Native Born | 1,311 (99.5%) | 7 (0.5%) |
| Foreign Born, Citizen | 3,666 (97.6%) | 90 (2.4%) |
| Foreign Born, not a Citizen | 1,082 (92.9%) | 83 (7.1%) |
Health Insurance Coverage by Household Income in La Crescenta Montrose
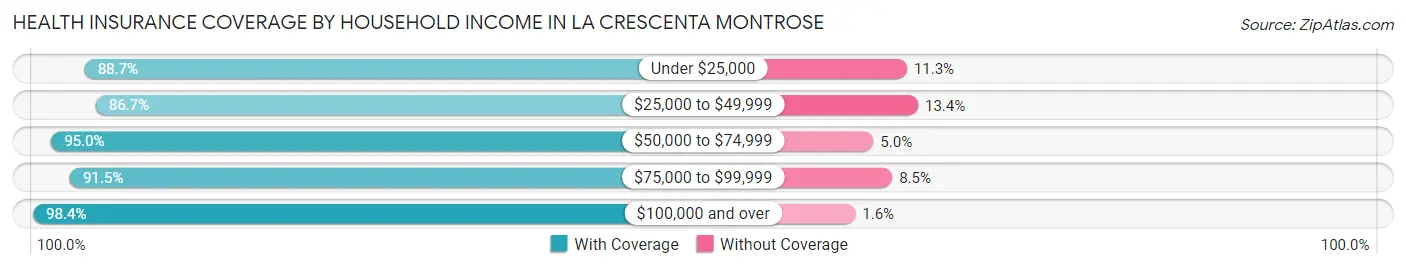
| Household Income | With Coverage | Without Coverage |
| Under $25,000 | 1,165 (88.7%) | 148 (11.3%) |
| $25,000 to $49,999 | 1,739 (86.7%) | 268 (13.4%) |
| $50,000 to $74,999 | 1,410 (95.0%) | 74 (5.0%) |
| $75,000 to $99,999 | 860 (91.5%) | 80 (8.5%) |
| $100,000 and over | 14,108 (98.4%) | 229 (1.6%) |
Public vs Private Health Insurance Coverage by Age in La Crescenta Montrose
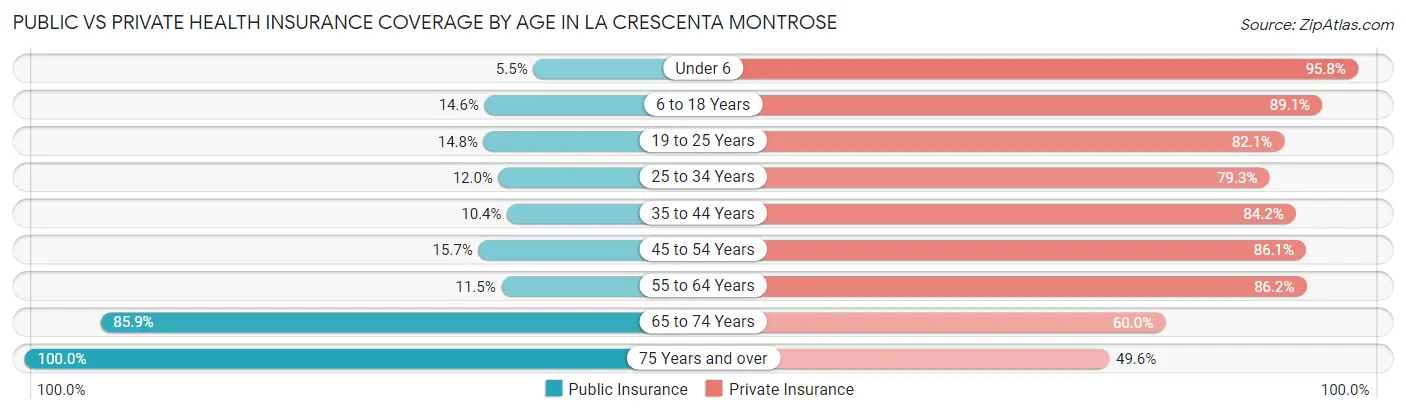
| Age Bracket | Public Insurance | Private Insurance |
| Under 6 | 73 (5.5%) | 1,262 (95.8%) |
| 6 to 18 Years | 548 (14.6%) | 3,347 (89.1%) |
| 19 to 25 Years | 172 (14.8%) | 956 (82.1%) |
| 25 to 34 Years | 209 (12.0%) | 1,382 (79.3%) |
| 35 to 44 Years | 311 (10.4%) | 2,521 (84.2%) |
| 45 to 54 Years | 435 (15.7%) | 2,384 (86.1%) |
| 55 to 64 Years | 314 (11.5%) | 2,362 (86.2%) |
| 65 to 74 Years | 1,813 (85.9%) | 1,266 (60.0%) |
| 75 Years and over | 1,500 (100.0%) | 744 (49.6%) |
| Total | 5,375 (26.8%) | 16,224 (80.7%) |
Disability Status by Sex by Age in La Crescenta Montrose
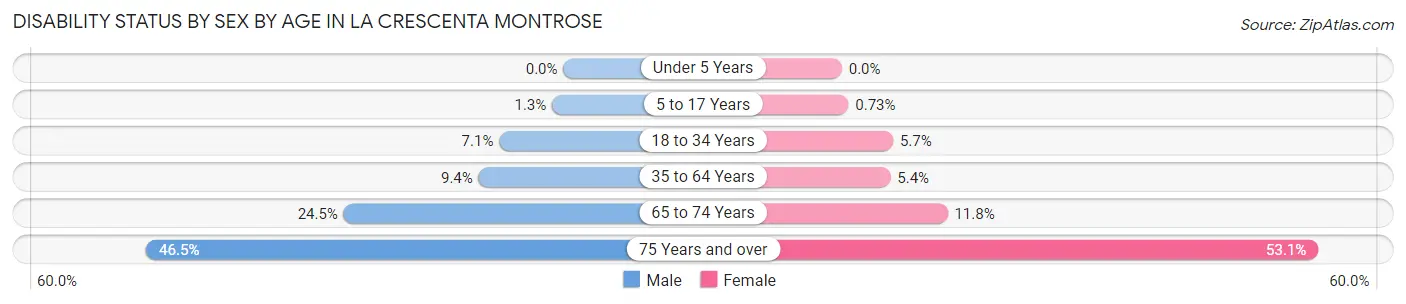
| Age Bracket | Male | Female |
| Under 5 Years | 0 (0.0%) | 0 (0.0%) |
| 5 to 17 Years | 29 (1.3%) | 12 (0.7%) |
| 18 to 34 Years | 99 (7.1%) | 96 (5.7%) |
| 35 to 64 Years | 382 (9.4%) | 241 (5.4%) |
| 65 to 74 Years | 248 (24.5%) | 129 (11.8%) |
| 75 Years and over | 210 (46.5%) | 556 (53.0%) |
Disability Class by Sex by Age in La Crescenta Montrose
Disability Class: Hearing Difficulty
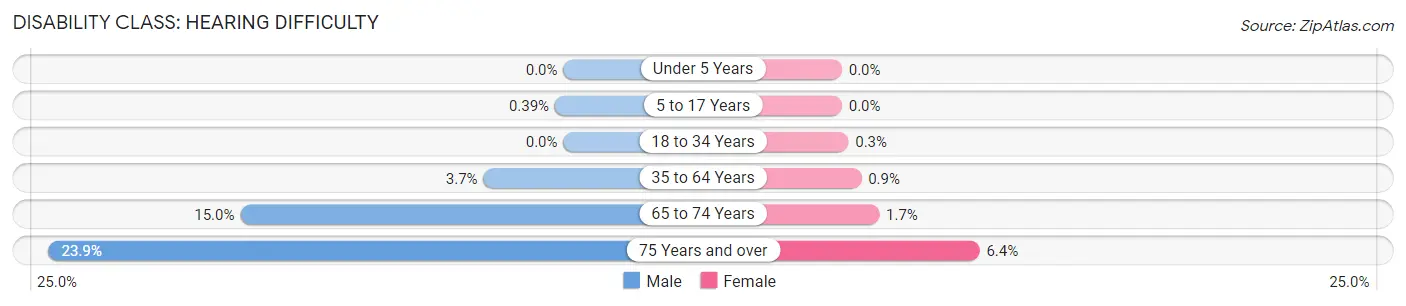
| Age Bracket | Male | Female |
| Under 5 Years | 0 (0.0%) | 0 (0.0%) |
| 5 to 17 Years | 9 (0.4%) | 0 (0.0%) |
| 18 to 34 Years | 0 (0.0%) | 5 (0.3%) |
| 35 to 64 Years | 150 (3.7%) | 40 (0.9%) |
| 65 to 74 Years | 152 (15.0%) | 19 (1.7%) |
| 75 Years and over | 108 (23.9%) | 67 (6.4%) |
Disability Class: Vision Difficulty
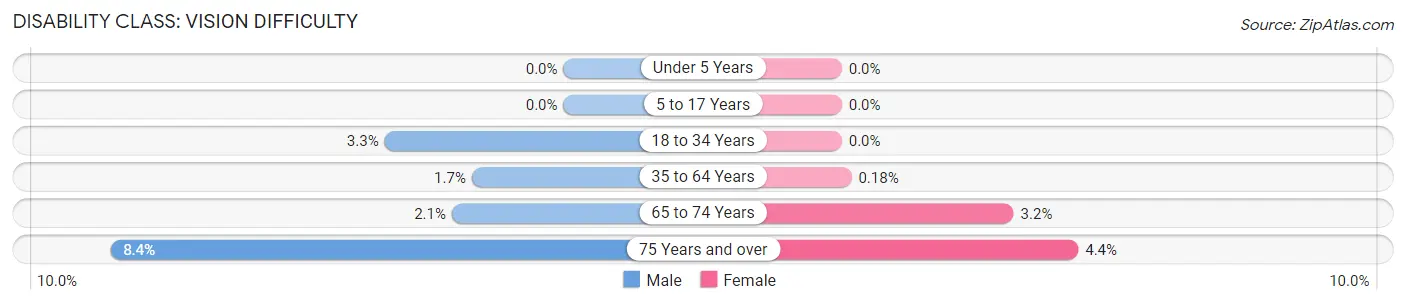
| Age Bracket | Male | Female |
| Under 5 Years | 0 (0.0%) | 0 (0.0%) |
| 5 to 17 Years | 0 (0.0%) | 0 (0.0%) |
| 18 to 34 Years | 46 (3.3%) | 0 (0.0%) |
| 35 to 64 Years | 69 (1.7%) | 8 (0.2%) |
| 65 to 74 Years | 21 (2.1%) | 35 (3.2%) |
| 75 Years and over | 38 (8.4%) | 46 (4.4%) |
Disability Class: Cognitive Difficulty
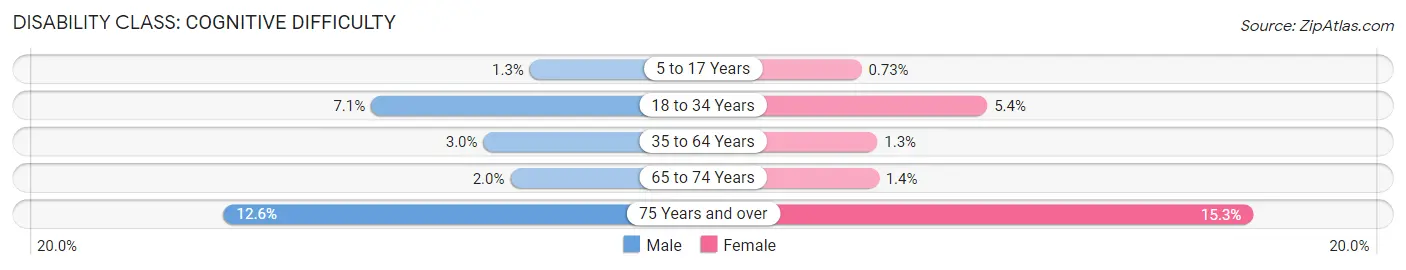
| Age Bracket | Male | Female |
| 5 to 17 Years | 29 (1.3%) | 12 (0.7%) |
| 18 to 34 Years | 99 (7.1%) | 91 (5.4%) |
| 35 to 64 Years | 120 (3.0%) | 59 (1.3%) |
| 65 to 74 Years | 20 (2.0%) | 15 (1.4%) |
| 75 Years and over | 57 (12.6%) | 160 (15.3%) |
Disability Class: Ambulatory Difficulty
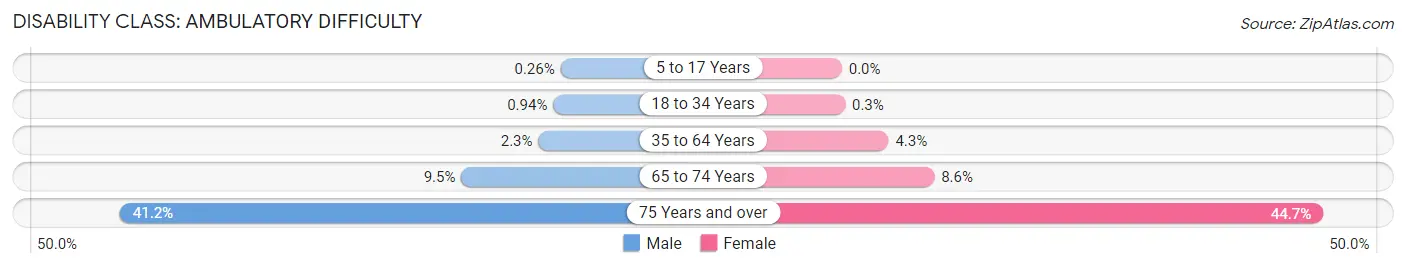
| Age Bracket | Male | Female |
| 5 to 17 Years | 6 (0.3%) | 0 (0.0%) |
| 18 to 34 Years | 13 (0.9%) | 5 (0.3%) |
| 35 to 64 Years | 94 (2.3%) | 193 (4.3%) |
| 65 to 74 Years | 96 (9.5%) | 94 (8.6%) |
| 75 Years and over | 186 (41.1%) | 468 (44.7%) |
Disability Class: Self-Care Difficulty
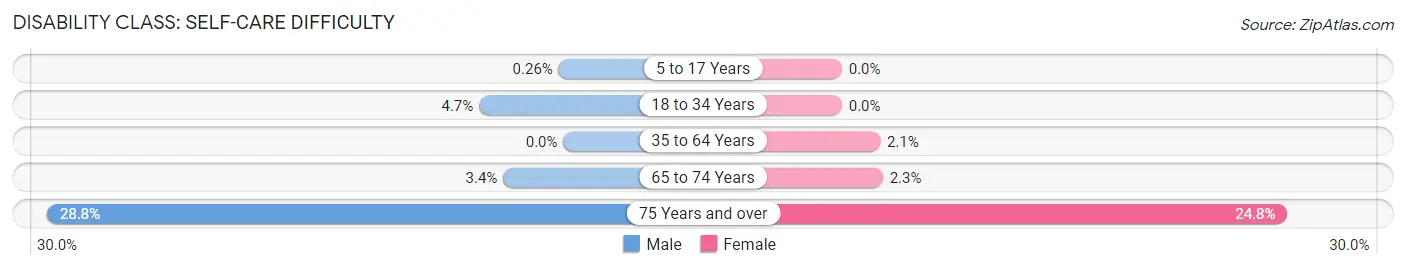
| Age Bracket | Male | Female |
| 5 to 17 Years | 6 (0.3%) | 0 (0.0%) |
| 18 to 34 Years | 65 (4.7%) | 0 (0.0%) |
| 35 to 64 Years | 0 (0.0%) | 95 (2.1%) |
| 65 to 74 Years | 34 (3.4%) | 25 (2.3%) |
| 75 Years and over | 130 (28.8%) | 260 (24.8%) |
Technology Access in La Crescenta Montrose
Computing Device Access in La Crescenta Montrose
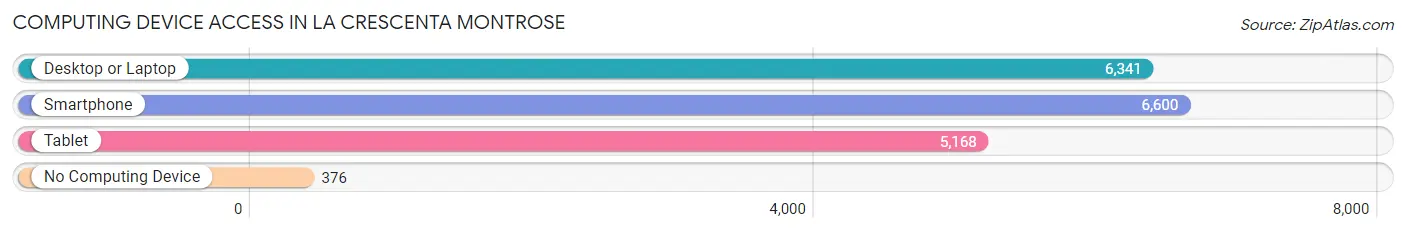
| Device Type | # Households | % Households |
| Desktop or Laptop | 6,341 | 87.4% |
| Smartphone | 6,600 | 90.9% |
| Tablet | 5,168 | 71.2% |
| No Computing Device | 376 | 5.2% |
| Total | 7,259 | 100.0% |
Internet Access in La Crescenta Montrose
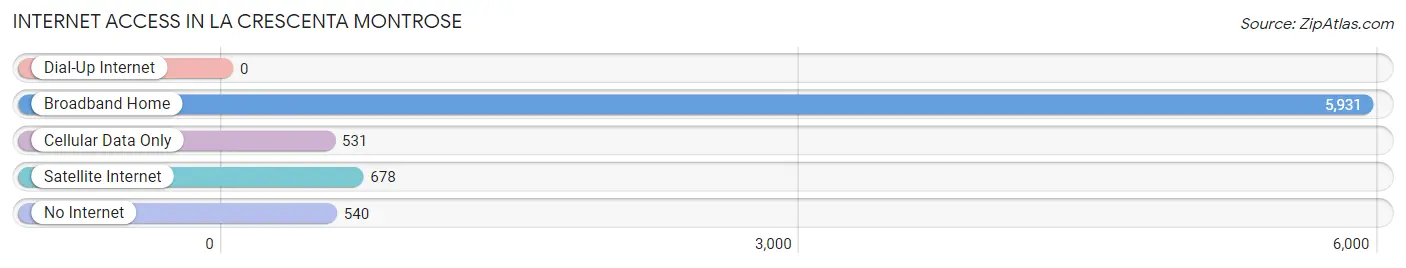
| Internet Type | # Households | % Households |
| Dial-Up Internet | 0 | 0.0% |
| Broadband Home | 5,931 | 81.7% |
| Cellular Data Only | 531 | 7.3% |
| Satellite Internet | 678 | 9.3% |
| No Internet | 540 | 7.4% |
| Total | 7,259 | 100.0% |
La Crescenta Montrose Summary
La Crescenta Montrose is a census-designated place (CDP) located in Los Angeles County, California. It is situated in the foothills of the San Gabriel Mountains, and is part of the Crescenta Valley. The population was 19,653 at the 2010 census, up from 18,532 at the 2000 census.
History
The area now known as La Crescenta Montrose was originally inhabited by the Tongva people, who were later displaced by Spanish settlers in the late 18th century. The area was part of the Rancho San Rafael, which was granted to Jose Maria Verdugo in 1784. The area was later subdivided into smaller parcels, and in 1887, the area was named La Crescenta after the crescent shape of the valley.
In the early 20th century, the area was developed as a residential community, and in 1916, the La Crescenta Woman’s Club was founded. The area was annexed to the City of Los Angeles in 1923, and in the 1940s, the area was further developed with the construction of the Foothill Freeway.
Geography
La Crescenta Montrose is located at 34°14′18″N 118°14′57″W (34.238, -118.249). It is situated in the foothills of the San Gabriel Mountains, and is part of the Crescenta Valley. The area is bordered by the cities of Glendale to the south and east, La Cañada Flintridge to the north, and Tujunga to the west.
The CDP has a total area of 4 8 square miles 12 4 km2 all of it land
Economy
The economy of La Crescenta Montrose is largely based on retail and services. The area is home to a variety of restaurants, shops, and other businesses. The area is also home to a number of professional offices, including medical and dental offices, law firms, and accounting firms.
Demographics
As of the 2010 census, there were 19,653 people, 7,541 households, and 5,072 families residing in the CDP. The population density was 4,093.3 people per square mile (1,581.2/km2). There were 7,890 housing units at an average density of 1,637.2 per square mile (631.3/km2). The racial makeup of the CDP was 74.2% White, 1.3% African American, 0.3% Native American, 18.5% Asian, 0.1% Pacific Islander, 3.2% from other races, and 2.5% from two or more races. Hispanic or Latino of any race were 10.2% of the population.
There were 7,541 households, out of which 33.2% had children under the age of 18 living with them, 54.2% were married couples living together, 10.7% had a female householder with no husband present, and 30.3% were non-families. 24.2% of all households were made up of individuals, and 9.7% had someone living alone who was 65 years of age or older. The average household size was 2.60 and the average family size was 3.12.
In the CDP, the population was spread out, with 24.2% under the age of 18, 7.2% from 18 to 24, 28.2% from 25 to 44, 25.7% from 45 to 64, and 14.7% who were 65 years of age or older. The median age was 39 years. For every 100 females, there were 93.2 males. For every 100 females age 18 and over, there were 90.2 males.
The median income for a household in the CDP was $63,817, and the median income for a family was $76,945. Males had a median income of $50,945 versus $41,945 for females. The per capita income for the CDP was $31,945. About 4.2% of families and 6.2% of the population were below the poverty line, including 7.2% of those under age 18 and 4.2% of those age 65 or over.
Common Questions
What is Per Capita Income in La Crescenta Montrose?
Per Capita income in La Crescenta Montrose is $54,376.
What is the Median Family Income in La Crescenta Montrose?
Median Family Income in La Crescenta Montrose is $156,346.
What is the Median Household income in La Crescenta Montrose?
Median Household Income in La Crescenta Montrose is $115,734.
What is Income or Wage Gap in La Crescenta Montrose?
Income or Wage Gap in La Crescenta Montrose is 33.9%.
Women in La Crescenta Montrose earn 66.1 cents for every dollar earned by a man.
What is Inequality or Gini Index in La Crescenta Montrose?
Inequality or Gini Index in La Crescenta Montrose is 0.46.
What is the Total Population of La Crescenta Montrose?
Total Population of La Crescenta Montrose is 20,092.
What is the Total Male Population of La Crescenta Montrose?
Total Male Population of La Crescenta Montrose is 9,696.
What is the Total Female Population of La Crescenta Montrose?
Total Female Population of La Crescenta Montrose is 10,396.
What is the Ratio of Males per 100 Females in La Crescenta Montrose?
There are 93.27 Males per 100 Females in La Crescenta Montrose.
What is the Ratio of Females per 100 Males in La Crescenta Montrose?
There are 107.22 Females per 100 Males in La Crescenta Montrose.
What is the Median Population Age in La Crescenta Montrose?
Median Population Age in La Crescenta Montrose is 42.1 Years.
What is the Average Family Size in La Crescenta Montrose
Average Family Size in La Crescenta Montrose is 3.5 People.
What is the Average Household Size in La Crescenta Montrose
Average Household Size in La Crescenta Montrose is 2.8 People.
How Large is the Labor Force in La Crescenta Montrose?
There are 10,238 People in the Labor Forcein in La Crescenta Montrose.
What is the Percentage of People in the Labor Force in La Crescenta Montrose?
65.2% of People are in the Labor Force in La Crescenta Montrose.
What is the Unemployment Rate in La Crescenta Montrose?
Unemployment Rate in La Crescenta Montrose is 7.5%.