Palmdale, CA Map & Demographics
Palmdale Map
Palmdale Overview
$27,882
PER CAPITA INCOME
$82,481
AVG FAMILY INCOME
$78,414
AVG HOUSEHOLD INCOME
34.7%
WAGE / INCOME GAP [ % ]
65.3¢/ $1
WAGE / INCOME GAP [ $ ]
$12,341
FAMILY INCOME DEFICIT
0.42
INEQUALITY / GINI INDEX
166,895
TOTAL POPULATION
82,777
MALE POPULATION
84,118
FEMALE POPULATION
98.41
MALES / 100 FEMALES
101.62
FEMALES / 100 MALES
33.0
MEDIAN AGE
3.9
AVG FAMILY SIZE
3.6
AVG HOUSEHOLD SIZE
75,756
LABOR FORCE [ PEOPLE ]
61.1%
PERCENT IN LABOR FORCE
7.4%
UNEMPLOYMENT RATE
Palmdale Area Codes
Income in Palmdale
Income Overview in Palmdale
Per Capita Income in Palmdale is $27,882, while median incomes of families and households are $82,481 and $78,414 respectively.
| Characteristic | Number | Measure |
| Per Capita Income | 166,895 | $27,882 |
| Median Family Income | 37,953 | $82,481 |
| Mean Family Income | 37,953 | $100,581 |
| Median Household Income | 46,588 | $78,414 |
| Mean Household Income | 46,588 | $96,849 |
| Income Deficit | 37,953 | $12,341 |
| Wage / Income Gap (%) | 166,895 | 34.68% |
| Wage / Income Gap ($) | 166,895 | 65.32¢ per $1 |
| Gini / Inequality Index | 166,895 | 0.42 |
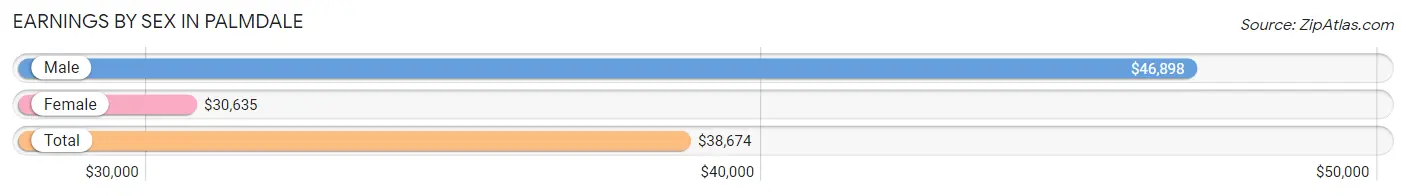
Earnings by Sex in Palmdale
Average Earnings in Palmdale are $38,674, $46,898 for men and $30,635 for women, a difference of 34.7%.
| Sex | Number | Average Earnings |
| Male | 41,310 (54.7%) | $46,898 |
| Female | 34,148 (45.3%) | $30,635 |
| Total | 75,458 (100.0%) | $38,674 |
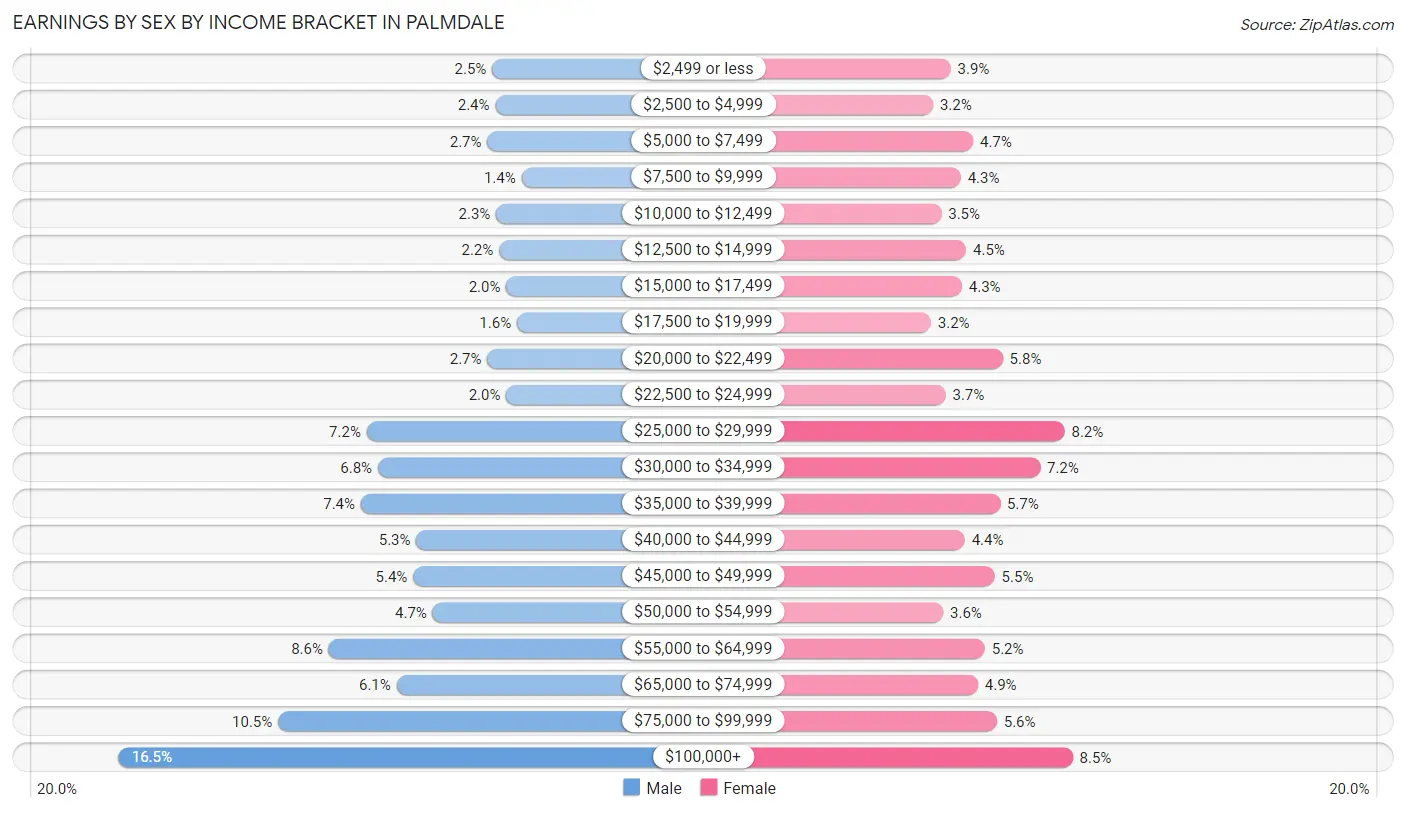
Earnings by Sex by Income Bracket in Palmdale
The most common earnings brackets in Palmdale are $100,000+ for men (6,805 | 16.5%) and $100,000+ for women (2,888 | 8.5%).
| Income | Male | Female |
| $2,499 or less | 1,025 (2.5%) | 1,327 (3.9%) |
| $2,500 to $4,999 | 976 (2.4%) | 1,103 (3.2%) |
| $5,000 to $7,499 | 1,100 (2.7%) | 1,616 (4.7%) |
| $7,500 to $9,999 | 569 (1.4%) | 1,459 (4.3%) |
| $10,000 to $12,499 | 961 (2.3%) | 1,210 (3.5%) |
| $12,500 to $14,999 | 919 (2.2%) | 1,528 (4.5%) |
| $15,000 to $17,499 | 806 (1.9%) | 1,471 (4.3%) |
| $17,500 to $19,999 | 641 (1.5%) | 1,074 (3.2%) |
| $20,000 to $22,499 | 1,097 (2.7%) | 1,993 (5.8%) |
| $22,500 to $24,999 | 807 (1.9%) | 1,262 (3.7%) |
| $25,000 to $29,999 | 2,966 (7.2%) | 2,787 (8.2%) |
| $30,000 to $34,999 | 2,794 (6.8%) | 2,473 (7.2%) |
| $35,000 to $39,999 | 3,058 (7.4%) | 1,960 (5.7%) |
| $40,000 to $44,999 | 2,198 (5.3%) | 1,511 (4.4%) |
| $45,000 to $49,999 | 2,248 (5.4%) | 1,892 (5.5%) |
| $50,000 to $54,999 | 1,946 (4.7%) | 1,234 (3.6%) |
| $55,000 to $64,999 | 3,552 (8.6%) | 1,767 (5.2%) |
| $65,000 to $74,999 | 2,505 (6.1%) | 1,675 (4.9%) |
| $75,000 to $99,999 | 4,337 (10.5%) | 1,918 (5.6%) |
| $100,000+ | 6,805 (16.5%) | 2,888 (8.5%) |
| Total | 41,310 (100.0%) | 34,148 (100.0%) |
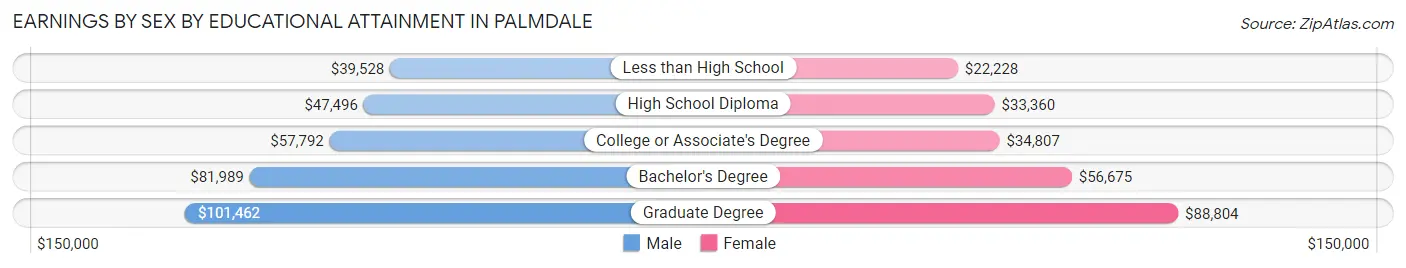
Earnings by Sex by Educational Attainment in Palmdale
Average earnings in Palmdale are $52,074 for men and $34,815 for women, a difference of 33.1%. Men with an educational attainment of graduate degree enjoy the highest average annual earnings of $101,462, while those with less than high school education earn the least with $39,528. Women with an educational attainment of graduate degree earn the most with the average annual earnings of $88,804, while those with less than high school education have the smallest earnings of $22,228.
| Educational Attainment | Male Income | Female Income |
| Less than High School | $39,528 | $22,228 |
| High School Diploma | $47,496 | $33,360 |
| College or Associate's Degree | $57,792 | $34,807 |
| Bachelor's Degree | $81,989 | $56,675 |
| Graduate Degree | $101,462 | $88,804 |
| Total | $52,074 | $34,815 |
Family Income in Palmdale
Family Income Brackets in Palmdale
According to the Palmdale family income data, there are 7,932 families falling into the $100,000 to $149,999 income range, which is the most common income bracket and makes up 20.9% of all families. Conversely, the $10,000 to $14,999 income bracket is the least frequent group with only 683 families (1.8%) belonging to this category.
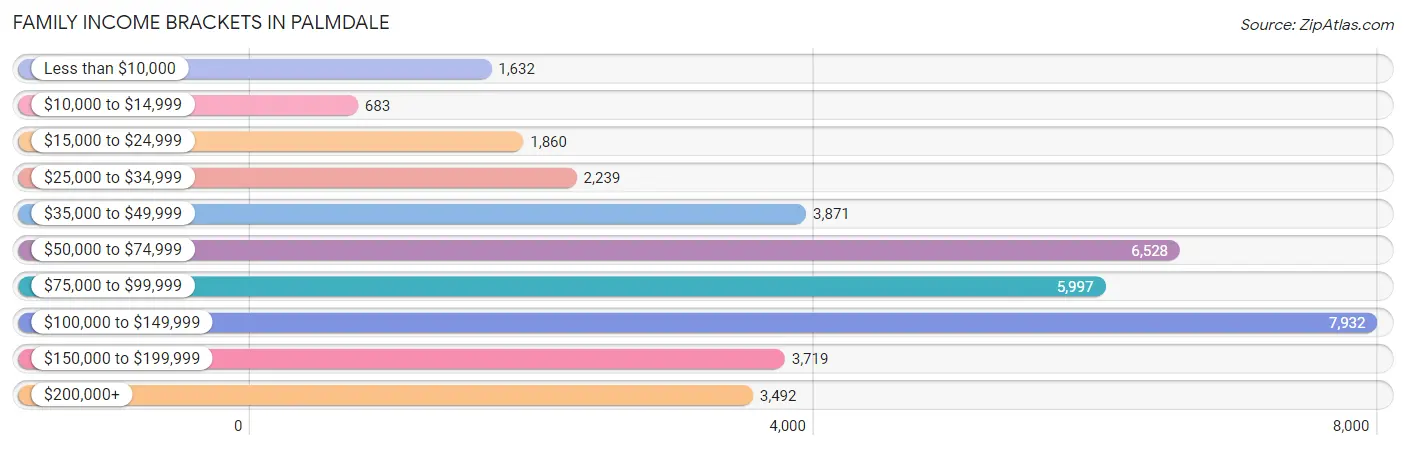
| Income Bracket | # Families | % Families |
| Less than $10,000 | 1,632 | 4.3% |
| $10,000 to $14,999 | 683 | 1.8% |
| $15,000 to $24,999 | 1,860 | 4.9% |
| $25,000 to $34,999 | 2,239 | 5.9% |
| $35,000 to $49,999 | 3,871 | 10.2% |
| $50,000 to $74,999 | 6,528 | 17.2% |
| $75,000 to $99,999 | 5,997 | 15.8% |
| $100,000 to $149,999 | 7,932 | 20.9% |
| $150,000 to $199,999 | 3,719 | 9.8% |
| $200,000+ | 3,492 | 9.2% |
Family Income by Famaliy Size in Palmdale
7+ person families (2,173 | 5.7%) account for the highest median family income in Palmdale with $116,212 per family, while 2-person families (10,467 | 27.6%) have the highest median income of $35,044 per family member.
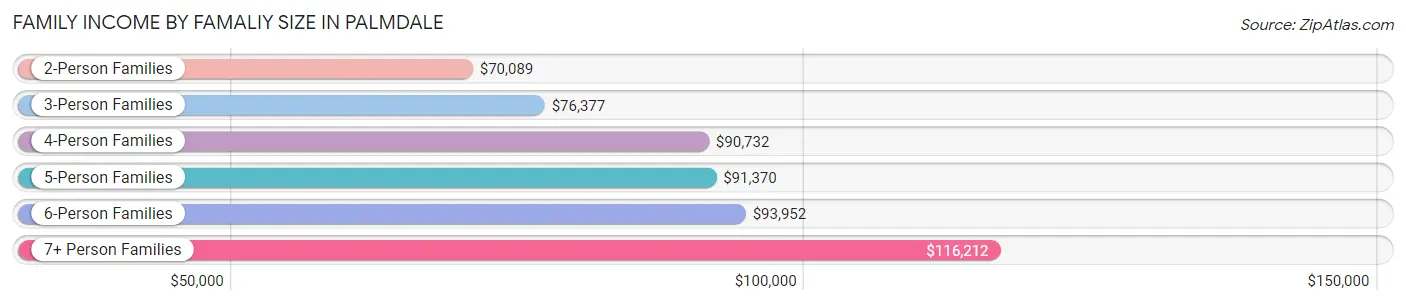
| Income Bracket | # Families | Median Income |
| 2-Person Families | 10,467 (27.6%) | $70,089 |
| 3-Person Families | 9,072 (23.9%) | $76,377 |
| 4-Person Families | 7,601 (20.0%) | $90,732 |
| 5-Person Families | 5,696 (15.0%) | $91,370 |
| 6-Person Families | 2,944 (7.8%) | $93,952 |
| 7+ Person Families | 2,173 (5.7%) | $116,212 |
| Total | 37,953 (100.0%) | $82,481 |
Family Income by Number of Earners in Palmdale
The median family income in Palmdale is $82,481, with families comprising 3+ earners (7,430) having the highest median family income of $132,529, while families with no earners (4,316) have the lowest median family income of $25,709, accounting for 19.6% and 11.4% of families, respectively.
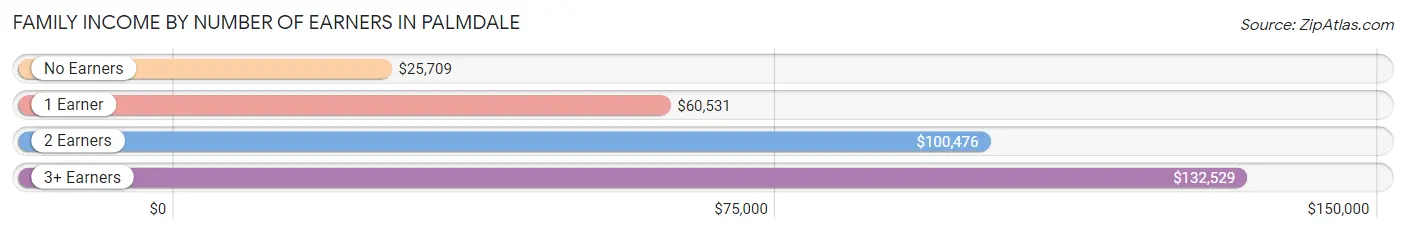
| Number of Earners | # Families | Median Income |
| No Earners | 4,316 (11.4%) | $25,709 |
| 1 Earner | 13,743 (36.2%) | $60,531 |
| 2 Earners | 12,464 (32.8%) | $100,476 |
| 3+ Earners | 7,430 (19.6%) | $132,529 |
| Total | 37,953 (100.0%) | $82,481 |
Household Income in Palmdale
Household Income Brackets in Palmdale
With 9,131 households falling in the category, the $100,000 to $149,999 income range is the most frequent in Palmdale, accounting for 19.6% of all households. In contrast, only 1,444 households (3.1%) fall into the $10,000 to $14,999 income bracket, making it the least populous group.
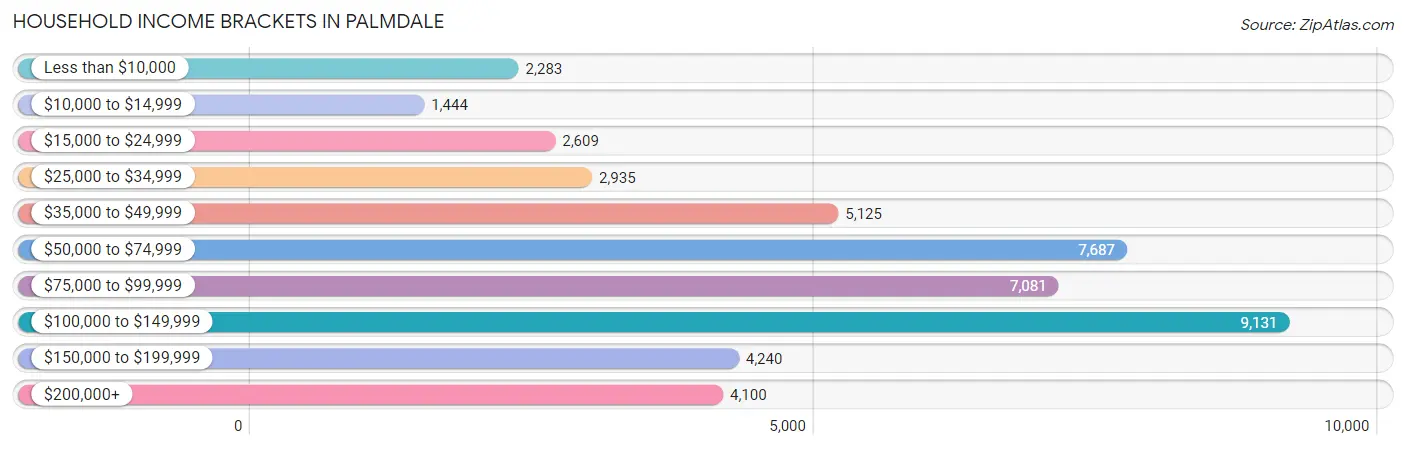
| Income Bracket | # Households | % Households |
| Less than $10,000 | 2,283 | 4.9% |
| $10,000 to $14,999 | 1,444 | 3.1% |
| $15,000 to $24,999 | 2,609 | 5.6% |
| $25,000 to $34,999 | 2,935 | 6.3% |
| $35,000 to $49,999 | 5,125 | 11.0% |
| $50,000 to $74,999 | 7,687 | 16.5% |
| $75,000 to $99,999 | 7,081 | 15.2% |
| $100,000 to $149,999 | 9,131 | 19.6% |
| $150,000 to $199,999 | 4,240 | 9.1% |
| $200,000+ | 4,100 | 8.8% |
Household Income by Householder Age in Palmdale
The median household income in Palmdale is $78,414, with the highest median household income of $90,908 found in the 45 to 64 years age bracket for the primary householder. A total of 20,493 households (44.0%) fall into this category. Meanwhile, the 15 to 24 years age bracket for the primary householder has the lowest median household income of $55,268, with 1,187 households (2.5%) in this group.
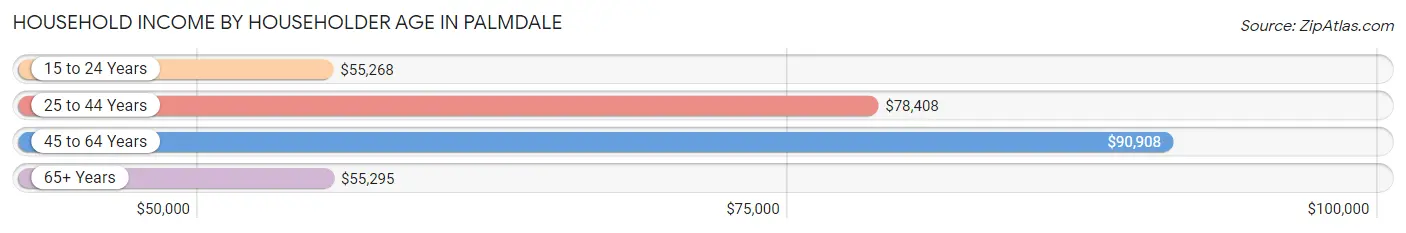
| Income Bracket | # Households | Median Income |
| 15 to 24 Years | 1,187 (2.5%) | $55,268 |
| 25 to 44 Years | 16,124 (34.6%) | $78,408 |
| 45 to 64 Years | 20,493 (44.0%) | $90,908 |
| 65+ Years | 8,784 (18.9%) | $55,295 |
| Total | 46,588 (100.0%) | $78,414 |
Poverty in Palmdale
Income Below Poverty by Sex and Age in Palmdale
With 11.7% poverty level for males and 16.5% for females among the residents of Palmdale, under 5 year old males and under 5 year old females are the most vulnerable to poverty, with 1,198 males (21.1%) and 1,535 females (26.1%) in their respective age groups living below the poverty level.
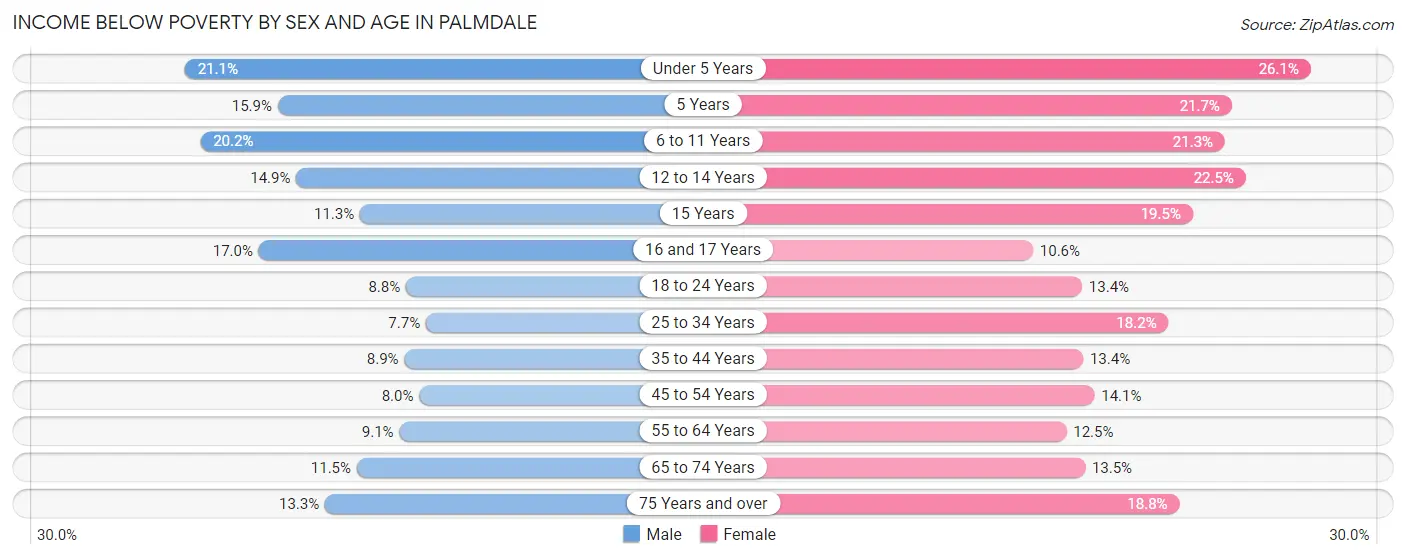
| Age Bracket | Male | Female |
| Under 5 Years | 1,198 (21.1%) | 1,535 (26.1%) |
| 5 Years | 201 (15.9%) | 294 (21.7%) |
| 6 to 11 Years | 1,661 (20.2%) | 1,561 (21.3%) |
| 12 to 14 Years | 738 (14.9%) | 931 (22.5%) |
| 15 Years | 190 (11.3%) | 298 (19.5%) |
| 16 and 17 Years | 527 (17.0%) | 245 (10.6%) |
| 18 to 24 Years | 751 (8.8%) | 1,102 (13.4%) |
| 25 to 34 Years | 895 (7.6%) | 2,057 (18.2%) |
| 35 to 44 Years | 918 (8.8%) | 1,498 (13.4%) |
| 45 to 54 Years | 806 (8.0%) | 1,522 (14.1%) |
| 55 to 64 Years | 826 (9.1%) | 1,235 (12.5%) |
| 65 to 74 Years | 596 (11.5%) | 861 (13.5%) |
| 75 Years and over | 323 (13.3%) | 645 (18.8%) |
| Total | 9,630 (11.7%) | 13,784 (16.5%) |
Income Above Poverty by Sex and Age in Palmdale
According to the poverty statistics in Palmdale, males aged 25 to 34 years and females aged 16 and 17 years are the age groups that are most secure financially, with 92.3% of males and 89.4% of females in these age groups living above the poverty line.
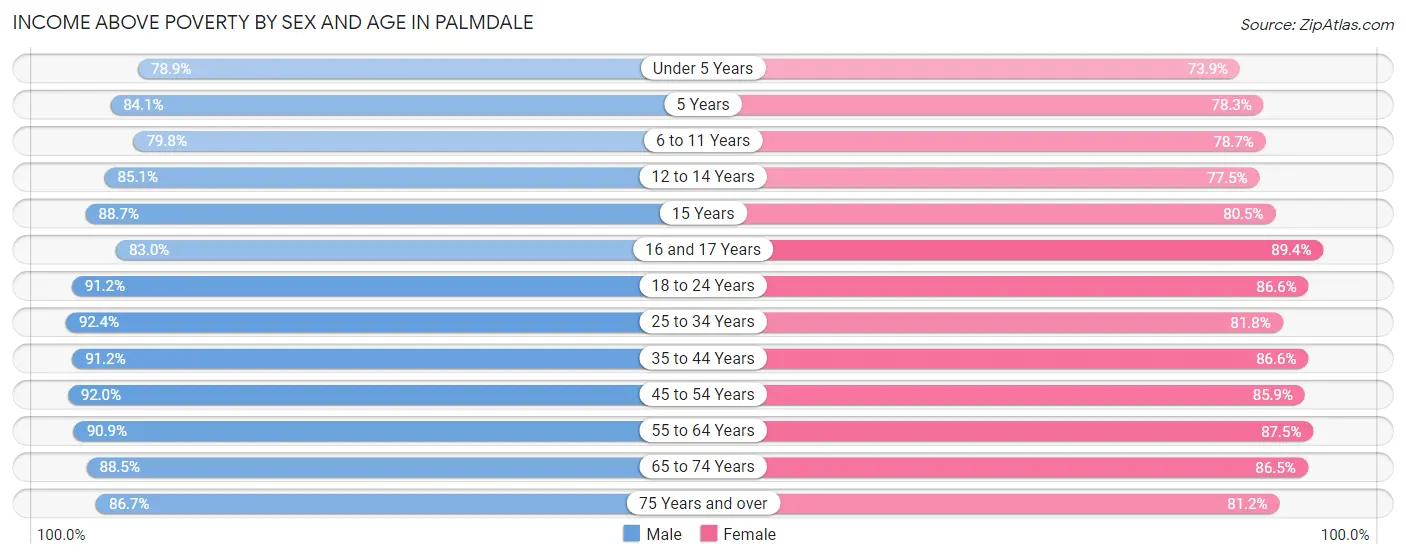
| Age Bracket | Male | Female |
| Under 5 Years | 4,486 (78.9%) | 4,344 (73.9%) |
| 5 Years | 1,063 (84.1%) | 1,060 (78.3%) |
| 6 to 11 Years | 6,555 (79.8%) | 5,759 (78.7%) |
| 12 to 14 Years | 4,224 (85.1%) | 3,208 (77.5%) |
| 15 Years | 1,489 (88.7%) | 1,227 (80.5%) |
| 16 and 17 Years | 2,580 (83.0%) | 2,058 (89.4%) |
| 18 to 24 Years | 7,826 (91.2%) | 7,142 (86.6%) |
| 25 to 34 Years | 10,805 (92.3%) | 9,253 (81.8%) |
| 35 to 44 Years | 9,456 (91.1%) | 9,652 (86.6%) |
| 45 to 54 Years | 9,245 (92.0%) | 9,301 (85.9%) |
| 55 to 64 Years | 8,225 (90.9%) | 8,646 (87.5%) |
| 65 to 74 Years | 4,588 (88.5%) | 5,498 (86.5%) |
| 75 Years and over | 2,111 (86.7%) | 2,786 (81.2%) |
| Total | 72,653 (88.3%) | 69,934 (83.5%) |
Income Below Poverty Among Married-Couple Families in Palmdale
The poverty statistics for married-couple families in Palmdale show that 6.4% or 1,593 of the total 25,019 families live below the poverty line. Families with 5 or more children have the highest poverty rate of 32.0%, comprising of 126 families. On the other hand, families with 1 or 2 children have the lowest poverty rate of 3.6%, which includes 328 families.
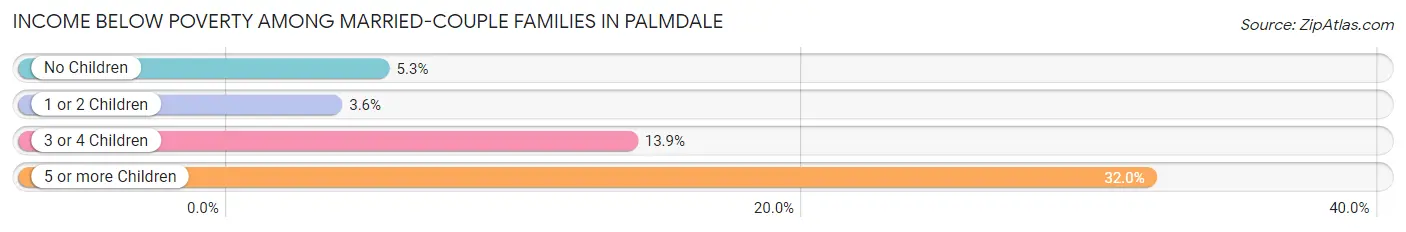
| Children | Above Poverty | Below Poverty |
| No Children | 11,310 (94.7%) | 630 (5.3%) |
| 1 or 2 Children | 8,701 (96.4%) | 328 (3.6%) |
| 3 or 4 Children | 3,147 (86.1%) | 509 (13.9%) |
| 5 or more Children | 268 (68.0%) | 126 (32.0%) |
| Total | 23,426 (93.6%) | 1,593 (6.4%) |
Income Below Poverty Among Single-Parent Households in Palmdale
According to the poverty data in Palmdale, 8.6% or 363 single-father households and 29.0% or 2,531 single-mother households are living below the poverty line. Among single-father households, those with 5 or more children have the highest poverty rate, with 57 households (41.9%) experiencing poverty. Likewise, among single-mother households, those with 3 or 4 children have the highest poverty rate, with 613 households (56.0%) falling below the poverty line.
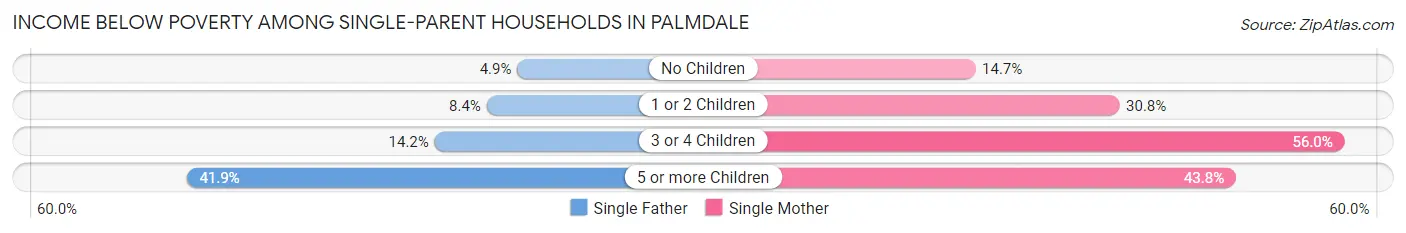
| Children | Single Father | Single Mother |
| No Children | 86 (4.9%) | 418 (14.7%) |
| 1 or 2 Children | 160 (8.4%) | 1,404 (30.8%) |
| 3 or 4 Children | 60 (14.2%) | 613 (56.0%) |
| 5 or more Children | 57 (41.9%) | 96 (43.8%) |
| Total | 363 (8.6%) | 2,531 (29.0%) |
Income Below Poverty Among Married-Couple vs Single-Parent Households in Palmdale
The poverty data for Palmdale shows that 1,593 of the married-couple family households (6.4%) and 2,894 of the single-parent households (22.4%) are living below the poverty level. Within the married-couple family households, those with 5 or more children have the highest poverty rate, with 126 households (32.0%) falling below the poverty line. Among the single-parent households, those with 3 or 4 children have the highest poverty rate, with 673 household (44.3%) living below poverty.
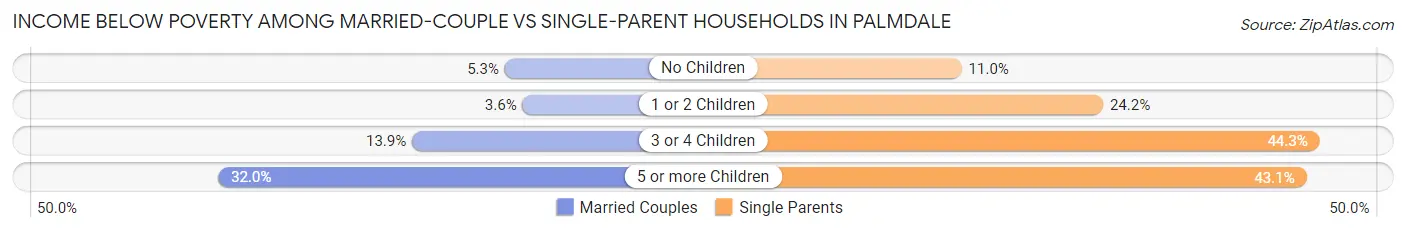
| Children | Married-Couple Families | Single-Parent Households |
| No Children | 630 (5.3%) | 504 (11.0%) |
| 1 or 2 Children | 328 (3.6%) | 1,564 (24.1%) |
| 3 or 4 Children | 509 (13.9%) | 673 (44.3%) |
| 5 or more Children | 126 (32.0%) | 153 (43.1%) |
| Total | 1,593 (6.4%) | 2,894 (22.4%) |
Race in Palmdale
The most populous races in Palmdale are Hispanic or Latino (105,134 | 63.0%), White / Caucasian (58,860 | 35.3%), and Some other Race (51,999 | 31.2%).
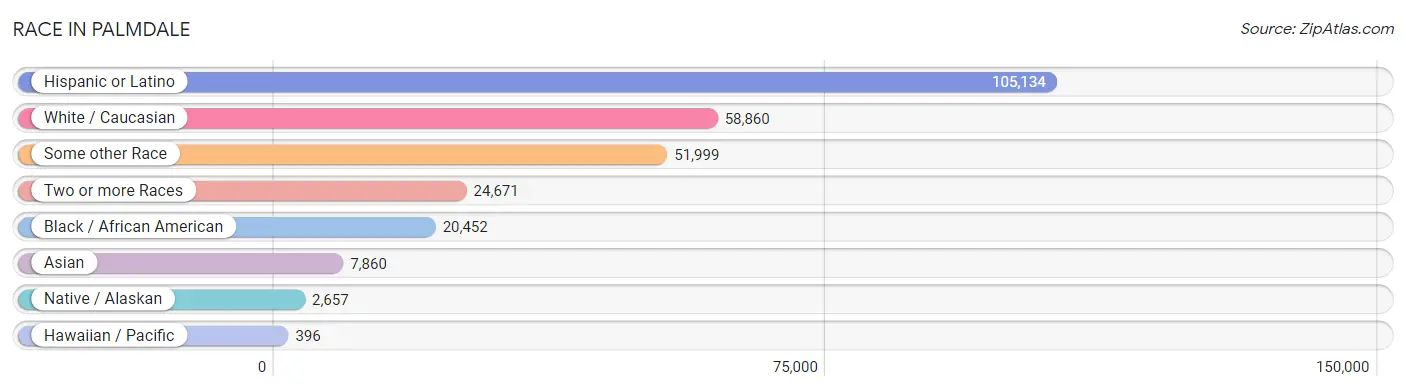
| Race | # Population | % Population |
| Asian | 7,860 | 4.7% |
| Black / African American | 20,452 | 12.2% |
| Hawaiian / Pacific | 396 | 0.2% |
| Hispanic or Latino | 105,134 | 63.0% |
| Native / Alaskan | 2,657 | 1.6% |
| White / Caucasian | 58,860 | 35.3% |
| Two or more Races | 24,671 | 14.8% |
| Some other Race | 51,999 | 31.2% |
| Total | 166,895 | 100.0% |
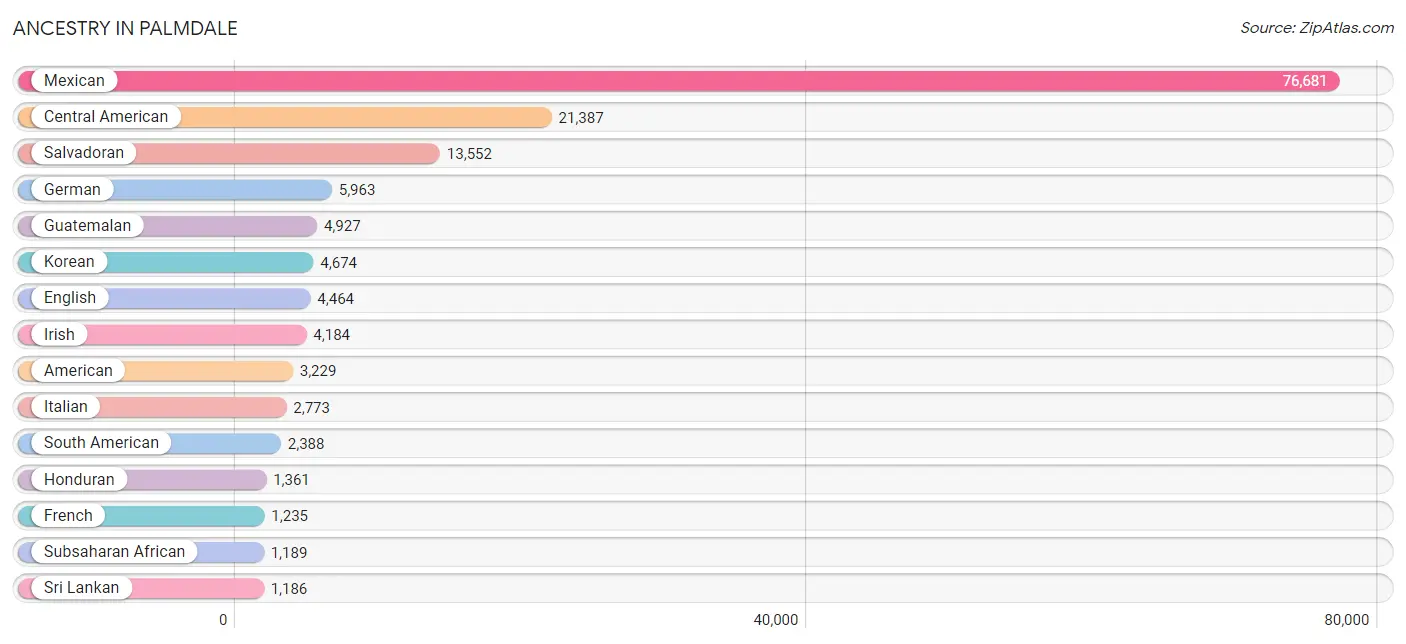
Ancestry in Palmdale
The most populous ancestries reported in Palmdale are Mexican (76,681 | 46.0%), Central American (21,387 | 12.8%), Salvadoran (13,552 | 8.1%), German (5,963 | 3.6%), and Guatemalan (4,927 | 2.9%), together accounting for 73.4% of all Palmdale residents.
| Ancestry | # Population | % Population |
| Afghan | 40 | 0.0% |
| African | 644 | 0.4% |
| American | 3,229 | 1.9% |
| Apache | 170 | 0.1% |
| Arab | 730 | 0.4% |
| Argentinean | 721 | 0.4% |
| Armenian | 1,045 | 0.6% |
| Australian | 8 | 0.0% |
| Austrian | 52 | 0.0% |
| Barbadian | 26 | 0.0% |
| Basque | 6 | 0.0% |
| Belizean | 153 | 0.1% |
| Bhutanese | 630 | 0.4% |
| Blackfeet | 207 | 0.1% |
| Bolivian | 37 | 0.0% |
| Brazilian | 85 | 0.1% |
| British | 312 | 0.2% |
| Burmese | 628 | 0.4% |
| Cambodian | 30 | 0.0% |
| Canadian | 201 | 0.1% |
| Carpatho Rusyn | 6 | 0.0% |
| Central American | 21,387 | 12.8% |
| Central American Indian | 903 | 0.5% |
| Cherokee | 306 | 0.2% |
| Chickasaw | 26 | 0.0% |
| Chilean | 81 | 0.1% |
| Chippewa | 7 | 0.0% |
| Choctaw | 264 | 0.2% |
| Colombian | 256 | 0.2% |
| Comanche | 5 | 0.0% |
| Costa Rican | 154 | 0.1% |
| Creek | 24 | 0.0% |
| Croatian | 62 | 0.0% |
| Cuban | 423 | 0.3% |
| Czech | 525 | 0.3% |
| Czechoslovakian | 288 | 0.2% |
| Danish | 252 | 0.2% |
| Dominican | 137 | 0.1% |
| Dutch | 308 | 0.2% |
| Eastern European | 160 | 0.1% |
| Ecuadorian | 311 | 0.2% |
| Egyptian | 289 | 0.2% |
| English | 4,464 | 2.7% |
| Ethiopian | 43 | 0.0% |
| European | 1,024 | 0.6% |
| Finnish | 248 | 0.2% |
| French | 1,235 | 0.7% |
| French Canadian | 229 | 0.1% |
| German | 5,963 | 3.6% |
| Ghanaian | 44 | 0.0% |
| Greek | 74 | 0.0% |
| Guamanian / Chamorro | 139 | 0.1% |
| Guatemalan | 4,927 | 2.9% |
| Haitian | 118 | 0.1% |
| Honduran | 1,361 | 0.8% |
| Hungarian | 426 | 0.3% |
| Icelander | 9 | 0.0% |
| Indian (Asian) | 620 | 0.4% |
| Iranian | 306 | 0.2% |
| Iraqi | 7 | 0.0% |
| Irish | 4,184 | 2.5% |
| Iroquois | 20 | 0.0% |
| Italian | 2,773 | 1.7% |
| Jamaican | 112 | 0.1% |
| Japanese | 213 | 0.1% |
| Jordanian | 123 | 0.1% |
| Korean | 4,674 | 2.8% |
| Laotian | 57 | 0.0% |
| Latvian | 6 | 0.0% |
| Lebanese | 25 | 0.0% |
| Lithuanian | 163 | 0.1% |
| Luxembourger | 74 | 0.0% |
| Malaysian | 44 | 0.0% |
| Maltese | 18 | 0.0% |
| Menominee | 13 | 0.0% |
| Mexican | 76,681 | 46.0% |
| Mexican American Indian | 742 | 0.4% |
| Mongolian | 31 | 0.0% |
| Moroccan | 34 | 0.0% |
| Native Hawaiian | 287 | 0.2% |
| Navajo | 70 | 0.0% |
| Nicaraguan | 829 | 0.5% |
| Nigerian | 432 | 0.3% |
| Northern European | 186 | 0.1% |
| Norwegian | 870 | 0.5% |
| Paiute | 18 | 0.0% |
| Pakistani | 86 | 0.1% |
| Palestinian | 42 | 0.0% |
| Panamanian | 61 | 0.0% |
| Pennsylvania German | 7 | 0.0% |
| Peruvian | 943 | 0.6% |
| Polish | 862 | 0.5% |
| Portuguese | 696 | 0.4% |
| Pueblo | 160 | 0.1% |
| Puerto Rican | 865 | 0.5% |
| Romanian | 86 | 0.1% |
| Russian | 951 | 0.6% |
| Salvadoran | 13,552 | 8.1% |
| Samoan | 209 | 0.1% |
| Scandinavian | 220 | 0.1% |
| Scotch-Irish | 209 | 0.1% |
| Scottish | 892 | 0.5% |
| Serbian | 37 | 0.0% |
| Sioux | 13 | 0.0% |
| Slavic | 11 | 0.0% |
| Slovak | 9 | 0.0% |
| Slovene | 45 | 0.0% |
| South African | 7 | 0.0% |
| South American | 2,388 | 1.4% |
| Spaniard | 289 | 0.2% |
| Spanish | 204 | 0.1% |
| Spanish American | 88 | 0.1% |
| Sri Lankan | 1,186 | 0.7% |
| Subsaharan African | 1,189 | 0.7% |
| Swedish | 644 | 0.4% |
| Swiss | 31 | 0.0% |
| Syrian | 10 | 0.0% |
| Thai | 632 | 0.4% |
| Tohono O'Odham | 24 | 0.0% |
| Tongan | 42 | 0.0% |
| Turkish | 124 | 0.1% |
| Ugandan | 7 | 0.0% |
| Ukrainian | 184 | 0.1% |
| Uruguayan | 9 | 0.0% |
| Venezuelan | 6 | 0.0% |
| Vietnamese | 106 | 0.1% |
| Welsh | 182 | 0.1% |
| West Indian | 59 | 0.0% |
| Yaqui | 139 | 0.1% |
| Yugoslavian | 17 | 0.0% | View All 130 Rows |
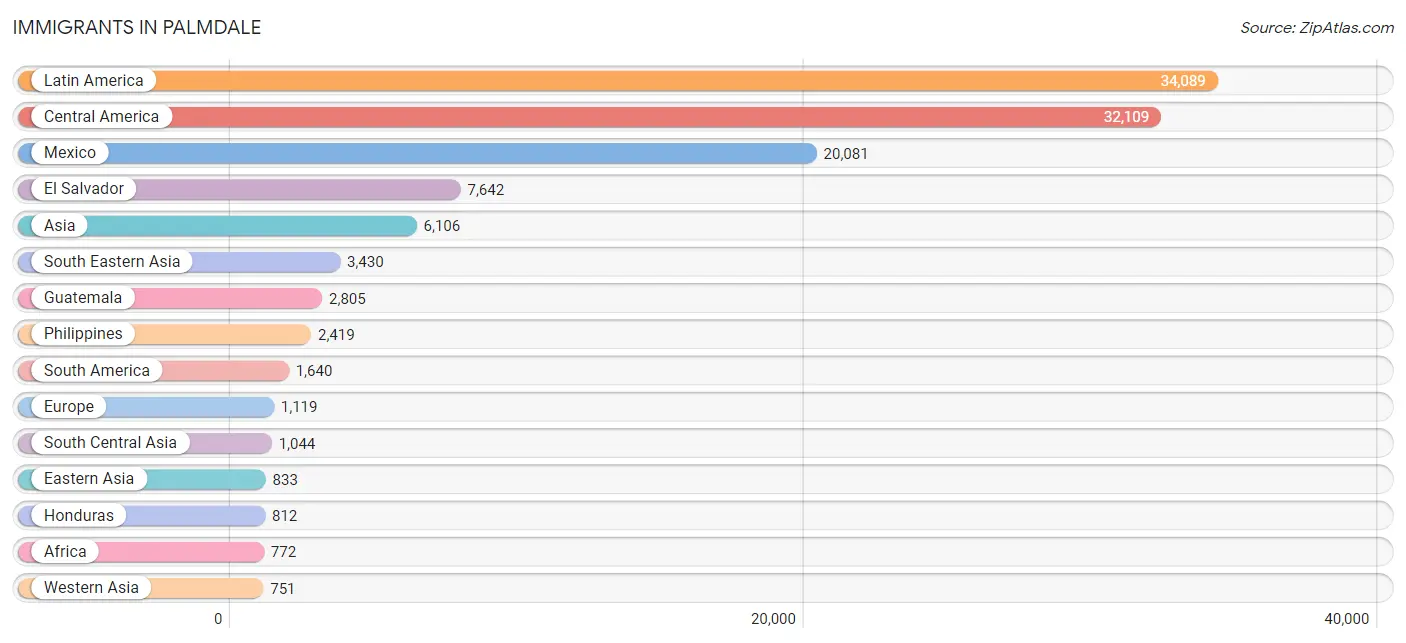
Immigrants in Palmdale
The most numerous immigrant groups reported in Palmdale came from Latin America (34,089 | 20.4%), Central America (32,109 | 19.2%), Mexico (20,081 | 12.0%), El Salvador (7,642 | 4.6%), and Asia (6,106 | 3.7%), together accounting for 59.9% of all Palmdale residents.
| Immigration Origin | # Population | % Population |
| Afghanistan | 54 | 0.0% |
| Africa | 772 | 0.5% |
| Argentina | 380 | 0.2% |
| Armenia | 324 | 0.2% |
| Asia | 6,106 | 3.7% |
| Australia | 30 | 0.0% |
| Austria | 10 | 0.0% |
| Azores | 11 | 0.0% |
| Bangladesh | 113 | 0.1% |
| Belarus | 9 | 0.0% |
| Belize | 181 | 0.1% |
| Bolivia | 26 | 0.0% |
| Bosnia and Herzegovina | 17 | 0.0% |
| Brazil | 25 | 0.0% |
| Bulgaria | 17 | 0.0% |
| Cambodia | 198 | 0.1% |
| Cameroon | 18 | 0.0% |
| Canada | 98 | 0.1% |
| Caribbean | 340 | 0.2% |
| Central America | 32,109 | 19.2% |
| Chile | 78 | 0.1% |
| China | 184 | 0.1% |
| Colombia | 214 | 0.1% |
| Costa Rica | 116 | 0.1% |
| Cuba | 141 | 0.1% |
| Denmark | 5 | 0.0% |
| Dominican Republic | 101 | 0.1% |
| Eastern Africa | 241 | 0.1% |
| Eastern Asia | 833 | 0.5% |
| Eastern Europe | 545 | 0.3% |
| Ecuador | 289 | 0.2% |
| Egypt | 132 | 0.1% |
| El Salvador | 7,642 | 4.6% |
| England | 38 | 0.0% |
| Ethiopia | 80 | 0.1% |
| Europe | 1,119 | 0.7% |
| Fiji | 7 | 0.0% |
| France | 48 | 0.0% |
| Germany | 146 | 0.1% |
| Ghana | 68 | 0.0% |
| Guatemala | 2,805 | 1.7% |
| Guyana | 90 | 0.1% |
| Honduras | 812 | 0.5% |
| Hong Kong | 7 | 0.0% |
| Hungary | 171 | 0.1% |
| India | 204 | 0.1% |
| Indonesia | 45 | 0.0% |
| Iran | 338 | 0.2% |
| Iraq | 154 | 0.1% |
| Ireland | 11 | 0.0% |
| Israel | 6 | 0.0% |
| Italy | 53 | 0.0% |
| Jamaica | 80 | 0.1% |
| Japan | 210 | 0.1% |
| Jordan | 18 | 0.0% |
| Korea | 404 | 0.2% |
| Kuwait | 91 | 0.1% |
| Laos | 32 | 0.0% |
| Latin America | 34,089 | 20.4% |
| Lebanon | 5 | 0.0% |
| Malaysia | 36 | 0.0% |
| Mexico | 20,081 | 12.0% |
| Middle Africa | 18 | 0.0% |
| Morocco | 18 | 0.0% |
| Nepal | 17 | 0.0% |
| Netherlands | 21 | 0.0% |
| Nicaragua | 472 | 0.3% |
| Nigeria | 212 | 0.1% |
| Northern Africa | 190 | 0.1% |
| Northern Europe | 278 | 0.2% |
| Oceania | 55 | 0.0% |
| Pakistan | 172 | 0.1% |
| Peru | 523 | 0.3% |
| Philippines | 2,419 | 1.5% |
| Portugal | 11 | 0.0% |
| Romania | 41 | 0.0% |
| Russia | 194 | 0.1% |
| Scotland | 52 | 0.0% |
| South America | 1,640 | 1.0% |
| South Central Asia | 1,044 | 0.6% |
| South Eastern Asia | 3,430 | 2.1% |
| Southern Europe | 71 | 0.0% |
| Spain | 7 | 0.0% |
| Sri Lanka | 123 | 0.1% |
| Syria | 101 | 0.1% |
| Taiwan | 63 | 0.0% |
| Thailand | 71 | 0.0% |
| Trinidad and Tobago | 16 | 0.0% |
| Turkey | 30 | 0.0% |
| Uganda | 21 | 0.0% |
| Ukraine | 96 | 0.1% |
| Uruguay | 9 | 0.0% |
| Venezuela | 6 | 0.0% |
| Vietnam | 629 | 0.4% |
| West Indies | 2 | 0.0% |
| Western Africa | 290 | 0.2% |
| Western Asia | 751 | 0.4% |
| Western Europe | 225 | 0.1% | View All 98 Rows |
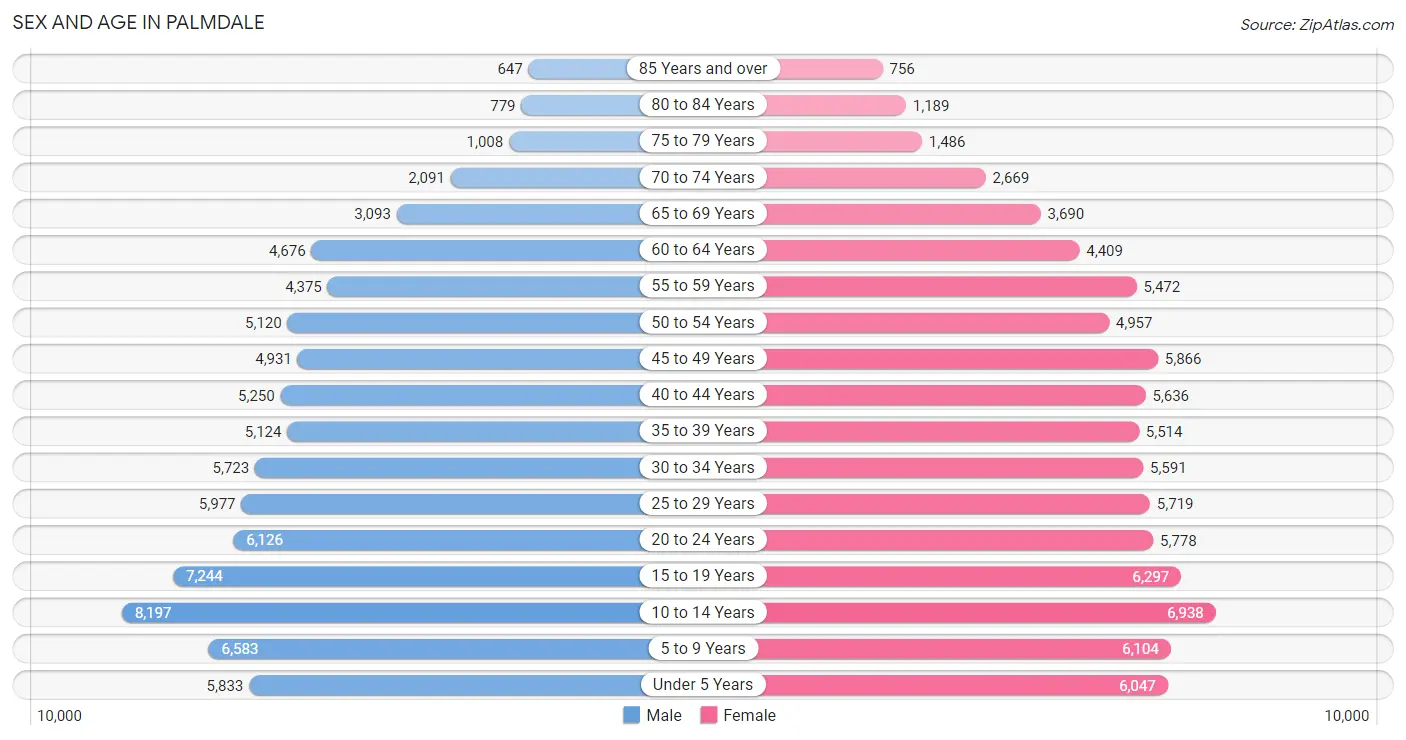
Sex and Age in Palmdale
Sex and Age in Palmdale
The most populous age groups in Palmdale are 10 to 14 Years (8,197 | 9.9%) for men and 10 to 14 Years (6,938 | 8.3%) for women.
| Age Bracket | Male | Female |
| Under 5 Years | 5,833 (7.0%) | 6,047 (7.2%) |
| 5 to 9 Years | 6,583 (8.0%) | 6,104 (7.3%) |
| 10 to 14 Years | 8,197 (9.9%) | 6,938 (8.3%) |
| 15 to 19 Years | 7,244 (8.7%) | 6,297 (7.5%) |
| 20 to 24 Years | 6,126 (7.4%) | 5,778 (6.9%) |
| 25 to 29 Years | 5,977 (7.2%) | 5,719 (6.8%) |
| 30 to 34 Years | 5,723 (6.9%) | 5,591 (6.7%) |
| 35 to 39 Years | 5,124 (6.2%) | 5,514 (6.6%) |
| 40 to 44 Years | 5,250 (6.3%) | 5,636 (6.7%) |
| 45 to 49 Years | 4,931 (6.0%) | 5,866 (7.0%) |
| 50 to 54 Years | 5,120 (6.2%) | 4,957 (5.9%) |
| 55 to 59 Years | 4,375 (5.3%) | 5,472 (6.5%) |
| 60 to 64 Years | 4,676 (5.7%) | 4,409 (5.2%) |
| 65 to 69 Years | 3,093 (3.7%) | 3,690 (4.4%) |
| 70 to 74 Years | 2,091 (2.5%) | 2,669 (3.2%) |
| 75 to 79 Years | 1,008 (1.2%) | 1,486 (1.8%) |
| 80 to 84 Years | 779 (0.9%) | 1,189 (1.4%) |
| 85 Years and over | 647 (0.8%) | 756 (0.9%) |
| Total | 82,777 (100.0%) | 84,118 (100.0%) |
Families and Households in Palmdale
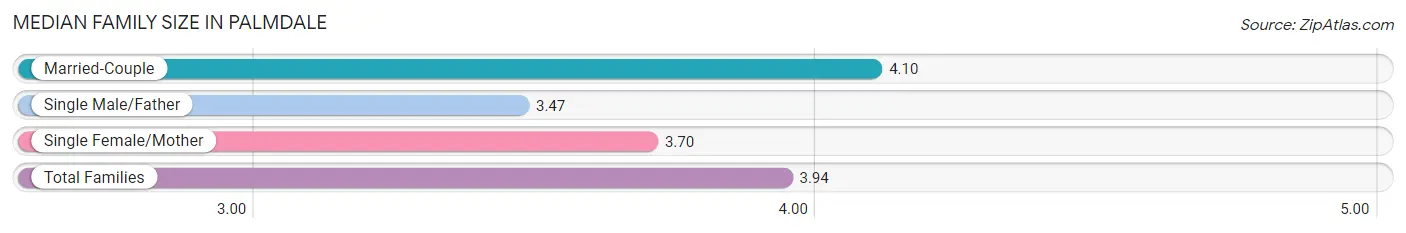
Median Family Size in Palmdale
The median family size in Palmdale is 3.94 persons per family, with married-couple families (25,019 | 65.9%) accounting for the largest median family size of 4.1 persons per family. On the other hand, single male/father families (4,212 | 11.1%) represent the smallest median family size with 3.47 persons per family.
| Family Type | # Families | Family Size |
| Married-Couple | 25,019 (65.9%) | 4.10 |
| Single Male/Father | 4,212 (11.1%) | 3.47 |
| Single Female/Mother | 8,722 (23.0%) | 3.70 |
| Total Families | 37,953 (100.0%) | 3.94 |
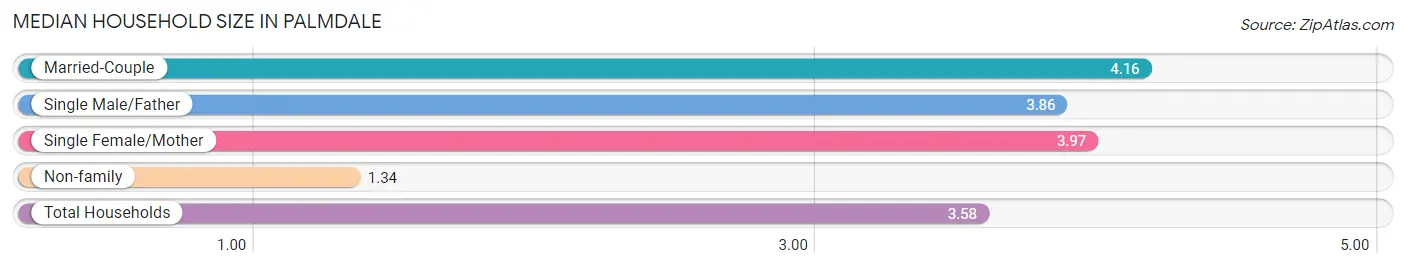
Median Household Size in Palmdale
The median household size in Palmdale is 3.58 persons per household, with married-couple households (25,019 | 53.7%) accounting for the largest median household size of 4.16 persons per household. non-family households (8,635 | 18.5%) represent the smallest median household size with 1.34 persons per household.
| Household Type | # Households | Household Size |
| Married-Couple | 25,019 (53.7%) | 4.16 |
| Single Male/Father | 4,212 (9.0%) | 3.86 |
| Single Female/Mother | 8,722 (18.7%) | 3.97 |
| Non-family | 8,635 (18.5%) | 1.34 |
| Total Households | 46,588 (100.0%) | 3.58 |
Household Size by Marriage Status in Palmdale
Out of a total of 46,588 households in Palmdale, 37,953 (81.5%) are family households, while 8,635 (18.5%) are nonfamily households. The most numerous type of family households are 2-person households, comprising 9,066, and the most common type of nonfamily households are 1-person households, comprising 6,713.
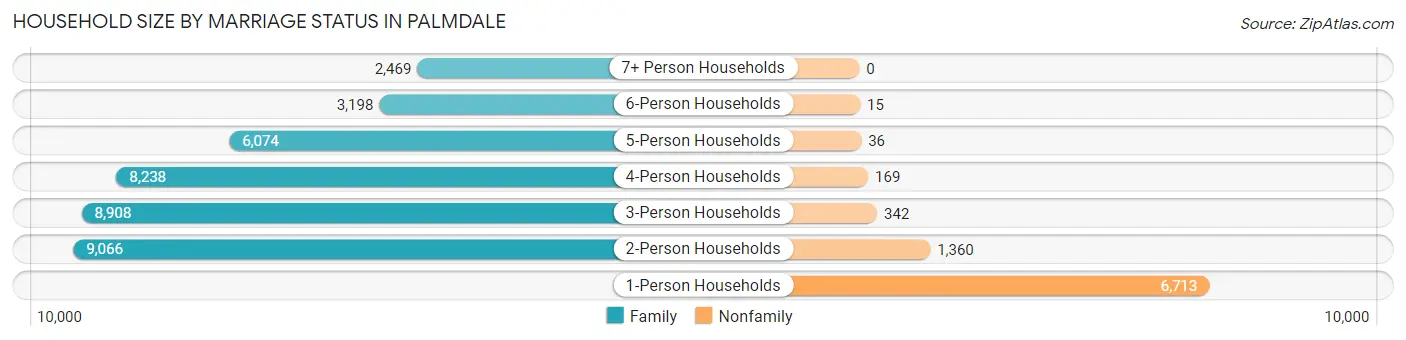
| Household Size | Family Households | Nonfamily Households |
| 1-Person Households | - | 6,713 (14.4%) |
| 2-Person Households | 9,066 (19.5%) | 1,360 (2.9%) |
| 3-Person Households | 8,908 (19.1%) | 342 (0.7%) |
| 4-Person Households | 8,238 (17.7%) | 169 (0.4%) |
| 5-Person Households | 6,074 (13.0%) | 36 (0.1%) |
| 6-Person Households | 3,198 (6.9%) | 15 (0.0%) |
| 7+ Person Households | 2,469 (5.3%) | 0 (0.0%) |
| Total | 37,953 (81.5%) | 8,635 (18.5%) |
Female Fertility in Palmdale
Fertility by Age in Palmdale
Average fertility rate in Palmdale is 60.0 births per 1,000 women. Women in the age bracket of 20 to 34 years have the highest fertility rate with 101.0 births per 1,000 women. Women in the age bracket of 20 to 34 years acount for 70.3% of all women with births.
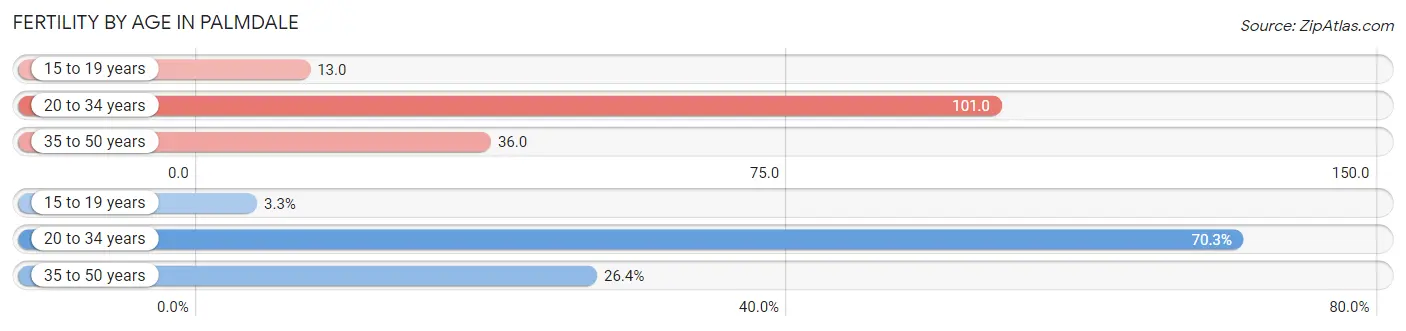
| Age Bracket | Women with Births | Births / 1,000 Women |
| 15 to 19 years | 82 (3.3%) | 13.0 |
| 20 to 34 years | 1,733 (70.3%) | 101.0 |
| 35 to 50 years | 651 (26.4%) | 36.0 |
| Total | 2,466 (100.0%) | 60.0 |
Fertility by Age by Marriage Status in Palmdale
64.1% of women with births (2,466) in Palmdale are married. The highest percentage of unmarried women with births falls into 15 to 19 years age bracket with 100.0% of them unmarried at the time of birth, while the lowest percentage of unmarried women with births belong to 35 to 50 years age bracket with 20.3% of them unmarried.
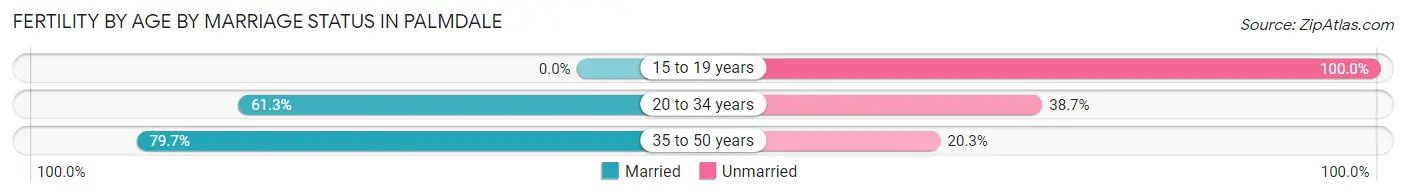
| Age Bracket | Married | Unmarried |
| 15 to 19 years | 0 (0.0%) | 82 (100.0%) |
| 20 to 34 years | 1,062 (61.3%) | 671 (38.7%) |
| 35 to 50 years | 519 (79.7%) | 132 (20.3%) |
| Total | 1,581 (64.1%) | 885 (35.9%) |
Fertility by Education in Palmdale
Average fertility rate in Palmdale is 60.0 births per 1,000 women. Women with the education attainment of graduate degree have the highest fertility rate of 100.0 births per 1,000 women, while women with the education attainment of less than high school have the lowest fertility at 41.0 births per 1,000 women. Women with the education attainment of college or associate's degree represent 44.4% of all women with births.
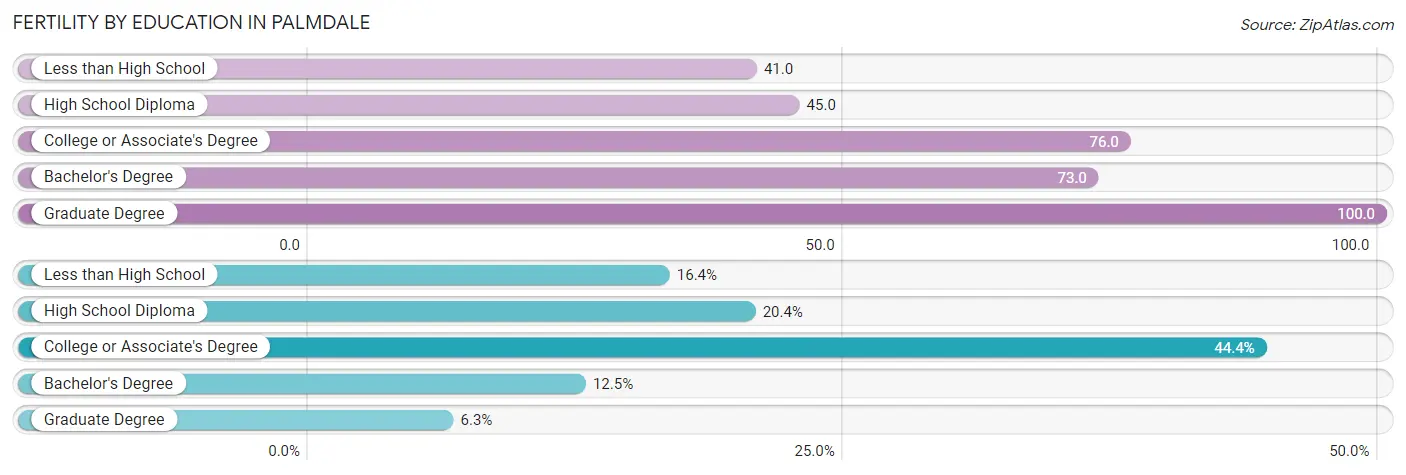
| Educational Attainment | Women with Births | Births / 1,000 Women |
| Less than High School | 405 (16.4%) | 41.0 |
| High School Diploma | 504 (20.4%) | 45.0 |
| College or Associate's Degree | 1,094 (44.4%) | 76.0 |
| Bachelor's Degree | 308 (12.5%) | 73.0 |
| Graduate Degree | 155 (6.3%) | 100.0 |
| Total | 2,466 (100.0%) | 60.0 |
Fertility by Education by Marriage Status in Palmdale
35.9% of women with births in Palmdale are unmarried. Women with the educational attainment of graduate degree are most likely to be married with 100.0% of them married at childbirth, while women with the educational attainment of less than high school are least likely to be married with 46.2% of them unmarried at childbirth.
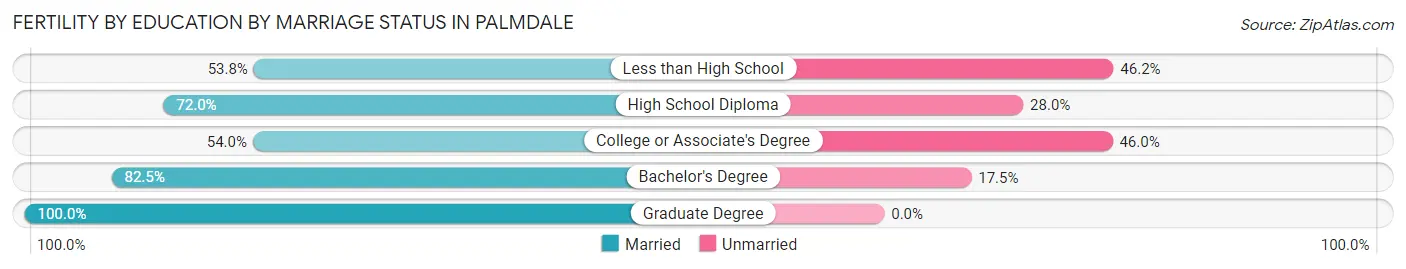
| Educational Attainment | Married | Unmarried |
| Less than High School | 218 (53.8%) | 187 (46.2%) |
| High School Diploma | 363 (72.0%) | 141 (28.0%) |
| College or Associate's Degree | 591 (54.0%) | 503 (46.0%) |
| Bachelor's Degree | 254 (82.5%) | 54 (17.5%) |
| Graduate Degree | 155 (100.0%) | 0 (0.0%) |
| Total | 1,581 (64.1%) | 885 (35.9%) |
Employment Characteristics in Palmdale
Employment by Class of Employer in Palmdale
Among the 68,272 employed individuals in Palmdale, private company employees (45,594 | 66.8%), local government employees (6,649 | 9.7%), and self-employed (not incorporated) (5,555 | 8.1%) make up the most common classes of employment.
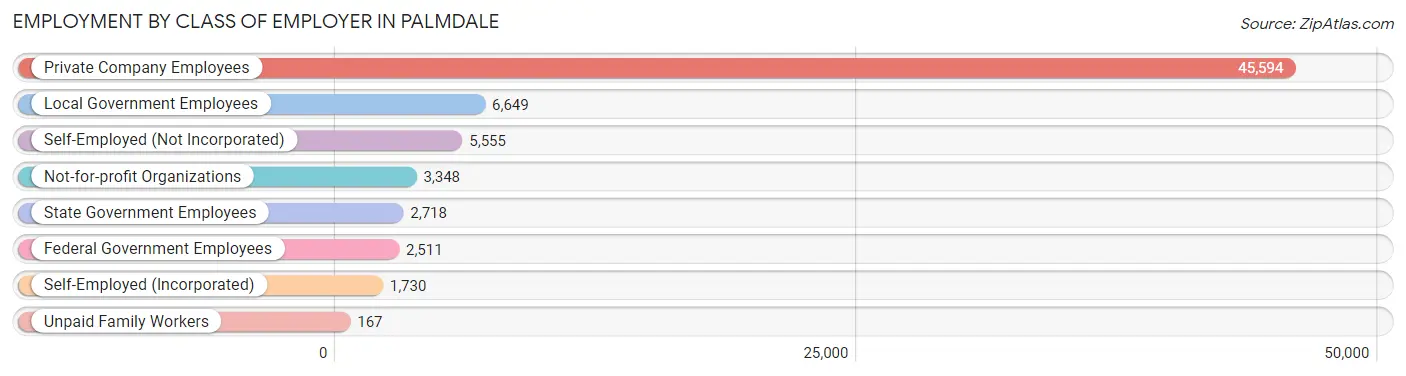
| Employer Class | # Employees | % Employees |
| Private Company Employees | 45,594 | 66.8% |
| Self-Employed (Incorporated) | 1,730 | 2.5% |
| Self-Employed (Not Incorporated) | 5,555 | 8.1% |
| Not-for-profit Organizations | 3,348 | 4.9% |
| Local Government Employees | 6,649 | 9.7% |
| State Government Employees | 2,718 | 4.0% |
| Federal Government Employees | 2,511 | 3.7% |
| Unpaid Family Workers | 167 | 0.2% |
| Total | 68,272 | 100.0% |
Employment Status by Age in Palmdale
According to the labor force statistics for Palmdale, out of the total population over 16 years of age (123,987), 61.1% or 75,756 individuals are in the labor force, with 7.4% or 5,606 of them unemployed. The age group with the highest labor force participation rate is 35 to 44 years, with 77.4% or 16,660 individuals in the labor force. Within the labor force, the 16 to 19 years age range has the highest percentage of unemployed individuals, with 23.4% or 660 of them being unemployed.
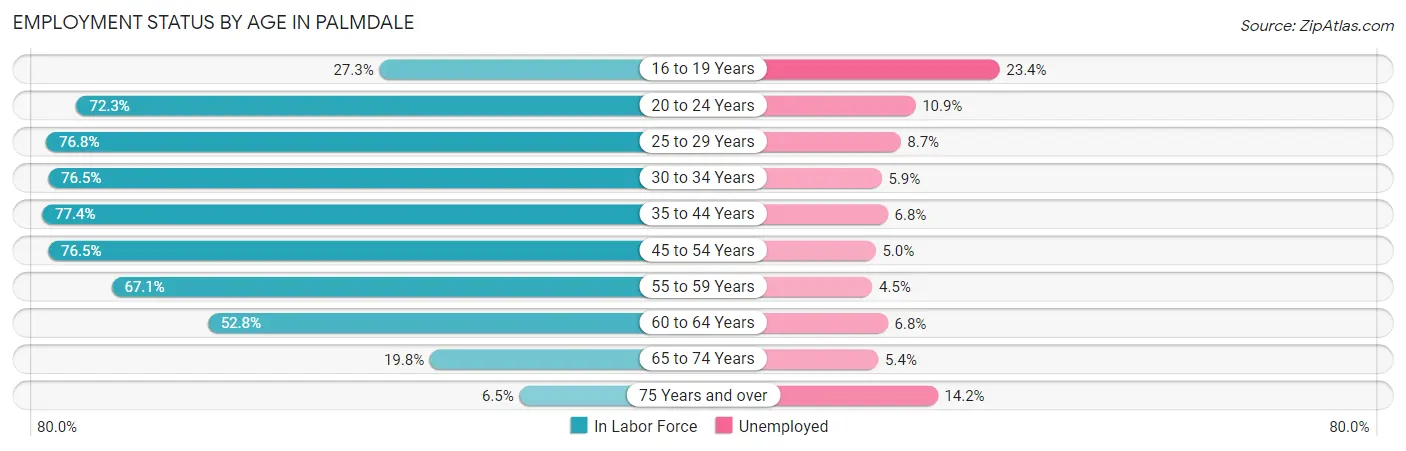
| Age Bracket | In Labor Force | Unemployed |
| 16 to 19 Years | 2,821 (27.3%) | 660 (23.4%) |
| 20 to 24 Years | 8,607 (72.3%) | 938 (10.9%) |
| 25 to 29 Years | 8,983 (76.8%) | 782 (8.7%) |
| 30 to 34 Years | 8,655 (76.5%) | 511 (5.9%) |
| 35 to 44 Years | 16,660 (77.4%) | 1,133 (6.8%) |
| 45 to 54 Years | 15,969 (76.5%) | 798 (5.0%) |
| 55 to 59 Years | 6,607 (67.1%) | 297 (4.5%) |
| 60 to 64 Years | 4,797 (52.8%) | 326 (6.8%) |
| 65 to 74 Years | 2,286 (19.8%) | 123 (5.4%) |
| 75 Years and over | 381 (6.5%) | 54 (14.2%) |
| Total | 75,756 (61.1%) | 5,606 (7.4%) |
Employment Status by Educational Attainment in Palmdale
According to labor force statistics for Palmdale, 73.1% of individuals (61,653) out of the total population between 25 and 64 years of age (84,340) are in the labor force, with 6.2% or 3,822 of them being unemployed. The group with the highest labor force participation rate are those with the educational attainment of bachelor's degree or higher, with 85.9% or 11,817 individuals in the labor force. Within the labor force, individuals with less than high school education have the highest percentage of unemployment, with 9.6% or 1,114 of them being unemployed.
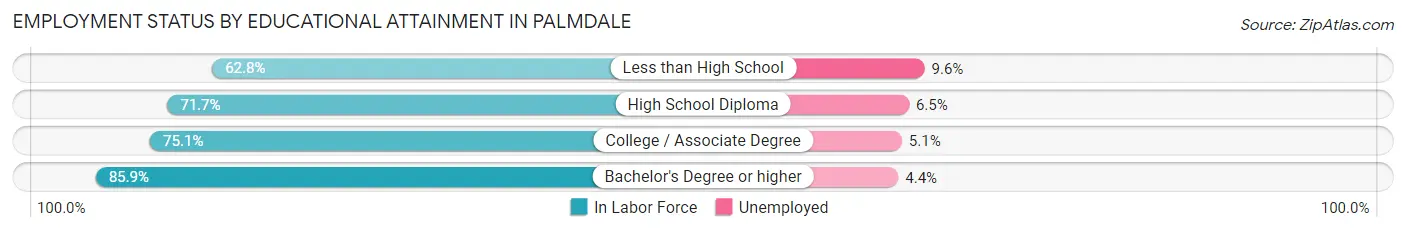
| Educational Attainment | In Labor Force | Unemployed |
| Less than High School | 11,602 (62.8%) | 1,774 (9.6%) |
| High School Diploma | 18,669 (71.7%) | 1,692 (6.5%) |
| College / Associate Degree | 19,579 (75.1%) | 1,330 (5.1%) |
| Bachelor's Degree or higher | 11,817 (85.9%) | 605 (4.4%) |
| Total | 61,653 (73.1%) | 5,229 (6.2%) |
Employment Occupations by Sex in Palmdale
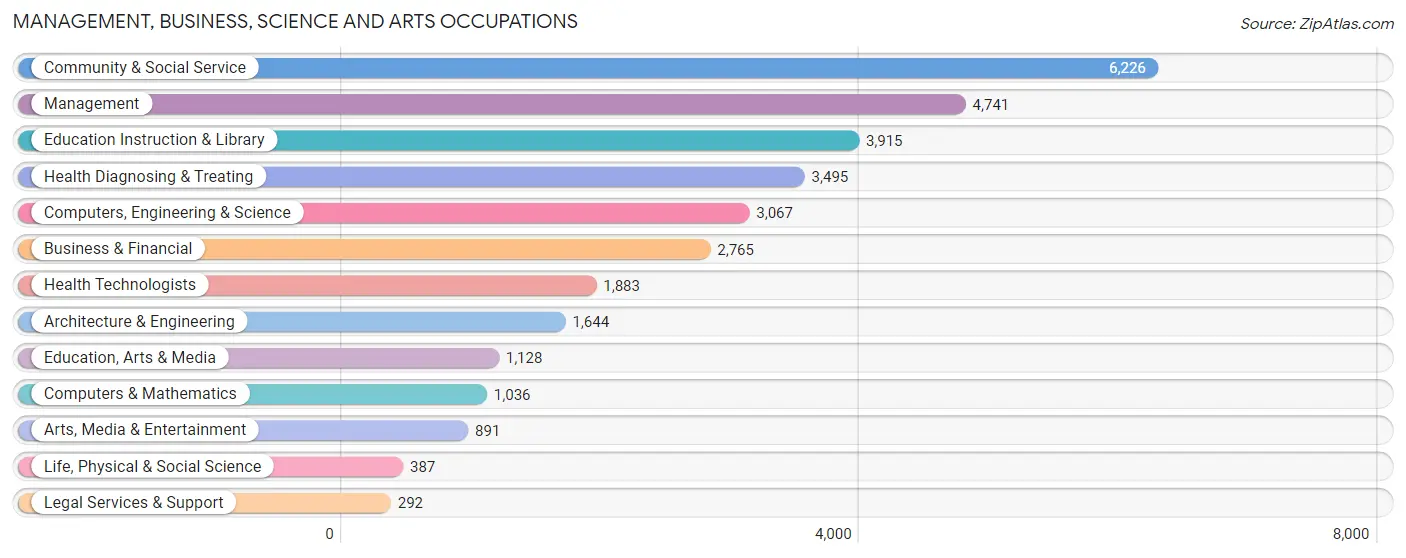
Management, Business, Science and Arts Occupations
The most common Management, Business, Science and Arts occupations in Palmdale are Community & Social Service (6,226 | 8.9%), Management (4,741 | 6.8%), Education Instruction & Library (3,915 | 5.6%), Health Diagnosing & Treating (3,495 | 5.0%), and Computers, Engineering & Science (3,067 | 4.4%).
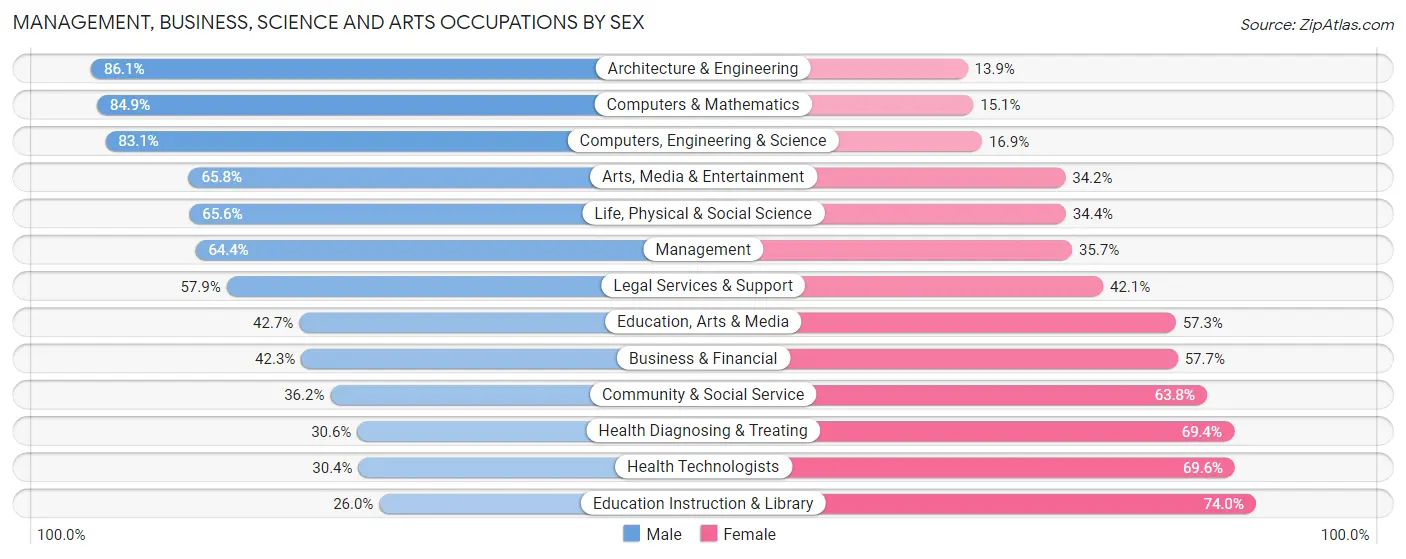
Management, Business, Science and Arts Occupations by Sex
Within the Management, Business, Science and Arts occupations in Palmdale, the most male-oriented occupations are Architecture & Engineering (86.1%), Computers & Mathematics (84.9%), and Computers, Engineering & Science (83.1%), while the most female-oriented occupations are Education Instruction & Library (74.0%), Health Technologists (69.6%), and Health Diagnosing & Treating (69.4%).
| Occupation | Male | Female |
| Management | 3,051 (64.3%) | 1,690 (35.6%) |
| Business & Financial | 1,170 (42.3%) | 1,595 (57.7%) |
| Computers, Engineering & Science | 2,550 (83.1%) | 517 (16.9%) |
| Computers & Mathematics | 880 (84.9%) | 156 (15.1%) |
| Architecture & Engineering | 1,416 (86.1%) | 228 (13.9%) |
| Life, Physical & Social Science | 254 (65.6%) | 133 (34.4%) |
| Community & Social Service | 2,256 (36.2%) | 3,970 (63.8%) |
| Education, Arts & Media | 482 (42.7%) | 646 (57.3%) |
| Legal Services & Support | 169 (57.9%) | 123 (42.1%) |
| Education Instruction & Library | 1,019 (26.0%) | 2,896 (74.0%) |
| Arts, Media & Entertainment | 586 (65.8%) | 305 (34.2%) |
| Health Diagnosing & Treating | 1,070 (30.6%) | 2,425 (69.4%) |
| Health Technologists | 572 (30.4%) | 1,311 (69.6%) |
| Total (Category) | 10,097 (49.7%) | 10,197 (50.2%) |
| Total (Overall) | 38,726 (55.3%) | 31,343 (44.7%) |
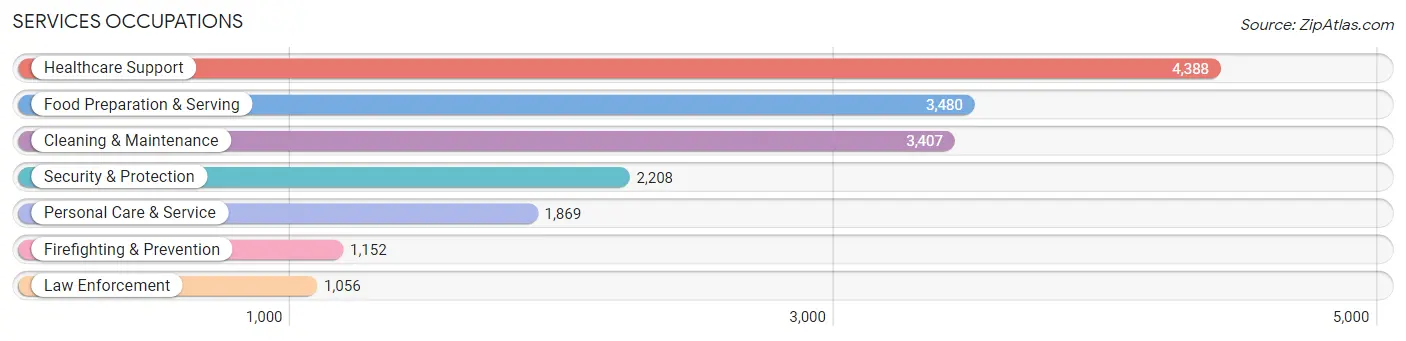
Services Occupations
The most common Services occupations in Palmdale are Healthcare Support (4,388 | 6.3%), Food Preparation & Serving (3,480 | 5.0%), Cleaning & Maintenance (3,407 | 4.9%), Security & Protection (2,208 | 3.2%), and Personal Care & Service (1,869 | 2.7%).
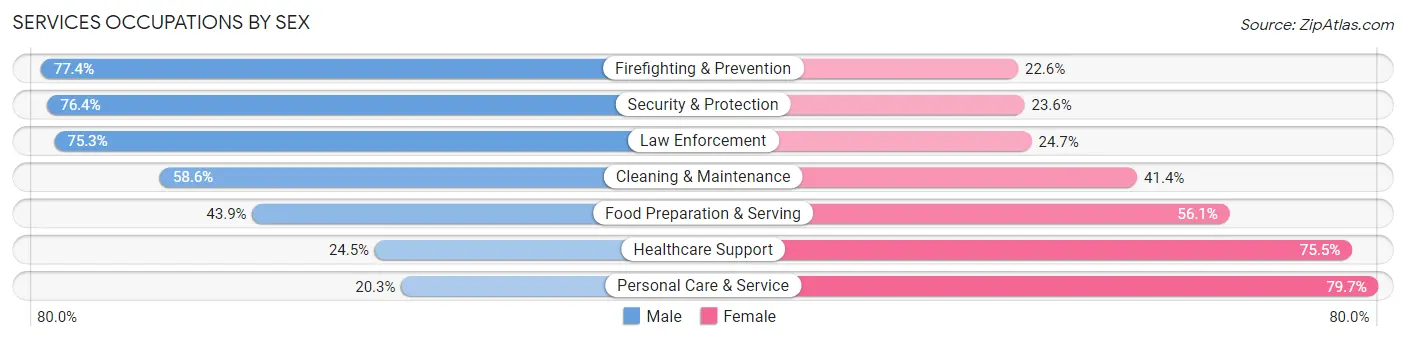
Services Occupations by Sex
Within the Services occupations in Palmdale, the most male-oriented occupations are Firefighting & Prevention (77.4%), Security & Protection (76.4%), and Law Enforcement (75.3%), while the most female-oriented occupations are Personal Care & Service (79.7%), Healthcare Support (75.5%), and Food Preparation & Serving (56.1%).
| Occupation | Male | Female |
| Healthcare Support | 1,075 (24.5%) | 3,313 (75.5%) |
| Security & Protection | 1,687 (76.4%) | 521 (23.6%) |
| Firefighting & Prevention | 892 (77.4%) | 260 (22.6%) |
| Law Enforcement | 795 (75.3%) | 261 (24.7%) |
| Food Preparation & Serving | 1,528 (43.9%) | 1,952 (56.1%) |
| Cleaning & Maintenance | 1,995 (58.6%) | 1,412 (41.4%) |
| Personal Care & Service | 380 (20.3%) | 1,489 (79.7%) |
| Total (Category) | 6,665 (43.4%) | 8,687 (56.6%) |
| Total (Overall) | 38,726 (55.3%) | 31,343 (44.7%) |
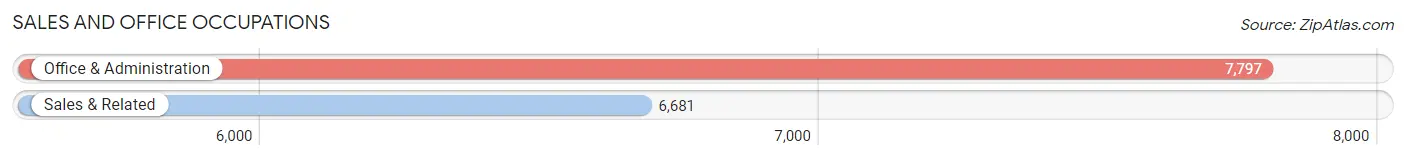
Sales and Office Occupations
The most common Sales and Office occupations in Palmdale are Office & Administration (7,797 | 11.1%), and Sales & Related (6,681 | 9.5%).
Sales and Office Occupations by Sex
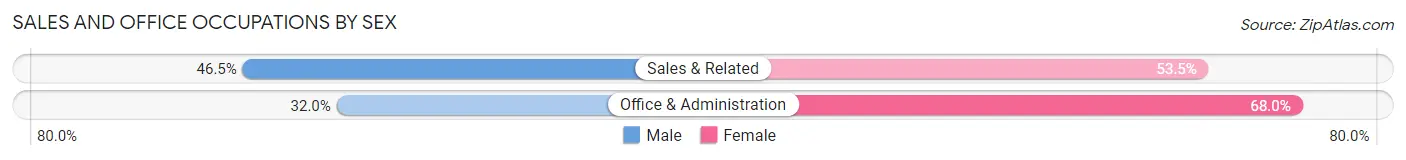
| Occupation | Male | Female |
| Sales & Related | 3,104 (46.5%) | 3,577 (53.5%) |
| Office & Administration | 2,495 (32.0%) | 5,302 (68.0%) |
| Total (Category) | 5,599 (38.7%) | 8,879 (61.3%) |
| Total (Overall) | 38,726 (55.3%) | 31,343 (44.7%) |
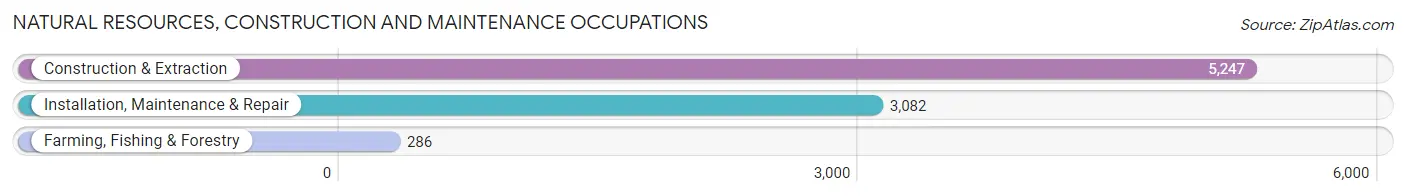
Natural Resources, Construction and Maintenance Occupations
The most common Natural Resources, Construction and Maintenance occupations in Palmdale are Construction & Extraction (5,247 | 7.5%), Installation, Maintenance & Repair (3,082 | 4.4%), and Farming, Fishing & Forestry (286 | 0.4%).
Natural Resources, Construction and Maintenance Occupations by Sex
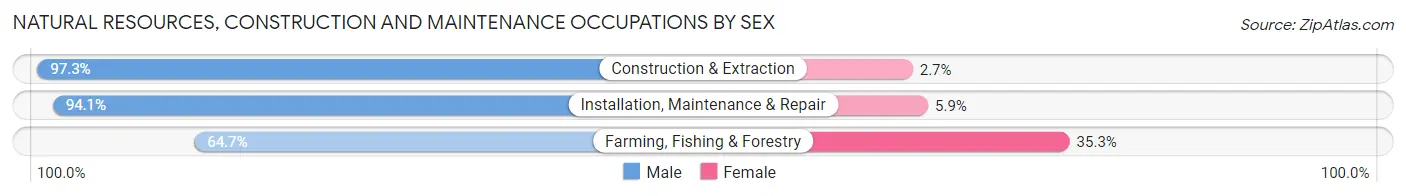
| Occupation | Male | Female |
| Farming, Fishing & Forestry | 185 (64.7%) | 101 (35.3%) |
| Construction & Extraction | 5,107 (97.3%) | 140 (2.7%) |
| Installation, Maintenance & Repair | 2,901 (94.1%) | 181 (5.9%) |
| Total (Category) | 8,193 (95.1%) | 422 (4.9%) |
| Total (Overall) | 38,726 (55.3%) | 31,343 (44.7%) |
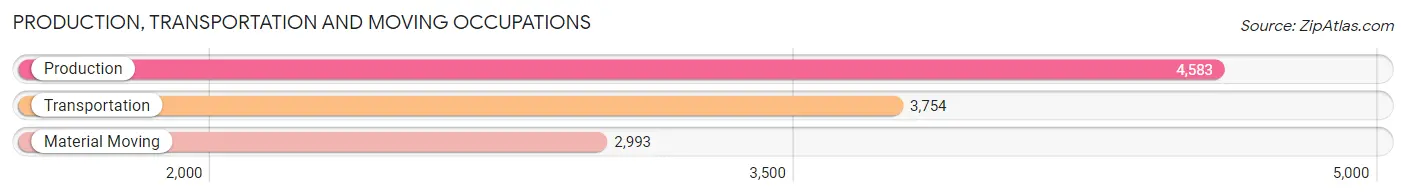
Production, Transportation and Moving Occupations
The most common Production, Transportation and Moving occupations in Palmdale are Production (4,583 | 6.5%), Transportation (3,754 | 5.4%), and Material Moving (2,993 | 4.3%).
Production, Transportation and Moving Occupations by Sex
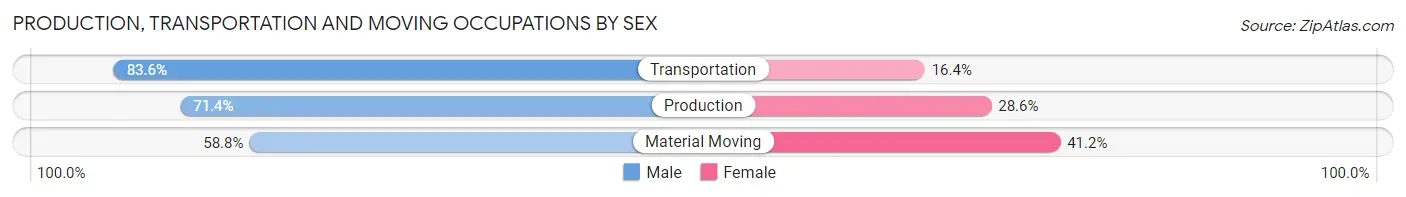
| Occupation | Male | Female |
| Production | 3,273 (71.4%) | 1,310 (28.6%) |
| Transportation | 3,140 (83.6%) | 614 (16.4%) |
| Material Moving | 1,759 (58.8%) | 1,234 (41.2%) |
| Total (Category) | 8,172 (72.1%) | 3,158 (27.9%) |
| Total (Overall) | 38,726 (55.3%) | 31,343 (44.7%) |
Employment Industries by Sex in Palmdale
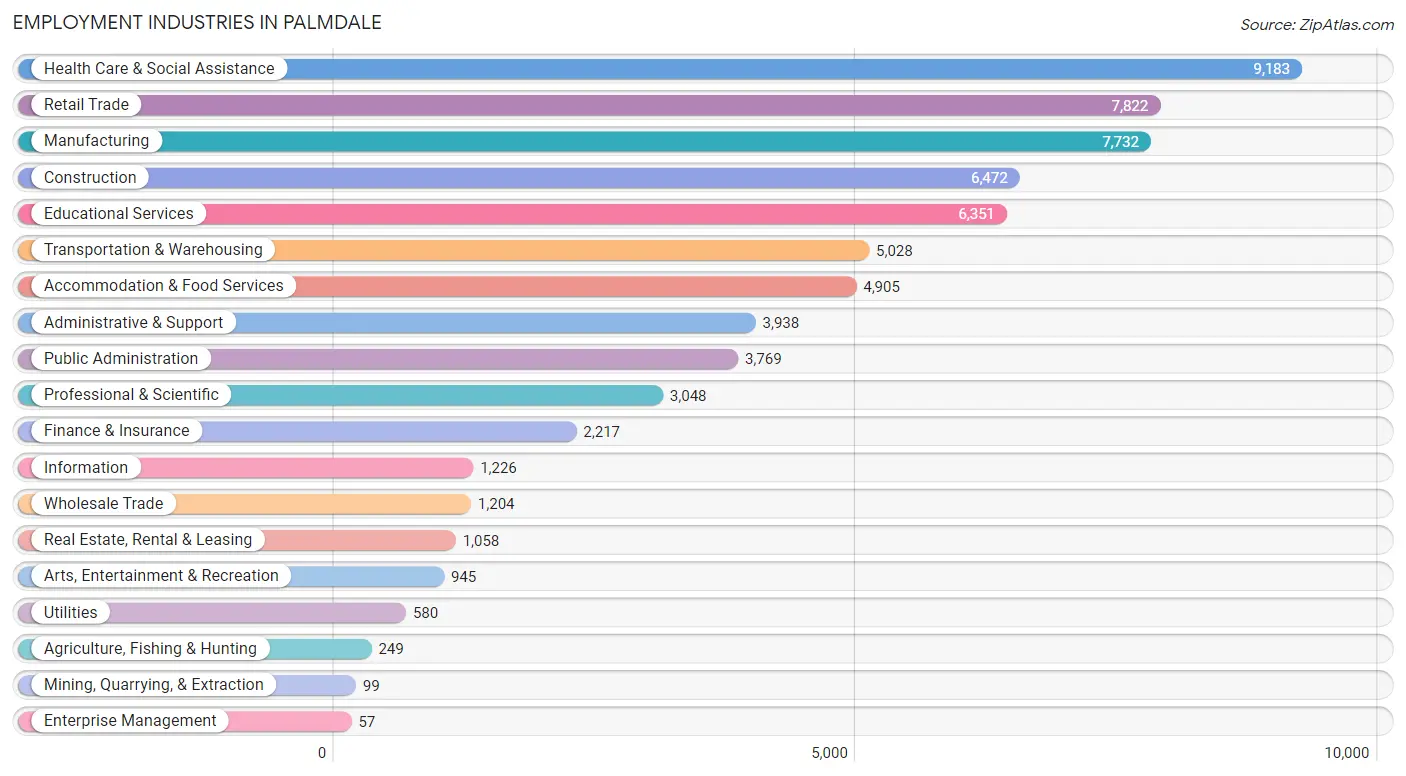
Employment Industries in Palmdale
The major employment industries in Palmdale include Health Care & Social Assistance (9,183 | 13.1%), Retail Trade (7,822 | 11.2%), Manufacturing (7,732 | 11.0%), Construction (6,472 | 9.2%), and Educational Services (6,351 | 9.1%).
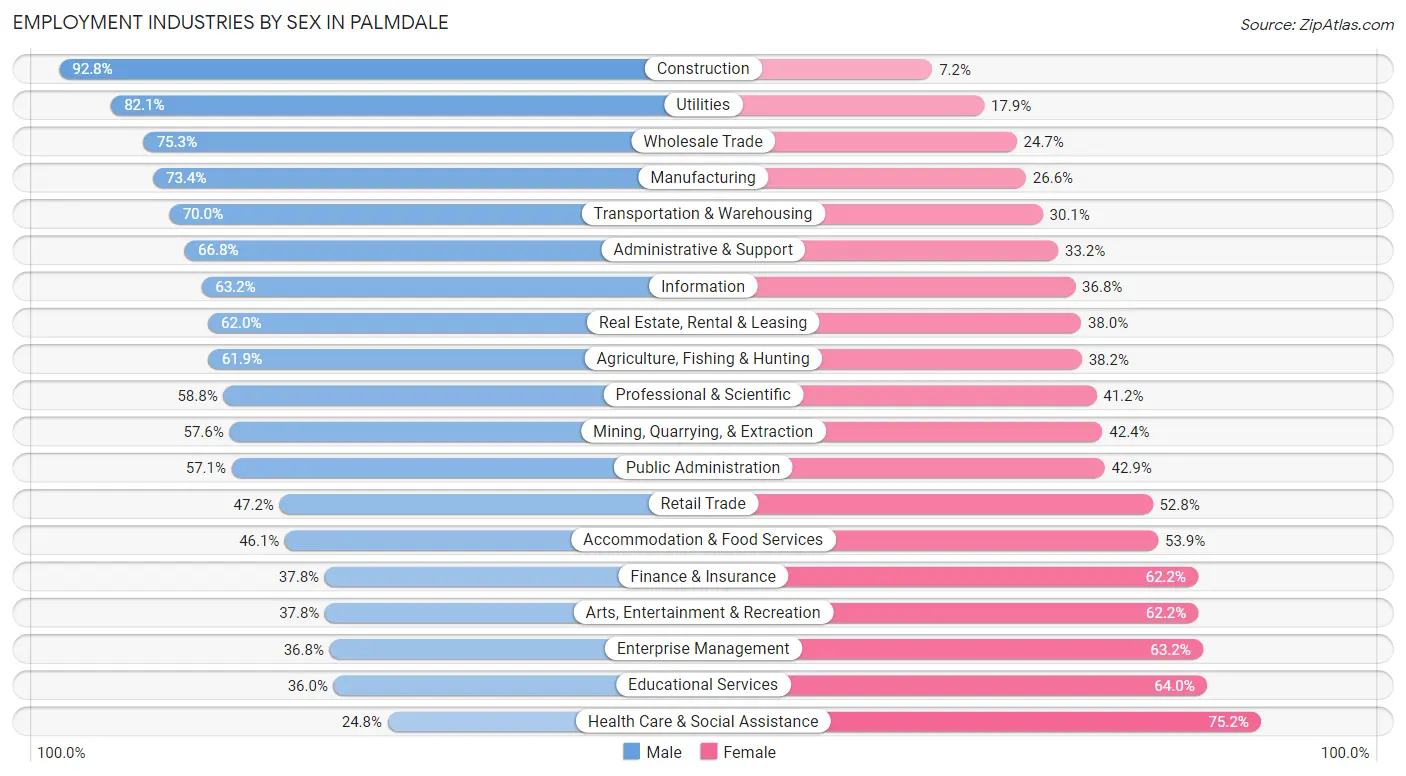
Employment Industries by Sex in Palmdale
The Palmdale industries that see more men than women are Construction (92.8%), Utilities (82.1%), and Wholesale Trade (75.3%), whereas the industries that tend to have a higher number of women are Health Care & Social Assistance (75.2%), Educational Services (64.0%), and Enterprise Management (63.2%).
| Industry | Male | Female |
| Agriculture, Fishing & Hunting | 154 (61.9%) | 95 (38.2%) |
| Mining, Quarrying, & Extraction | 57 (57.6%) | 42 (42.4%) |
| Construction | 6,006 (92.8%) | 466 (7.2%) |
| Manufacturing | 5,676 (73.4%) | 2,056 (26.6%) |
| Wholesale Trade | 907 (75.3%) | 297 (24.7%) |
| Retail Trade | 3,693 (47.2%) | 4,129 (52.8%) |
| Transportation & Warehousing | 3,517 (70.0%) | 1,511 (30.0%) |
| Utilities | 476 (82.1%) | 104 (17.9%) |
| Information | 775 (63.2%) | 451 (36.8%) |
| Finance & Insurance | 839 (37.8%) | 1,378 (62.2%) |
| Real Estate, Rental & Leasing | 656 (62.0%) | 402 (38.0%) |
| Professional & Scientific | 1,793 (58.8%) | 1,255 (41.2%) |
| Enterprise Management | 21 (36.8%) | 36 (63.2%) |
| Administrative & Support | 2,629 (66.8%) | 1,309 (33.2%) |
| Educational Services | 2,287 (36.0%) | 4,064 (64.0%) |
| Health Care & Social Assistance | 2,279 (24.8%) | 6,904 (75.2%) |
| Arts, Entertainment & Recreation | 357 (37.8%) | 588 (62.2%) |
| Accommodation & Food Services | 2,259 (46.1%) | 2,646 (53.9%) |
| Public Administration | 2,153 (57.1%) | 1,616 (42.9%) |
| Total | 38,726 (55.3%) | 31,343 (44.7%) |
Education in Palmdale
School Enrollment in Palmdale
The most common levels of schooling among the 50,520 students in Palmdale are high school (12,374 | 24.5%), middle school (11,278 | 22.3%), and college / undergraduate (10,844 | 21.5%).
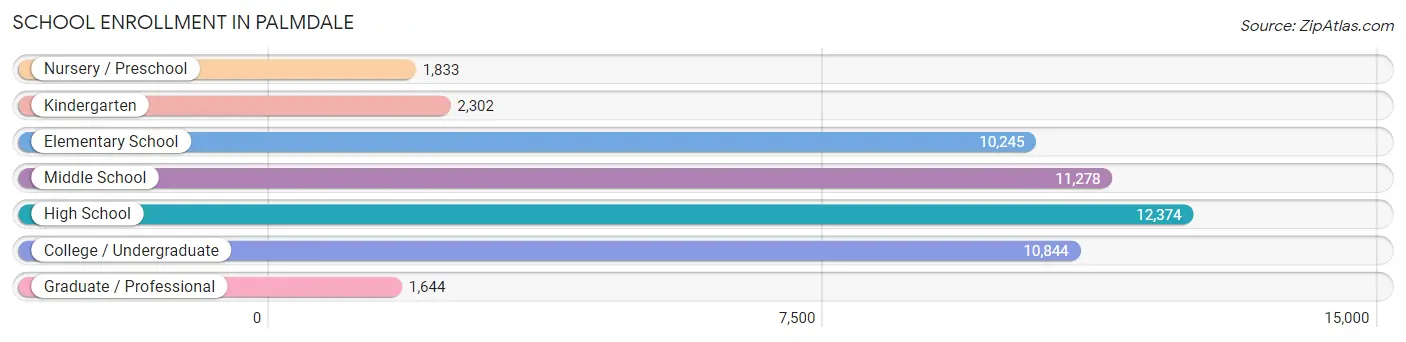
| School Level | # Students | % Students |
| Nursery / Preschool | 1,833 | 3.6% |
| Kindergarten | 2,302 | 4.6% |
| Elementary School | 10,245 | 20.3% |
| Middle School | 11,278 | 22.3% |
| High School | 12,374 | 24.5% |
| College / Undergraduate | 10,844 | 21.5% |
| Graduate / Professional | 1,644 | 3.3% |
| Total | 50,520 | 100.0% |
School Enrollment by Age by Funding Source in Palmdale
Out of a total of 50,520 students who are enrolled in schools in Palmdale, 4,749 (9.4%) attend a private institution, while the remaining 45,771 (90.6%) are enrolled in public schools. The age group of 35 years and over has the highest likelihood of being enrolled in private schools, with 762 (30.0% in the age bracket) enrolled. Conversely, the age group of 10 to 14 year olds has the lowest likelihood of being enrolled in a private school, with 13,949 (93.9% in the age bracket) attending a public institution.
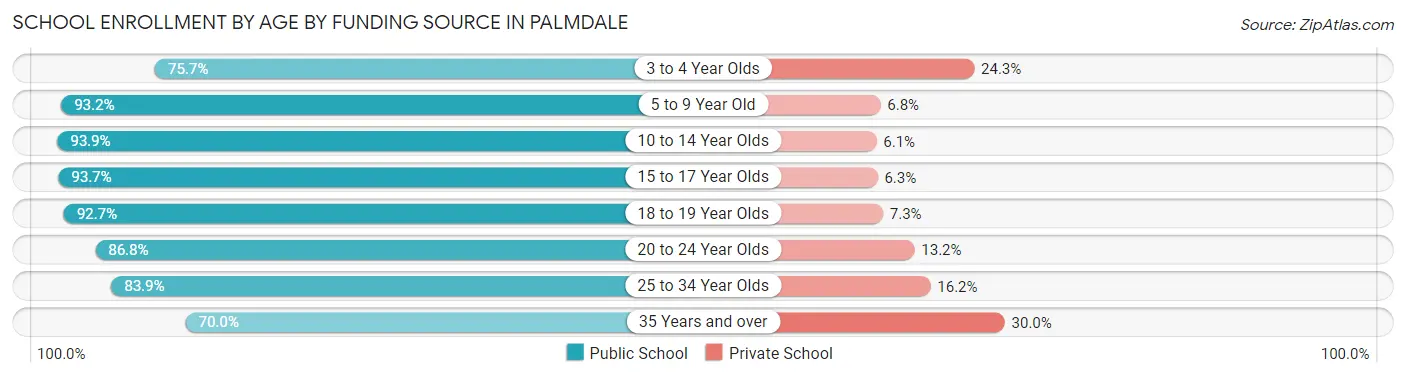
| Age Bracket | Public School | Private School |
| 3 to 4 Year Olds | 1,056 (75.7%) | 339 (24.3%) |
| 5 to 9 Year Old | 11,205 (93.2%) | 821 (6.8%) |
| 10 to 14 Year Olds | 13,949 (93.9%) | 904 (6.1%) |
| 15 to 17 Year Olds | 7,908 (93.7%) | 532 (6.3%) |
| 18 to 19 Year Olds | 3,148 (92.7%) | 248 (7.3%) |
| 20 to 24 Year Olds | 4,359 (86.8%) | 661 (13.2%) |
| 25 to 34 Year Olds | 2,388 (83.9%) | 460 (16.2%) |
| 35 Years and over | 1,780 (70.0%) | 762 (30.0%) |
| Total | 45,771 (90.6%) | 4,749 (9.4%) |
Educational Attainment by Field of Study in Palmdale
Business (3,261 | 18.4%), engineering (1,940 | 10.9%), science & technology (1,899 | 10.7%), education (1,547 | 8.7%), and arts & humanities (1,393 | 7.8%) are the most common fields of study among 17,759 individuals in Palmdale who have obtained a bachelor's degree or higher.
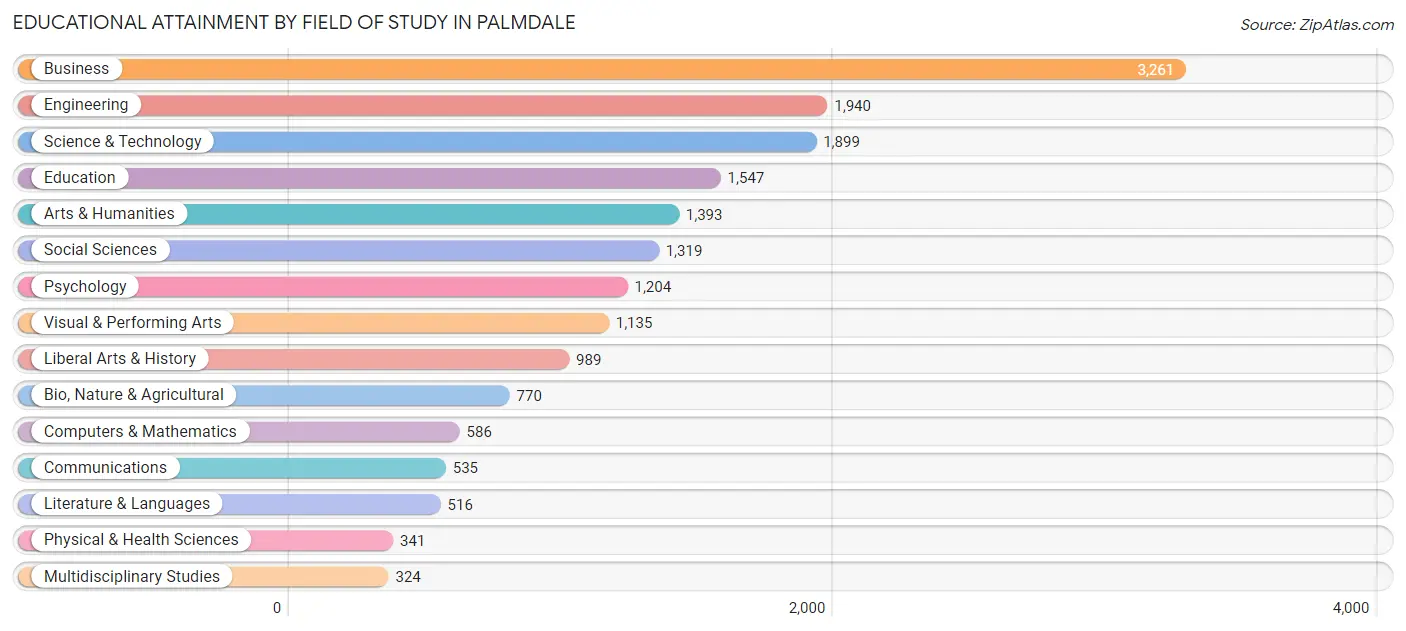
| Field of Study | # Graduates | % Graduates |
| Computers & Mathematics | 586 | 3.3% |
| Bio, Nature & Agricultural | 770 | 4.3% |
| Physical & Health Sciences | 341 | 1.9% |
| Psychology | 1,204 | 6.8% |
| Social Sciences | 1,319 | 7.4% |
| Engineering | 1,940 | 10.9% |
| Multidisciplinary Studies | 324 | 1.8% |
| Science & Technology | 1,899 | 10.7% |
| Business | 3,261 | 18.4% |
| Education | 1,547 | 8.7% |
| Literature & Languages | 516 | 2.9% |
| Liberal Arts & History | 989 | 5.6% |
| Visual & Performing Arts | 1,135 | 6.4% |
| Communications | 535 | 3.0% |
| Arts & Humanities | 1,393 | 7.8% |
| Total | 17,759 | 100.0% |
Transportation & Commute in Palmdale
Vehicle Availability by Sex in Palmdale
The most prevalent vehicle ownership categories in Palmdale are males with 2 vehicles (12,886, accounting for 33.8%) and females with 2 vehicles (9,690, making up 42.8%).
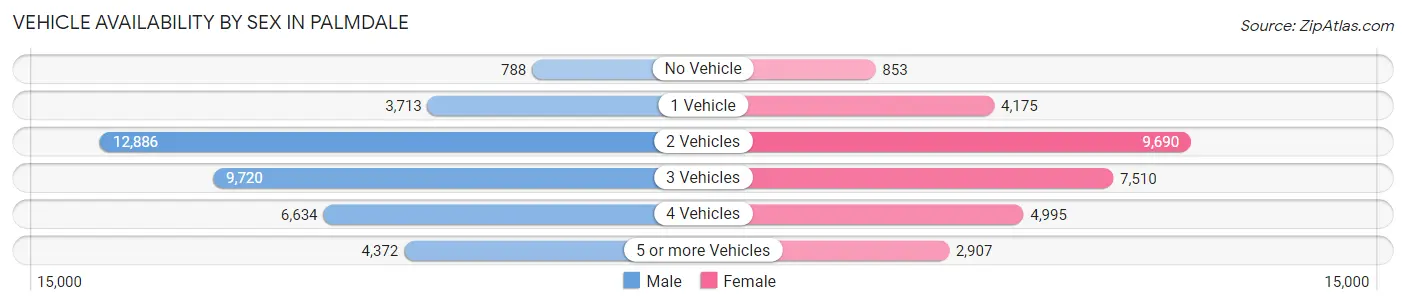
| Vehicles Available | Male | Female |
| No Vehicle | 788 (2.1%) | 853 (2.8%) |
| 1 Vehicle | 3,713 (9.7%) | 4,175 (13.9%) |
| 2 Vehicles | 12,886 (33.8%) | 9,690 (32.2%) |
| 3 Vehicles | 9,720 (25.5%) | 7,510 (24.9%) |
| 4 Vehicles | 6,634 (17.4%) | 4,995 (16.6%) |
| 5 or more Vehicles | 4,372 (11.5%) | 2,907 (9.7%) |
| Total | 38,113 (100.0%) | 30,130 (100.0%) |
Commute Time in Palmdale
The most frequently occuring commute durations in Palmdale are 60 to 89 minutes (12,253 commuters, 19.5%), 15 to 19 minutes (11,118 commuters, 17.7%), and 20 to 24 minutes (8,137 commuters, 13.0%).
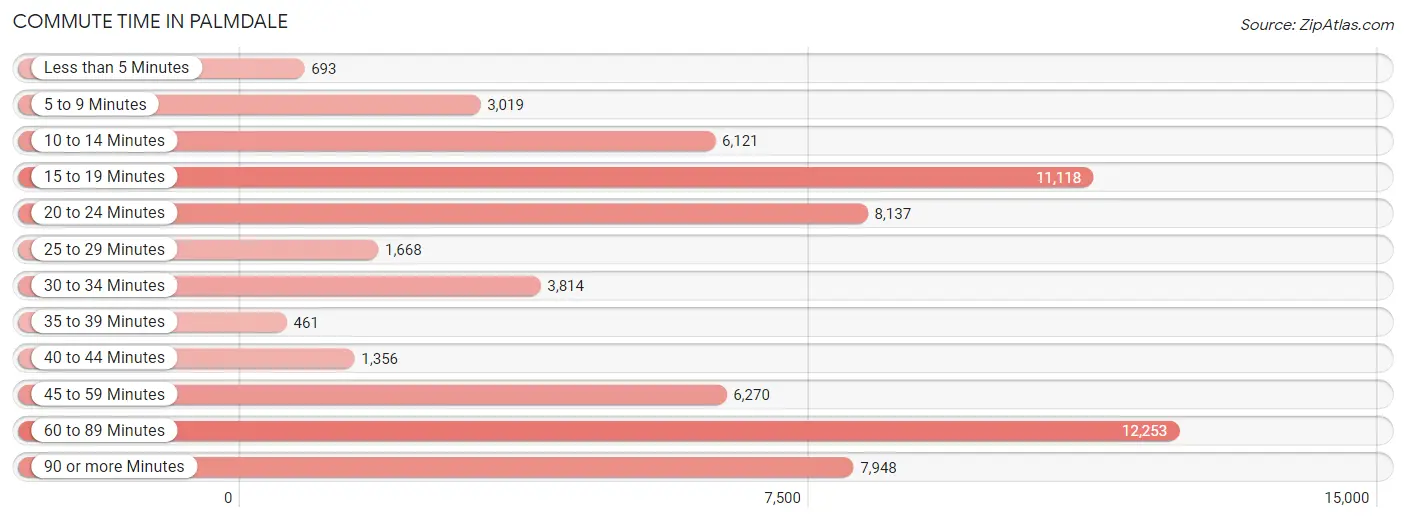
| Commute Time | # Commuters | % Commuters |
| Less than 5 Minutes | 693 | 1.1% |
| 5 to 9 Minutes | 3,019 | 4.8% |
| 10 to 14 Minutes | 6,121 | 9.7% |
| 15 to 19 Minutes | 11,118 | 17.7% |
| 20 to 24 Minutes | 8,137 | 13.0% |
| 25 to 29 Minutes | 1,668 | 2.6% |
| 30 to 34 Minutes | 3,814 | 6.1% |
| 35 to 39 Minutes | 461 | 0.7% |
| 40 to 44 Minutes | 1,356 | 2.2% |
| 45 to 59 Minutes | 6,270 | 10.0% |
| 60 to 89 Minutes | 12,253 | 19.5% |
| 90 or more Minutes | 7,948 | 12.6% |
Commute Time by Sex in Palmdale
The most common commute times in Palmdale are 60 to 89 minutes (8,757 commuters, 24.3%) for males and 15 to 19 minutes (5,479 commuters, 20.4%) for females.
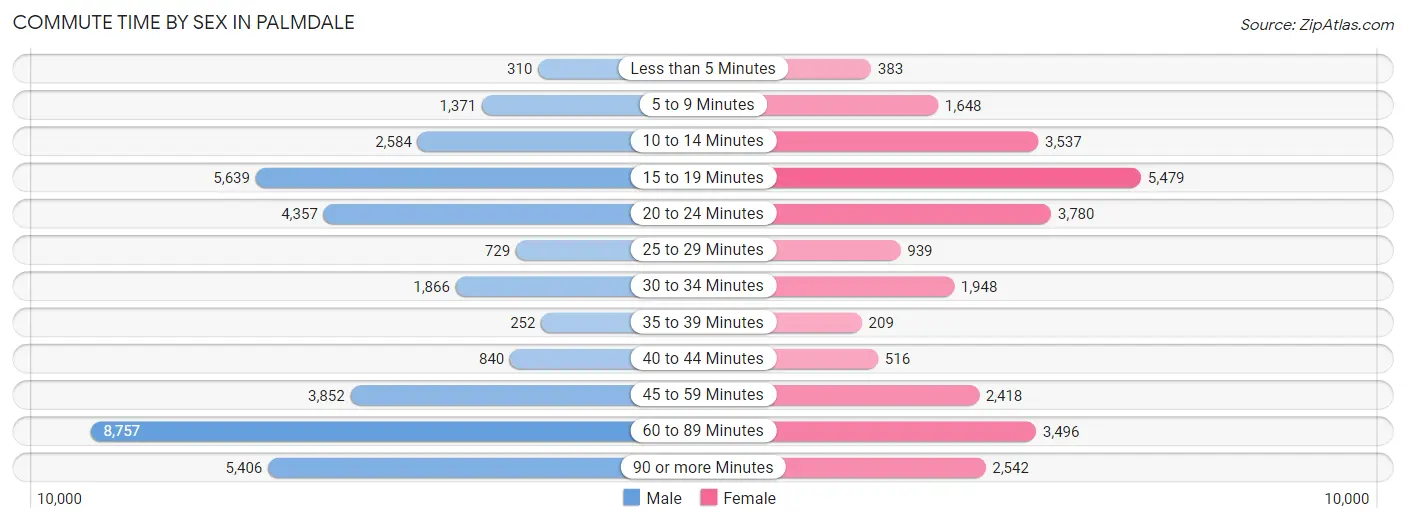
| Commute Time | Male | Female |
| Less than 5 Minutes | 310 (0.9%) | 383 (1.4%) |
| 5 to 9 Minutes | 1,371 (3.8%) | 1,648 (6.1%) |
| 10 to 14 Minutes | 2,584 (7.2%) | 3,537 (13.2%) |
| 15 to 19 Minutes | 5,639 (15.7%) | 5,479 (20.4%) |
| 20 to 24 Minutes | 4,357 (12.1%) | 3,780 (14.1%) |
| 25 to 29 Minutes | 729 (2.0%) | 939 (3.5%) |
| 30 to 34 Minutes | 1,866 (5.2%) | 1,948 (7.2%) |
| 35 to 39 Minutes | 252 (0.7%) | 209 (0.8%) |
| 40 to 44 Minutes | 840 (2.3%) | 516 (1.9%) |
| 45 to 59 Minutes | 3,852 (10.7%) | 2,418 (9.0%) |
| 60 to 89 Minutes | 8,757 (24.3%) | 3,496 (13.0%) |
| 90 or more Minutes | 5,406 (15.0%) | 2,542 (9.5%) |
Time of Departure to Work by Sex in Palmdale
The most frequent times of departure to work in Palmdale are 12:00 AM to 4:59 AM (7,161, 19.9%) for males and 7:00 AM to 7:29 AM (3,672, 13.7%) for females.
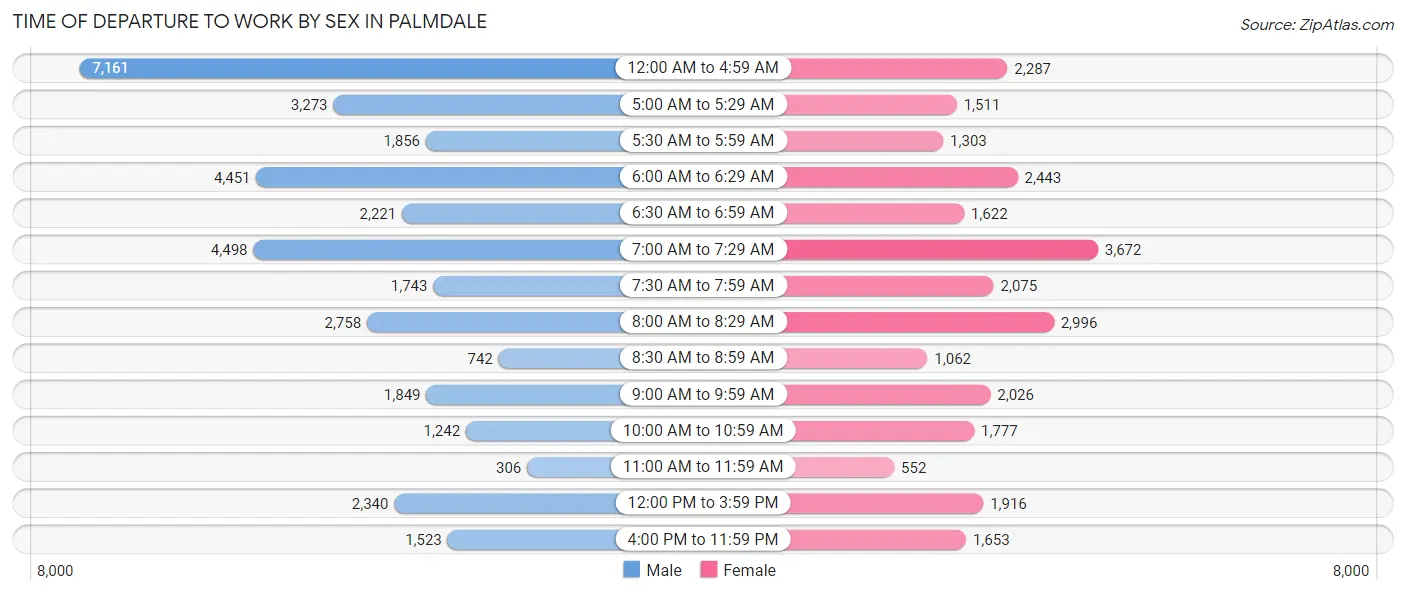
| Time of Departure | Male | Female |
| 12:00 AM to 4:59 AM | 7,161 (19.9%) | 2,287 (8.5%) |
| 5:00 AM to 5:29 AM | 3,273 (9.1%) | 1,511 (5.6%) |
| 5:30 AM to 5:59 AM | 1,856 (5.2%) | 1,303 (4.8%) |
| 6:00 AM to 6:29 AM | 4,451 (12.4%) | 2,443 (9.1%) |
| 6:30 AM to 6:59 AM | 2,221 (6.2%) | 1,622 (6.0%) |
| 7:00 AM to 7:29 AM | 4,498 (12.5%) | 3,672 (13.7%) |
| 7:30 AM to 7:59 AM | 1,743 (4.9%) | 2,075 (7.7%) |
| 8:00 AM to 8:29 AM | 2,758 (7.7%) | 2,996 (11.1%) |
| 8:30 AM to 8:59 AM | 742 (2.1%) | 1,062 (4.0%) |
| 9:00 AM to 9:59 AM | 1,849 (5.1%) | 2,026 (7.5%) |
| 10:00 AM to 10:59 AM | 1,242 (3.5%) | 1,777 (6.6%) |
| 11:00 AM to 11:59 AM | 306 (0.9%) | 552 (2.1%) |
| 12:00 PM to 3:59 PM | 2,340 (6.5%) | 1,916 (7.1%) |
| 4:00 PM to 11:59 PM | 1,523 (4.2%) | 1,653 (6.1%) |
| Total | 35,963 (100.0%) | 26,895 (100.0%) |
Housing Occupancy in Palmdale
Occupancy by Ownership in Palmdale
Of the total 46,588 dwellings in Palmdale, owner-occupied units account for 30,993 (66.5%), while renter-occupied units make up 15,595 (33.5%).
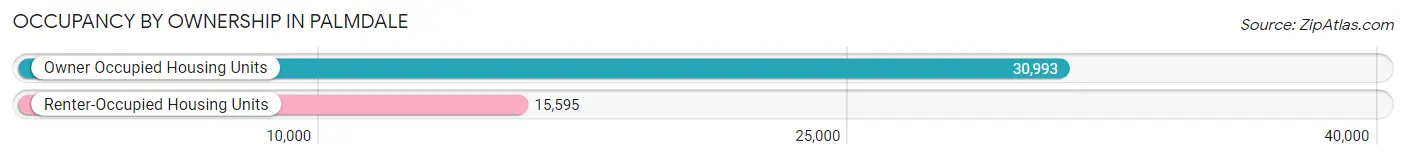
| Occupancy | # Housing Units | % Housing Units |
| Owner Occupied Housing Units | 30,993 | 66.5% |
| Renter-Occupied Housing Units | 15,595 | 33.5% |
| Total Occupied Housing Units | 46,588 | 100.0% |
Occupancy by Household Size in Palmdale
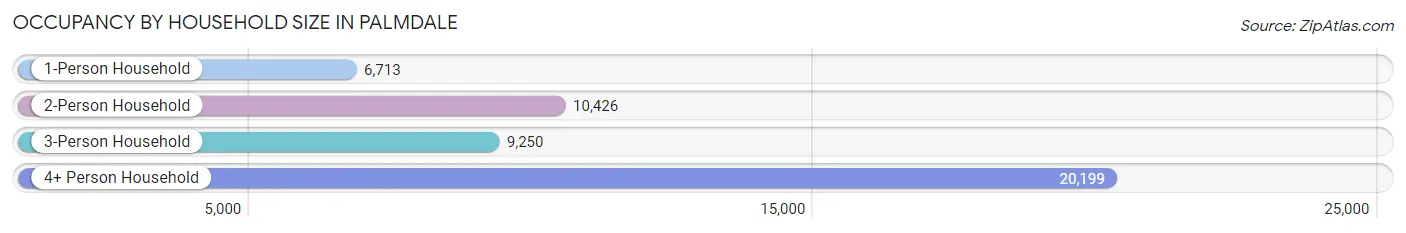
| Household Size | # Housing Units | % Housing Units |
| 1-Person Household | 6,713 | 14.4% |
| 2-Person Household | 10,426 | 22.4% |
| 3-Person Household | 9,250 | 19.9% |
| 4+ Person Household | 20,199 | 43.4% |
| Total Housing Units | 46,588 | 100.0% |
Occupancy by Ownership by Household Size in Palmdale
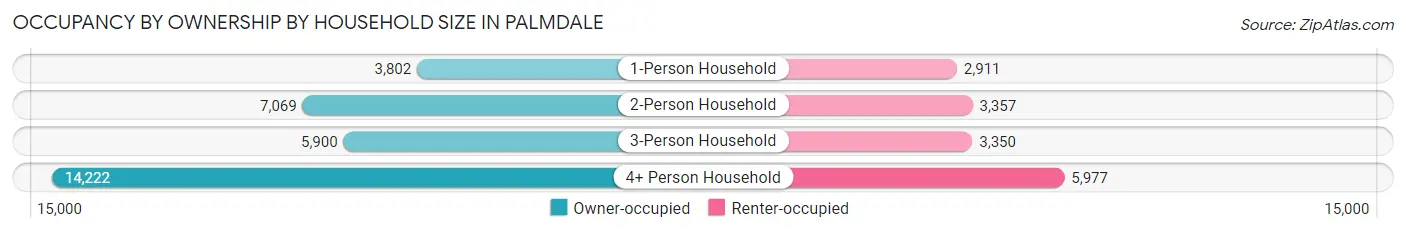
| Household Size | Owner-occupied | Renter-occupied |
| 1-Person Household | 3,802 (56.6%) | 2,911 (43.4%) |
| 2-Person Household | 7,069 (67.8%) | 3,357 (32.2%) |
| 3-Person Household | 5,900 (63.8%) | 3,350 (36.2%) |
| 4+ Person Household | 14,222 (70.4%) | 5,977 (29.6%) |
| Total Housing Units | 30,993 (66.5%) | 15,595 (33.5%) |
Occupancy by Educational Attainment in Palmdale
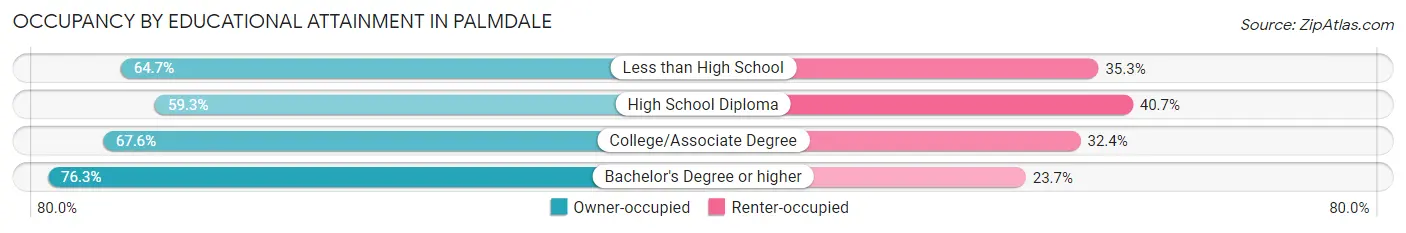
| Household Size | Owner-occupied | Renter-occupied |
| Less than High School | 5,988 (64.7%) | 3,262 (35.3%) |
| High School Diploma | 7,440 (59.3%) | 5,107 (40.7%) |
| College/Associate Degree | 10,437 (67.6%) | 5,008 (32.4%) |
| Bachelor's Degree or higher | 7,128 (76.3%) | 2,218 (23.7%) |
Occupancy by Age of Householder in Palmdale
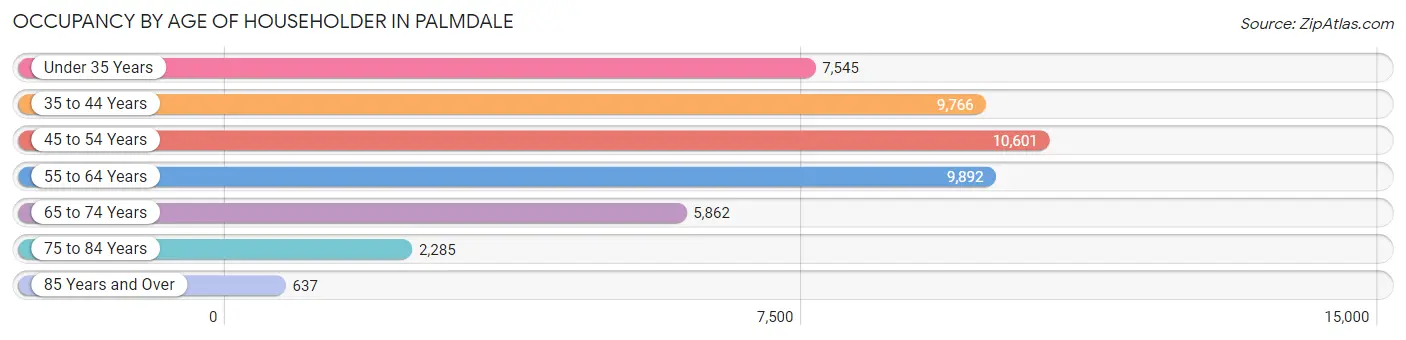
| Age Bracket | # Households | % Households |
| Under 35 Years | 7,545 | 16.2% |
| 35 to 44 Years | 9,766 | 21.0% |
| 45 to 54 Years | 10,601 | 22.8% |
| 55 to 64 Years | 9,892 | 21.2% |
| 65 to 74 Years | 5,862 | 12.6% |
| 75 to 84 Years | 2,285 | 4.9% |
| 85 Years and Over | 637 | 1.4% |
| Total | 46,588 | 100.0% |
Housing Finances in Palmdale
Median Income by Occupancy in Palmdale
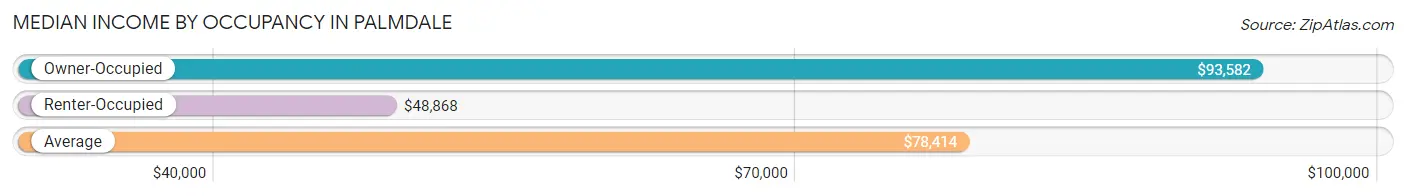
| Occupancy Type | # Households | Median Income |
| Owner-Occupied | 30,993 (66.5%) | $93,582 |
| Renter-Occupied | 15,595 (33.5%) | $48,868 |
| Average | 46,588 (100.0%) | $78,414 |
Occupancy by Householder Income Bracket in Palmdale
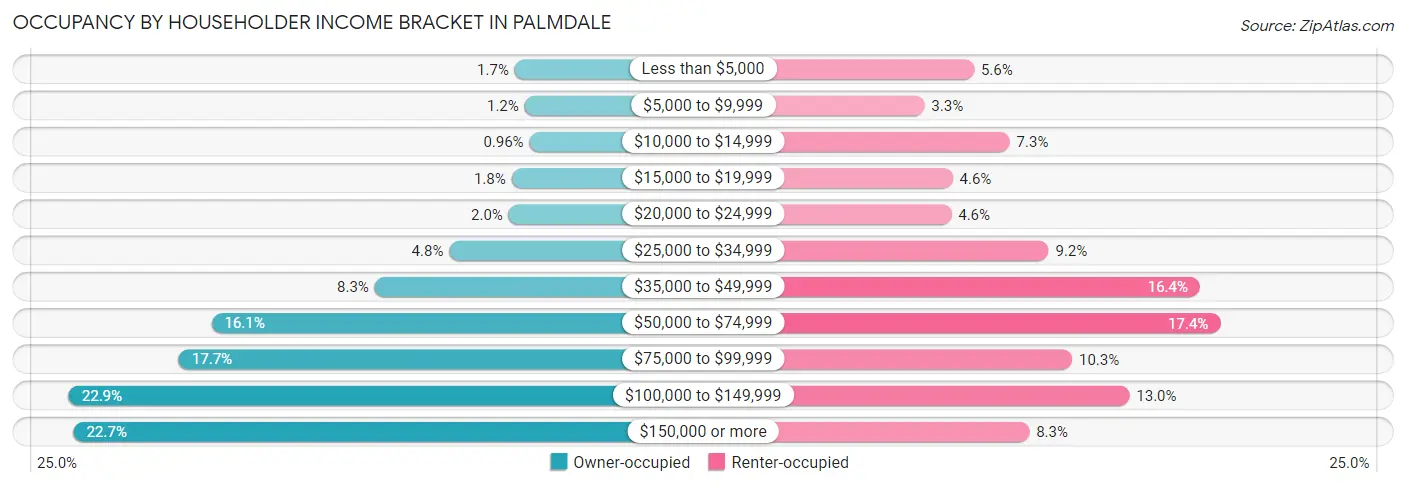
| Income Bracket | Owner-occupied | Renter-occupied |
| Less than $5,000 | 516 (1.7%) | 879 (5.6%) |
| $5,000 to $9,999 | 369 (1.2%) | 511 (3.3%) |
| $10,000 to $14,999 | 299 (1.0%) | 1,145 (7.3%) |
| $15,000 to $19,999 | 562 (1.8%) | 721 (4.6%) |
| $20,000 to $24,999 | 604 (1.9%) | 711 (4.6%) |
| $25,000 to $34,999 | 1,483 (4.8%) | 1,433 (9.2%) |
| $35,000 to $49,999 | 2,583 (8.3%) | 2,556 (16.4%) |
| $50,000 to $74,999 | 4,989 (16.1%) | 2,708 (17.4%) |
| $75,000 to $99,999 | 5,469 (17.6%) | 1,608 (10.3%) |
| $100,000 to $149,999 | 7,093 (22.9%) | 2,034 (13.0%) |
| $150,000 or more | 7,026 (22.7%) | 1,289 (8.3%) |
| Total | 30,993 (100.0%) | 15,595 (100.0%) |
Monthly Housing Cost Tiers in Palmdale
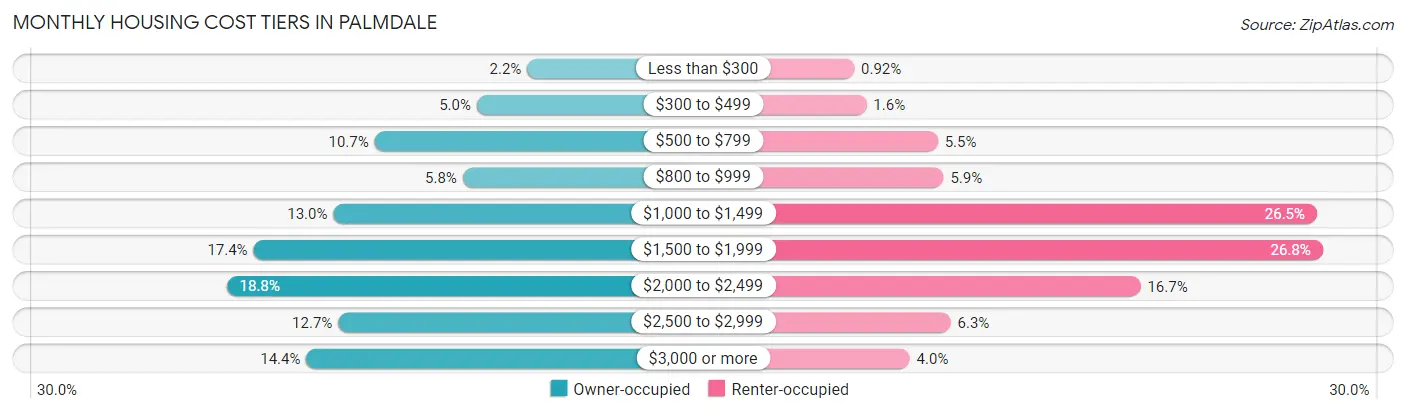
| Monthly Cost | Owner-occupied | Renter-occupied |
| Less than $300 | 694 (2.2%) | 143 (0.9%) |
| $300 to $499 | 1,556 (5.0%) | 249 (1.6%) |
| $500 to $799 | 3,307 (10.7%) | 864 (5.5%) |
| $800 to $999 | 1,798 (5.8%) | 914 (5.9%) |
| $1,000 to $1,499 | 4,014 (13.0%) | 4,129 (26.5%) |
| $1,500 to $1,999 | 5,381 (17.4%) | 4,180 (26.8%) |
| $2,000 to $2,499 | 5,838 (18.8%) | 2,611 (16.7%) |
| $2,500 to $2,999 | 3,929 (12.7%) | 975 (6.2%) |
| $3,000 or more | 4,476 (14.4%) | 623 (4.0%) |
| Total | 30,993 (100.0%) | 15,595 (100.0%) |
Physical Housing Characteristics in Palmdale
Housing Structures in Palmdale
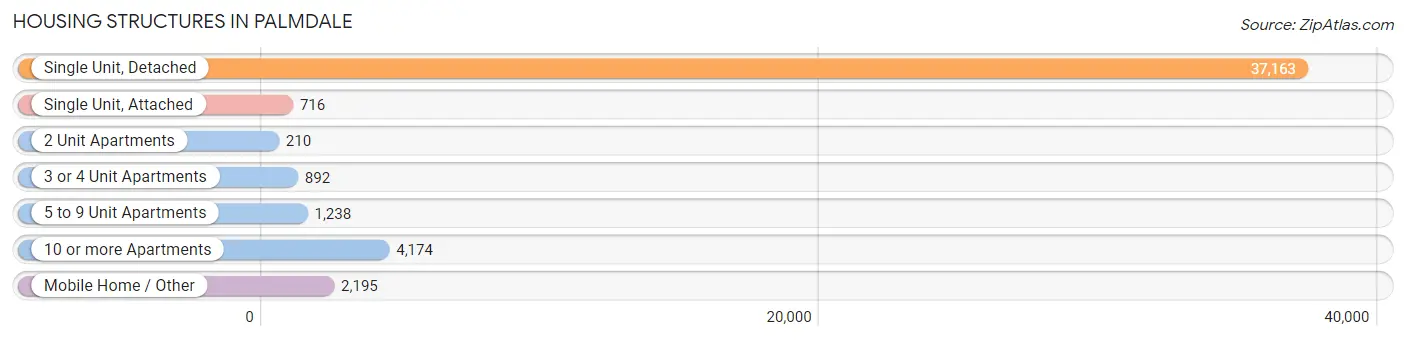
| Structure Type | # Housing Units | % Housing Units |
| Single Unit, Detached | 37,163 | 79.8% |
| Single Unit, Attached | 716 | 1.5% |
| 2 Unit Apartments | 210 | 0.4% |
| 3 or 4 Unit Apartments | 892 | 1.9% |
| 5 to 9 Unit Apartments | 1,238 | 2.7% |
| 10 or more Apartments | 4,174 | 9.0% |
| Mobile Home / Other | 2,195 | 4.7% |
| Total | 46,588 | 100.0% |
Housing Structures by Occupancy in Palmdale
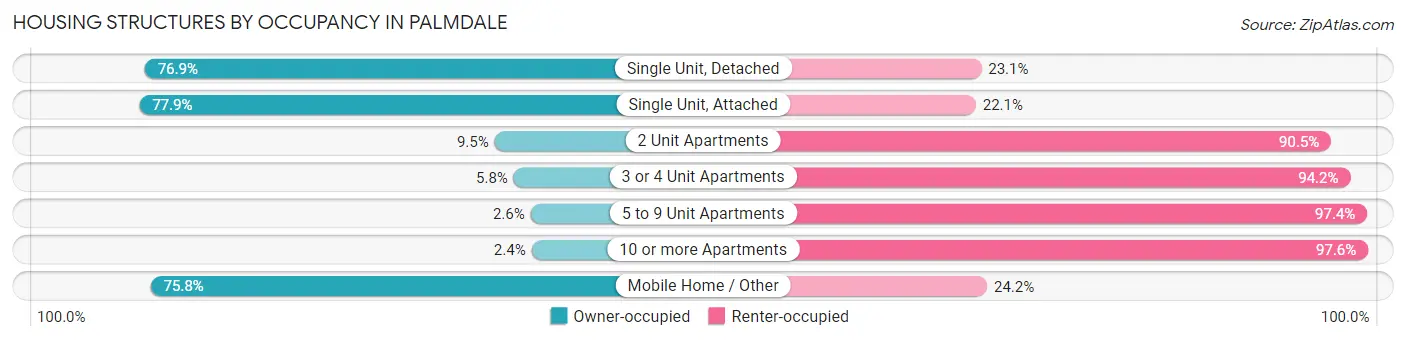
| Structure Type | Owner-occupied | Renter-occupied |
| Single Unit, Detached | 28,568 (76.9%) | 8,595 (23.1%) |
| Single Unit, Attached | 558 (77.9%) | 158 (22.1%) |
| 2 Unit Apartments | 20 (9.5%) | 190 (90.5%) |
| 3 or 4 Unit Apartments | 52 (5.8%) | 840 (94.2%) |
| 5 to 9 Unit Apartments | 32 (2.6%) | 1,206 (97.4%) |
| 10 or more Apartments | 100 (2.4%) | 4,074 (97.6%) |
| Mobile Home / Other | 1,663 (75.8%) | 532 (24.2%) |
| Total | 30,993 (66.5%) | 15,595 (33.5%) |
Housing Structures by Number of Rooms in Palmdale
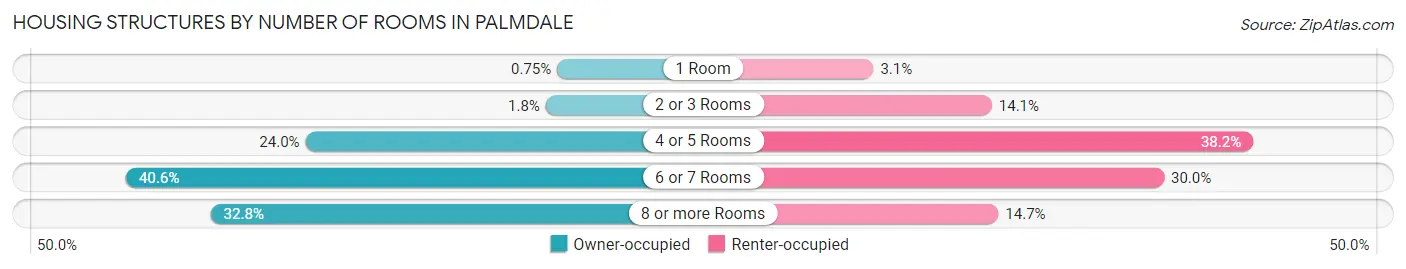
| Number of Rooms | Owner-occupied | Renter-occupied |
| 1 Room | 232 (0.7%) | 483 (3.1%) |
| 2 or 3 Rooms | 561 (1.8%) | 2,191 (14.1%) |
| 4 or 5 Rooms | 7,449 (24.0%) | 5,958 (38.2%) |
| 6 or 7 Rooms | 12,588 (40.6%) | 4,676 (30.0%) |
| 8 or more Rooms | 10,163 (32.8%) | 2,287 (14.7%) |
| Total | 30,993 (100.0%) | 15,595 (100.0%) |
Housing Structure by Heating Type in Palmdale
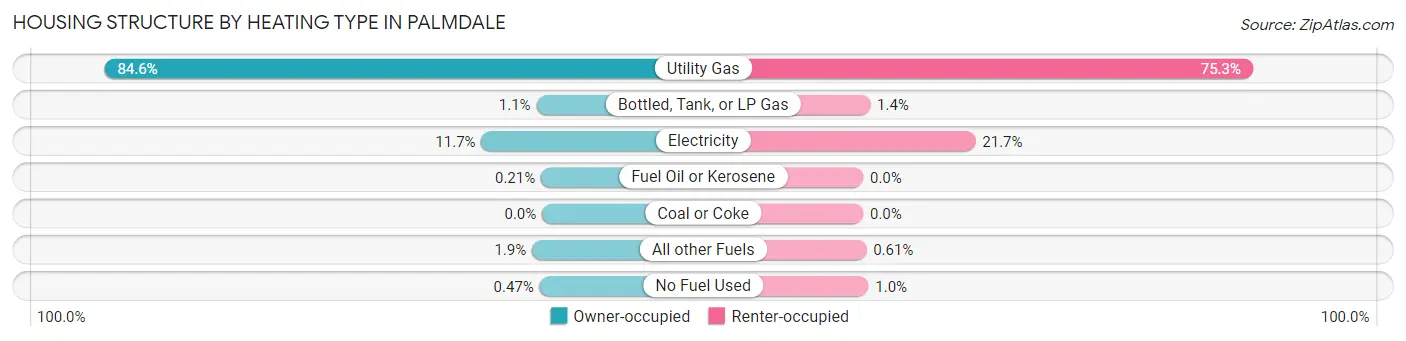
| Heating Type | Owner-occupied | Renter-occupied |
| Utility Gas | 26,207 (84.6%) | 11,744 (75.3%) |
| Bottled, Tank, or LP Gas | 339 (1.1%) | 213 (1.4%) |
| Electricity | 3,637 (11.7%) | 3,384 (21.7%) |
| Fuel Oil or Kerosene | 64 (0.2%) | 0 (0.0%) |
| Coal or Coke | 0 (0.0%) | 0 (0.0%) |
| All other Fuels | 601 (1.9%) | 95 (0.6%) |
| No Fuel Used | 145 (0.5%) | 159 (1.0%) |
| Total | 30,993 (100.0%) | 15,595 (100.0%) |
Household Vehicle Usage in Palmdale
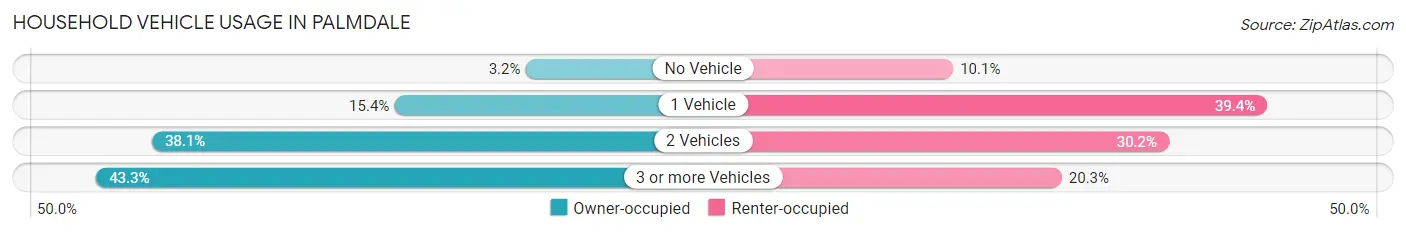
| Vehicles per Household | Owner-occupied | Renter-occupied |
| No Vehicle | 981 (3.2%) | 1,577 (10.1%) |
| 1 Vehicle | 4,777 (15.4%) | 6,145 (39.4%) |
| 2 Vehicles | 11,812 (38.1%) | 4,715 (30.2%) |
| 3 or more Vehicles | 13,423 (43.3%) | 3,158 (20.3%) |
| Total | 30,993 (100.0%) | 15,595 (100.0%) |
Real Estate & Mortgages in Palmdale
Real Estate and Mortgage Overview in Palmdale
| Characteristic | Without Mortgage | With Mortgage |
| Housing Units | 7,526 | 23,467 |
| Median Property Value | $348,200 | $415,900 |
| Median Household Income | $67,326 | $5,946 |
| Monthly Housing Costs | $658 | $4,457 |
| Real Estate Taxes | $3,433 | $447 |
Property Value by Mortgage Status in Palmdale
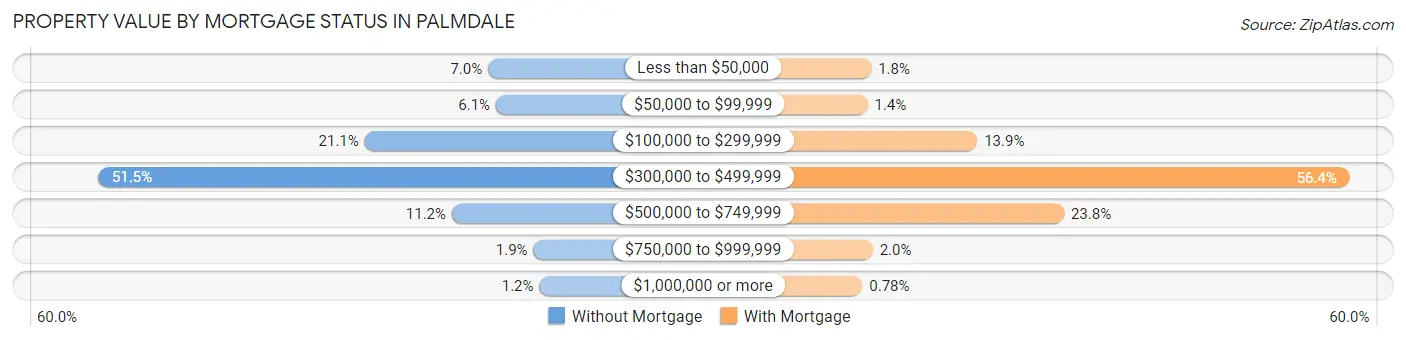
| Property Value | Without Mortgage | With Mortgage |
| Less than $50,000 | 529 (7.0%) | 420 (1.8%) |
| $50,000 to $99,999 | 461 (6.1%) | 322 (1.4%) |
| $100,000 to $299,999 | 1,591 (21.1%) | 3,265 (13.9%) |
| $300,000 to $499,999 | 3,877 (51.5%) | 13,227 (56.4%) |
| $500,000 to $749,999 | 841 (11.2%) | 5,591 (23.8%) |
| $750,000 to $999,999 | 139 (1.8%) | 460 (2.0%) |
| $1,000,000 or more | 88 (1.2%) | 182 (0.8%) |
| Total | 7,526 (100.0%) | 23,467 (100.0%) |
Household Income by Mortgage Status in Palmdale
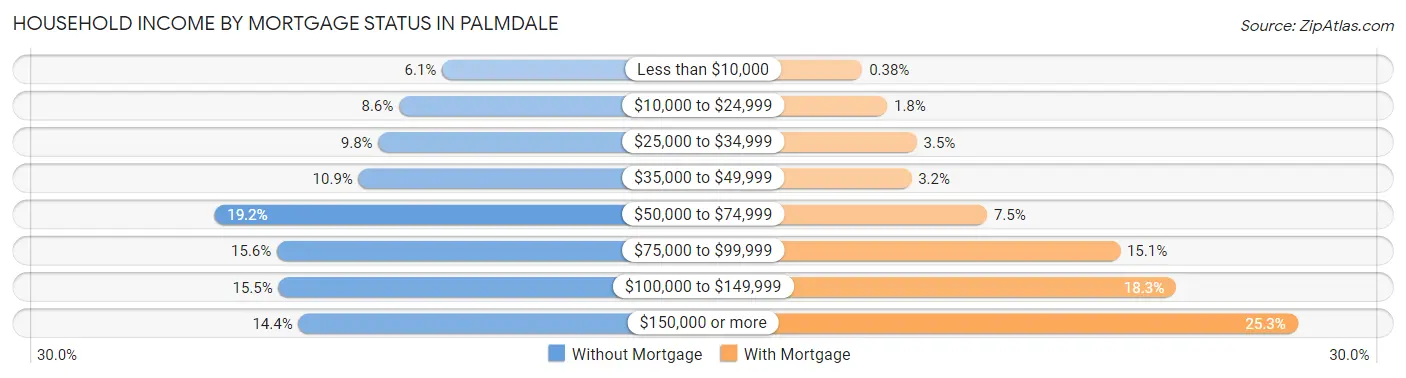
| Household Income | Without Mortgage | With Mortgage |
| Less than $10,000 | 462 (6.1%) | 90 (0.4%) |
| $10,000 to $24,999 | 647 (8.6%) | 423 (1.8%) |
| $25,000 to $34,999 | 736 (9.8%) | 818 (3.5%) |
| $35,000 to $49,999 | 821 (10.9%) | 747 (3.2%) |
| $50,000 to $74,999 | 1,442 (19.2%) | 1,762 (7.5%) |
| $75,000 to $99,999 | 1,172 (15.6%) | 3,547 (15.1%) |
| $100,000 to $149,999 | 1,166 (15.5%) | 4,297 (18.3%) |
| $150,000 or more | 1,080 (14.3%) | 5,927 (25.3%) |
| Total | 7,526 (100.0%) | 23,467 (100.0%) |
Property Value to Household Income Ratio in Palmdale
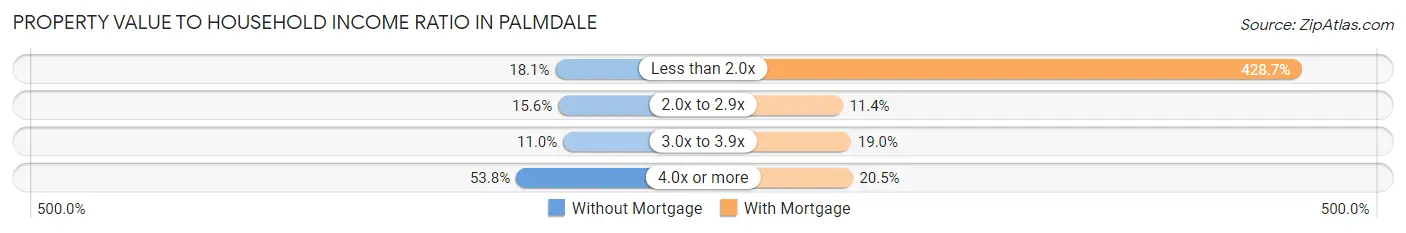
| Value-to-Income Ratio | Without Mortgage | With Mortgage |
| Less than 2.0x | 1,362 (18.1%) | 100,595 (428.7%) |
| 2.0x to 2.9x | 1,173 (15.6%) | 2,668 (11.4%) |
| 3.0x to 3.9x | 826 (11.0%) | 4,466 (19.0%) |
| 4.0x or more | 4,048 (53.8%) | 4,798 (20.4%) |
| Total | 7,526 (100.0%) | 23,467 (100.0%) |
Real Estate Taxes by Mortgage Status in Palmdale
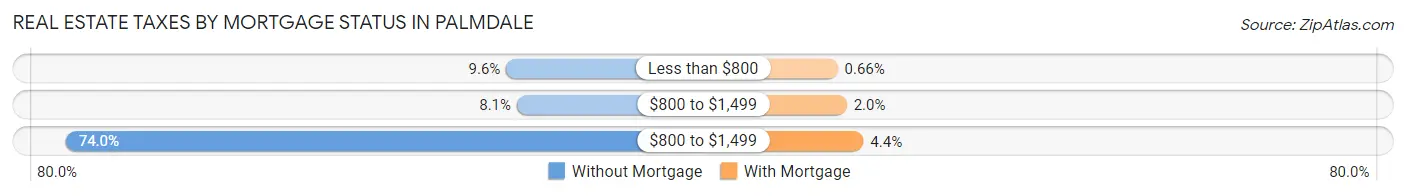
| Property Taxes | Without Mortgage | With Mortgage |
| Less than $800 | 725 (9.6%) | 156 (0.7%) |
| $800 to $1,499 | 607 (8.1%) | 470 (2.0%) |
| $800 to $1,499 | 5,567 (74.0%) | 1,043 (4.4%) |
| Total | 7,526 (100.0%) | 23,467 (100.0%) |
Health & Disability in Palmdale
Health Insurance Coverage by Age in Palmdale
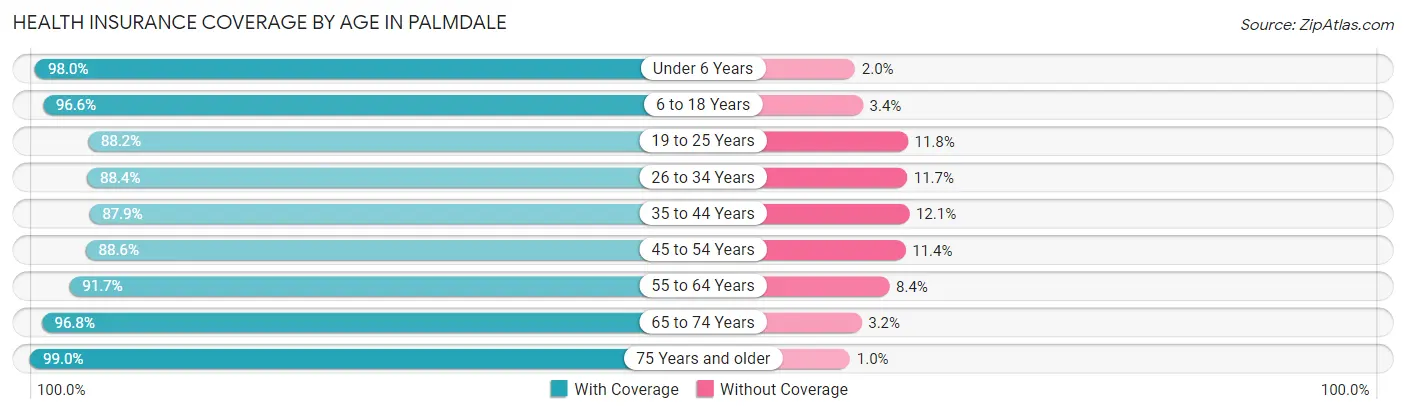
| Age Bracket | With Coverage | Without Coverage |
| Under 6 Years | 14,283 (98.0%) | 285 (2.0%) |
| 6 to 18 Years | 34,904 (96.6%) | 1,231 (3.4%) |
| 19 to 25 Years | 15,097 (88.2%) | 2,020 (11.8%) |
| 26 to 34 Years | 17,875 (88.3%) | 2,357 (11.7%) |
| 35 to 44 Years | 18,918 (87.9%) | 2,594 (12.1%) |
| 45 to 54 Years | 18,499 (88.6%) | 2,375 (11.4%) |
| 55 to 64 Years | 17,352 (91.6%) | 1,580 (8.4%) |
| 65 to 74 Years | 11,177 (96.8%) | 366 (3.2%) |
| 75 Years and older | 5,804 (99.0%) | 61 (1.0%) |
| Total | 153,909 (92.3%) | 12,869 (7.7%) |
Health Insurance Coverage by Citizenship Status in Palmdale
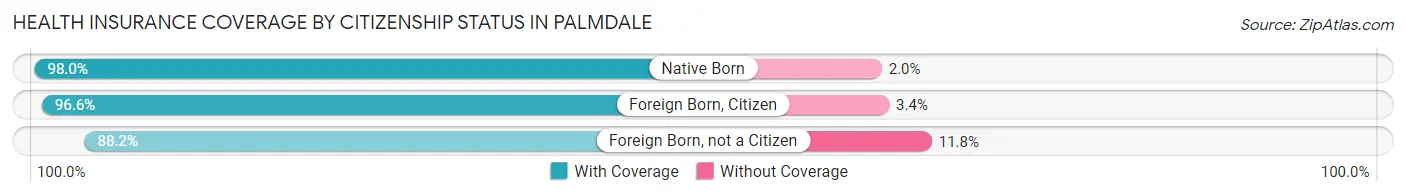
| Citizenship Status | With Coverage | Without Coverage |
| Native Born | 14,283 (98.0%) | 285 (2.0%) |
| Foreign Born, Citizen | 34,904 (96.6%) | 1,231 (3.4%) |
| Foreign Born, not a Citizen | 15,097 (88.2%) | 2,020 (11.8%) |
Health Insurance Coverage by Household Income in Palmdale
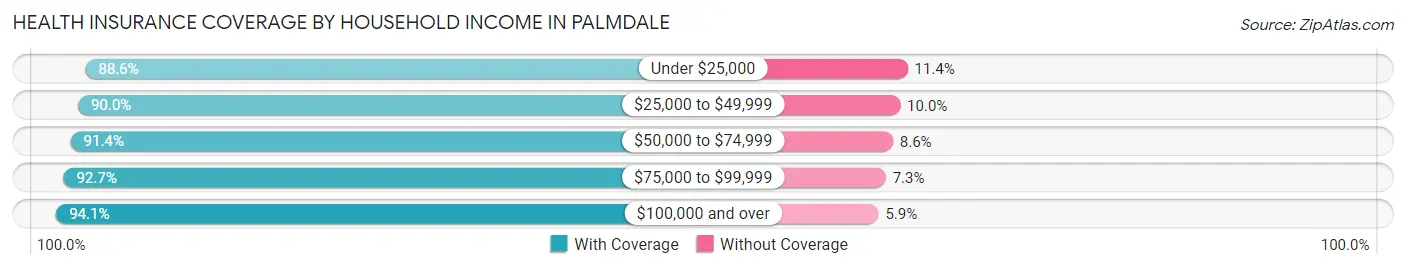
| Household Income | With Coverage | Without Coverage |
| Under $25,000 | 13,747 (88.6%) | 1,767 (11.4%) |
| $25,000 to $49,999 | 22,945 (90.0%) | 2,550 (10.0%) |
| $50,000 to $74,999 | 24,811 (91.4%) | 2,343 (8.6%) |
| $75,000 to $99,999 | 24,332 (92.7%) | 1,914 (7.3%) |
| $100,000 and over | 67,849 (94.1%) | 4,275 (5.9%) |
Public vs Private Health Insurance Coverage by Age in Palmdale
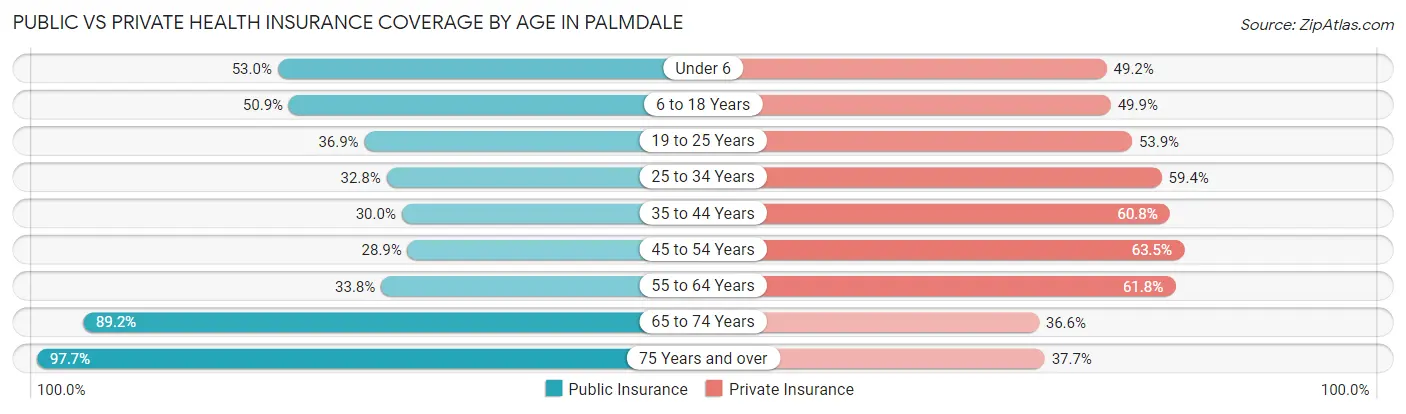
| Age Bracket | Public Insurance | Private Insurance |
| Under 6 | 7,722 (53.0%) | 7,160 (49.1%) |
| 6 to 18 Years | 18,408 (50.9%) | 18,038 (49.9%) |
| 19 to 25 Years | 6,319 (36.9%) | 9,220 (53.9%) |
| 25 to 34 Years | 6,641 (32.8%) | 12,012 (59.4%) |
| 35 to 44 Years | 6,453 (30.0%) | 13,086 (60.8%) |
| 45 to 54 Years | 6,034 (28.9%) | 13,248 (63.5%) |
| 55 to 64 Years | 6,405 (33.8%) | 11,708 (61.8%) |
| 65 to 74 Years | 10,293 (89.2%) | 4,221 (36.6%) |
| 75 Years and over | 5,731 (97.7%) | 2,209 (37.7%) |
| Total | 74,006 (44.4%) | 90,902 (54.5%) |
Disability Status by Sex by Age in Palmdale
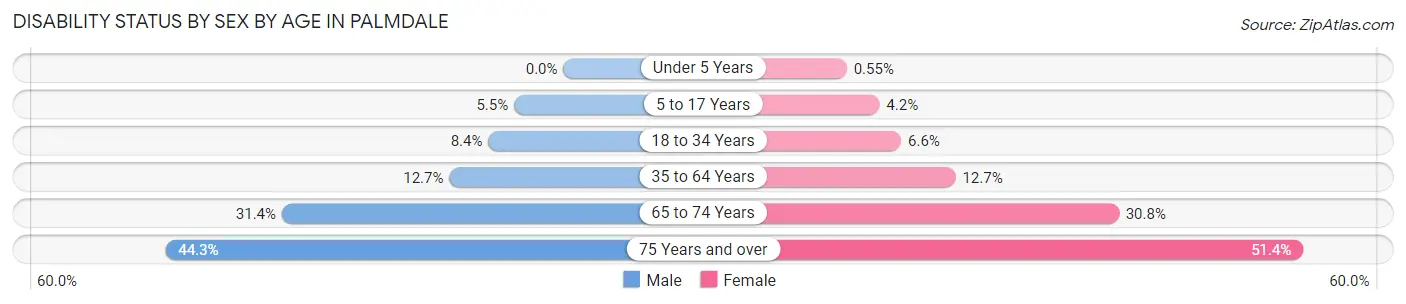
| Age Bracket | Male | Female |
| Under 5 Years | 0 (0.0%) | 33 (0.5%) |
| 5 to 17 Years | 1,074 (5.5%) | 707 (4.2%) |
| 18 to 34 Years | 1,688 (8.4%) | 1,290 (6.6%) |
| 35 to 64 Years | 3,743 (12.7%) | 4,033 (12.7%) |
| 65 to 74 Years | 1,625 (31.4%) | 1,961 (30.8%) |
| 75 Years and over | 1,079 (44.3%) | 1,763 (51.4%) |
Disability Class by Sex by Age in Palmdale
Disability Class: Hearing Difficulty
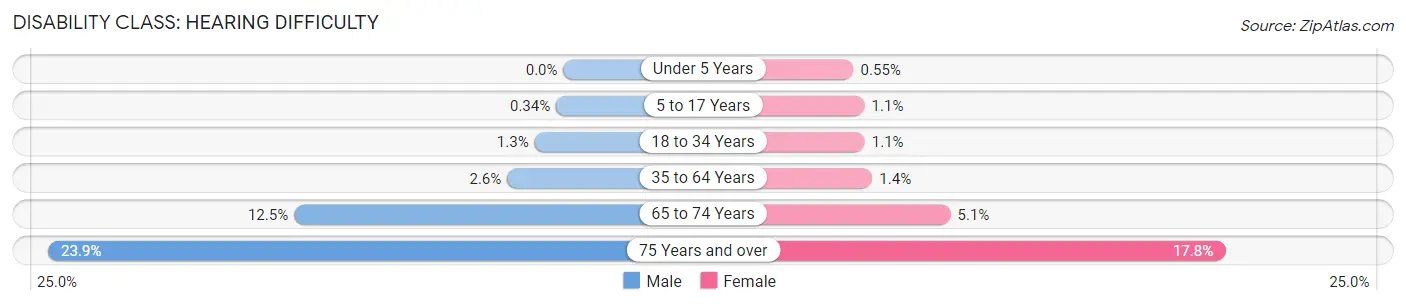
| Age Bracket | Male | Female |
| Under 5 Years | 0 (0.0%) | 33 (0.5%) |
| 5 to 17 Years | 67 (0.3%) | 179 (1.1%) |
| 18 to 34 Years | 271 (1.3%) | 209 (1.1%) |
| 35 to 64 Years | 769 (2.6%) | 452 (1.4%) |
| 65 to 74 Years | 648 (12.5%) | 321 (5.1%) |
| 75 Years and over | 582 (23.9%) | 610 (17.8%) |
Disability Class: Vision Difficulty
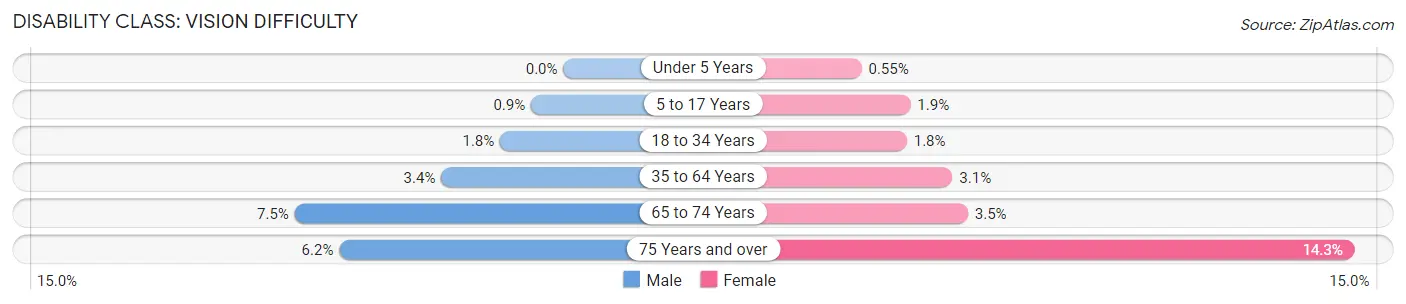
| Age Bracket | Male | Female |
| Under 5 Years | 0 (0.0%) | 33 (0.5%) |
| 5 to 17 Years | 176 (0.9%) | 323 (1.9%) |
| 18 to 34 Years | 355 (1.8%) | 353 (1.8%) |
| 35 to 64 Years | 1,003 (3.4%) | 980 (3.1%) |
| 65 to 74 Years | 388 (7.5%) | 223 (3.5%) |
| 75 Years and over | 152 (6.2%) | 490 (14.3%) |
Disability Class: Cognitive Difficulty
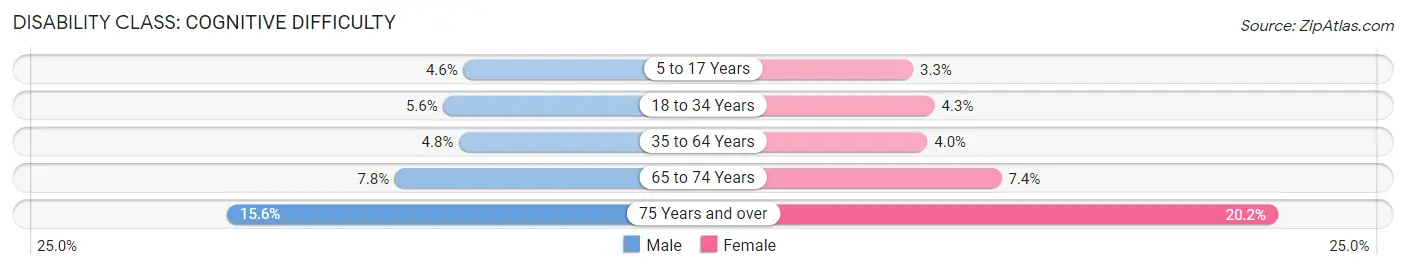
| Age Bracket | Male | Female |
| 5 to 17 Years | 905 (4.6%) | 559 (3.3%) |
| 18 to 34 Years | 1,123 (5.6%) | 842 (4.3%) |
| 35 to 64 Years | 1,423 (4.8%) | 1,266 (4.0%) |
| 65 to 74 Years | 405 (7.8%) | 471 (7.4%) |
| 75 Years and over | 380 (15.6%) | 694 (20.2%) |
Disability Class: Ambulatory Difficulty
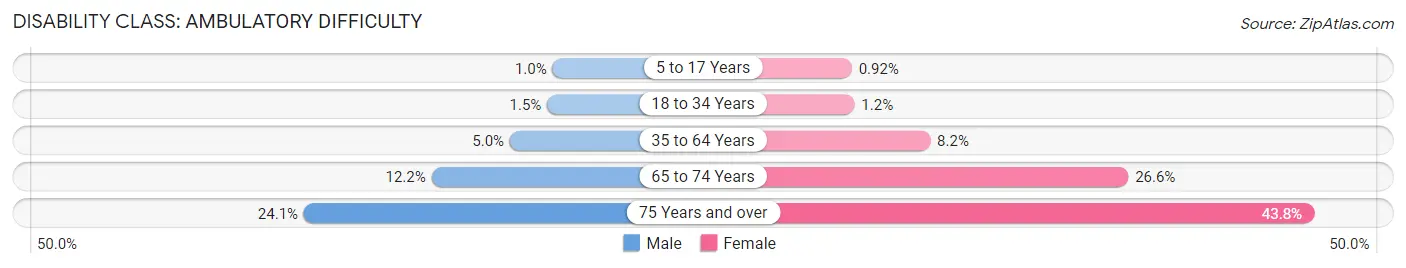
| Age Bracket | Male | Female |
| 5 to 17 Years | 196 (1.0%) | 156 (0.9%) |
| 18 to 34 Years | 303 (1.5%) | 228 (1.2%) |
| 35 to 64 Years | 1,461 (5.0%) | 2,613 (8.2%) |
| 65 to 74 Years | 634 (12.2%) | 1,690 (26.6%) |
| 75 Years and over | 586 (24.1%) | 1,503 (43.8%) |
Disability Class: Self-Care Difficulty
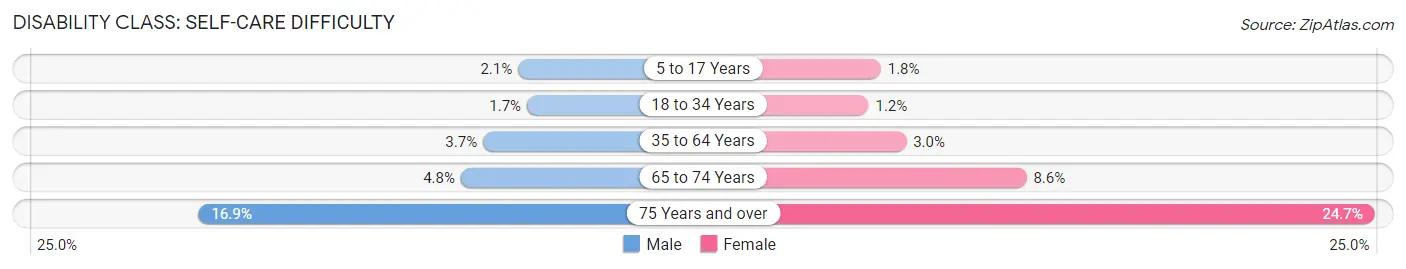
| Age Bracket | Male | Female |
| 5 to 17 Years | 411 (2.1%) | 306 (1.8%) |
| 18 to 34 Years | 341 (1.7%) | 242 (1.2%) |
| 35 to 64 Years | 1,098 (3.7%) | 953 (3.0%) |
| 65 to 74 Years | 247 (4.8%) | 545 (8.6%) |
| 75 Years and over | 412 (16.9%) | 848 (24.7%) |
Technology Access in Palmdale
Computing Device Access in Palmdale
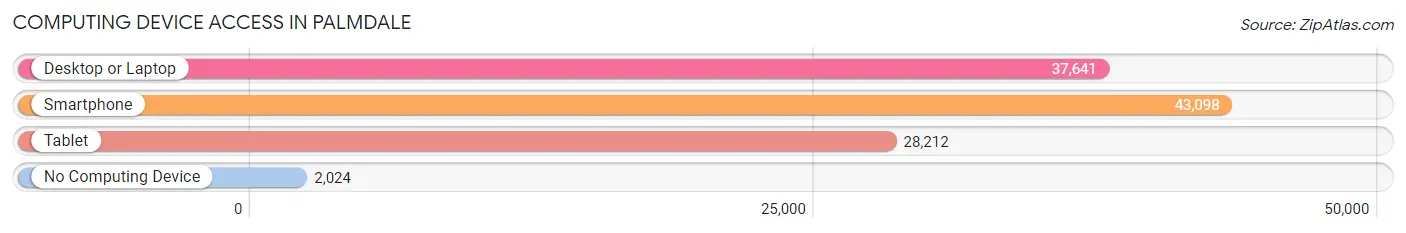
| Device Type | # Households | % Households |
| Desktop or Laptop | 37,641 | 80.8% |
| Smartphone | 43,098 | 92.5% |
| Tablet | 28,212 | 60.6% |
| No Computing Device | 2,024 | 4.3% |
| Total | 46,588 | 100.0% |
Internet Access in Palmdale
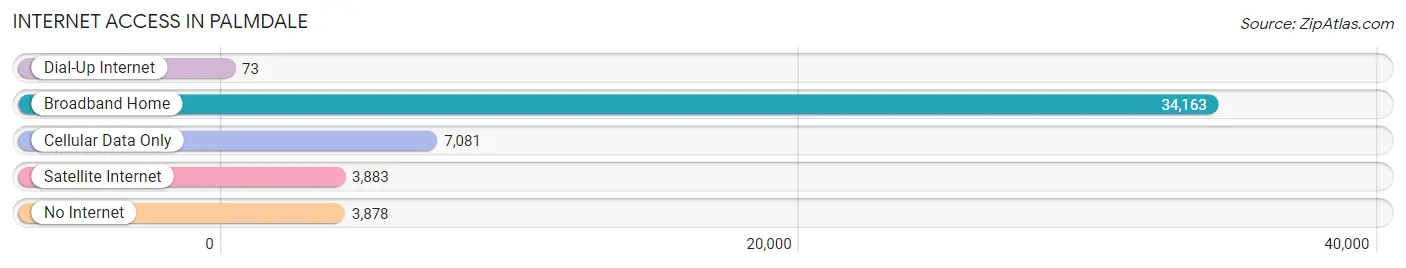
| Internet Type | # Households | % Households |
| Dial-Up Internet | 73 | 0.2% |
| Broadband Home | 34,163 | 73.3% |
| Cellular Data Only | 7,081 | 15.2% |
| Satellite Internet | 3,883 | 8.3% |
| No Internet | 3,878 | 8.3% |
| Total | 46,588 | 100.0% |
Palmdale Summary
Palmdale, California is a city located in the Antelope Valley of the western Mojave Desert in Los Angeles County. It is situated in the northern part of the county, approximately 60 miles northeast of downtown Los Angeles. The city is home to a population of over 152,750 people, making it the eighth largest city in Los Angeles County and the 42nd largest city in California.
History
The area that is now Palmdale was originally inhabited by the Tataviam people, who were a branch of the Tongva people. The Tataviam people lived in the area for thousands of years before the arrival of Europeans. The first Europeans to settle in the area were Spanish missionaries, who established a mission in the area in 1771. The area was later settled by ranchers in the late 19th century, and the city of Palmdale was officially incorporated in 1962.
Geography
Palmdale is located in the Antelope Valley of the western Mojave Desert in Los Angeles County. It is situated in the northern part of the county, approximately 60 miles northeast of downtown Los Angeles. The city covers an area of about 94.6 square miles, with a population density of 1,611 people per square mile. The city is located at an elevation of 2,619 feet above sea level.
The city is bordered by the Angeles National Forest to the north, the San Gabriel Mountains to the east, the San Bernardino Mountains to the south, and the Mojave Desert to the west. The city is located in a semi-arid climate zone, with hot summers and mild winters. The average annual temperature is 68 degrees Fahrenheit, with an average high of 91 degrees in the summer and an average low of 44 degrees in the winter.
Economy
Palmdale’s economy is largely based on aerospace and defense, with the city being home to several major aerospace and defense companies, including Lockheed Martin, Boeing, and Northrop Grumman. The city is also home to several other major employers, including Palmdale Regional Medical Center, Palmdale School District, and the Antelope Valley Mall.
The city’s unemployment rate was 5.2% in 2019, which is lower than the national average of 3.7%. The median household income in Palmdale is $63,845, which is higher than the national average of $61,937. The city’s poverty rate is 17.2%, which is higher than the national average of 11.8%.
Demographics
As of 2019, Palmdale had a population of 152,750 people. The city’s population is diverse, with the largest racial/ethnic groups being White (47.3%), Hispanic or Latino (41.2%), African American (7.2%), and Asian (3.2%). The city’s median age is 33.7 years, with a gender ratio of 49.7% male and 50.3% female.
Palmdale is a relatively young city, with a median age of 33.7 years. The city’s population is also growing, with a population growth rate of 2.2% from 2010 to 2019. The city’s population is expected to continue to grow in the coming years, as the city continues to attract new residents and businesses.
Common Questions
What is Per Capita Income in Palmdale?
Per Capita income in Palmdale is $27,882.
What is the Median Family Income in Palmdale?
Median Family Income in Palmdale is $82,481.
What is the Median Household income in Palmdale?
Median Household Income in Palmdale is $78,414.
What is Income or Wage Gap in Palmdale?
Income or Wage Gap in Palmdale is 34.7%.
Women in Palmdale earn 65.3 cents for every dollar earned by a man.
What is Family Income Deficit in Palmdale?
Family Income Deficit in Palmdale is $12,341.
Families that are below poverty line in Palmdale earn $12,341 less on average than the poverty threshold level.
What is Inequality or Gini Index in Palmdale?
Inequality or Gini Index in Palmdale is 0.42.
What is the Total Population of Palmdale?
Total Population of Palmdale is 166,895.
What is the Total Male Population of Palmdale?
Total Male Population of Palmdale is 82,777.
What is the Total Female Population of Palmdale?
Total Female Population of Palmdale is 84,118.
What is the Ratio of Males per 100 Females in Palmdale?
There are 98.41 Males per 100 Females in Palmdale.
What is the Ratio of Females per 100 Males in Palmdale?
There are 101.62 Females per 100 Males in Palmdale.
What is the Median Population Age in Palmdale?
Median Population Age in Palmdale is 33.0 Years.
What is the Average Family Size in Palmdale
Average Family Size in Palmdale is 3.9 People.
What is the Average Household Size in Palmdale
Average Household Size in Palmdale is 3.6 People.
How Large is the Labor Force in Palmdale?
There are 75,756 People in the Labor Forcein in Palmdale.
What is the Percentage of People in the Labor Force in Palmdale?
61.1% of People are in the Labor Force in Palmdale.
What is the Unemployment Rate in Palmdale?
Unemployment Rate in Palmdale is 7.4%.