Garden Grove, CA Map & Demographics
Garden Grove Map
Garden Grove Overview
$31,132
PER CAPITA INCOME
$91,469
AVG FAMILY INCOME
$86,139
AVG HOUSEHOLD INCOME
21.3%
WAGE / INCOME GAP [ % ]
78.7¢/ $1
WAGE / INCOME GAP [ $ ]
$11,782
FAMILY INCOME DEFICIT
0.42
INEQUALITY / GINI INDEX
171,637
TOTAL POPULATION
86,329
MALE POPULATION
85,308
FEMALE POPULATION
101.20
MALES / 100 FEMALES
98.82
FEMALES / 100 MALES
39.2
MEDIAN AGE
3.9
AVG FAMILY SIZE
3.5
AVG HOUSEHOLD SIZE
89,937
LABOR FORCE [ PEOPLE ]
64.3%
PERCENT IN LABOR FORCE
5.8%
UNEMPLOYMENT RATE
Income in Garden Grove
Income Overview in Garden Grove
Per Capita Income in Garden Grove is $31,132, while median incomes of families and households are $91,469 and $86,139 respectively.
| Characteristic | Number | Measure |
| Per Capita Income | 171,637 | $31,132 |
| Median Family Income | 37,486 | $91,469 |
| Mean Family Income | 37,486 | $109,625 |
| Median Household Income | 48,183 | $86,139 |
| Mean Household Income | 48,183 | $105,717 |
| Income Deficit | 37,486 | $11,782 |
| Wage / Income Gap (%) | 171,637 | 21.34% |
| Wage / Income Gap ($) | 171,637 | 78.66¢ per $1 |
| Gini / Inequality Index | 171,637 | 0.42 |
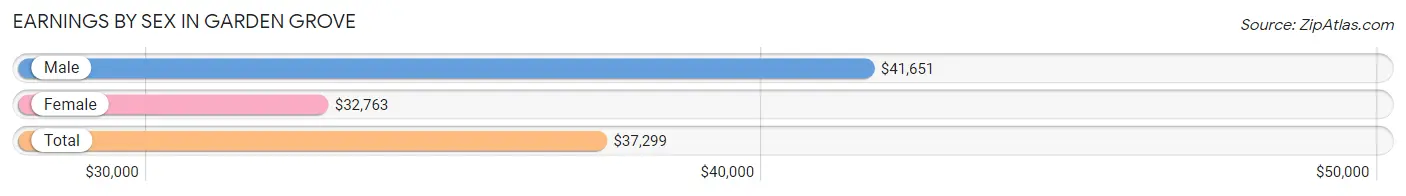
Earnings by Sex in Garden Grove
Average Earnings in Garden Grove are $37,299, $41,651 for men and $32,763 for women, a difference of 21.3%.
| Sex | Number | Average Earnings |
| Male | 49,018 (54.0%) | $41,651 |
| Female | 41,769 (46.0%) | $32,763 |
| Total | 90,787 (100.0%) | $37,299 |
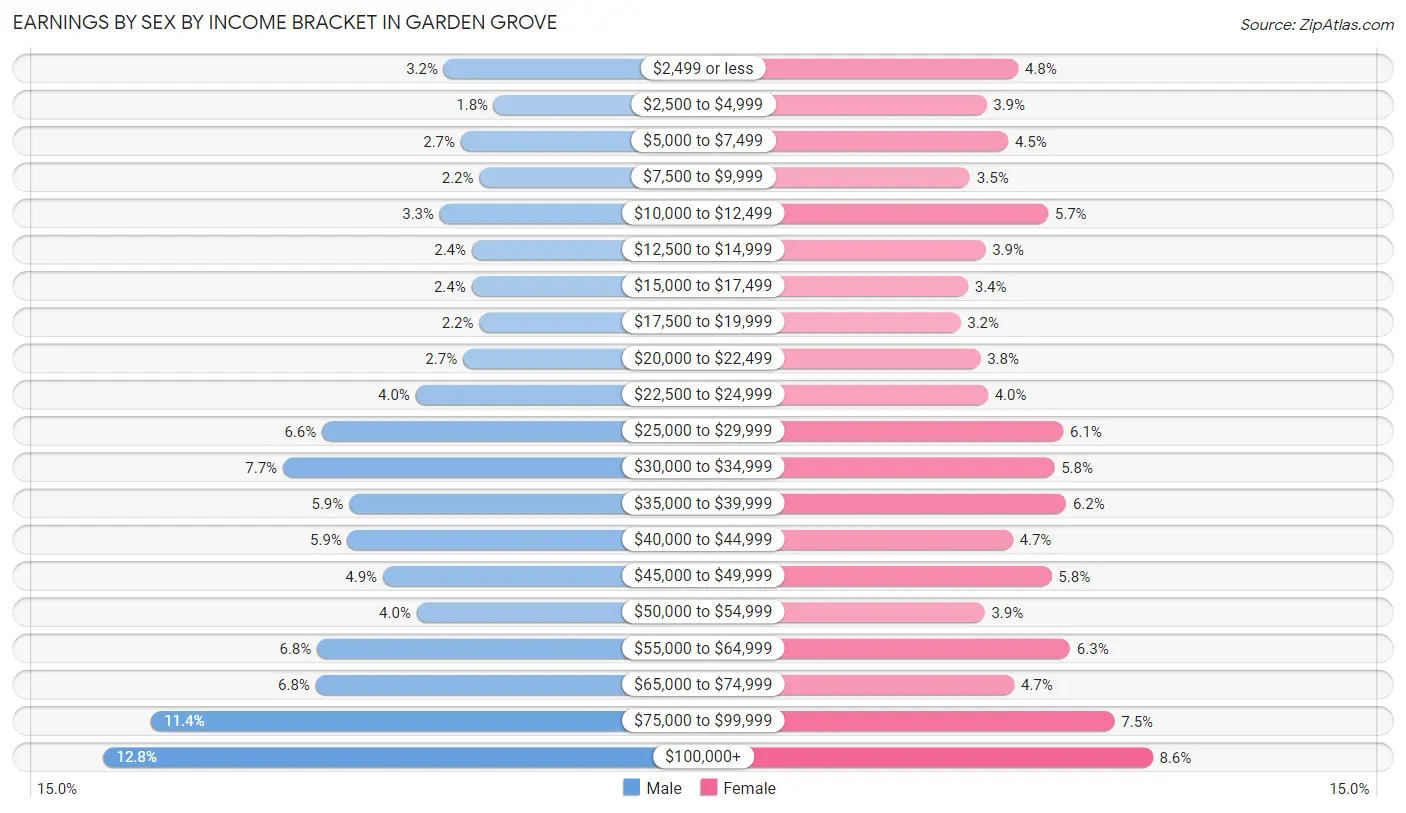
Earnings by Sex by Income Bracket in Garden Grove
The most common earnings brackets in Garden Grove are $100,000+ for men (6,264 | 12.8%) and $100,000+ for women (3,586 | 8.6%).
| Income | Male | Female |
| $2,499 or less | 1,578 (3.2%) | 2,010 (4.8%) |
| $2,500 to $4,999 | 887 (1.8%) | 1,636 (3.9%) |
| $5,000 to $7,499 | 1,345 (2.7%) | 1,893 (4.5%) |
| $7,500 to $9,999 | 1,088 (2.2%) | 1,446 (3.5%) |
| $10,000 to $12,499 | 1,631 (3.3%) | 2,362 (5.7%) |
| $12,500 to $14,999 | 1,192 (2.4%) | 1,623 (3.9%) |
| $15,000 to $17,499 | 1,197 (2.4%) | 1,420 (3.4%) |
| $17,500 to $19,999 | 1,087 (2.2%) | 1,332 (3.2%) |
| $20,000 to $22,499 | 1,313 (2.7%) | 1,566 (3.7%) |
| $22,500 to $24,999 | 1,965 (4.0%) | 1,654 (4.0%) |
| $25,000 to $29,999 | 3,253 (6.6%) | 2,540 (6.1%) |
| $30,000 to $34,999 | 3,792 (7.7%) | 2,437 (5.8%) |
| $35,000 to $39,999 | 2,881 (5.9%) | 2,573 (6.2%) |
| $40,000 to $44,999 | 2,900 (5.9%) | 1,947 (4.7%) |
| $45,000 to $49,999 | 2,418 (4.9%) | 2,400 (5.8%) |
| $50,000 to $54,999 | 1,950 (4.0%) | 1,617 (3.9%) |
| $55,000 to $64,999 | 3,324 (6.8%) | 2,621 (6.3%) |
| $65,000 to $74,999 | 3,343 (6.8%) | 1,963 (4.7%) |
| $75,000 to $99,999 | 5,610 (11.4%) | 3,143 (7.5%) |
| $100,000+ | 6,264 (12.8%) | 3,586 (8.6%) |
| Total | 49,018 (100.0%) | 41,769 (100.0%) |
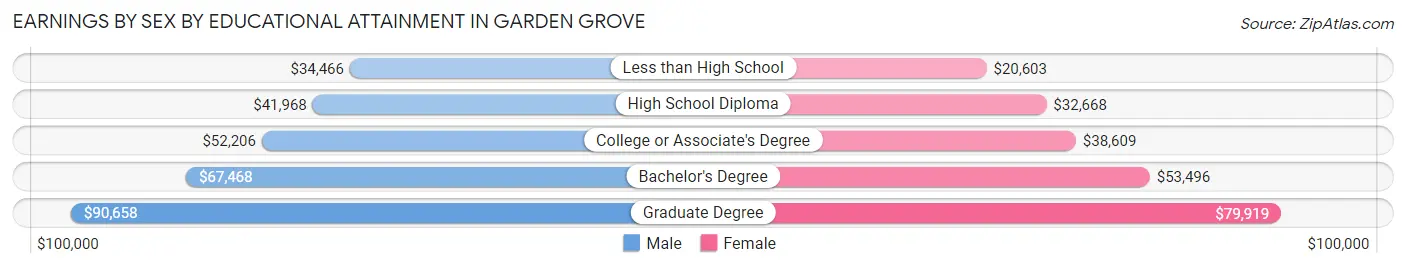
Earnings by Sex by Educational Attainment in Garden Grove
Average earnings in Garden Grove are $46,199 for men and $36,830 for women, a difference of 20.3%. Men with an educational attainment of graduate degree enjoy the highest average annual earnings of $90,658, while those with less than high school education earn the least with $34,466. Women with an educational attainment of graduate degree earn the most with the average annual earnings of $79,919, while those with less than high school education have the smallest earnings of $20,603.
| Educational Attainment | Male Income | Female Income |
| Less than High School | $34,466 | $20,603 |
| High School Diploma | $41,968 | $32,668 |
| College or Associate's Degree | $52,206 | $38,609 |
| Bachelor's Degree | $67,468 | $53,496 |
| Graduate Degree | $90,658 | $79,919 |
| Total | $46,199 | $36,830 |
Family Income in Garden Grove
Family Income Brackets in Garden Grove
According to the Garden Grove family income data, there are 7,910 families falling into the $100,000 to $149,999 income range, which is the most common income bracket and makes up 21.1% of all families. Conversely, the $10,000 to $14,999 income bracket is the least frequent group with only 675 families (1.8%) belonging to this category.
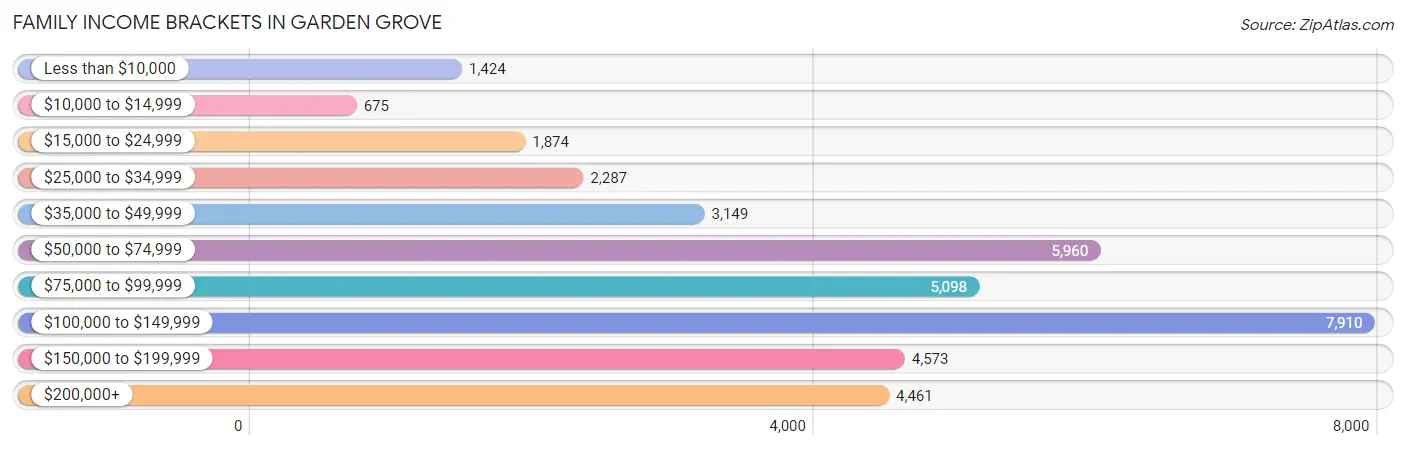
| Income Bracket | # Families | % Families |
| Less than $10,000 | 1,424 | 3.8% |
| $10,000 to $14,999 | 675 | 1.8% |
| $15,000 to $24,999 | 1,874 | 5.0% |
| $25,000 to $34,999 | 2,287 | 6.1% |
| $35,000 to $49,999 | 3,149 | 8.4% |
| $50,000 to $74,999 | 5,960 | 15.9% |
| $75,000 to $99,999 | 5,098 | 13.6% |
| $100,000 to $149,999 | 7,910 | 21.1% |
| $150,000 to $199,999 | 4,573 | 12.2% |
| $200,000+ | 4,461 | 11.9% |
Family Income by Famaliy Size in Garden Grove
7+ person families (2,155 | 5.8%) account for the highest median family income in Garden Grove with $141,306 per family, while 2-person families (10,918 | 29.1%) have the highest median income of $34,662 per family member.
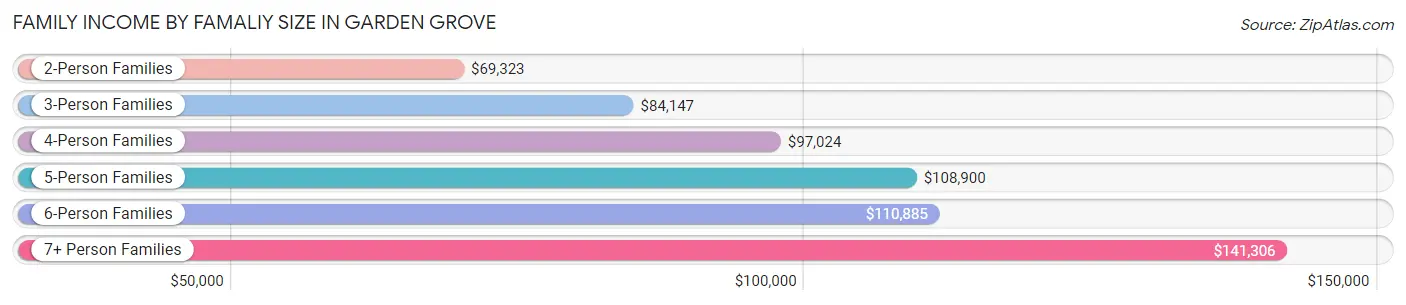
| Income Bracket | # Families | Median Income |
| 2-Person Families | 10,918 (29.1%) | $69,323 |
| 3-Person Families | 8,778 (23.4%) | $84,147 |
| 4-Person Families | 8,135 (21.7%) | $97,024 |
| 5-Person Families | 4,950 (13.2%) | $108,900 |
| 6-Person Families | 2,550 (6.8%) | $110,885 |
| 7+ Person Families | 2,155 (5.8%) | $141,306 |
| Total | 37,486 (100.0%) | $91,469 |
Family Income by Number of Earners in Garden Grove
The median family income in Garden Grove is $91,469, with families comprising 3+ earners (9,813) having the highest median family income of $139,291, while families with no earners (3,624) have the lowest median family income of $28,308, accounting for 26.2% and 9.7% of families, respectively.
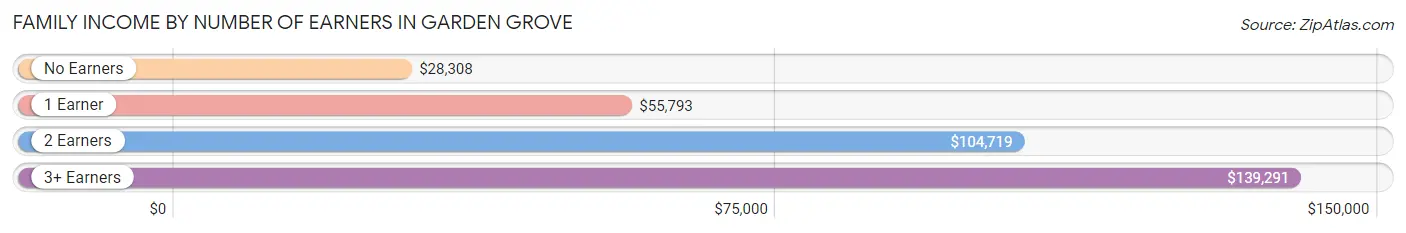
| Number of Earners | # Families | Median Income |
| No Earners | 3,624 (9.7%) | $28,308 |
| 1 Earner | 10,567 (28.2%) | $55,793 |
| 2 Earners | 13,482 (36.0%) | $104,719 |
| 3+ Earners | 9,813 (26.2%) | $139,291 |
| Total | 37,486 (100.0%) | $91,469 |
Household Income in Garden Grove
Household Income Brackets in Garden Grove
With 9,540 households falling in the category, the $100,000 to $149,999 income range is the most frequent in Garden Grove, accounting for 19.8% of all households. In contrast, only 1,397 households (2.9%) fall into the $10,000 to $14,999 income bracket, making it the least populous group.
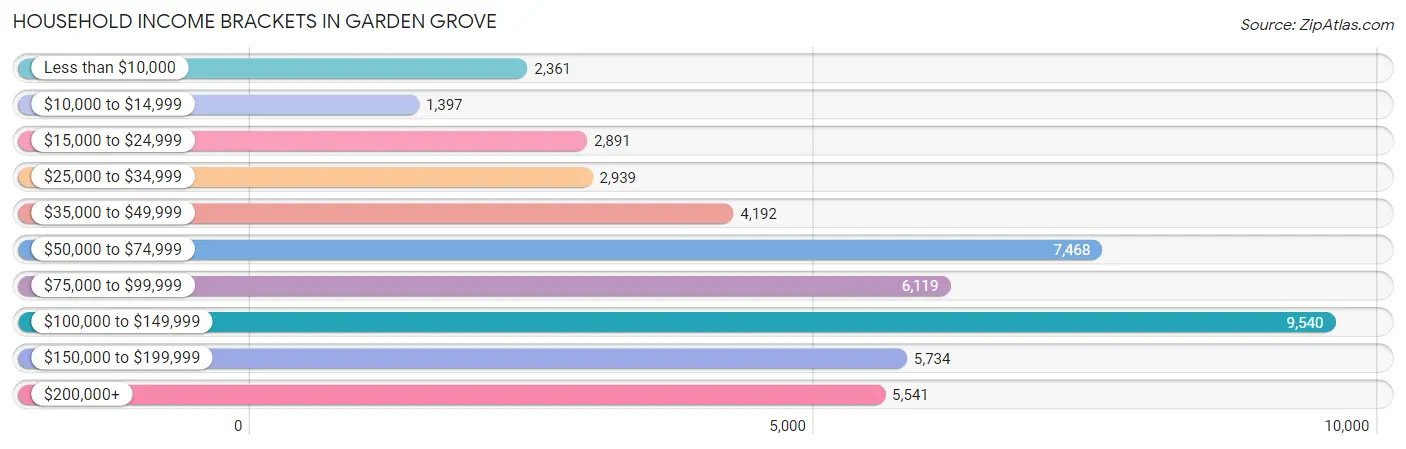
| Income Bracket | # Households | % Households |
| Less than $10,000 | 2,361 | 4.9% |
| $10,000 to $14,999 | 1,397 | 2.9% |
| $15,000 to $24,999 | 2,891 | 6.0% |
| $25,000 to $34,999 | 2,939 | 6.1% |
| $35,000 to $49,999 | 4,192 | 8.7% |
| $50,000 to $74,999 | 7,468 | 15.5% |
| $75,000 to $99,999 | 6,119 | 12.7% |
| $100,000 to $149,999 | 9,540 | 19.8% |
| $150,000 to $199,999 | 5,734 | 11.9% |
| $200,000+ | 5,541 | 11.5% |
Household Income by Householder Age in Garden Grove
The median household income in Garden Grove is $86,139, with the highest median household income of $103,110 found in the 45 to 64 years age bracket for the primary householder. A total of 22,452 households (46.6%) fall into this category. Meanwhile, the 65+ years age bracket for the primary householder has the lowest median household income of $56,215, with 11,535 households (23.9%) in this group.
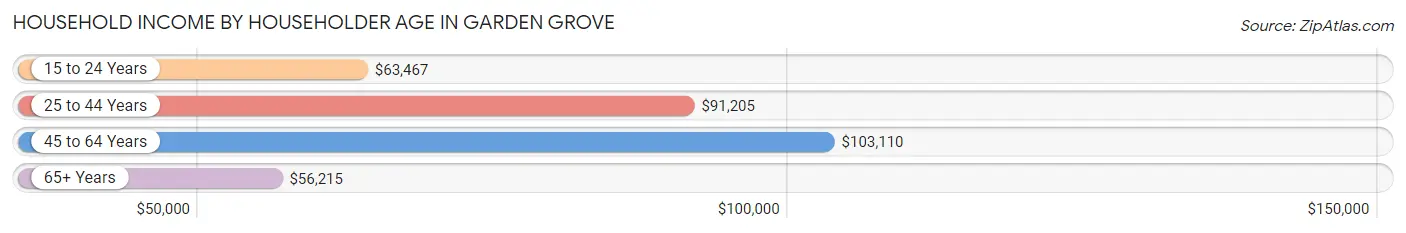
| Income Bracket | # Households | Median Income |
| 15 to 24 Years | 855 (1.8%) | $63,467 |
| 25 to 44 Years | 13,341 (27.7%) | $91,205 |
| 45 to 64 Years | 22,452 (46.6%) | $103,110 |
| 65+ Years | 11,535 (23.9%) | $56,215 |
| Total | 48,183 (100.0%) | $86,139 |
Poverty in Garden Grove
Income Below Poverty by Sex and Age in Garden Grove
With 11.6% poverty level for males and 13.7% for females among the residents of Garden Grove, 5 year old males and 75 year old and over females are the most vulnerable to poverty, with 197 males (19.6%) and 1,253 females (19.4%) in their respective age groups living below the poverty level.
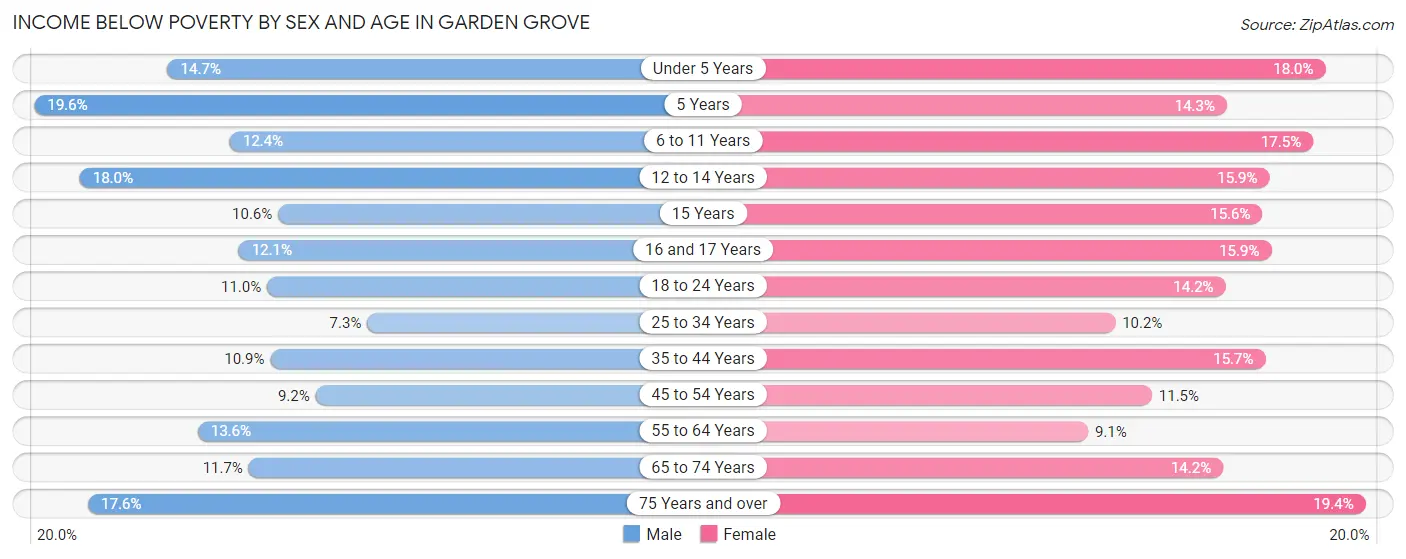
| Age Bracket | Male | Female |
| Under 5 Years | 586 (14.7%) | 798 (17.9%) |
| 5 Years | 197 (19.6%) | 116 (14.3%) |
| 6 to 11 Years | 727 (12.4%) | 999 (17.5%) |
| 12 to 14 Years | 651 (17.9%) | 459 (15.9%) |
| 15 Years | 156 (10.6%) | 195 (15.6%) |
| 16 and 17 Years | 273 (12.0%) | 385 (15.9%) |
| 18 to 24 Years | 918 (11.0%) | 1,123 (14.2%) |
| 25 to 34 Years | 932 (7.3%) | 1,195 (10.2%) |
| 35 to 44 Years | 1,124 (10.9%) | 1,554 (15.7%) |
| 45 to 54 Years | 1,200 (9.2%) | 1,461 (11.5%) |
| 55 to 64 Years | 1,643 (13.6%) | 1,063 (9.1%) |
| 65 to 74 Years | 767 (11.7%) | 953 (14.1%) |
| 75 Years and over | 764 (17.6%) | 1,253 (19.4%) |
| Total | 9,938 (11.6%) | 11,554 (13.7%) |
Income Above Poverty by Sex and Age in Garden Grove
According to the poverty statistics in Garden Grove, males aged 25 to 34 years and females aged 55 to 64 years are the age groups that are most secure financially, with 92.7% of males and 90.9% of females in these age groups living above the poverty line.
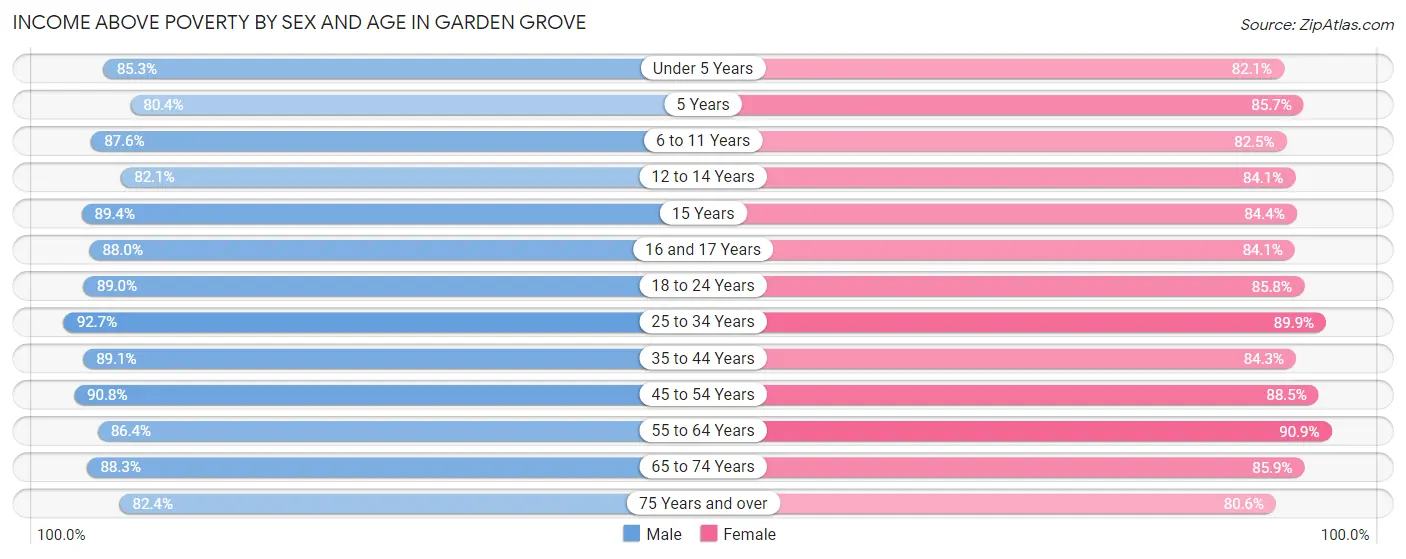
| Age Bracket | Male | Female |
| Under 5 Years | 3,402 (85.3%) | 3,648 (82.1%) |
| 5 Years | 806 (80.4%) | 696 (85.7%) |
| 6 to 11 Years | 5,144 (87.6%) | 4,712 (82.5%) |
| 12 to 14 Years | 2,975 (82.1%) | 2,433 (84.1%) |
| 15 Years | 1,317 (89.4%) | 1,054 (84.4%) |
| 16 and 17 Years | 1,993 (87.9%) | 2,031 (84.1%) |
| 18 to 24 Years | 7,424 (89.0%) | 6,764 (85.8%) |
| 25 to 34 Years | 11,867 (92.7%) | 10,579 (89.8%) |
| 35 to 44 Years | 9,203 (89.1%) | 8,329 (84.3%) |
| 45 to 54 Years | 11,849 (90.8%) | 11,230 (88.5%) |
| 55 to 64 Years | 10,466 (86.4%) | 10,562 (90.9%) |
| 65 to 74 Years | 5,798 (88.3%) | 5,780 (85.9%) |
| 75 Years and over | 3,566 (82.4%) | 5,194 (80.6%) |
| Total | 75,810 (88.4%) | 73,012 (86.3%) |
Income Below Poverty Among Married-Couple Families in Garden Grove
The poverty statistics for married-couple families in Garden Grove show that 6.5% or 1,654 of the total 25,354 families live below the poverty line. Families with 3 or 4 children have the highest poverty rate of 11.1%, comprising of 243 families. On the other hand, families with no children have the lowest poverty rate of 4.9%, which includes 647 families.
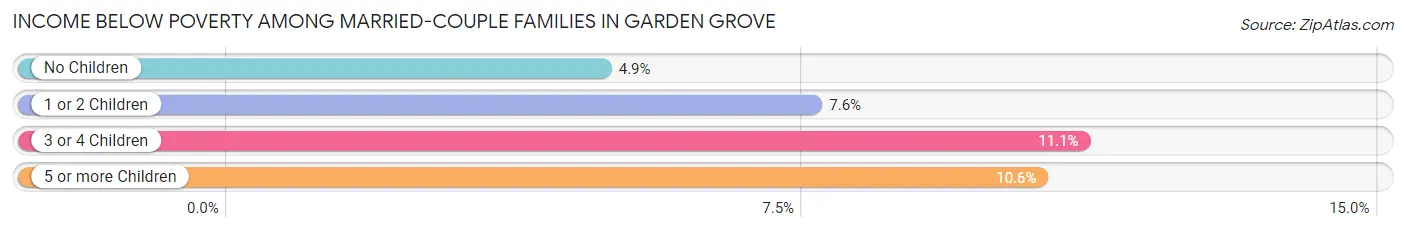
| Children | Above Poverty | Below Poverty |
| No Children | 12,622 (95.1%) | 647 (4.9%) |
| 1 or 2 Children | 8,892 (92.4%) | 735 (7.6%) |
| 3 or 4 Children | 1,941 (88.9%) | 243 (11.1%) |
| 5 or more Children | 245 (89.4%) | 29 (10.6%) |
| Total | 23,700 (93.5%) | 1,654 (6.5%) |
Income Below Poverty Among Single-Parent Households in Garden Grove
According to the poverty data in Garden Grove, 12.3% or 480 single-father households and 19.7% or 1,624 single-mother households are living below the poverty line. Among single-father households, those with 5 or more children have the highest poverty rate, with 23 households (27.1%) experiencing poverty. Likewise, among single-mother households, those with 5 or more children have the highest poverty rate, with 23 households (69.7%) falling below the poverty line.
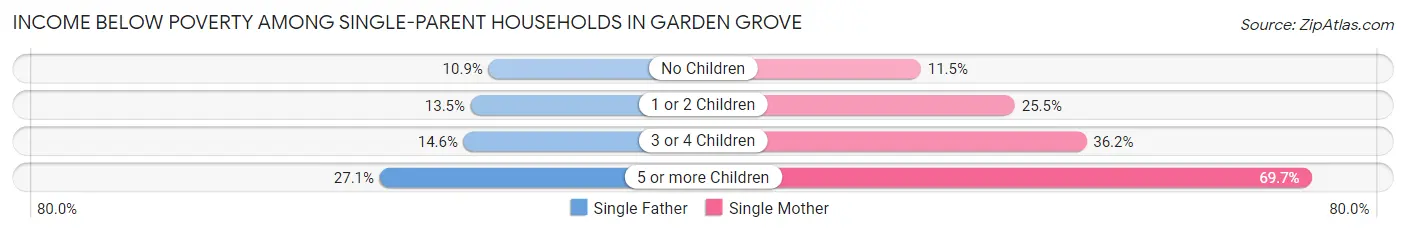
| Children | Single Father | Single Mother |
| No Children | 259 (10.8%) | 452 (11.5%) |
| 1 or 2 Children | 137 (13.5%) | 935 (25.5%) |
| 3 or 4 Children | 61 (14.6%) | 214 (36.1%) |
| 5 or more Children | 23 (27.1%) | 23 (69.7%) |
| Total | 480 (12.3%) | 1,624 (19.7%) |
Income Below Poverty Among Married-Couple vs Single-Parent Households in Garden Grove
The poverty data for Garden Grove shows that 1,654 of the married-couple family households (6.5%) and 2,104 of the single-parent households (17.3%) are living below the poverty level. Within the married-couple family households, those with 3 or 4 children have the highest poverty rate, with 243 households (11.1%) falling below the poverty line. Among the single-parent households, those with 5 or more children have the highest poverty rate, with 46 household (39.0%) living below poverty.
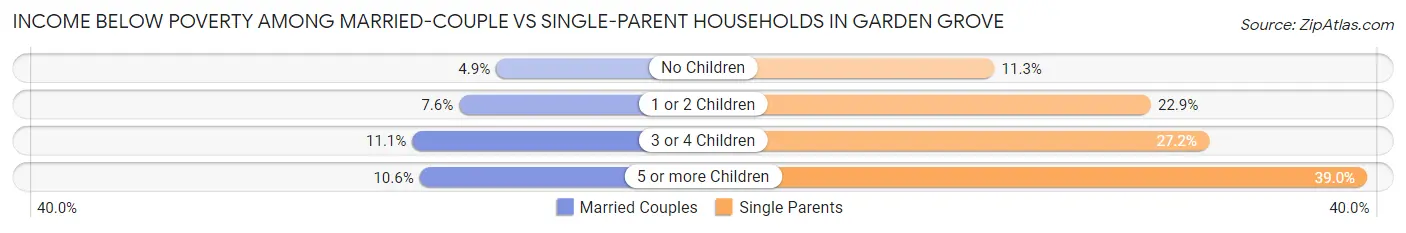
| Children | Married-Couple Families | Single-Parent Households |
| No Children | 647 (4.9%) | 711 (11.3%) |
| 1 or 2 Children | 735 (7.6%) | 1,072 (22.9%) |
| 3 or 4 Children | 243 (11.1%) | 275 (27.2%) |
| 5 or more Children | 29 (10.6%) | 46 (39.0%) |
| Total | 1,654 (6.5%) | 2,104 (17.3%) |
Race in Garden Grove
The most populous races in Garden Grove are Asian (71,510 | 41.7%), Hispanic or Latino (64,048 | 37.3%), and White / Caucasian (54,787 | 31.9%).
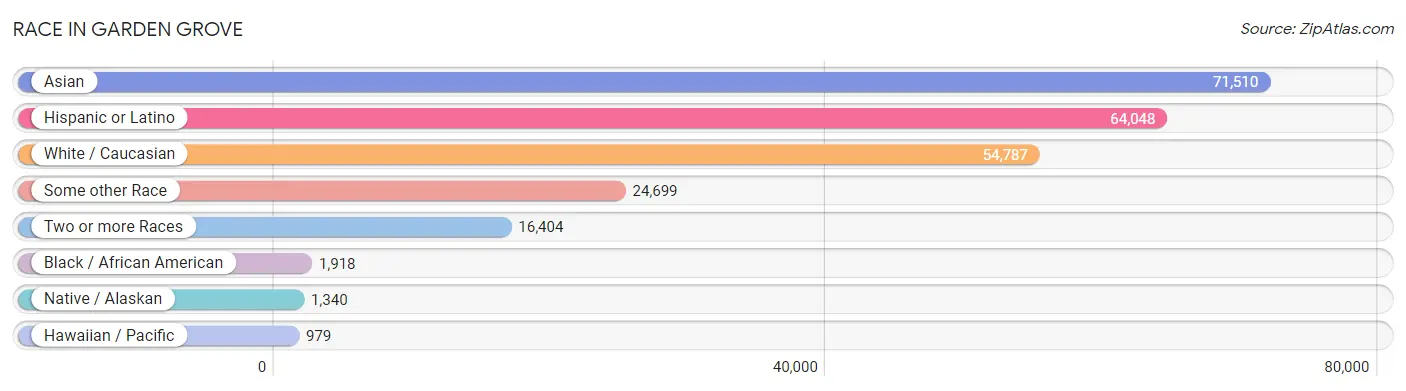
| Race | # Population | % Population |
| Asian | 71,510 | 41.7% |
| Black / African American | 1,918 | 1.1% |
| Hawaiian / Pacific | 979 | 0.6% |
| Hispanic or Latino | 64,048 | 37.3% |
| Native / Alaskan | 1,340 | 0.8% |
| White / Caucasian | 54,787 | 31.9% |
| Two or more Races | 16,404 | 9.6% |
| Some other Race | 24,699 | 14.4% |
| Total | 171,637 | 100.0% |
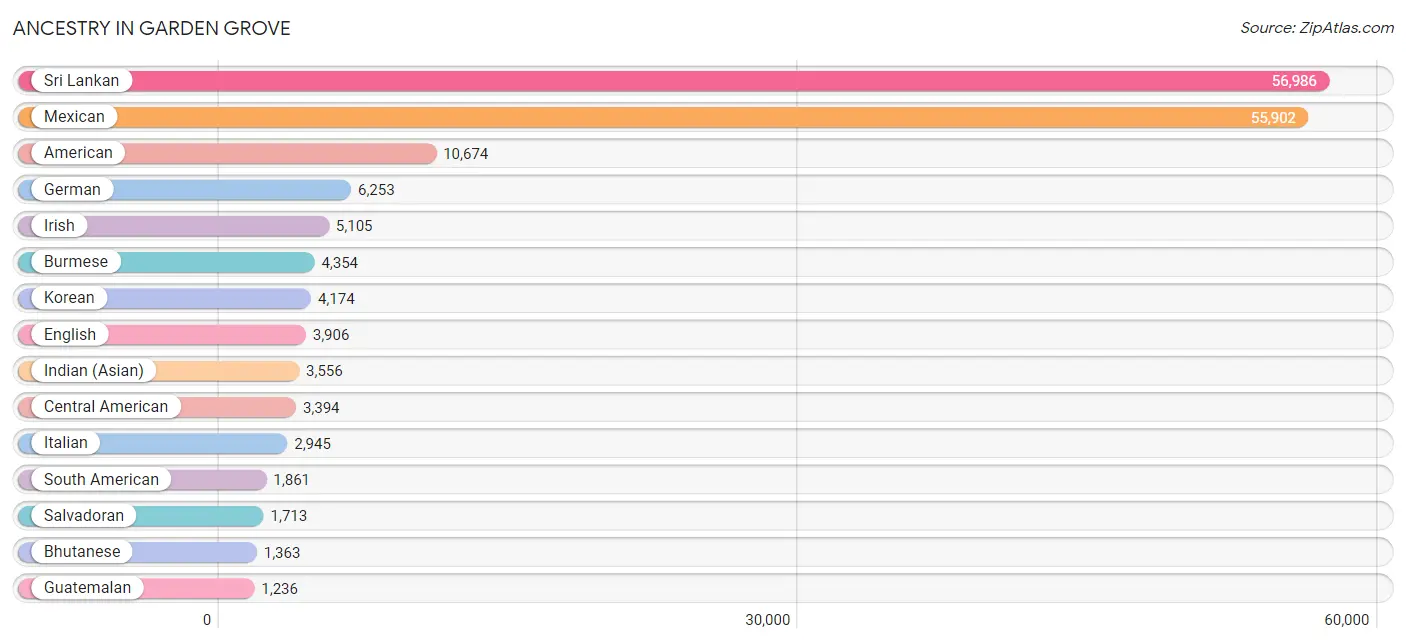
Ancestry in Garden Grove
The most populous ancestries reported in Garden Grove are Sri Lankan (56,986 | 33.2%), Mexican (55,902 | 32.6%), American (10,674 | 6.2%), German (6,253 | 3.6%), and Irish (5,105 | 3.0%), together accounting for 78.6% of all Garden Grove residents.
| Ancestry | # Population | % Population |
| Afghan | 161 | 0.1% |
| African | 19 | 0.0% |
| American | 10,674 | 6.2% |
| Apache | 27 | 0.0% |
| Arab | 655 | 0.4% |
| Argentinean | 281 | 0.2% |
| Armenian | 191 | 0.1% |
| Assyrian / Chaldean / Syriac | 98 | 0.1% |
| Australian | 15 | 0.0% |
| Austrian | 55 | 0.0% |
| Bangladeshi | 277 | 0.2% |
| Basque | 16 | 0.0% |
| Belgian | 94 | 0.1% |
| Bhutanese | 1,363 | 0.8% |
| Blackfeet | 88 | 0.1% |
| Bolivian | 44 | 0.0% |
| Brazilian | 31 | 0.0% |
| British | 267 | 0.2% |
| Burmese | 4,354 | 2.5% |
| Cambodian | 8 | 0.0% |
| Canadian | 164 | 0.1% |
| Cape Verdean | 7 | 0.0% |
| Central American | 3,394 | 2.0% |
| Central American Indian | 104 | 0.1% |
| Cherokee | 150 | 0.1% |
| Chilean | 48 | 0.0% |
| Chippewa | 9 | 0.0% |
| Choctaw | 56 | 0.0% |
| Colombian | 489 | 0.3% |
| Comanche | 32 | 0.0% |
| Costa Rican | 153 | 0.1% |
| Creek | 6 | 0.0% |
| Croatian | 54 | 0.0% |
| Cuban | 176 | 0.1% |
| Czech | 214 | 0.1% |
| Czechoslovakian | 44 | 0.0% |
| Danish | 225 | 0.1% |
| Dutch | 628 | 0.4% |
| Eastern European | 157 | 0.1% |
| Ecuadorian | 56 | 0.0% |
| Egyptian | 212 | 0.1% |
| English | 3,906 | 2.3% |
| Estonian | 55 | 0.0% |
| Ethiopian | 253 | 0.2% |
| European | 1,181 | 0.7% |
| Filipino | 131 | 0.1% |
| Finnish | 96 | 0.1% |
| French | 1,162 | 0.7% |
| French Canadian | 150 | 0.1% |
| German | 6,253 | 3.6% |
| German Russian | 51 | 0.0% |
| Greek | 238 | 0.1% |
| Guamanian / Chamorro | 77 | 0.0% |
| Guatemalan | 1,236 | 0.7% |
| Haitian | 18 | 0.0% |
| Honduran | 168 | 0.1% |
| Hopi | 13 | 0.0% |
| Hungarian | 163 | 0.1% |
| Indian (Asian) | 3,556 | 2.1% |
| Iranian | 158 | 0.1% |
| Iraqi | 125 | 0.1% |
| Irish | 5,105 | 3.0% |
| Italian | 2,945 | 1.7% |
| Jamaican | 7 | 0.0% |
| Japanese | 525 | 0.3% |
| Korean | 4,174 | 2.4% |
| Laotian | 74 | 0.0% |
| Lebanese | 73 | 0.0% |
| Lithuanian | 50 | 0.0% |
| Malaysian | 374 | 0.2% |
| Maltese | 9 | 0.0% |
| Mexican | 55,902 | 32.6% |
| Mexican American Indian | 876 | 0.5% |
| Moroccan | 11 | 0.0% |
| Native Hawaiian | 448 | 0.3% |
| Navajo | 177 | 0.1% |
| Nicaraguan | 43 | 0.0% |
| Nigerian | 9 | 0.0% |
| Northern European | 148 | 0.1% |
| Norwegian | 765 | 0.4% |
| Pakistani | 440 | 0.3% |
| Palestinian | 15 | 0.0% |
| Panamanian | 34 | 0.0% |
| Peruvian | 496 | 0.3% |
| Polish | 739 | 0.4% |
| Portuguese | 242 | 0.1% |
| Puerto Rican | 468 | 0.3% |
| Romanian | 181 | 0.1% |
| Russian | 133 | 0.1% |
| Salvadoran | 1,713 | 1.0% |
| Samoan | 773 | 0.4% |
| Scandinavian | 171 | 0.1% |
| Scotch-Irish | 369 | 0.2% |
| Scottish | 692 | 0.4% |
| Serbian | 7 | 0.0% |
| Sioux | 15 | 0.0% |
| Slavic | 12 | 0.0% |
| Slovak | 29 | 0.0% |
| South American | 1,861 | 1.1% |
| Spaniard | 130 | 0.1% |
| Spanish | 514 | 0.3% |
| Sri Lankan | 56,986 | 33.2% |
| Subsaharan African | 310 | 0.2% |
| Sudanese | 22 | 0.0% |
| Swedish | 698 | 0.4% |
| Swiss | 57 | 0.0% |
| Syrian | 56 | 0.0% |
| Taiwanese | 68 | 0.0% |
| Thai | 1,030 | 0.6% |
| Tongan | 140 | 0.1% |
| Trinidadian and Tobagonian | 79 | 0.1% |
| Turkish | 223 | 0.1% |
| Ukrainian | 85 | 0.1% |
| Venezuelan | 185 | 0.1% |
| Vietnamese | 116 | 0.1% |
| Welsh | 155 | 0.1% |
| Yaqui | 16 | 0.0% |
| Yugoslavian | 33 | 0.0% | View All 118 Rows |
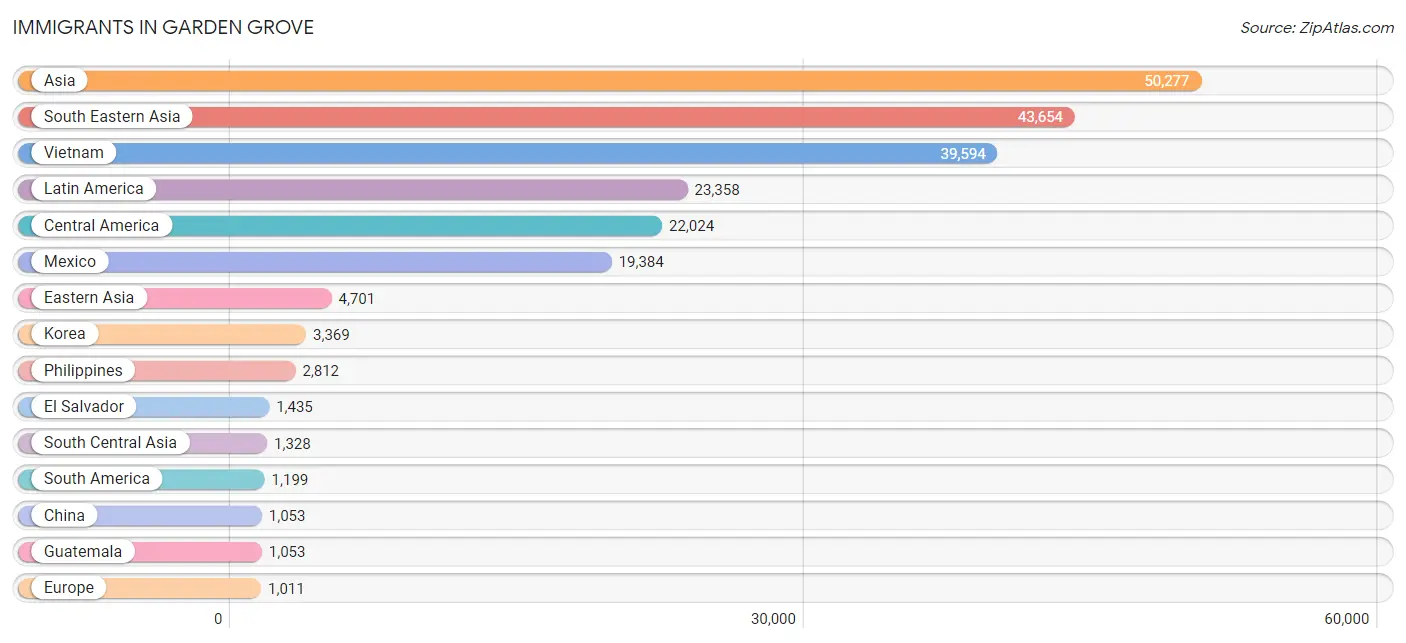
Immigrants in Garden Grove
The most numerous immigrant groups reported in Garden Grove came from Asia (50,277 | 29.3%), South Eastern Asia (43,654 | 25.4%), Vietnam (39,594 | 23.1%), Latin America (23,358 | 13.6%), and Central America (22,024 | 12.8%), together accounting for 104.2% of all Garden Grove residents.
| Immigration Origin | # Population | % Population |
| Afghanistan | 220 | 0.1% |
| Africa | 466 | 0.3% |
| Argentina | 74 | 0.0% |
| Armenia | 81 | 0.1% |
| Asia | 50,277 | 29.3% |
| Australia | 21 | 0.0% |
| Bangladesh | 94 | 0.1% |
| Barbados | 9 | 0.0% |
| Belgium | 26 | 0.0% |
| Bolivia | 65 | 0.0% |
| Bosnia and Herzegovina | 9 | 0.0% |
| Brazil | 242 | 0.1% |
| Bulgaria | 21 | 0.0% |
| Cambodia | 514 | 0.3% |
| Canada | 187 | 0.1% |
| Caribbean | 135 | 0.1% |
| Central America | 22,024 | 12.8% |
| Chile | 41 | 0.0% |
| China | 1,053 | 0.6% |
| Colombia | 99 | 0.1% |
| Costa Rica | 88 | 0.1% |
| Cuba | 64 | 0.0% |
| Czechoslovakia | 29 | 0.0% |
| Dominican Republic | 4 | 0.0% |
| Eastern Africa | 161 | 0.1% |
| Eastern Asia | 4,701 | 2.7% |
| Eastern Europe | 283 | 0.2% |
| Ecuador | 33 | 0.0% |
| Egypt | 234 | 0.1% |
| El Salvador | 1,435 | 0.8% |
| England | 36 | 0.0% |
| Ethiopia | 121 | 0.1% |
| Europe | 1,011 | 0.6% |
| Fiji | 11 | 0.0% |
| France | 100 | 0.1% |
| Germany | 178 | 0.1% |
| Guatemala | 1,053 | 0.6% |
| Honduras | 37 | 0.0% |
| Hong Kong | 26 | 0.0% |
| Hungary | 54 | 0.0% |
| India | 433 | 0.3% |
| Indonesia | 122 | 0.1% |
| Iran | 176 | 0.1% |
| Iraq | 158 | 0.1% |
| Ireland | 56 | 0.0% |
| Israel | 11 | 0.0% |
| Italy | 50 | 0.0% |
| Japan | 271 | 0.2% |
| Jordan | 23 | 0.0% |
| Korea | 3,369 | 2.0% |
| Laos | 372 | 0.2% |
| Latin America | 23,358 | 13.6% |
| Lebanon | 18 | 0.0% |
| Lithuania | 5 | 0.0% |
| Malaysia | 26 | 0.0% |
| Mexico | 19,384 | 11.3% |
| Nepal | 26 | 0.0% |
| Netherlands | 38 | 0.0% |
| Nicaragua | 17 | 0.0% |
| Nigeria | 22 | 0.0% |
| Northern Africa | 273 | 0.2% |
| Northern Europe | 230 | 0.1% |
| Norway | 7 | 0.0% |
| Oceania | 120 | 0.1% |
| Pakistan | 357 | 0.2% |
| Panama | 10 | 0.0% |
| Peru | 424 | 0.3% |
| Philippines | 2,812 | 1.6% |
| Romania | 98 | 0.1% |
| Russia | 42 | 0.0% |
| Saudi Arabia | 9 | 0.0% |
| Serbia | 10 | 0.0% |
| South Africa | 6 | 0.0% |
| South America | 1,199 | 0.7% |
| South Central Asia | 1,328 | 0.8% |
| South Eastern Asia | 43,654 | 25.4% |
| Southern Europe | 146 | 0.1% |
| Spain | 87 | 0.1% |
| Sri Lanka | 22 | 0.0% |
| Sweden | 7 | 0.0% |
| Switzerland | 10 | 0.0% |
| Syria | 112 | 0.1% |
| Taiwan | 298 | 0.2% |
| Thailand | 205 | 0.1% |
| Trinidad and Tobago | 58 | 0.0% |
| Turkey | 166 | 0.1% |
| Ukraine | 15 | 0.0% |
| Venezuela | 190 | 0.1% |
| Vietnam | 39,594 | 23.1% |
| Western Africa | 22 | 0.0% |
| Western Asia | 585 | 0.3% |
| Western Europe | 352 | 0.2% |
| Yemen | 7 | 0.0% |
| Zimbabwe | 13 | 0.0% | View All 94 Rows |
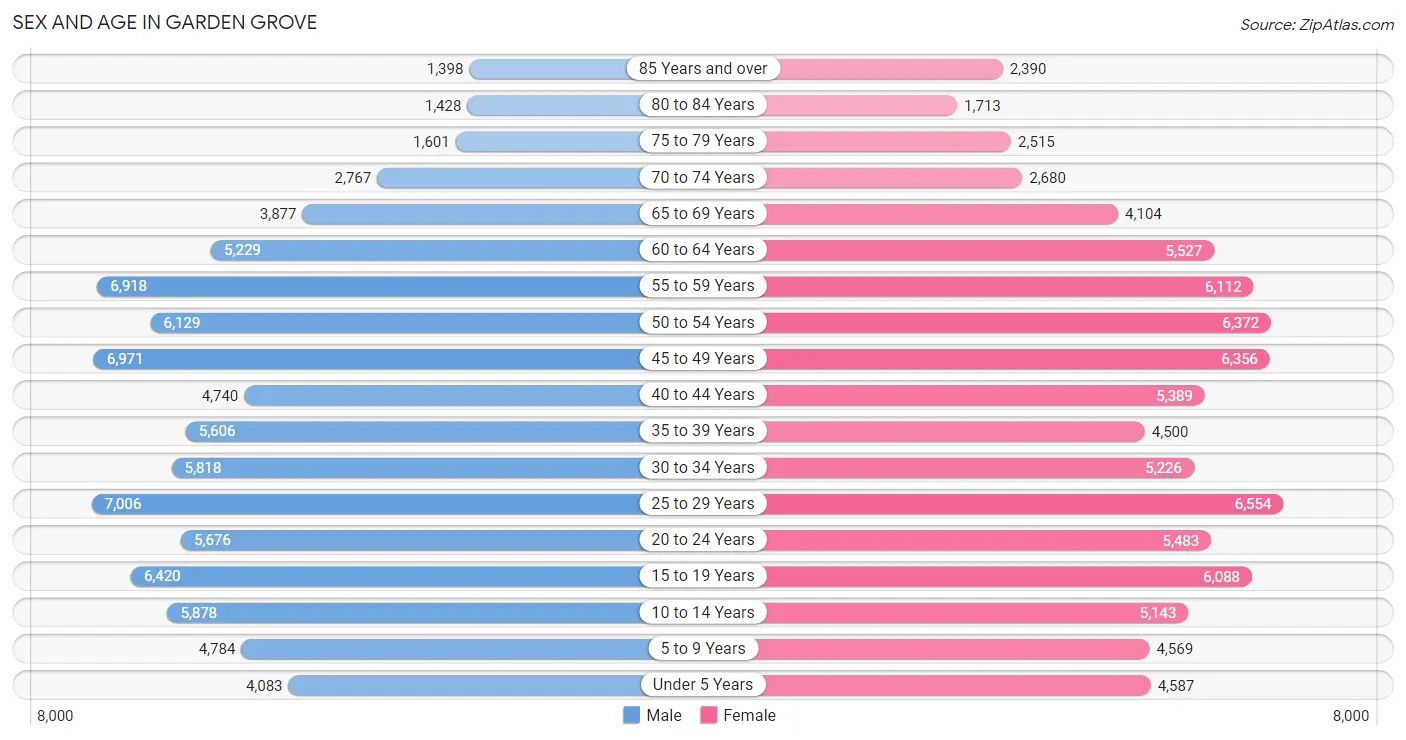
Sex and Age in Garden Grove
Sex and Age in Garden Grove
The most populous age groups in Garden Grove are 25 to 29 Years (7,006 | 8.1%) for men and 25 to 29 Years (6,554 | 7.7%) for women.
| Age Bracket | Male | Female |
| Under 5 Years | 4,083 (4.7%) | 4,587 (5.4%) |
| 5 to 9 Years | 4,784 (5.5%) | 4,569 (5.4%) |
| 10 to 14 Years | 5,878 (6.8%) | 5,143 (6.0%) |
| 15 to 19 Years | 6,420 (7.4%) | 6,088 (7.1%) |
| 20 to 24 Years | 5,676 (6.6%) | 5,483 (6.4%) |
| 25 to 29 Years | 7,006 (8.1%) | 6,554 (7.7%) |
| 30 to 34 Years | 5,818 (6.7%) | 5,226 (6.1%) |
| 35 to 39 Years | 5,606 (6.5%) | 4,500 (5.3%) |
| 40 to 44 Years | 4,740 (5.5%) | 5,389 (6.3%) |
| 45 to 49 Years | 6,971 (8.1%) | 6,356 (7.4%) |
| 50 to 54 Years | 6,129 (7.1%) | 6,372 (7.5%) |
| 55 to 59 Years | 6,918 (8.0%) | 6,112 (7.2%) |
| 60 to 64 Years | 5,229 (6.1%) | 5,527 (6.5%) |
| 65 to 69 Years | 3,877 (4.5%) | 4,104 (4.8%) |
| 70 to 74 Years | 2,767 (3.2%) | 2,680 (3.1%) |
| 75 to 79 Years | 1,601 (1.8%) | 2,515 (2.9%) |
| 80 to 84 Years | 1,428 (1.7%) | 1,713 (2.0%) |
| 85 Years and over | 1,398 (1.6%) | 2,390 (2.8%) |
| Total | 86,329 (100.0%) | 85,308 (100.0%) |
Families and Households in Garden Grove
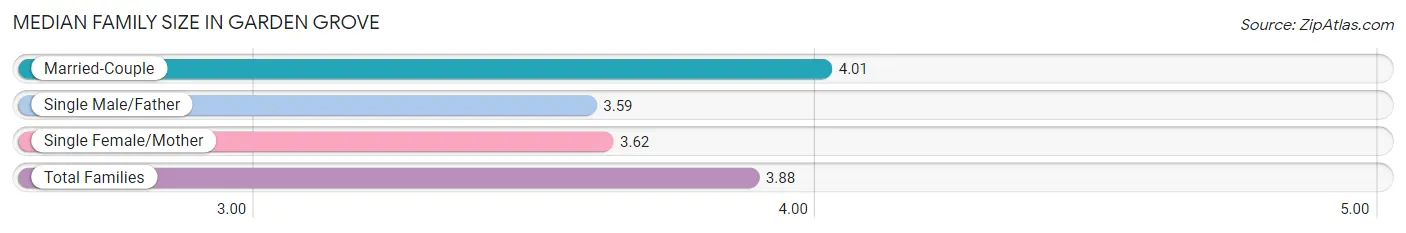
Median Family Size in Garden Grove
The median family size in Garden Grove is 3.88 persons per family, with married-couple families (25,354 | 67.6%) accounting for the largest median family size of 4.01 persons per family. On the other hand, single male/father families (3,906 | 10.4%) represent the smallest median family size with 3.59 persons per family.
| Family Type | # Families | Family Size |
| Married-Couple | 25,354 (67.6%) | 4.01 |
| Single Male/Father | 3,906 (10.4%) | 3.59 |
| Single Female/Mother | 8,226 (21.9%) | 3.62 |
| Total Families | 37,486 (100.0%) | 3.88 |
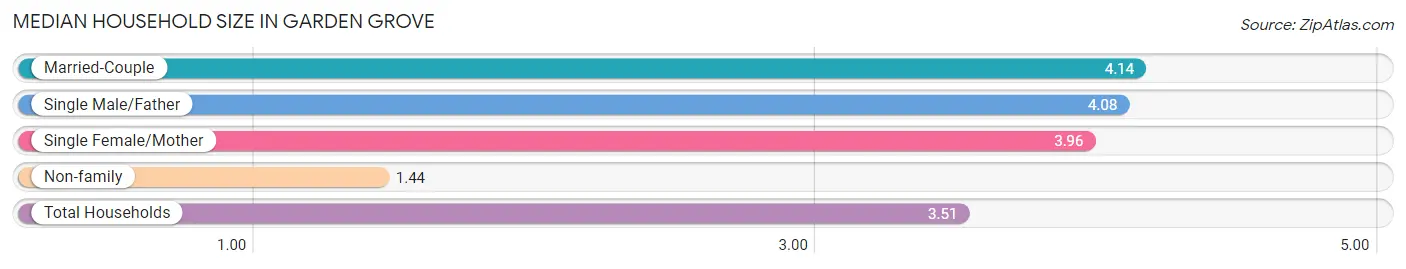
Median Household Size in Garden Grove
The median household size in Garden Grove is 3.51 persons per household, with married-couple households (25,354 | 52.6%) accounting for the largest median household size of 4.14 persons per household. non-family households (10,697 | 22.2%) represent the smallest median household size with 1.44 persons per household.
| Household Type | # Households | Household Size |
| Married-Couple | 25,354 (52.6%) | 4.14 |
| Single Male/Father | 3,906 (8.1%) | 4.08 |
| Single Female/Mother | 8,226 (17.1%) | 3.96 |
| Non-family | 10,697 (22.2%) | 1.44 |
| Total Households | 48,183 (100.0%) | 3.51 |
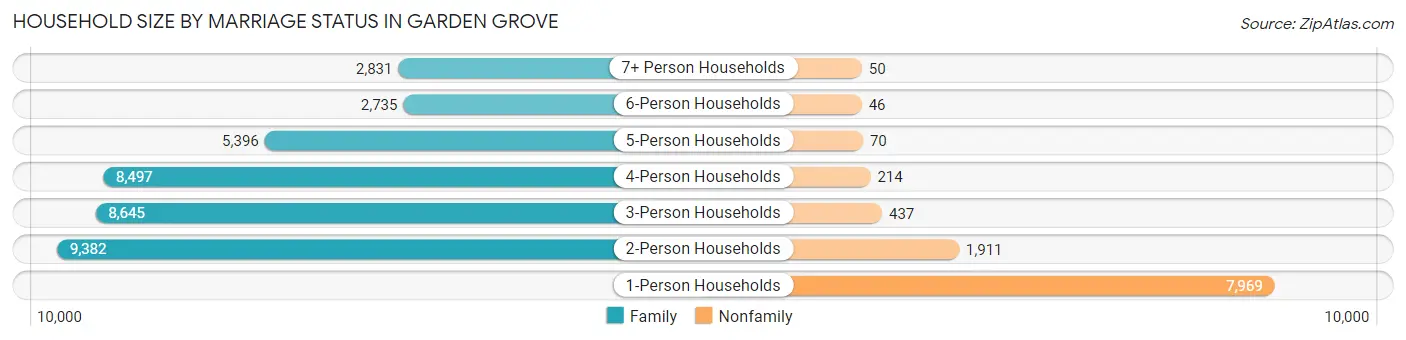
Household Size by Marriage Status in Garden Grove
Out of a total of 48,183 households in Garden Grove, 37,486 (77.8%) are family households, while 10,697 (22.2%) are nonfamily households. The most numerous type of family households are 2-person households, comprising 9,382, and the most common type of nonfamily households are 1-person households, comprising 7,969.
| Household Size | Family Households | Nonfamily Households |
| 1-Person Households | - | 7,969 (16.5%) |
| 2-Person Households | 9,382 (19.5%) | 1,911 (4.0%) |
| 3-Person Households | 8,645 (17.9%) | 437 (0.9%) |
| 4-Person Households | 8,497 (17.6%) | 214 (0.4%) |
| 5-Person Households | 5,396 (11.2%) | 70 (0.2%) |
| 6-Person Households | 2,735 (5.7%) | 46 (0.1%) |
| 7+ Person Households | 2,831 (5.9%) | 50 (0.1%) |
| Total | 37,486 (77.8%) | 10,697 (22.2%) |
Female Fertility in Garden Grove
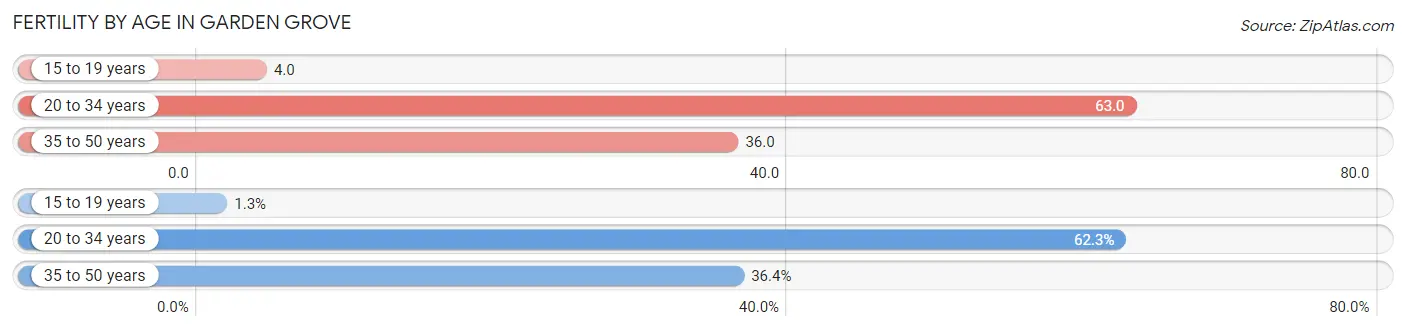
Fertility by Age in Garden Grove
Average fertility rate in Garden Grove is 43.0 births per 1,000 women. Women in the age bracket of 20 to 34 years have the highest fertility rate with 63.0 births per 1,000 women. Women in the age bracket of 20 to 34 years acount for 62.3% of all women with births.
| Age Bracket | Women with Births | Births / 1,000 Women |
| 15 to 19 years | 23 (1.3%) | 4.0 |
| 20 to 34 years | 1,094 (62.3%) | 63.0 |
| 35 to 50 years | 639 (36.4%) | 36.0 |
| Total | 1,756 (100.0%) | 43.0 |
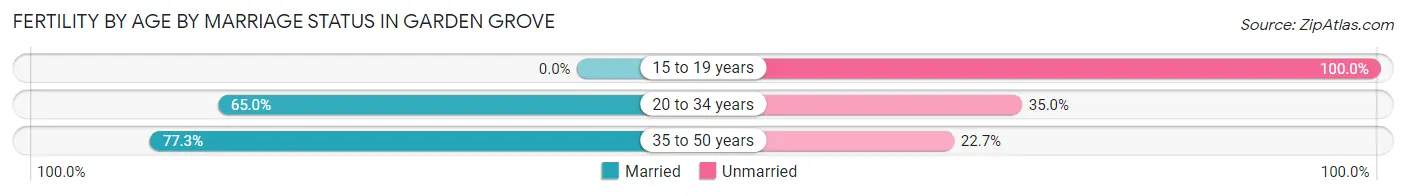
Fertility by Age by Marriage Status in Garden Grove
68.6% of women with births (1,756) in Garden Grove are married. The highest percentage of unmarried women with births falls into 15 to 19 years age bracket with 100.0% of them unmarried at the time of birth, while the lowest percentage of unmarried women with births belong to 35 to 50 years age bracket with 22.7% of them unmarried.
| Age Bracket | Married | Unmarried |
| 15 to 19 years | 0 (0.0%) | 23 (100.0%) |
| 20 to 34 years | 711 (65.0%) | 383 (35.0%) |
| 35 to 50 years | 494 (77.3%) | 145 (22.7%) |
| Total | 1,205 (68.6%) | 551 (31.4%) |
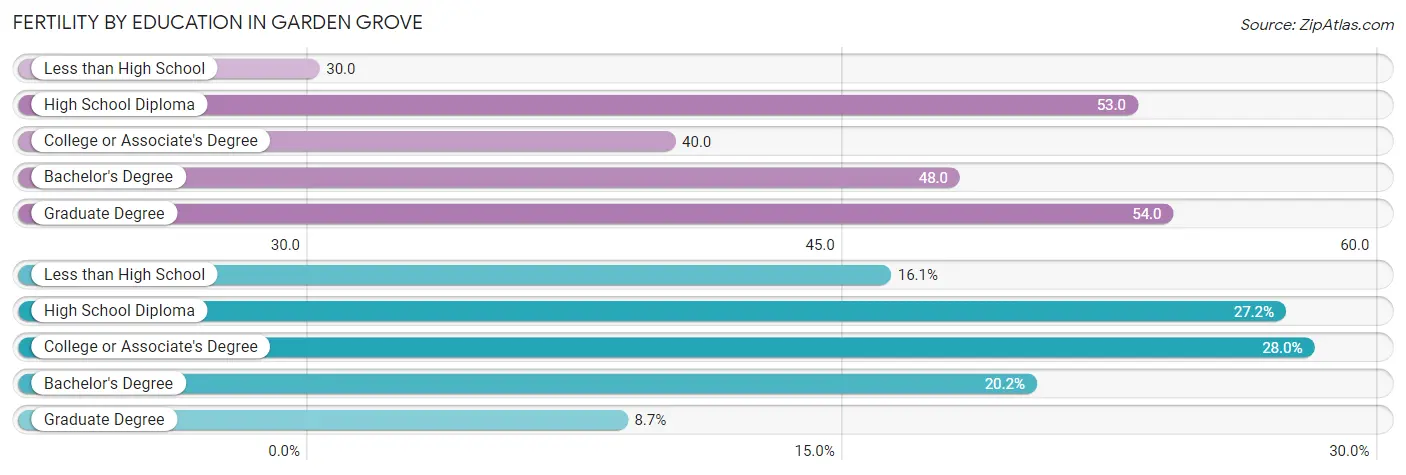
Fertility by Education in Garden Grove
Average fertility rate in Garden Grove is 43.0 births per 1,000 women. Women with the education attainment of graduate degree have the highest fertility rate of 54.0 births per 1,000 women, while women with the education attainment of less than high school have the lowest fertility at 30.0 births per 1,000 women. Women with the education attainment of college or associate's degree represent 28.0% of all women with births.
| Educational Attainment | Women with Births | Births / 1,000 Women |
| Less than High School | 282 (16.1%) | 30.0 |
| High School Diploma | 477 (27.2%) | 53.0 |
| College or Associate's Degree | 491 (28.0%) | 40.0 |
| Bachelor's Degree | 354 (20.2%) | 48.0 |
| Graduate Degree | 152 (8.7%) | 54.0 |
| Total | 1,756 (100.0%) | 43.0 |
Fertility by Education by Marriage Status in Garden Grove
31.4% of women with births in Garden Grove are unmarried. Women with the educational attainment of graduate degree are most likely to be married with 88.2% of them married at childbirth, while women with the educational attainment of less than high school are least likely to be married with 38.7% of them unmarried at childbirth.
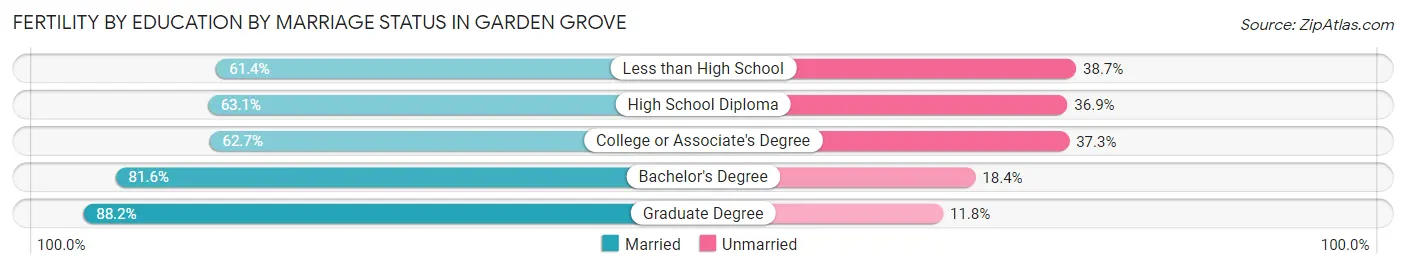
| Educational Attainment | Married | Unmarried |
| Less than High School | 173 (61.4%) | 109 (38.7%) |
| High School Diploma | 301 (63.1%) | 176 (36.9%) |
| College or Associate's Degree | 308 (62.7%) | 183 (37.3%) |
| Bachelor's Degree | 289 (81.6%) | 65 (18.4%) |
| Graduate Degree | 134 (88.2%) | 18 (11.8%) |
| Total | 1,205 (68.6%) | 551 (31.4%) |
Employment Characteristics in Garden Grove
Employment by Class of Employer in Garden Grove
Among the 82,701 employed individuals in Garden Grove, private company employees (61,229 | 74.0%), self-employed (not incorporated) (6,012 | 7.3%), and local government employees (5,601 | 6.8%) make up the most common classes of employment.
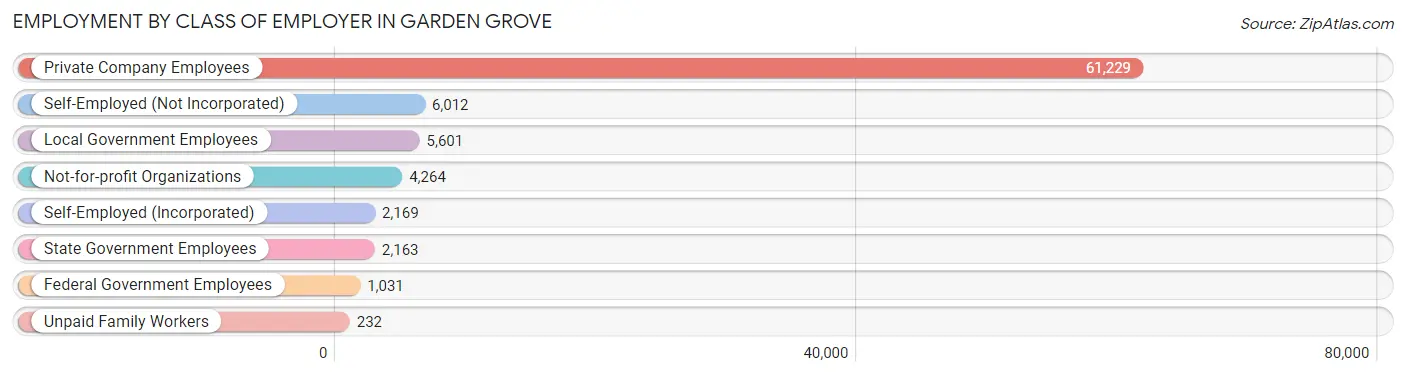
| Employer Class | # Employees | % Employees |
| Private Company Employees | 61,229 | 74.0% |
| Self-Employed (Incorporated) | 2,169 | 2.6% |
| Self-Employed (Not Incorporated) | 6,012 | 7.3% |
| Not-for-profit Organizations | 4,264 | 5.2% |
| Local Government Employees | 5,601 | 6.8% |
| State Government Employees | 2,163 | 2.6% |
| Federal Government Employees | 1,031 | 1.3% |
| Unpaid Family Workers | 232 | 0.3% |
| Total | 82,701 | 100.0% |
Employment Status by Age in Garden Grove
According to the labor force statistics for Garden Grove, out of the total population over 16 years of age (139,871), 64.3% or 89,937 individuals are in the labor force, with 5.8% or 5,216 of them unemployed. The age group with the highest labor force participation rate is 45 to 54 years, with 83.0% or 21,437 individuals in the labor force. Within the labor force, the 16 to 19 years age range has the highest percentage of unemployed individuals, with 18.3% or 494 of them being unemployed.
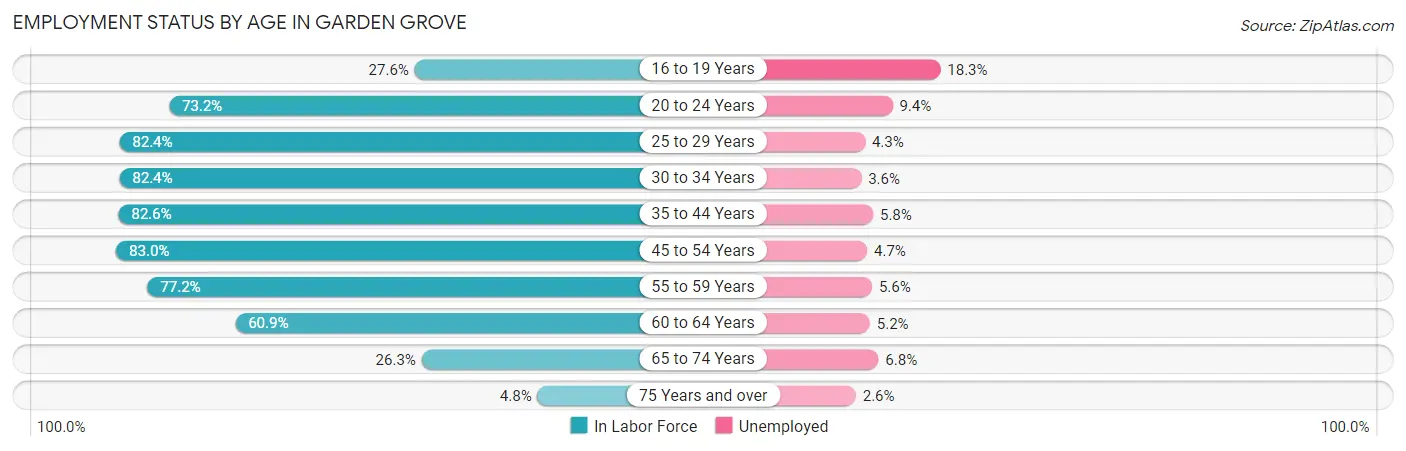
| Age Bracket | In Labor Force | Unemployed |
| 16 to 19 Years | 2,701 (27.6%) | 494 (18.3%) |
| 20 to 24 Years | 8,168 (73.2%) | 768 (9.4%) |
| 25 to 29 Years | 11,173 (82.4%) | 480 (4.3%) |
| 30 to 34 Years | 9,100 (82.4%) | 328 (3.6%) |
| 35 to 44 Years | 16,714 (82.6%) | 969 (5.8%) |
| 45 to 54 Years | 21,437 (83.0%) | 1,008 (4.7%) |
| 55 to 59 Years | 10,059 (77.2%) | 563 (5.6%) |
| 60 to 64 Years | 6,550 (60.9%) | 341 (5.2%) |
| 65 to 74 Years | 3,532 (26.3%) | 240 (6.8%) |
| 75 Years and over | 530 (4.8%) | 14 (2.6%) |
| Total | 89,937 (64.3%) | 5,216 (5.8%) |
Employment Status by Educational Attainment in Garden Grove
According to labor force statistics for Garden Grove, 79.4% of individuals (74,996) out of the total population between 25 and 64 years of age (94,453) are in the labor force, with 4.9% or 3,675 of them being unemployed. The group with the highest labor force participation rate are those with the educational attainment of bachelor's degree or higher, with 87.1% or 20,029 individuals in the labor force. Within the labor force, individuals with high school diploma education have the highest percentage of unemployment, with 6.1% or 1,109 of them being unemployed.
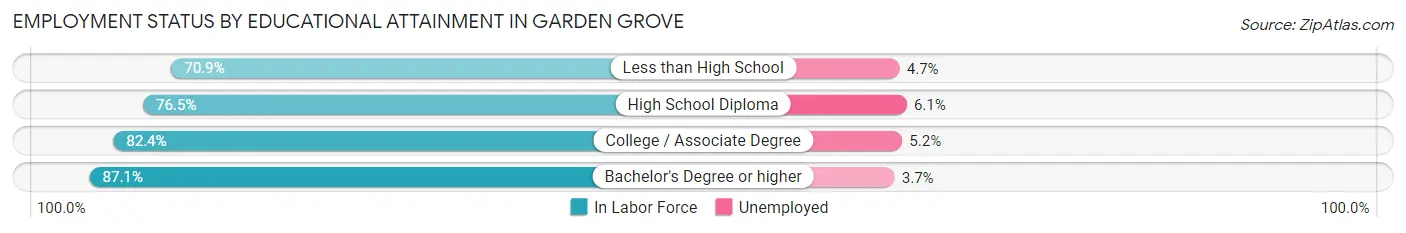
| Educational Attainment | In Labor Force | Unemployed |
| Less than High School | 15,095 (70.9%) | 1,001 (4.7%) |
| High School Diploma | 18,178 (76.5%) | 1,449 (6.1%) |
| College / Associate Degree | 21,759 (82.4%) | 1,373 (5.2%) |
| Bachelor's Degree or higher | 20,029 (87.1%) | 851 (3.7%) |
| Total | 74,996 (79.4%) | 4,628 (4.9%) |
Employment Occupations by Sex in Garden Grove
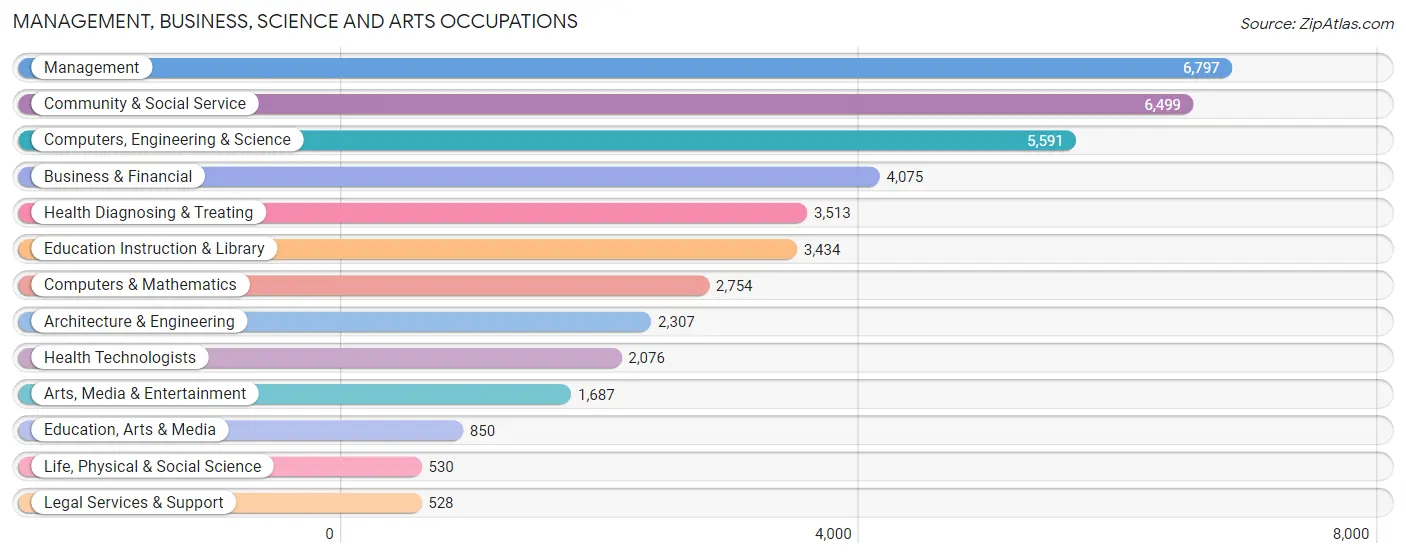
Management, Business, Science and Arts Occupations
The most common Management, Business, Science and Arts occupations in Garden Grove are Management (6,797 | 8.0%), Community & Social Service (6,499 | 7.7%), Computers, Engineering & Science (5,591 | 6.6%), Business & Financial (4,075 | 4.8%), and Health Diagnosing & Treating (3,513 | 4.2%).
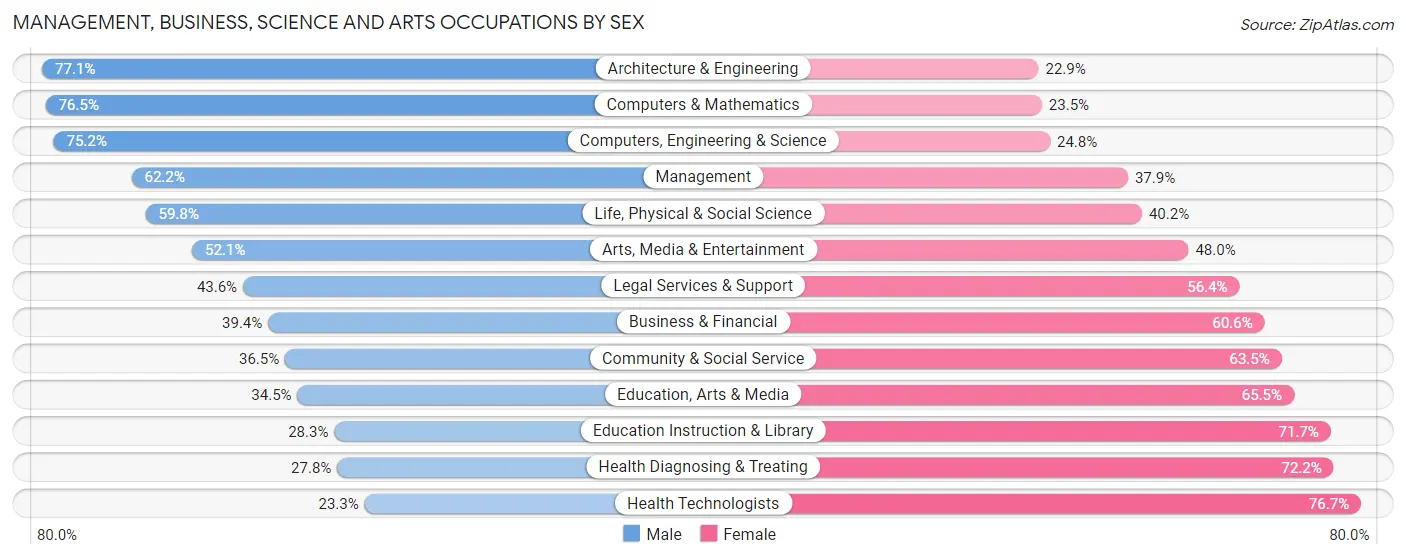
Management, Business, Science and Arts Occupations by Sex
Within the Management, Business, Science and Arts occupations in Garden Grove, the most male-oriented occupations are Architecture & Engineering (77.1%), Computers & Mathematics (76.5%), and Computers, Engineering & Science (75.2%), while the most female-oriented occupations are Health Technologists (76.7%), Health Diagnosing & Treating (72.2%), and Education Instruction & Library (71.7%).
| Occupation | Male | Female |
| Management | 4,224 (62.2%) | 2,573 (37.9%) |
| Business & Financial | 1,604 (39.4%) | 2,471 (60.6%) |
| Computers, Engineering & Science | 4,202 (75.2%) | 1,389 (24.8%) |
| Computers & Mathematics | 2,107 (76.5%) | 647 (23.5%) |
| Architecture & Engineering | 1,778 (77.1%) | 529 (22.9%) |
| Life, Physical & Social Science | 317 (59.8%) | 213 (40.2%) |
| Community & Social Service | 2,374 (36.5%) | 4,125 (63.5%) |
| Education, Arts & Media | 293 (34.5%) | 557 (65.5%) |
| Legal Services & Support | 230 (43.6%) | 298 (56.4%) |
| Education Instruction & Library | 973 (28.3%) | 2,461 (71.7%) |
| Arts, Media & Entertainment | 878 (52.0%) | 809 (47.9%) |
| Health Diagnosing & Treating | 978 (27.8%) | 2,535 (72.2%) |
| Health Technologists | 483 (23.3%) | 1,593 (76.7%) |
| Total (Category) | 13,382 (50.5%) | 13,093 (49.4%) |
| Total (Overall) | 45,877 (54.1%) | 38,839 (45.9%) |
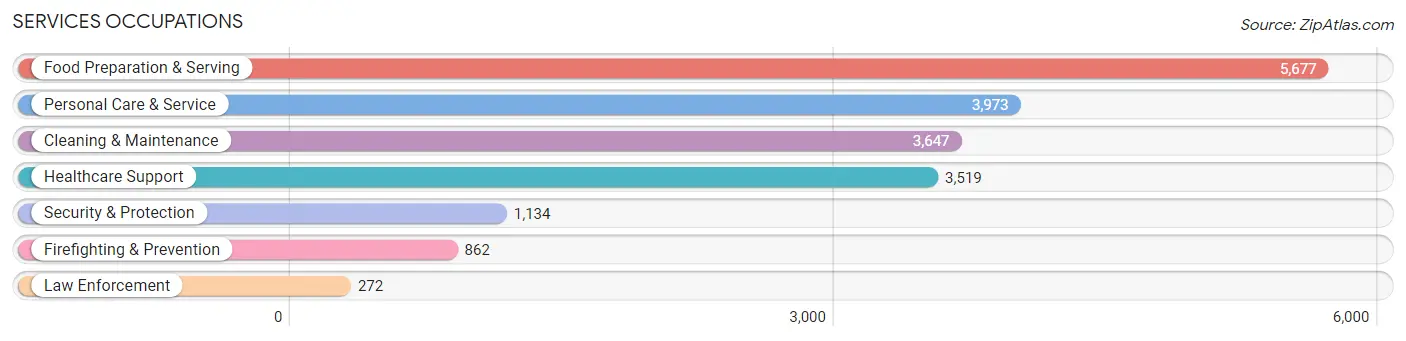
Services Occupations
The most common Services occupations in Garden Grove are Food Preparation & Serving (5,677 | 6.7%), Personal Care & Service (3,973 | 4.7%), Cleaning & Maintenance (3,647 | 4.3%), Healthcare Support (3,519 | 4.2%), and Security & Protection (1,134 | 1.3%).
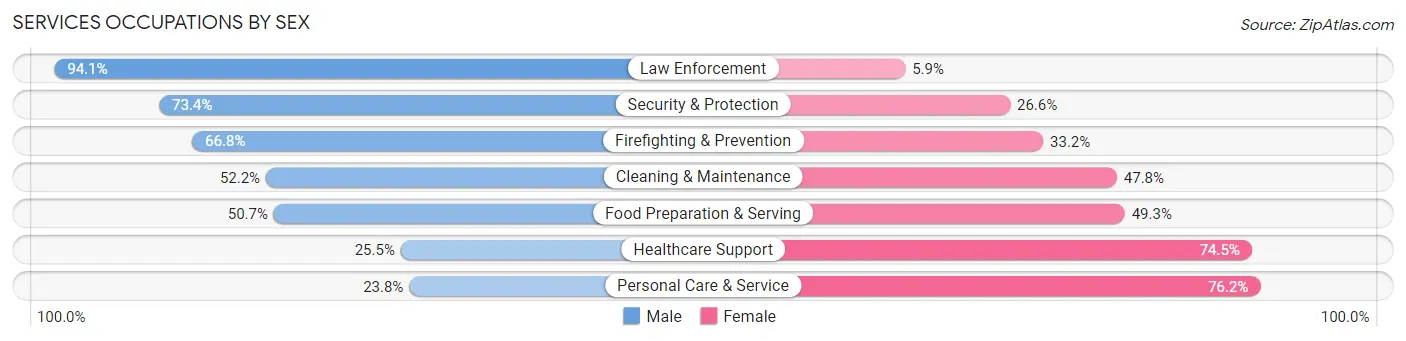
Services Occupations by Sex
Within the Services occupations in Garden Grove, the most male-oriented occupations are Law Enforcement (94.1%), Security & Protection (73.4%), and Firefighting & Prevention (66.8%), while the most female-oriented occupations are Personal Care & Service (76.2%), Healthcare Support (74.5%), and Food Preparation & Serving (49.3%).
| Occupation | Male | Female |
| Healthcare Support | 898 (25.5%) | 2,621 (74.5%) |
| Security & Protection | 832 (73.4%) | 302 (26.6%) |
| Firefighting & Prevention | 576 (66.8%) | 286 (33.2%) |
| Law Enforcement | 256 (94.1%) | 16 (5.9%) |
| Food Preparation & Serving | 2,876 (50.7%) | 2,801 (49.3%) |
| Cleaning & Maintenance | 1,904 (52.2%) | 1,743 (47.8%) |
| Personal Care & Service | 947 (23.8%) | 3,026 (76.2%) |
| Total (Category) | 7,457 (41.5%) | 10,493 (58.5%) |
| Total (Overall) | 45,877 (54.1%) | 38,839 (45.9%) |
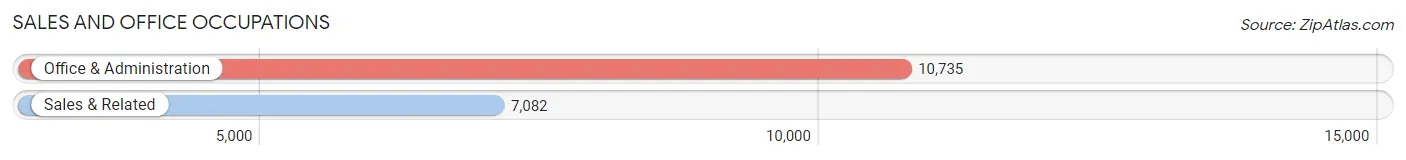
Sales and Office Occupations
The most common Sales and Office occupations in Garden Grove are Office & Administration (10,735 | 12.7%), and Sales & Related (7,082 | 8.4%).
Sales and Office Occupations by Sex
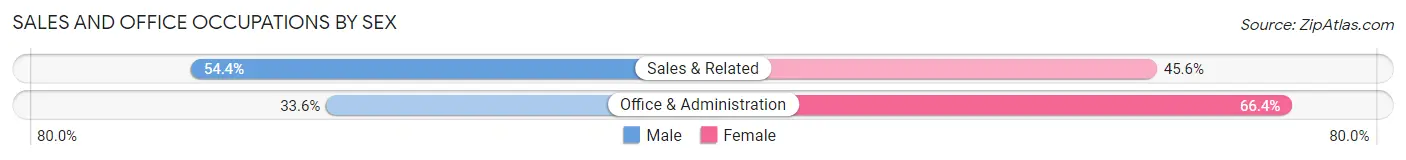
| Occupation | Male | Female |
| Sales & Related | 3,854 (54.4%) | 3,228 (45.6%) |
| Office & Administration | 3,607 (33.6%) | 7,128 (66.4%) |
| Total (Category) | 7,461 (41.9%) | 10,356 (58.1%) |
| Total (Overall) | 45,877 (54.1%) | 38,839 (45.9%) |
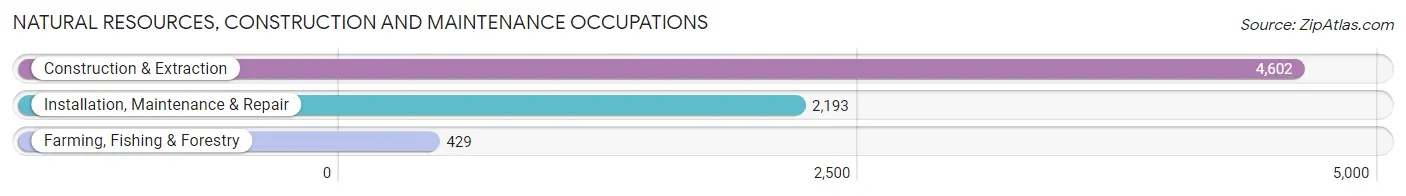
Natural Resources, Construction and Maintenance Occupations
The most common Natural Resources, Construction and Maintenance occupations in Garden Grove are Construction & Extraction (4,602 | 5.4%), Installation, Maintenance & Repair (2,193 | 2.6%), and Farming, Fishing & Forestry (429 | 0.5%).
Natural Resources, Construction and Maintenance Occupations by Sex
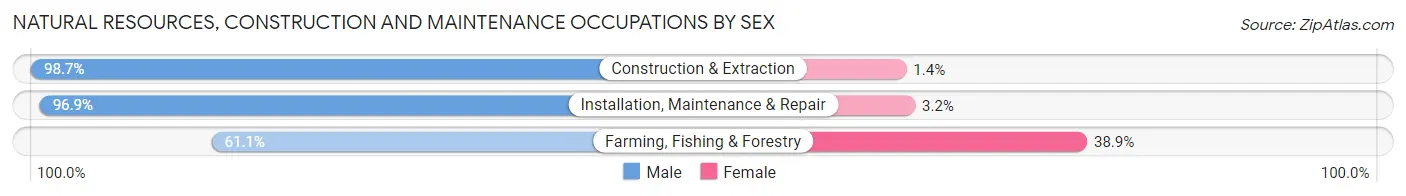
| Occupation | Male | Female |
| Farming, Fishing & Forestry | 262 (61.1%) | 167 (38.9%) |
| Construction & Extraction | 4,540 (98.7%) | 62 (1.3%) |
| Installation, Maintenance & Repair | 2,124 (96.9%) | 69 (3.2%) |
| Total (Category) | 6,926 (95.9%) | 298 (4.1%) |
| Total (Overall) | 45,877 (54.1%) | 38,839 (45.9%) |
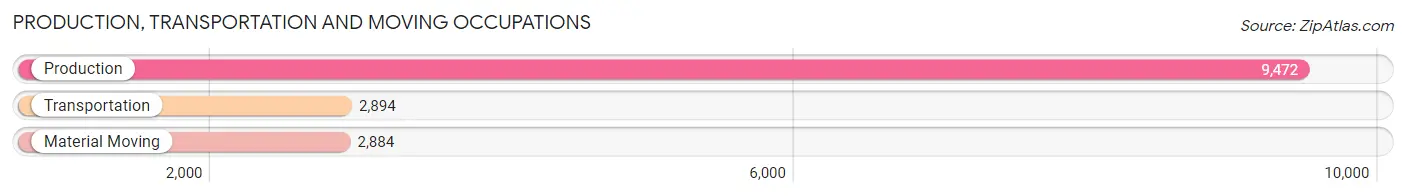
Production, Transportation and Moving Occupations
The most common Production, Transportation and Moving occupations in Garden Grove are Production (9,472 | 11.2%), Transportation (2,894 | 3.4%), and Material Moving (2,884 | 3.4%).
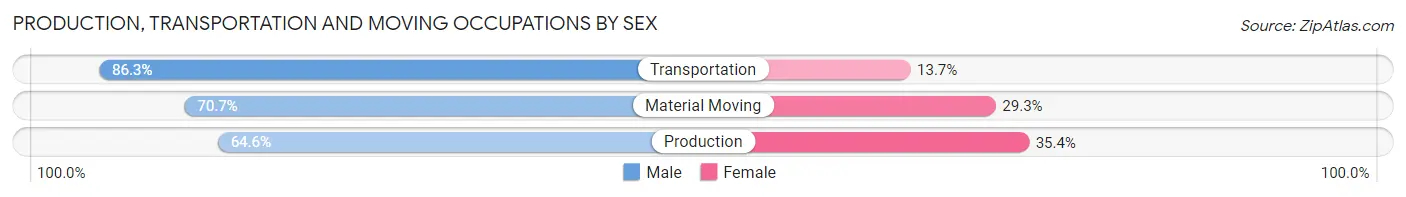
Production, Transportation and Moving Occupations by Sex
| Occupation | Male | Female |
| Production | 6,115 (64.6%) | 3,357 (35.4%) |
| Transportation | 2,498 (86.3%) | 396 (13.7%) |
| Material Moving | 2,038 (70.7%) | 846 (29.3%) |
| Total (Category) | 10,651 (69.8%) | 4,599 (30.2%) |
| Total (Overall) | 45,877 (54.1%) | 38,839 (45.9%) |
Employment Industries by Sex in Garden Grove
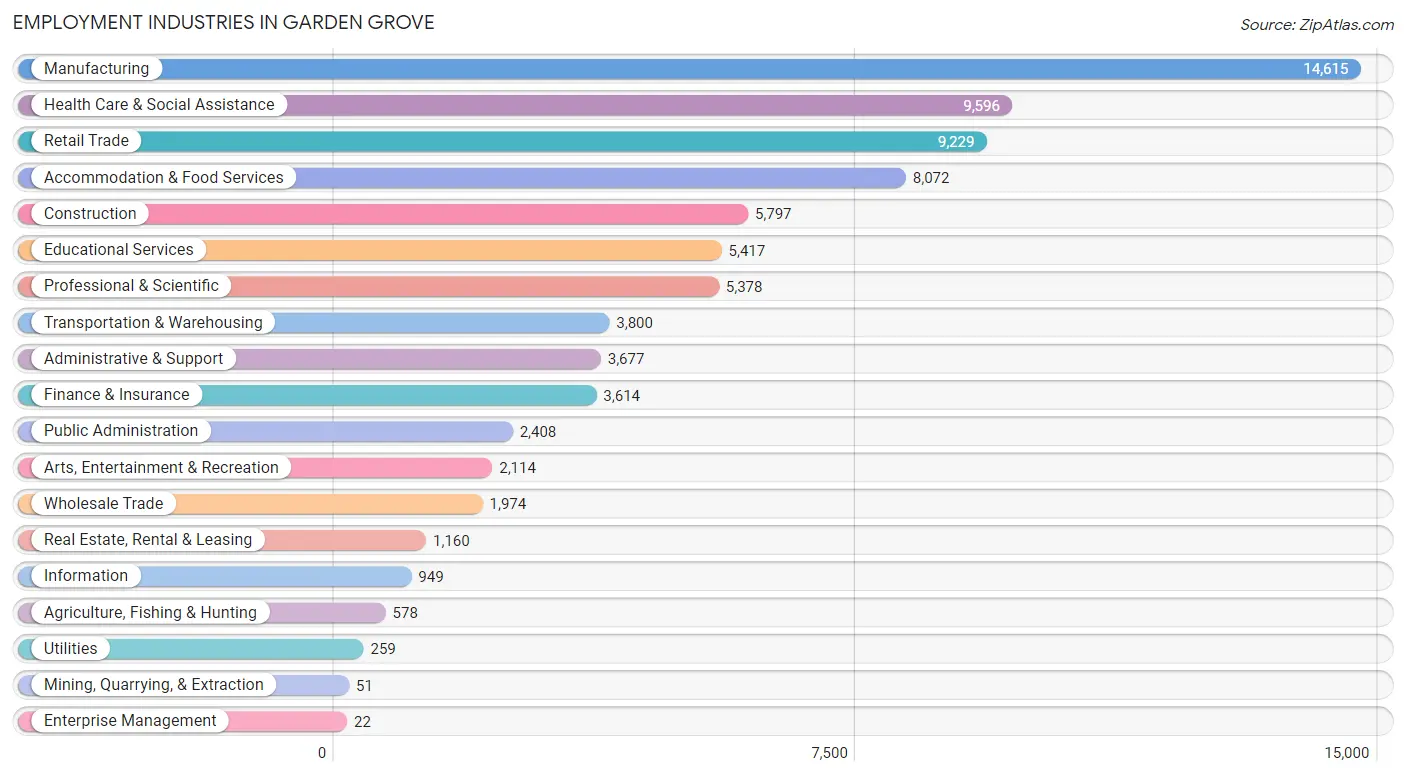
Employment Industries in Garden Grove
The major employment industries in Garden Grove include Manufacturing (14,615 | 17.2%), Health Care & Social Assistance (9,596 | 11.3%), Retail Trade (9,229 | 10.9%), Accommodation & Food Services (8,072 | 9.5%), and Construction (5,797 | 6.8%).
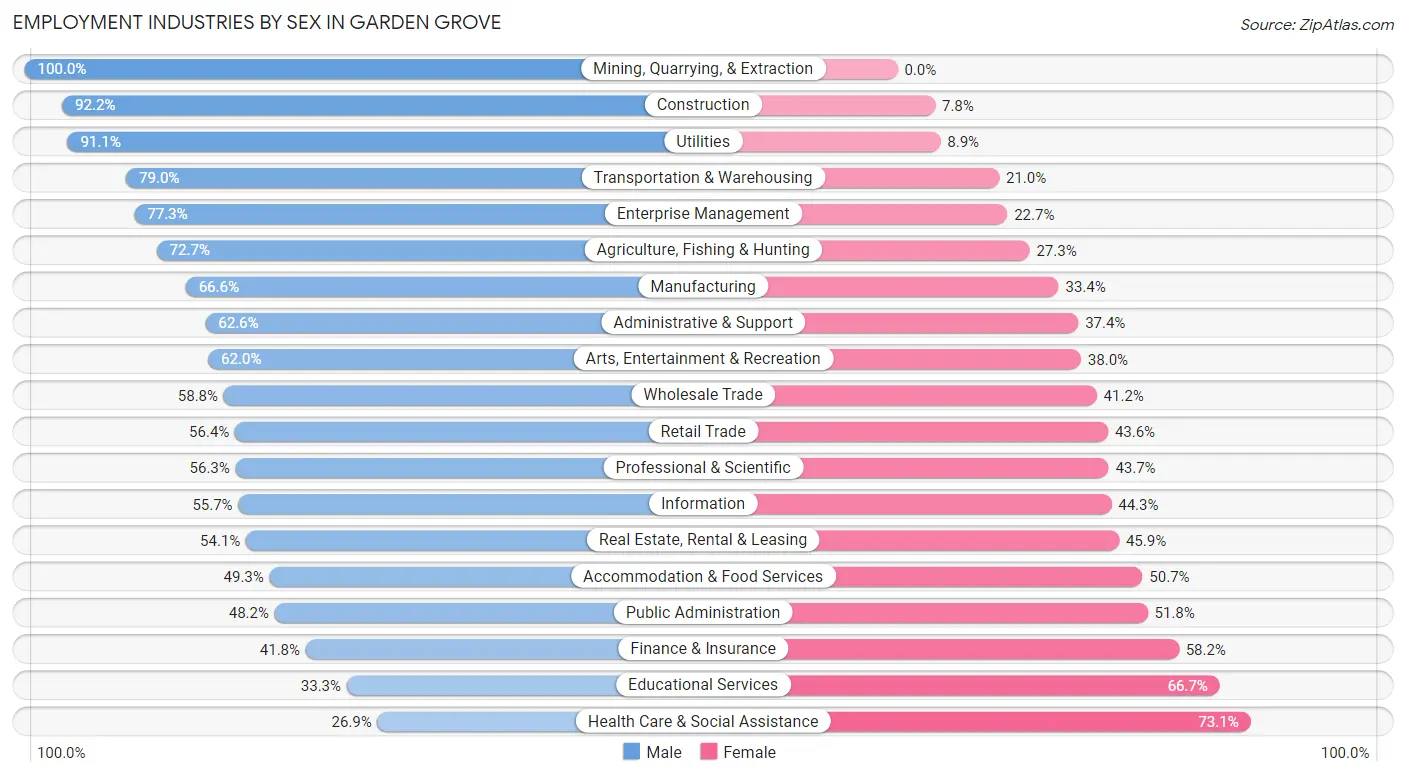
Employment Industries by Sex in Garden Grove
The Garden Grove industries that see more men than women are Mining, Quarrying, & Extraction (100.0%), Construction (92.2%), and Utilities (91.1%), whereas the industries that tend to have a higher number of women are Health Care & Social Assistance (73.1%), Educational Services (66.7%), and Finance & Insurance (58.2%).
| Industry | Male | Female |
| Agriculture, Fishing & Hunting | 420 (72.7%) | 158 (27.3%) |
| Mining, Quarrying, & Extraction | 51 (100.0%) | 0 (0.0%) |
| Construction | 5,346 (92.2%) | 451 (7.8%) |
| Manufacturing | 9,739 (66.6%) | 4,876 (33.4%) |
| Wholesale Trade | 1,160 (58.8%) | 814 (41.2%) |
| Retail Trade | 5,207 (56.4%) | 4,022 (43.6%) |
| Transportation & Warehousing | 3,001 (79.0%) | 799 (21.0%) |
| Utilities | 236 (91.1%) | 23 (8.9%) |
| Information | 529 (55.7%) | 420 (44.3%) |
| Finance & Insurance | 1,510 (41.8%) | 2,104 (58.2%) |
| Real Estate, Rental & Leasing | 628 (54.1%) | 532 (45.9%) |
| Professional & Scientific | 3,029 (56.3%) | 2,349 (43.7%) |
| Enterprise Management | 17 (77.3%) | 5 (22.7%) |
| Administrative & Support | 2,301 (62.6%) | 1,376 (37.4%) |
| Educational Services | 1,804 (33.3%) | 3,613 (66.7%) |
| Health Care & Social Assistance | 2,584 (26.9%) | 7,012 (73.1%) |
| Arts, Entertainment & Recreation | 1,311 (62.0%) | 803 (38.0%) |
| Accommodation & Food Services | 3,979 (49.3%) | 4,093 (50.7%) |
| Public Administration | 1,161 (48.2%) | 1,247 (51.8%) |
| Total | 45,877 (54.1%) | 38,839 (45.9%) |
Education in Garden Grove
School Enrollment in Garden Grove
The most common levels of schooling among the 44,897 students in Garden Grove are college / undergraduate (12,955 | 28.8%), high school (9,895 | 22.0%), and middle school (8,519 | 19.0%).
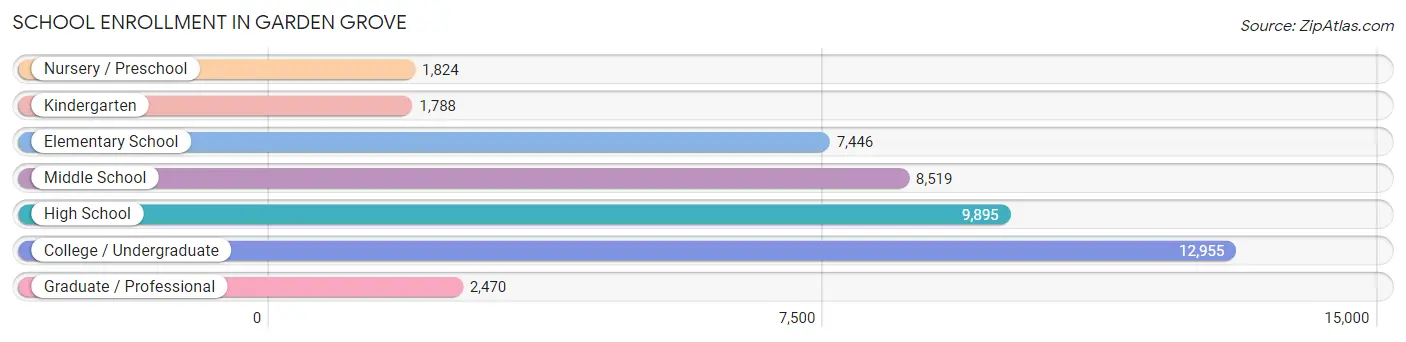
| School Level | # Students | % Students |
| Nursery / Preschool | 1,824 | 4.1% |
| Kindergarten | 1,788 | 4.0% |
| Elementary School | 7,446 | 16.6% |
| Middle School | 8,519 | 19.0% |
| High School | 9,895 | 22.0% |
| College / Undergraduate | 12,955 | 28.8% |
| Graduate / Professional | 2,470 | 5.5% |
| Total | 44,897 | 100.0% |
School Enrollment by Age by Funding Source in Garden Grove
Out of a total of 44,897 students who are enrolled in schools in Garden Grove, 3,816 (8.5%) attend a private institution, while the remaining 41,081 (91.5%) are enrolled in public schools. The age group of 3 to 4 year olds has the highest likelihood of being enrolled in private schools, with 716 (48.8% in the age bracket) enrolled. Conversely, the age group of 15 to 17 year olds has the lowest likelihood of being enrolled in a private school, with 6,986 (96.4% in the age bracket) attending a public institution.
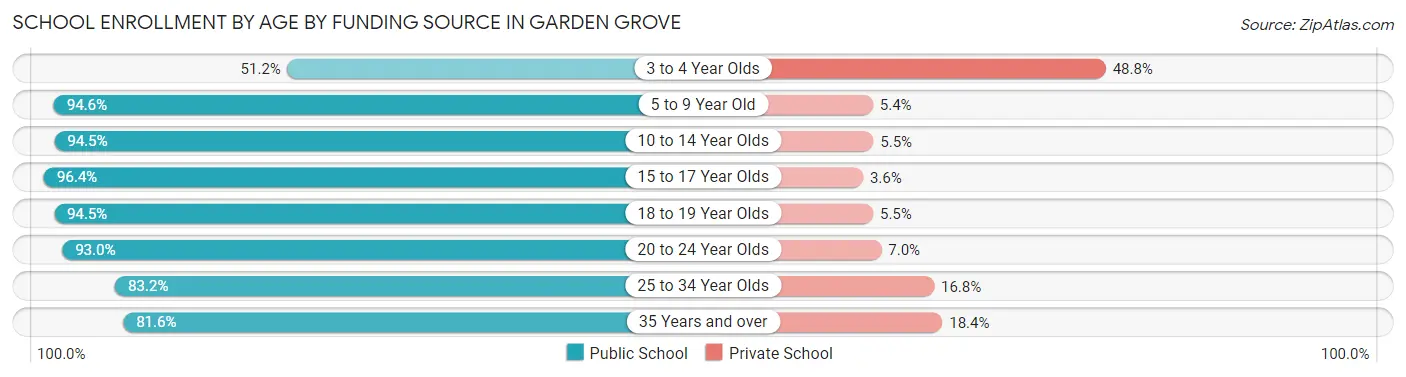
| Age Bracket | Public School | Private School |
| 3 to 4 Year Olds | 751 (51.2%) | 716 (48.8%) |
| 5 to 9 Year Old | 8,284 (94.6%) | 477 (5.4%) |
| 10 to 14 Year Olds | 10,162 (94.5%) | 595 (5.5%) |
| 15 to 17 Year Olds | 6,986 (96.4%) | 261 (3.6%) |
| 18 to 19 Year Olds | 3,695 (94.5%) | 214 (5.5%) |
| 20 to 24 Year Olds | 5,824 (93.0%) | 440 (7.0%) |
| 25 to 34 Year Olds | 3,122 (83.2%) | 632 (16.8%) |
| 35 Years and over | 2,235 (81.6%) | 503 (18.4%) |
| Total | 41,081 (91.5%) | 3,816 (8.5%) |
Educational Attainment by Field of Study in Garden Grove
Business (6,382 | 21.9%), science & technology (3,149 | 10.8%), engineering (2,968 | 10.2%), social sciences (2,217 | 7.6%), and computers & mathematics (1,976 | 6.8%) are the most common fields of study among 29,140 individuals in Garden Grove who have obtained a bachelor's degree or higher.
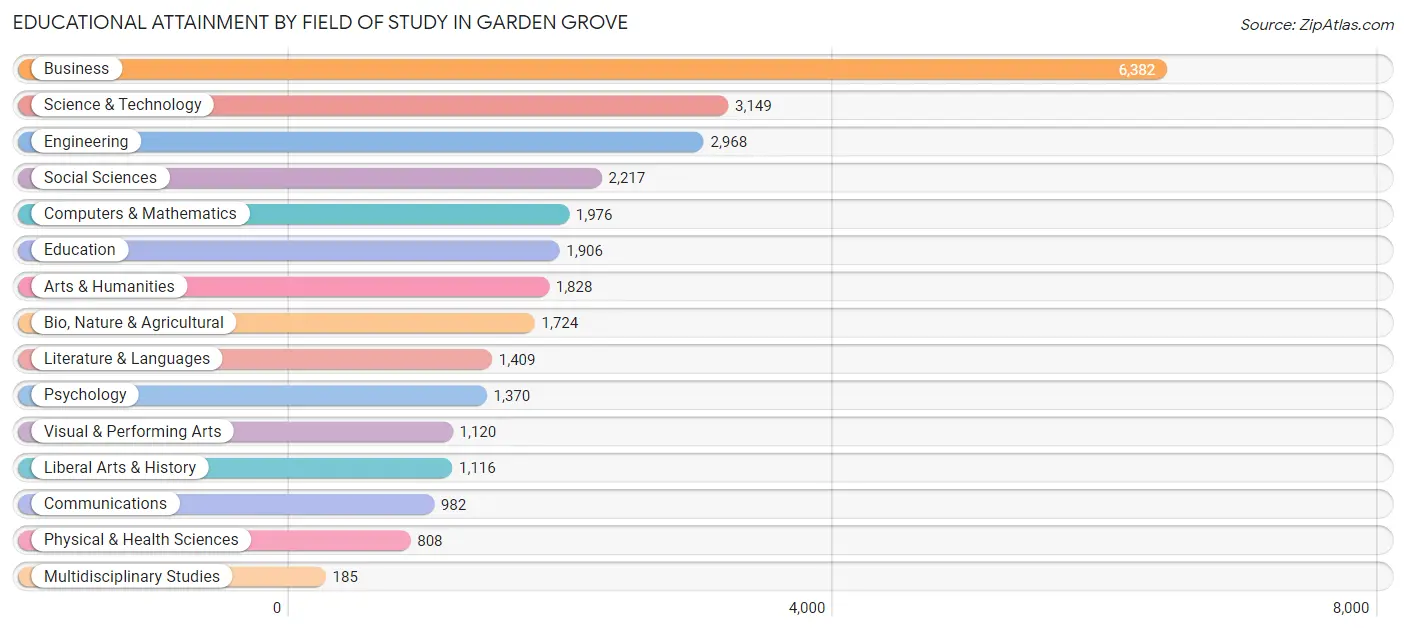
| Field of Study | # Graduates | % Graduates |
| Computers & Mathematics | 1,976 | 6.8% |
| Bio, Nature & Agricultural | 1,724 | 5.9% |
| Physical & Health Sciences | 808 | 2.8% |
| Psychology | 1,370 | 4.7% |
| Social Sciences | 2,217 | 7.6% |
| Engineering | 2,968 | 10.2% |
| Multidisciplinary Studies | 185 | 0.6% |
| Science & Technology | 3,149 | 10.8% |
| Business | 6,382 | 21.9% |
| Education | 1,906 | 6.5% |
| Literature & Languages | 1,409 | 4.8% |
| Liberal Arts & History | 1,116 | 3.8% |
| Visual & Performing Arts | 1,120 | 3.8% |
| Communications | 982 | 3.4% |
| Arts & Humanities | 1,828 | 6.3% |
| Total | 29,140 | 100.0% |
Transportation & Commute in Garden Grove
Vehicle Availability by Sex in Garden Grove
The most prevalent vehicle ownership categories in Garden Grove are males with 2 vehicles (14,832, accounting for 33.0%) and females with 2 vehicles (11,609, making up 39.5%).
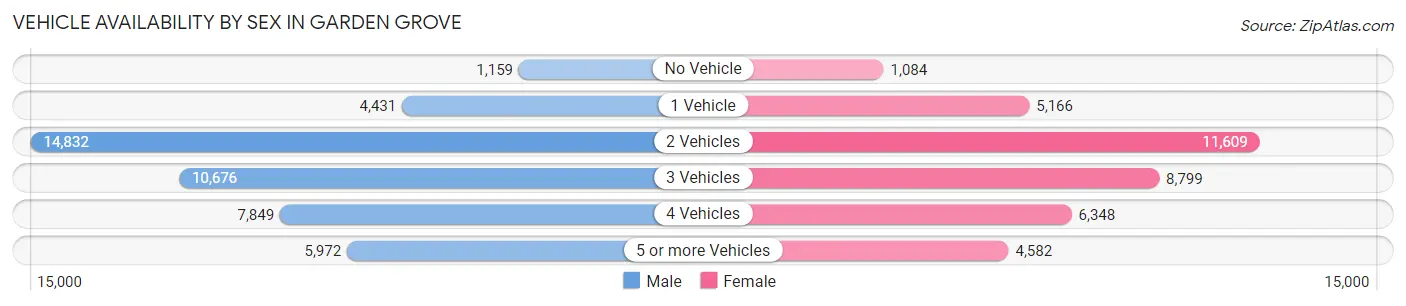
| Vehicles Available | Male | Female |
| No Vehicle | 1,159 (2.6%) | 1,084 (2.9%) |
| 1 Vehicle | 4,431 (9.9%) | 5,166 (13.7%) |
| 2 Vehicles | 14,832 (33.0%) | 11,609 (30.9%) |
| 3 Vehicles | 10,676 (23.8%) | 8,799 (23.4%) |
| 4 Vehicles | 7,849 (17.5%) | 6,348 (16.9%) |
| 5 or more Vehicles | 5,972 (13.3%) | 4,582 (12.2%) |
| Total | 44,919 (100.0%) | 37,588 (100.0%) |
Commute Time in Garden Grove
The most frequently occuring commute durations in Garden Grove are 30 to 34 minutes (16,270 commuters, 21.5%), 20 to 24 minutes (11,581 commuters, 15.3%), and 15 to 19 minutes (10,660 commuters, 14.1%).
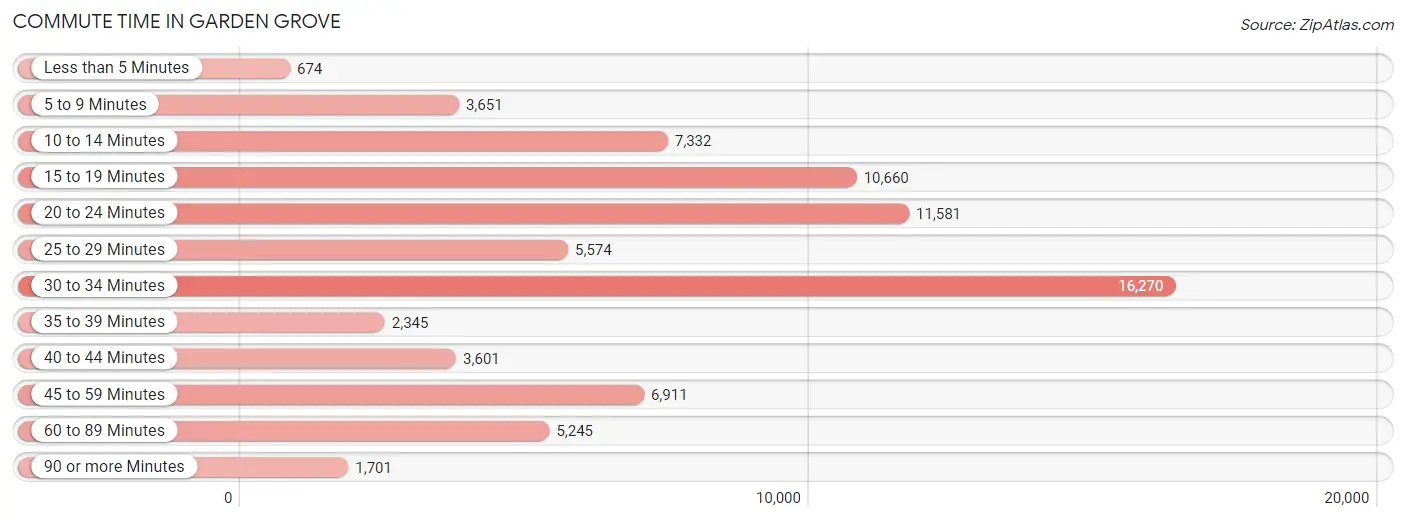
| Commute Time | # Commuters | % Commuters |
| Less than 5 Minutes | 674 | 0.9% |
| 5 to 9 Minutes | 3,651 | 4.8% |
| 10 to 14 Minutes | 7,332 | 9.7% |
| 15 to 19 Minutes | 10,660 | 14.1% |
| 20 to 24 Minutes | 11,581 | 15.3% |
| 25 to 29 Minutes | 5,574 | 7.4% |
| 30 to 34 Minutes | 16,270 | 21.5% |
| 35 to 39 Minutes | 2,345 | 3.1% |
| 40 to 44 Minutes | 3,601 | 4.8% |
| 45 to 59 Minutes | 6,911 | 9.1% |
| 60 to 89 Minutes | 5,245 | 6.9% |
| 90 or more Minutes | 1,701 | 2.2% |
Commute Time by Sex in Garden Grove
The most common commute times in Garden Grove are 30 to 34 minutes (9,512 commuters, 22.9%) for males and 30 to 34 minutes (6,758 commuters, 19.9%) for females.
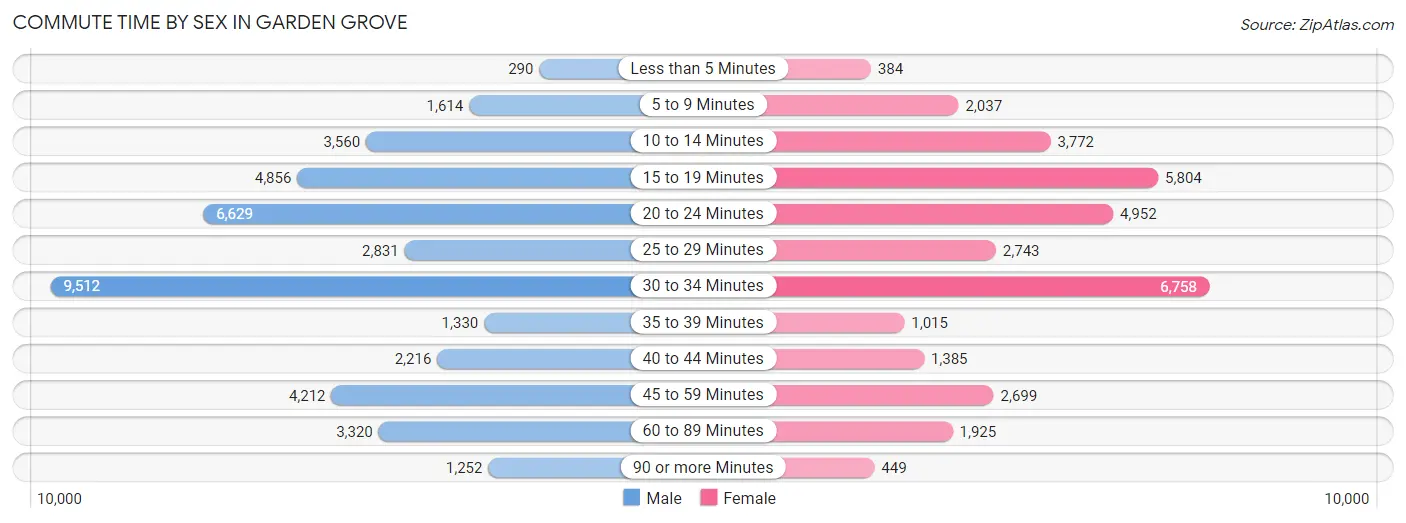
| Commute Time | Male | Female |
| Less than 5 Minutes | 290 (0.7%) | 384 (1.1%) |
| 5 to 9 Minutes | 1,614 (3.9%) | 2,037 (6.0%) |
| 10 to 14 Minutes | 3,560 (8.6%) | 3,772 (11.1%) |
| 15 to 19 Minutes | 4,856 (11.7%) | 5,804 (17.1%) |
| 20 to 24 Minutes | 6,629 (15.9%) | 4,952 (14.6%) |
| 25 to 29 Minutes | 2,831 (6.8%) | 2,743 (8.1%) |
| 30 to 34 Minutes | 9,512 (22.9%) | 6,758 (19.9%) |
| 35 to 39 Minutes | 1,330 (3.2%) | 1,015 (3.0%) |
| 40 to 44 Minutes | 2,216 (5.3%) | 1,385 (4.1%) |
| 45 to 59 Minutes | 4,212 (10.1%) | 2,699 (8.0%) |
| 60 to 89 Minutes | 3,320 (8.0%) | 1,925 (5.7%) |
| 90 or more Minutes | 1,252 (3.0%) | 449 (1.3%) |
Time of Departure to Work by Sex in Garden Grove
The most frequent times of departure to work in Garden Grove are 7:00 AM to 7:29 AM (4,846, 11.6%) for males and 7:00 AM to 7:29 AM (5,397, 15.9%) for females.
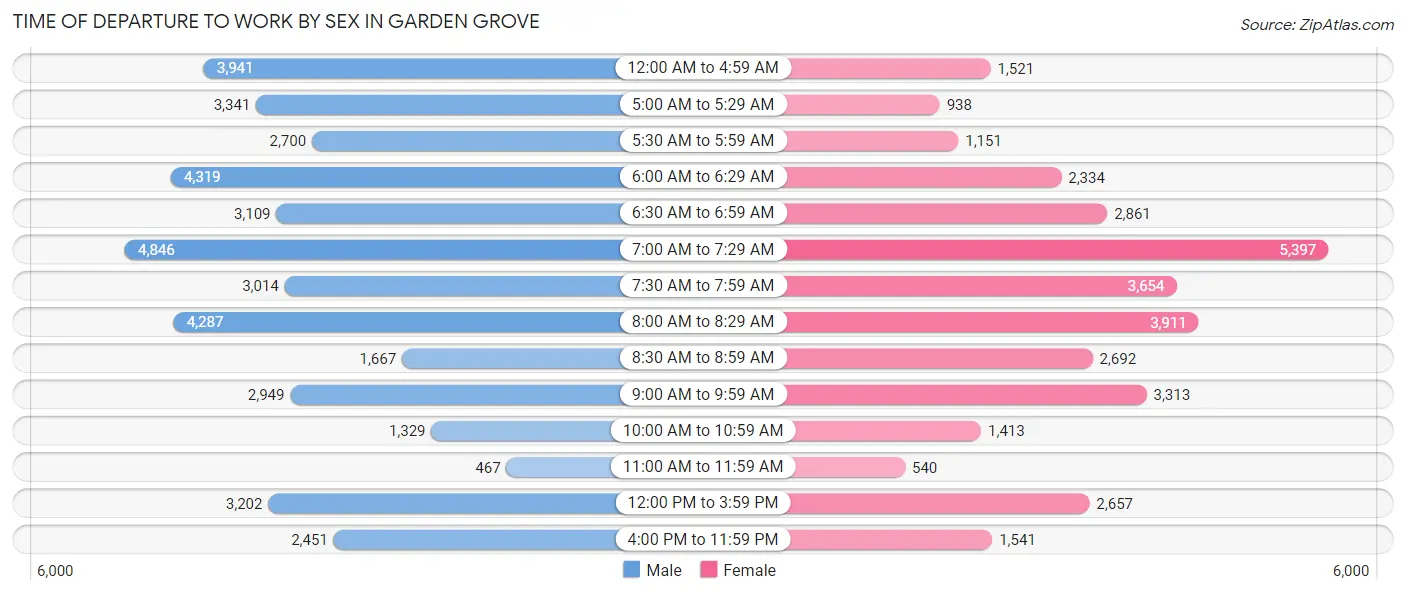
| Time of Departure | Male | Female |
| 12:00 AM to 4:59 AM | 3,941 (9.5%) | 1,521 (4.5%) |
| 5:00 AM to 5:29 AM | 3,341 (8.0%) | 938 (2.8%) |
| 5:30 AM to 5:59 AM | 2,700 (6.5%) | 1,151 (3.4%) |
| 6:00 AM to 6:29 AM | 4,319 (10.4%) | 2,334 (6.9%) |
| 6:30 AM to 6:59 AM | 3,109 (7.5%) | 2,861 (8.4%) |
| 7:00 AM to 7:29 AM | 4,846 (11.6%) | 5,397 (15.9%) |
| 7:30 AM to 7:59 AM | 3,014 (7.2%) | 3,654 (10.8%) |
| 8:00 AM to 8:29 AM | 4,287 (10.3%) | 3,911 (11.5%) |
| 8:30 AM to 8:59 AM | 1,667 (4.0%) | 2,692 (7.9%) |
| 9:00 AM to 9:59 AM | 2,949 (7.1%) | 3,313 (9.8%) |
| 10:00 AM to 10:59 AM | 1,329 (3.2%) | 1,413 (4.2%) |
| 11:00 AM to 11:59 AM | 467 (1.1%) | 540 (1.6%) |
| 12:00 PM to 3:59 PM | 3,202 (7.7%) | 2,657 (7.8%) |
| 4:00 PM to 11:59 PM | 2,451 (5.9%) | 1,541 (4.5%) |
| Total | 41,622 (100.0%) | 33,923 (100.0%) |
Housing Occupancy in Garden Grove
Occupancy by Ownership in Garden Grove
Of the total 48,183 dwellings in Garden Grove, owner-occupied units account for 26,039 (54.0%), while renter-occupied units make up 22,144 (46.0%).
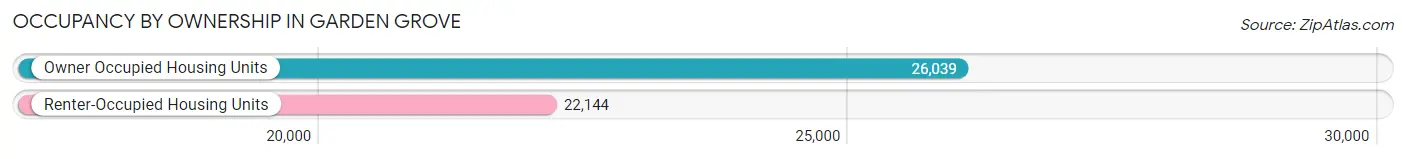
| Occupancy | # Housing Units | % Housing Units |
| Owner Occupied Housing Units | 26,039 | 54.0% |
| Renter-Occupied Housing Units | 22,144 | 46.0% |
| Total Occupied Housing Units | 48,183 | 100.0% |
Occupancy by Household Size in Garden Grove
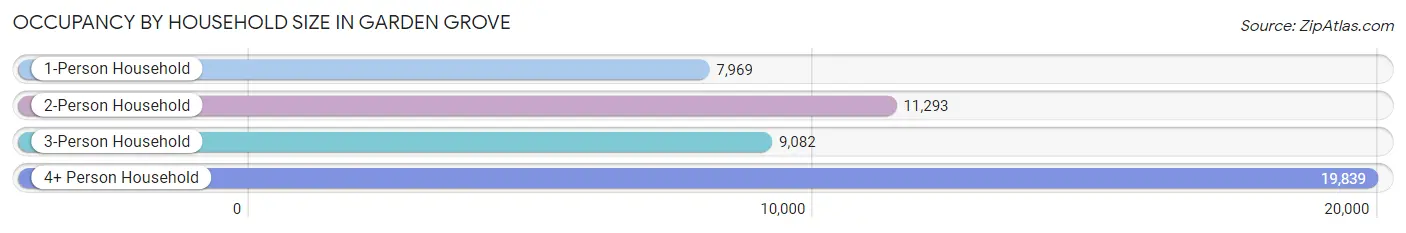
| Household Size | # Housing Units | % Housing Units |
| 1-Person Household | 7,969 | 16.5% |
| 2-Person Household | 11,293 | 23.4% |
| 3-Person Household | 9,082 | 18.9% |
| 4+ Person Household | 19,839 | 41.2% |
| Total Housing Units | 48,183 | 100.0% |
Occupancy by Ownership by Household Size in Garden Grove
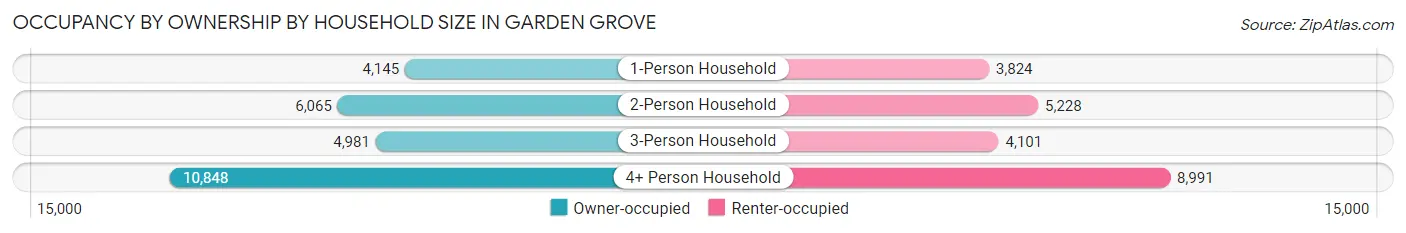
| Household Size | Owner-occupied | Renter-occupied |
| 1-Person Household | 4,145 (52.0%) | 3,824 (48.0%) |
| 2-Person Household | 6,065 (53.7%) | 5,228 (46.3%) |
| 3-Person Household | 4,981 (54.8%) | 4,101 (45.2%) |
| 4+ Person Household | 10,848 (54.7%) | 8,991 (45.3%) |
| Total Housing Units | 26,039 (54.0%) | 22,144 (46.0%) |
Occupancy by Educational Attainment in Garden Grove
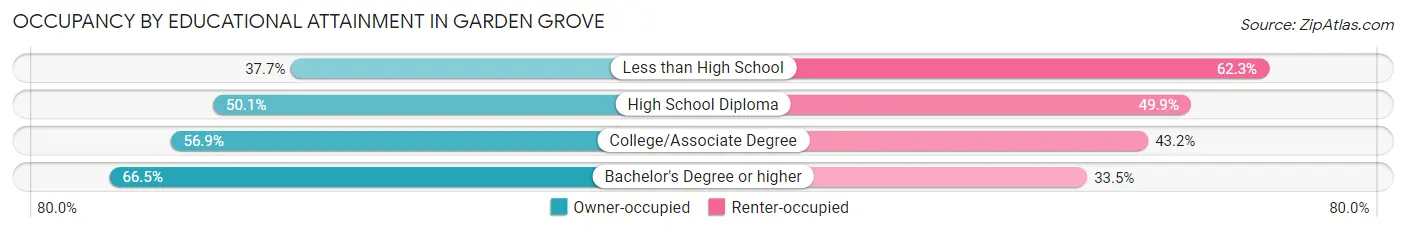
| Household Size | Owner-occupied | Renter-occupied |
| Less than High School | 3,763 (37.7%) | 6,217 (62.3%) |
| High School Diploma | 5,139 (50.1%) | 5,121 (49.9%) |
| College/Associate Degree | 8,540 (56.9%) | 6,481 (43.1%) |
| Bachelor's Degree or higher | 8,597 (66.5%) | 4,325 (33.5%) |
Occupancy by Age of Householder in Garden Grove
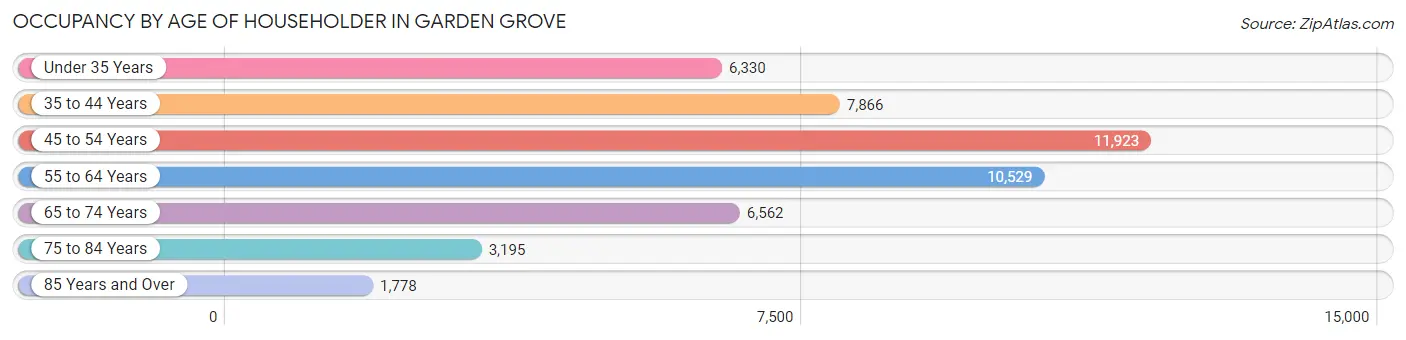
| Age Bracket | # Households | % Households |
| Under 35 Years | 6,330 | 13.1% |
| 35 to 44 Years | 7,866 | 16.3% |
| 45 to 54 Years | 11,923 | 24.7% |
| 55 to 64 Years | 10,529 | 21.8% |
| 65 to 74 Years | 6,562 | 13.6% |
| 75 to 84 Years | 3,195 | 6.6% |
| 85 Years and Over | 1,778 | 3.7% |
| Total | 48,183 | 100.0% |
Housing Finances in Garden Grove
Median Income by Occupancy in Garden Grove
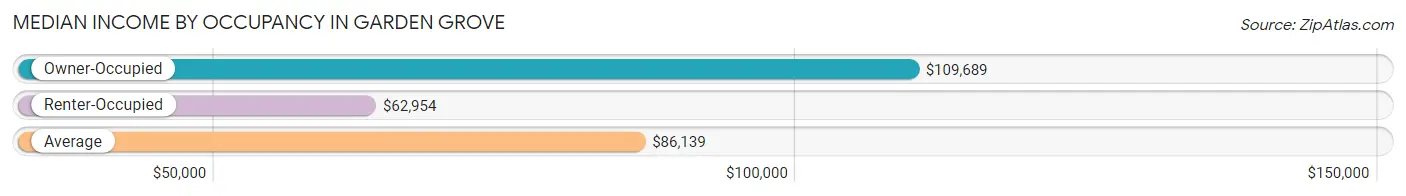
| Occupancy Type | # Households | Median Income |
| Owner-Occupied | 26,039 (54.0%) | $109,689 |
| Renter-Occupied | 22,144 (46.0%) | $62,954 |
| Average | 48,183 (100.0%) | $86,139 |
Occupancy by Householder Income Bracket in Garden Grove
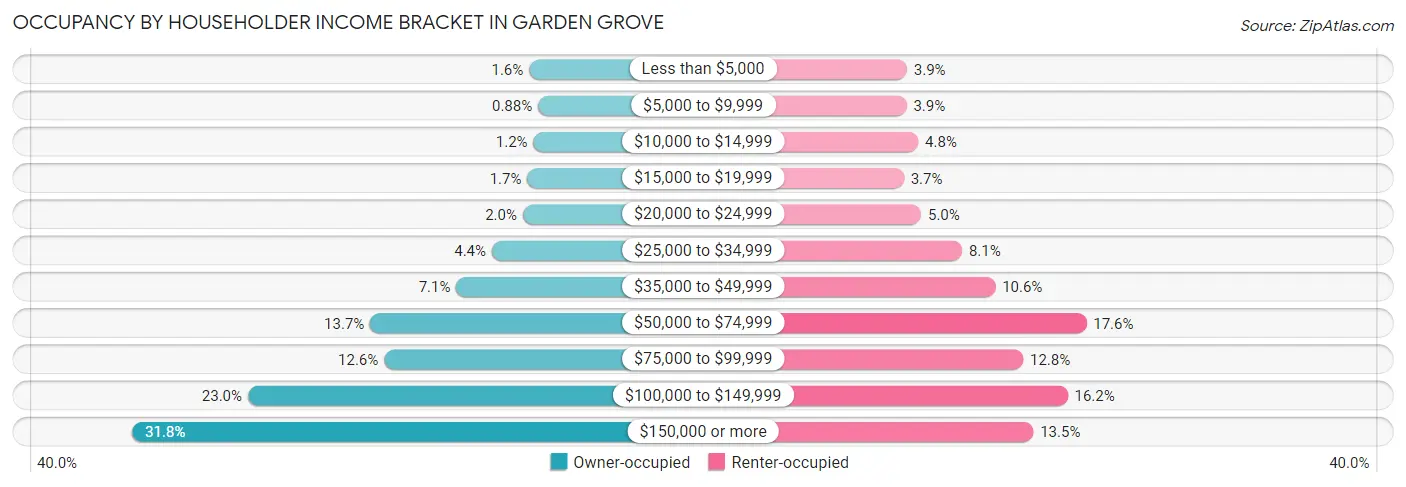
| Income Bracket | Owner-occupied | Renter-occupied |
| Less than $5,000 | 406 (1.6%) | 865 (3.9%) |
| $5,000 to $9,999 | 228 (0.9%) | 859 (3.9%) |
| $10,000 to $14,999 | 320 (1.2%) | 1,056 (4.8%) |
| $15,000 to $19,999 | 443 (1.7%) | 812 (3.7%) |
| $20,000 to $24,999 | 530 (2.0%) | 1,105 (5.0%) |
| $25,000 to $34,999 | 1,146 (4.4%) | 1,796 (8.1%) |
| $35,000 to $49,999 | 1,852 (7.1%) | 2,357 (10.6%) |
| $50,000 to $74,999 | 3,560 (13.7%) | 3,894 (17.6%) |
| $75,000 to $99,999 | 3,284 (12.6%) | 2,825 (12.8%) |
| $100,000 to $149,999 | 5,987 (23.0%) | 3,577 (16.2%) |
| $150,000 or more | 8,283 (31.8%) | 2,998 (13.5%) |
| Total | 26,039 (100.0%) | 22,144 (100.0%) |
Monthly Housing Cost Tiers in Garden Grove
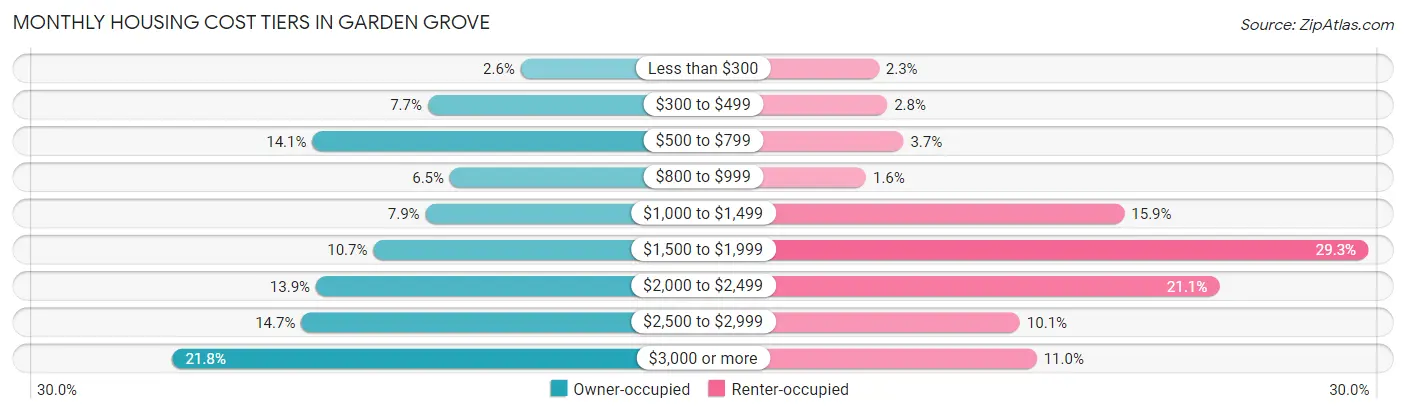
| Monthly Cost | Owner-occupied | Renter-occupied |
| Less than $300 | 677 (2.6%) | 506 (2.3%) |
| $300 to $499 | 2,012 (7.7%) | 608 (2.8%) |
| $500 to $799 | 3,675 (14.1%) | 809 (3.6%) |
| $800 to $999 | 1,694 (6.5%) | 349 (1.6%) |
| $1,000 to $1,499 | 2,046 (7.9%) | 3,509 (15.9%) |
| $1,500 to $1,999 | 2,797 (10.7%) | 6,488 (29.3%) |
| $2,000 to $2,499 | 3,622 (13.9%) | 4,667 (21.1%) |
| $2,500 to $2,999 | 3,832 (14.7%) | 2,233 (10.1%) |
| $3,000 or more | 5,684 (21.8%) | 2,437 (11.0%) |
| Total | 26,039 (100.0%) | 22,144 (100.0%) |
Physical Housing Characteristics in Garden Grove
Housing Structures in Garden Grove
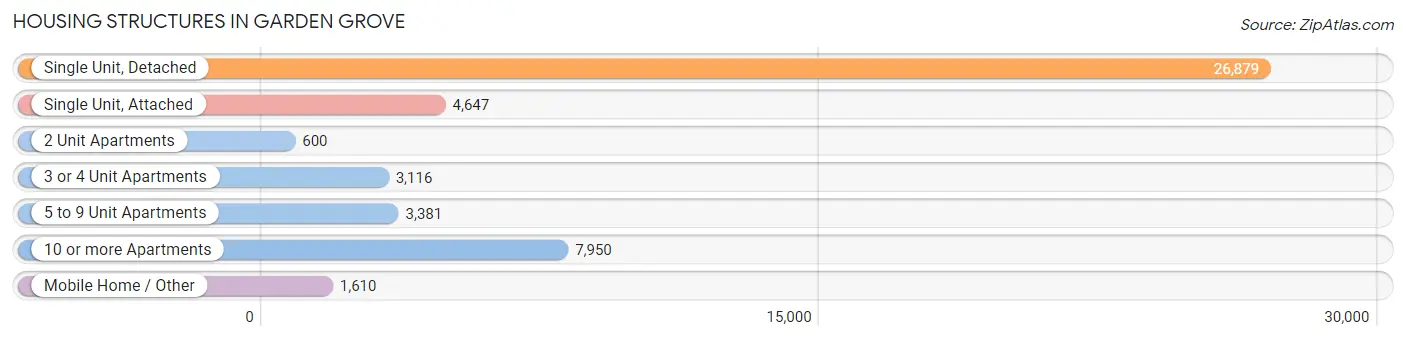
| Structure Type | # Housing Units | % Housing Units |
| Single Unit, Detached | 26,879 | 55.8% |
| Single Unit, Attached | 4,647 | 9.6% |
| 2 Unit Apartments | 600 | 1.3% |
| 3 or 4 Unit Apartments | 3,116 | 6.5% |
| 5 to 9 Unit Apartments | 3,381 | 7.0% |
| 10 or more Apartments | 7,950 | 16.5% |
| Mobile Home / Other | 1,610 | 3.3% |
| Total | 48,183 | 100.0% |
Housing Structures by Occupancy in Garden Grove
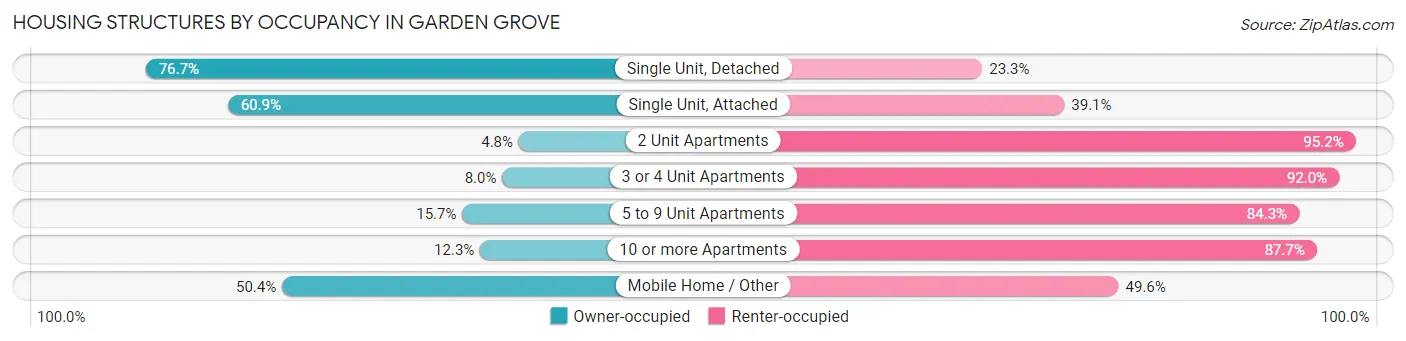
| Structure Type | Owner-occupied | Renter-occupied |
| Single Unit, Detached | 20,610 (76.7%) | 6,269 (23.3%) |
| Single Unit, Attached | 2,829 (60.9%) | 1,818 (39.1%) |
| 2 Unit Apartments | 29 (4.8%) | 571 (95.2%) |
| 3 or 4 Unit Apartments | 250 (8.0%) | 2,866 (92.0%) |
| 5 to 9 Unit Apartments | 532 (15.7%) | 2,849 (84.3%) |
| 10 or more Apartments | 977 (12.3%) | 6,973 (87.7%) |
| Mobile Home / Other | 812 (50.4%) | 798 (49.6%) |
| Total | 26,039 (54.0%) | 22,144 (46.0%) |
Housing Structures by Number of Rooms in Garden Grove
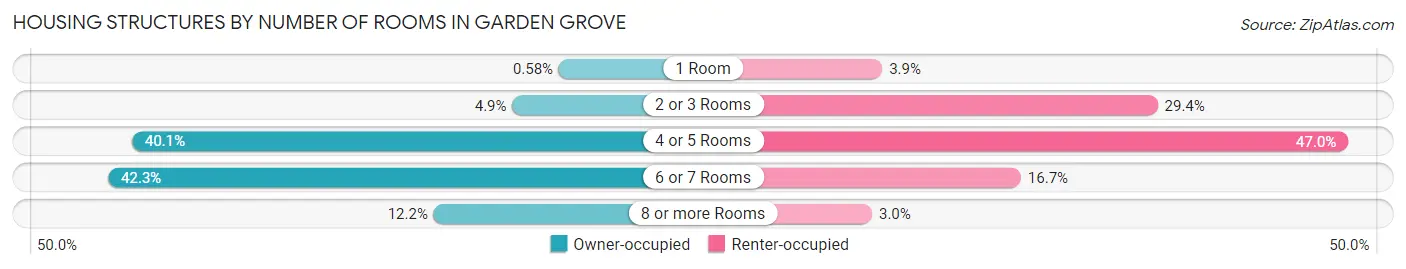
| Number of Rooms | Owner-occupied | Renter-occupied |
| 1 Room | 151 (0.6%) | 866 (3.9%) |
| 2 or 3 Rooms | 1,273 (4.9%) | 6,507 (29.4%) |
| 4 or 5 Rooms | 10,436 (40.1%) | 10,407 (47.0%) |
| 6 or 7 Rooms | 11,013 (42.3%) | 3,707 (16.7%) |
| 8 or more Rooms | 3,166 (12.2%) | 657 (3.0%) |
| Total | 26,039 (100.0%) | 22,144 (100.0%) |
Housing Structure by Heating Type in Garden Grove
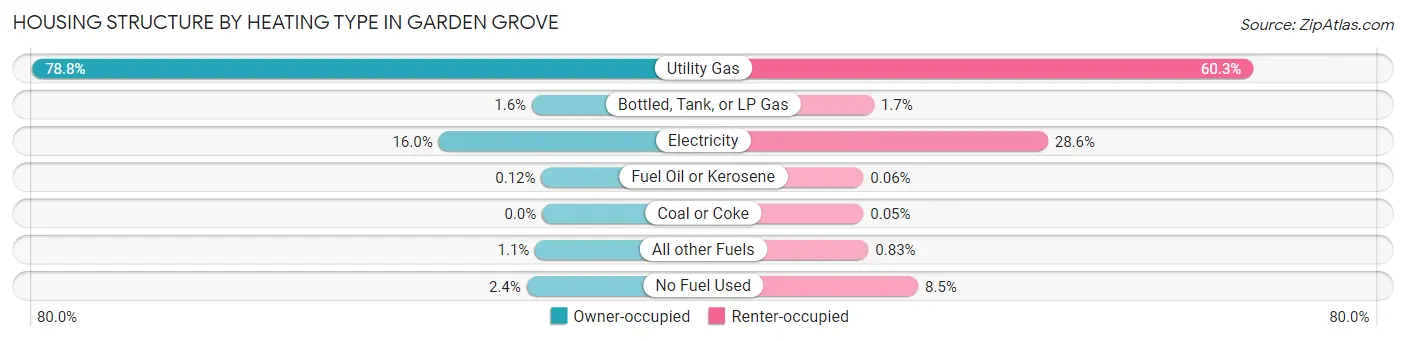
| Heating Type | Owner-occupied | Renter-occupied |
| Utility Gas | 20,524 (78.8%) | 13,352 (60.3%) |
| Bottled, Tank, or LP Gas | 409 (1.6%) | 375 (1.7%) |
| Electricity | 4,172 (16.0%) | 6,324 (28.6%) |
| Fuel Oil or Kerosene | 32 (0.1%) | 13 (0.1%) |
| Coal or Coke | 0 (0.0%) | 12 (0.1%) |
| All other Fuels | 279 (1.1%) | 184 (0.8%) |
| No Fuel Used | 623 (2.4%) | 1,884 (8.5%) |
| Total | 26,039 (100.0%) | 22,144 (100.0%) |
Household Vehicle Usage in Garden Grove
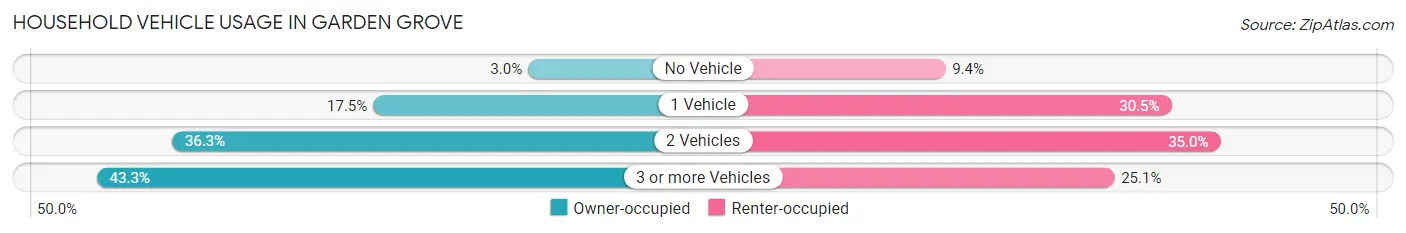
| Vehicles per Household | Owner-occupied | Renter-occupied |
| No Vehicle | 783 (3.0%) | 2,072 (9.4%) |
| 1 Vehicle | 4,550 (17.5%) | 6,747 (30.5%) |
| 2 Vehicles | 9,438 (36.2%) | 7,757 (35.0%) |
| 3 or more Vehicles | 11,268 (43.3%) | 5,568 (25.1%) |
| Total | 26,039 (100.0%) | 22,144 (100.0%) |
Real Estate & Mortgages in Garden Grove
Real Estate and Mortgage Overview in Garden Grove
| Characteristic | Without Mortgage | With Mortgage |
| Housing Units | 8,980 | 17,059 |
| Median Property Value | $696,000 | $705,800 |
| Median Household Income | $88,656 | $6,186 |
| Monthly Housing Costs | $647 | $5,678 |
| Real Estate Taxes | $3,860 | $262 |
Property Value by Mortgage Status in Garden Grove
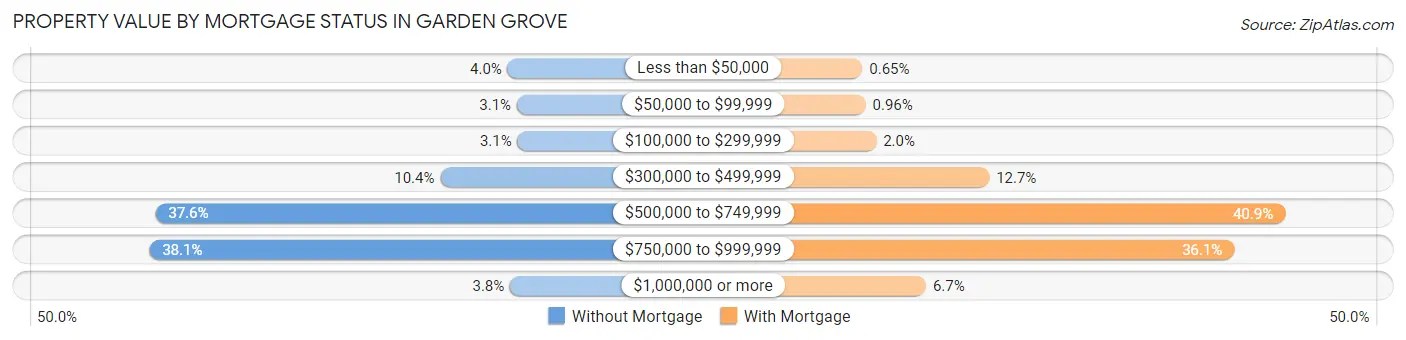
| Property Value | Without Mortgage | With Mortgage |
| Less than $50,000 | 358 (4.0%) | 111 (0.6%) |
| $50,000 to $99,999 | 279 (3.1%) | 164 (1.0%) |
| $100,000 to $299,999 | 274 (3.0%) | 336 (2.0%) |
| $300,000 to $499,999 | 935 (10.4%) | 2,172 (12.7%) |
| $500,000 to $749,999 | 3,372 (37.6%) | 6,980 (40.9%) |
| $750,000 to $999,999 | 3,424 (38.1%) | 6,152 (36.1%) |
| $1,000,000 or more | 338 (3.8%) | 1,144 (6.7%) |
| Total | 8,980 (100.0%) | 17,059 (100.0%) |
Household Income by Mortgage Status in Garden Grove
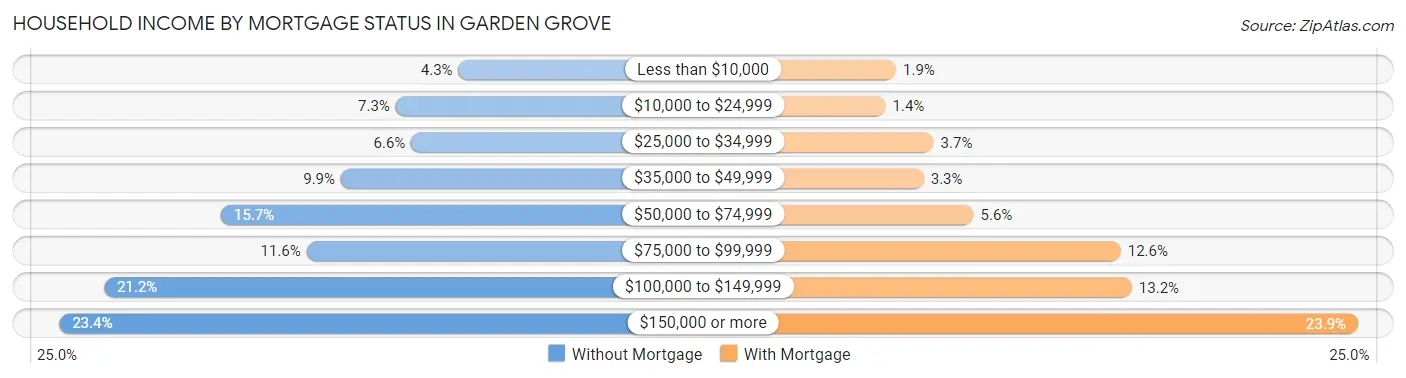
| Household Income | Without Mortgage | With Mortgage |
| Less than $10,000 | 390 (4.3%) | 329 (1.9%) |
| $10,000 to $24,999 | 658 (7.3%) | 244 (1.4%) |
| $25,000 to $34,999 | 592 (6.6%) | 635 (3.7%) |
| $35,000 to $49,999 | 893 (9.9%) | 554 (3.3%) |
| $50,000 to $74,999 | 1,405 (15.7%) | 959 (5.6%) |
| $75,000 to $99,999 | 1,039 (11.6%) | 2,155 (12.6%) |
| $100,000 to $149,999 | 1,906 (21.2%) | 2,245 (13.2%) |
| $150,000 or more | 2,097 (23.4%) | 4,081 (23.9%) |
| Total | 8,980 (100.0%) | 17,059 (100.0%) |
Property Value to Household Income Ratio in Garden Grove
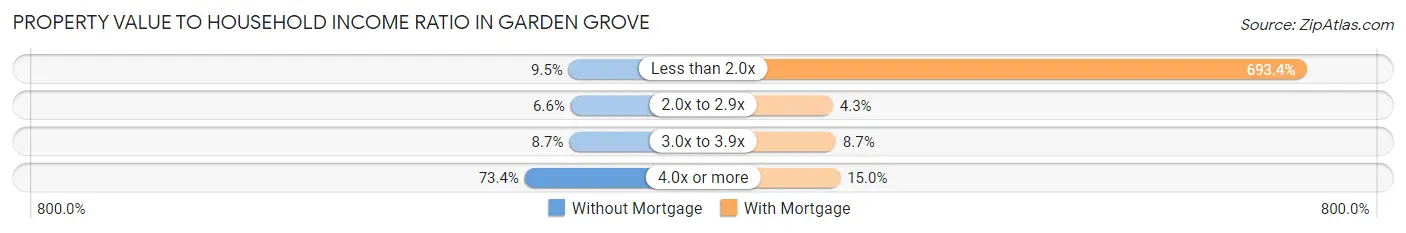
| Value-to-Income Ratio | Without Mortgage | With Mortgage |
| Less than 2.0x | 854 (9.5%) | 118,294 (693.4%) |
| 2.0x to 2.9x | 596 (6.6%) | 732 (4.3%) |
| 3.0x to 3.9x | 784 (8.7%) | 1,484 (8.7%) |
| 4.0x or more | 6,594 (73.4%) | 2,553 (15.0%) |
| Total | 8,980 (100.0%) | 17,059 (100.0%) |
Real Estate Taxes by Mortgage Status in Garden Grove
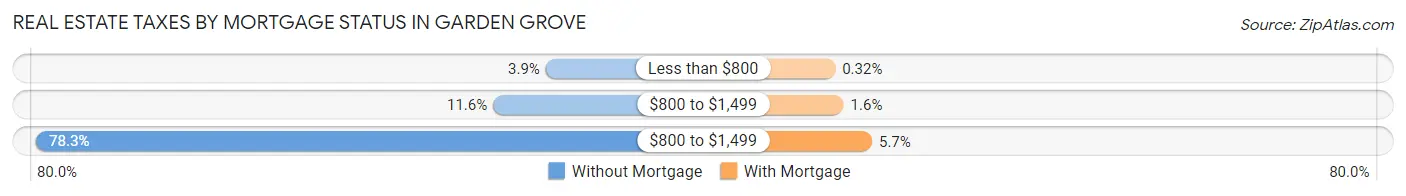
| Property Taxes | Without Mortgage | With Mortgage |
| Less than $800 | 347 (3.9%) | 54 (0.3%) |
| $800 to $1,499 | 1,037 (11.6%) | 265 (1.5%) |
| $800 to $1,499 | 7,032 (78.3%) | 973 (5.7%) |
| Total | 8,980 (100.0%) | 17,059 (100.0%) |
Health & Disability in Garden Grove
Health Insurance Coverage by Age in Garden Grove
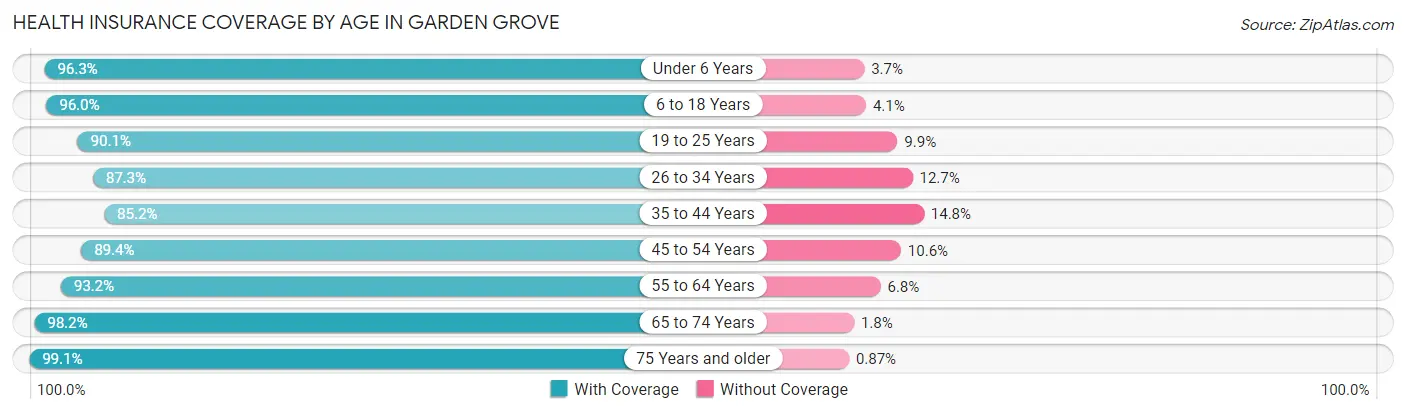
| Age Bracket | With Coverage | Without Coverage |
| Under 6 Years | 10,109 (96.3%) | 390 (3.7%) |
| 6 to 18 Years | 27,432 (96.0%) | 1,157 (4.1%) |
| 19 to 25 Years | 14,999 (90.1%) | 1,648 (9.9%) |
| 26 to 34 Years | 18,759 (87.3%) | 2,733 (12.7%) |
| 35 to 44 Years | 17,212 (85.2%) | 3,000 (14.8%) |
| 45 to 54 Years | 23,024 (89.4%) | 2,717 (10.6%) |
| 55 to 64 Years | 22,131 (93.2%) | 1,604 (6.8%) |
| 65 to 74 Years | 13,057 (98.2%) | 241 (1.8%) |
| 75 Years and older | 10,683 (99.1%) | 94 (0.9%) |
| Total | 157,406 (92.1%) | 13,584 (7.9%) |
Health Insurance Coverage by Citizenship Status in Garden Grove
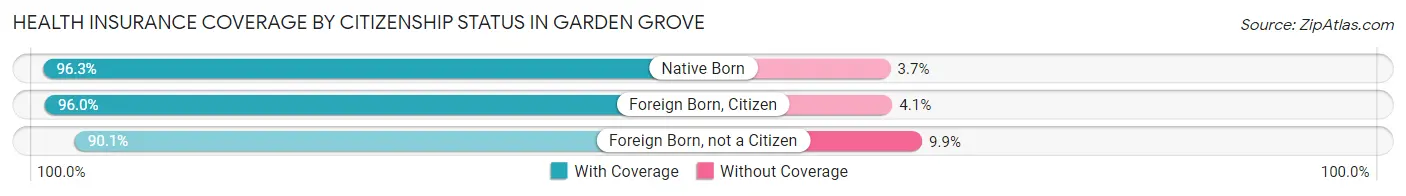
| Citizenship Status | With Coverage | Without Coverage |
| Native Born | 10,109 (96.3%) | 390 (3.7%) |
| Foreign Born, Citizen | 27,432 (96.0%) | 1,157 (4.1%) |
| Foreign Born, not a Citizen | 14,999 (90.1%) | 1,648 (9.9%) |
Health Insurance Coverage by Household Income in Garden Grove
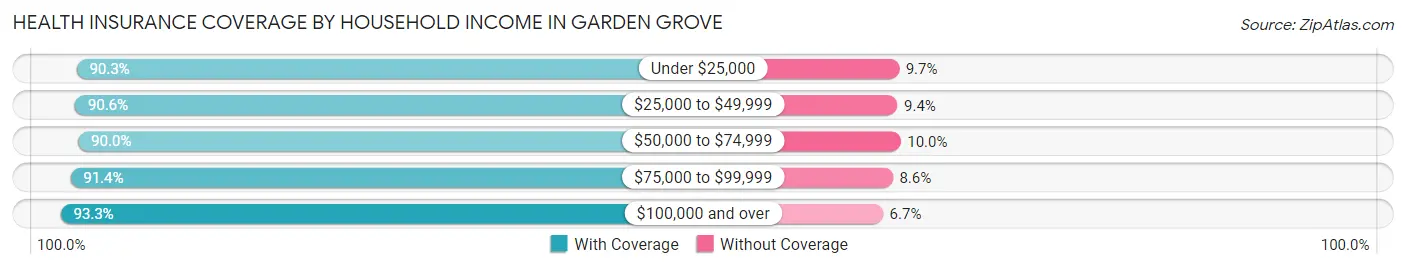
| Household Income | With Coverage | Without Coverage |
| Under $25,000 | 13,139 (90.3%) | 1,414 (9.7%) |
| $25,000 to $49,999 | 18,504 (90.6%) | 1,924 (9.4%) |
| $50,000 to $74,999 | 20,479 (90.0%) | 2,283 (10.0%) |
| $75,000 to $99,999 | 19,835 (91.4%) | 1,856 (8.6%) |
| $100,000 and over | 83,451 (93.3%) | 6,010 (6.7%) |
Public vs Private Health Insurance Coverage by Age in Garden Grove
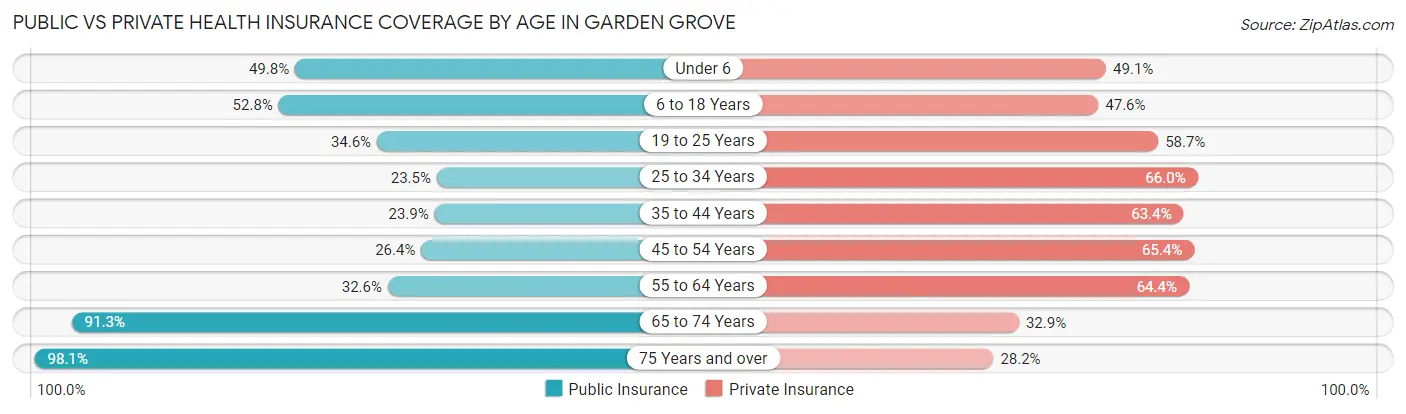
| Age Bracket | Public Insurance | Private Insurance |
| Under 6 | 5,230 (49.8%) | 5,152 (49.1%) |
| 6 to 18 Years | 15,105 (52.8%) | 13,614 (47.6%) |
| 19 to 25 Years | 5,760 (34.6%) | 9,776 (58.7%) |
| 25 to 34 Years | 5,049 (23.5%) | 14,189 (66.0%) |
| 35 to 44 Years | 4,832 (23.9%) | 12,819 (63.4%) |
| 45 to 54 Years | 6,790 (26.4%) | 16,834 (65.4%) |
| 55 to 64 Years | 7,735 (32.6%) | 15,284 (64.4%) |
| 65 to 74 Years | 12,136 (91.3%) | 4,374 (32.9%) |
| 75 Years and over | 10,577 (98.1%) | 3,034 (28.1%) |
| Total | 73,214 (42.8%) | 95,076 (55.6%) |
Disability Status by Sex by Age in Garden Grove
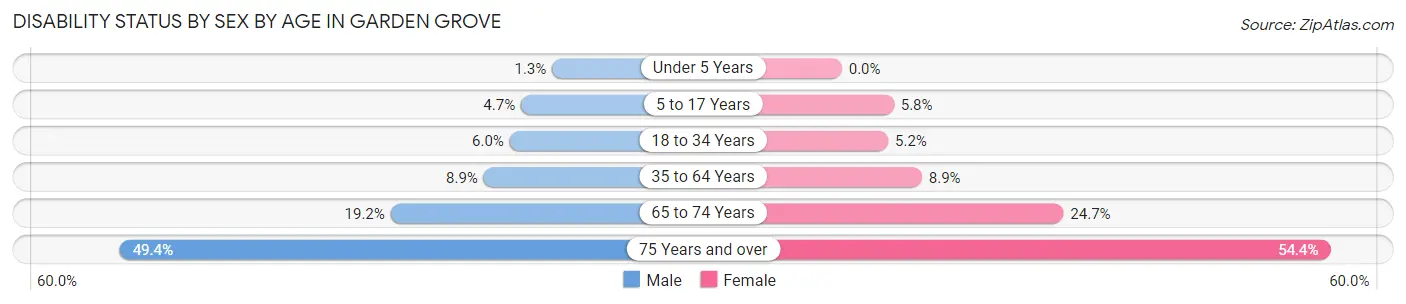
| Age Bracket | Male | Female |
| Under 5 Years | 51 (1.3%) | 0 (0.0%) |
| 5 to 17 Years | 680 (4.7%) | 774 (5.8%) |
| 18 to 34 Years | 1,262 (6.0%) | 1,015 (5.2%) |
| 35 to 64 Years | 3,149 (8.9%) | 3,052 (8.9%) |
| 65 to 74 Years | 1,263 (19.2%) | 1,662 (24.7%) |
| 75 Years and over | 2,139 (49.4%) | 3,507 (54.4%) |
Disability Class by Sex by Age in Garden Grove
Disability Class: Hearing Difficulty
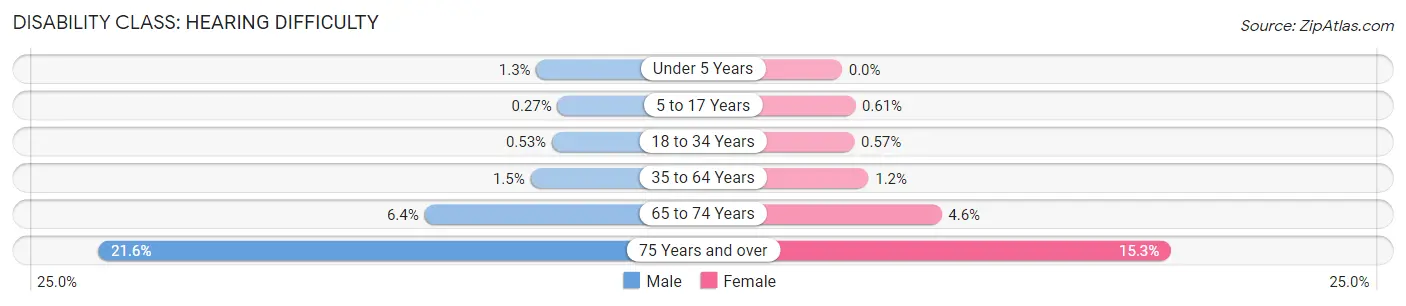
| Age Bracket | Male | Female |
| Under 5 Years | 51 (1.3%) | 0 (0.0%) |
| 5 to 17 Years | 39 (0.3%) | 82 (0.6%) |
| 18 to 34 Years | 112 (0.5%) | 112 (0.6%) |
| 35 to 64 Years | 540 (1.5%) | 422 (1.2%) |
| 65 to 74 Years | 423 (6.4%) | 311 (4.6%) |
| 75 Years and over | 935 (21.6%) | 985 (15.3%) |
Disability Class: Vision Difficulty
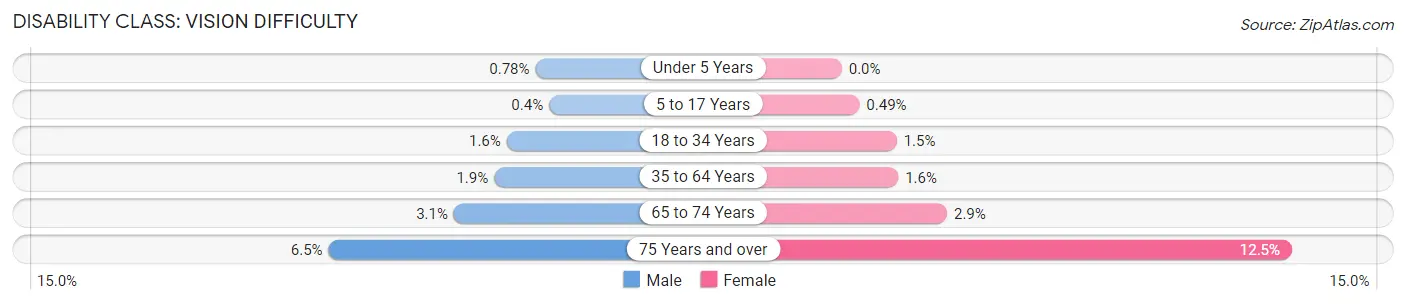
| Age Bracket | Male | Female |
| Under 5 Years | 32 (0.8%) | 0 (0.0%) |
| 5 to 17 Years | 58 (0.4%) | 66 (0.5%) |
| 18 to 34 Years | 334 (1.6%) | 300 (1.5%) |
| 35 to 64 Years | 686 (1.9%) | 536 (1.6%) |
| 65 to 74 Years | 200 (3.0%) | 197 (2.9%) |
| 75 Years and over | 283 (6.5%) | 808 (12.5%) |
Disability Class: Cognitive Difficulty
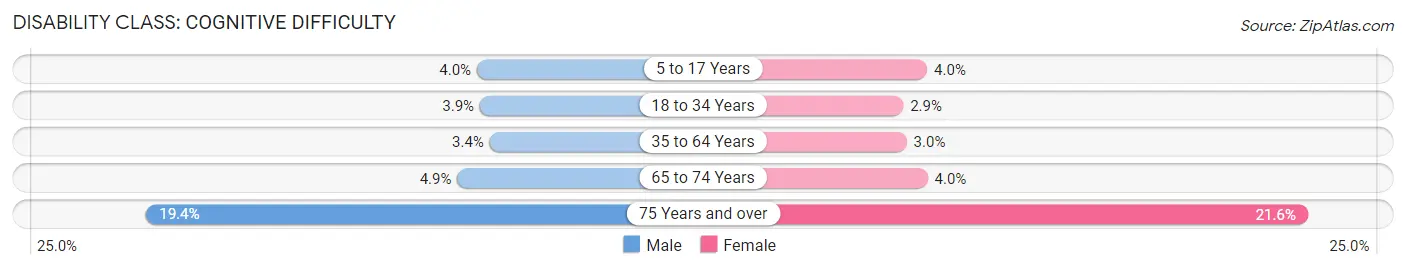
| Age Bracket | Male | Female |
| 5 to 17 Years | 578 (4.0%) | 530 (4.0%) |
| 18 to 34 Years | 816 (3.9%) | 561 (2.9%) |
| 35 to 64 Years | 1,213 (3.4%) | 1,030 (3.0%) |
| 65 to 74 Years | 323 (4.9%) | 268 (4.0%) |
| 75 Years and over | 838 (19.4%) | 1,394 (21.6%) |
Disability Class: Ambulatory Difficulty

| Age Bracket | Male | Female |
| 5 to 17 Years | 0 (0.0%) | 82 (0.6%) |
| 18 to 34 Years | 226 (1.1%) | 190 (1.0%) |
| 35 to 64 Years | 1,229 (3.5%) | 1,484 (4.3%) |
| 65 to 74 Years | 687 (10.5%) | 1,026 (15.2%) |
| 75 Years and over | 1,328 (30.7%) | 2,743 (42.5%) |
Disability Class: Self-Care Difficulty
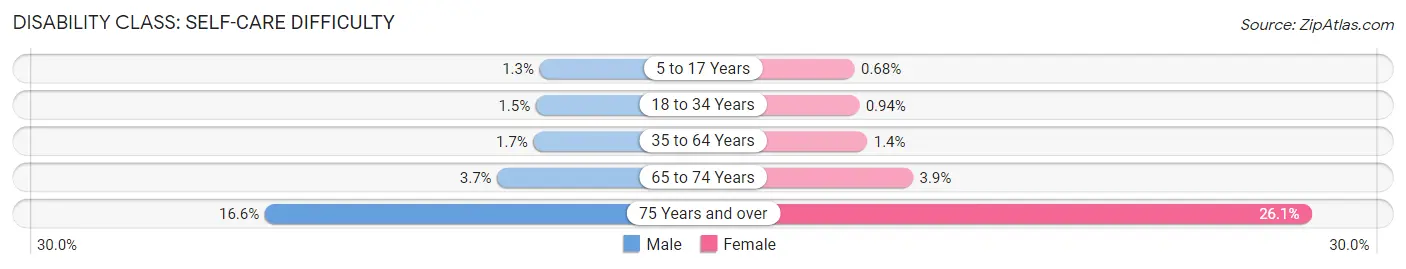
| Age Bracket | Male | Female |
| 5 to 17 Years | 189 (1.3%) | 91 (0.7%) |
| 18 to 34 Years | 321 (1.5%) | 185 (0.9%) |
| 35 to 64 Years | 584 (1.7%) | 474 (1.4%) |
| 65 to 74 Years | 241 (3.7%) | 265 (3.9%) |
| 75 Years and over | 719 (16.6%) | 1,685 (26.1%) |
Technology Access in Garden Grove
Computing Device Access in Garden Grove
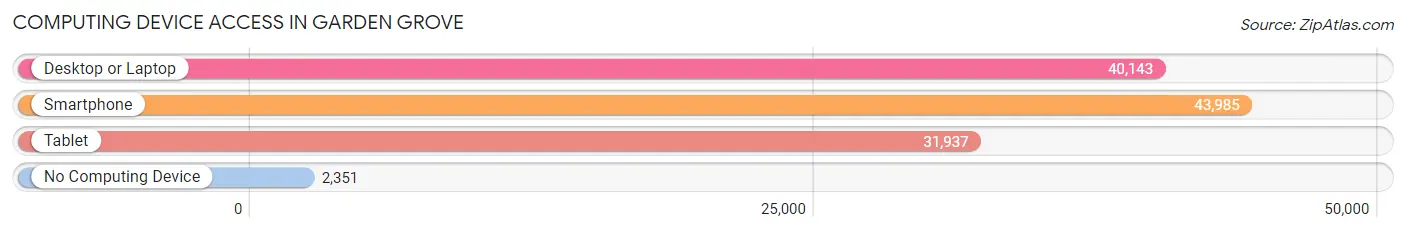
| Device Type | # Households | % Households |
| Desktop or Laptop | 40,143 | 83.3% |
| Smartphone | 43,985 | 91.3% |
| Tablet | 31,937 | 66.3% |
| No Computing Device | 2,351 | 4.9% |
| Total | 48,183 | 100.0% |
Internet Access in Garden Grove
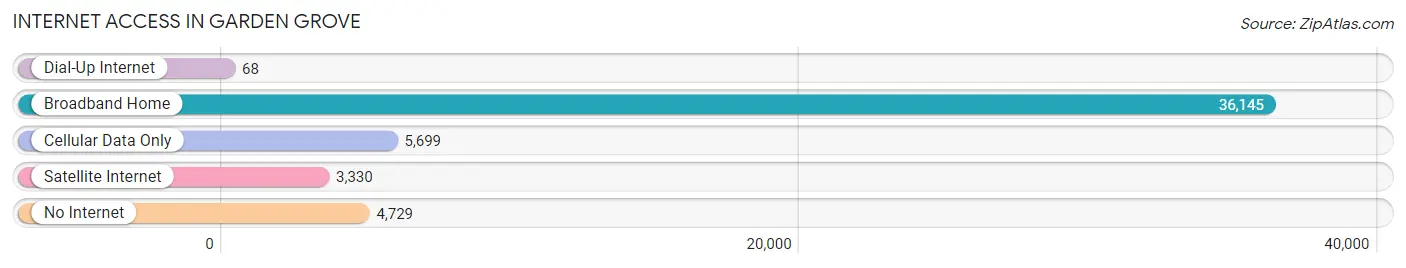
| Internet Type | # Households | % Households |
| Dial-Up Internet | 68 | 0.1% |
| Broadband Home | 36,145 | 75.0% |
| Cellular Data Only | 5,699 | 11.8% |
| Satellite Internet | 3,330 | 6.9% |
| No Internet | 4,729 | 9.8% |
| Total | 48,183 | 100.0% |
Garden Grove Summary
Garden Grove is a city located in Orange County, California, United States. It is located in the Los Angeles metropolitan area and is one of the most populous cities in the county. The city is known for its diverse population, its vibrant culture, and its many attractions.
Geography
Garden Grove is located in the northern part of Orange County, California, and is bordered by the cities of Anaheim, Santa Ana, and Westminster. The city is situated in a coastal plain, with the Santa Ana Mountains to the east and the Pacific Ocean to the west. The city has a total area of 22.2 square miles, of which 21.7 square miles is land and 0.5 square miles is water.
Climate
Garden Grove has a Mediterranean climate, with warm, dry summers and mild, wet winters. The average annual temperature is around 68°F, with temperatures ranging from the mid-50s in the winter to the mid-80s in the summer. The city receives an average of 15 inches of rain per year.
Demographics
As of the 2010 census, Garden Grove had a population of 170,883. The racial makeup of the city was 57.2% White, 2.3% African American, 1.2% Native American, 11.3% Asian, 0.4% Pacific Islander, 22.7% from other races, and 5.1% from two or more races. Hispanic or Latino of any race were 37.7% of the population.
Economy
Garden Grove is home to a variety of businesses and industries. The city is home to several major employers, including the Garden Grove Unified School District, the City of Garden Grove, and the Garden Grove Hospital Medical Center. The city is also home to several large retail centers, including the Garden Grove Town Center and the Garden Grove Marketplace.
The city is also home to several major attractions, including Disneyland, Knott's Berry Farm, and the Crystal Cathedral. The city is also home to several major events, including the Garden Grove Strawberry Festival and the Garden Grove Street Fair.
History
Garden Grove was founded in 1874 by Alonzo Cook, a former Union Army soldier. The city was originally named "Gardengrove," but the name was changed to "Garden Grove" in 1876. The city was incorporated in 1956 and has since grown to become one of the most populous cities in Orange County.
Garden Grove has a long history of being a diverse and vibrant community. The city has been home to a variety of cultures, including Mexican, Vietnamese, and Cambodian. The city has also been home to a variety of religious groups, including the Crystal Cathedral, the largest Protestant church in the world.
Garden Grove has also been home to a variety of notable people, including actor John Wayne, singer Gwen Stefani, and former President Richard Nixon. The city is also home to several major attractions, including Disneyland, Knott's Berry Farm, and the Crystal Cathedral.
Common Questions
What is Per Capita Income in Garden Grove?
Per Capita income in Garden Grove is $31,132.
What is the Median Family Income in Garden Grove?
Median Family Income in Garden Grove is $91,469.
What is the Median Household income in Garden Grove?
Median Household Income in Garden Grove is $86,139.
What is Income or Wage Gap in Garden Grove?
Income or Wage Gap in Garden Grove is 21.3%.
Women in Garden Grove earn 78.7 cents for every dollar earned by a man.
What is Family Income Deficit in Garden Grove?
Family Income Deficit in Garden Grove is $11,782.
Families that are below poverty line in Garden Grove earn $11,782 less on average than the poverty threshold level.
What is Inequality or Gini Index in Garden Grove?
Inequality or Gini Index in Garden Grove is 0.42.
What is the Total Population of Garden Grove?
Total Population of Garden Grove is 171,637.
What is the Total Male Population of Garden Grove?
Total Male Population of Garden Grove is 86,329.
What is the Total Female Population of Garden Grove?
Total Female Population of Garden Grove is 85,308.
What is the Ratio of Males per 100 Females in Garden Grove?
There are 101.20 Males per 100 Females in Garden Grove.
What is the Ratio of Females per 100 Males in Garden Grove?
There are 98.82 Females per 100 Males in Garden Grove.
What is the Median Population Age in Garden Grove?
Median Population Age in Garden Grove is 39.2 Years.
What is the Average Family Size in Garden Grove
Average Family Size in Garden Grove is 3.9 People.
What is the Average Household Size in Garden Grove
Average Household Size in Garden Grove is 3.5 People.
How Large is the Labor Force in Garden Grove?
There are 89,937 People in the Labor Forcein in Garden Grove.
What is the Percentage of People in the Labor Force in Garden Grove?
64.3% of People are in the Labor Force in Garden Grove.
What is the Unemployment Rate in Garden Grove?
Unemployment Rate in Garden Grove is 5.8%.