Sandy, UT Map & Demographics
Sandy Map
Sandy Overview
$47,480
PER CAPITA INCOME
$118,774
AVG FAMILY INCOME
$108,165
AVG HOUSEHOLD INCOME
39.1%
WAGE / INCOME GAP [ % ]
60.9¢/ $1
WAGE / INCOME GAP [ $ ]
$11,411
FAMILY INCOME DEFICIT
0.40
INEQUALITY / GINI INDEX
95,635
TOTAL POPULATION
48,607
MALE POPULATION
47,028
FEMALE POPULATION
103.36
MALES / 100 FEMALES
96.75
FEMALES / 100 MALES
36.9
MEDIAN AGE
3.3
AVG FAMILY SIZE
2.9
AVG HOUSEHOLD SIZE
51,460
LABOR FORCE [ PEOPLE ]
69.7%
PERCENT IN LABOR FORCE
2.2%
UNEMPLOYMENT RATE
Sandy Area Codes
Income in Sandy
Income Overview in Sandy
Per Capita Income in Sandy is $47,480, while median incomes of families and households are $118,774 and $108,165 respectively.
| Characteristic | Number | Measure |
| Per Capita Income | 95,635 | $47,480 |
| Median Family Income | 24,742 | $118,774 |
| Mean Family Income | 24,742 | $148,026 |
| Median Household Income | 32,747 | $108,165 |
| Mean Household Income | 32,747 | $134,942 |
| Income Deficit | 24,742 | $11,411 |
| Wage / Income Gap (%) | 95,635 | 39.09% |
| Wage / Income Gap ($) | 95,635 | 60.91¢ per $1 |
| Gini / Inequality Index | 95,635 | 0.40 |
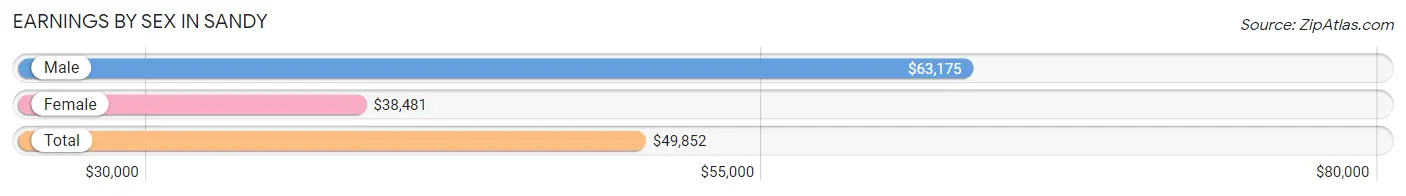
Earnings by Sex in Sandy
Average Earnings in Sandy are $49,852, $63,175 for men and $38,481 for women, a difference of 39.1%.
| Sex | Number | Average Earnings |
| Male | 29,469 (54.6%) | $63,175 |
| Female | 24,517 (45.4%) | $38,481 |
| Total | 53,986 (100.0%) | $49,852 |
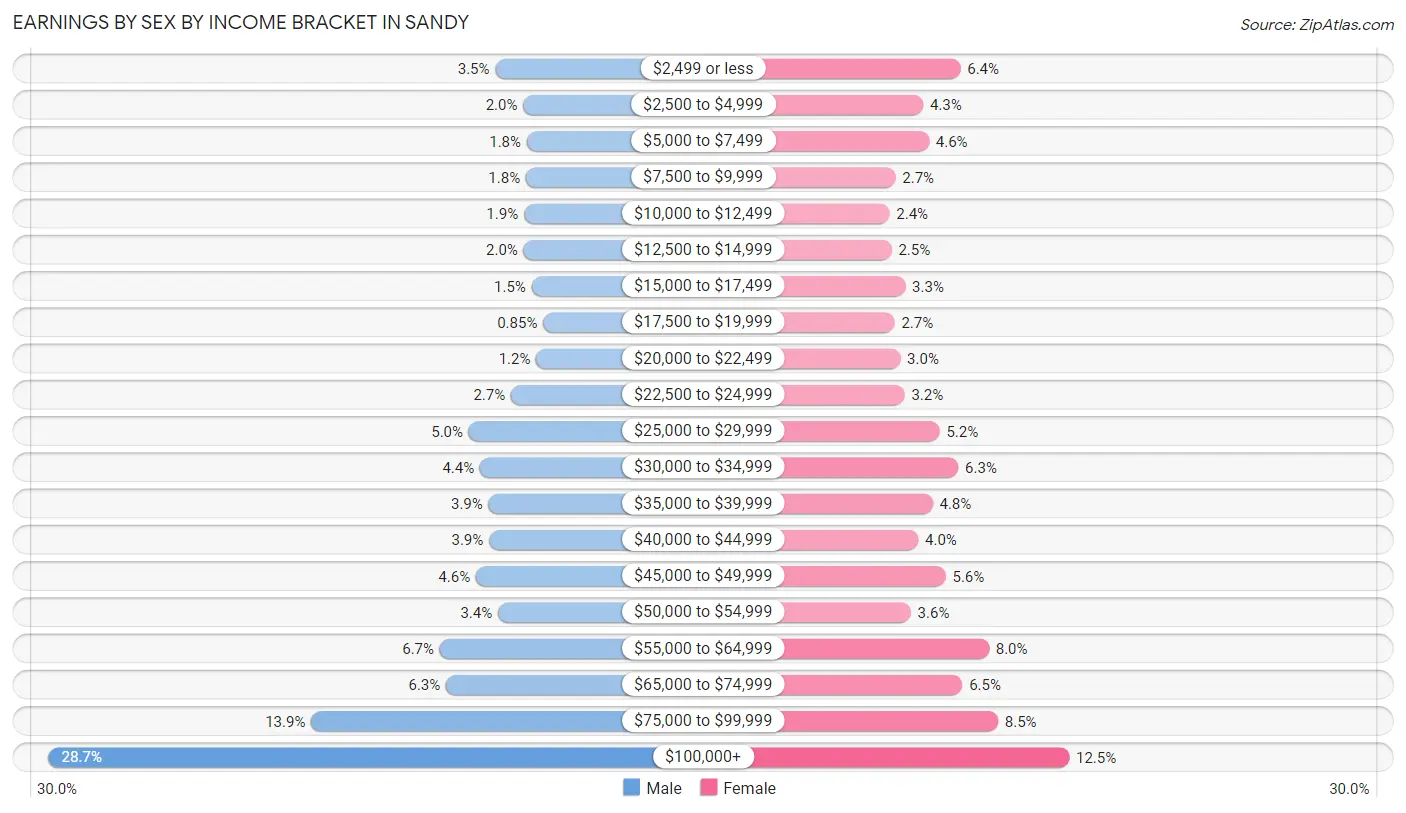
Earnings by Sex by Income Bracket in Sandy
The most common earnings brackets in Sandy are $100,000+ for men (8,443 | 28.6%) and $100,000+ for women (3,061 | 12.5%).
| Income | Male | Female |
| $2,499 or less | 1,042 (3.5%) | 1,564 (6.4%) |
| $2,500 to $4,999 | 582 (2.0%) | 1,050 (4.3%) |
| $5,000 to $7,499 | 522 (1.8%) | 1,130 (4.6%) |
| $7,500 to $9,999 | 536 (1.8%) | 670 (2.7%) |
| $10,000 to $12,499 | 569 (1.9%) | 587 (2.4%) |
| $12,500 to $14,999 | 576 (1.9%) | 615 (2.5%) |
| $15,000 to $17,499 | 442 (1.5%) | 805 (3.3%) |
| $17,500 to $19,999 | 250 (0.9%) | 658 (2.7%) |
| $20,000 to $22,499 | 366 (1.2%) | 735 (3.0%) |
| $22,500 to $24,999 | 784 (2.7%) | 795 (3.2%) |
| $25,000 to $29,999 | 1,483 (5.0%) | 1,278 (5.2%) |
| $30,000 to $34,999 | 1,298 (4.4%) | 1,534 (6.3%) |
| $35,000 to $39,999 | 1,154 (3.9%) | 1,182 (4.8%) |
| $40,000 to $44,999 | 1,145 (3.9%) | 983 (4.0%) |
| $45,000 to $49,999 | 1,365 (4.6%) | 1,361 (5.6%) |
| $50,000 to $54,999 | 998 (3.4%) | 881 (3.6%) |
| $55,000 to $64,999 | 1,962 (6.7%) | 1,956 (8.0%) |
| $65,000 to $74,999 | 1,859 (6.3%) | 1,590 (6.5%) |
| $75,000 to $99,999 | 4,093 (13.9%) | 2,082 (8.5%) |
| $100,000+ | 8,443 (28.6%) | 3,061 (12.5%) |
| Total | 29,469 (100.0%) | 24,517 (100.0%) |
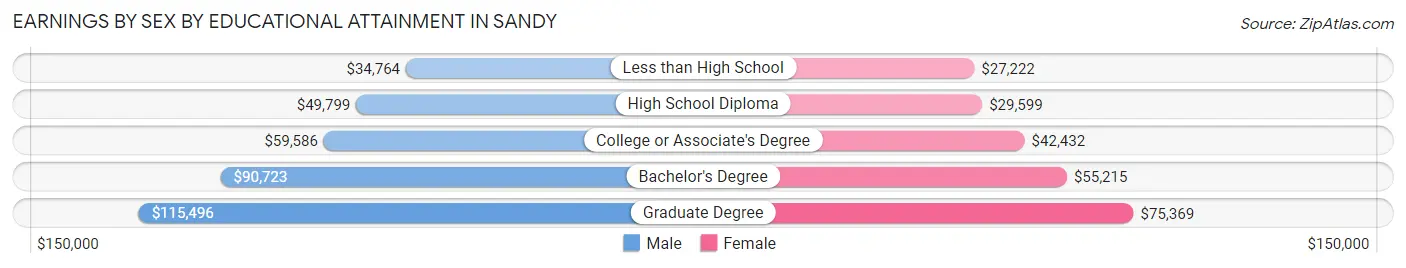
Earnings by Sex by Educational Attainment in Sandy
Average earnings in Sandy are $73,421 for men and $46,474 for women, a difference of 36.7%. Men with an educational attainment of graduate degree enjoy the highest average annual earnings of $115,496, while those with less than high school education earn the least with $34,764. Women with an educational attainment of graduate degree earn the most with the average annual earnings of $75,369, while those with less than high school education have the smallest earnings of $27,222.
| Educational Attainment | Male Income | Female Income |
| Less than High School | $34,764 | $27,222 |
| High School Diploma | $49,799 | $29,599 |
| College or Associate's Degree | $59,586 | $42,432 |
| Bachelor's Degree | $90,723 | $55,215 |
| Graduate Degree | $115,496 | $75,369 |
| Total | $73,421 | $46,474 |
Family Income in Sandy
Family Income Brackets in Sandy
According to the Sandy family income data, there are 6,235 families falling into the $100,000 to $149,999 income range, which is the most common income bracket and makes up 25.2% of all families. Conversely, the $10,000 to $14,999 income bracket is the least frequent group with only 247 families (1.0%) belonging to this category.
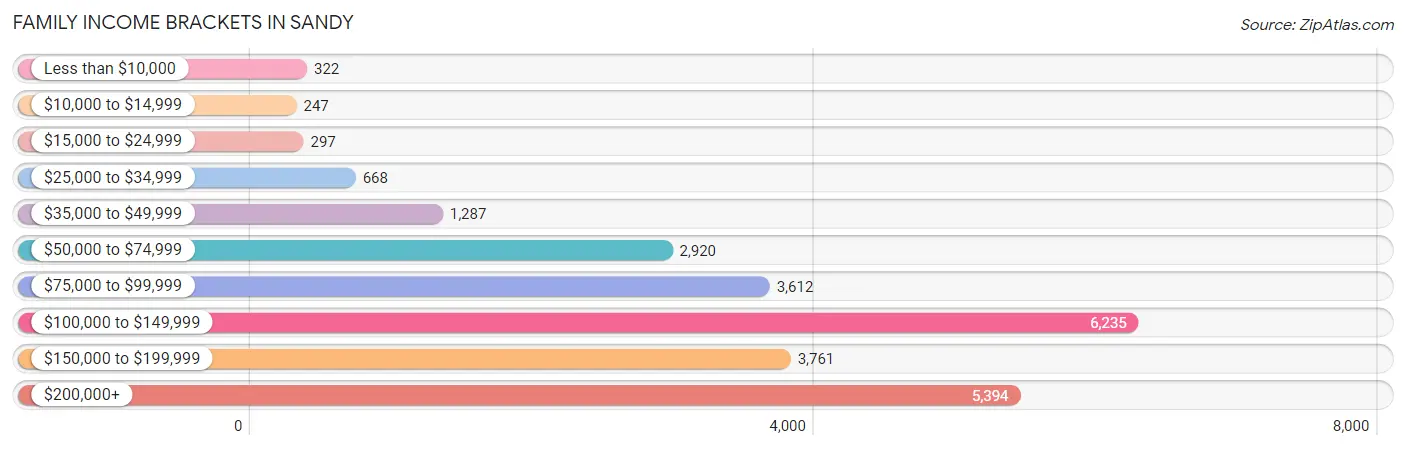
| Income Bracket | # Families | % Families |
| Less than $10,000 | 322 | 1.3% |
| $10,000 to $14,999 | 247 | 1.0% |
| $15,000 to $24,999 | 297 | 1.2% |
| $25,000 to $34,999 | 668 | 2.7% |
| $35,000 to $49,999 | 1,287 | 5.2% |
| $50,000 to $74,999 | 2,920 | 11.8% |
| $75,000 to $99,999 | 3,612 | 14.6% |
| $100,000 to $149,999 | 6,235 | 25.2% |
| $150,000 to $199,999 | 3,761 | 15.2% |
| $200,000+ | 5,394 | 21.8% |
Family Income by Famaliy Size in Sandy
6-person families (1,268 | 5.1%) account for the highest median family income in Sandy with $141,808 per family, while 2-person families (10,333 | 41.8%) have the highest median income of $51,815 per family member.
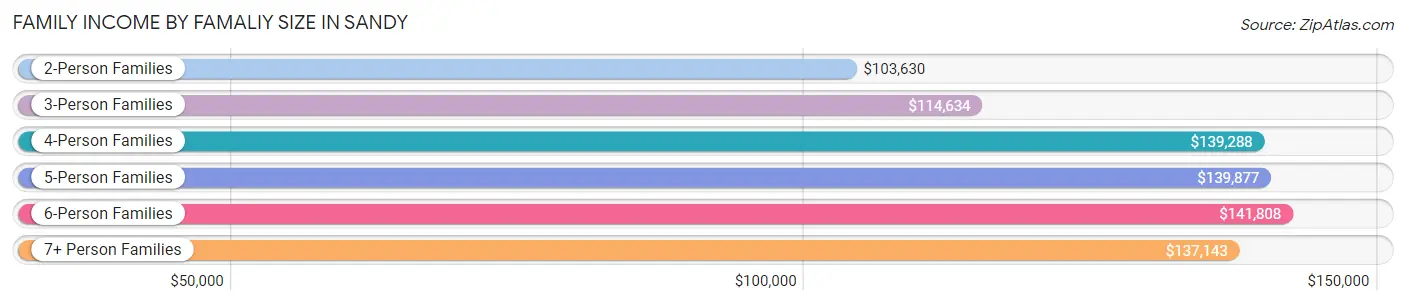
| Income Bracket | # Families | Median Income |
| 2-Person Families | 10,333 (41.8%) | $103,630 |
| 3-Person Families | 5,403 (21.8%) | $114,634 |
| 4-Person Families | 4,453 (18.0%) | $139,288 |
| 5-Person Families | 2,521 (10.2%) | $139,877 |
| 6-Person Families | 1,268 (5.1%) | $141,808 |
| 7+ Person Families | 764 (3.1%) | $137,143 |
| Total | 24,742 (100.0%) | $118,774 |
Family Income by Number of Earners in Sandy
The median family income in Sandy is $118,774, with families comprising 3+ earners (4,193) having the highest median family income of $171,023, while families with no earners (2,470) have the lowest median family income of $66,029, accounting for 17.0% and 10.0% of families, respectively.
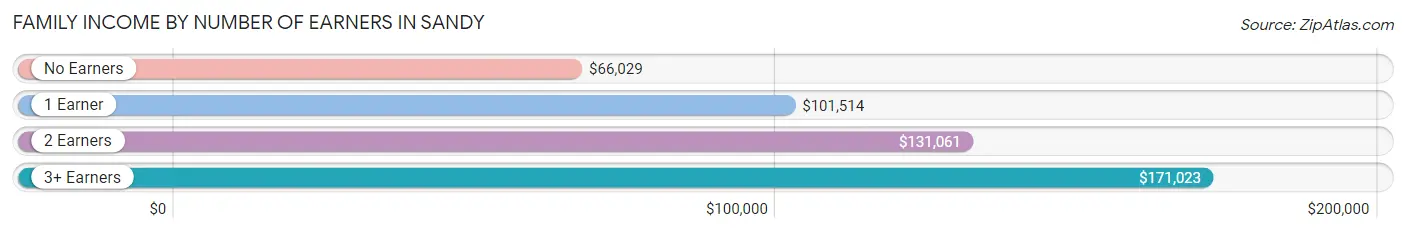
| Number of Earners | # Families | Median Income |
| No Earners | 2,470 (10.0%) | $66,029 |
| 1 Earner | 6,767 (27.4%) | $101,514 |
| 2 Earners | 11,312 (45.7%) | $131,061 |
| 3+ Earners | 4,193 (17.0%) | $171,023 |
| Total | 24,742 (100.0%) | $118,774 |
Household Income in Sandy
Household Income Brackets in Sandy
With 7,139 households falling in the category, the $100,000 to $149,999 income range is the most frequent in Sandy, accounting for 21.8% of all households. In contrast, only 393 households (1.2%) fall into the $10,000 to $14,999 income bracket, making it the least populous group.
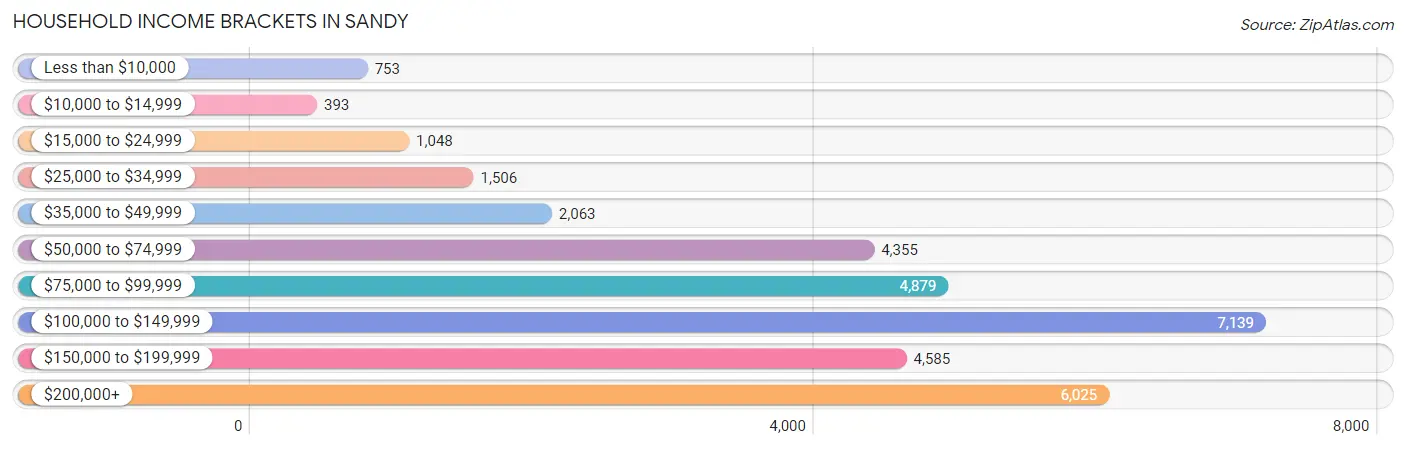
| Income Bracket | # Households | % Households |
| Less than $10,000 | 753 | 2.3% |
| $10,000 to $14,999 | 393 | 1.2% |
| $15,000 to $24,999 | 1,048 | 3.2% |
| $25,000 to $34,999 | 1,506 | 4.6% |
| $35,000 to $49,999 | 2,063 | 6.3% |
| $50,000 to $74,999 | 4,355 | 13.3% |
| $75,000 to $99,999 | 4,879 | 14.9% |
| $100,000 to $149,999 | 7,139 | 21.8% |
| $150,000 to $199,999 | 4,585 | 14.0% |
| $200,000+ | 6,025 | 18.4% |
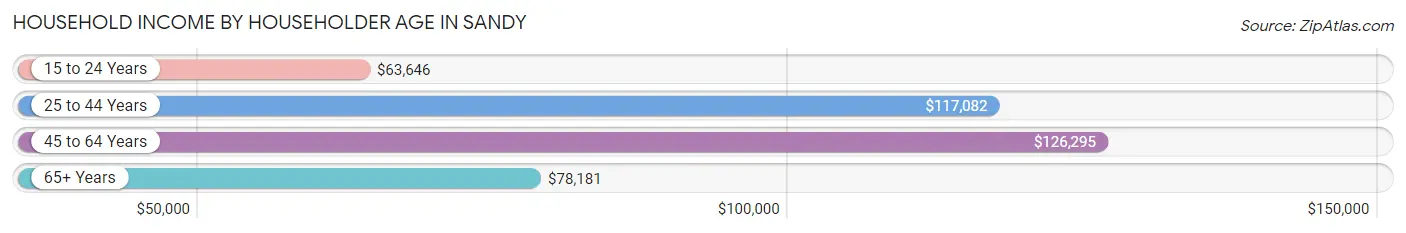
Household Income by Householder Age in Sandy
The median household income in Sandy is $108,165, with the highest median household income of $126,295 found in the 45 to 64 years age bracket for the primary householder. A total of 12,154 households (37.1%) fall into this category. Meanwhile, the 15 to 24 years age bracket for the primary householder has the lowest median household income of $63,646, with 898 households (2.7%) in this group.
| Income Bracket | # Households | Median Income |
| 15 to 24 Years | 898 (2.7%) | $63,646 |
| 25 to 44 Years | 11,104 (33.9%) | $117,082 |
| 45 to 64 Years | 12,154 (37.1%) | $126,295 |
| 65+ Years | 8,591 (26.2%) | $78,181 |
| Total | 32,747 (100.0%) | $108,165 |
Poverty in Sandy
Income Below Poverty by Sex and Age in Sandy
With 3.9% poverty level for males and 5.2% for females among the residents of Sandy, 15 year old males and 25 to 34 year old females are the most vulnerable to poverty, with 90 males (10.0%) and 548 females (8.6%) in their respective age groups living below the poverty level.
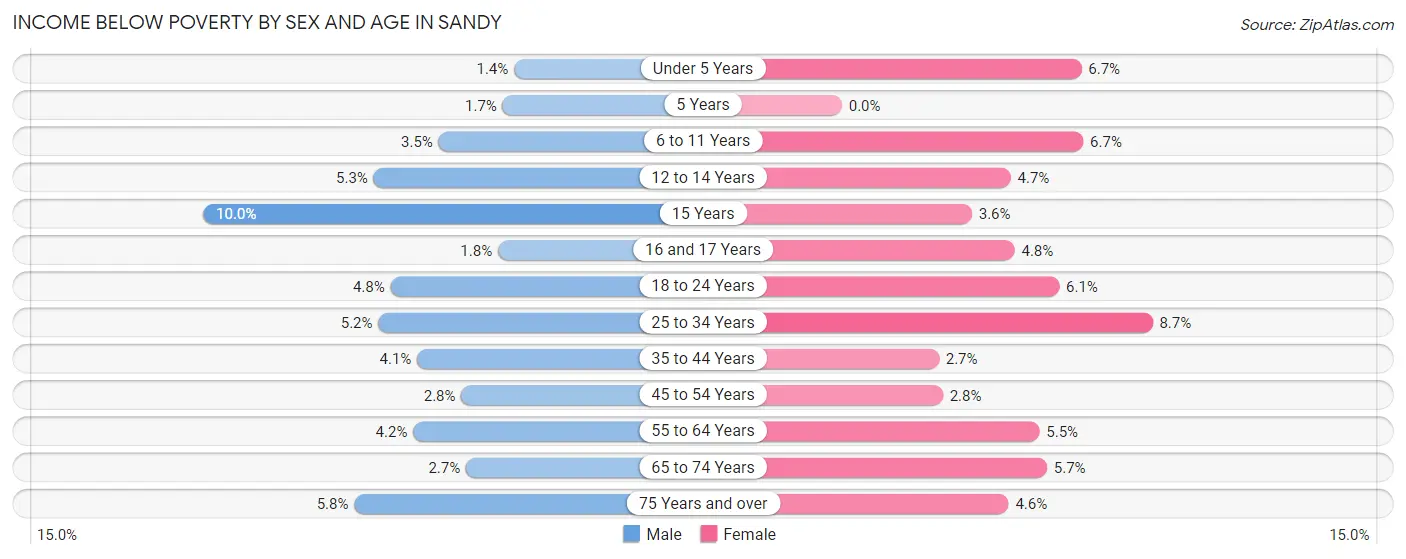
| Age Bracket | Male | Female |
| Under 5 Years | 48 (1.4%) | 169 (6.7%) |
| 5 Years | 13 (1.7%) | 0 (0.0%) |
| 6 to 11 Years | 155 (3.5%) | 262 (6.7%) |
| 12 to 14 Years | 128 (5.3%) | 89 (4.7%) |
| 15 Years | 90 (10.0%) | 29 (3.6%) |
| 16 and 17 Years | 24 (1.8%) | 73 (4.8%) |
| 18 to 24 Years | 186 (4.8%) | 205 (6.0%) |
| 25 to 34 Years | 341 (5.1%) | 548 (8.6%) |
| 35 to 44 Years | 283 (4.1%) | 177 (2.7%) |
| 45 to 54 Years | 157 (2.8%) | 166 (2.8%) |
| 55 to 64 Years | 232 (4.2%) | 333 (5.5%) |
| 65 to 74 Years | 114 (2.7%) | 271 (5.7%) |
| 75 Years and over | 133 (5.8%) | 128 (4.6%) |
| Total | 1,904 (3.9%) | 2,450 (5.2%) |
Income Above Poverty by Sex and Age in Sandy
According to the poverty statistics in Sandy, males aged under 5 years and females aged 5 years are the age groups that are most secure financially, with 98.6% of males and 100.0% of females in these age groups living above the poverty line.
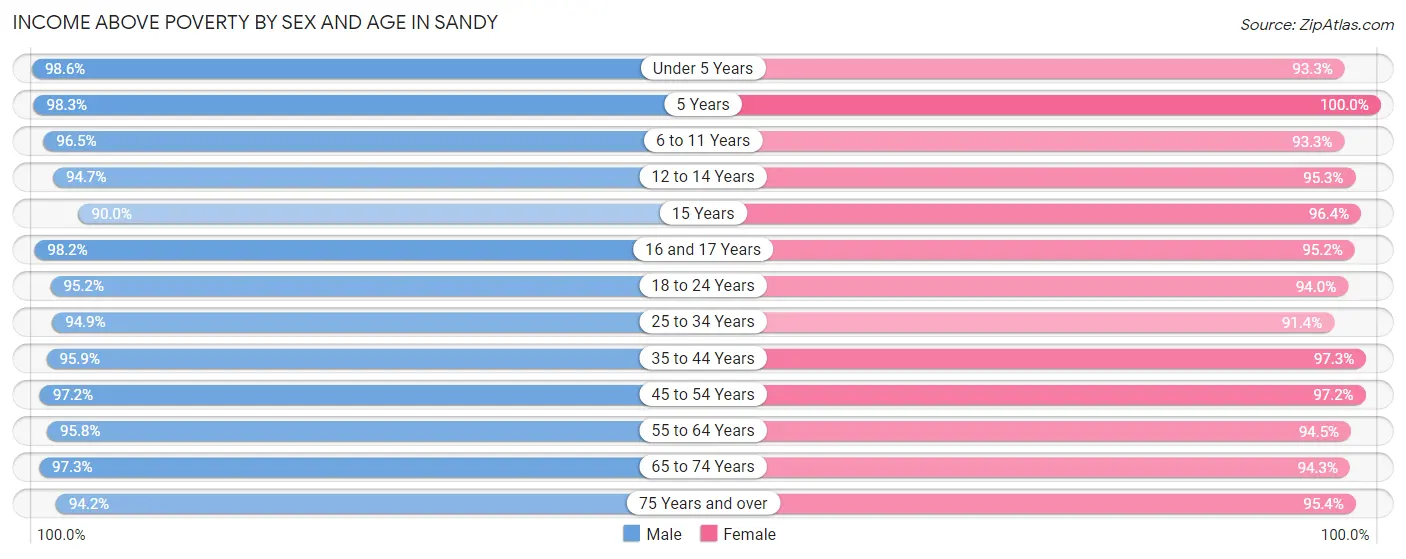
| Age Bracket | Male | Female |
| Under 5 Years | 3,456 (98.6%) | 2,366 (93.3%) |
| 5 Years | 758 (98.3%) | 476 (100.0%) |
| 6 to 11 Years | 4,308 (96.5%) | 3,634 (93.3%) |
| 12 to 14 Years | 2,296 (94.7%) | 1,804 (95.3%) |
| 15 Years | 807 (90.0%) | 773 (96.4%) |
| 16 and 17 Years | 1,297 (98.2%) | 1,444 (95.2%) |
| 18 to 24 Years | 3,678 (95.2%) | 3,185 (94.0%) |
| 25 to 34 Years | 6,284 (94.9%) | 5,789 (91.3%) |
| 35 to 44 Years | 6,666 (95.9%) | 6,373 (97.3%) |
| 45 to 54 Years | 5,379 (97.2%) | 5,750 (97.2%) |
| 55 to 64 Years | 5,315 (95.8%) | 5,724 (94.5%) |
| 65 to 74 Years | 4,088 (97.3%) | 4,475 (94.3%) |
| 75 Years and over | 2,154 (94.2%) | 2,628 (95.4%) |
| Total | 46,486 (96.1%) | 44,421 (94.8%) |
Income Below Poverty Among Married-Couple Families in Sandy
The poverty statistics for married-couple families in Sandy show that 1.9% or 378 of the total 20,358 families live below the poverty line. Families with 5 or more children have the highest poverty rate of 6.7%, comprising of 22 families. On the other hand, families with 1 or 2 children have the lowest poverty rate of 1.0%, which includes 67 families.
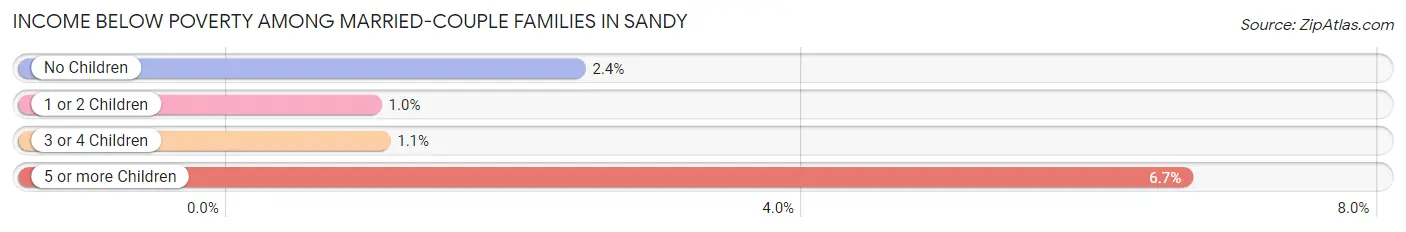
| Children | Above Poverty | Below Poverty |
| No Children | 10,598 (97.6%) | 263 (2.4%) |
| 1 or 2 Children | 6,656 (99.0%) | 67 (1.0%) |
| 3 or 4 Children | 2,417 (98.9%) | 26 (1.1%) |
| 5 or more Children | 309 (93.3%) | 22 (6.7%) |
| Total | 19,980 (98.1%) | 378 (1.9%) |
Income Below Poverty Among Single-Parent Households in Sandy
According to the poverty data in Sandy, 12.0% or 151 single-father households and 10.0% or 311 single-mother households are living below the poverty line. Among single-father households, those with 3 or 4 children have the highest poverty rate, with 64 households (73.6%) experiencing poverty. Likewise, among single-mother households, those with 5 or more children have the highest poverty rate, with 23 households (57.5%) falling below the poverty line.
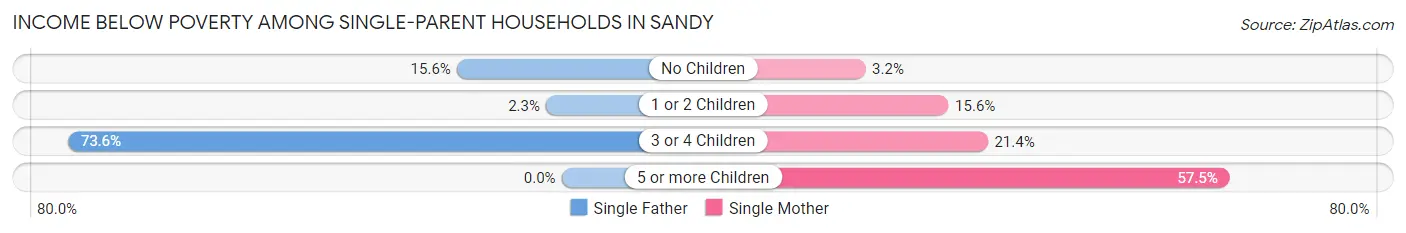
| Children | Single Father | Single Mother |
| No Children | 70 (15.6%) | 52 (3.2%) |
| 1 or 2 Children | 17 (2.3%) | 203 (15.6%) |
| 3 or 4 Children | 64 (73.6%) | 33 (21.4%) |
| 5 or more Children | 0 (0.0%) | 23 (57.5%) |
| Total | 151 (12.0%) | 311 (10.0%) |
Income Below Poverty Among Married-Couple vs Single-Parent Households in Sandy
The poverty data for Sandy shows that 378 of the married-couple family households (1.9%) and 462 of the single-parent households (10.5%) are living below the poverty level. Within the married-couple family households, those with 5 or more children have the highest poverty rate, with 22 households (6.7%) falling below the poverty line. Among the single-parent households, those with 5 or more children have the highest poverty rate, with 23 household (57.5%) living below poverty.
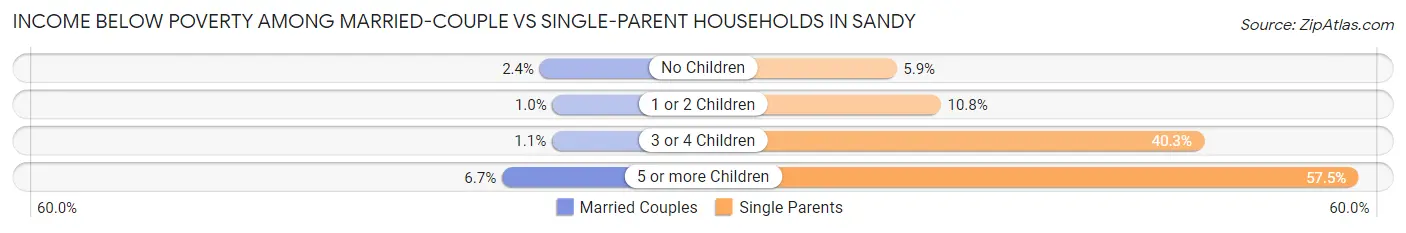
| Children | Married-Couple Families | Single-Parent Households |
| No Children | 263 (2.4%) | 122 (5.9%) |
| 1 or 2 Children | 67 (1.0%) | 220 (10.8%) |
| 3 or 4 Children | 26 (1.1%) | 97 (40.3%) |
| 5 or more Children | 22 (6.7%) | 23 (57.5%) |
| Total | 378 (1.9%) | 462 (10.5%) |
Race in Sandy
The most populous races in Sandy are White / Caucasian (80,161 | 83.8%), Hispanic or Latino (9,944 | 10.4%), and Two or more Races (5,780 | 6.0%).
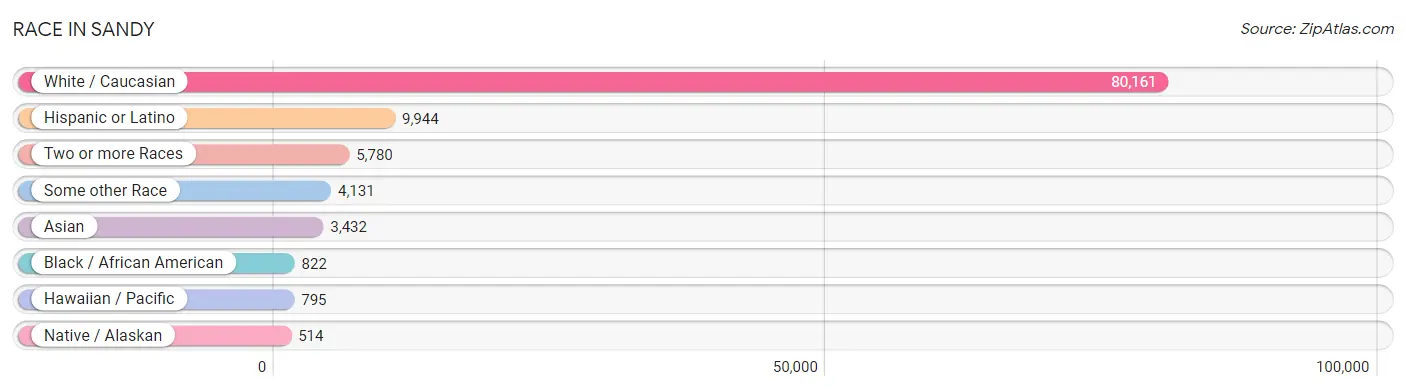
| Race | # Population | % Population |
| Asian | 3,432 | 3.6% |
| Black / African American | 822 | 0.9% |
| Hawaiian / Pacific | 795 | 0.8% |
| Hispanic or Latino | 9,944 | 10.4% |
| Native / Alaskan | 514 | 0.5% |
| White / Caucasian | 80,161 | 83.8% |
| Two or more Races | 5,780 | 6.0% |
| Some other Race | 4,131 | 4.3% |
| Total | 95,635 | 100.0% |
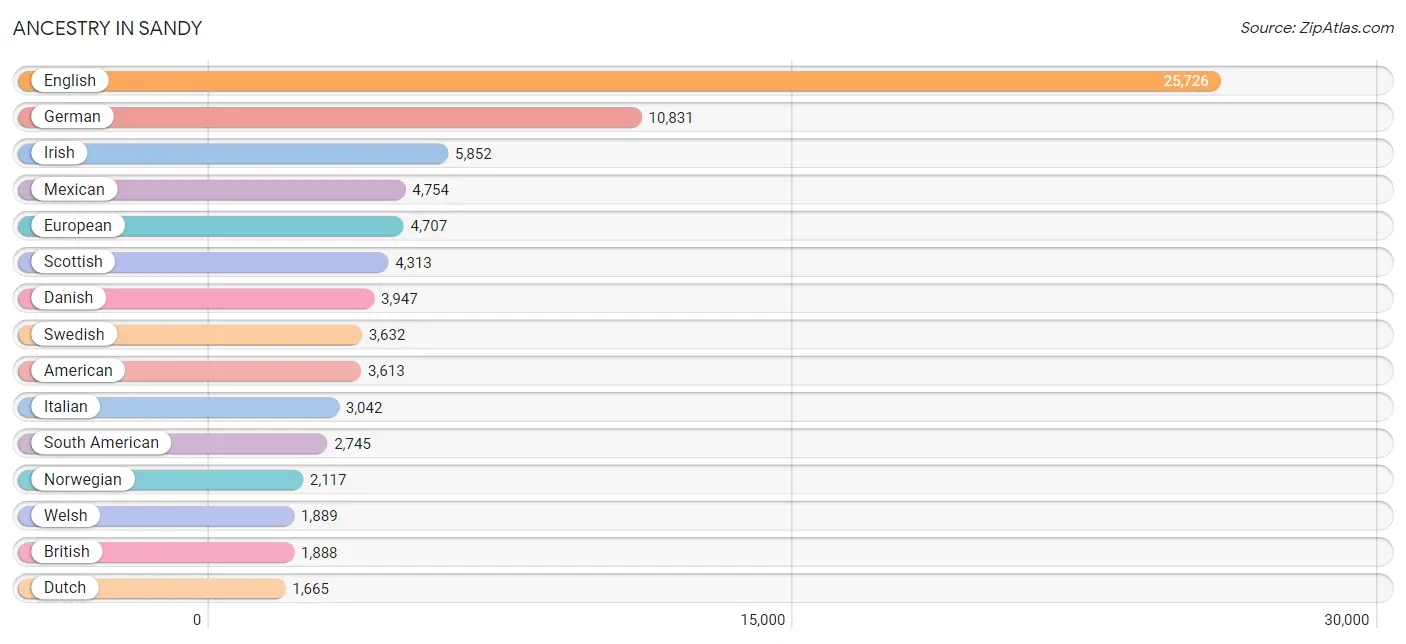
Ancestry in Sandy
The most populous ancestries reported in Sandy are English (25,726 | 26.9%), German (10,831 | 11.3%), Irish (5,852 | 6.1%), Mexican (4,754 | 5.0%), and European (4,707 | 4.9%), together accounting for 54.2% of all Sandy residents.
| Ancestry | # Population | % Population |
| African | 34 | 0.0% |
| American | 3,613 | 3.8% |
| Apache | 96 | 0.1% |
| Arab | 415 | 0.4% |
| Argentinean | 312 | 0.3% |
| Armenian | 682 | 0.7% |
| Australian | 216 | 0.2% |
| Austrian | 362 | 0.4% |
| Basque | 66 | 0.1% |
| Belgian | 31 | 0.0% |
| Bhutanese | 505 | 0.5% |
| Bolivian | 18 | 0.0% |
| Brazilian | 369 | 0.4% |
| British | 1,888 | 2.0% |
| Bulgarian | 9 | 0.0% |
| Burmese | 575 | 0.6% |
| Cambodian | 22 | 0.0% |
| Canadian | 341 | 0.4% |
| Central American | 317 | 0.3% |
| Central American Indian | 76 | 0.1% |
| Cherokee | 40 | 0.0% |
| Chickasaw | 16 | 0.0% |
| Chilean | 90 | 0.1% |
| Chippewa | 34 | 0.0% |
| Choctaw | 151 | 0.2% |
| Colombian | 309 | 0.3% |
| Costa Rican | 23 | 0.0% |
| Creek | 45 | 0.1% |
| Croatian | 98 | 0.1% |
| Cuban | 122 | 0.1% |
| Cypriot | 9 | 0.0% |
| Czech | 171 | 0.2% |
| Czechoslovakian | 103 | 0.1% |
| Danish | 3,947 | 4.1% |
| Dutch | 1,665 | 1.7% |
| Eastern European | 583 | 0.6% |
| Ecuadorian | 195 | 0.2% |
| Egyptian | 30 | 0.0% |
| English | 25,726 | 26.9% |
| European | 4,707 | 4.9% |
| Fijian | 17 | 0.0% |
| Filipino | 41 | 0.0% |
| Finnish | 81 | 0.1% |
| French | 1,530 | 1.6% |
| French Canadian | 206 | 0.2% |
| German | 10,831 | 11.3% |
| Greek | 602 | 0.6% |
| Guamanian / Chamorro | 9 | 0.0% |
| Guatemalan | 93 | 0.1% |
| Honduran | 71 | 0.1% |
| Hungarian | 180 | 0.2% |
| Icelander | 33 | 0.0% |
| Indian (Asian) | 1,642 | 1.7% |
| Iranian | 632 | 0.7% |
| Iraqi | 146 | 0.2% |
| Irish | 5,852 | 6.1% |
| Italian | 3,042 | 3.2% |
| Jamaican | 6 | 0.0% |
| Korean | 675 | 0.7% |
| Laotian | 21 | 0.0% |
| Latvian | 26 | 0.0% |
| Lebanese | 112 | 0.1% |
| Lithuanian | 77 | 0.1% |
| Malaysian | 167 | 0.2% |
| Mexican | 4,754 | 5.0% |
| Mexican American Indian | 133 | 0.1% |
| Moroccan | 14 | 0.0% |
| Native Hawaiian | 304 | 0.3% |
| Navajo | 376 | 0.4% |
| Nicaraguan | 19 | 0.0% |
| Nigerian | 126 | 0.1% |
| Northern European | 657 | 0.7% |
| Norwegian | 2,117 | 2.2% |
| Paiute | 11 | 0.0% |
| Pakistani | 201 | 0.2% |
| Palestinian | 21 | 0.0% |
| Panamanian | 46 | 0.1% |
| Paraguayan | 283 | 0.3% |
| Pennsylvania German | 14 | 0.0% |
| Peruvian | 248 | 0.3% |
| Polish | 1,044 | 1.1% |
| Portuguese | 169 | 0.2% |
| Puerto Rican | 300 | 0.3% |
| Romanian | 344 | 0.4% |
| Russian | 653 | 0.7% |
| Salvadoran | 65 | 0.1% |
| Samoan | 299 | 0.3% |
| Scandinavian | 1,455 | 1.5% |
| Scotch-Irish | 700 | 0.7% |
| Scottish | 4,313 | 4.5% |
| Serbian | 45 | 0.1% |
| Sierra Leonean | 30 | 0.0% |
| Sioux | 26 | 0.0% |
| Slavic | 15 | 0.0% |
| Slovak | 69 | 0.1% |
| Slovene | 34 | 0.0% |
| South African | 89 | 0.1% |
| South American | 2,745 | 2.9% |
| South American Indian | 78 | 0.1% |
| Spaniard | 429 | 0.4% |
| Spanish | 804 | 0.8% |
| Sri Lankan | 290 | 0.3% |
| Subsaharan African | 450 | 0.5% |
| Swedish | 3,632 | 3.8% |
| Swiss | 950 | 1.0% |
| Syrian | 15 | 0.0% |
| Thai | 686 | 0.7% |
| Tongan | 480 | 0.5% |
| Ukrainian | 175 | 0.2% |
| Uruguayan | 16 | 0.0% |
| Venezuelan | 1,274 | 1.3% |
| Welsh | 1,889 | 2.0% |
| Yugoslavian | 163 | 0.2% |
| Zimbabwean | 57 | 0.1% | View All 114 Rows |
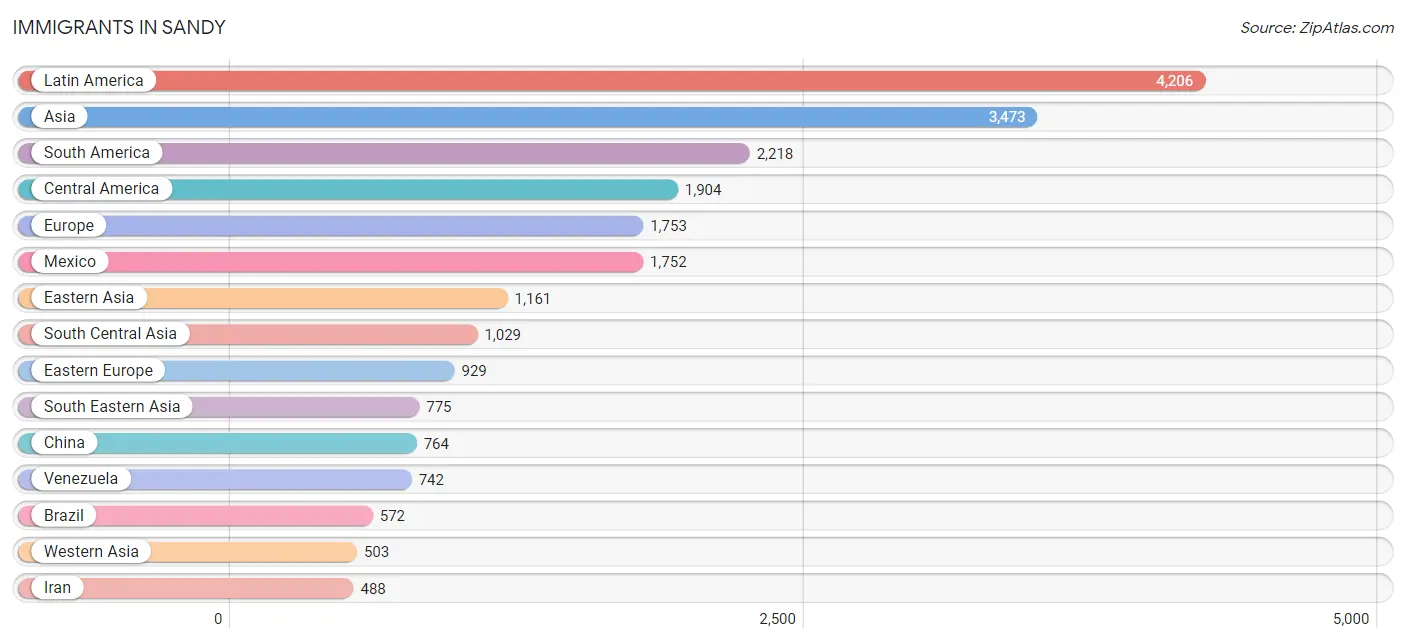
Immigrants in Sandy
The most numerous immigrant groups reported in Sandy came from Latin America (4,206 | 4.4%), Asia (3,473 | 3.6%), South America (2,218 | 2.3%), Central America (1,904 | 2.0%), and Europe (1,753 | 1.8%), together accounting for 14.2% of all Sandy residents.
| Immigration Origin | # Population | % Population |
| Africa | 213 | 0.2% |
| Argentina | 234 | 0.2% |
| Armenia | 69 | 0.1% |
| Asia | 3,473 | 3.6% |
| Australia | 110 | 0.1% |
| Austria | 12 | 0.0% |
| Belgium | 9 | 0.0% |
| Bolivia | 3 | 0.0% |
| Bosnia and Herzegovina | 42 | 0.0% |
| Brazil | 572 | 0.6% |
| Bulgaria | 9 | 0.0% |
| Canada | 272 | 0.3% |
| Caribbean | 84 | 0.1% |
| Central America | 1,904 | 2.0% |
| Chile | 114 | 0.1% |
| China | 764 | 0.8% |
| Colombia | 279 | 0.3% |
| Costa Rica | 8 | 0.0% |
| Cuba | 31 | 0.0% |
| Czechoslovakia | 40 | 0.0% |
| Denmark | 20 | 0.0% |
| Eastern Africa | 74 | 0.1% |
| Eastern Asia | 1,161 | 1.2% |
| Eastern Europe | 929 | 1.0% |
| Egypt | 14 | 0.0% |
| El Salvador | 34 | 0.0% |
| England | 122 | 0.1% |
| Europe | 1,753 | 1.8% |
| France | 16 | 0.0% |
| Germany | 288 | 0.3% |
| Greece | 7 | 0.0% |
| Guatemala | 40 | 0.0% |
| Haiti | 53 | 0.1% |
| Honduras | 44 | 0.1% |
| Hong Kong | 77 | 0.1% |
| India | 462 | 0.5% |
| Iran | 488 | 0.5% |
| Iraq | 176 | 0.2% |
| Israel | 14 | 0.0% |
| Italy | 8 | 0.0% |
| Japan | 82 | 0.1% |
| Korea | 300 | 0.3% |
| Kuwait | 6 | 0.0% |
| Laos | 75 | 0.1% |
| Latin America | 4,206 | 4.4% |
| Lebanon | 48 | 0.1% |
| Lithuania | 8 | 0.0% |
| Malaysia | 56 | 0.1% |
| Mexico | 1,752 | 1.8% |
| Moldova | 146 | 0.2% |
| Morocco | 16 | 0.0% |
| Nepal | 33 | 0.0% |
| Netherlands | 110 | 0.1% |
| Nicaragua | 9 | 0.0% |
| Nigeria | 27 | 0.0% |
| Northern Africa | 30 | 0.0% |
| Northern Europe | 330 | 0.4% |
| Norway | 22 | 0.0% |
| Oceania | 164 | 0.2% |
| Pakistan | 27 | 0.0% |
| Panama | 17 | 0.0% |
| Peru | 198 | 0.2% |
| Philippines | 216 | 0.2% |
| Poland | 88 | 0.1% |
| Romania | 39 | 0.0% |
| Russia | 207 | 0.2% |
| Saudi Arabia | 16 | 0.0% |
| Scotland | 21 | 0.0% |
| Serbia | 20 | 0.0% |
| South Africa | 75 | 0.1% |
| South America | 2,218 | 2.3% |
| South Central Asia | 1,029 | 1.1% |
| South Eastern Asia | 775 | 0.8% |
| Southern Europe | 27 | 0.0% |
| Spain | 12 | 0.0% |
| Sweden | 7 | 0.0% |
| Switzerland | 32 | 0.0% |
| Syria | 53 | 0.1% |
| Taiwan | 41 | 0.0% |
| Thailand | 92 | 0.1% |
| Ukraine | 70 | 0.1% |
| Uzbekistan | 19 | 0.0% |
| Venezuela | 742 | 0.8% |
| Vietnam | 336 | 0.4% |
| Western Africa | 27 | 0.0% |
| Western Asia | 503 | 0.5% |
| Western Europe | 467 | 0.5% |
| Yemen | 8 | 0.0% |
| Zimbabwe | 38 | 0.0% | View All 89 Rows |
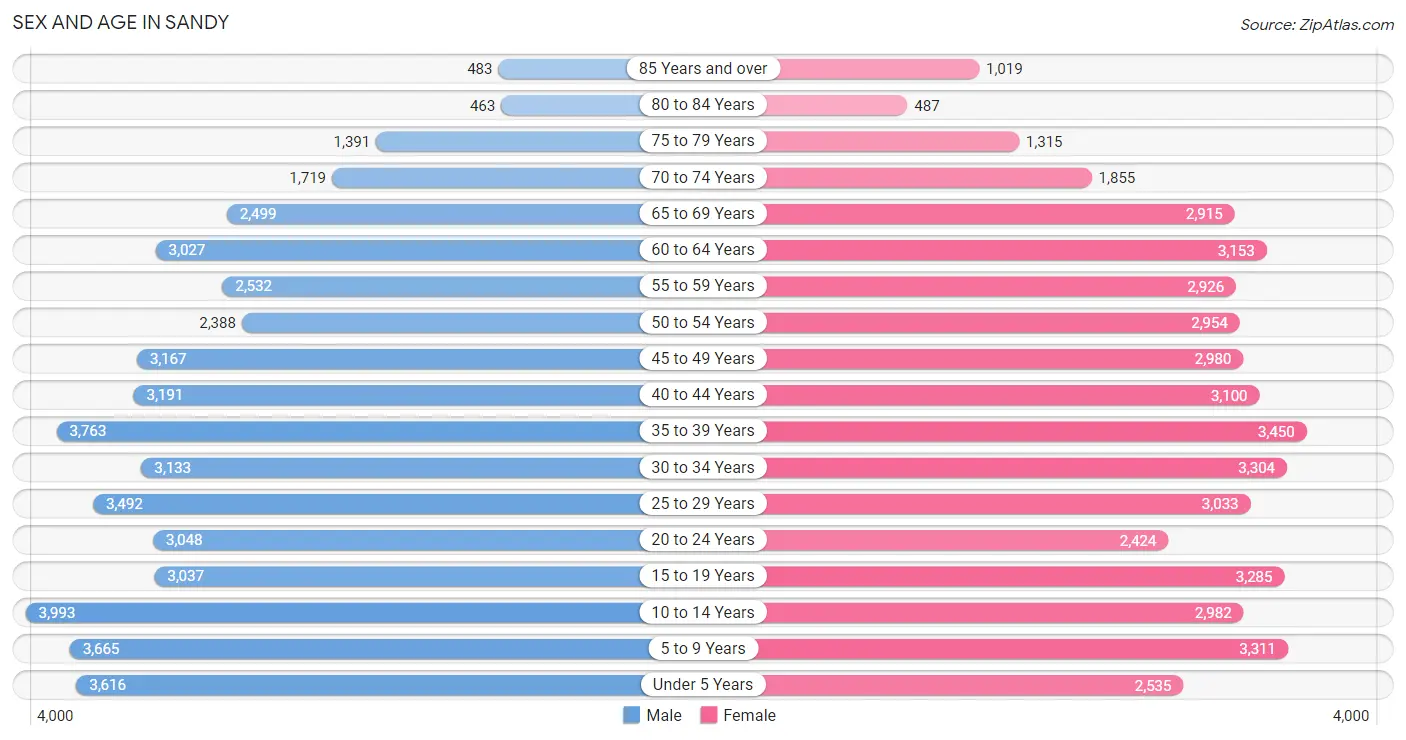
Sex and Age in Sandy
Sex and Age in Sandy
The most populous age groups in Sandy are 10 to 14 Years (3,993 | 8.2%) for men and 35 to 39 Years (3,450 | 7.3%) for women.
| Age Bracket | Male | Female |
| Under 5 Years | 3,616 (7.4%) | 2,535 (5.4%) |
| 5 to 9 Years | 3,665 (7.5%) | 3,311 (7.0%) |
| 10 to 14 Years | 3,993 (8.2%) | 2,982 (6.3%) |
| 15 to 19 Years | 3,037 (6.2%) | 3,285 (7.0%) |
| 20 to 24 Years | 3,048 (6.3%) | 2,424 (5.1%) |
| 25 to 29 Years | 3,492 (7.2%) | 3,033 (6.5%) |
| 30 to 34 Years | 3,133 (6.5%) | 3,304 (7.0%) |
| 35 to 39 Years | 3,763 (7.7%) | 3,450 (7.3%) |
| 40 to 44 Years | 3,191 (6.6%) | 3,100 (6.6%) |
| 45 to 49 Years | 3,167 (6.5%) | 2,980 (6.3%) |
| 50 to 54 Years | 2,388 (4.9%) | 2,954 (6.3%) |
| 55 to 59 Years | 2,532 (5.2%) | 2,926 (6.2%) |
| 60 to 64 Years | 3,027 (6.2%) | 3,153 (6.7%) |
| 65 to 69 Years | 2,499 (5.1%) | 2,915 (6.2%) |
| 70 to 74 Years | 1,719 (3.5%) | 1,855 (3.9%) |
| 75 to 79 Years | 1,391 (2.9%) | 1,315 (2.8%) |
| 80 to 84 Years | 463 (0.9%) | 487 (1.0%) |
| 85 Years and over | 483 (1.0%) | 1,019 (2.2%) |
| Total | 48,607 (100.0%) | 47,028 (100.0%) |
Families and Households in Sandy
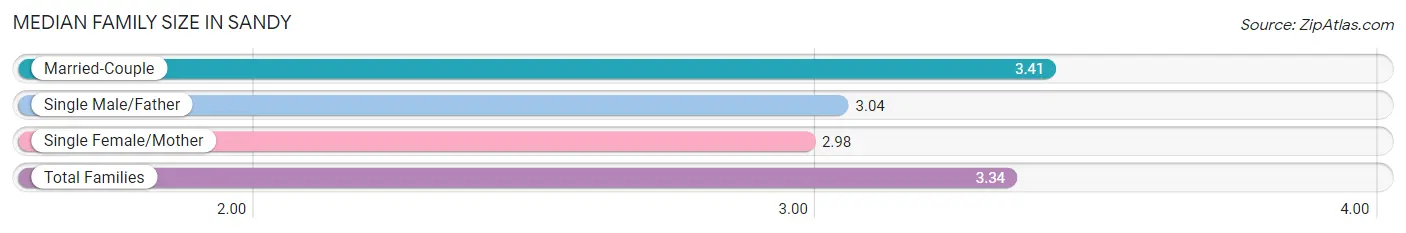
Median Family Size in Sandy
The median family size in Sandy is 3.34 persons per family, with married-couple families (20,358 | 82.3%) accounting for the largest median family size of 3.41 persons per family. On the other hand, single female/mother families (3,121 | 12.6%) represent the smallest median family size with 2.98 persons per family.
| Family Type | # Families | Family Size |
| Married-Couple | 20,358 (82.3%) | 3.41 |
| Single Male/Father | 1,263 (5.1%) | 3.04 |
| Single Female/Mother | 3,121 (12.6%) | 2.98 |
| Total Families | 24,742 (100.0%) | 3.34 |
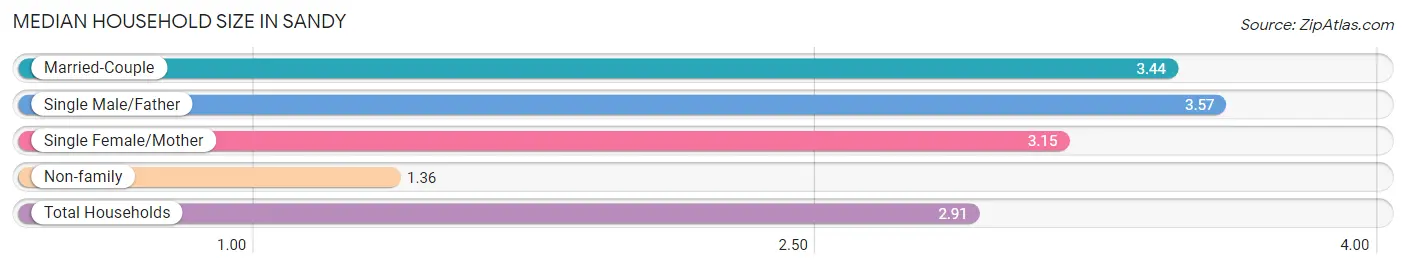
Median Household Size in Sandy
The median household size in Sandy is 2.91 persons per household, with single male/father households (1,263 | 3.9%) accounting for the largest median household size of 3.57 persons per household. non-family households (8,005 | 24.4%) represent the smallest median household size with 1.36 persons per household.
| Household Type | # Households | Household Size |
| Married-Couple | 20,358 (62.2%) | 3.44 |
| Single Male/Father | 1,263 (3.9%) | 3.57 |
| Single Female/Mother | 3,121 (9.5%) | 3.15 |
| Non-family | 8,005 (24.4%) | 1.36 |
| Total Households | 32,747 (100.0%) | 2.91 |
Household Size by Marriage Status in Sandy
Out of a total of 32,747 households in Sandy, 24,742 (75.6%) are family households, while 8,005 (24.4%) are nonfamily households. The most numerous type of family households are 2-person households, comprising 9,770, and the most common type of nonfamily households are 1-person households, comprising 6,008.
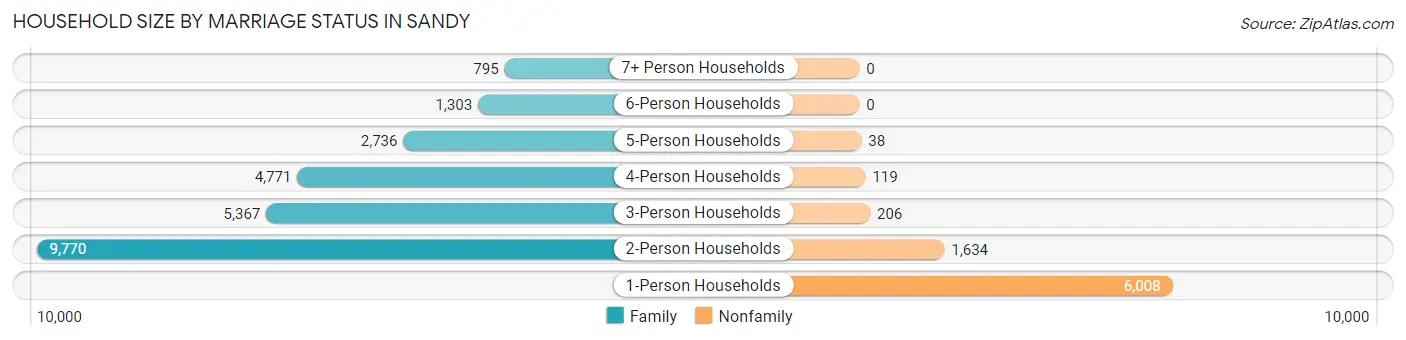
| Household Size | Family Households | Nonfamily Households |
| 1-Person Households | - | 6,008 (18.3%) |
| 2-Person Households | 9,770 (29.8%) | 1,634 (5.0%) |
| 3-Person Households | 5,367 (16.4%) | 206 (0.6%) |
| 4-Person Households | 4,771 (14.6%) | 119 (0.4%) |
| 5-Person Households | 2,736 (8.4%) | 38 (0.1%) |
| 6-Person Households | 1,303 (4.0%) | 0 (0.0%) |
| 7+ Person Households | 795 (2.4%) | 0 (0.0%) |
| Total | 24,742 (75.6%) | 8,005 (24.4%) |
Female Fertility in Sandy
Fertility by Age in Sandy
Average fertility rate in Sandy is 50.0 births per 1,000 women. Women in the age bracket of 20 to 34 years have the highest fertility rate with 84.0 births per 1,000 women. Women in the age bracket of 20 to 34 years acount for 66.5% of all women with births.
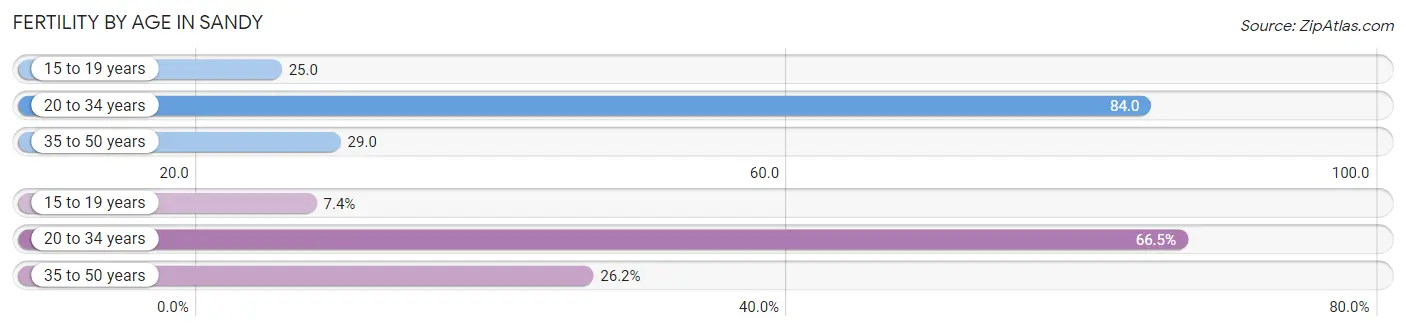
| Age Bracket | Women with Births | Births / 1,000 Women |
| 15 to 19 years | 82 (7.4%) | 25.0 |
| 20 to 34 years | 740 (66.5%) | 84.0 |
| 35 to 50 years | 291 (26.2%) | 29.0 |
| Total | 1,113 (100.0%) | 50.0 |
Fertility by Age by Marriage Status in Sandy
88.2% of women with births (1,113) in Sandy are married. The highest percentage of unmarried women with births falls into 15 to 19 years age bracket with 47.6% of them unmarried at the time of birth, while the lowest percentage of unmarried women with births belong to 35 to 50 years age bracket with 3.4% of them unmarried.
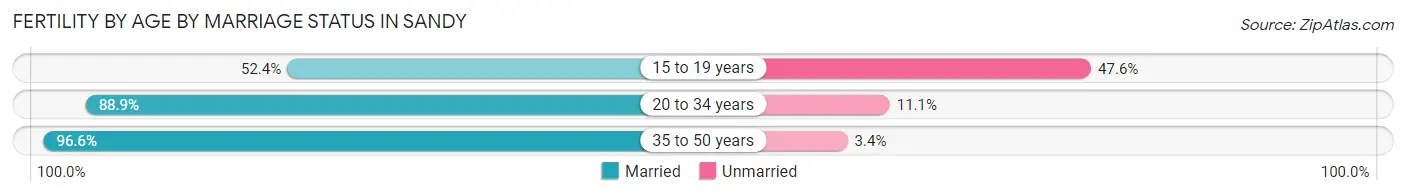
| Age Bracket | Married | Unmarried |
| 15 to 19 years | 43 (52.4%) | 39 (47.6%) |
| 20 to 34 years | 658 (88.9%) | 82 (11.1%) |
| 35 to 50 years | 281 (96.6%) | 10 (3.4%) |
| Total | 982 (88.2%) | 131 (11.8%) |
Fertility by Education in Sandy
Average fertility rate in Sandy is 50.0 births per 1,000 women. Women with the education attainment of graduate degree have the highest fertility rate of 74.0 births per 1,000 women, while women with the education attainment of less than high school have the lowest fertility at 19.0 births per 1,000 women. Women with the education attainment of bachelor's degree represent 32.8% of all women with births.
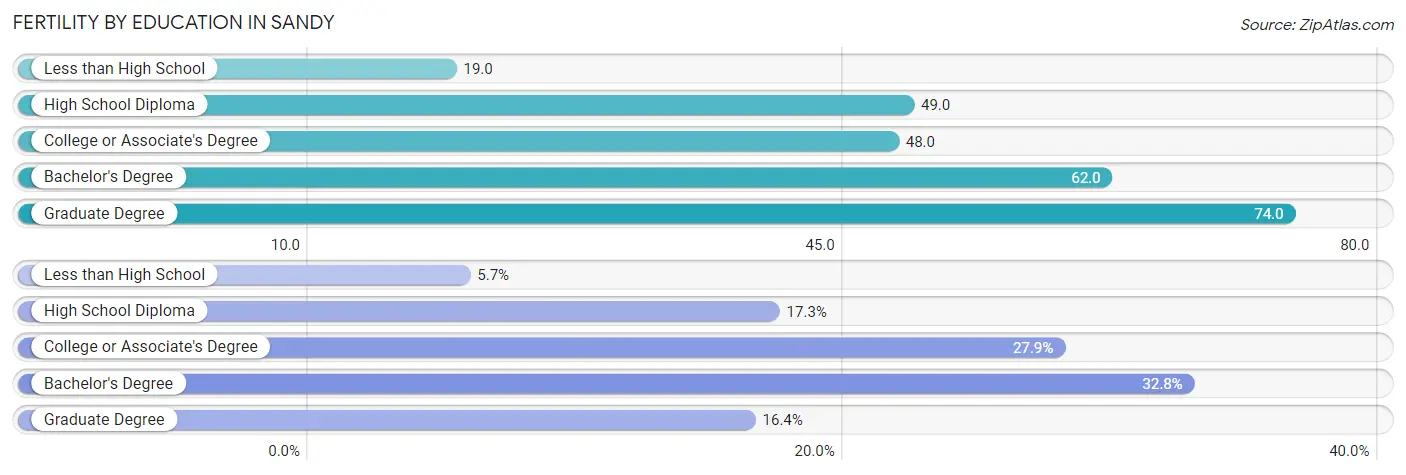
| Educational Attainment | Women with Births | Births / 1,000 Women |
| Less than High School | 63 (5.7%) | 19.0 |
| High School Diploma | 192 (17.2%) | 49.0 |
| College or Associate's Degree | 311 (27.9%) | 48.0 |
| Bachelor's Degree | 365 (32.8%) | 62.0 |
| Graduate Degree | 182 (16.4%) | 74.0 |
| Total | 1,113 (100.0%) | 50.0 |
Fertility by Education by Marriage Status in Sandy
11.8% of women with births in Sandy are unmarried. Women with the educational attainment of graduate degree are most likely to be married with 100.0% of them married at childbirth, while women with the educational attainment of less than high school are least likely to be married with 30.2% of them unmarried at childbirth.
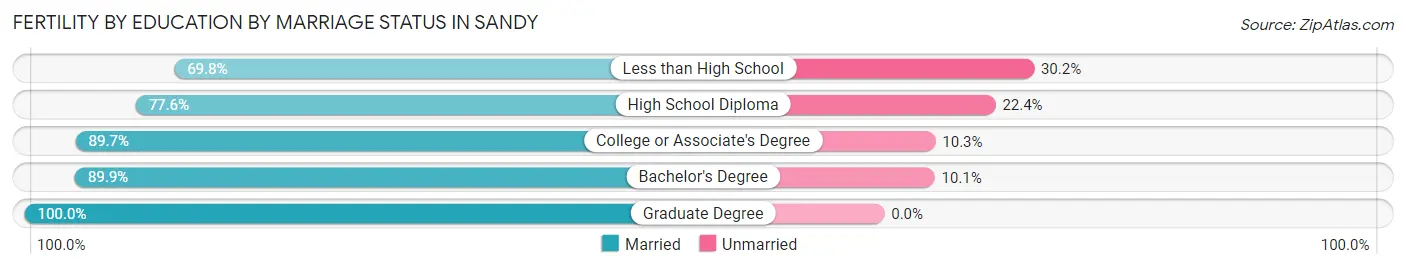
| Educational Attainment | Married | Unmarried |
| Less than High School | 44 (69.8%) | 19 (30.2%) |
| High School Diploma | 149 (77.6%) | 43 (22.4%) |
| College or Associate's Degree | 279 (89.7%) | 32 (10.3%) |
| Bachelor's Degree | 328 (89.9%) | 37 (10.1%) |
| Graduate Degree | 182 (100.0%) | 0 (0.0%) |
| Total | 982 (88.2%) | 131 (11.8%) |
Employment Characteristics in Sandy
Employment by Class of Employer in Sandy
Among the 49,768 employed individuals in Sandy, private company employees (34,807 | 69.9%), not-for-profit organizations (3,813 | 7.7%), and self-employed (incorporated) (2,893 | 5.8%) make up the most common classes of employment.
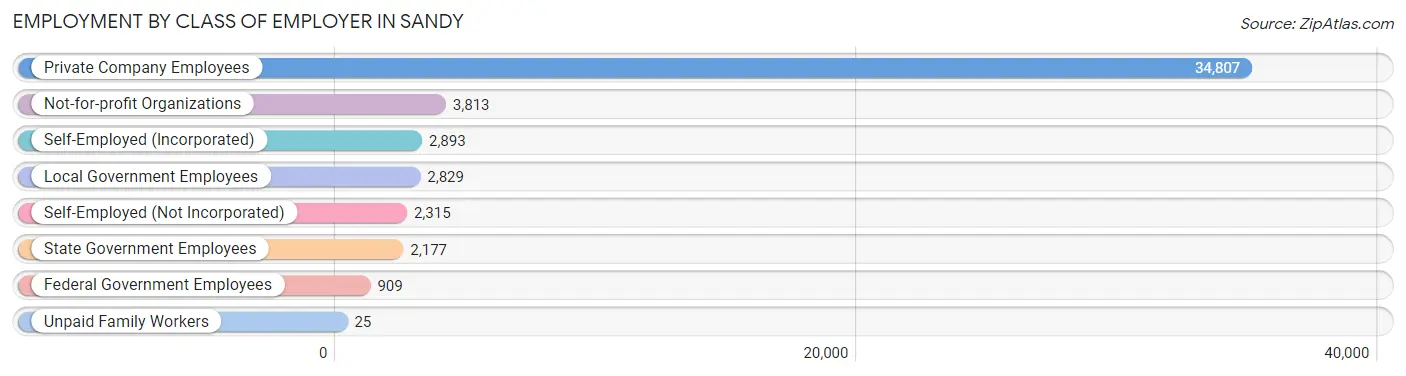
| Employer Class | # Employees | % Employees |
| Private Company Employees | 34,807 | 69.9% |
| Self-Employed (Incorporated) | 2,893 | 5.8% |
| Self-Employed (Not Incorporated) | 2,315 | 4.6% |
| Not-for-profit Organizations | 3,813 | 7.7% |
| Local Government Employees | 2,829 | 5.7% |
| State Government Employees | 2,177 | 4.4% |
| Federal Government Employees | 909 | 1.8% |
| Unpaid Family Workers | 25 | 0.1% |
| Total | 49,768 | 100.0% |
Employment Status by Age in Sandy
According to the labor force statistics for Sandy, out of the total population over 16 years of age (73,831), 69.7% or 51,460 individuals are in the labor force, with 2.2% or 1,132 of them unemployed. The age group with the highest labor force participation rate is 20 to 24 years, with 91.0% or 4,980 individuals in the labor force. Within the labor force, the 65 to 74 years age range has the highest percentage of unemployed individuals, with 5.0% or 159 of them being unemployed.
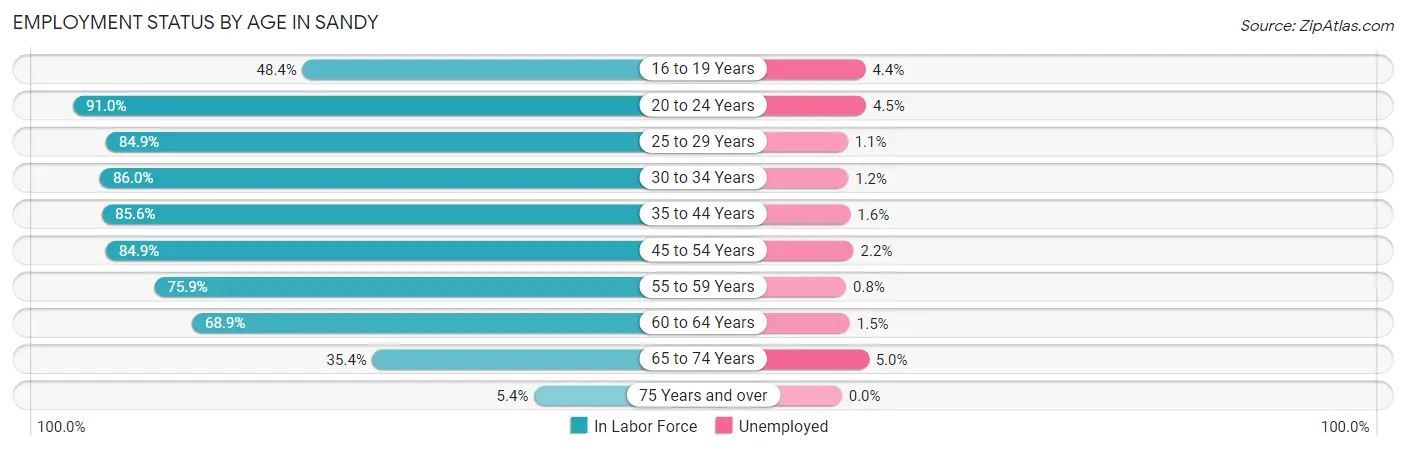
| Age Bracket | In Labor Force | Unemployed |
| 16 to 19 Years | 2,236 (48.4%) | 98 (4.4%) |
| 20 to 24 Years | 4,980 (91.0%) | 224 (4.5%) |
| 25 to 29 Years | 5,540 (84.9%) | 61 (1.1%) |
| 30 to 34 Years | 5,536 (86.0%) | 66 (1.2%) |
| 35 to 44 Years | 11,559 (85.6%) | 185 (1.6%) |
| 45 to 54 Years | 9,754 (84.9%) | 215 (2.2%) |
| 55 to 59 Years | 4,143 (75.9%) | 33 (0.8%) |
| 60 to 64 Years | 4,258 (68.9%) | 64 (1.5%) |
| 65 to 74 Years | 3,182 (35.4%) | 159 (5.0%) |
| 75 Years and over | 279 (5.4%) | 0 (0.0%) |
| Total | 51,460 (69.7%) | 1,132 (2.2%) |
Employment Status by Educational Attainment in Sandy
According to labor force statistics for Sandy, 82.2% of individuals (40,765) out of the total population between 25 and 64 years of age (49,593) are in the labor force, with 1.5% or 611 of them being unemployed. The group with the highest labor force participation rate are those with the educational attainment of bachelor's degree or higher, with 87.1% or 19,841 individuals in the labor force. Within the labor force, individuals with high school diploma education have the highest percentage of unemployment, with 3.6% or 224 of them being unemployed.
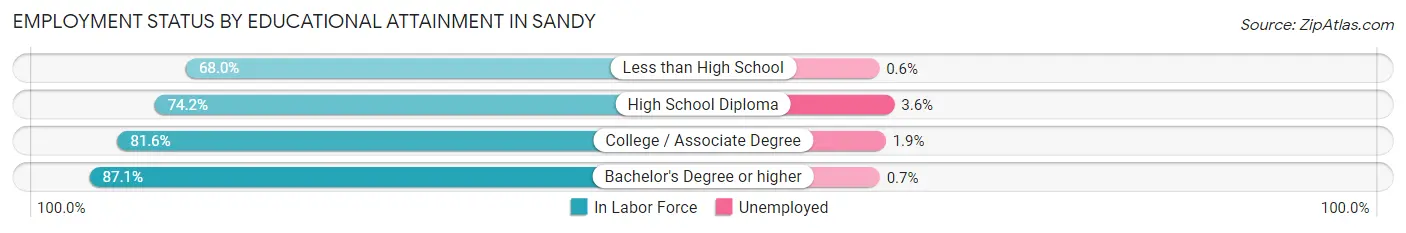
| Educational Attainment | In Labor Force | Unemployed |
| Less than High School | 1,571 (68.0%) | 14 (0.6%) |
| High School Diploma | 6,231 (74.2%) | 302 (3.6%) |
| College / Associate Degree | 13,141 (81.6%) | 306 (1.9%) |
| Bachelor's Degree or higher | 19,841 (87.1%) | 159 (0.7%) |
| Total | 40,765 (82.2%) | 744 (1.5%) |
Employment Occupations by Sex in Sandy
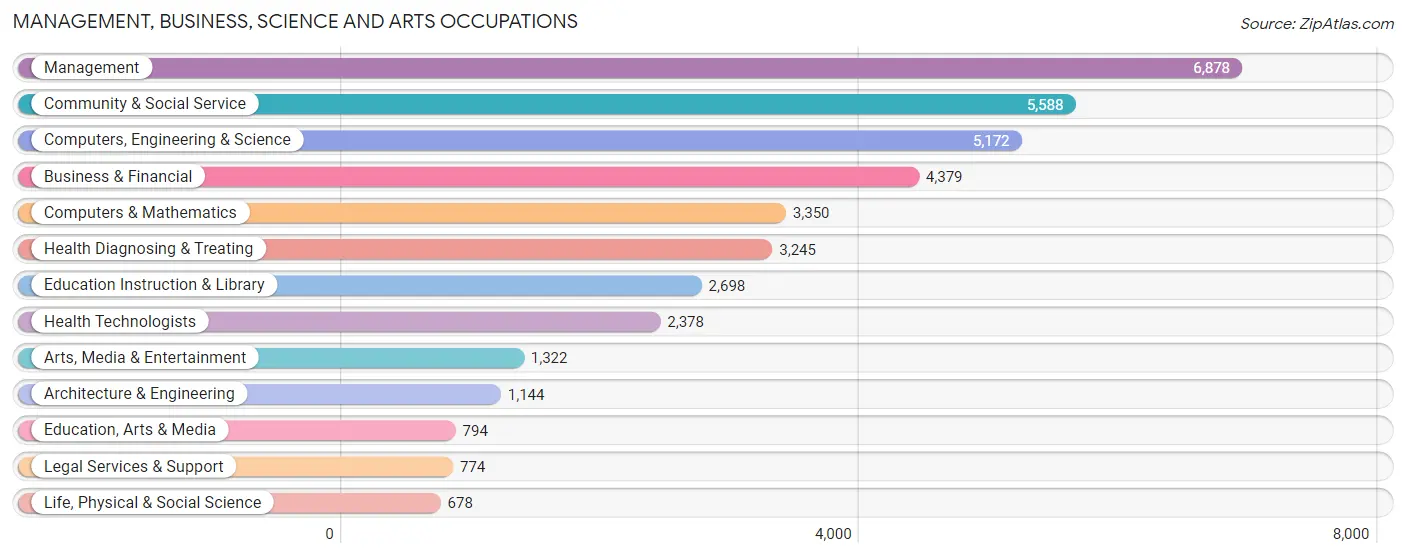
Management, Business, Science and Arts Occupations
The most common Management, Business, Science and Arts occupations in Sandy are Management (6,878 | 13.7%), Community & Social Service (5,588 | 11.1%), Computers, Engineering & Science (5,172 | 10.3%), Business & Financial (4,379 | 8.7%), and Computers & Mathematics (3,350 | 6.7%).
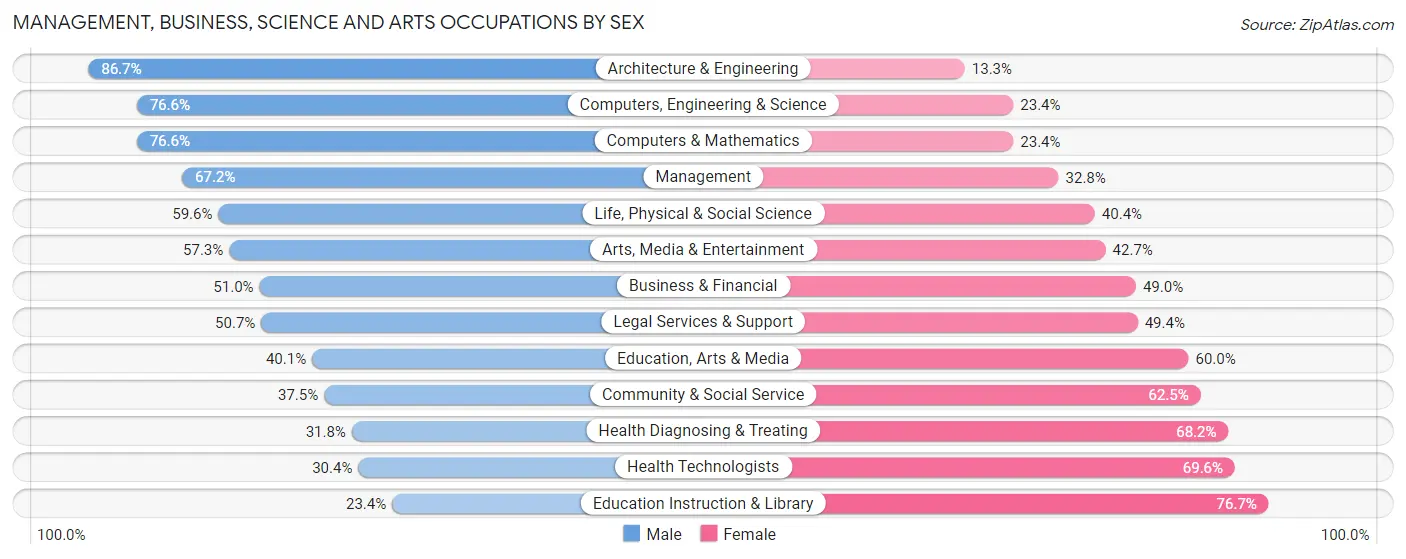
Management, Business, Science and Arts Occupations by Sex
Within the Management, Business, Science and Arts occupations in Sandy, the most male-oriented occupations are Architecture & Engineering (86.7%), Computers, Engineering & Science (76.6%), and Computers & Mathematics (76.6%), while the most female-oriented occupations are Education Instruction & Library (76.6%), Health Technologists (69.6%), and Health Diagnosing & Treating (68.2%).
| Occupation | Male | Female |
| Management | 4,619 (67.2%) | 2,259 (32.8%) |
| Business & Financial | 2,234 (51.0%) | 2,145 (49.0%) |
| Computers, Engineering & Science | 3,962 (76.6%) | 1,210 (23.4%) |
| Computers & Mathematics | 2,566 (76.6%) | 784 (23.4%) |
| Architecture & Engineering | 992 (86.7%) | 152 (13.3%) |
| Life, Physical & Social Science | 404 (59.6%) | 274 (40.4%) |
| Community & Social Service | 2,098 (37.5%) | 3,490 (62.5%) |
| Education, Arts & Media | 318 (40.1%) | 476 (60.0%) |
| Legal Services & Support | 392 (50.6%) | 382 (49.3%) |
| Education Instruction & Library | 630 (23.4%) | 2,068 (76.6%) |
| Arts, Media & Entertainment | 758 (57.3%) | 564 (42.7%) |
| Health Diagnosing & Treating | 1,031 (31.8%) | 2,214 (68.2%) |
| Health Technologists | 723 (30.4%) | 1,655 (69.6%) |
| Total (Category) | 13,944 (55.2%) | 11,318 (44.8%) |
| Total (Overall) | 27,703 (55.1%) | 22,598 (44.9%) |
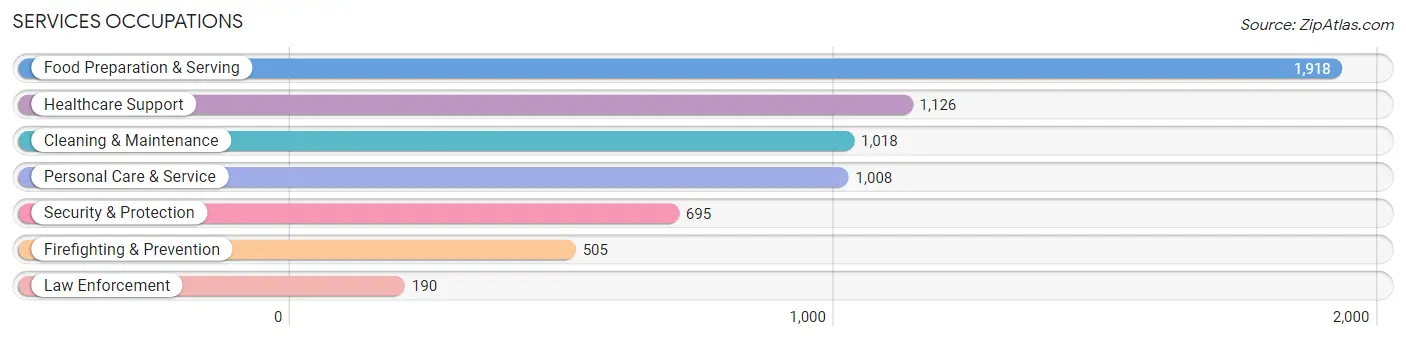
Services Occupations
The most common Services occupations in Sandy are Food Preparation & Serving (1,918 | 3.8%), Healthcare Support (1,126 | 2.2%), Cleaning & Maintenance (1,018 | 2.0%), Personal Care & Service (1,008 | 2.0%), and Security & Protection (695 | 1.4%).
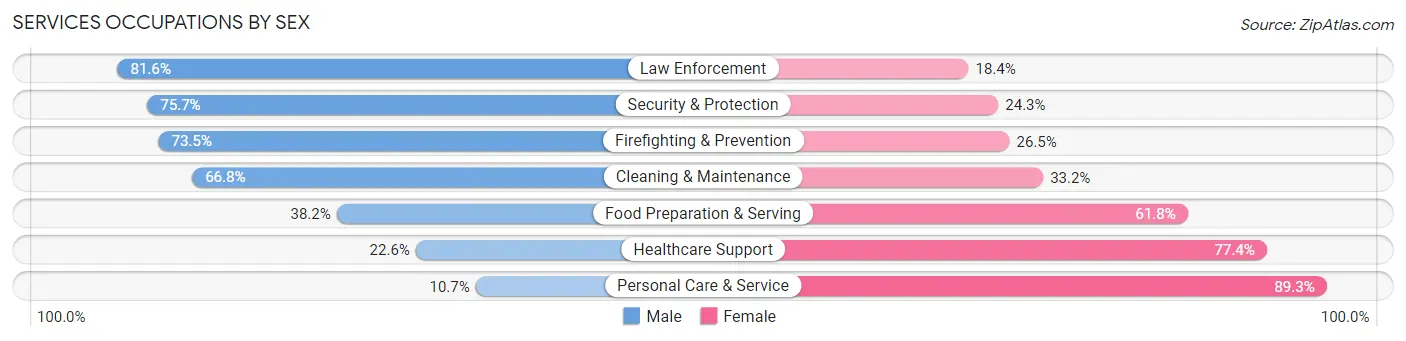
Services Occupations by Sex
Within the Services occupations in Sandy, the most male-oriented occupations are Law Enforcement (81.6%), Security & Protection (75.7%), and Firefighting & Prevention (73.5%), while the most female-oriented occupations are Personal Care & Service (89.3%), Healthcare Support (77.4%), and Food Preparation & Serving (61.8%).
| Occupation | Male | Female |
| Healthcare Support | 254 (22.6%) | 872 (77.4%) |
| Security & Protection | 526 (75.7%) | 169 (24.3%) |
| Firefighting & Prevention | 371 (73.5%) | 134 (26.5%) |
| Law Enforcement | 155 (81.6%) | 35 (18.4%) |
| Food Preparation & Serving | 733 (38.2%) | 1,185 (61.8%) |
| Cleaning & Maintenance | 680 (66.8%) | 338 (33.2%) |
| Personal Care & Service | 108 (10.7%) | 900 (89.3%) |
| Total (Category) | 2,301 (39.9%) | 3,464 (60.1%) |
| Total (Overall) | 27,703 (55.1%) | 22,598 (44.9%) |
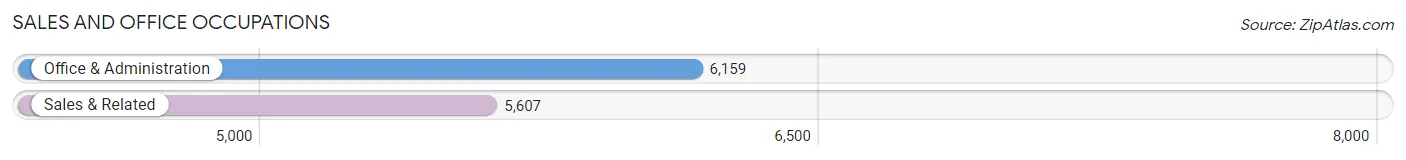
Sales and Office Occupations
The most common Sales and Office occupations in Sandy are Office & Administration (6,159 | 12.2%), and Sales & Related (5,607 | 11.2%).
Sales and Office Occupations by Sex
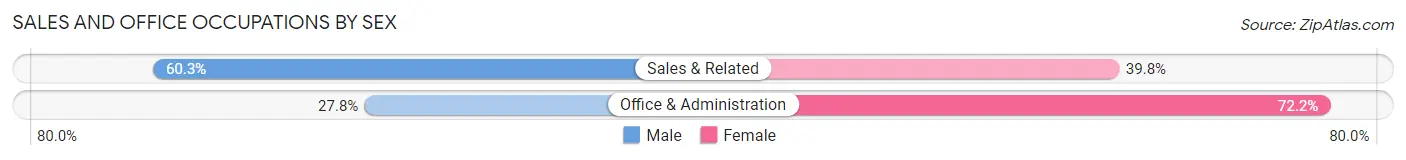
| Occupation | Male | Female |
| Sales & Related | 3,378 (60.3%) | 2,229 (39.8%) |
| Office & Administration | 1,710 (27.8%) | 4,449 (72.2%) |
| Total (Category) | 5,088 (43.2%) | 6,678 (56.8%) |
| Total (Overall) | 27,703 (55.1%) | 22,598 (44.9%) |
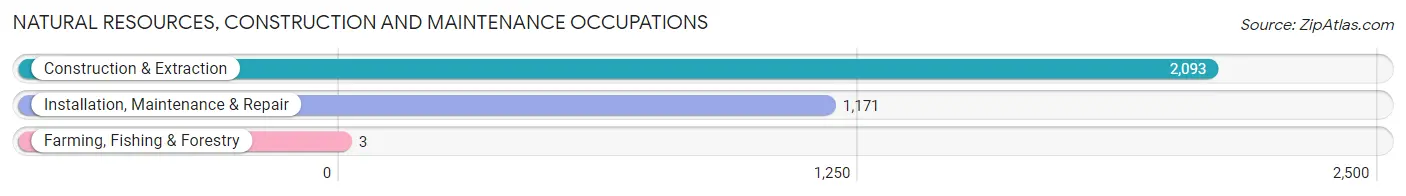
Natural Resources, Construction and Maintenance Occupations
The most common Natural Resources, Construction and Maintenance occupations in Sandy are Construction & Extraction (2,093 | 4.2%), Installation, Maintenance & Repair (1,171 | 2.3%), and Farming, Fishing & Forestry (3 | 0.0%).
Natural Resources, Construction and Maintenance Occupations by Sex
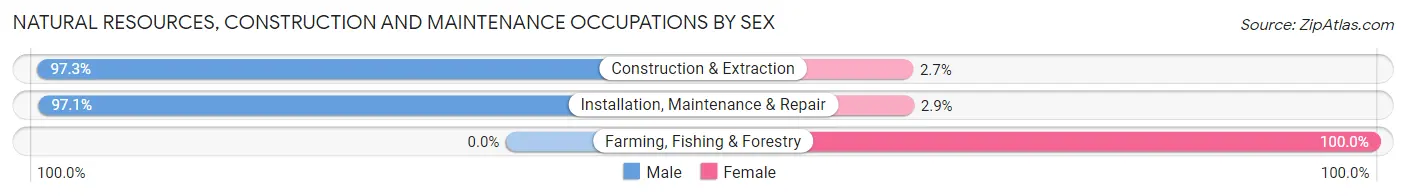
| Occupation | Male | Female |
| Farming, Fishing & Forestry | 0 (0.0%) | 3 (100.0%) |
| Construction & Extraction | 2,036 (97.3%) | 57 (2.7%) |
| Installation, Maintenance & Repair | 1,137 (97.1%) | 34 (2.9%) |
| Total (Category) | 3,173 (97.1%) | 94 (2.9%) |
| Total (Overall) | 27,703 (55.1%) | 22,598 (44.9%) |
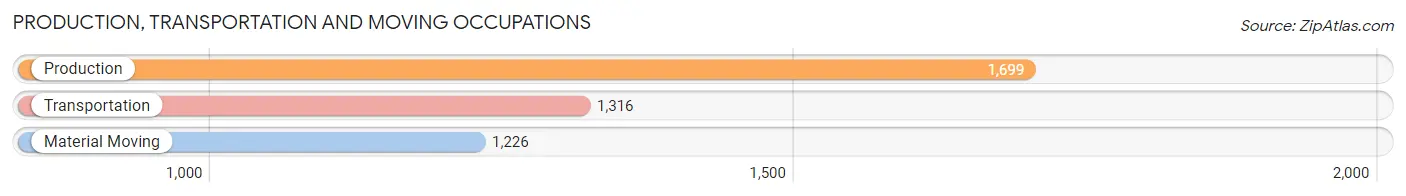
Production, Transportation and Moving Occupations
The most common Production, Transportation and Moving occupations in Sandy are Production (1,699 | 3.4%), Transportation (1,316 | 2.6%), and Material Moving (1,226 | 2.4%).
Production, Transportation and Moving Occupations by Sex
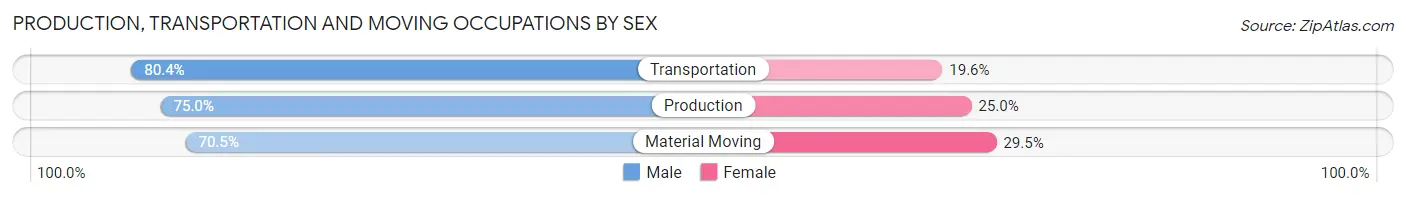
| Occupation | Male | Female |
| Production | 1,275 (75.0%) | 424 (25.0%) |
| Transportation | 1,058 (80.4%) | 258 (19.6%) |
| Material Moving | 864 (70.5%) | 362 (29.5%) |
| Total (Category) | 3,197 (75.4%) | 1,044 (24.6%) |
| Total (Overall) | 27,703 (55.1%) | 22,598 (44.9%) |
Employment Industries by Sex in Sandy
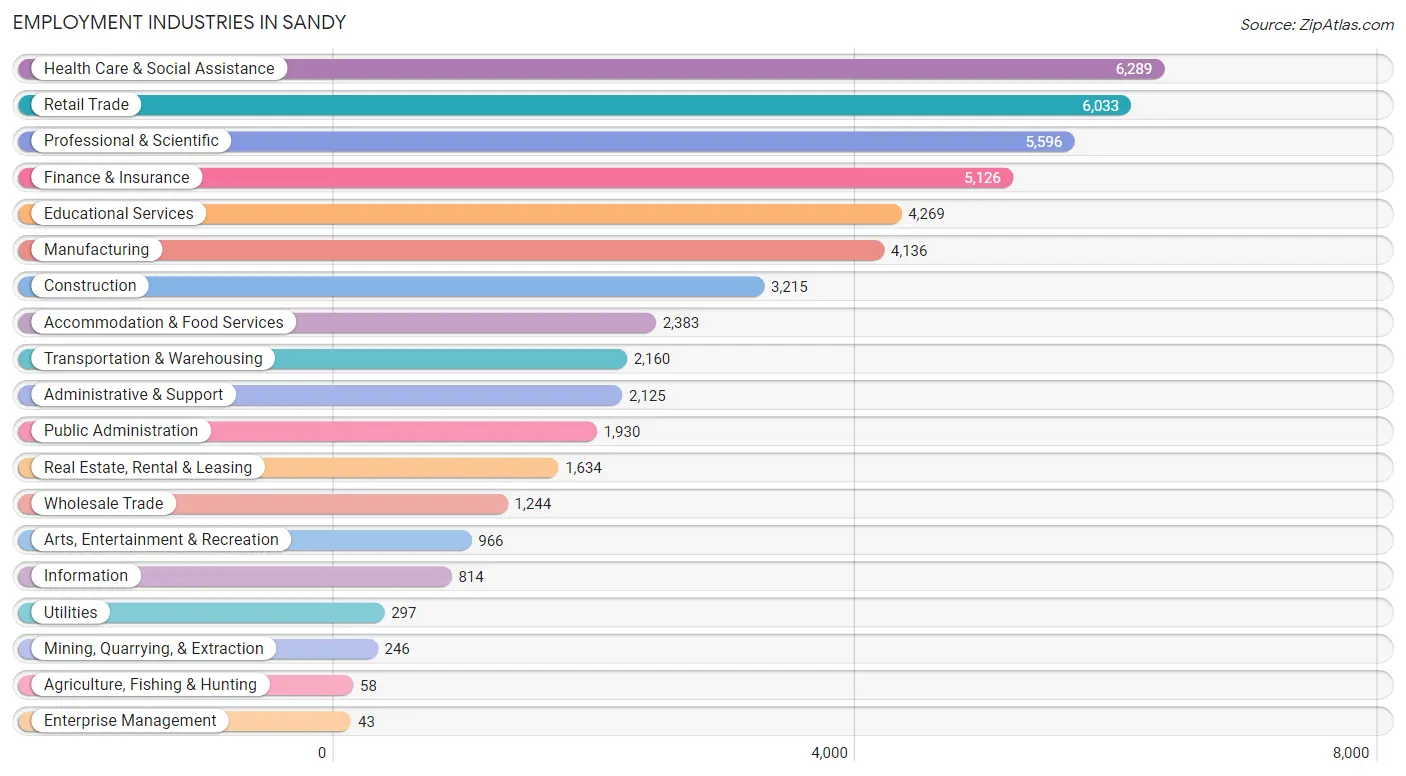
Employment Industries in Sandy
The major employment industries in Sandy include Health Care & Social Assistance (6,289 | 12.5%), Retail Trade (6,033 | 12.0%), Professional & Scientific (5,596 | 11.1%), Finance & Insurance (5,126 | 10.2%), and Educational Services (4,269 | 8.5%).
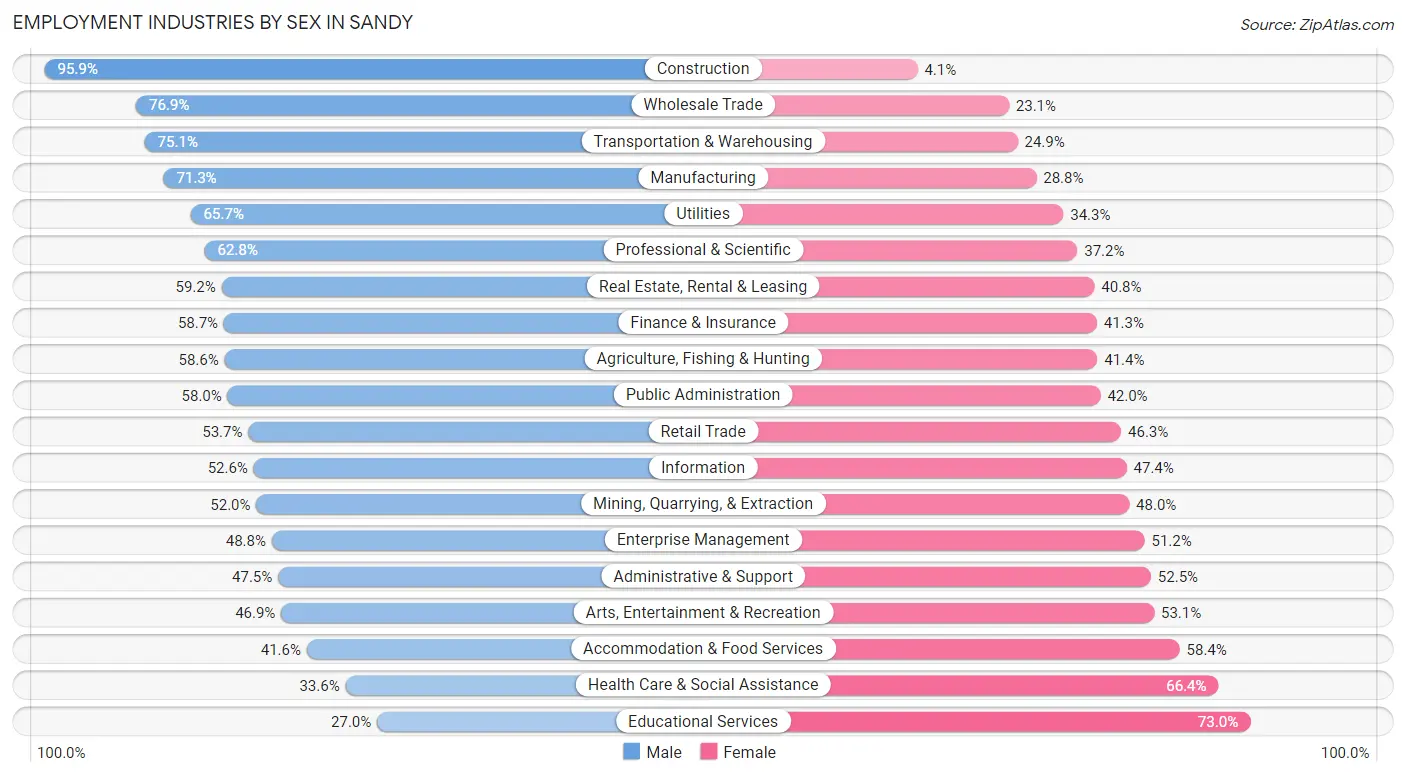
Employment Industries by Sex in Sandy
The Sandy industries that see more men than women are Construction (95.9%), Wholesale Trade (76.9%), and Transportation & Warehousing (75.1%), whereas the industries that tend to have a higher number of women are Educational Services (73.0%), Health Care & Social Assistance (66.4%), and Accommodation & Food Services (58.4%).
| Industry | Male | Female |
| Agriculture, Fishing & Hunting | 34 (58.6%) | 24 (41.4%) |
| Mining, Quarrying, & Extraction | 128 (52.0%) | 118 (48.0%) |
| Construction | 3,082 (95.9%) | 133 (4.1%) |
| Manufacturing | 2,947 (71.3%) | 1,189 (28.7%) |
| Wholesale Trade | 957 (76.9%) | 287 (23.1%) |
| Retail Trade | 3,240 (53.7%) | 2,793 (46.3%) |
| Transportation & Warehousing | 1,623 (75.1%) | 537 (24.9%) |
| Utilities | 195 (65.7%) | 102 (34.3%) |
| Information | 428 (52.6%) | 386 (47.4%) |
| Finance & Insurance | 3,011 (58.7%) | 2,115 (41.3%) |
| Real Estate, Rental & Leasing | 968 (59.2%) | 666 (40.8%) |
| Professional & Scientific | 3,512 (62.8%) | 2,084 (37.2%) |
| Enterprise Management | 21 (48.8%) | 22 (51.2%) |
| Administrative & Support | 1,010 (47.5%) | 1,115 (52.5%) |
| Educational Services | 1,154 (27.0%) | 3,115 (73.0%) |
| Health Care & Social Assistance | 2,112 (33.6%) | 4,177 (66.4%) |
| Arts, Entertainment & Recreation | 453 (46.9%) | 513 (53.1%) |
| Accommodation & Food Services | 991 (41.6%) | 1,392 (58.4%) |
| Public Administration | 1,119 (58.0%) | 811 (42.0%) |
| Total | 27,703 (55.1%) | 22,598 (44.9%) |
Education in Sandy
School Enrollment in Sandy
The most common levels of schooling among the 25,378 students in Sandy are high school (5,731 | 22.6%), middle school (5,696 | 22.4%), and elementary school (5,583 | 22.0%).
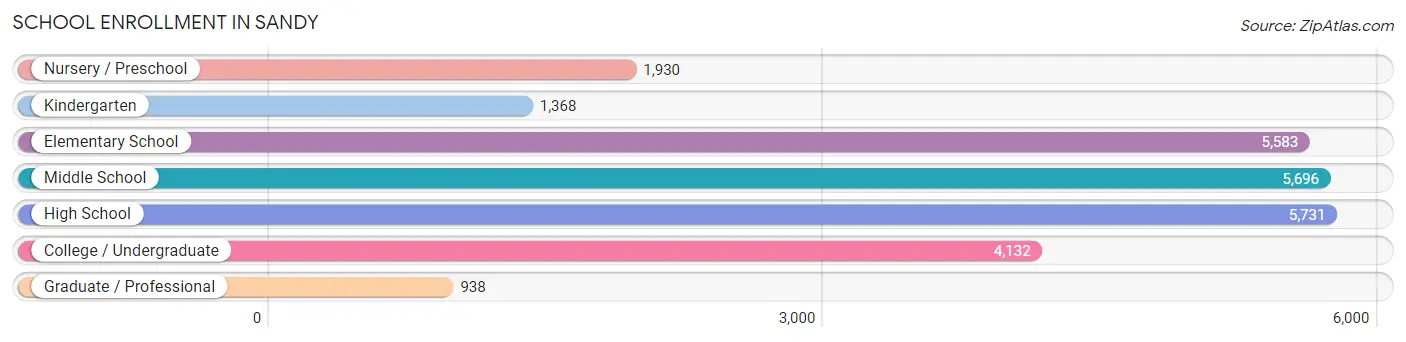
| School Level | # Students | % Students |
| Nursery / Preschool | 1,930 | 7.6% |
| Kindergarten | 1,368 | 5.4% |
| Elementary School | 5,583 | 22.0% |
| Middle School | 5,696 | 22.4% |
| High School | 5,731 | 22.6% |
| College / Undergraduate | 4,132 | 16.3% |
| Graduate / Professional | 938 | 3.7% |
| Total | 25,378 | 100.0% |
School Enrollment by Age by Funding Source in Sandy
Out of a total of 25,378 students who are enrolled in schools in Sandy, 4,187 (16.5%) attend a private institution, while the remaining 21,191 (83.5%) are enrolled in public schools. The age group of 3 to 4 year olds has the highest likelihood of being enrolled in private schools, with 831 (55.8% in the age bracket) enrolled. Conversely, the age group of 10 to 14 year olds has the lowest likelihood of being enrolled in a private school, with 6,213 (91.8% in the age bracket) attending a public institution.
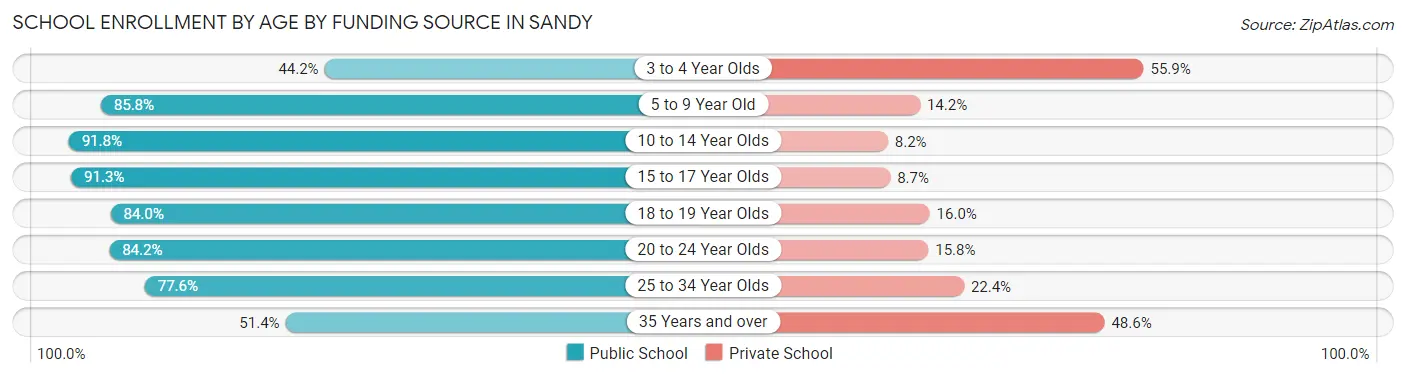
| Age Bracket | Public School | Private School |
| 3 to 4 Year Olds | 657 (44.2%) | 831 (55.8%) |
| 5 to 9 Year Old | 5,836 (85.8%) | 967 (14.2%) |
| 10 to 14 Year Olds | 6,213 (91.8%) | 557 (8.2%) |
| 15 to 17 Year Olds | 4,002 (91.3%) | 380 (8.7%) |
| 18 to 19 Year Olds | 907 (84.0%) | 173 (16.0%) |
| 20 to 24 Year Olds | 1,811 (84.2%) | 339 (15.8%) |
| 25 to 34 Year Olds | 1,091 (77.6%) | 315 (22.4%) |
| 35 Years and over | 668 (51.4%) | 631 (48.6%) |
| Total | 21,191 (83.5%) | 4,187 (16.5%) |
Educational Attainment by Field of Study in Sandy
Business (5,922 | 19.2%), science & technology (3,372 | 10.9%), social sciences (3,089 | 10.0%), engineering (2,797 | 9.0%), and education (2,775 | 9.0%) are the most common fields of study among 30,891 individuals in Sandy who have obtained a bachelor's degree or higher.
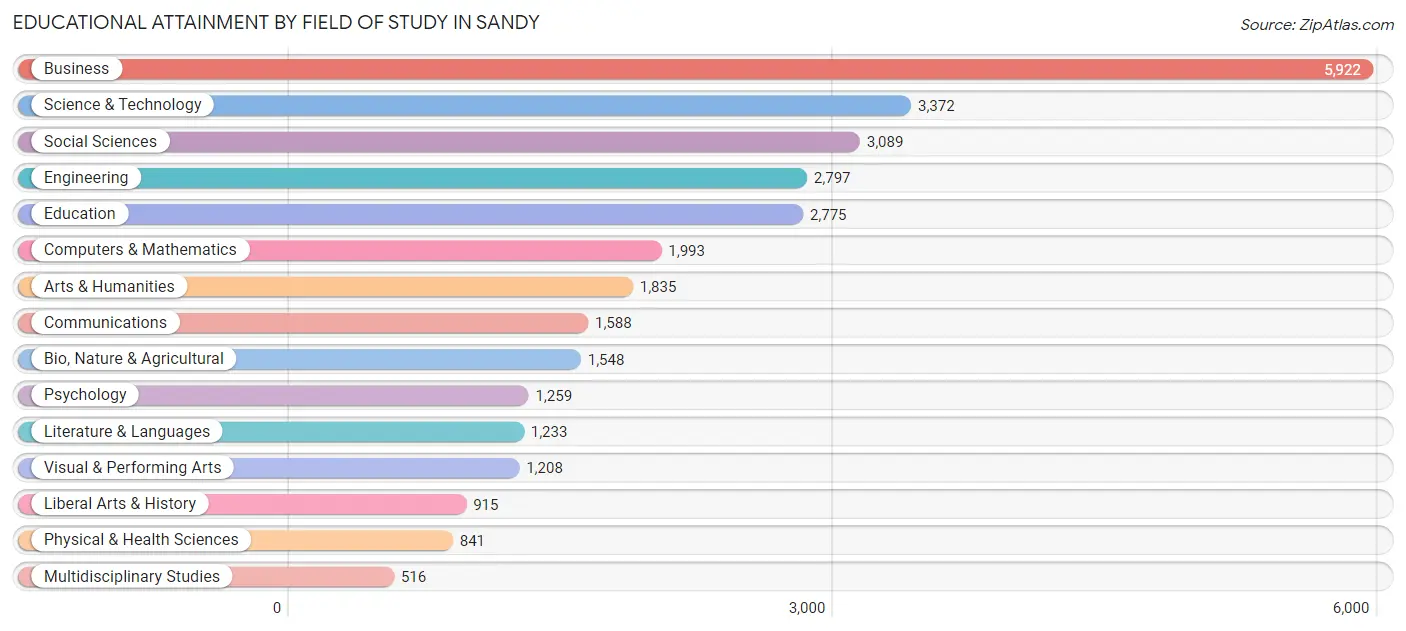
| Field of Study | # Graduates | % Graduates |
| Computers & Mathematics | 1,993 | 6.5% |
| Bio, Nature & Agricultural | 1,548 | 5.0% |
| Physical & Health Sciences | 841 | 2.7% |
| Psychology | 1,259 | 4.1% |
| Social Sciences | 3,089 | 10.0% |
| Engineering | 2,797 | 9.0% |
| Multidisciplinary Studies | 516 | 1.7% |
| Science & Technology | 3,372 | 10.9% |
| Business | 5,922 | 19.2% |
| Education | 2,775 | 9.0% |
| Literature & Languages | 1,233 | 4.0% |
| Liberal Arts & History | 915 | 3.0% |
| Visual & Performing Arts | 1,208 | 3.9% |
| Communications | 1,588 | 5.1% |
| Arts & Humanities | 1,835 | 5.9% |
| Total | 30,891 | 100.0% |
Transportation & Commute in Sandy
Vehicle Availability by Sex in Sandy
The most prevalent vehicle ownership categories in Sandy are males with 2 vehicles (11,631, accounting for 42.4%) and females with 2 vehicles (9,362, making up 52.2%).
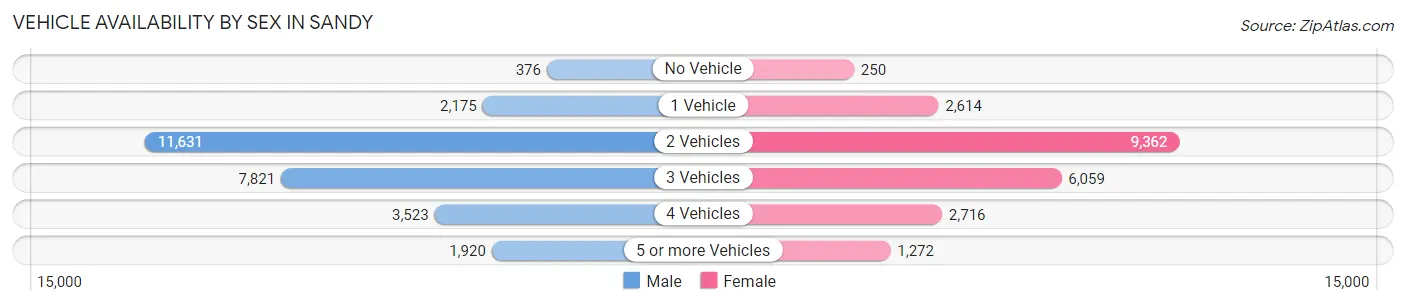
| Vehicles Available | Male | Female |
| No Vehicle | 376 (1.4%) | 250 (1.1%) |
| 1 Vehicle | 2,175 (7.9%) | 2,614 (11.7%) |
| 2 Vehicles | 11,631 (42.4%) | 9,362 (42.0%) |
| 3 Vehicles | 7,821 (28.5%) | 6,059 (27.2%) |
| 4 Vehicles | 3,523 (12.8%) | 2,716 (12.2%) |
| 5 or more Vehicles | 1,920 (7.0%) | 1,272 (5.7%) |
| Total | 27,446 (100.0%) | 22,273 (100.0%) |
Commute Time in Sandy
The most frequently occuring commute durations in Sandy are 20 to 24 minutes (7,774 commuters, 19.0%), 15 to 19 minutes (6,718 commuters, 16.4%), and 30 to 34 minutes (6,245 commuters, 15.2%).
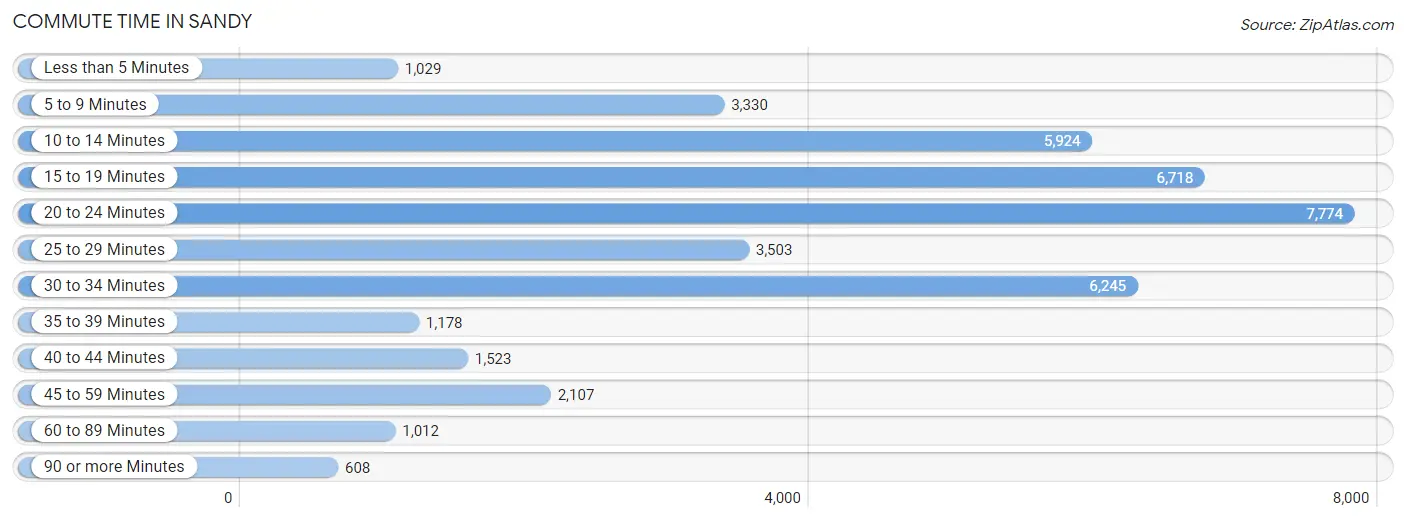
| Commute Time | # Commuters | % Commuters |
| Less than 5 Minutes | 1,029 | 2.5% |
| 5 to 9 Minutes | 3,330 | 8.1% |
| 10 to 14 Minutes | 5,924 | 14.5% |
| 15 to 19 Minutes | 6,718 | 16.4% |
| 20 to 24 Minutes | 7,774 | 19.0% |
| 25 to 29 Minutes | 3,503 | 8.6% |
| 30 to 34 Minutes | 6,245 | 15.2% |
| 35 to 39 Minutes | 1,178 | 2.9% |
| 40 to 44 Minutes | 1,523 | 3.7% |
| 45 to 59 Minutes | 2,107 | 5.1% |
| 60 to 89 Minutes | 1,012 | 2.5% |
| 90 or more Minutes | 608 | 1.5% |
Commute Time by Sex in Sandy
The most common commute times in Sandy are 20 to 24 minutes (4,627 commuters, 20.1%) for males and 20 to 24 minutes (3,147 commuters, 17.6%) for females.
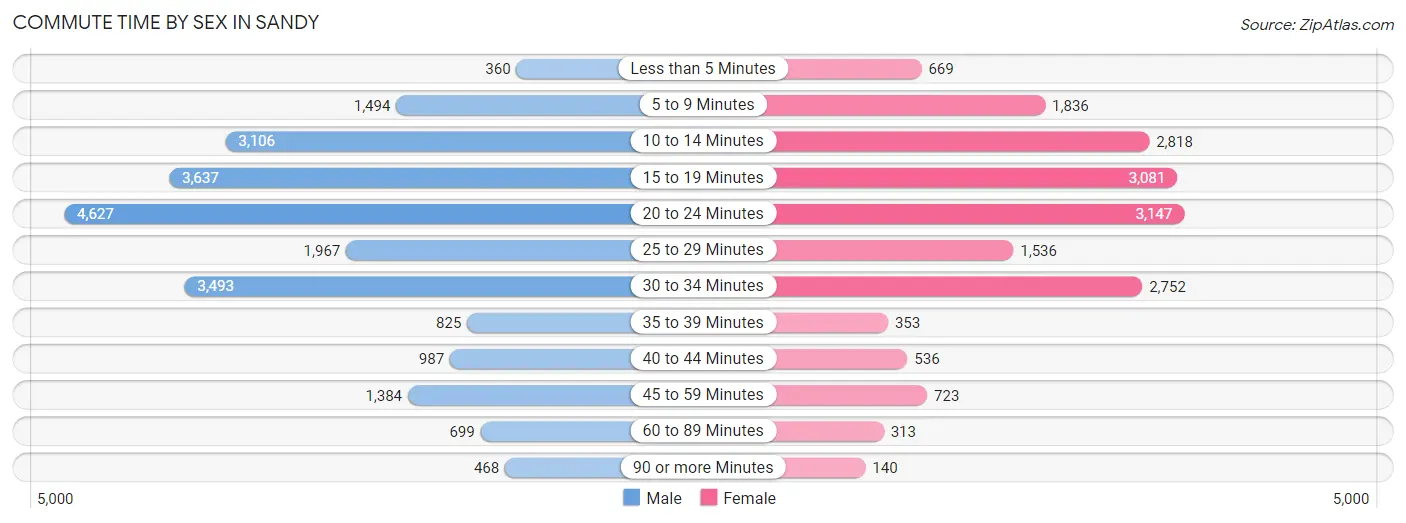
| Commute Time | Male | Female |
| Less than 5 Minutes | 360 (1.6%) | 669 (3.7%) |
| 5 to 9 Minutes | 1,494 (6.5%) | 1,836 (10.2%) |
| 10 to 14 Minutes | 3,106 (13.5%) | 2,818 (15.7%) |
| 15 to 19 Minutes | 3,637 (15.8%) | 3,081 (17.2%) |
| 20 to 24 Minutes | 4,627 (20.1%) | 3,147 (17.6%) |
| 25 to 29 Minutes | 1,967 (8.5%) | 1,536 (8.6%) |
| 30 to 34 Minutes | 3,493 (15.2%) | 2,752 (15.4%) |
| 35 to 39 Minutes | 825 (3.6%) | 353 (2.0%) |
| 40 to 44 Minutes | 987 (4.3%) | 536 (3.0%) |
| 45 to 59 Minutes | 1,384 (6.0%) | 723 (4.0%) |
| 60 to 89 Minutes | 699 (3.0%) | 313 (1.8%) |
| 90 or more Minutes | 468 (2.0%) | 140 (0.8%) |
Time of Departure to Work by Sex in Sandy
The most frequent times of departure to work in Sandy are 8:00 AM to 8:29 AM (3,867, 16.8%) for males and 8:00 AM to 8:29 AM (2,837, 15.9%) for females.
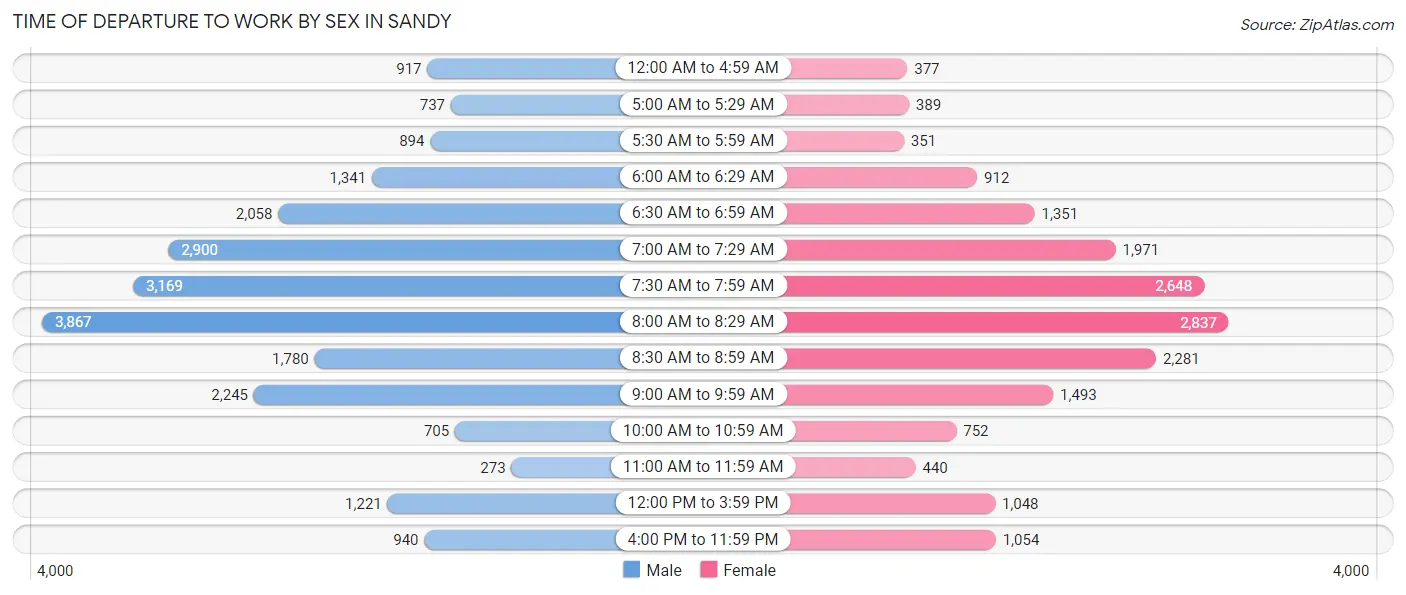
| Time of Departure | Male | Female |
| 12:00 AM to 4:59 AM | 917 (4.0%) | 377 (2.1%) |
| 5:00 AM to 5:29 AM | 737 (3.2%) | 389 (2.2%) |
| 5:30 AM to 5:59 AM | 894 (3.9%) | 351 (2.0%) |
| 6:00 AM to 6:29 AM | 1,341 (5.8%) | 912 (5.1%) |
| 6:30 AM to 6:59 AM | 2,058 (8.9%) | 1,351 (7.5%) |
| 7:00 AM to 7:29 AM | 2,900 (12.6%) | 1,971 (11.0%) |
| 7:30 AM to 7:59 AM | 3,169 (13.8%) | 2,648 (14.8%) |
| 8:00 AM to 8:29 AM | 3,867 (16.8%) | 2,837 (15.9%) |
| 8:30 AM to 8:59 AM | 1,780 (7.7%) | 2,281 (12.7%) |
| 9:00 AM to 9:59 AM | 2,245 (9.7%) | 1,493 (8.3%) |
| 10:00 AM to 10:59 AM | 705 (3.1%) | 752 (4.2%) |
| 11:00 AM to 11:59 AM | 273 (1.2%) | 440 (2.5%) |
| 12:00 PM to 3:59 PM | 1,221 (5.3%) | 1,048 (5.9%) |
| 4:00 PM to 11:59 PM | 940 (4.1%) | 1,054 (5.9%) |
| Total | 23,047 (100.0%) | 17,904 (100.0%) |
Housing Occupancy in Sandy
Occupancy by Ownership in Sandy
Of the total 32,747 dwellings in Sandy, owner-occupied units account for 25,038 (76.5%), while renter-occupied units make up 7,709 (23.5%).
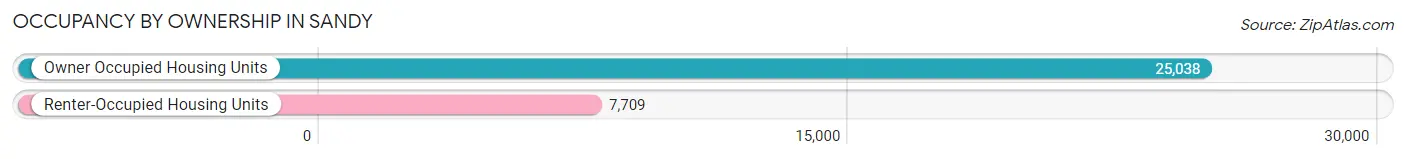
| Occupancy | # Housing Units | % Housing Units |
| Owner Occupied Housing Units | 25,038 | 76.5% |
| Renter-Occupied Housing Units | 7,709 | 23.5% |
| Total Occupied Housing Units | 32,747 | 100.0% |
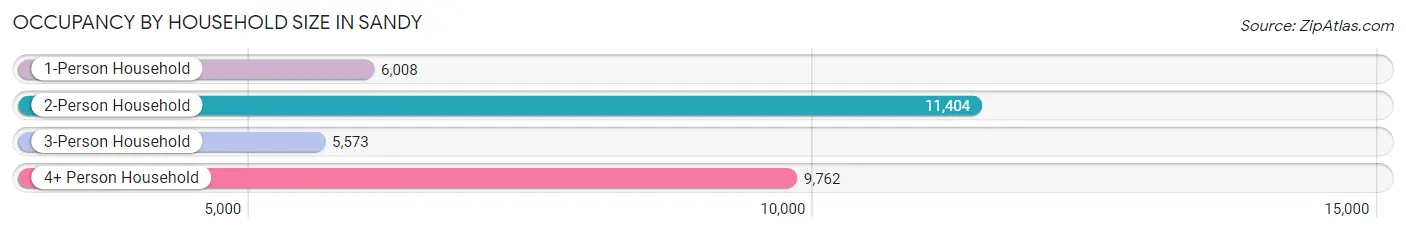
Occupancy by Household Size in Sandy
| Household Size | # Housing Units | % Housing Units |
| 1-Person Household | 6,008 | 18.3% |
| 2-Person Household | 11,404 | 34.8% |
| 3-Person Household | 5,573 | 17.0% |
| 4+ Person Household | 9,762 | 29.8% |
| Total Housing Units | 32,747 | 100.0% |
Occupancy by Ownership by Household Size in Sandy
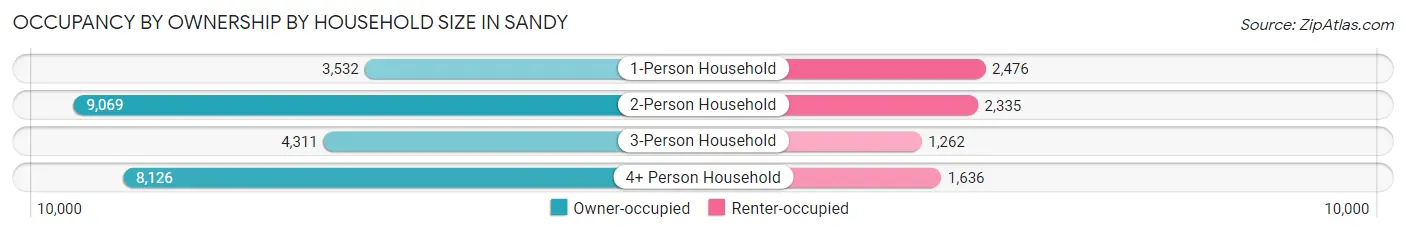
| Household Size | Owner-occupied | Renter-occupied |
| 1-Person Household | 3,532 (58.8%) | 2,476 (41.2%) |
| 2-Person Household | 9,069 (79.5%) | 2,335 (20.5%) |
| 3-Person Household | 4,311 (77.4%) | 1,262 (22.6%) |
| 4+ Person Household | 8,126 (83.2%) | 1,636 (16.8%) |
| Total Housing Units | 25,038 (76.5%) | 7,709 (23.5%) |
Occupancy by Educational Attainment in Sandy
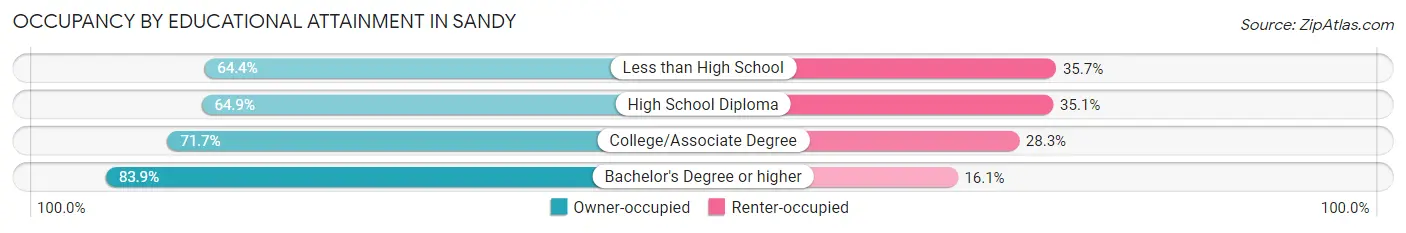
| Household Size | Owner-occupied | Renter-occupied |
| Less than High School | 574 (64.3%) | 318 (35.6%) |
| High School Diploma | 3,292 (64.9%) | 1,780 (35.1%) |
| College/Associate Degree | 7,621 (71.7%) | 3,008 (28.3%) |
| Bachelor's Degree or higher | 13,551 (83.9%) | 2,603 (16.1%) |
Occupancy by Age of Householder in Sandy
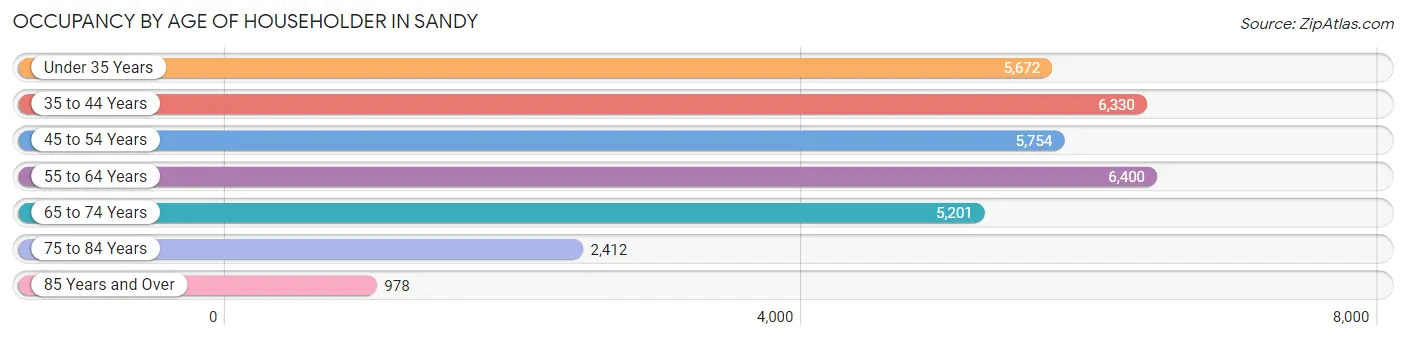
| Age Bracket | # Households | % Households |
| Under 35 Years | 5,672 | 17.3% |
| 35 to 44 Years | 6,330 | 19.3% |
| 45 to 54 Years | 5,754 | 17.6% |
| 55 to 64 Years | 6,400 | 19.5% |
| 65 to 74 Years | 5,201 | 15.9% |
| 75 to 84 Years | 2,412 | 7.4% |
| 85 Years and Over | 978 | 3.0% |
| Total | 32,747 | 100.0% |
Housing Finances in Sandy
Median Income by Occupancy in Sandy
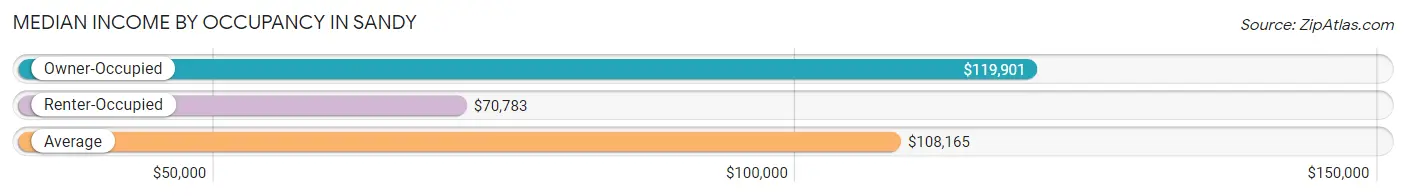
| Occupancy Type | # Households | Median Income |
| Owner-Occupied | 25,038 (76.5%) | $119,901 |
| Renter-Occupied | 7,709 (23.5%) | $70,783 |
| Average | 32,747 (100.0%) | $108,165 |
Occupancy by Householder Income Bracket in Sandy
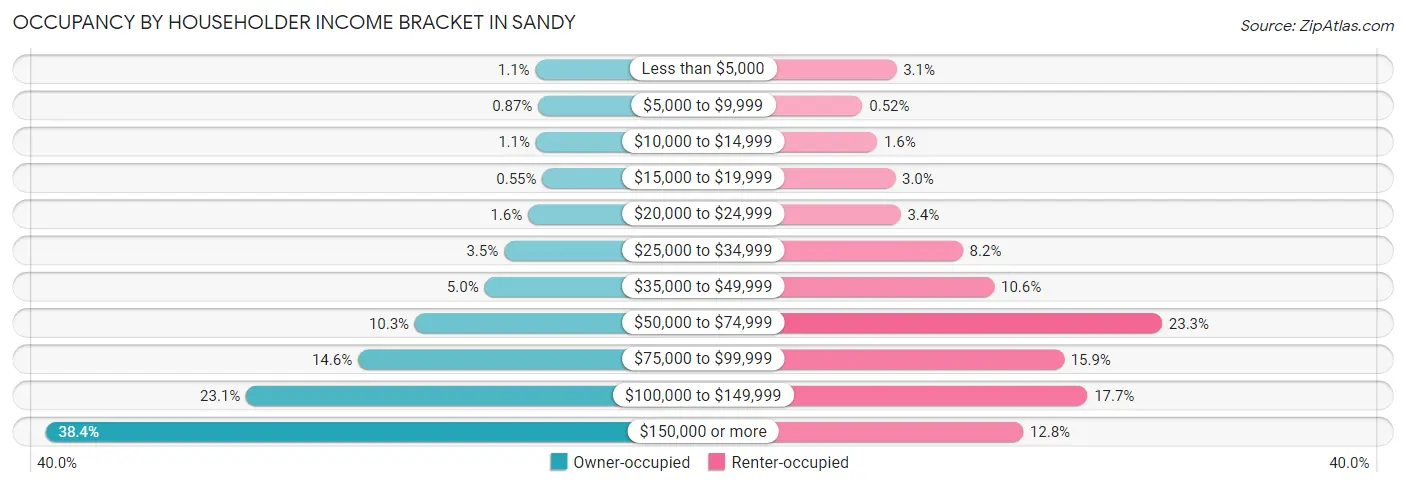
| Income Bracket | Owner-occupied | Renter-occupied |
| Less than $5,000 | 271 (1.1%) | 239 (3.1%) |
| $5,000 to $9,999 | 217 (0.9%) | 40 (0.5%) |
| $10,000 to $14,999 | 262 (1.1%) | 126 (1.6%) |
| $15,000 to $19,999 | 138 (0.5%) | 232 (3.0%) |
| $20,000 to $24,999 | 411 (1.6%) | 264 (3.4%) |
| $25,000 to $34,999 | 869 (3.5%) | 629 (8.2%) |
| $35,000 to $49,999 | 1,242 (5.0%) | 813 (10.5%) |
| $50,000 to $74,999 | 2,569 (10.3%) | 1,799 (23.3%) |
| $75,000 to $99,999 | 3,655 (14.6%) | 1,223 (15.9%) |
| $100,000 to $149,999 | 5,790 (23.1%) | 1,361 (17.6%) |
| $150,000 or more | 9,614 (38.4%) | 983 (12.8%) |
| Total | 25,038 (100.0%) | 7,709 (100.0%) |
Monthly Housing Cost Tiers in Sandy
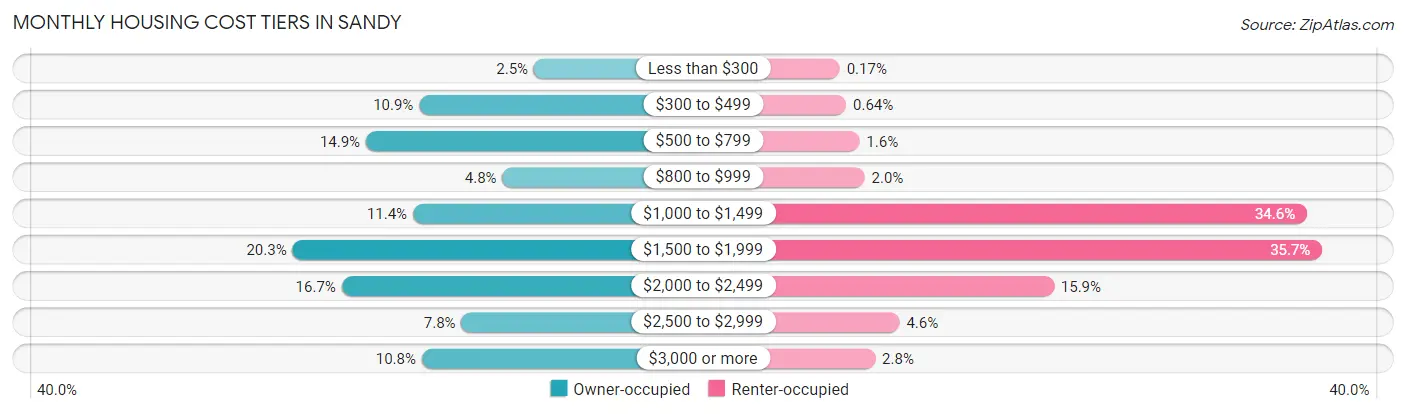
| Monthly Cost | Owner-occupied | Renter-occupied |
| Less than $300 | 624 (2.5%) | 13 (0.2%) |
| $300 to $499 | 2,739 (10.9%) | 49 (0.6%) |
| $500 to $799 | 3,720 (14.9%) | 125 (1.6%) |
| $800 to $999 | 1,205 (4.8%) | 154 (2.0%) |
| $1,000 to $1,499 | 2,855 (11.4%) | 2,666 (34.6%) |
| $1,500 to $1,999 | 5,075 (20.3%) | 2,752 (35.7%) |
| $2,000 to $2,499 | 4,168 (16.7%) | 1,229 (15.9%) |
| $2,500 to $2,999 | 1,961 (7.8%) | 352 (4.6%) |
| $3,000 or more | 2,691 (10.7%) | 214 (2.8%) |
| Total | 25,038 (100.0%) | 7,709 (100.0%) |
Physical Housing Characteristics in Sandy
Housing Structures in Sandy
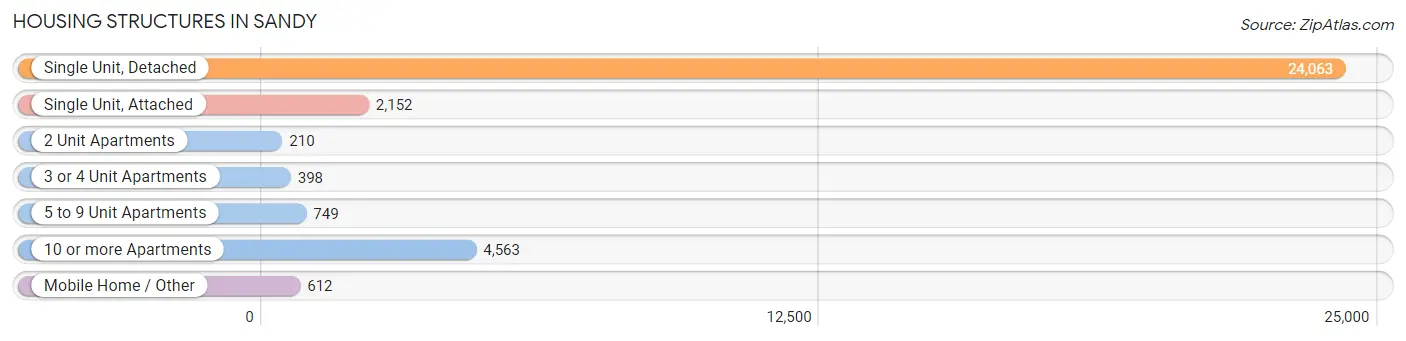
| Structure Type | # Housing Units | % Housing Units |
| Single Unit, Detached | 24,063 | 73.5% |
| Single Unit, Attached | 2,152 | 6.6% |
| 2 Unit Apartments | 210 | 0.6% |
| 3 or 4 Unit Apartments | 398 | 1.2% |
| 5 to 9 Unit Apartments | 749 | 2.3% |
| 10 or more Apartments | 4,563 | 13.9% |
| Mobile Home / Other | 612 | 1.9% |
| Total | 32,747 | 100.0% |
Housing Structures by Occupancy in Sandy
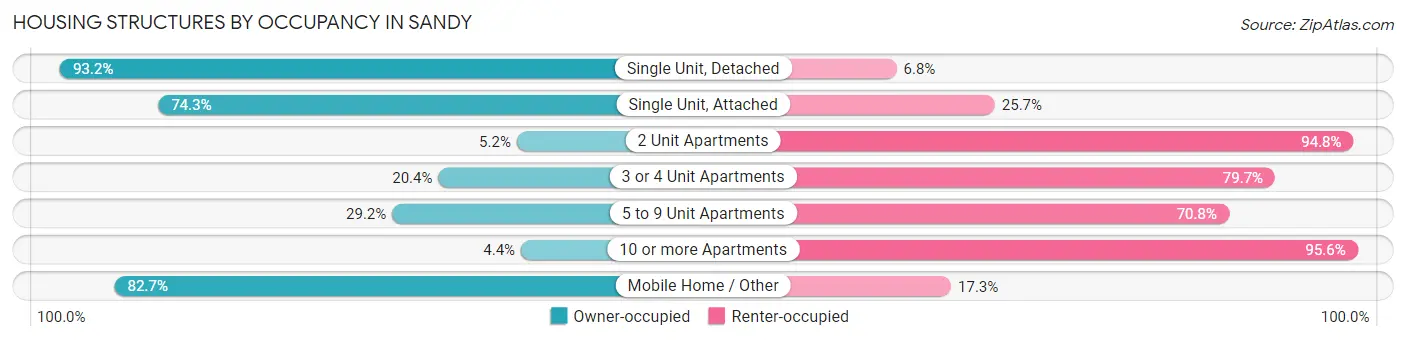
| Structure Type | Owner-occupied | Renter-occupied |
| Single Unit, Detached | 22,421 (93.2%) | 1,642 (6.8%) |
| Single Unit, Attached | 1,598 (74.3%) | 554 (25.7%) |
| 2 Unit Apartments | 11 (5.2%) | 199 (94.8%) |
| 3 or 4 Unit Apartments | 81 (20.3%) | 317 (79.6%) |
| 5 to 9 Unit Apartments | 219 (29.2%) | 530 (70.8%) |
| 10 or more Apartments | 202 (4.4%) | 4,361 (95.6%) |
| Mobile Home / Other | 506 (82.7%) | 106 (17.3%) |
| Total | 25,038 (76.5%) | 7,709 (23.5%) |
Housing Structures by Number of Rooms in Sandy
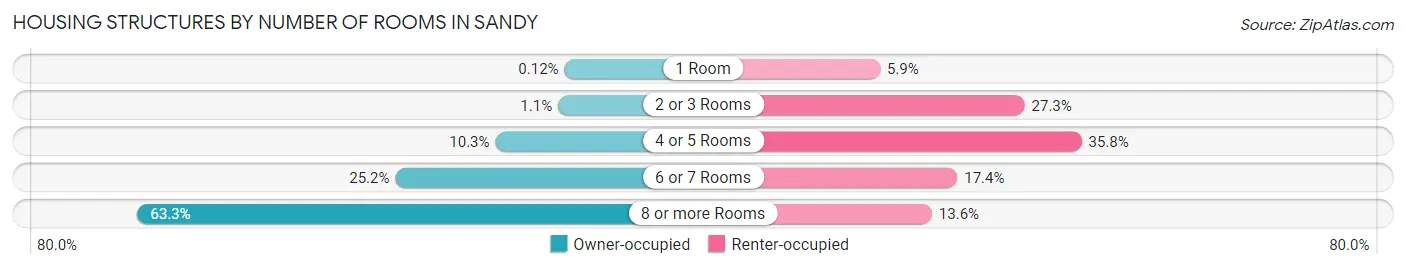
| Number of Rooms | Owner-occupied | Renter-occupied |
| 1 Room | 30 (0.1%) | 457 (5.9%) |
| 2 or 3 Rooms | 268 (1.1%) | 2,107 (27.3%) |
| 4 or 5 Rooms | 2,590 (10.3%) | 2,757 (35.8%) |
| 6 or 7 Rooms | 6,298 (25.2%) | 1,339 (17.4%) |
| 8 or more Rooms | 15,852 (63.3%) | 1,049 (13.6%) |
| Total | 25,038 (100.0%) | 7,709 (100.0%) |
Housing Structure by Heating Type in Sandy
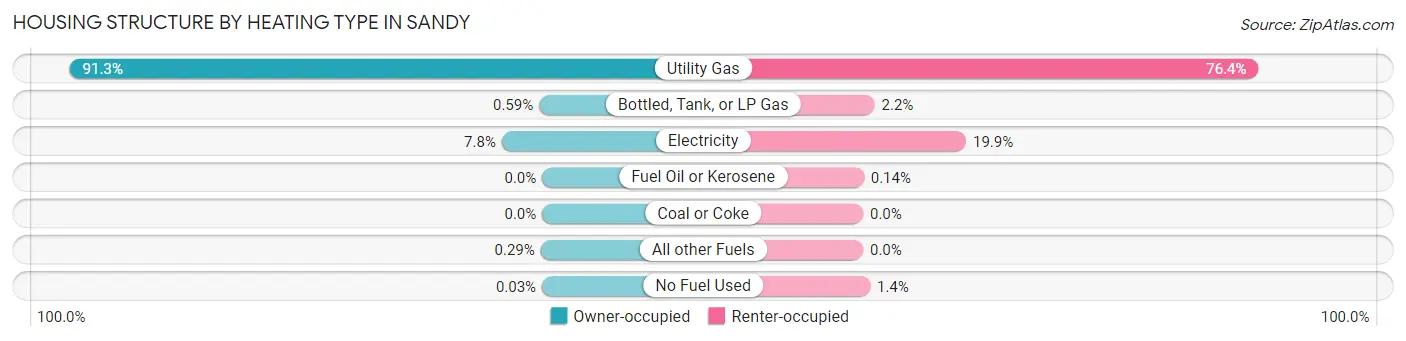
| Heating Type | Owner-occupied | Renter-occupied |
| Utility Gas | 22,857 (91.3%) | 5,888 (76.4%) |
| Bottled, Tank, or LP Gas | 148 (0.6%) | 172 (2.2%) |
| Electricity | 1,953 (7.8%) | 1,534 (19.9%) |
| Fuel Oil or Kerosene | 0 (0.0%) | 11 (0.1%) |
| Coal or Coke | 0 (0.0%) | 0 (0.0%) |
| All other Fuels | 73 (0.3%) | 0 (0.0%) |
| No Fuel Used | 7 (0.0%) | 104 (1.3%) |
| Total | 25,038 (100.0%) | 7,709 (100.0%) |
Household Vehicle Usage in Sandy
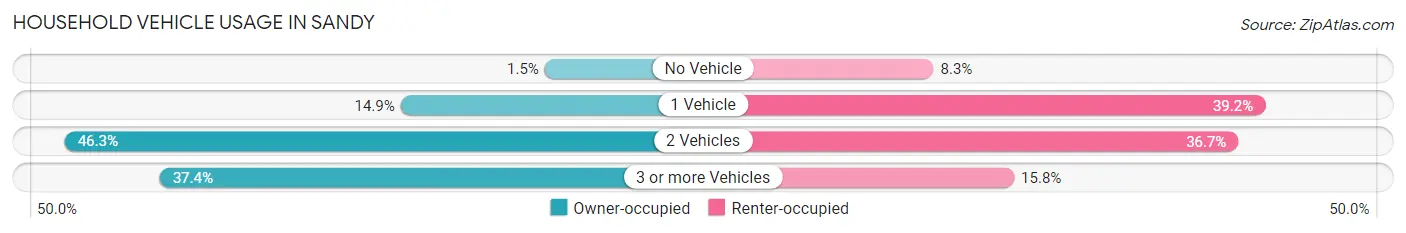
| Vehicles per Household | Owner-occupied | Renter-occupied |
| No Vehicle | 364 (1.5%) | 638 (8.3%) |
| 1 Vehicle | 3,734 (14.9%) | 3,023 (39.2%) |
| 2 Vehicles | 11,581 (46.3%) | 2,830 (36.7%) |
| 3 or more Vehicles | 9,359 (37.4%) | 1,218 (15.8%) |
| Total | 25,038 (100.0%) | 7,709 (100.0%) |
Real Estate & Mortgages in Sandy
Real Estate and Mortgage Overview in Sandy
| Characteristic | Without Mortgage | With Mortgage |
| Housing Units | 8,061 | 16,977 |
| Median Property Value | $487,300 | $494,400 |
| Median Household Income | $93,272 | $7,440 |
| Monthly Housing Costs | $555 | $2,676 |
| Real Estate Taxes | $2,735 | $279 |
Property Value by Mortgage Status in Sandy
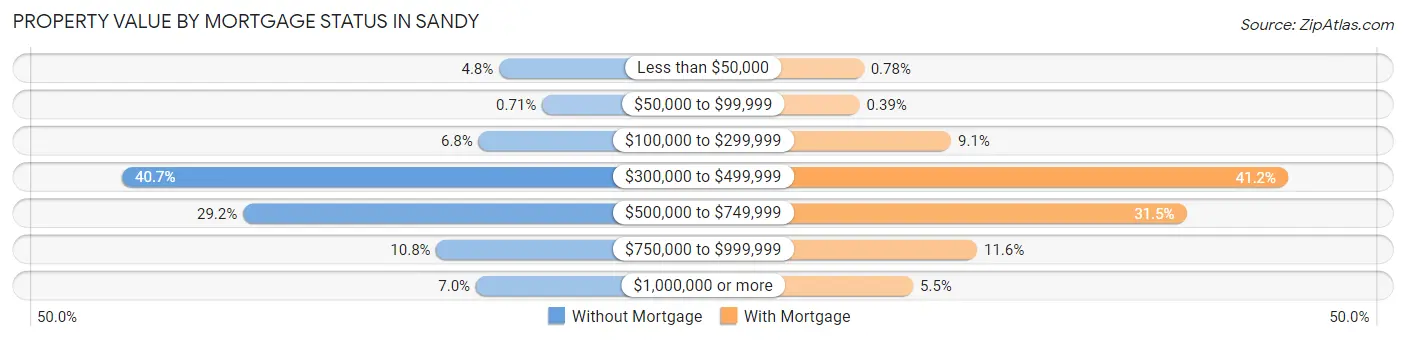
| Property Value | Without Mortgage | With Mortgage |
| Less than $50,000 | 388 (4.8%) | 133 (0.8%) |
| $50,000 to $99,999 | 57 (0.7%) | 66 (0.4%) |
| $100,000 to $299,999 | 545 (6.8%) | 1,545 (9.1%) |
| $300,000 to $499,999 | 3,282 (40.7%) | 6,989 (41.2%) |
| $500,000 to $749,999 | 2,354 (29.2%) | 5,349 (31.5%) |
| $750,000 to $999,999 | 869 (10.8%) | 1,964 (11.6%) |
| $1,000,000 or more | 566 (7.0%) | 931 (5.5%) |
| Total | 8,061 (100.0%) | 16,977 (100.0%) |
Household Income by Mortgage Status in Sandy
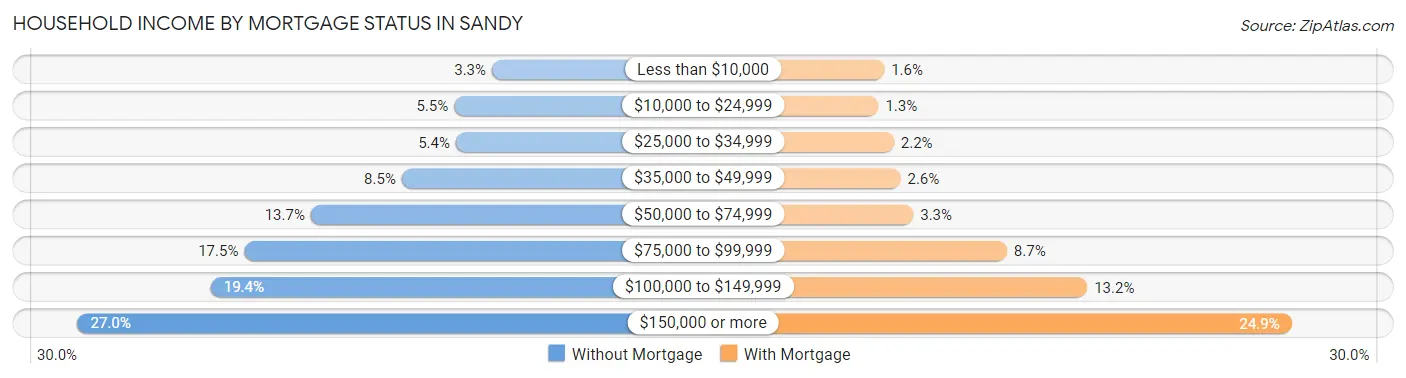
| Household Income | Without Mortgage | With Mortgage |
| Less than $10,000 | 266 (3.3%) | 278 (1.6%) |
| $10,000 to $24,999 | 440 (5.5%) | 222 (1.3%) |
| $25,000 to $34,999 | 432 (5.4%) | 371 (2.2%) |
| $35,000 to $49,999 | 681 (8.5%) | 437 (2.6%) |
| $50,000 to $74,999 | 1,100 (13.7%) | 561 (3.3%) |
| $75,000 to $99,999 | 1,407 (17.4%) | 1,469 (8.6%) |
| $100,000 to $149,999 | 1,561 (19.4%) | 2,248 (13.2%) |
| $150,000 or more | 2,174 (27.0%) | 4,229 (24.9%) |
| Total | 8,061 (100.0%) | 16,977 (100.0%) |
Property Value to Household Income Ratio in Sandy
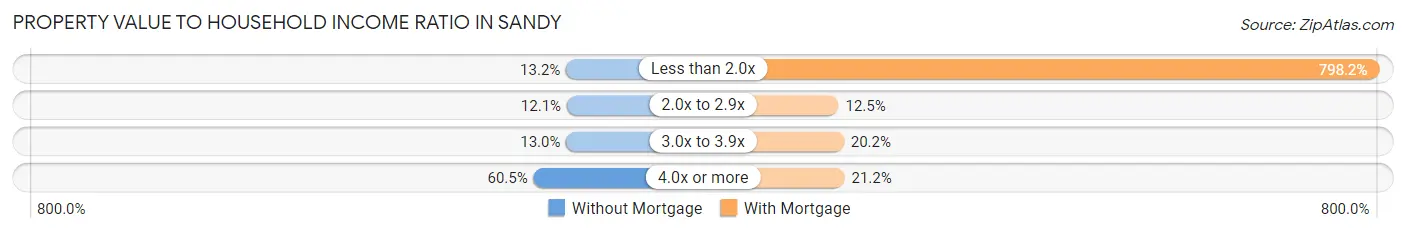
| Value-to-Income Ratio | Without Mortgage | With Mortgage |
| Less than 2.0x | 1,062 (13.2%) | 135,504 (798.2%) |
| 2.0x to 2.9x | 973 (12.1%) | 2,123 (12.5%) |
| 3.0x to 3.9x | 1,048 (13.0%) | 3,426 (20.2%) |
| 4.0x or more | 4,877 (60.5%) | 3,601 (21.2%) |
| Total | 8,061 (100.0%) | 16,977 (100.0%) |
Real Estate Taxes by Mortgage Status in Sandy
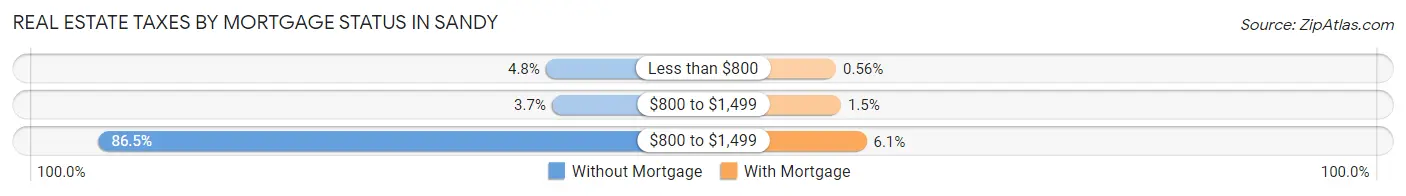
| Property Taxes | Without Mortgage | With Mortgage |
| Less than $800 | 390 (4.8%) | 95 (0.6%) |
| $800 to $1,499 | 300 (3.7%) | 246 (1.5%) |
| $800 to $1,499 | 6,971 (86.5%) | 1,039 (6.1%) |
| Total | 8,061 (100.0%) | 16,977 (100.0%) |
Health & Disability in Sandy
Health Insurance Coverage by Age in Sandy
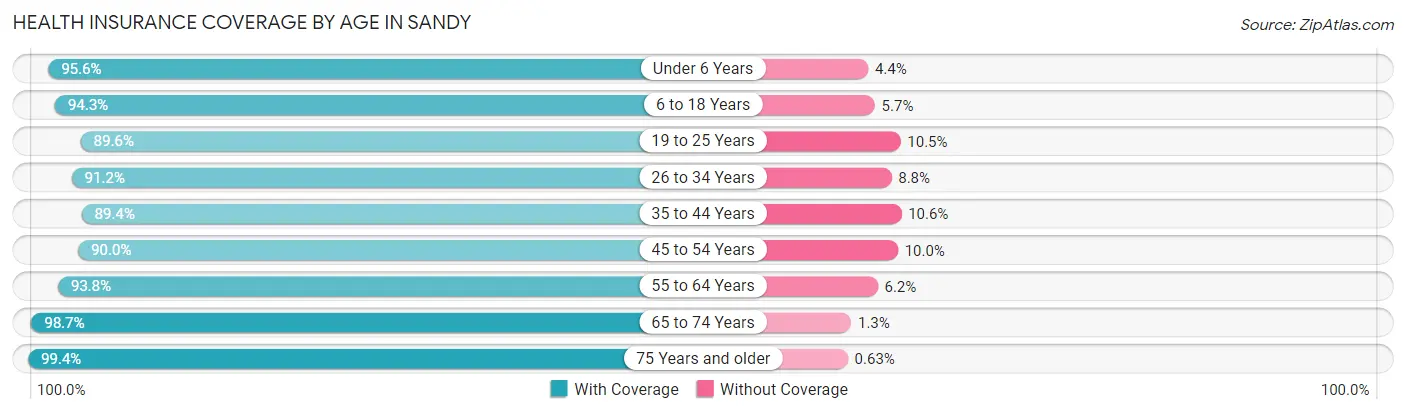
| Age Bracket | With Coverage | Without Coverage |
| Under 6 Years | 7,088 (95.6%) | 327 (4.4%) |
| 6 to 18 Years | 17,171 (94.3%) | 1,030 (5.7%) |
| 19 to 25 Years | 6,679 (89.5%) | 779 (10.4%) |
| 26 to 34 Years | 10,748 (91.2%) | 1,032 (8.8%) |
| 35 to 44 Years | 12,039 (89.4%) | 1,429 (10.6%) |
| 45 to 54 Years | 10,305 (90.0%) | 1,140 (10.0%) |
| 55 to 64 Years | 10,885 (93.8%) | 719 (6.2%) |
| 65 to 74 Years | 8,835 (98.7%) | 113 (1.3%) |
| 75 Years and older | 5,011 (99.4%) | 32 (0.6%) |
| Total | 88,761 (93.1%) | 6,601 (6.9%) |
Health Insurance Coverage by Citizenship Status in Sandy
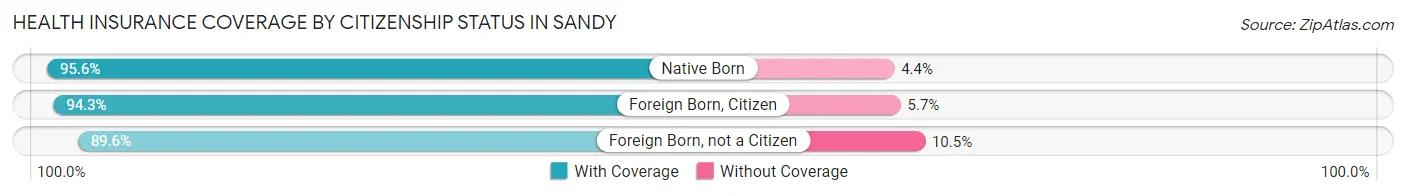
| Citizenship Status | With Coverage | Without Coverage |
| Native Born | 7,088 (95.6%) | 327 (4.4%) |
| Foreign Born, Citizen | 17,171 (94.3%) | 1,030 (5.7%) |
| Foreign Born, not a Citizen | 6,679 (89.5%) | 779 (10.4%) |
Health Insurance Coverage by Household Income in Sandy
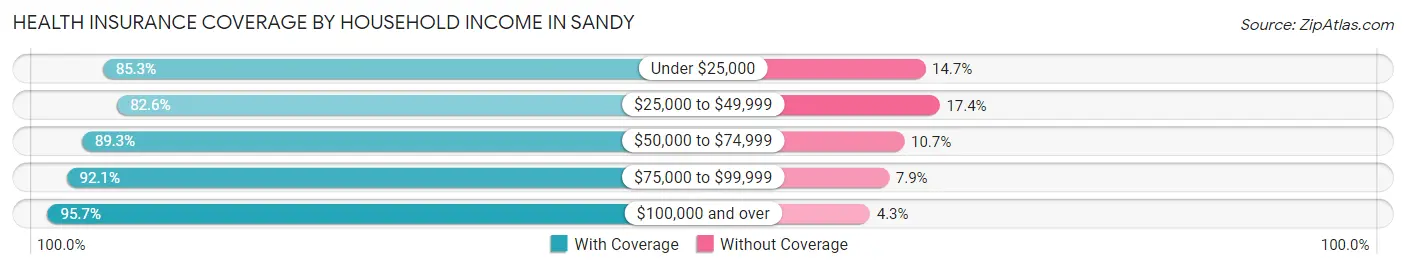
| Household Income | With Coverage | Without Coverage |
| Under $25,000 | 2,876 (85.3%) | 494 (14.7%) |
| $25,000 to $49,999 | 6,503 (82.6%) | 1,366 (17.4%) |
| $50,000 to $74,999 | 9,044 (89.3%) | 1,086 (10.7%) |
| $75,000 to $99,999 | 12,204 (92.1%) | 1,044 (7.9%) |
| $100,000 and over | 57,935 (95.7%) | 2,607 (4.3%) |
Public vs Private Health Insurance Coverage by Age in Sandy
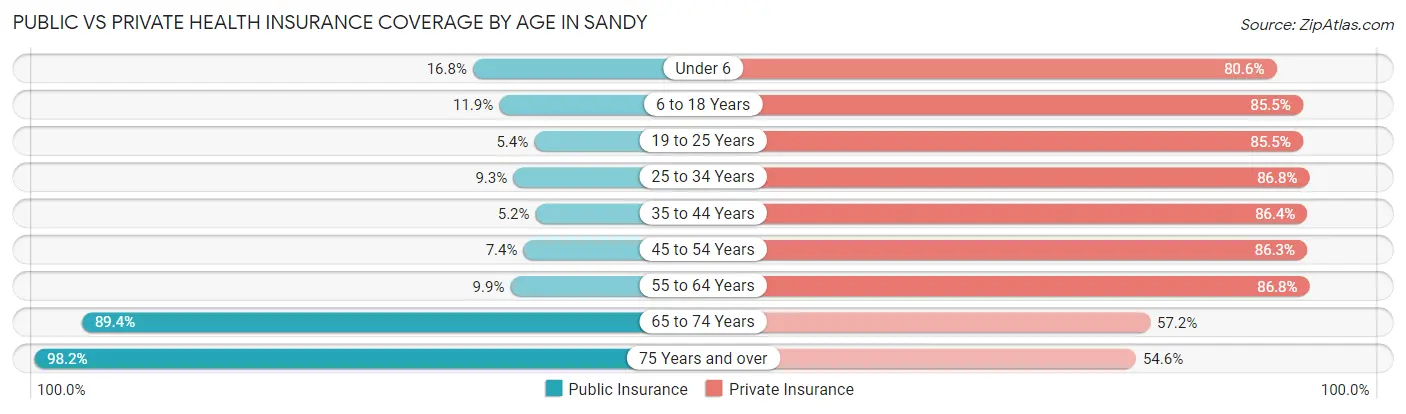
| Age Bracket | Public Insurance | Private Insurance |
| Under 6 | 1,247 (16.8%) | 5,979 (80.6%) |
| 6 to 18 Years | 2,174 (11.9%) | 15,565 (85.5%) |
| 19 to 25 Years | 406 (5.4%) | 6,378 (85.5%) |
| 25 to 34 Years | 1,100 (9.3%) | 10,220 (86.8%) |
| 35 to 44 Years | 699 (5.2%) | 11,634 (86.4%) |
| 45 to 54 Years | 851 (7.4%) | 9,879 (86.3%) |
| 55 to 64 Years | 1,144 (9.9%) | 10,070 (86.8%) |
| 65 to 74 Years | 7,999 (89.4%) | 5,120 (57.2%) |
| 75 Years and over | 4,953 (98.2%) | 2,754 (54.6%) |
| Total | 20,573 (21.6%) | 77,599 (81.4%) |
Disability Status by Sex by Age in Sandy
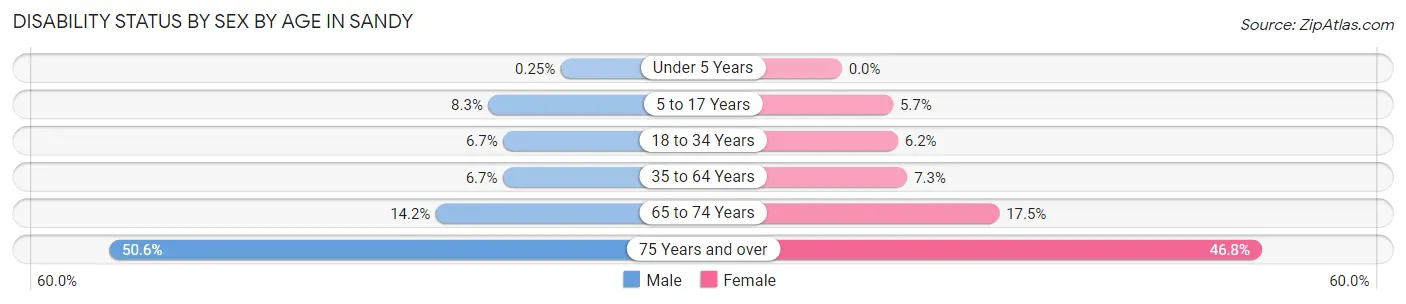
| Age Bracket | Male | Female |
| Under 5 Years | 9 (0.3%) | 0 (0.0%) |
| 5 to 17 Years | 821 (8.3%) | 491 (5.7%) |
| 18 to 34 Years | 699 (6.7%) | 607 (6.2%) |
| 35 to 64 Years | 1,204 (6.7%) | 1,350 (7.3%) |
| 65 to 74 Years | 595 (14.2%) | 832 (17.5%) |
| 75 Years and over | 1,157 (50.6%) | 1,289 (46.8%) |
Disability Class by Sex by Age in Sandy
Disability Class: Hearing Difficulty
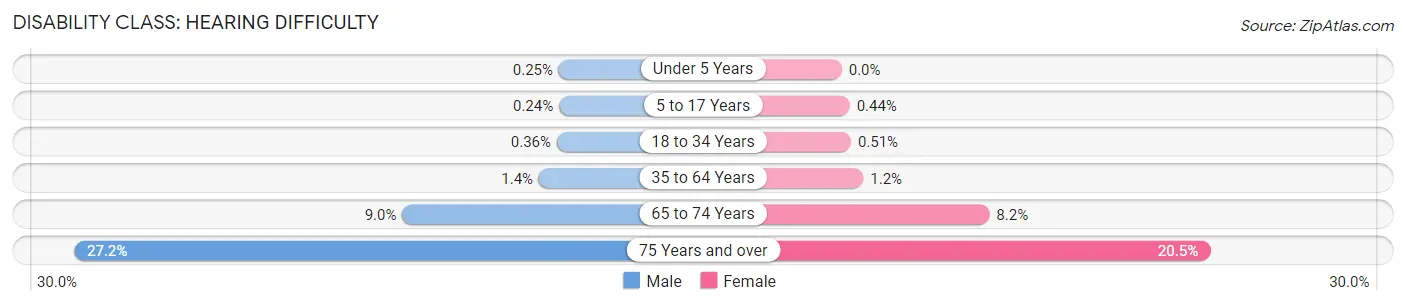
| Age Bracket | Male | Female |
| Under 5 Years | 9 (0.3%) | 0 (0.0%) |
| 5 to 17 Years | 24 (0.2%) | 38 (0.4%) |
| 18 to 34 Years | 38 (0.4%) | 50 (0.5%) |
| 35 to 64 Years | 245 (1.4%) | 223 (1.2%) |
| 65 to 74 Years | 377 (9.0%) | 390 (8.2%) |
| 75 Years and over | 623 (27.2%) | 565 (20.5%) |
Disability Class: Vision Difficulty
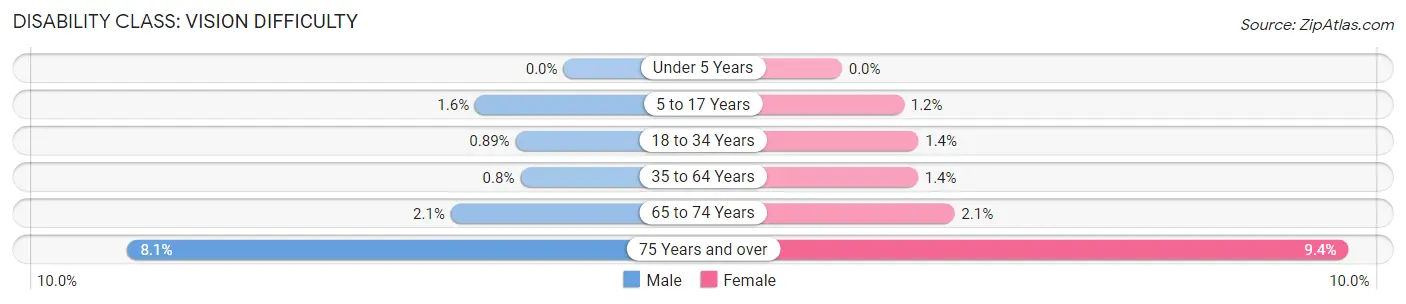
| Age Bracket | Male | Female |
| Under 5 Years | 0 (0.0%) | 0 (0.0%) |
| 5 to 17 Years | 162 (1.6%) | 99 (1.1%) |
| 18 to 34 Years | 93 (0.9%) | 138 (1.4%) |
| 35 to 64 Years | 144 (0.8%) | 261 (1.4%) |
| 65 to 74 Years | 88 (2.1%) | 99 (2.1%) |
| 75 Years and over | 185 (8.1%) | 259 (9.4%) |
Disability Class: Cognitive Difficulty
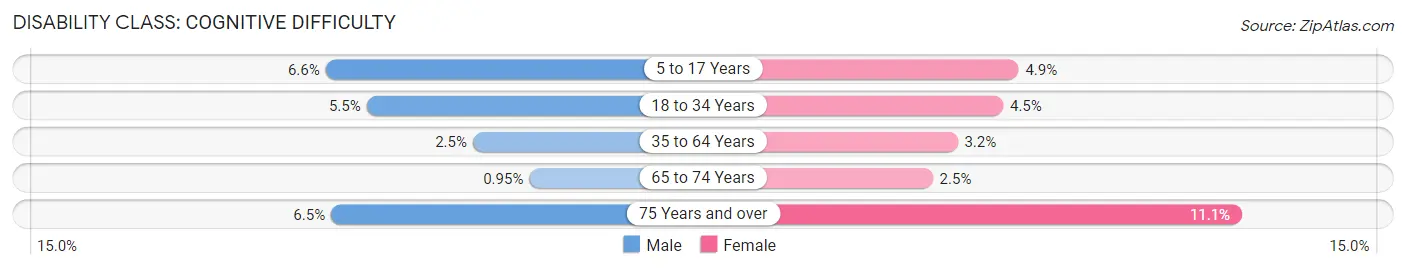
| Age Bracket | Male | Female |
| 5 to 17 Years | 654 (6.6%) | 424 (4.9%) |
| 18 to 34 Years | 575 (5.5%) | 437 (4.5%) |
| 35 to 64 Years | 453 (2.5%) | 597 (3.2%) |
| 65 to 74 Years | 40 (0.9%) | 120 (2.5%) |
| 75 Years and over | 148 (6.5%) | 307 (11.1%) |
Disability Class: Ambulatory Difficulty
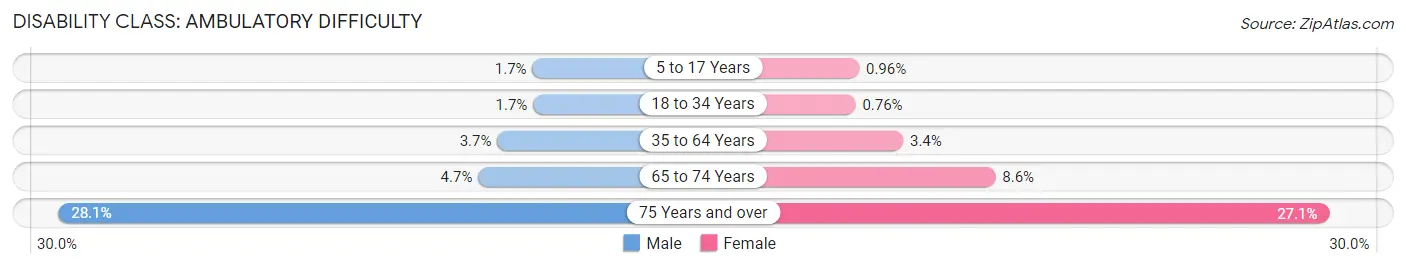
| Age Bracket | Male | Female |
| 5 to 17 Years | 170 (1.7%) | 83 (1.0%) |
| 18 to 34 Years | 176 (1.7%) | 74 (0.8%) |
| 35 to 64 Years | 663 (3.7%) | 632 (3.4%) |
| 65 to 74 Years | 199 (4.7%) | 406 (8.6%) |
| 75 Years and over | 643 (28.1%) | 748 (27.1%) |
Disability Class: Self-Care Difficulty
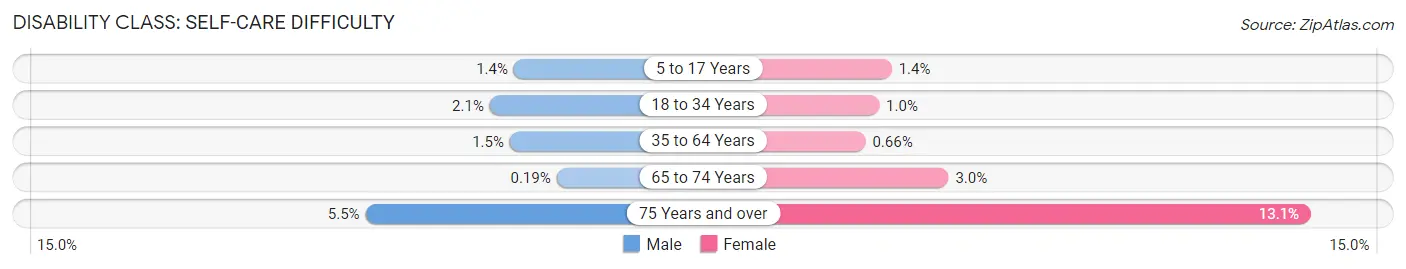
| Age Bracket | Male | Female |
| 5 to 17 Years | 136 (1.4%) | 120 (1.4%) |
| 18 to 34 Years | 215 (2.1%) | 101 (1.0%) |
| 35 to 64 Years | 268 (1.5%) | 123 (0.7%) |
| 65 to 74 Years | 8 (0.2%) | 141 (3.0%) |
| 75 Years and over | 126 (5.5%) | 360 (13.1%) |
Technology Access in Sandy
Computing Device Access in Sandy
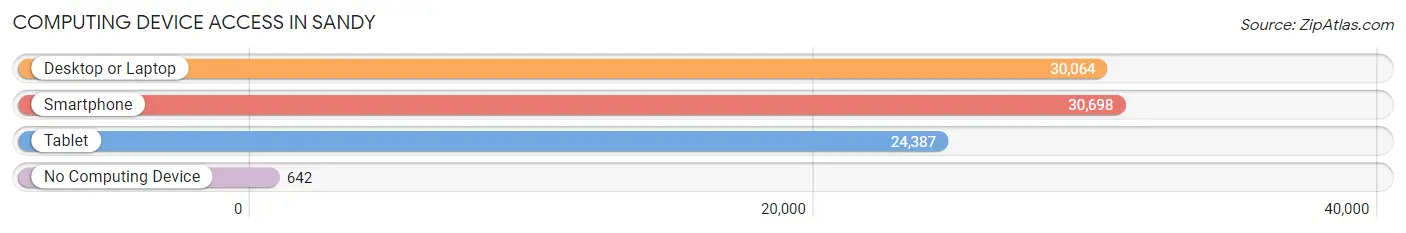
| Device Type | # Households | % Households |
| Desktop or Laptop | 30,064 | 91.8% |
| Smartphone | 30,698 | 93.7% |
| Tablet | 24,387 | 74.5% |
| No Computing Device | 642 | 2.0% |
| Total | 32,747 | 100.0% |
Internet Access in Sandy
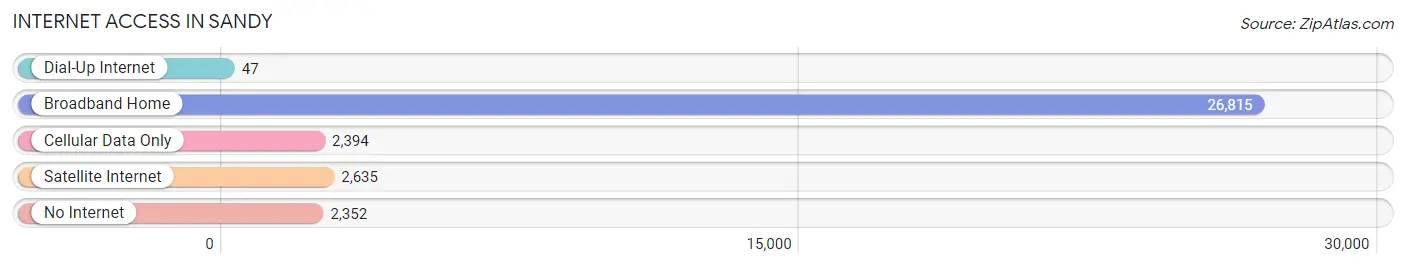
| Internet Type | # Households | % Households |
| Dial-Up Internet | 47 | 0.1% |
| Broadband Home | 26,815 | 81.9% |
| Cellular Data Only | 2,394 | 7.3% |
| Satellite Internet | 2,635 | 8.1% |
| No Internet | 2,352 | 7.2% |
| Total | 32,747 | 100.0% |
Sandy Summary
Sandy, Utah is a city located in Salt Lake County, Utah, United States. It is part of the Salt Lake City metropolitan area. The population was 87,461 at the 2010 census, making it the sixth-largest city in Utah. Sandy is home to the Shops at South Town shopping mall, the Jordan Commons entertainment and dining complex, and the South Towne Exposition Center.
History
Sandy was first settled in 1848 by Mormon pioneers, who named it after the nearby Sandy Creek. The area was originally known as South Jordan, but was later changed to Sandy. The city was incorporated in 1893 and has grown steadily since then.
Geography
Sandy is located in the foothills of the Wasatch Mountains, at the base of the Oquirrh Mountains. It is bordered by the cities of Draper to the south, Midvale to the west, and South Jordan to the north. The city covers an area of approximately 33 square miles.
Climate
Sandy has a semi-arid climate, with hot summers and cold winters. The average annual temperature is 46°F, with an average high of 79°F in July and an average low of 24°F in January. The average annual precipitation is 17.5 inches.
Economy
Sandy is home to several major employers, including the Kennecott Utah Copper mine, the South Towne Exposition Center, and the Shops at South Town shopping mall. The city is also home to several technology companies, including Adobe, eBay, and Oracle.
Demographics
As of the 2010 census, there were 87,461 people, 28,845 households, and 21,945 families residing in the city. The population density was 2,637.3 people per square mile. The racial makeup of the city was 84.2% White, 2.2% African American, 0.7% Native American, 4.3% Asian, 0.2% Pacific Islander, 5.2% from other races, and 3.2% from two or more races. Hispanic or Latino of any race were 11.2% of the population.
The median income for a household in the city was $63,945, and the median income for a family was $71,945. The per capita income for the city was $27,945. About 4.2% of families and 5.7% of the population were below the poverty line, including 6.7% of those under age 18 and 4.2% of those age 65 or over.
Common Questions
What is Per Capita Income in Sandy?
Per Capita income in Sandy is $47,480.
What is the Median Family Income in Sandy?
Median Family Income in Sandy is $118,774.
What is the Median Household income in Sandy?
Median Household Income in Sandy is $108,165.
What is Income or Wage Gap in Sandy?
Income or Wage Gap in Sandy is 39.1%.
Women in Sandy earn 60.9 cents for every dollar earned by a man.
What is Family Income Deficit in Sandy?
Family Income Deficit in Sandy is $11,411.
Families that are below poverty line in Sandy earn $11,411 less on average than the poverty threshold level.
What is Inequality or Gini Index in Sandy?
Inequality or Gini Index in Sandy is 0.40.
What is the Total Population of Sandy?
Total Population of Sandy is 95,635.
What is the Total Male Population of Sandy?
Total Male Population of Sandy is 48,607.
What is the Total Female Population of Sandy?
Total Female Population of Sandy is 47,028.
What is the Ratio of Males per 100 Females in Sandy?
There are 103.36 Males per 100 Females in Sandy.
What is the Ratio of Females per 100 Males in Sandy?
There are 96.75 Females per 100 Males in Sandy.
What is the Median Population Age in Sandy?
Median Population Age in Sandy is 36.9 Years.
What is the Average Family Size in Sandy
Average Family Size in Sandy is 3.3 People.
What is the Average Household Size in Sandy
Average Household Size in Sandy is 2.9 People.
How Large is the Labor Force in Sandy?
There are 51,460 People in the Labor Forcein in Sandy.
What is the Percentage of People in the Labor Force in Sandy?
69.7% of People are in the Labor Force in Sandy.
What is the Unemployment Rate in Sandy?
Unemployment Rate in Sandy is 2.2%.