Rancho Cordova, CA Map & Demographics
Rancho Cordova Map
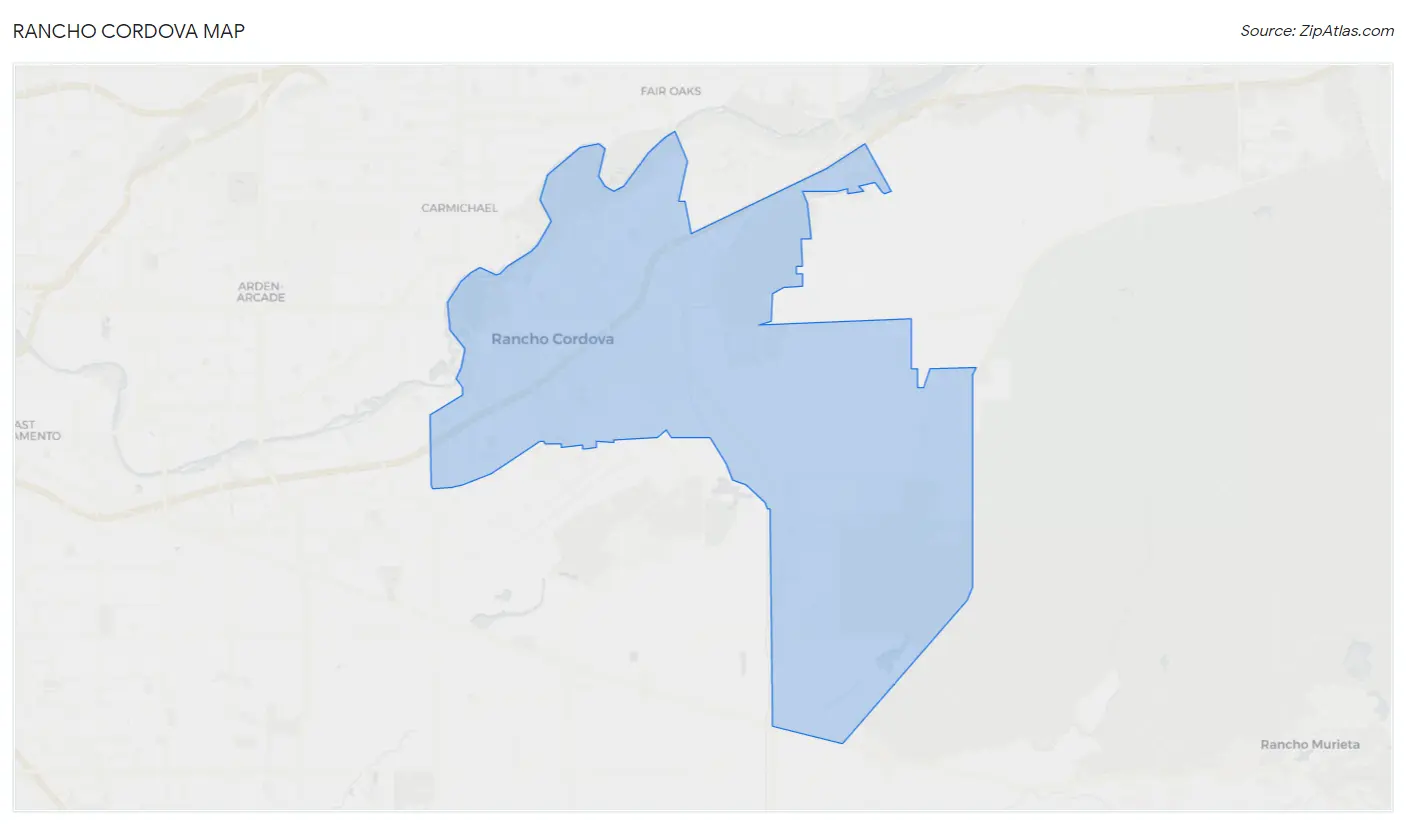
Rancho Cordova Overview
$36,124
PER CAPITA INCOME
$95,550
AVG FAMILY INCOME
$85,099
AVG HOUSEHOLD INCOME
19.2%
WAGE / INCOME GAP [ % ]
80.8¢/ $1
WAGE / INCOME GAP [ $ ]
$11,857
FAMILY INCOME DEFICIT
0.40
INEQUALITY / GINI INDEX
79,128
TOTAL POPULATION
38,727
MALE POPULATION
40,401
FEMALE POPULATION
95.86
MALES / 100 FEMALES
104.32
FEMALES / 100 MALES
35.4
MEDIAN AGE
3.5
AVG FAMILY SIZE
2.9
AVG HOUSEHOLD SIZE
40,013
LABOR FORCE [ PEOPLE ]
65.7%
PERCENT IN LABOR FORCE
6.1%
UNEMPLOYMENT RATE
Rancho Cordova Area Codes
Income in Rancho Cordova
Income Overview in Rancho Cordova
Per Capita Income in Rancho Cordova is $36,124, while median incomes of families and households are $95,550 and $85,099 respectively.
| Characteristic | Number | Measure |
| Per Capita Income | 79,128 | $36,124 |
| Median Family Income | 18,749 | $95,550 |
| Mean Family Income | 18,749 | $112,438 |
| Median Household Income | 27,339 | $85,099 |
| Mean Household Income | 27,339 | $102,229 |
| Income Deficit | 18,749 | $11,857 |
| Wage / Income Gap (%) | 79,128 | 19.25% |
| Wage / Income Gap ($) | 79,128 | 80.75¢ per $1 |
| Gini / Inequality Index | 79,128 | 0.40 |
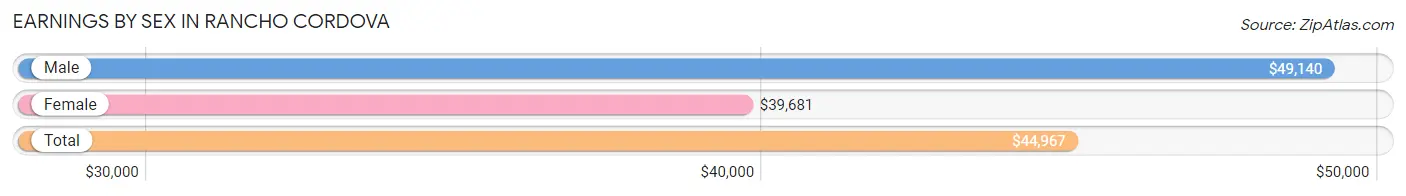
Earnings by Sex in Rancho Cordova
Average Earnings in Rancho Cordova are $44,967, $49,140 for men and $39,681 for women, a difference of 19.3%.
| Sex | Number | Average Earnings |
| Male | 21,145 (51.8%) | $49,140 |
| Female | 19,686 (48.2%) | $39,681 |
| Total | 40,831 (100.0%) | $44,967 |
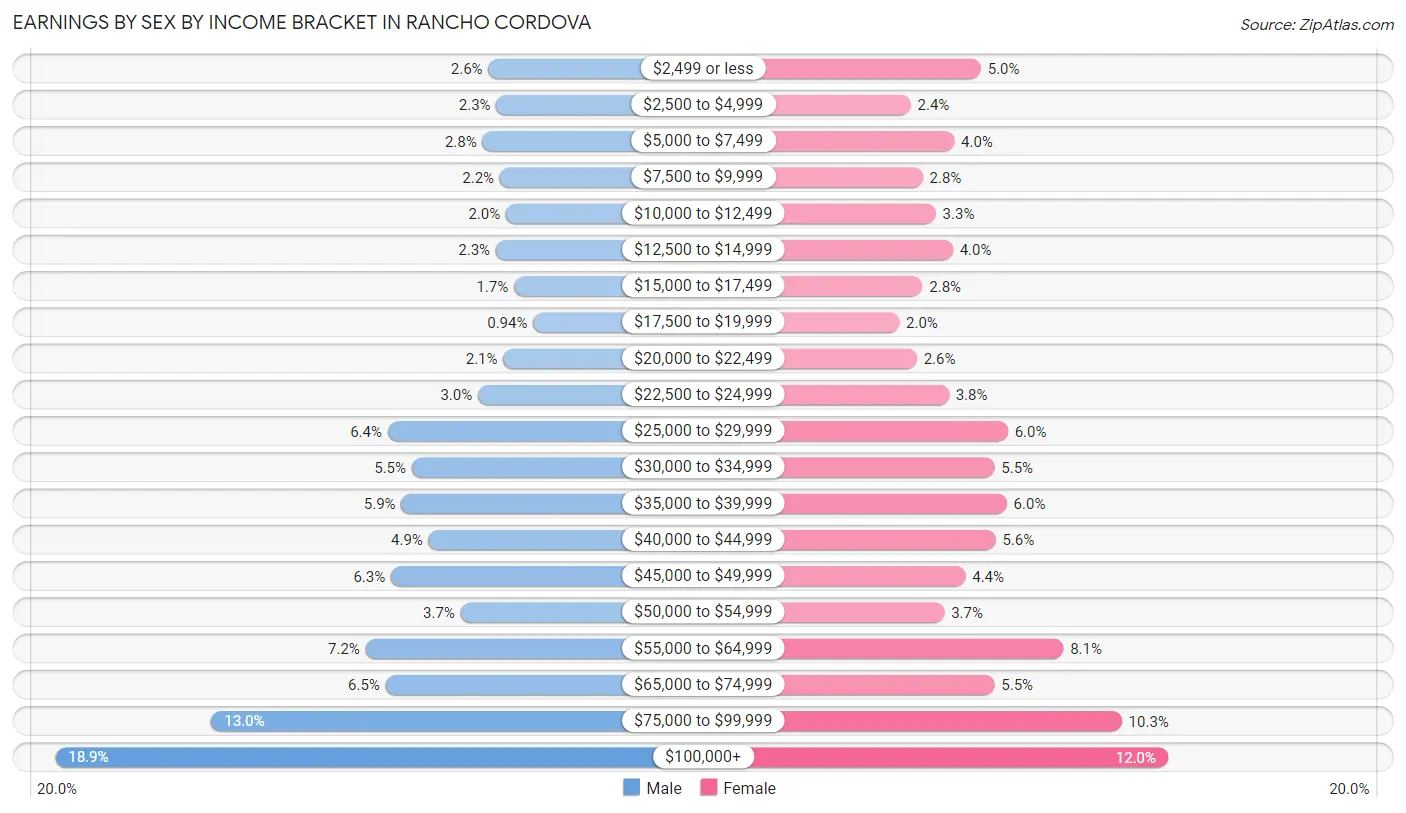
Earnings by Sex by Income Bracket in Rancho Cordova
The most common earnings brackets in Rancho Cordova are $100,000+ for men (3,986 | 18.9%) and $100,000+ for women (2,369 | 12.0%).
| Income | Male | Female |
| $2,499 or less | 553 (2.6%) | 988 (5.0%) |
| $2,500 to $4,999 | 490 (2.3%) | 471 (2.4%) |
| $5,000 to $7,499 | 600 (2.8%) | 791 (4.0%) |
| $7,500 to $9,999 | 463 (2.2%) | 560 (2.8%) |
| $10,000 to $12,499 | 414 (2.0%) | 656 (3.3%) |
| $12,500 to $14,999 | 494 (2.3%) | 782 (4.0%) |
| $15,000 to $17,499 | 350 (1.7%) | 557 (2.8%) |
| $17,500 to $19,999 | 199 (0.9%) | 386 (2.0%) |
| $20,000 to $22,499 | 435 (2.1%) | 516 (2.6%) |
| $22,500 to $24,999 | 637 (3.0%) | 752 (3.8%) |
| $25,000 to $29,999 | 1,352 (6.4%) | 1,188 (6.0%) |
| $30,000 to $34,999 | 1,160 (5.5%) | 1,088 (5.5%) |
| $35,000 to $39,999 | 1,243 (5.9%) | 1,179 (6.0%) |
| $40,000 to $44,999 | 1,027 (4.9%) | 1,097 (5.6%) |
| $45,000 to $49,999 | 1,325 (6.3%) | 875 (4.4%) |
| $50,000 to $54,999 | 773 (3.7%) | 719 (3.6%) |
| $55,000 to $64,999 | 1,527 (7.2%) | 1,597 (8.1%) |
| $65,000 to $74,999 | 1,369 (6.5%) | 1,088 (5.5%) |
| $75,000 to $99,999 | 2,748 (13.0%) | 2,027 (10.3%) |
| $100,000+ | 3,986 (18.9%) | 2,369 (12.0%) |
| Total | 21,145 (100.0%) | 19,686 (100.0%) |
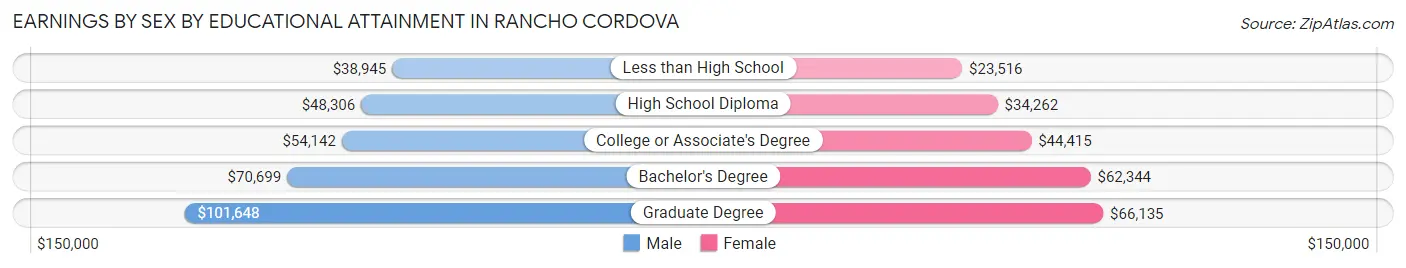
Earnings by Sex by Educational Attainment in Rancho Cordova
Average earnings in Rancho Cordova are $55,517 for men and $44,646 for women, a difference of 19.6%. Men with an educational attainment of graduate degree enjoy the highest average annual earnings of $101,648, while those with less than high school education earn the least with $38,945. Women with an educational attainment of graduate degree earn the most with the average annual earnings of $66,135, while those with less than high school education have the smallest earnings of $23,516.
| Educational Attainment | Male Income | Female Income |
| Less than High School | $38,945 | $23,516 |
| High School Diploma | $48,306 | $34,262 |
| College or Associate's Degree | $54,142 | $44,415 |
| Bachelor's Degree | $70,699 | $62,344 |
| Graduate Degree | $101,648 | $66,135 |
| Total | $55,517 | $44,646 |
Family Income in Rancho Cordova
Family Income Brackets in Rancho Cordova
According to the Rancho Cordova family income data, there are 4,406 families falling into the $100,000 to $149,999 income range, which is the most common income bracket and makes up 23.5% of all families. Conversely, the $10,000 to $14,999 income bracket is the least frequent group with only 131 families (0.7%) belonging to this category.
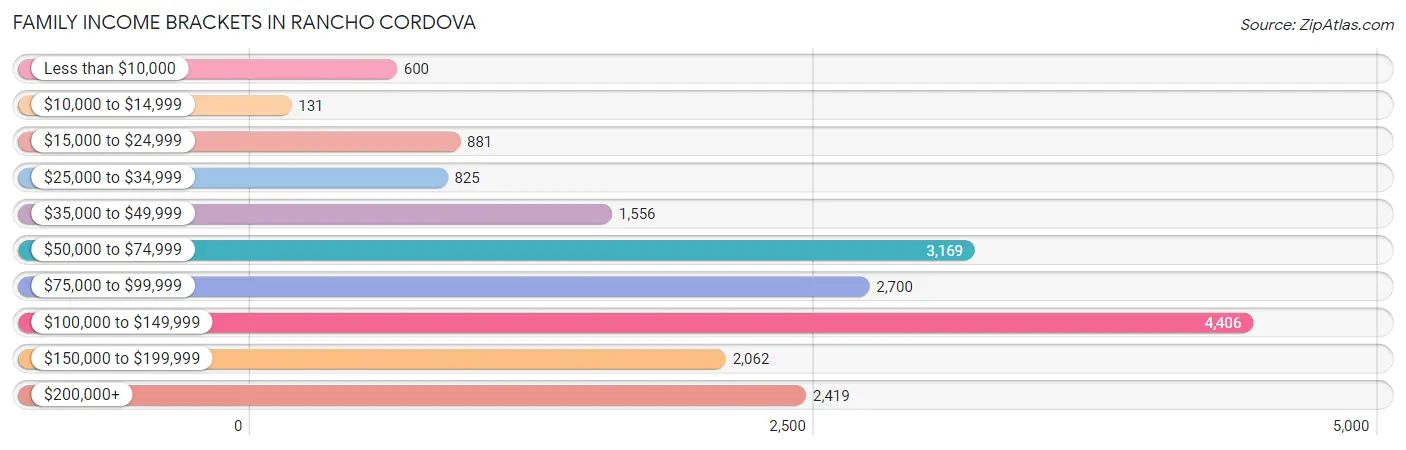
| Income Bracket | # Families | % Families |
| Less than $10,000 | 600 | 3.2% |
| $10,000 to $14,999 | 131 | 0.7% |
| $15,000 to $24,999 | 881 | 4.7% |
| $25,000 to $34,999 | 825 | 4.4% |
| $35,000 to $49,999 | 1,556 | 8.3% |
| $50,000 to $74,999 | 3,169 | 16.9% |
| $75,000 to $99,999 | 2,700 | 14.4% |
| $100,000 to $149,999 | 4,406 | 23.5% |
| $150,000 to $199,999 | 2,062 | 11.0% |
| $200,000+ | 2,419 | 12.9% |
Family Income by Famaliy Size in Rancho Cordova
7+ person families (666 | 3.5%) account for the highest median family income in Rancho Cordova with $115,263 per family, while 2-person families (7,040 | 37.6%) have the highest median income of $44,476 per family member.
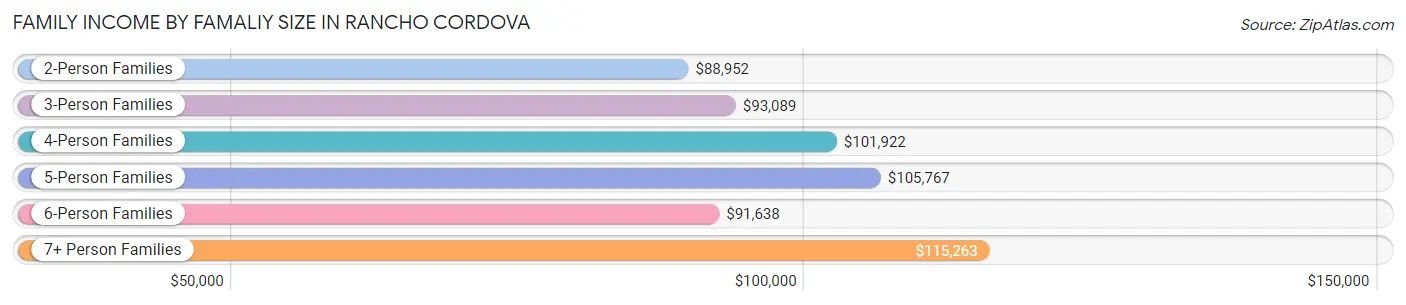
| Income Bracket | # Families | Median Income |
| 2-Person Families | 7,040 (37.6%) | $88,952 |
| 3-Person Families | 4,093 (21.8%) | $93,089 |
| 4-Person Families | 3,680 (19.6%) | $101,922 |
| 5-Person Families | 2,506 (13.4%) | $105,767 |
| 6-Person Families | 764 (4.1%) | $91,638 |
| 7+ Person Families | 666 (3.5%) | $115,263 |
| Total | 18,749 (100.0%) | $95,550 |
Family Income by Number of Earners in Rancho Cordova
The median family income in Rancho Cordova is $95,550, with families comprising 3+ earners (2,723) having the highest median family income of $131,250, while families with no earners (2,058) have the lowest median family income of $51,625, accounting for 14.5% and 11.0% of families, respectively.
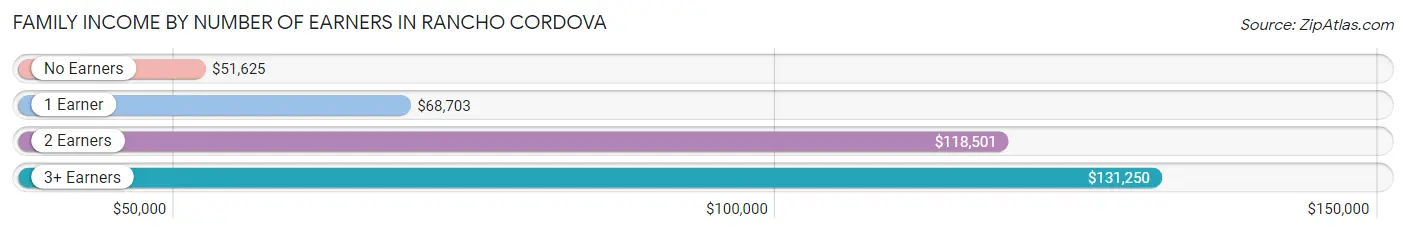
| Number of Earners | # Families | Median Income |
| No Earners | 2,058 (11.0%) | $51,625 |
| 1 Earner | 6,099 (32.5%) | $68,703 |
| 2 Earners | 7,869 (42.0%) | $118,501 |
| 3+ Earners | 2,723 (14.5%) | $131,250 |
| Total | 18,749 (100.0%) | $95,550 |
Household Income in Rancho Cordova
Household Income Brackets in Rancho Cordova
With 6,042 households falling in the category, the $100,000 to $149,999 income range is the most frequent in Rancho Cordova, accounting for 22.1% of all households. In contrast, only 629 households (2.3%) fall into the $10,000 to $14,999 income bracket, making it the least populous group.
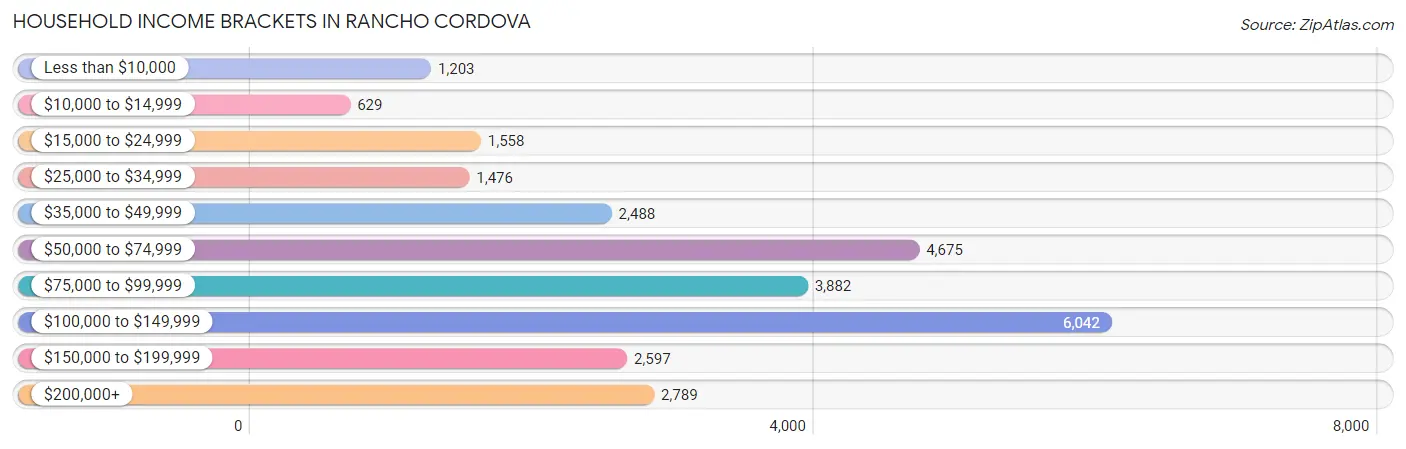
| Income Bracket | # Households | % Households |
| Less than $10,000 | 1,203 | 4.4% |
| $10,000 to $14,999 | 629 | 2.3% |
| $15,000 to $24,999 | 1,558 | 5.7% |
| $25,000 to $34,999 | 1,476 | 5.4% |
| $35,000 to $49,999 | 2,488 | 9.1% |
| $50,000 to $74,999 | 4,675 | 17.1% |
| $75,000 to $99,999 | 3,882 | 14.2% |
| $100,000 to $149,999 | 6,042 | 22.1% |
| $150,000 to $199,999 | 2,597 | 9.5% |
| $200,000+ | 2,789 | 10.2% |
Household Income by Householder Age in Rancho Cordova
The median household income in Rancho Cordova is $85,099, with the highest median household income of $100,049 found in the 45 to 64 years age bracket for the primary householder. A total of 10,143 households (37.1%) fall into this category. Meanwhile, the 65+ years age bracket for the primary householder has the lowest median household income of $61,423, with 5,697 households (20.8%) in this group.
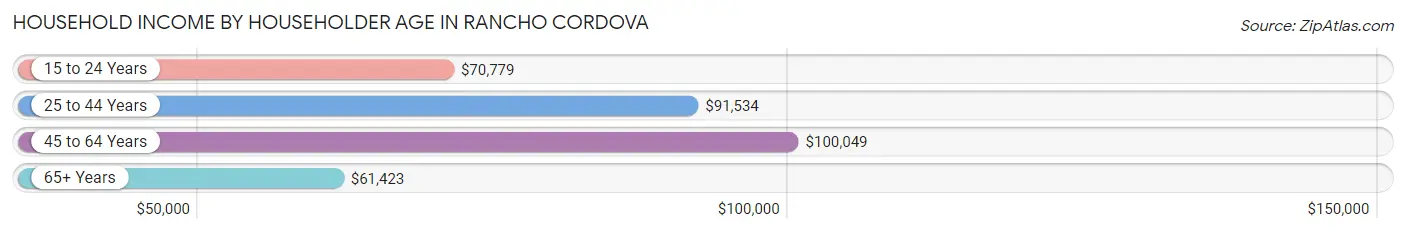
| Income Bracket | # Households | Median Income |
| 15 to 24 Years | 971 (3.5%) | $70,779 |
| 25 to 44 Years | 10,528 (38.5%) | $91,534 |
| 45 to 64 Years | 10,143 (37.1%) | $100,049 |
| 65+ Years | 5,697 (20.8%) | $61,423 |
| Total | 27,339 (100.0%) | $85,099 |
Poverty in Rancho Cordova
Income Below Poverty by Sex and Age in Rancho Cordova
With 10.3% poverty level for males and 12.8% for females among the residents of Rancho Cordova, 15 year old males and 5 year old females are the most vulnerable to poverty, with 166 males (31.9%) and 181 females (21.8%) in their respective age groups living below the poverty level.
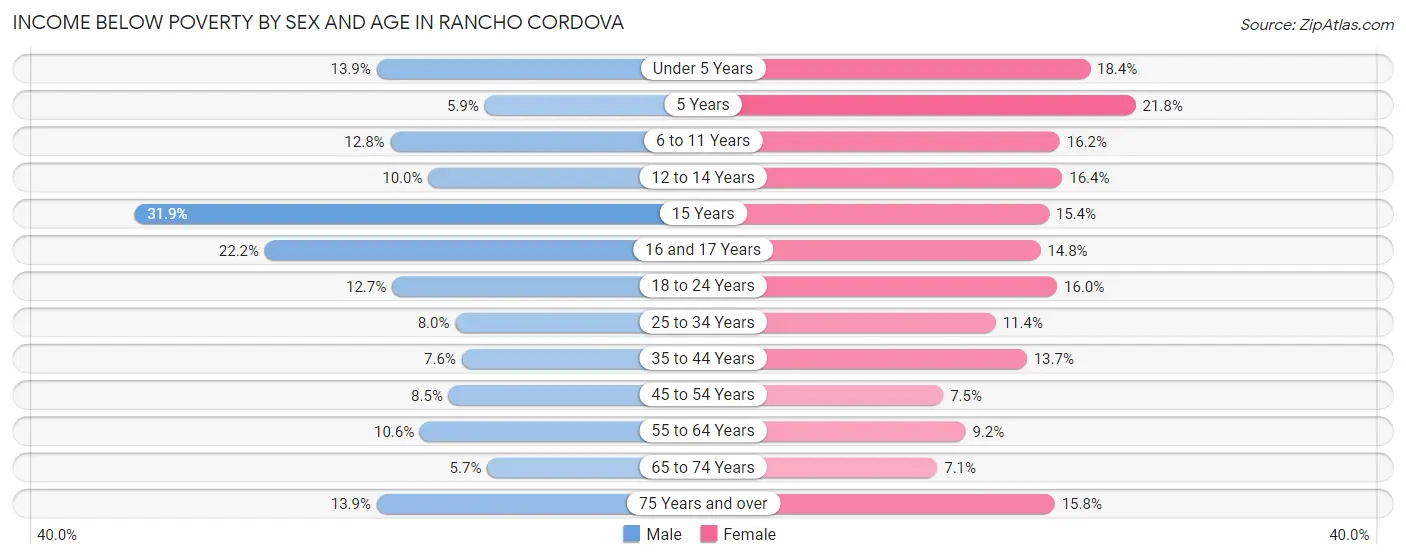
| Age Bracket | Male | Female |
| Under 5 Years | 384 (13.9%) | 539 (18.4%) |
| 5 Years | 23 (5.9%) | 181 (21.8%) |
| 6 to 11 Years | 514 (12.8%) | 444 (16.2%) |
| 12 to 14 Years | 140 (10.0%) | 294 (16.4%) |
| 15 Years | 166 (31.9%) | 101 (15.4%) |
| 16 and 17 Years | 191 (22.2%) | 131 (14.7%) |
| 18 to 24 Years | 359 (12.7%) | 581 (16.0%) |
| 25 to 34 Years | 506 (8.0%) | 710 (11.4%) |
| 35 to 44 Years | 440 (7.5%) | 797 (13.7%) |
| 45 to 54 Years | 411 (8.5%) | 359 (7.5%) |
| 55 to 64 Years | 515 (10.6%) | 414 (9.2%) |
| 65 to 74 Years | 149 (5.7%) | 209 (7.1%) |
| 75 Years and over | 187 (13.9%) | 398 (15.8%) |
| Total | 3,985 (10.3%) | 5,158 (12.8%) |
Income Above Poverty by Sex and Age in Rancho Cordova
According to the poverty statistics in Rancho Cordova, males aged 65 to 74 years and females aged 65 to 74 years are the age groups that are most secure financially, with 94.4% of males and 92.9% of females in these age groups living above the poverty line.
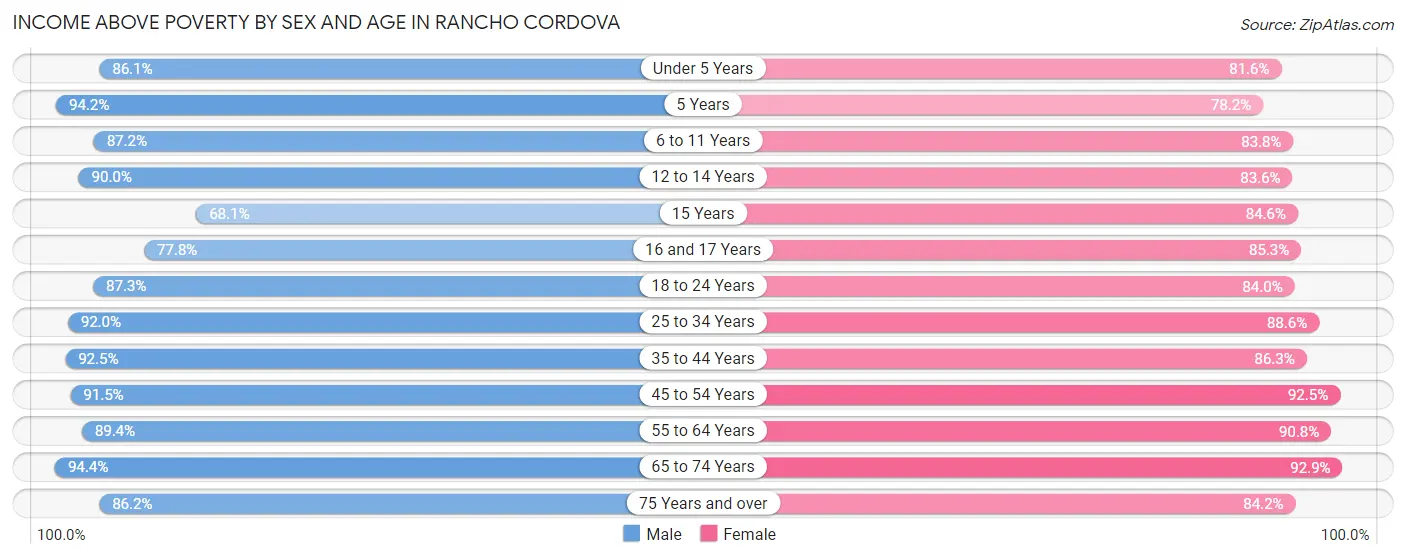
| Age Bracket | Male | Female |
| Under 5 Years | 2,385 (86.1%) | 2,386 (81.6%) |
| 5 Years | 370 (94.2%) | 649 (78.2%) |
| 6 to 11 Years | 3,488 (87.2%) | 2,299 (83.8%) |
| 12 to 14 Years | 1,256 (90.0%) | 1,502 (83.6%) |
| 15 Years | 355 (68.1%) | 556 (84.6%) |
| 16 and 17 Years | 671 (77.8%) | 757 (85.3%) |
| 18 to 24 Years | 2,463 (87.3%) | 3,054 (84.0%) |
| 25 to 34 Years | 5,804 (92.0%) | 5,504 (88.6%) |
| 35 to 44 Years | 5,391 (92.4%) | 5,008 (86.3%) |
| 45 to 54 Years | 4,416 (91.5%) | 4,410 (92.5%) |
| 55 to 64 Years | 4,325 (89.4%) | 4,098 (90.8%) |
| 65 to 74 Years | 2,489 (94.4%) | 2,739 (92.9%) |
| 75 Years and over | 1,163 (86.2%) | 2,120 (84.2%) |
| Total | 34,576 (89.7%) | 35,082 (87.2%) |
Income Below Poverty Among Married-Couple Families in Rancho Cordova
The poverty statistics for married-couple families in Rancho Cordova show that 5.8% or 783 of the total 13,447 families live below the poverty line. Families with 5 or more children have the highest poverty rate of 37.5%, comprising of 123 families. On the other hand, families with no children have the lowest poverty rate of 2.4%, which includes 151 families.
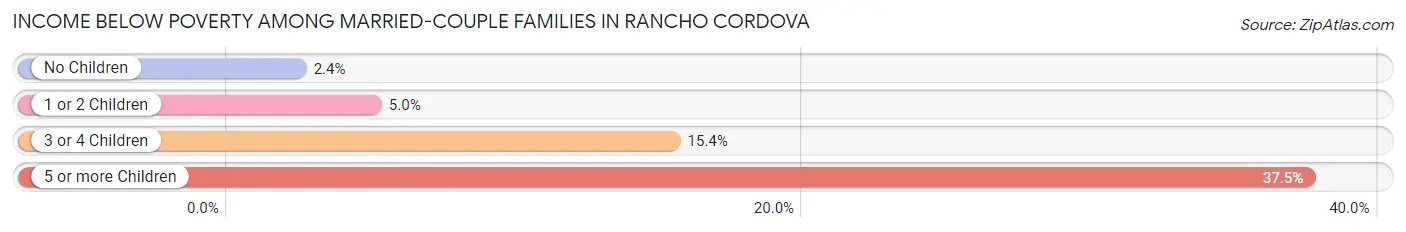
| Children | Above Poverty | Below Poverty |
| No Children | 6,154 (97.6%) | 151 (2.4%) |
| 1 or 2 Children | 4,944 (95.0%) | 261 (5.0%) |
| 3 or 4 Children | 1,361 (84.6%) | 248 (15.4%) |
| 5 or more Children | 205 (62.5%) | 123 (37.5%) |
| Total | 12,664 (94.2%) | 783 (5.8%) |
Income Below Poverty Among Single-Parent Households in Rancho Cordova
According to the poverty data in Rancho Cordova, 10.8% or 170 single-father households and 16.6% or 618 single-mother households are living below the poverty line. Among single-father households, those with 1 or 2 children have the highest poverty rate, with 99 households (13.2%) experiencing poverty. Likewise, among single-mother households, those with 1 or 2 children have the highest poverty rate, with 463 households (26.3%) falling below the poverty line.
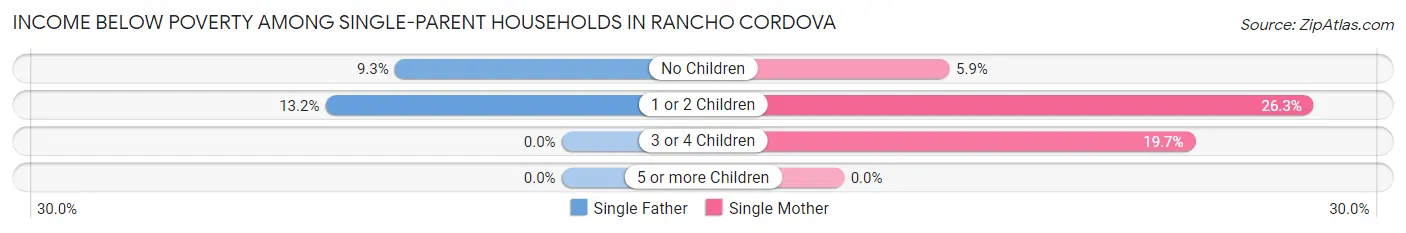
| Children | Single Father | Single Mother |
| No Children | 71 (9.3%) | 99 (5.9%) |
| 1 or 2 Children | 99 (13.2%) | 463 (26.3%) |
| 3 or 4 Children | 0 (0.0%) | 56 (19.7%) |
| 5 or more Children | 0 (0.0%) | 0 (0.0%) |
| Total | 170 (10.8%) | 618 (16.6%) |
Income Below Poverty Among Married-Couple vs Single-Parent Households in Rancho Cordova
The poverty data for Rancho Cordova shows that 783 of the married-couple family households (5.8%) and 788 of the single-parent households (14.9%) are living below the poverty level. Within the married-couple family households, those with 5 or more children have the highest poverty rate, with 123 households (37.5%) falling below the poverty line. Among the single-parent households, those with 1 or 2 children have the highest poverty rate, with 562 household (22.4%) living below poverty.
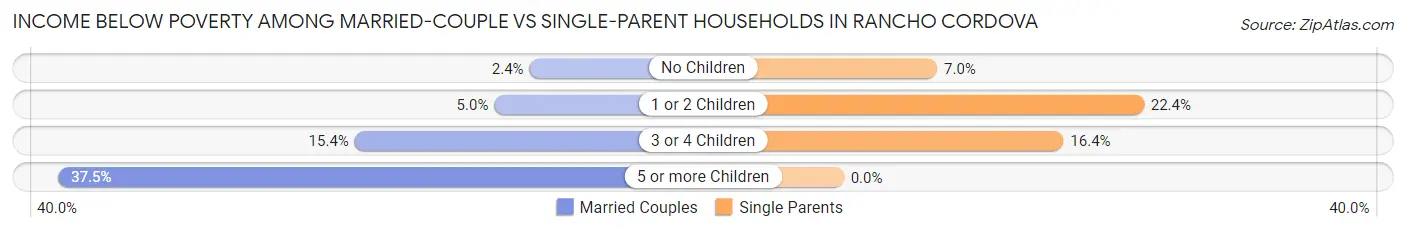
| Children | Married-Couple Families | Single-Parent Households |
| No Children | 151 (2.4%) | 170 (7.0%) |
| 1 or 2 Children | 261 (5.0%) | 562 (22.4%) |
| 3 or 4 Children | 248 (15.4%) | 56 (16.4%) |
| 5 or more Children | 123 (37.5%) | 0 (0.0%) |
| Total | 783 (5.8%) | 788 (14.9%) |
Race in Rancho Cordova
The most populous races in Rancho Cordova are White / Caucasian (41,271 | 52.2%), Hispanic or Latino (16,959 | 21.4%), and Asian (11,918 | 15.1%).
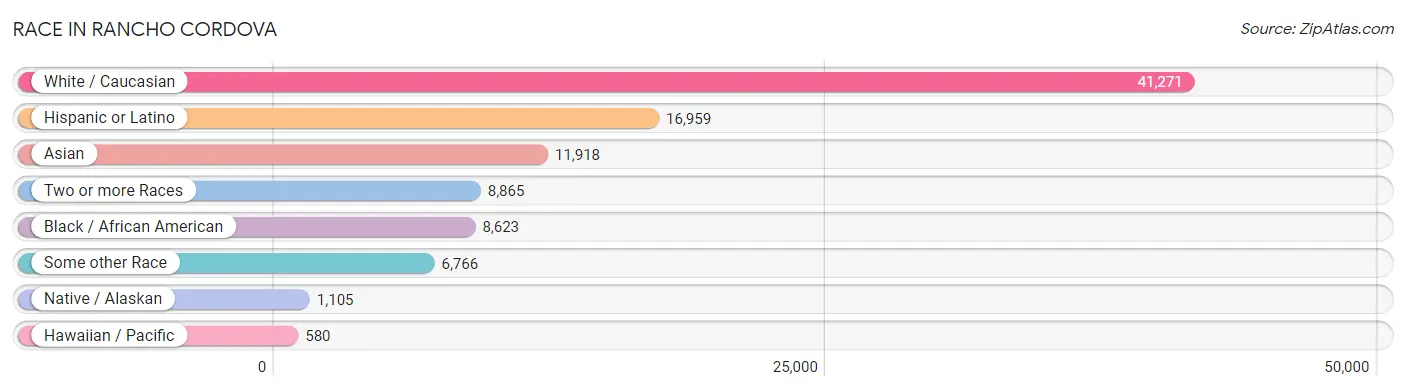
| Race | # Population | % Population |
| Asian | 11,918 | 15.1% |
| Black / African American | 8,623 | 10.9% |
| Hawaiian / Pacific | 580 | 0.7% |
| Hispanic or Latino | 16,959 | 21.4% |
| Native / Alaskan | 1,105 | 1.4% |
| White / Caucasian | 41,271 | 52.2% |
| Two or more Races | 8,865 | 11.2% |
| Some other Race | 6,766 | 8.6% |
| Total | 79,128 | 100.0% |
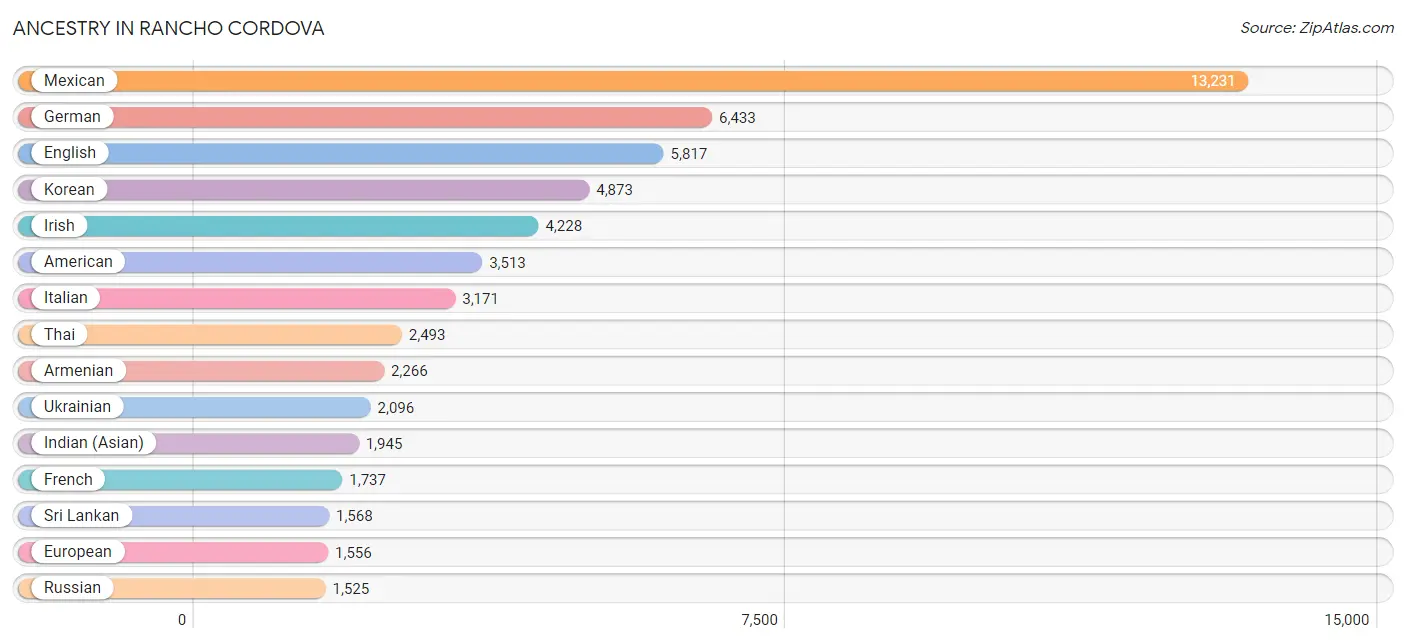
Ancestry in Rancho Cordova
The most populous ancestries reported in Rancho Cordova are Mexican (13,231 | 16.7%), German (6,433 | 8.1%), English (5,817 | 7.3%), Korean (4,873 | 6.2%), and Irish (4,228 | 5.3%), together accounting for 43.7% of all Rancho Cordova residents.
| Ancestry | # Population | % Population |
| Afghan | 626 | 0.8% |
| African | 582 | 0.7% |
| American | 3,513 | 4.4% |
| Apache | 181 | 0.2% |
| Arab | 538 | 0.7% |
| Argentinean | 44 | 0.1% |
| Armenian | 2,266 | 2.9% |
| Australian | 10 | 0.0% |
| Austrian | 97 | 0.1% |
| Bangladeshi | 1,152 | 1.5% |
| Basque | 53 | 0.1% |
| Belgian | 55 | 0.1% |
| Belizean | 8 | 0.0% |
| Bhutanese | 795 | 1.0% |
| Blackfeet | 266 | 0.3% |
| Bolivian | 18 | 0.0% |
| Brazilian | 90 | 0.1% |
| British | 151 | 0.2% |
| Bulgarian | 103 | 0.1% |
| Burmese | 1,067 | 1.3% |
| Canadian | 89 | 0.1% |
| Cape Verdean | 37 | 0.1% |
| Celtic | 20 | 0.0% |
| Central American | 1,401 | 1.8% |
| Central American Indian | 290 | 0.4% |
| Cherokee | 356 | 0.4% |
| Chickasaw | 19 | 0.0% |
| Chilean | 39 | 0.1% |
| Colombian | 98 | 0.1% |
| Comanche | 3 | 0.0% |
| Cree | 124 | 0.2% |
| Creek | 86 | 0.1% |
| Croatian | 22 | 0.0% |
| Crow | 23 | 0.0% |
| Cuban | 158 | 0.2% |
| Czech | 71 | 0.1% |
| Czechoslovakian | 31 | 0.0% |
| Danish | 294 | 0.4% |
| Delaware | 4 | 0.0% |
| Dominican | 28 | 0.0% |
| Dutch | 590 | 0.7% |
| Eastern European | 227 | 0.3% |
| Ecuadorian | 14 | 0.0% |
| Egyptian | 326 | 0.4% |
| English | 5,817 | 7.3% |
| Ethiopian | 127 | 0.2% |
| European | 1,556 | 2.0% |
| Filipino | 15 | 0.0% |
| Finnish | 308 | 0.4% |
| French | 1,737 | 2.2% |
| French Canadian | 123 | 0.2% |
| German | 6,433 | 8.1% |
| Ghanaian | 27 | 0.0% |
| Greek | 232 | 0.3% |
| Guamanian / Chamorro | 42 | 0.1% |
| Guatemalan | 276 | 0.4% |
| Haitian | 18 | 0.0% |
| Honduran | 43 | 0.1% |
| Hungarian | 269 | 0.3% |
| Icelander | 13 | 0.0% |
| Indian (Asian) | 1,945 | 2.5% |
| Iranian | 143 | 0.2% |
| Irish | 4,228 | 5.3% |
| Israeli | 26 | 0.0% |
| Italian | 3,171 | 4.0% |
| Jamaican | 41 | 0.1% |
| Japanese | 50 | 0.1% |
| Jordanian | 18 | 0.0% |
| Kenyan | 61 | 0.1% |
| Korean | 4,873 | 6.2% |
| Laotian | 72 | 0.1% |
| Latvian | 52 | 0.1% |
| Lebanese | 43 | 0.1% |
| Liberian | 71 | 0.1% |
| Lithuanian | 5 | 0.0% |
| Luxembourger | 5 | 0.0% |
| Macedonian | 30 | 0.0% |
| Malaysian | 162 | 0.2% |
| Maltese | 30 | 0.0% |
| Mexican | 13,231 | 16.7% |
| Mexican American Indian | 398 | 0.5% |
| Native Hawaiian | 499 | 0.6% |
| Navajo | 129 | 0.2% |
| Nepalese | 369 | 0.5% |
| Nicaraguan | 203 | 0.3% |
| Nigerian | 111 | 0.1% |
| Northern European | 102 | 0.1% |
| Norwegian | 895 | 1.1% |
| Paiute | 33 | 0.0% |
| Pakistani | 210 | 0.3% |
| Palestinian | 13 | 0.0% |
| Panamanian | 14 | 0.0% |
| Pennsylvania German | 5 | 0.0% |
| Peruvian | 131 | 0.2% |
| Polish | 657 | 0.8% |
| Portuguese | 883 | 1.1% |
| Potawatomi | 21 | 0.0% |
| Pueblo | 12 | 0.0% |
| Puerto Rican | 618 | 0.8% |
| Puget Sound Salish | 27 | 0.0% |
| Romanian | 708 | 0.9% |
| Russian | 1,525 | 1.9% |
| Salvadoran | 865 | 1.1% |
| Samoan | 145 | 0.2% |
| Scandinavian | 156 | 0.2% |
| Scotch-Irish | 493 | 0.6% |
| Scottish | 966 | 1.2% |
| Seminole | 49 | 0.1% |
| Serbian | 14 | 0.0% |
| Shoshone | 7 | 0.0% |
| Sioux | 69 | 0.1% |
| Slavic | 46 | 0.1% |
| Slovak | 29 | 0.0% |
| Slovene | 5 | 0.0% |
| South American | 451 | 0.6% |
| Spaniard | 440 | 0.6% |
| Spanish | 315 | 0.4% |
| Sri Lankan | 1,568 | 2.0% |
| Subsaharan African | 1,136 | 1.4% |
| Sudanese | 38 | 0.1% |
| Swedish | 769 | 1.0% |
| Swiss | 169 | 0.2% |
| Syrian | 32 | 0.0% |
| Thai | 2,493 | 3.2% |
| Tlingit-Haida | 15 | 0.0% |
| Tongan | 12 | 0.0% |
| Turkish | 75 | 0.1% |
| Ukrainian | 2,096 | 2.6% |
| Venezuelan | 107 | 0.1% |
| Vietnamese | 110 | 0.1% |
| Welsh | 141 | 0.2% |
| West Indian | 118 | 0.2% |
| Yaqui | 10 | 0.0% |
| Yugoslavian | 25 | 0.0% | View All 134 Rows |
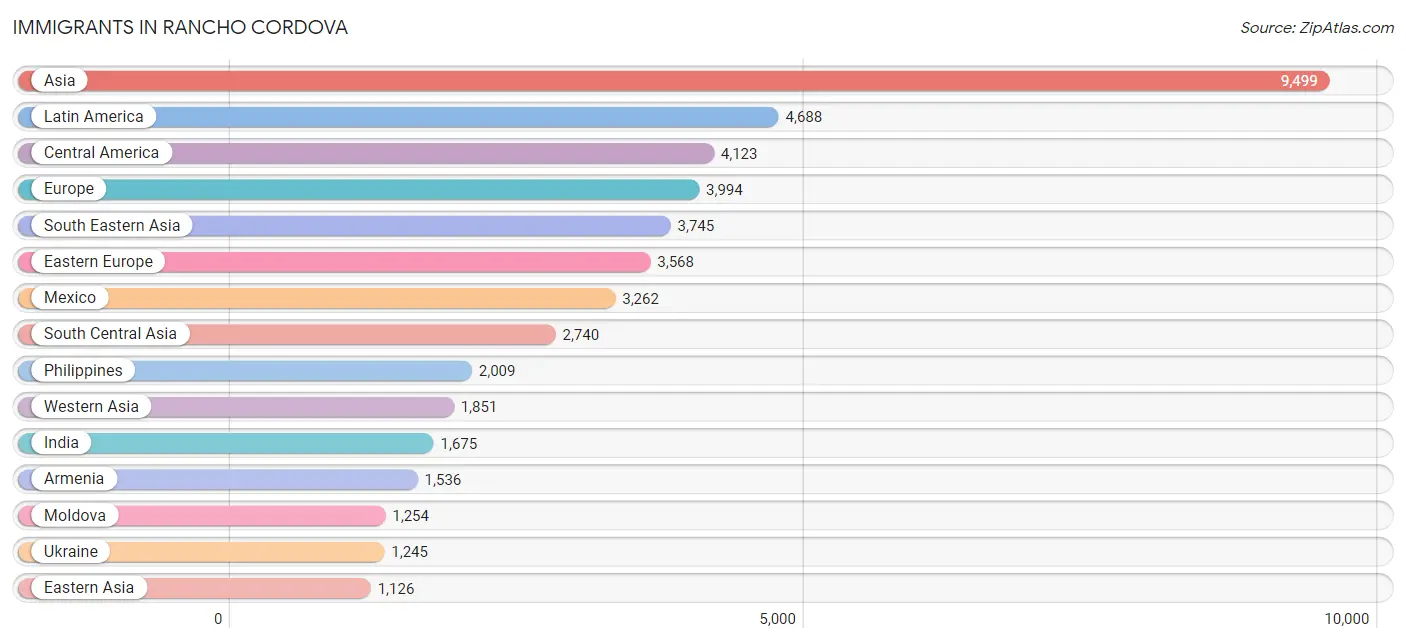
Immigrants in Rancho Cordova
The most numerous immigrant groups reported in Rancho Cordova came from Asia (9,499 | 12.0%), Latin America (4,688 | 5.9%), Central America (4,123 | 5.2%), Europe (3,994 | 5.1%), and South Eastern Asia (3,745 | 4.7%), together accounting for 32.9% of all Rancho Cordova residents.
| Immigration Origin | # Population | % Population |
| Afghanistan | 654 | 0.8% |
| Africa | 622 | 0.8% |
| Argentina | 11 | 0.0% |
| Armenia | 1,536 | 1.9% |
| Asia | 9,499 | 12.0% |
| Austria | 9 | 0.0% |
| Azores | 10 | 0.0% |
| Bangladesh | 114 | 0.1% |
| Belarus | 119 | 0.2% |
| Belgium | 20 | 0.0% |
| Belize | 1 | 0.0% |
| Bosnia and Herzegovina | 17 | 0.0% |
| Brazil | 114 | 0.1% |
| Bulgaria | 85 | 0.1% |
| Cambodia | 28 | 0.0% |
| Canada | 136 | 0.2% |
| Caribbean | 79 | 0.1% |
| Central America | 4,123 | 5.2% |
| Chile | 11 | 0.0% |
| China | 480 | 0.6% |
| Colombia | 46 | 0.1% |
| Czechoslovakia | 79 | 0.1% |
| Eastern Africa | 174 | 0.2% |
| Eastern Asia | 1,126 | 1.4% |
| Eastern Europe | 3,568 | 4.5% |
| Egypt | 326 | 0.4% |
| El Salvador | 439 | 0.5% |
| England | 81 | 0.1% |
| Ethiopia | 81 | 0.1% |
| Europe | 3,994 | 5.1% |
| Fiji | 246 | 0.3% |
| Germany | 111 | 0.1% |
| Ghana | 27 | 0.0% |
| Greece | 11 | 0.0% |
| Guatemala | 256 | 0.3% |
| Guyana | 15 | 0.0% |
| Honduras | 33 | 0.0% |
| Hong Kong | 128 | 0.2% |
| Hungary | 30 | 0.0% |
| India | 1,675 | 2.1% |
| Indonesia | 255 | 0.3% |
| Iran | 90 | 0.1% |
| Iraq | 28 | 0.0% |
| Ireland | 28 | 0.0% |
| Israel | 16 | 0.0% |
| Italy | 42 | 0.1% |
| Jamaica | 18 | 0.0% |
| Japan | 136 | 0.2% |
| Jordan | 110 | 0.1% |
| Kazakhstan | 39 | 0.1% |
| Kenya | 64 | 0.1% |
| Korea | 510 | 0.6% |
| Laos | 190 | 0.2% |
| Latin America | 4,688 | 5.9% |
| Latvia | 73 | 0.1% |
| Lebanon | 40 | 0.1% |
| Malaysia | 31 | 0.0% |
| Mexico | 3,262 | 4.1% |
| Micronesia | 76 | 0.1% |
| Moldova | 1,254 | 1.6% |
| Morocco | 6 | 0.0% |
| Nepal | 69 | 0.1% |
| Netherlands | 38 | 0.1% |
| Nicaragua | 118 | 0.2% |
| Nigeria | 51 | 0.1% |
| Northern Africa | 368 | 0.5% |
| Northern Europe | 145 | 0.2% |
| Norway | 6 | 0.0% |
| Oceania | 426 | 0.5% |
| Pakistan | 14 | 0.0% |
| Panama | 14 | 0.0% |
| Peru | 98 | 0.1% |
| Philippines | 2,009 | 2.5% |
| Poland | 28 | 0.0% |
| Portugal | 28 | 0.0% |
| Romania | 115 | 0.2% |
| Russia | 502 | 0.6% |
| Singapore | 5 | 0.0% |
| South Africa | 2 | 0.0% |
| South America | 486 | 0.6% |
| South Central Asia | 2,740 | 3.5% |
| South Eastern Asia | 3,745 | 4.7% |
| Southern Europe | 98 | 0.1% |
| Spain | 17 | 0.0% |
| St. Vincent and the Grenadines | 61 | 0.1% |
| Sudan | 36 | 0.1% |
| Syria | 7 | 0.0% |
| Taiwan | 38 | 0.1% |
| Thailand | 199 | 0.3% |
| Turkey | 65 | 0.1% |
| Ukraine | 1,245 | 1.6% |
| Uzbekistan | 85 | 0.1% |
| Venezuela | 191 | 0.2% |
| Vietnam | 1,028 | 1.3% |
| Western Africa | 78 | 0.1% |
| Western Asia | 1,851 | 2.3% |
| Western Europe | 183 | 0.2% | View All 97 Rows |
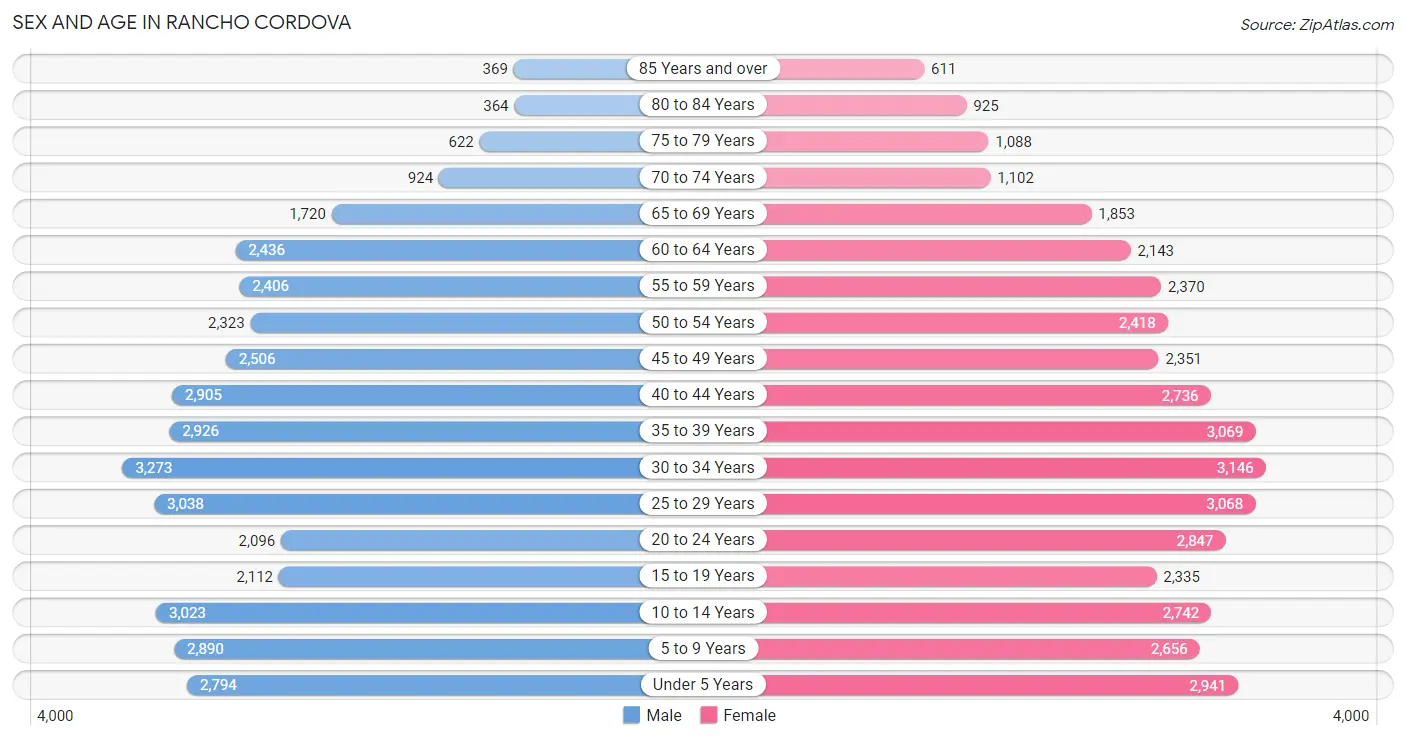
Sex and Age in Rancho Cordova
Sex and Age in Rancho Cordova
The most populous age groups in Rancho Cordova are 30 to 34 Years (3,273 | 8.5%) for men and 30 to 34 Years (3,146 | 7.8%) for women.
| Age Bracket | Male | Female |
| Under 5 Years | 2,794 (7.2%) | 2,941 (7.3%) |
| 5 to 9 Years | 2,890 (7.5%) | 2,656 (6.6%) |
| 10 to 14 Years | 3,023 (7.8%) | 2,742 (6.8%) |
| 15 to 19 Years | 2,112 (5.4%) | 2,335 (5.8%) |
| 20 to 24 Years | 2,096 (5.4%) | 2,847 (7.0%) |
| 25 to 29 Years | 3,038 (7.8%) | 3,068 (7.6%) |
| 30 to 34 Years | 3,273 (8.5%) | 3,146 (7.8%) |
| 35 to 39 Years | 2,926 (7.6%) | 3,069 (7.6%) |
| 40 to 44 Years | 2,905 (7.5%) | 2,736 (6.8%) |
| 45 to 49 Years | 2,506 (6.5%) | 2,351 (5.8%) |
| 50 to 54 Years | 2,323 (6.0%) | 2,418 (6.0%) |
| 55 to 59 Years | 2,406 (6.2%) | 2,370 (5.9%) |
| 60 to 64 Years | 2,436 (6.3%) | 2,143 (5.3%) |
| 65 to 69 Years | 1,720 (4.4%) | 1,853 (4.6%) |
| 70 to 74 Years | 924 (2.4%) | 1,102 (2.7%) |
| 75 to 79 Years | 622 (1.6%) | 1,088 (2.7%) |
| 80 to 84 Years | 364 (0.9%) | 925 (2.3%) |
| 85 Years and over | 369 (0.9%) | 611 (1.5%) |
| Total | 38,727 (100.0%) | 40,401 (100.0%) |
Families and Households in Rancho Cordova
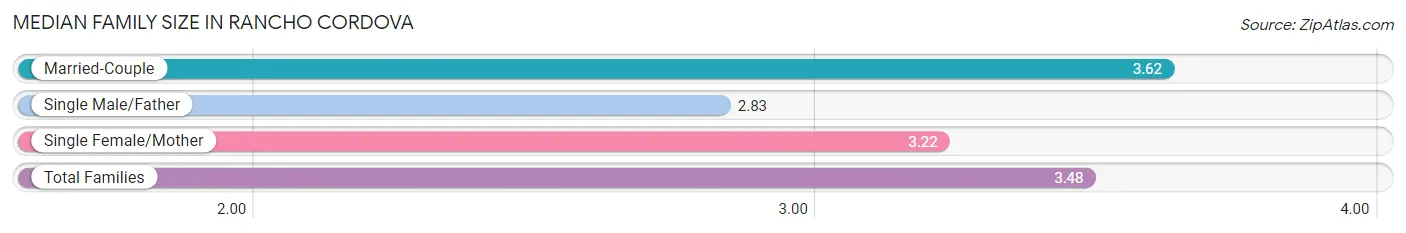
Median Family Size in Rancho Cordova
The median family size in Rancho Cordova is 3.48 persons per family, with married-couple families (13,447 | 71.7%) accounting for the largest median family size of 3.62 persons per family. On the other hand, single male/father families (1,568 | 8.4%) represent the smallest median family size with 2.83 persons per family.
| Family Type | # Families | Family Size |
| Married-Couple | 13,447 (71.7%) | 3.62 |
| Single Male/Father | 1,568 (8.4%) | 2.83 |
| Single Female/Mother | 3,734 (19.9%) | 3.22 |
| Total Families | 18,749 (100.0%) | 3.48 |
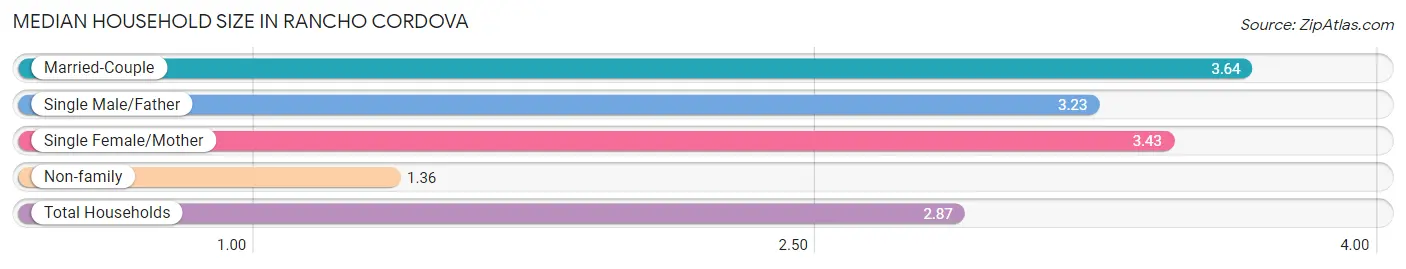
Median Household Size in Rancho Cordova
The median household size in Rancho Cordova is 2.87 persons per household, with married-couple households (13,447 | 49.2%) accounting for the largest median household size of 3.64 persons per household. non-family households (8,590 | 31.4%) represent the smallest median household size with 1.36 persons per household.
| Household Type | # Households | Household Size |
| Married-Couple | 13,447 (49.2%) | 3.64 |
| Single Male/Father | 1,568 (5.7%) | 3.23 |
| Single Female/Mother | 3,734 (13.7%) | 3.43 |
| Non-family | 8,590 (31.4%) | 1.36 |
| Total Households | 27,339 (100.0%) | 2.87 |
Household Size by Marriage Status in Rancho Cordova
Out of a total of 27,339 households in Rancho Cordova, 18,749 (68.6%) are family households, while 8,590 (31.4%) are nonfamily households. The most numerous type of family households are 2-person households, comprising 6,400, and the most common type of nonfamily households are 1-person households, comprising 6,355.
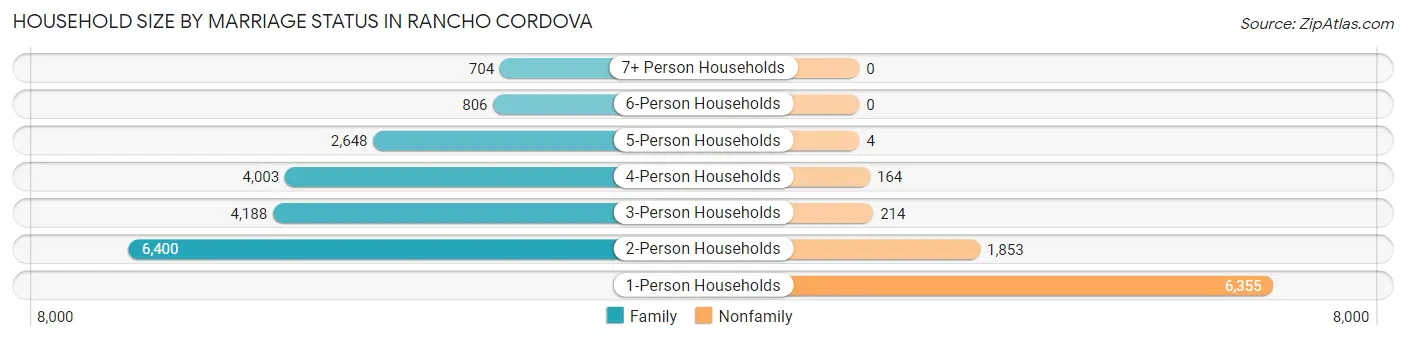
| Household Size | Family Households | Nonfamily Households |
| 1-Person Households | - | 6,355 (23.3%) |
| 2-Person Households | 6,400 (23.4%) | 1,853 (6.8%) |
| 3-Person Households | 4,188 (15.3%) | 214 (0.8%) |
| 4-Person Households | 4,003 (14.6%) | 164 (0.6%) |
| 5-Person Households | 2,648 (9.7%) | 4 (0.0%) |
| 6-Person Households | 806 (2.9%) | 0 (0.0%) |
| 7+ Person Households | 704 (2.6%) | 0 (0.0%) |
| Total | 18,749 (68.6%) | 8,590 (31.4%) |
Female Fertility in Rancho Cordova
Fertility by Age in Rancho Cordova
Average fertility rate in Rancho Cordova is 51.0 births per 1,000 women. Women in the age bracket of 20 to 34 years have the highest fertility rate with 73.0 births per 1,000 women. Women in the age bracket of 20 to 34 years acount for 64.7% of all women with births.
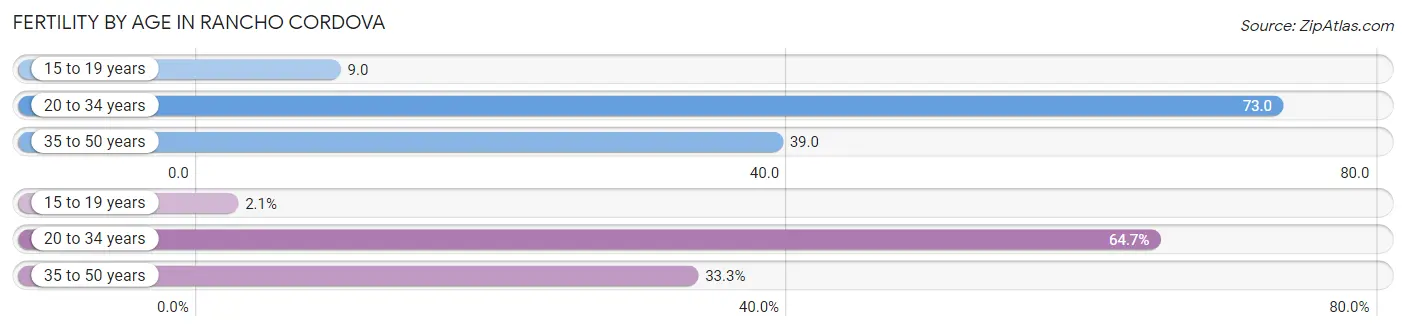
| Age Bracket | Women with Births | Births / 1,000 Women |
| 15 to 19 years | 21 (2.1%) | 9.0 |
| 20 to 34 years | 663 (64.7%) | 73.0 |
| 35 to 50 years | 341 (33.3%) | 39.0 |
| Total | 1,025 (100.0%) | 51.0 |
Fertility by Age by Marriage Status in Rancho Cordova
74.3% of women with births (1,025) in Rancho Cordova are married. The highest percentage of unmarried women with births falls into 20 to 34 years age bracket with 30.2% of them unmarried at the time of birth, while the lowest percentage of unmarried women with births belong to 15 to 19 years age bracket with 0.0% of them unmarried.
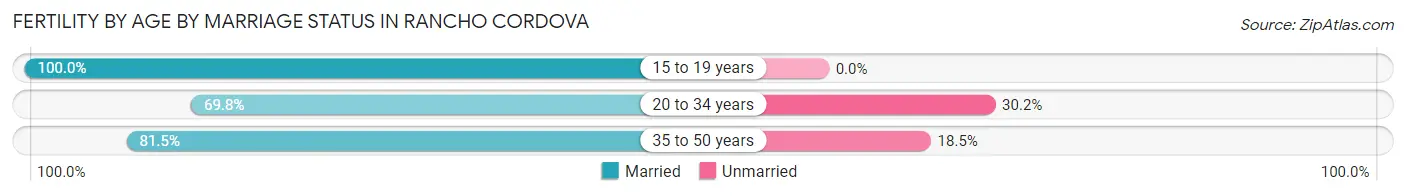
| Age Bracket | Married | Unmarried |
| 15 to 19 years | 21 (100.0%) | 0 (0.0%) |
| 20 to 34 years | 463 (69.8%) | 200 (30.2%) |
| 35 to 50 years | 278 (81.5%) | 63 (18.5%) |
| Total | 762 (74.3%) | 263 (25.7%) |
Fertility by Education in Rancho Cordova
Average fertility rate in Rancho Cordova is 51.0 births per 1,000 women. Women with the education attainment of high school diploma have the highest fertility rate of 74.0 births per 1,000 women, while women with the education attainment of graduate degree have the lowest fertility at 21.0 births per 1,000 women. Women with the education attainment of college or associate's degree represent 34.6% of all women with births.
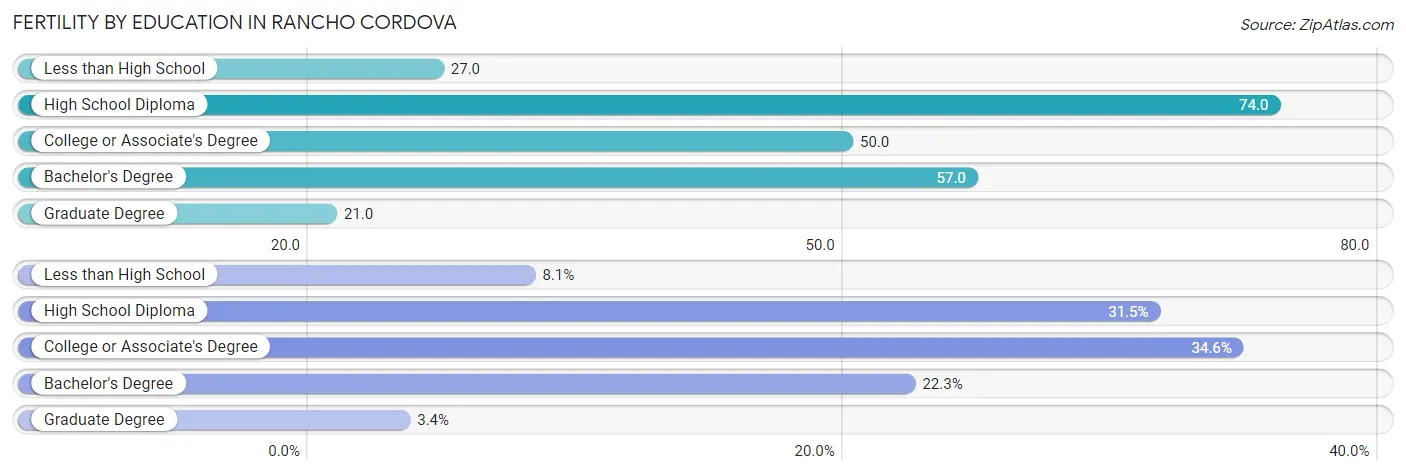
| Educational Attainment | Women with Births | Births / 1,000 Women |
| Less than High School | 83 (8.1%) | 27.0 |
| High School Diploma | 323 (31.5%) | 74.0 |
| College or Associate's Degree | 355 (34.6%) | 50.0 |
| Bachelor's Degree | 229 (22.3%) | 57.0 |
| Graduate Degree | 35 (3.4%) | 21.0 |
| Total | 1,025 (100.0%) | 51.0 |
Fertility by Education by Marriage Status in Rancho Cordova
25.7% of women with births in Rancho Cordova are unmarried. Women with the educational attainment of graduate degree are most likely to be married with 100.0% of them married at childbirth, while women with the educational attainment of less than high school are least likely to be married with 50.6% of them unmarried at childbirth.
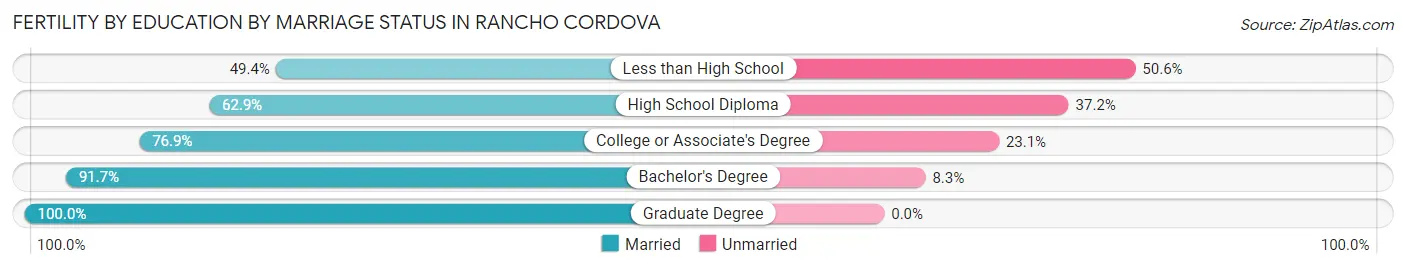
| Educational Attainment | Married | Unmarried |
| Less than High School | 41 (49.4%) | 42 (50.6%) |
| High School Diploma | 203 (62.8%) | 120 (37.1%) |
| College or Associate's Degree | 273 (76.9%) | 82 (23.1%) |
| Bachelor's Degree | 210 (91.7%) | 19 (8.3%) |
| Graduate Degree | 35 (100.0%) | 0 (0.0%) |
| Total | 762 (74.3%) | 263 (25.7%) |
Employment Characteristics in Rancho Cordova
Employment by Class of Employer in Rancho Cordova
Among the 36,208 employed individuals in Rancho Cordova, private company employees (22,636 | 62.5%), state government employees (3,670 | 10.1%), and not-for-profit organizations (3,363 | 9.3%) make up the most common classes of employment.
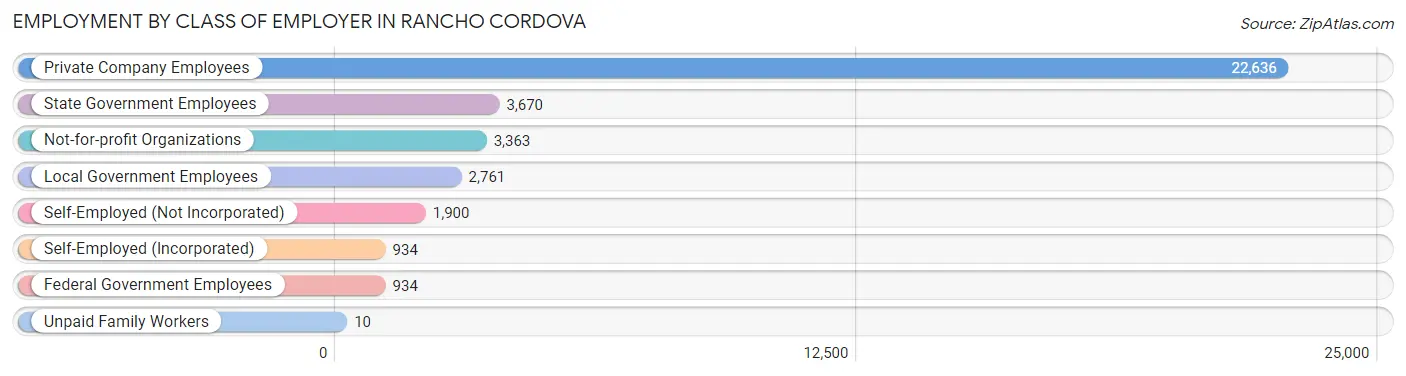
| Employer Class | # Employees | % Employees |
| Private Company Employees | 22,636 | 62.5% |
| Self-Employed (Incorporated) | 934 | 2.6% |
| Self-Employed (Not Incorporated) | 1,900 | 5.2% |
| Not-for-profit Organizations | 3,363 | 9.3% |
| Local Government Employees | 2,761 | 7.6% |
| State Government Employees | 3,670 | 10.1% |
| Federal Government Employees | 934 | 2.6% |
| Unpaid Family Workers | 10 | 0.0% |
| Total | 36,208 | 100.0% |
Employment Status by Age in Rancho Cordova
According to the labor force statistics for Rancho Cordova, out of the total population over 16 years of age (60,903), 65.7% or 40,013 individuals are in the labor force, with 6.1% or 2,441 of them unemployed. The age group with the highest labor force participation rate is 35 to 44 years, with 84.9% or 9,879 individuals in the labor force. Within the labor force, the 20 to 24 years age range has the highest percentage of unemployed individuals, with 11.0% or 421 of them being unemployed.
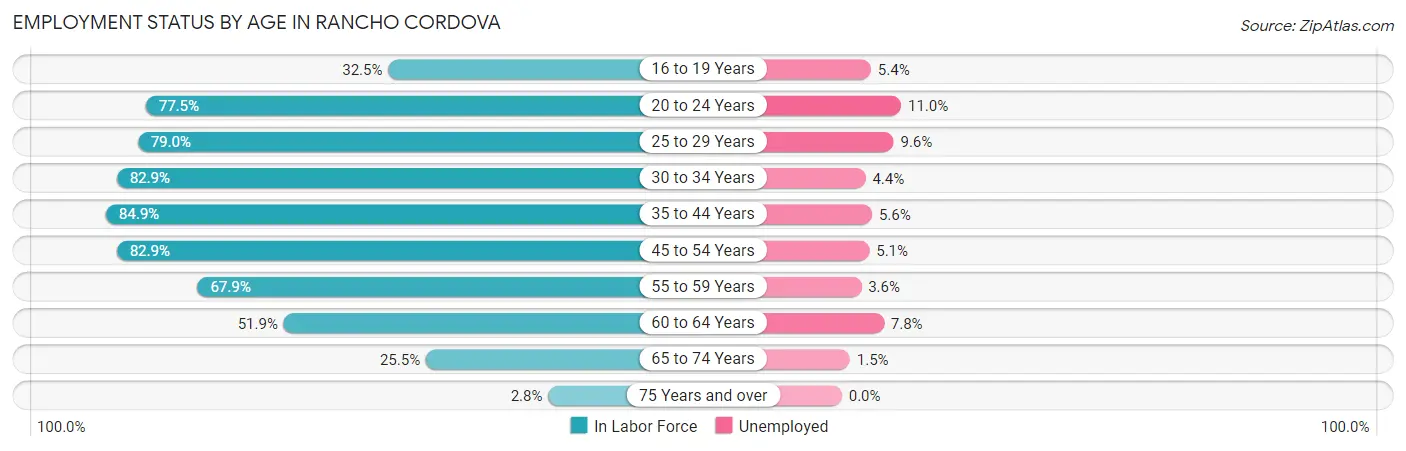
| Age Bracket | In Labor Force | Unemployed |
| 16 to 19 Years | 1,062 (32.5%) | 57 (5.4%) |
| 20 to 24 Years | 3,831 (77.5%) | 421 (11.0%) |
| 25 to 29 Years | 4,824 (79.0%) | 463 (9.6%) |
| 30 to 34 Years | 5,321 (82.9%) | 234 (4.4%) |
| 35 to 44 Years | 9,879 (84.9%) | 553 (5.6%) |
| 45 to 54 Years | 7,957 (82.9%) | 406 (5.1%) |
| 55 to 59 Years | 3,243 (67.9%) | 117 (3.6%) |
| 60 to 64 Years | 2,377 (51.9%) | 185 (7.8%) |
| 65 to 74 Years | 1,428 (25.5%) | 21 (1.5%) |
| 75 Years and over | 111 (2.8%) | 0 (0.0%) |
| Total | 40,013 (65.7%) | 2,441 (6.1%) |
Employment Status by Educational Attainment in Rancho Cordova
According to labor force statistics for Rancho Cordova, 77.9% of individuals (33,586) out of the total population between 25 and 64 years of age (43,114) are in the labor force, with 5.8% or 1,948 of them being unemployed. The group with the highest labor force participation rate are those with the educational attainment of bachelor's degree or higher, with 87.2% or 11,313 individuals in the labor force. Within the labor force, individuals with high school diploma education have the highest percentage of unemployment, with 7.0% or 504 of them being unemployed.
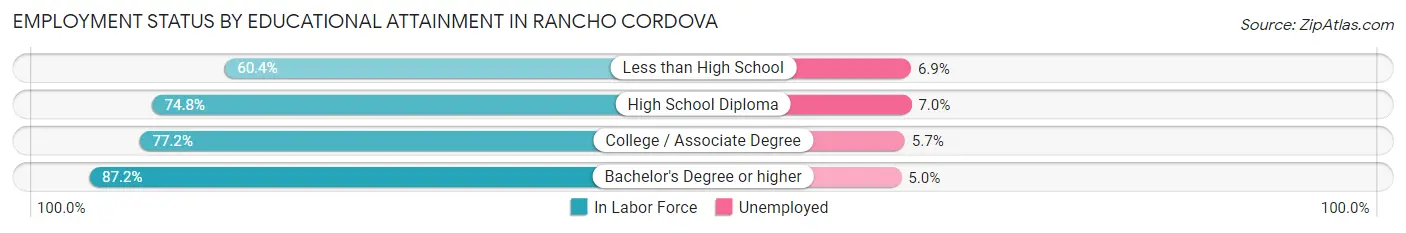
| Educational Attainment | In Labor Force | Unemployed |
| Less than High School | 2,662 (60.4%) | 304 (6.9%) |
| High School Diploma | 7,205 (74.8%) | 674 (7.0%) |
| College / Associate Degree | 12,430 (77.2%) | 918 (5.7%) |
| Bachelor's Degree or higher | 11,313 (87.2%) | 649 (5.0%) |
| Total | 33,586 (77.9%) | 2,501 (5.8%) |
Employment Occupations by Sex in Rancho Cordova
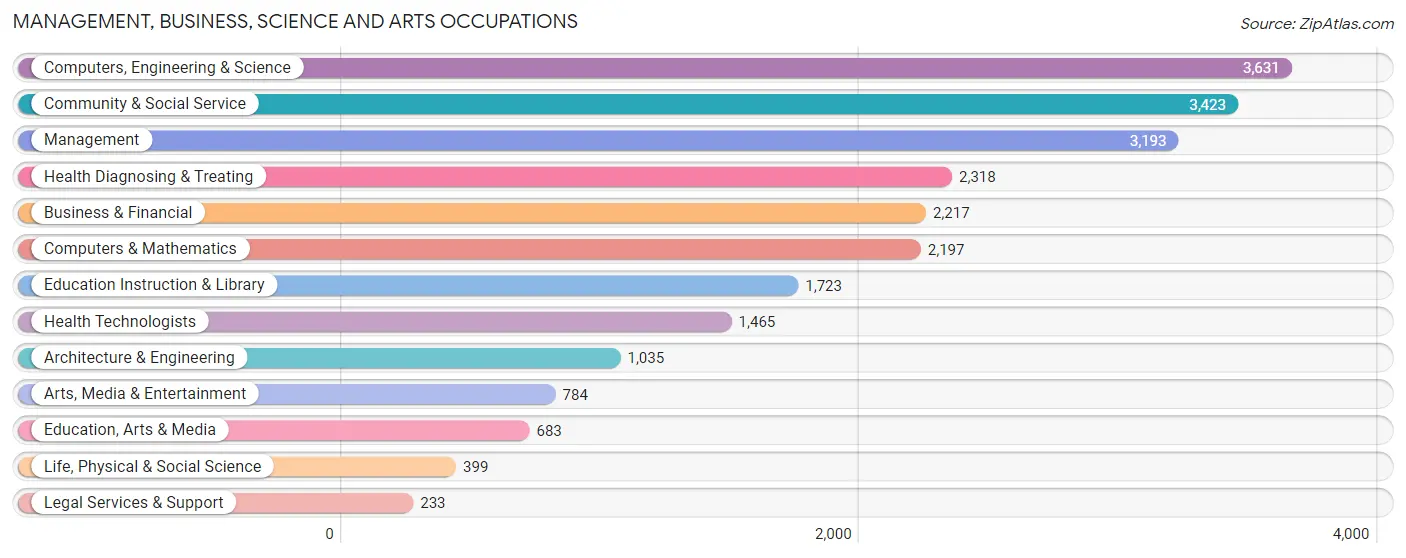
Management, Business, Science and Arts Occupations
The most common Management, Business, Science and Arts occupations in Rancho Cordova are Computers, Engineering & Science (3,631 | 9.7%), Community & Social Service (3,423 | 9.1%), Management (3,193 | 8.5%), Health Diagnosing & Treating (2,318 | 6.2%), and Business & Financial (2,217 | 5.9%).
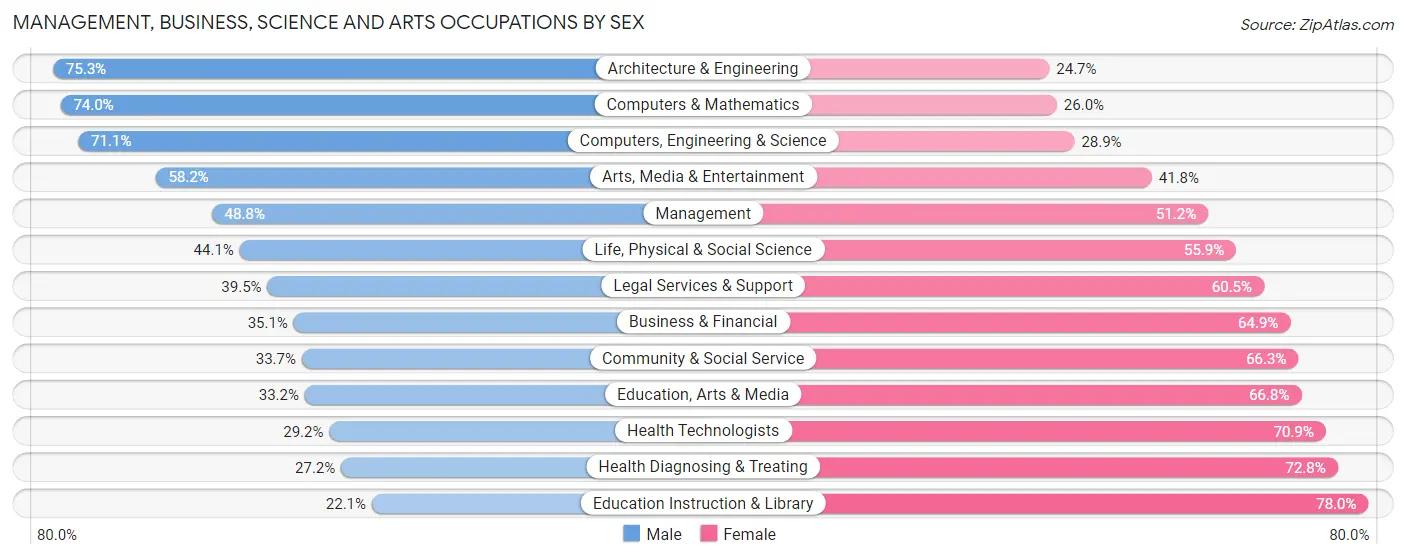
Management, Business, Science and Arts Occupations by Sex
Within the Management, Business, Science and Arts occupations in Rancho Cordova, the most male-oriented occupations are Architecture & Engineering (75.3%), Computers & Mathematics (74.0%), and Computers, Engineering & Science (71.1%), while the most female-oriented occupations are Education Instruction & Library (77.9%), Health Diagnosing & Treating (72.8%), and Health Technologists (70.9%).
| Occupation | Male | Female |
| Management | 1,558 (48.8%) | 1,635 (51.2%) |
| Business & Financial | 778 (35.1%) | 1,439 (64.9%) |
| Computers, Engineering & Science | 2,581 (71.1%) | 1,050 (28.9%) |
| Computers & Mathematics | 1,626 (74.0%) | 571 (26.0%) |
| Architecture & Engineering | 779 (75.3%) | 256 (24.7%) |
| Life, Physical & Social Science | 176 (44.1%) | 223 (55.9%) |
| Community & Social Service | 1,155 (33.7%) | 2,268 (66.3%) |
| Education, Arts & Media | 227 (33.2%) | 456 (66.8%) |
| Legal Services & Support | 92 (39.5%) | 141 (60.5%) |
| Education Instruction & Library | 380 (22.1%) | 1,343 (77.9%) |
| Arts, Media & Entertainment | 456 (58.2%) | 328 (41.8%) |
| Health Diagnosing & Treating | 630 (27.2%) | 1,688 (72.8%) |
| Health Technologists | 427 (29.1%) | 1,038 (70.9%) |
| Total (Category) | 6,702 (45.3%) | 8,080 (54.7%) |
| Total (Overall) | 19,419 (51.9%) | 18,007 (48.1%) |
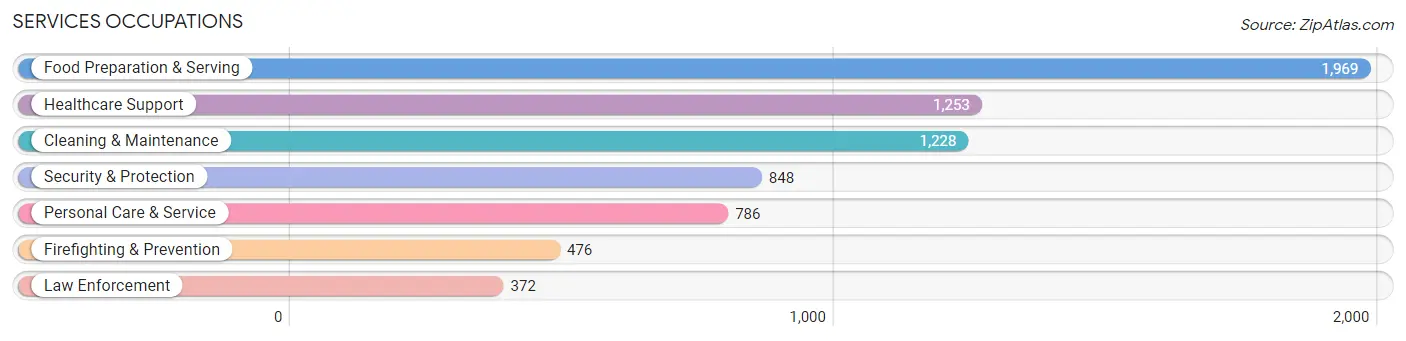
Services Occupations
The most common Services occupations in Rancho Cordova are Food Preparation & Serving (1,969 | 5.3%), Healthcare Support (1,253 | 3.4%), Cleaning & Maintenance (1,228 | 3.3%), Security & Protection (848 | 2.3%), and Personal Care & Service (786 | 2.1%).
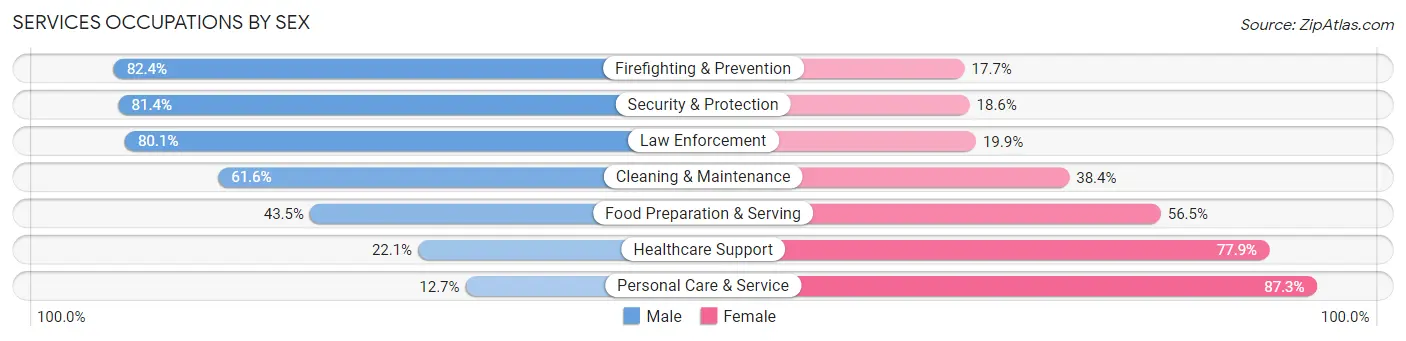
Services Occupations by Sex
Within the Services occupations in Rancho Cordova, the most male-oriented occupations are Firefighting & Prevention (82.4%), Security & Protection (81.4%), and Law Enforcement (80.1%), while the most female-oriented occupations are Personal Care & Service (87.3%), Healthcare Support (77.9%), and Food Preparation & Serving (56.5%).
| Occupation | Male | Female |
| Healthcare Support | 277 (22.1%) | 976 (77.9%) |
| Security & Protection | 690 (81.4%) | 158 (18.6%) |
| Firefighting & Prevention | 392 (82.4%) | 84 (17.6%) |
| Law Enforcement | 298 (80.1%) | 74 (19.9%) |
| Food Preparation & Serving | 857 (43.5%) | 1,112 (56.5%) |
| Cleaning & Maintenance | 757 (61.6%) | 471 (38.4%) |
| Personal Care & Service | 100 (12.7%) | 686 (87.3%) |
| Total (Category) | 2,681 (44.1%) | 3,403 (55.9%) |
| Total (Overall) | 19,419 (51.9%) | 18,007 (48.1%) |
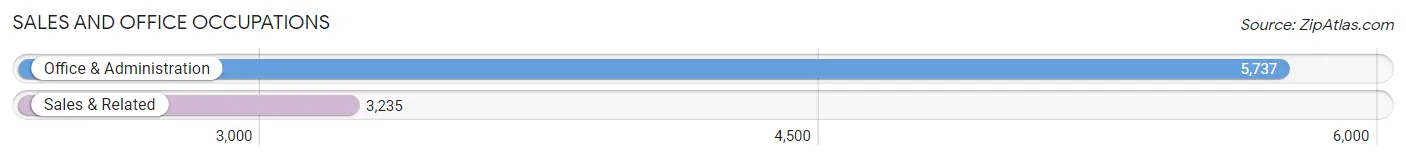
Sales and Office Occupations
The most common Sales and Office occupations in Rancho Cordova are Office & Administration (5,737 | 15.3%), and Sales & Related (3,235 | 8.6%).
Sales and Office Occupations by Sex
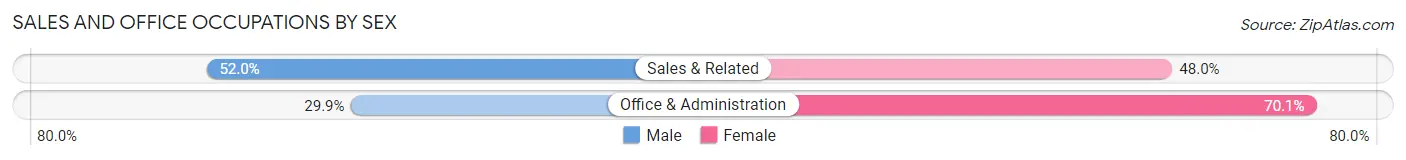
| Occupation | Male | Female |
| Sales & Related | 1,683 (52.0%) | 1,552 (48.0%) |
| Office & Administration | 1,714 (29.9%) | 4,023 (70.1%) |
| Total (Category) | 3,397 (37.9%) | 5,575 (62.1%) |
| Total (Overall) | 19,419 (51.9%) | 18,007 (48.1%) |
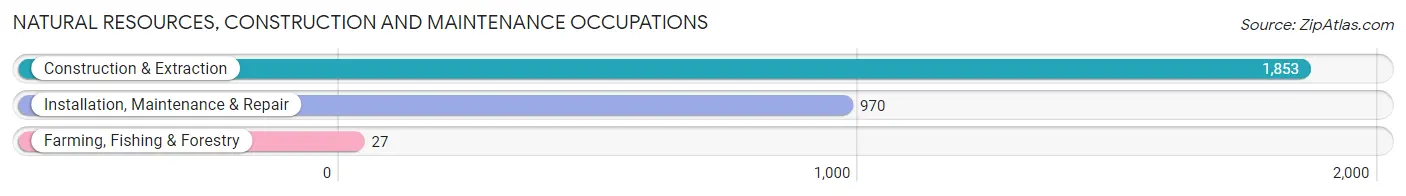
Natural Resources, Construction and Maintenance Occupations
The most common Natural Resources, Construction and Maintenance occupations in Rancho Cordova are Construction & Extraction (1,853 | 5.0%), Installation, Maintenance & Repair (970 | 2.6%), and Farming, Fishing & Forestry (27 | 0.1%).
Natural Resources, Construction and Maintenance Occupations by Sex
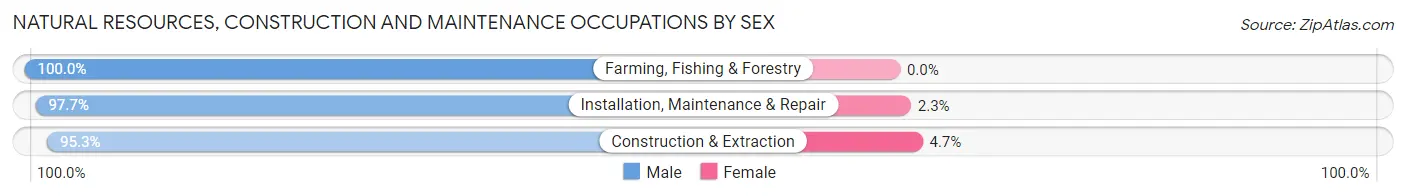
| Occupation | Male | Female |
| Farming, Fishing & Forestry | 27 (100.0%) | 0 (0.0%) |
| Construction & Extraction | 1,766 (95.3%) | 87 (4.7%) |
| Installation, Maintenance & Repair | 948 (97.7%) | 22 (2.3%) |
| Total (Category) | 2,741 (96.2%) | 109 (3.8%) |
| Total (Overall) | 19,419 (51.9%) | 18,007 (48.1%) |
Production, Transportation and Moving Occupations
The most common Production, Transportation and Moving occupations in Rancho Cordova are Transportation (1,623 | 4.3%), Material Moving (1,567 | 4.2%), and Production (1,548 | 4.1%).
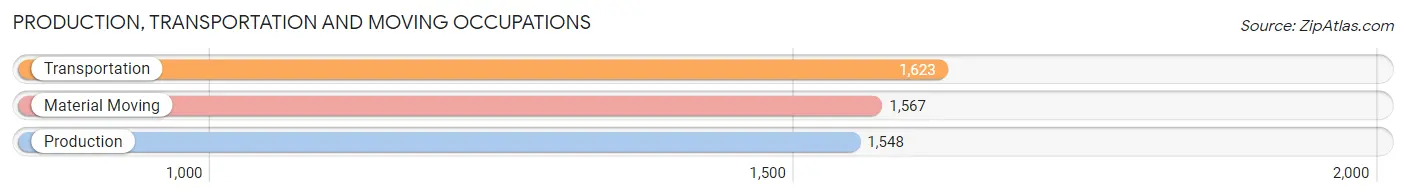
Production, Transportation and Moving Occupations by Sex
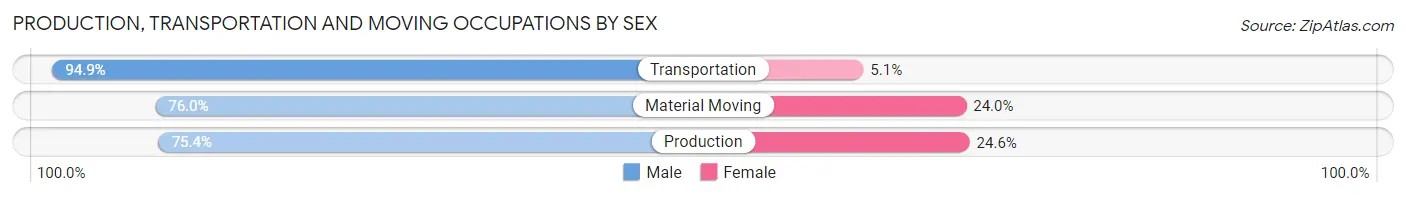
| Occupation | Male | Female |
| Production | 1,167 (75.4%) | 381 (24.6%) |
| Transportation | 1,540 (94.9%) | 83 (5.1%) |
| Material Moving | 1,191 (76.0%) | 376 (24.0%) |
| Total (Category) | 3,898 (82.3%) | 840 (17.7%) |
| Total (Overall) | 19,419 (51.9%) | 18,007 (48.1%) |
Employment Industries by Sex in Rancho Cordova
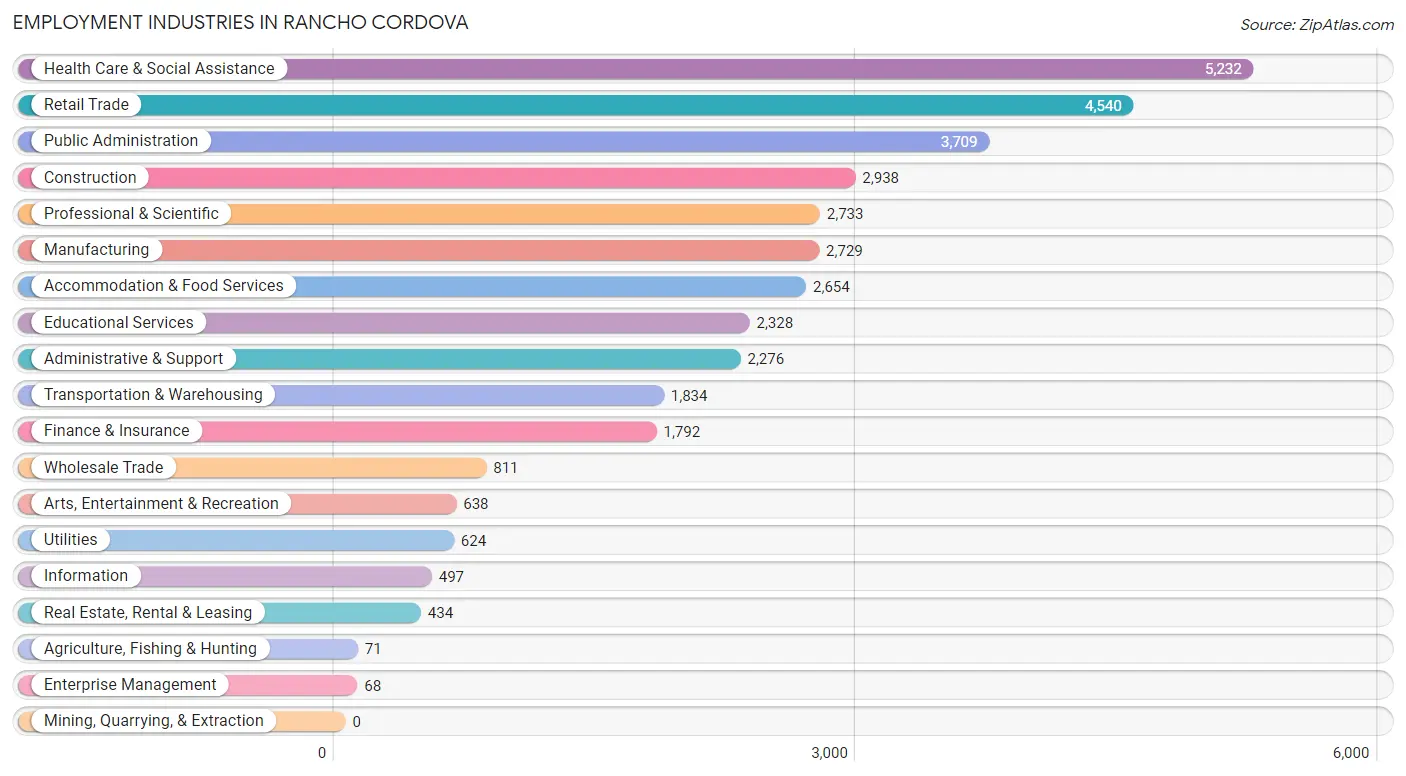
Employment Industries in Rancho Cordova
The major employment industries in Rancho Cordova include Health Care & Social Assistance (5,232 | 14.0%), Retail Trade (4,540 | 12.1%), Public Administration (3,709 | 9.9%), Construction (2,938 | 7.9%), and Professional & Scientific (2,733 | 7.3%).
Employment Industries by Sex in Rancho Cordova
The Rancho Cordova industries that see more men than women are Agriculture, Fishing & Hunting (100.0%), Construction (84.7%), and Transportation & Warehousing (76.5%), whereas the industries that tend to have a higher number of women are Enterprise Management (77.9%), Health Care & Social Assistance (76.1%), and Educational Services (70.9%).
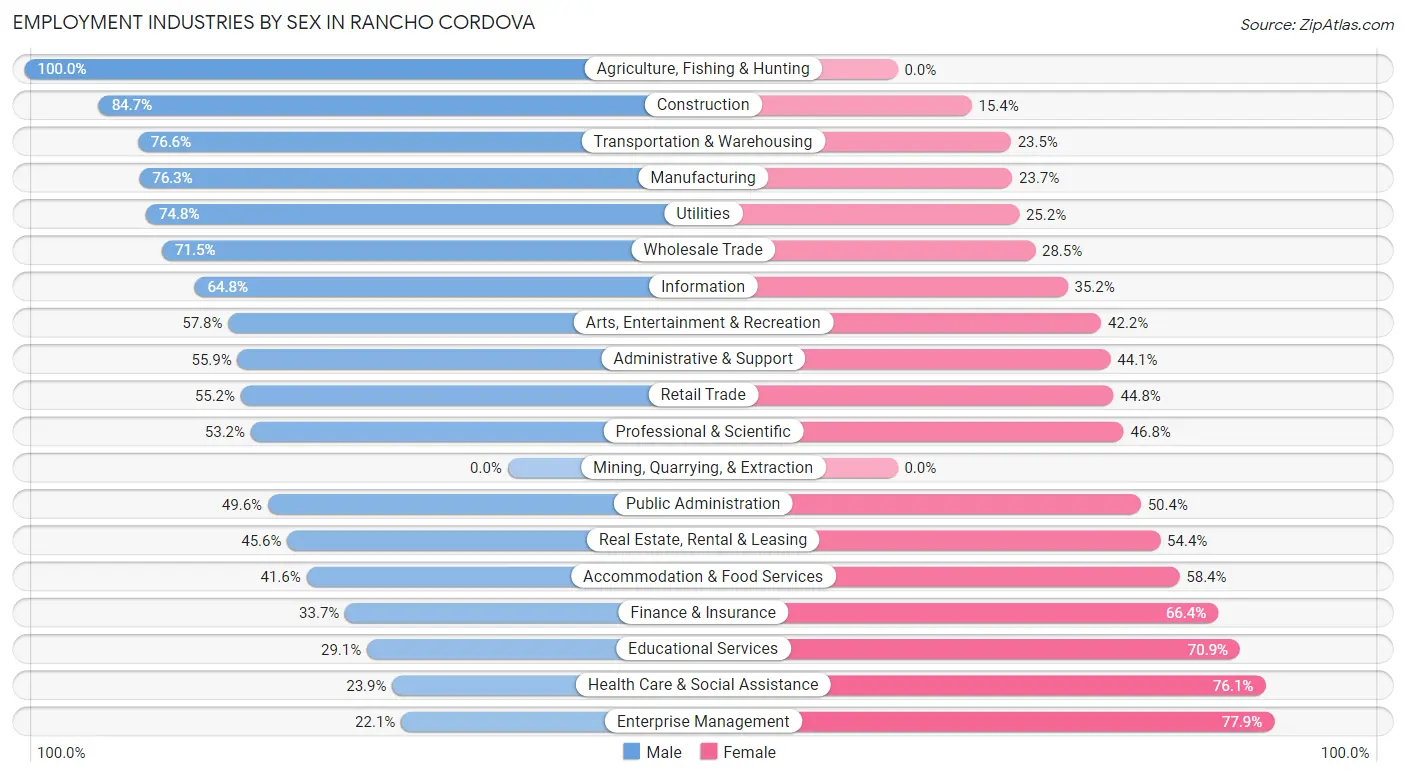
| Industry | Male | Female |
| Agriculture, Fishing & Hunting | 71 (100.0%) | 0 (0.0%) |
| Mining, Quarrying, & Extraction | 0 (0.0%) | 0 (0.0%) |
| Construction | 2,487 (84.7%) | 451 (15.3%) |
| Manufacturing | 2,081 (76.3%) | 648 (23.7%) |
| Wholesale Trade | 580 (71.5%) | 231 (28.5%) |
| Retail Trade | 2,508 (55.2%) | 2,032 (44.8%) |
| Transportation & Warehousing | 1,404 (76.5%) | 430 (23.4%) |
| Utilities | 467 (74.8%) | 157 (25.2%) |
| Information | 322 (64.8%) | 175 (35.2%) |
| Finance & Insurance | 603 (33.7%) | 1,189 (66.3%) |
| Real Estate, Rental & Leasing | 198 (45.6%) | 236 (54.4%) |
| Professional & Scientific | 1,453 (53.2%) | 1,280 (46.8%) |
| Enterprise Management | 15 (22.1%) | 53 (77.9%) |
| Administrative & Support | 1,273 (55.9%) | 1,003 (44.1%) |
| Educational Services | 678 (29.1%) | 1,650 (70.9%) |
| Health Care & Social Assistance | 1,250 (23.9%) | 3,982 (76.1%) |
| Arts, Entertainment & Recreation | 369 (57.8%) | 269 (42.2%) |
| Accommodation & Food Services | 1,105 (41.6%) | 1,549 (58.4%) |
| Public Administration | 1,841 (49.6%) | 1,868 (50.4%) |
| Total | 19,419 (51.9%) | 18,007 (48.1%) |
Education in Rancho Cordova
School Enrollment in Rancho Cordova
The most common levels of schooling among the 21,012 students in Rancho Cordova are college / undergraduate (5,035 | 24.0%), middle school (4,488 | 21.4%), and elementary school (4,115 | 19.6%).
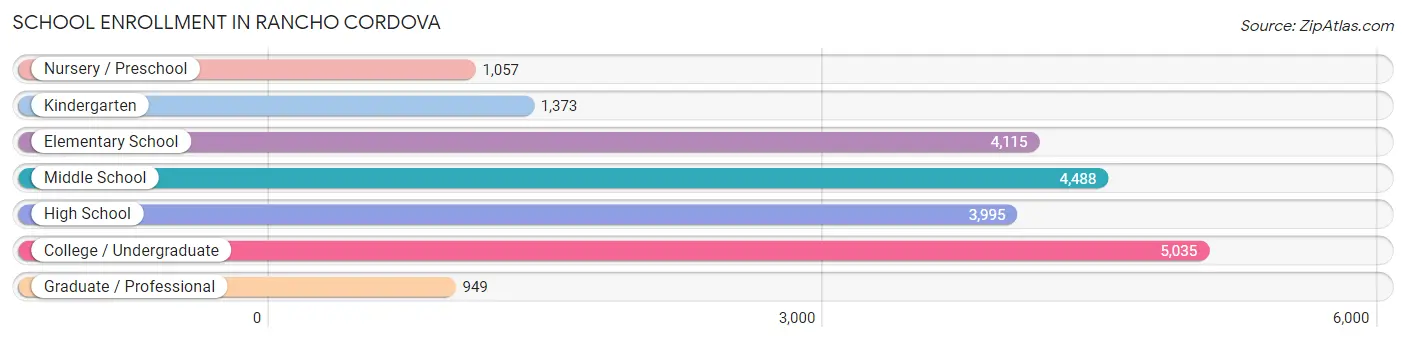
| School Level | # Students | % Students |
| Nursery / Preschool | 1,057 | 5.0% |
| Kindergarten | 1,373 | 6.5% |
| Elementary School | 4,115 | 19.6% |
| Middle School | 4,488 | 21.4% |
| High School | 3,995 | 19.0% |
| College / Undergraduate | 5,035 | 24.0% |
| Graduate / Professional | 949 | 4.5% |
| Total | 21,012 | 100.0% |
School Enrollment by Age by Funding Source in Rancho Cordova
Out of a total of 21,012 students who are enrolled in schools in Rancho Cordova, 2,816 (13.4%) attend a private institution, while the remaining 18,196 (86.6%) are enrolled in public schools. The age group of 3 to 4 year olds has the highest likelihood of being enrolled in private schools, with 340 (38.6% in the age bracket) enrolled. Conversely, the age group of 20 to 24 year olds has the lowest likelihood of being enrolled in a private school, with 2,005 (93.5% in the age bracket) attending a public institution.
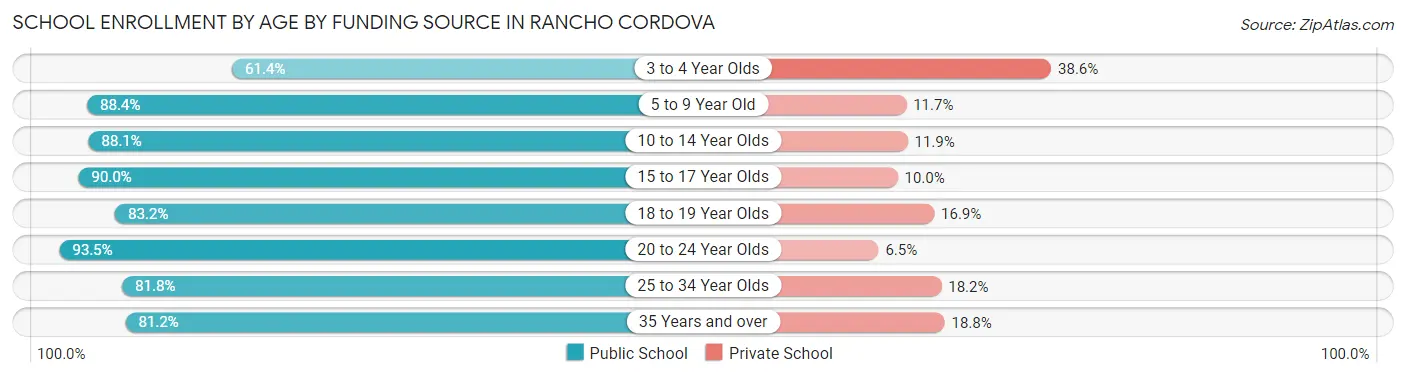
| Age Bracket | Public School | Private School |
| 3 to 4 Year Olds | 540 (61.4%) | 340 (38.6%) |
| 5 to 9 Year Old | 4,536 (88.3%) | 598 (11.7%) |
| 10 to 14 Year Olds | 5,063 (88.1%) | 683 (11.9%) |
| 15 to 17 Year Olds | 2,566 (90.0%) | 286 (10.0%) |
| 18 to 19 Year Olds | 898 (83.2%) | 182 (16.9%) |
| 20 to 24 Year Olds | 2,005 (93.5%) | 139 (6.5%) |
| 25 to 34 Year Olds | 1,179 (81.8%) | 262 (18.2%) |
| 35 Years and over | 1,409 (81.2%) | 326 (18.8%) |
| Total | 18,196 (86.6%) | 2,816 (13.4%) |
Educational Attainment by Field of Study in Rancho Cordova
Business (3,172 | 18.8%), engineering (1,793 | 10.6%), science & technology (1,614 | 9.6%), arts & humanities (1,502 | 8.9%), and social sciences (1,406 | 8.3%) are the most common fields of study among 16,903 individuals in Rancho Cordova who have obtained a bachelor's degree or higher.
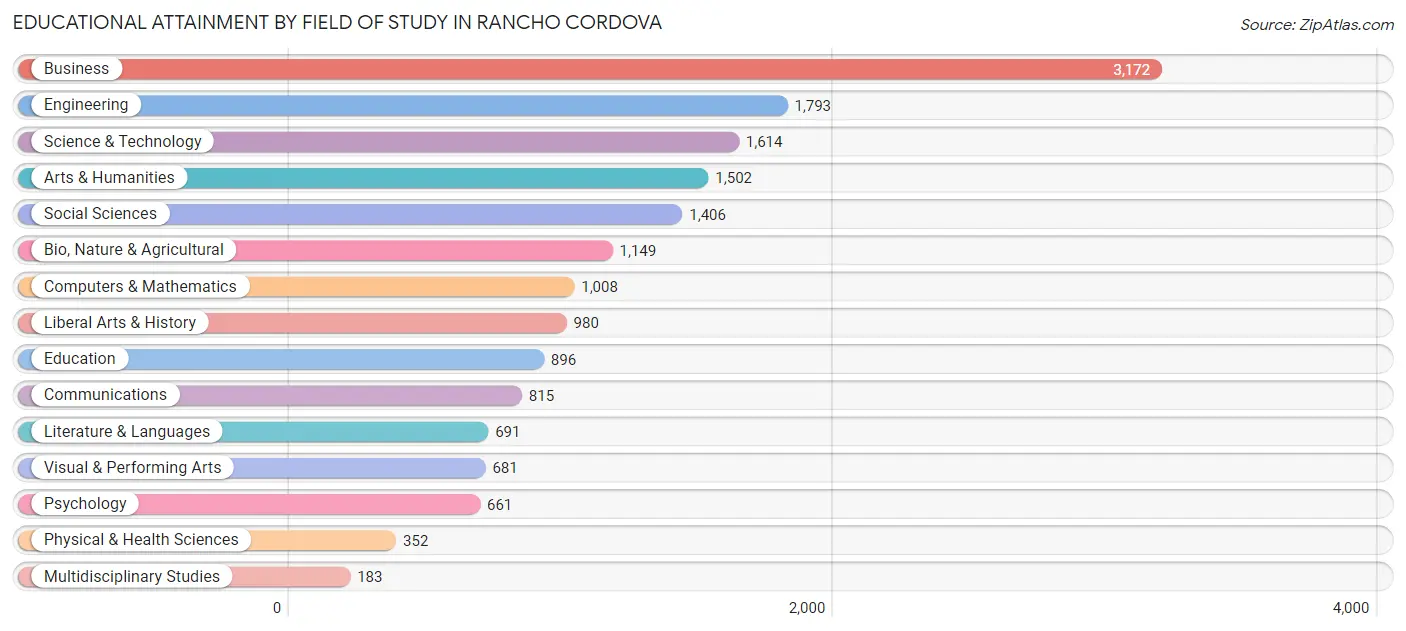
| Field of Study | # Graduates | % Graduates |
| Computers & Mathematics | 1,008 | 6.0% |
| Bio, Nature & Agricultural | 1,149 | 6.8% |
| Physical & Health Sciences | 352 | 2.1% |
| Psychology | 661 | 3.9% |
| Social Sciences | 1,406 | 8.3% |
| Engineering | 1,793 | 10.6% |
| Multidisciplinary Studies | 183 | 1.1% |
| Science & Technology | 1,614 | 9.6% |
| Business | 3,172 | 18.8% |
| Education | 896 | 5.3% |
| Literature & Languages | 691 | 4.1% |
| Liberal Arts & History | 980 | 5.8% |
| Visual & Performing Arts | 681 | 4.0% |
| Communications | 815 | 4.8% |
| Arts & Humanities | 1,502 | 8.9% |
| Total | 16,903 | 100.0% |
Transportation & Commute in Rancho Cordova
Vehicle Availability by Sex in Rancho Cordova
The most prevalent vehicle ownership categories in Rancho Cordova are males with 2 vehicles (7,570, accounting for 39.8%) and females with 2 vehicles (6,739, making up 44.2%).
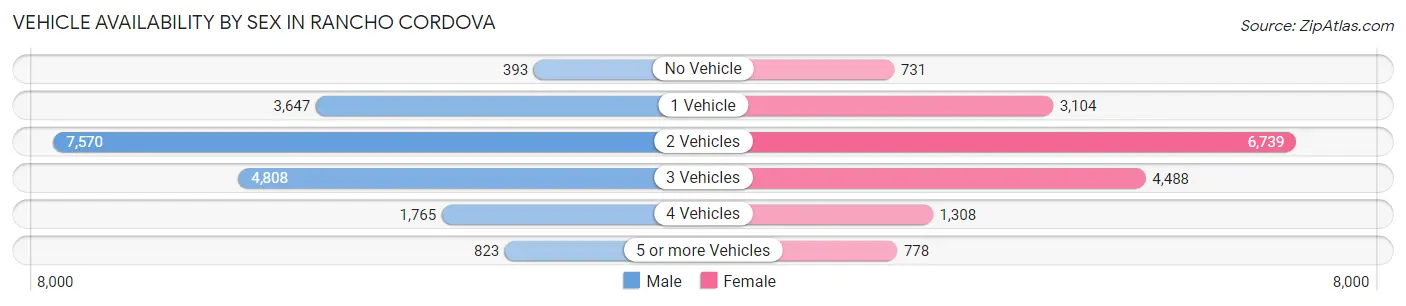
| Vehicles Available | Male | Female |
| No Vehicle | 393 (2.1%) | 731 (4.3%) |
| 1 Vehicle | 3,647 (19.2%) | 3,104 (18.1%) |
| 2 Vehicles | 7,570 (39.8%) | 6,739 (39.3%) |
| 3 Vehicles | 4,808 (25.3%) | 4,488 (26.2%) |
| 4 Vehicles | 1,765 (9.3%) | 1,308 (7.6%) |
| 5 or more Vehicles | 823 (4.3%) | 778 (4.5%) |
| Total | 19,006 (100.0%) | 17,148 (100.0%) |
Commute Time in Rancho Cordova
The most frequently occuring commute durations in Rancho Cordova are 30 to 34 minutes (5,410 commuters, 17.5%), 20 to 24 minutes (4,928 commuters, 16.0%), and 15 to 19 minutes (4,225 commuters, 13.7%).
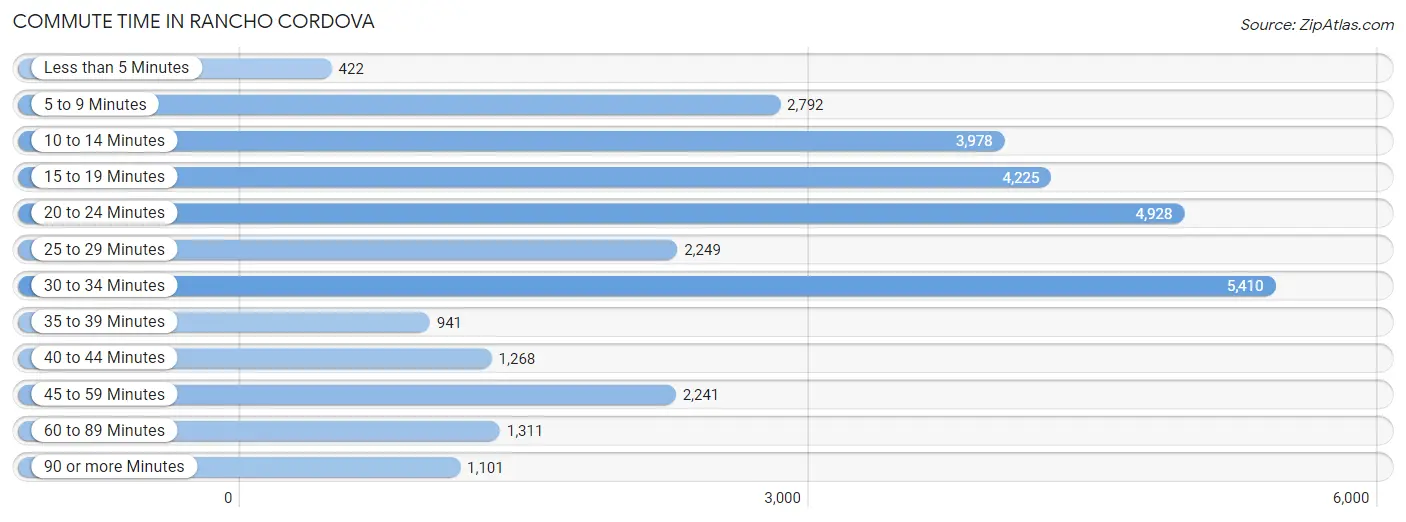
| Commute Time | # Commuters | % Commuters |
| Less than 5 Minutes | 422 | 1.4% |
| 5 to 9 Minutes | 2,792 | 9.0% |
| 10 to 14 Minutes | 3,978 | 12.9% |
| 15 to 19 Minutes | 4,225 | 13.7% |
| 20 to 24 Minutes | 4,928 | 16.0% |
| 25 to 29 Minutes | 2,249 | 7.3% |
| 30 to 34 Minutes | 5,410 | 17.5% |
| 35 to 39 Minutes | 941 | 3.0% |
| 40 to 44 Minutes | 1,268 | 4.1% |
| 45 to 59 Minutes | 2,241 | 7.3% |
| 60 to 89 Minutes | 1,311 | 4.3% |
| 90 or more Minutes | 1,101 | 3.6% |
Commute Time by Sex in Rancho Cordova
The most common commute times in Rancho Cordova are 30 to 34 minutes (2,975 commuters, 17.8%) for males and 30 to 34 minutes (2,435 commuters, 17.2%) for females.
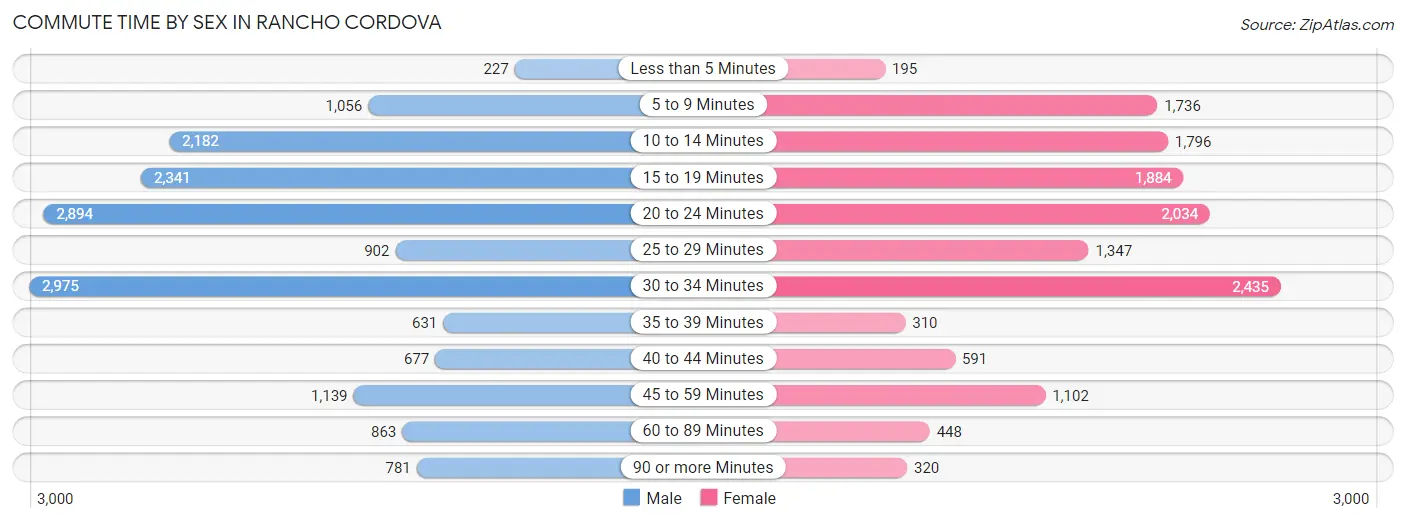
| Commute Time | Male | Female |
| Less than 5 Minutes | 227 (1.4%) | 195 (1.4%) |
| 5 to 9 Minutes | 1,056 (6.3%) | 1,736 (12.2%) |
| 10 to 14 Minutes | 2,182 (13.1%) | 1,796 (12.7%) |
| 15 to 19 Minutes | 2,341 (14.0%) | 1,884 (13.3%) |
| 20 to 24 Minutes | 2,894 (17.4%) | 2,034 (14.3%) |
| 25 to 29 Minutes | 902 (5.4%) | 1,347 (9.5%) |
| 30 to 34 Minutes | 2,975 (17.8%) | 2,435 (17.2%) |
| 35 to 39 Minutes | 631 (3.8%) | 310 (2.2%) |
| 40 to 44 Minutes | 677 (4.1%) | 591 (4.2%) |
| 45 to 59 Minutes | 1,139 (6.8%) | 1,102 (7.8%) |
| 60 to 89 Minutes | 863 (5.2%) | 448 (3.2%) |
| 90 or more Minutes | 781 (4.7%) | 320 (2.2%) |
Time of Departure to Work by Sex in Rancho Cordova
The most frequent times of departure to work in Rancho Cordova are 7:00 AM to 7:29 AM (2,206, 13.2%) for males and 7:00 AM to 7:29 AM (1,979, 13.9%) for females.
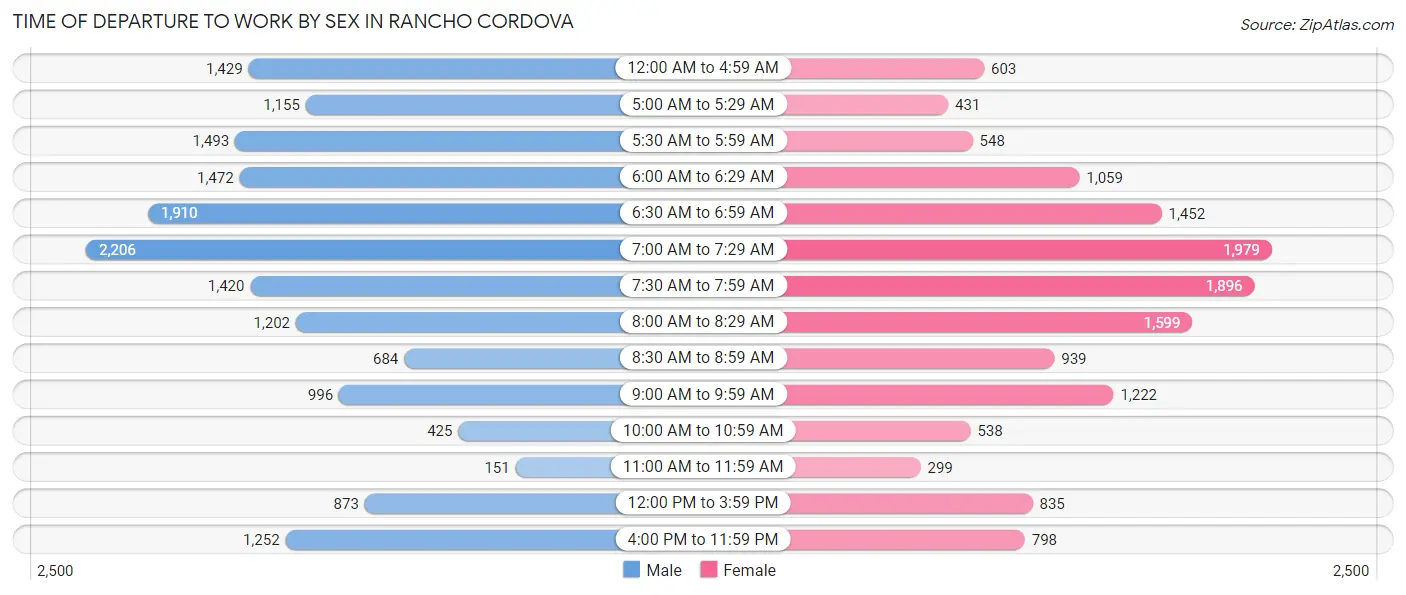
| Time of Departure | Male | Female |
| 12:00 AM to 4:59 AM | 1,429 (8.6%) | 603 (4.3%) |
| 5:00 AM to 5:29 AM | 1,155 (6.9%) | 431 (3.0%) |
| 5:30 AM to 5:59 AM | 1,493 (9.0%) | 548 (3.9%) |
| 6:00 AM to 6:29 AM | 1,472 (8.8%) | 1,059 (7.5%) |
| 6:30 AM to 6:59 AM | 1,910 (11.5%) | 1,452 (10.2%) |
| 7:00 AM to 7:29 AM | 2,206 (13.2%) | 1,979 (13.9%) |
| 7:30 AM to 7:59 AM | 1,420 (8.5%) | 1,896 (13.4%) |
| 8:00 AM to 8:29 AM | 1,202 (7.2%) | 1,599 (11.3%) |
| 8:30 AM to 8:59 AM | 684 (4.1%) | 939 (6.6%) |
| 9:00 AM to 9:59 AM | 996 (6.0%) | 1,222 (8.6%) |
| 10:00 AM to 10:59 AM | 425 (2.5%) | 538 (3.8%) |
| 11:00 AM to 11:59 AM | 151 (0.9%) | 299 (2.1%) |
| 12:00 PM to 3:59 PM | 873 (5.2%) | 835 (5.9%) |
| 4:00 PM to 11:59 PM | 1,252 (7.5%) | 798 (5.6%) |
| Total | 16,668 (100.0%) | 14,198 (100.0%) |
Housing Occupancy in Rancho Cordova
Occupancy by Ownership in Rancho Cordova
Of the total 27,339 dwellings in Rancho Cordova, owner-occupied units account for 15,903 (58.2%), while renter-occupied units make up 11,436 (41.8%).
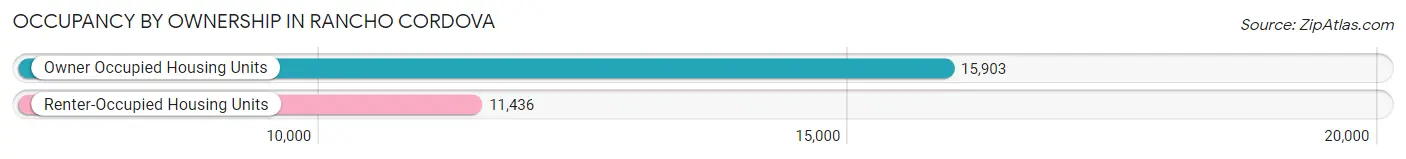
| Occupancy | # Housing Units | % Housing Units |
| Owner Occupied Housing Units | 15,903 | 58.2% |
| Renter-Occupied Housing Units | 11,436 | 41.8% |
| Total Occupied Housing Units | 27,339 | 100.0% |
Occupancy by Household Size in Rancho Cordova
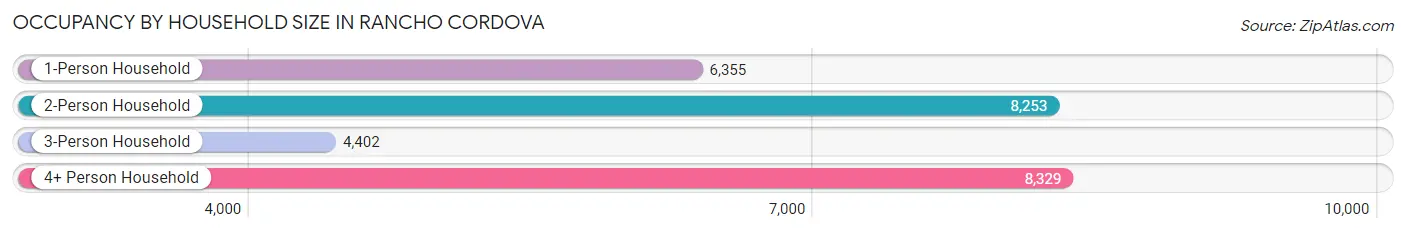
| Household Size | # Housing Units | % Housing Units |
| 1-Person Household | 6,355 | 23.3% |
| 2-Person Household | 8,253 | 30.2% |
| 3-Person Household | 4,402 | 16.1% |
| 4+ Person Household | 8,329 | 30.5% |
| Total Housing Units | 27,339 | 100.0% |
Occupancy by Ownership by Household Size in Rancho Cordova
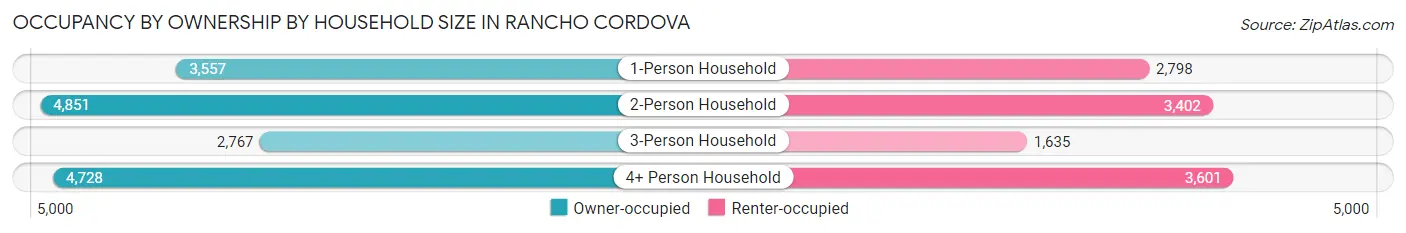
| Household Size | Owner-occupied | Renter-occupied |
| 1-Person Household | 3,557 (56.0%) | 2,798 (44.0%) |
| 2-Person Household | 4,851 (58.8%) | 3,402 (41.2%) |
| 3-Person Household | 2,767 (62.9%) | 1,635 (37.1%) |
| 4+ Person Household | 4,728 (56.8%) | 3,601 (43.2%) |
| Total Housing Units | 15,903 (58.2%) | 11,436 (41.8%) |
Occupancy by Educational Attainment in Rancho Cordova
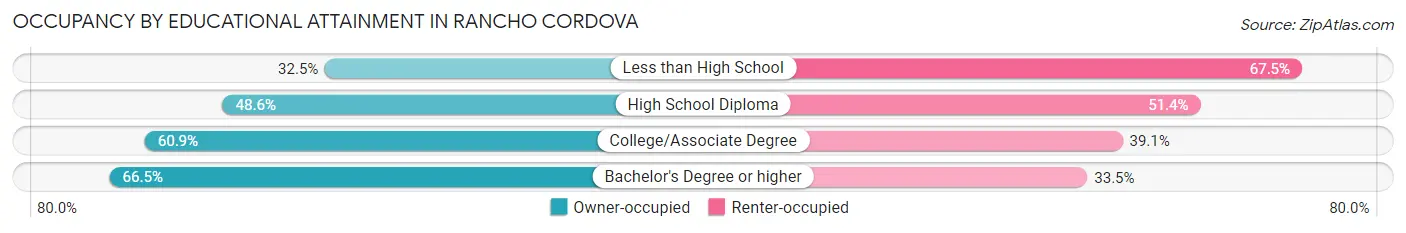
| Household Size | Owner-occupied | Renter-occupied |
| Less than High School | 691 (32.5%) | 1,436 (67.5%) |
| High School Diploma | 2,569 (48.6%) | 2,719 (51.4%) |
| College/Associate Degree | 6,613 (60.9%) | 4,243 (39.1%) |
| Bachelor's Degree or higher | 6,030 (66.5%) | 3,038 (33.5%) |
Occupancy by Age of Householder in Rancho Cordova
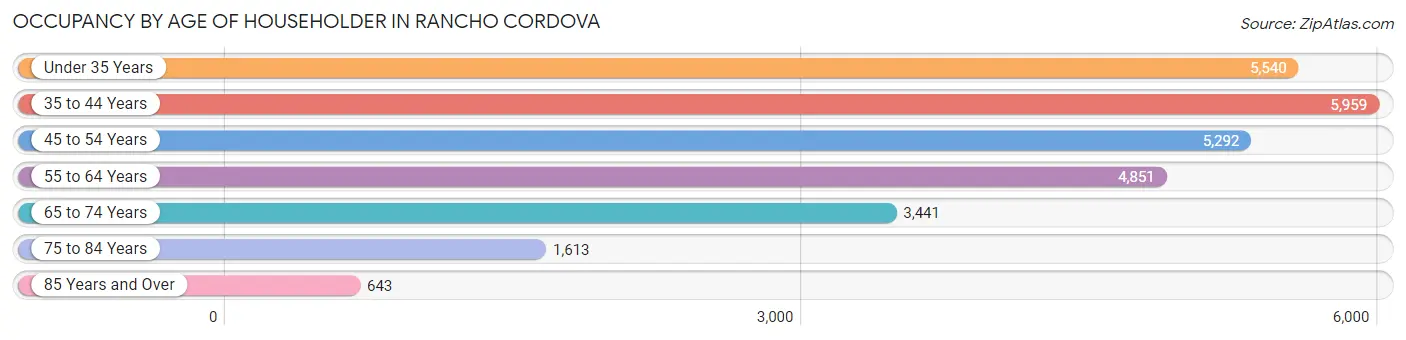
| Age Bracket | # Households | % Households |
| Under 35 Years | 5,540 | 20.3% |
| 35 to 44 Years | 5,959 | 21.8% |
| 45 to 54 Years | 5,292 | 19.4% |
| 55 to 64 Years | 4,851 | 17.7% |
| 65 to 74 Years | 3,441 | 12.6% |
| 75 to 84 Years | 1,613 | 5.9% |
| 85 Years and Over | 643 | 2.4% |
| Total | 27,339 | 100.0% |
Housing Finances in Rancho Cordova
Median Income by Occupancy in Rancho Cordova
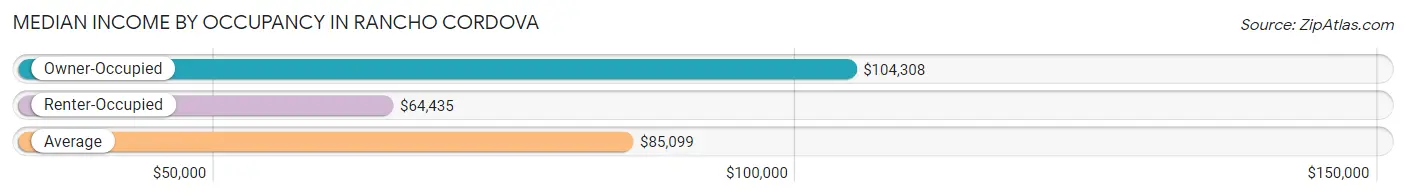
| Occupancy Type | # Households | Median Income |
| Owner-Occupied | 15,903 (58.2%) | $104,308 |
| Renter-Occupied | 11,436 (41.8%) | $64,435 |
| Average | 27,339 (100.0%) | $85,099 |
Occupancy by Householder Income Bracket in Rancho Cordova
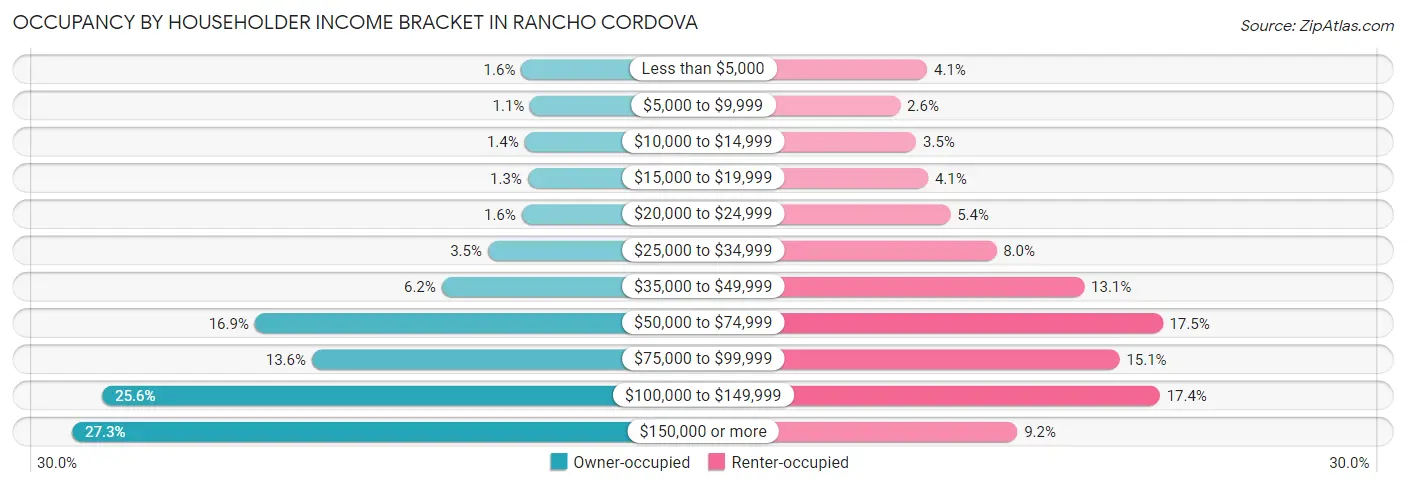
| Income Bracket | Owner-occupied | Renter-occupied |
| Less than $5,000 | 257 (1.6%) | 468 (4.1%) |
| $5,000 to $9,999 | 176 (1.1%) | 292 (2.5%) |
| $10,000 to $14,999 | 228 (1.4%) | 396 (3.5%) |
| $15,000 to $19,999 | 199 (1.3%) | 473 (4.1%) |
| $20,000 to $24,999 | 255 (1.6%) | 619 (5.4%) |
| $25,000 to $34,999 | 561 (3.5%) | 919 (8.0%) |
| $35,000 to $49,999 | 982 (6.2%) | 1,494 (13.1%) |
| $50,000 to $74,999 | 2,680 (16.9%) | 2,006 (17.5%) |
| $75,000 to $99,999 | 2,161 (13.6%) | 1,724 (15.1%) |
| $100,000 to $149,999 | 4,066 (25.6%) | 1,988 (17.4%) |
| $150,000 or more | 4,338 (27.3%) | 1,057 (9.2%) |
| Total | 15,903 (100.0%) | 11,436 (100.0%) |
Monthly Housing Cost Tiers in Rancho Cordova
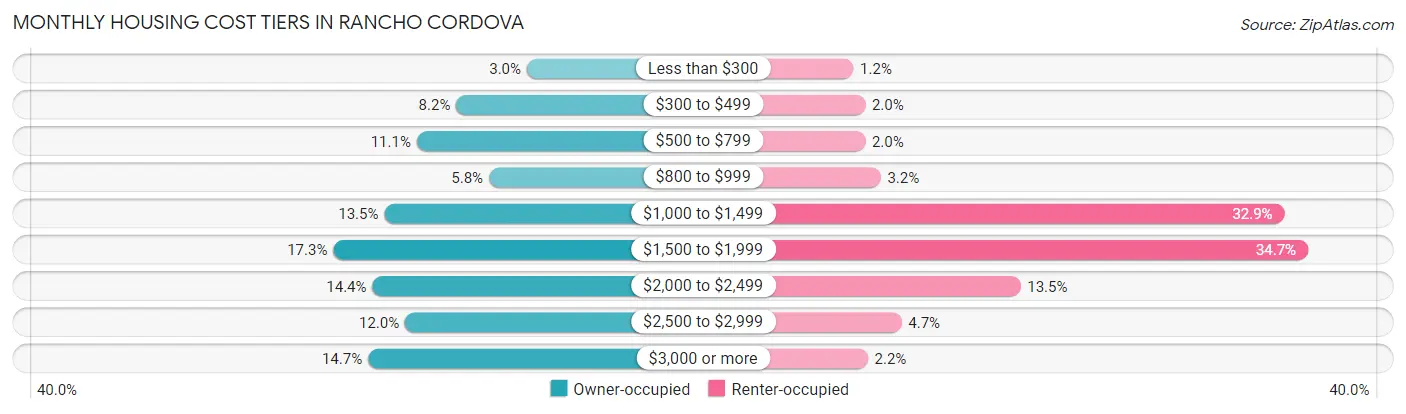
| Monthly Cost | Owner-occupied | Renter-occupied |
| Less than $300 | 478 (3.0%) | 133 (1.2%) |
| $300 to $499 | 1,305 (8.2%) | 232 (2.0%) |
| $500 to $799 | 1,769 (11.1%) | 232 (2.0%) |
| $800 to $999 | 923 (5.8%) | 362 (3.2%) |
| $1,000 to $1,499 | 2,148 (13.5%) | 3,765 (32.9%) |
| $1,500 to $1,999 | 2,747 (17.3%) | 3,963 (34.6%) |
| $2,000 to $2,499 | 2,289 (14.4%) | 1,540 (13.5%) |
| $2,500 to $2,999 | 1,905 (12.0%) | 539 (4.7%) |
| $3,000 or more | 2,339 (14.7%) | 254 (2.2%) |
| Total | 15,903 (100.0%) | 11,436 (100.0%) |
Physical Housing Characteristics in Rancho Cordova
Housing Structures in Rancho Cordova
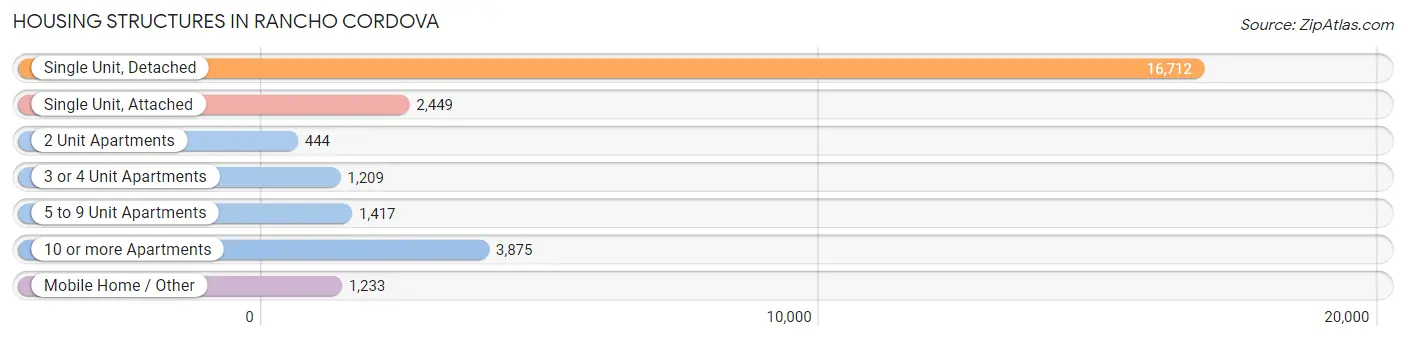
| Structure Type | # Housing Units | % Housing Units |
| Single Unit, Detached | 16,712 | 61.1% |
| Single Unit, Attached | 2,449 | 9.0% |
| 2 Unit Apartments | 444 | 1.6% |
| 3 or 4 Unit Apartments | 1,209 | 4.4% |
| 5 to 9 Unit Apartments | 1,417 | 5.2% |
| 10 or more Apartments | 3,875 | 14.2% |
| Mobile Home / Other | 1,233 | 4.5% |
| Total | 27,339 | 100.0% |
Housing Structures by Occupancy in Rancho Cordova
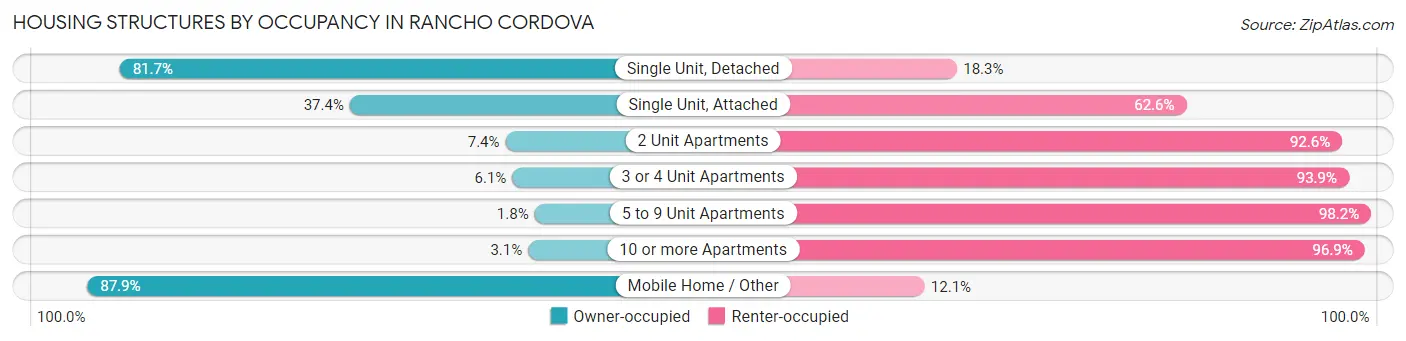
| Structure Type | Owner-occupied | Renter-occupied |
| Single Unit, Detached | 13,651 (81.7%) | 3,061 (18.3%) |
| Single Unit, Attached | 916 (37.4%) | 1,533 (62.6%) |
| 2 Unit Apartments | 33 (7.4%) | 411 (92.6%) |
| 3 or 4 Unit Apartments | 74 (6.1%) | 1,135 (93.9%) |
| 5 to 9 Unit Apartments | 26 (1.8%) | 1,391 (98.2%) |
| 10 or more Apartments | 119 (3.1%) | 3,756 (96.9%) |
| Mobile Home / Other | 1,084 (87.9%) | 149 (12.1%) |
| Total | 15,903 (58.2%) | 11,436 (41.8%) |
Housing Structures by Number of Rooms in Rancho Cordova
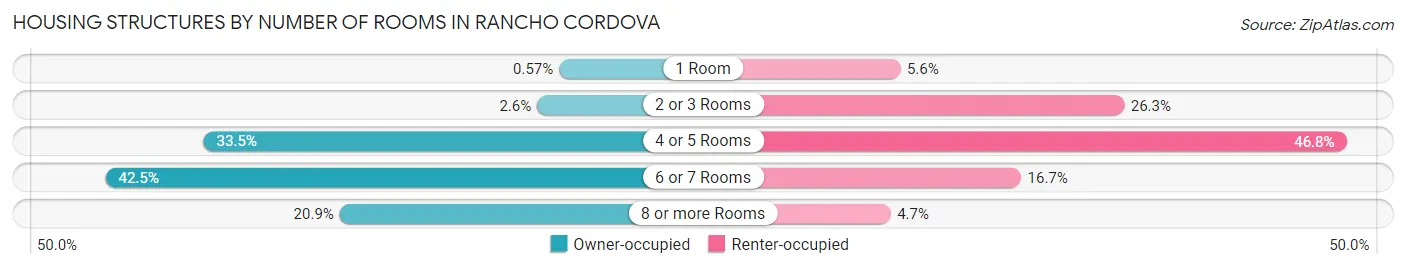
| Number of Rooms | Owner-occupied | Renter-occupied |
| 1 Room | 90 (0.6%) | 635 (5.6%) |
| 2 or 3 Rooms | 415 (2.6%) | 3,002 (26.3%) |
| 4 or 5 Rooms | 5,319 (33.5%) | 5,356 (46.8%) |
| 6 or 7 Rooms | 6,761 (42.5%) | 1,911 (16.7%) |
| 8 or more Rooms | 3,318 (20.9%) | 532 (4.6%) |
| Total | 15,903 (100.0%) | 11,436 (100.0%) |
Housing Structure by Heating Type in Rancho Cordova
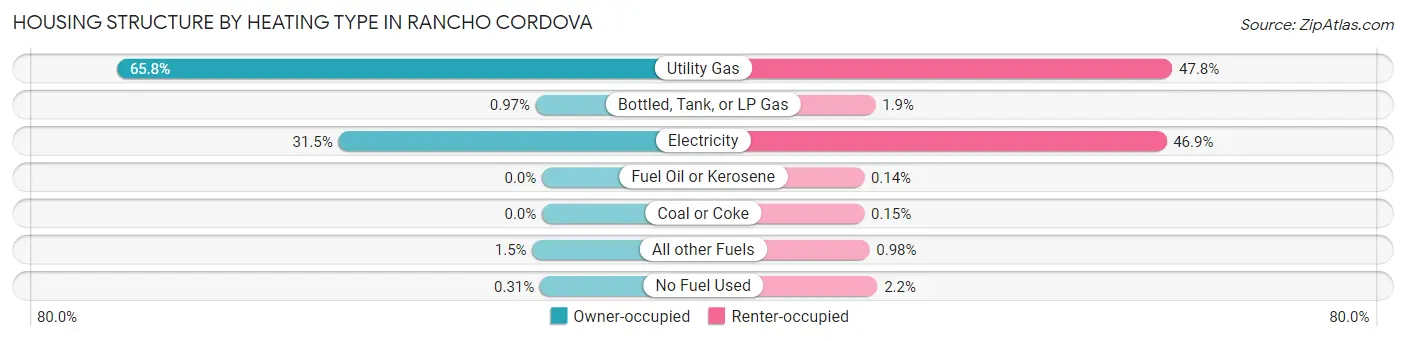
| Heating Type | Owner-occupied | Renter-occupied |
| Utility Gas | 10,456 (65.7%) | 5,464 (47.8%) |
| Bottled, Tank, or LP Gas | 155 (1.0%) | 216 (1.9%) |
| Electricity | 5,004 (31.5%) | 5,360 (46.9%) |
| Fuel Oil or Kerosene | 0 (0.0%) | 16 (0.1%) |
| Coal or Coke | 0 (0.0%) | 17 (0.2%) |
| All other Fuels | 238 (1.5%) | 112 (1.0%) |
| No Fuel Used | 50 (0.3%) | 251 (2.2%) |
| Total | 15,903 (100.0%) | 11,436 (100.0%) |
Household Vehicle Usage in Rancho Cordova
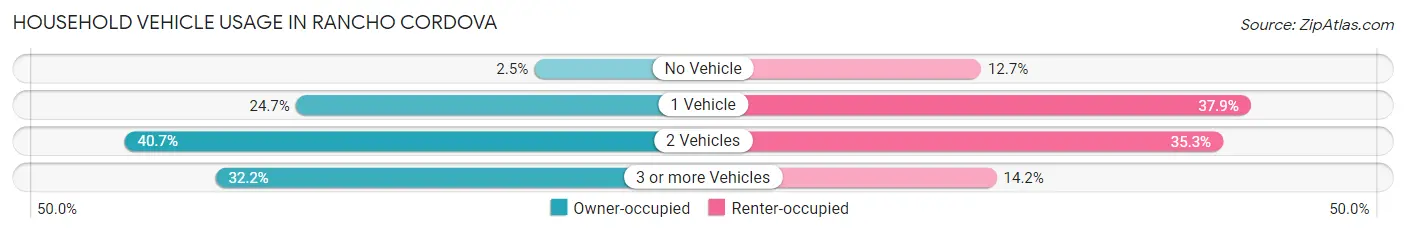
| Vehicles per Household | Owner-occupied | Renter-occupied |
| No Vehicle | 389 (2.5%) | 1,452 (12.7%) |
| 1 Vehicle | 3,928 (24.7%) | 4,330 (37.9%) |
| 2 Vehicles | 6,468 (40.7%) | 4,035 (35.3%) |
| 3 or more Vehicles | 5,118 (32.2%) | 1,619 (14.2%) |
| Total | 15,903 (100.0%) | 11,436 (100.0%) |
Real Estate & Mortgages in Rancho Cordova
Real Estate and Mortgage Overview in Rancho Cordova
| Characteristic | Without Mortgage | With Mortgage |
| Housing Units | 4,667 | 11,236 |
| Median Property Value | $354,300 | $437,700 |
| Median Household Income | $73,191 | $3,660 |
| Monthly Housing Costs | $600 | $2,333 |
| Real Estate Taxes | $1,955 | $185 |
Property Value by Mortgage Status in Rancho Cordova
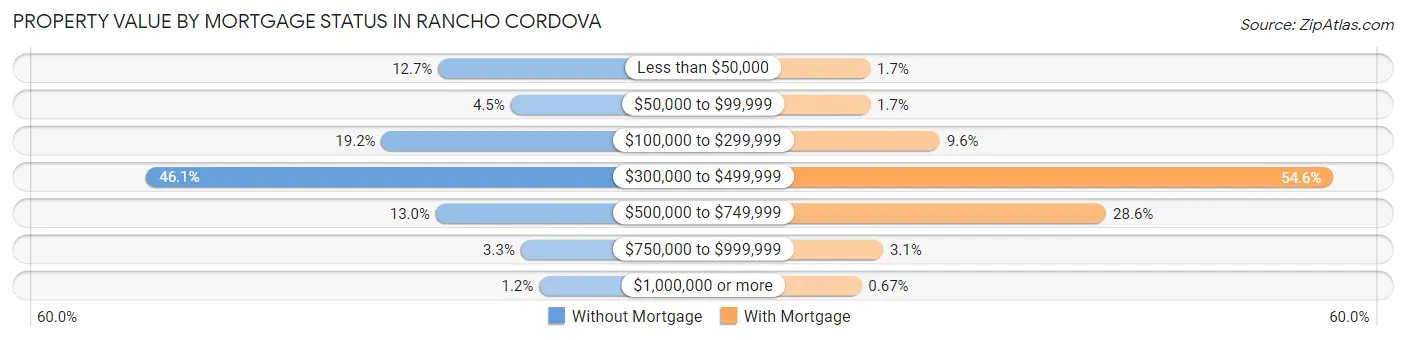
| Property Value | Without Mortgage | With Mortgage |
| Less than $50,000 | 594 (12.7%) | 187 (1.7%) |
| $50,000 to $99,999 | 208 (4.5%) | 186 (1.7%) |
| $100,000 to $299,999 | 897 (19.2%) | 1,082 (9.6%) |
| $300,000 to $499,999 | 2,151 (46.1%) | 6,135 (54.6%) |
| $500,000 to $749,999 | 607 (13.0%) | 3,218 (28.6%) |
| $750,000 to $999,999 | 154 (3.3%) | 353 (3.1%) |
| $1,000,000 or more | 56 (1.2%) | 75 (0.7%) |
| Total | 4,667 (100.0%) | 11,236 (100.0%) |
Household Income by Mortgage Status in Rancho Cordova
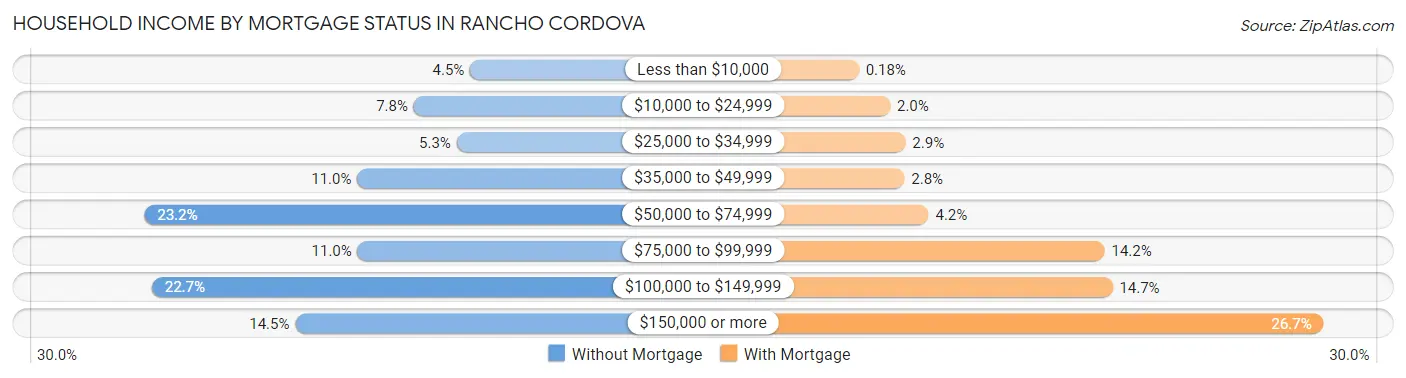
| Household Income | Without Mortgage | With Mortgage |
| Less than $10,000 | 212 (4.5%) | 20 (0.2%) |
| $10,000 to $24,999 | 362 (7.8%) | 221 (2.0%) |
| $25,000 to $34,999 | 248 (5.3%) | 320 (2.9%) |
| $35,000 to $49,999 | 513 (11.0%) | 313 (2.8%) |
| $50,000 to $74,999 | 1,081 (23.2%) | 469 (4.2%) |
| $75,000 to $99,999 | 512 (11.0%) | 1,599 (14.2%) |
| $100,000 to $149,999 | 1,061 (22.7%) | 1,649 (14.7%) |
| $150,000 or more | 678 (14.5%) | 3,005 (26.7%) |
| Total | 4,667 (100.0%) | 11,236 (100.0%) |
Property Value to Household Income Ratio in Rancho Cordova
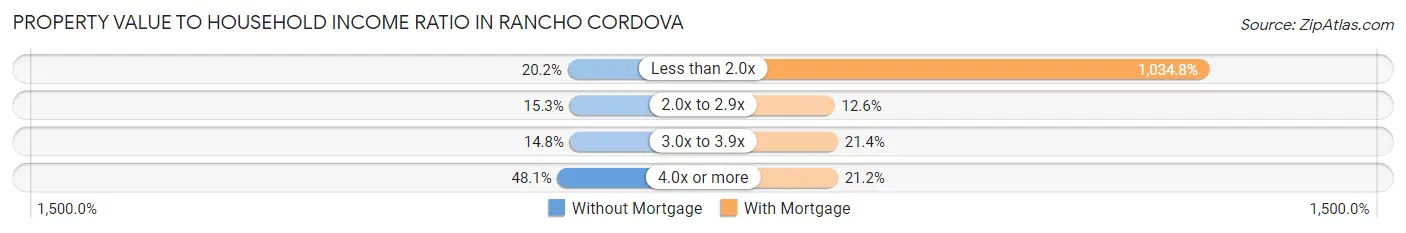
| Value-to-Income Ratio | Without Mortgage | With Mortgage |
| Less than 2.0x | 944 (20.2%) | 116,270 (1,034.8%) |
| 2.0x to 2.9x | 715 (15.3%) | 1,418 (12.6%) |
| 3.0x to 3.9x | 689 (14.8%) | 2,408 (21.4%) |
| 4.0x or more | 2,243 (48.1%) | 2,378 (21.2%) |
| Total | 4,667 (100.0%) | 11,236 (100.0%) |
Real Estate Taxes by Mortgage Status in Rancho Cordova
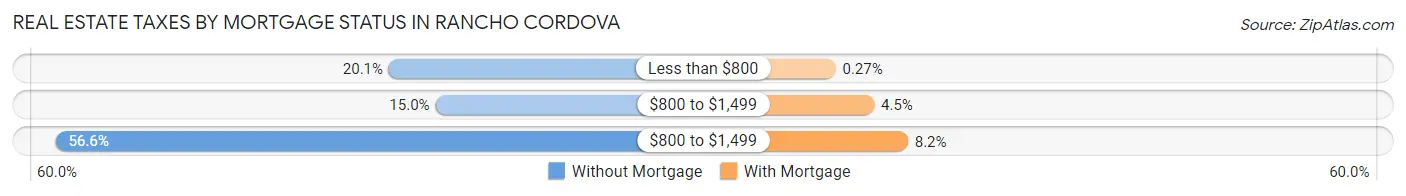
| Property Taxes | Without Mortgage | With Mortgage |
| Less than $800 | 937 (20.1%) | 30 (0.3%) |
| $800 to $1,499 | 699 (15.0%) | 506 (4.5%) |
| $800 to $1,499 | 2,642 (56.6%) | 920 (8.2%) |
| Total | 4,667 (100.0%) | 11,236 (100.0%) |
Health & Disability in Rancho Cordova
Health Insurance Coverage by Age in Rancho Cordova
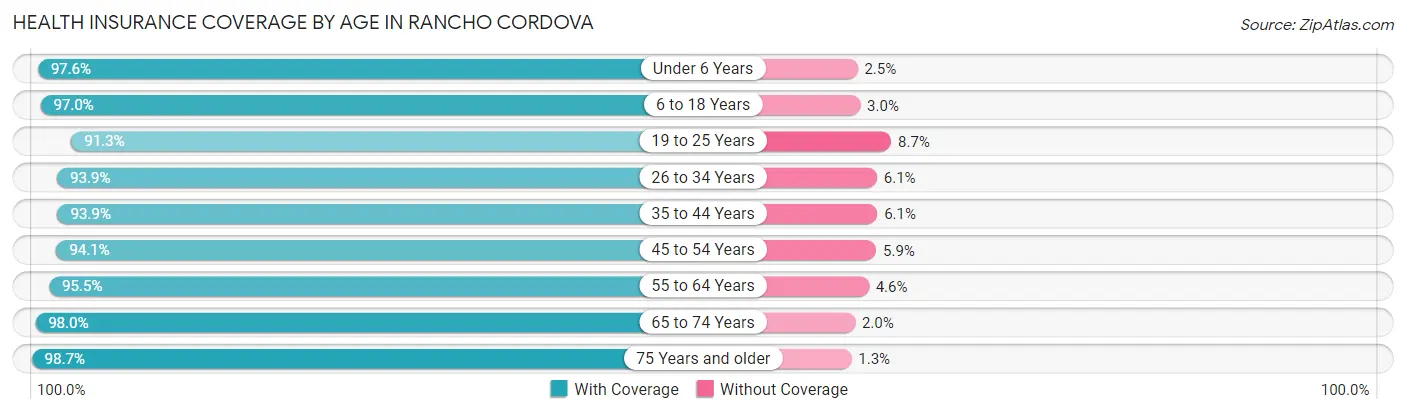
| Age Bracket | With Coverage | Without Coverage |
| Under 6 Years | 6,796 (97.6%) | 171 (2.5%) |
| 6 to 18 Years | 13,555 (97.0%) | 414 (3.0%) |
| 19 to 25 Years | 5,778 (91.3%) | 552 (8.7%) |
| 26 to 34 Years | 10,906 (93.9%) | 705 (6.1%) |
| 35 to 44 Years | 10,874 (93.9%) | 711 (6.1%) |
| 45 to 54 Years | 9,010 (94.1%) | 568 (5.9%) |
| 55 to 64 Years | 8,909 (95.5%) | 425 (4.5%) |
| 65 to 74 Years | 5,475 (98.0%) | 111 (2.0%) |
| 75 Years and older | 3,817 (98.7%) | 51 (1.3%) |
| Total | 75,120 (95.3%) | 3,708 (4.7%) |
Health Insurance Coverage by Citizenship Status in Rancho Cordova
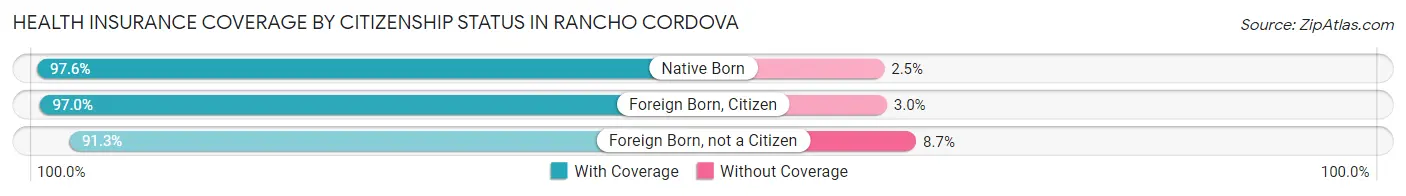
| Citizenship Status | With Coverage | Without Coverage |
| Native Born | 6,796 (97.6%) | 171 (2.5%) |
| Foreign Born, Citizen | 13,555 (97.0%) | 414 (3.0%) |
| Foreign Born, not a Citizen | 5,778 (91.3%) | 552 (8.7%) |
Health Insurance Coverage by Household Income in Rancho Cordova
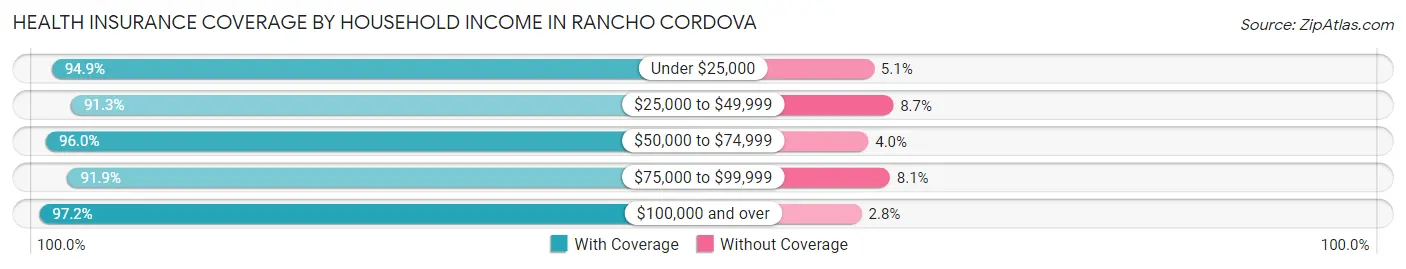
| Household Income | With Coverage | Without Coverage |
| Under $25,000 | 6,338 (94.9%) | 339 (5.1%) |
| $25,000 to $49,999 | 9,260 (91.3%) | 882 (8.7%) |
| $50,000 to $74,999 | 12,677 (96.0%) | 533 (4.0%) |
| $75,000 to $99,999 | 10,465 (91.9%) | 917 (8.1%) |
| $100,000 and over | 35,870 (97.2%) | 1,021 (2.8%) |
Public vs Private Health Insurance Coverage by Age in Rancho Cordova
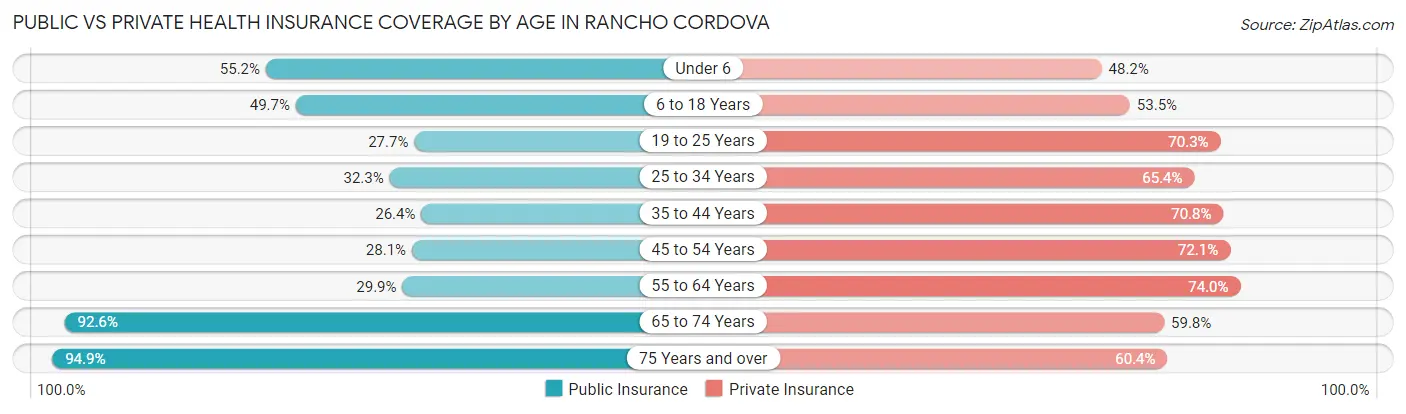
| Age Bracket | Public Insurance | Private Insurance |
| Under 6 | 3,847 (55.2%) | 3,360 (48.2%) |
| 6 to 18 Years | 6,938 (49.7%) | 7,470 (53.5%) |
| 19 to 25 Years | 1,752 (27.7%) | 4,448 (70.3%) |
| 25 to 34 Years | 3,746 (32.3%) | 7,597 (65.4%) |
| 35 to 44 Years | 3,054 (26.4%) | 8,204 (70.8%) |
| 45 to 54 Years | 2,692 (28.1%) | 6,902 (72.1%) |
| 55 to 64 Years | 2,789 (29.9%) | 6,904 (74.0%) |
| 65 to 74 Years | 5,171 (92.6%) | 3,342 (59.8%) |
| 75 Years and over | 3,669 (94.9%) | 2,337 (60.4%) |
| Total | 33,658 (42.7%) | 50,564 (64.1%) |
Disability Status by Sex by Age in Rancho Cordova
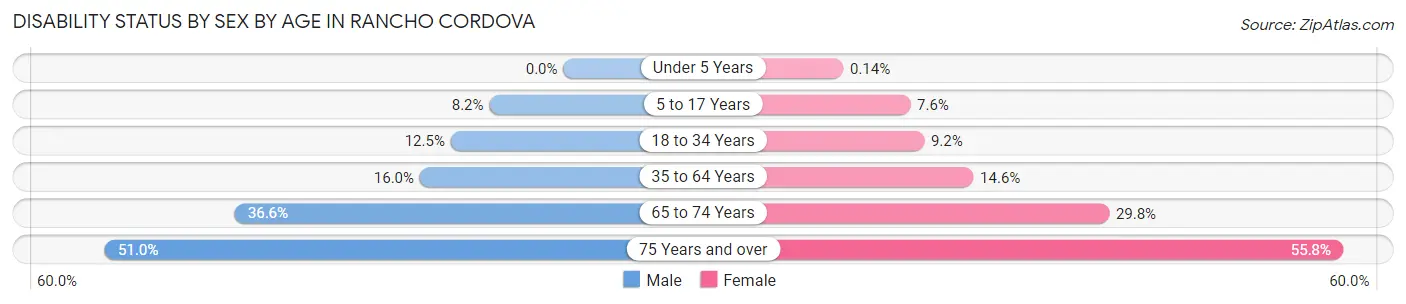
| Age Bracket | Male | Female |
| Under 5 Years | 0 (0.0%) | 4 (0.1%) |
| 5 to 17 Years | 601 (8.2%) | 528 (7.6%) |
| 18 to 34 Years | 1,140 (12.5%) | 899 (9.1%) |
| 35 to 64 Years | 2,463 (16.0%) | 2,207 (14.6%) |
| 65 to 74 Years | 965 (36.6%) | 877 (29.7%) |
| 75 Years and over | 689 (51.0%) | 1,405 (55.8%) |
Disability Class by Sex by Age in Rancho Cordova
Disability Class: Hearing Difficulty
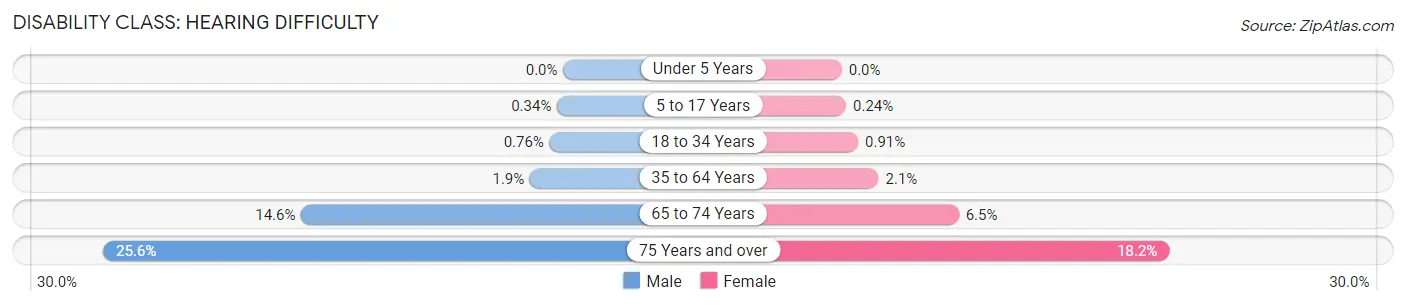
| Age Bracket | Male | Female |
| Under 5 Years | 0 (0.0%) | 0 (0.0%) |
| 5 to 17 Years | 25 (0.3%) | 17 (0.2%) |
| 18 to 34 Years | 69 (0.8%) | 89 (0.9%) |
| 35 to 64 Years | 285 (1.8%) | 310 (2.1%) |
| 65 to 74 Years | 385 (14.6%) | 192 (6.5%) |
| 75 Years and over | 346 (25.6%) | 459 (18.2%) |
Disability Class: Vision Difficulty
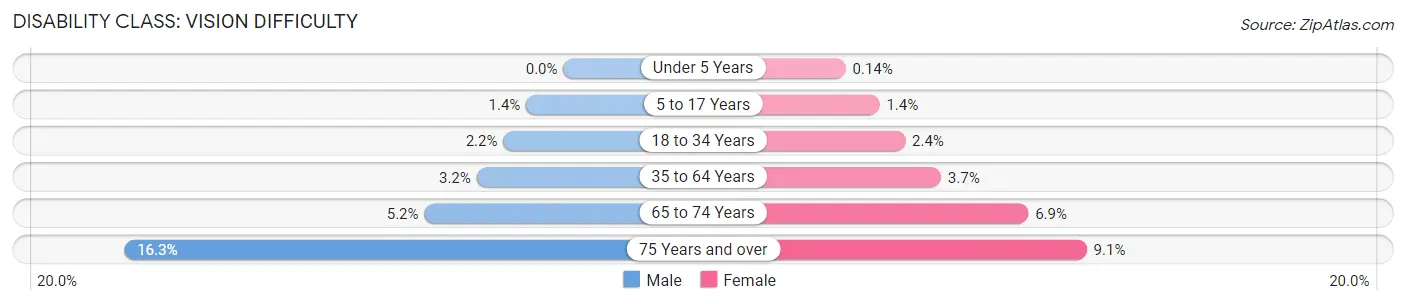
| Age Bracket | Male | Female |
| Under 5 Years | 0 (0.0%) | 4 (0.1%) |
| 5 to 17 Years | 101 (1.4%) | 97 (1.4%) |
| 18 to 34 Years | 203 (2.2%) | 231 (2.4%) |
| 35 to 64 Years | 496 (3.2%) | 555 (3.7%) |
| 65 to 74 Years | 136 (5.2%) | 204 (6.9%) |
| 75 Years and over | 220 (16.3%) | 229 (9.1%) |
Disability Class: Cognitive Difficulty
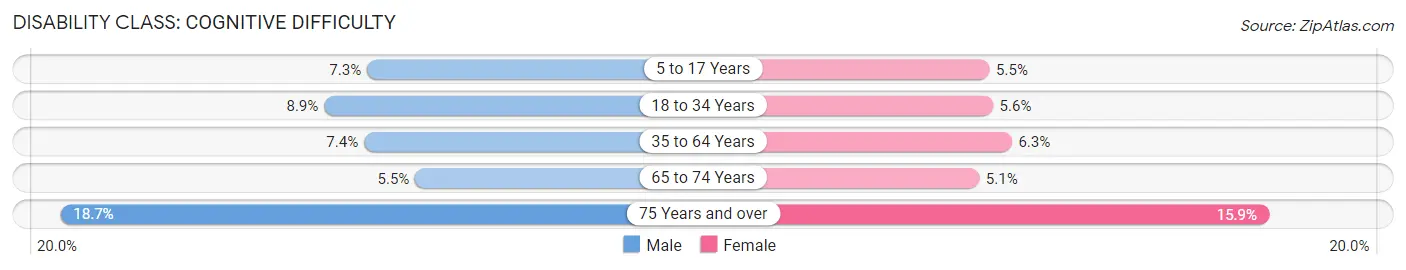
| Age Bracket | Male | Female |
| 5 to 17 Years | 532 (7.3%) | 380 (5.5%) |
| 18 to 34 Years | 807 (8.9%) | 550 (5.6%) |
| 35 to 64 Years | 1,140 (7.4%) | 951 (6.3%) |
| 65 to 74 Years | 145 (5.5%) | 150 (5.1%) |
| 75 Years and over | 252 (18.7%) | 399 (15.9%) |
Disability Class: Ambulatory Difficulty
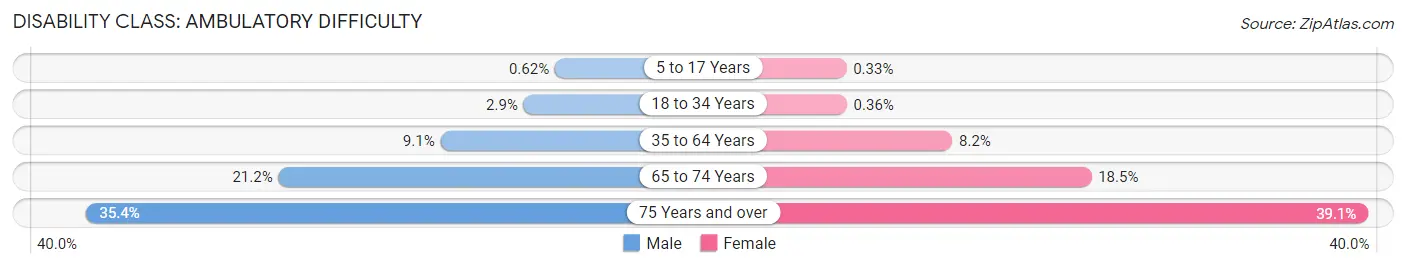
| Age Bracket | Male | Female |
| 5 to 17 Years | 45 (0.6%) | 23 (0.3%) |
| 18 to 34 Years | 267 (2.9%) | 35 (0.4%) |
| 35 to 64 Years | 1,405 (9.1%) | 1,235 (8.2%) |
| 65 to 74 Years | 558 (21.1%) | 546 (18.5%) |
| 75 Years and over | 478 (35.4%) | 984 (39.1%) |
Disability Class: Self-Care Difficulty
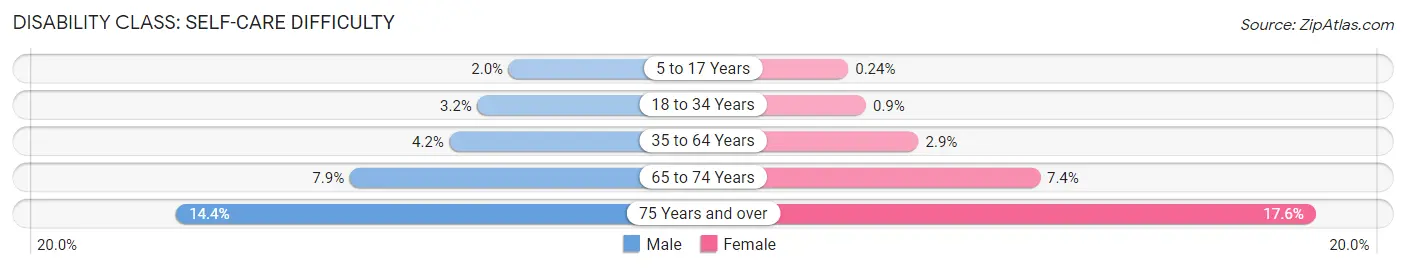
| Age Bracket | Male | Female |
| 5 to 17 Years | 147 (2.0%) | 17 (0.2%) |
| 18 to 34 Years | 289 (3.2%) | 88 (0.9%) |
| 35 to 64 Years | 651 (4.2%) | 430 (2.9%) |
| 65 to 74 Years | 209 (7.9%) | 217 (7.4%) |
| 75 Years and over | 194 (14.4%) | 443 (17.6%) |
Technology Access in Rancho Cordova
Computing Device Access in Rancho Cordova
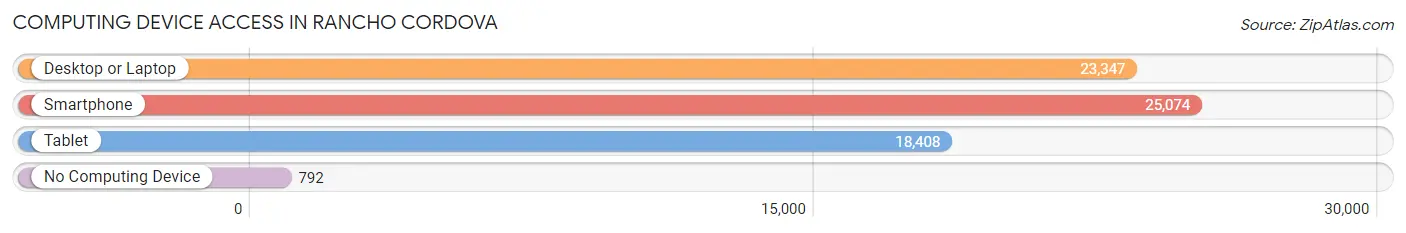
| Device Type | # Households | % Households |
| Desktop or Laptop | 23,347 | 85.4% |
| Smartphone | 25,074 | 91.7% |
| Tablet | 18,408 | 67.3% |
| No Computing Device | 792 | 2.9% |
| Total | 27,339 | 100.0% |
Internet Access in Rancho Cordova
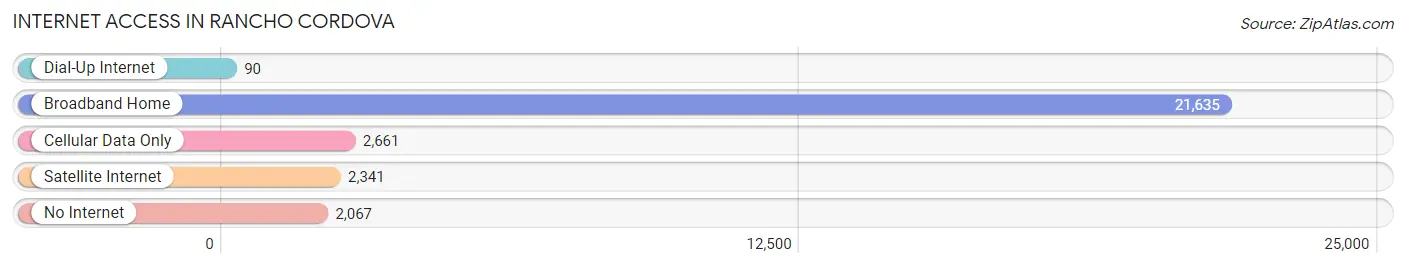
| Internet Type | # Households | % Households |
| Dial-Up Internet | 90 | 0.3% |
| Broadband Home | 21,635 | 79.1% |
| Cellular Data Only | 2,661 | 9.7% |
| Satellite Internet | 2,341 | 8.6% |
| No Internet | 2,067 | 7.6% |
| Total | 27,339 | 100.0% |
Rancho Cordova Summary
Rancho Cordova is a city located in Sacramento County, California, United States. It is part of the Sacramento–Arden-Arcade–Roseville Metropolitan Statistical Area. The population was 64,776 at the 2010 census. Rancho Cordova is the Sacramento area's largest employment sub-center, attracting over 50,000 commuters.
History
Rancho Cordova is a modern-day city that was founded in 2003. However, the history of the area dates back to the 18th century when it was part of a Spanish land grant known as Rancho Rio de los Americanos. The area was originally inhabited by the Miwok and Maidu Native American tribes.
In the mid-19th century, the area was settled by pioneers who established farms and ranches. The area was known as Mayhew’s Crossing and Hangtown Crossing during this time. In the late 19th century, the area was renamed Mills Station after a local postmaster.
In the early 20th century, the area was renamed Cordova after a local landowner. The area was annexed by the City of Sacramento in the 1950s and was officially incorporated as the City of Rancho Cordova in 2003.
Geography
Rancho Cordova is located at 38°35'17" North, 121°17'20" West (38.588, -121.289). It is situated in the Central Valley of California, approximately 20 miles east of Sacramento. The city is bordered by the cities of Folsom, Gold River, and Sacramento.
The city has a total area of 24.2 square miles, of which 24.1 square miles is land and 0.1 square miles is water. The city is located in the foothills of the Sierra Nevada mountain range and is home to several creeks and rivers, including the American River, Dry Creek, and the Sacramento River.
Economy
Rancho Cordova is a major employment center in the Sacramento area. The city is home to over 50,000 commuters and is the largest employment sub-center in the region. The city is home to several major employers, including Aerojet Rocketdyne, Intel, Kaiser Permanente, and VSP Global.
The city is also home to several shopping centers, including the Folsom Premium Outlets, the Sunrise Marketplace, and the Kavana Shopping Center.
Demographics
As of the 2010 census, the population of Rancho Cordova was 64,776. The racial makeup of the city was 57.2% White, 16.3% African American, 0.7% Native American, 11.2% Asian, 0.3% Pacific Islander, 9.7% from other races, and 4.7% from two or more races. Hispanic or Latino of any race were 20.2% of the population.
The median household income in the city was $63,837 and the median family income was $71,837. The per capita income was $27,837. About 8.3% of families and 11.2% of the population were below the poverty line, including 15.2% of those under age 18 and 6.2% of those age 65 or over.
Common Questions
What is Per Capita Income in Rancho Cordova?
Per Capita income in Rancho Cordova is $36,124.
What is the Median Family Income in Rancho Cordova?
Median Family Income in Rancho Cordova is $95,550.
What is the Median Household income in Rancho Cordova?
Median Household Income in Rancho Cordova is $85,099.
What is Income or Wage Gap in Rancho Cordova?
Income or Wage Gap in Rancho Cordova is 19.2%.
Women in Rancho Cordova earn 80.8 cents for every dollar earned by a man.
What is Family Income Deficit in Rancho Cordova?
Family Income Deficit in Rancho Cordova is $11,857.
Families that are below poverty line in Rancho Cordova earn $11,857 less on average than the poverty threshold level.
What is Inequality or Gini Index in Rancho Cordova?
Inequality or Gini Index in Rancho Cordova is 0.40.
What is the Total Population of Rancho Cordova?
Total Population of Rancho Cordova is 79,128.
What is the Total Male Population of Rancho Cordova?
Total Male Population of Rancho Cordova is 38,727.
What is the Total Female Population of Rancho Cordova?
Total Female Population of Rancho Cordova is 40,401.
What is the Ratio of Males per 100 Females in Rancho Cordova?
There are 95.86 Males per 100 Females in Rancho Cordova.
What is the Ratio of Females per 100 Males in Rancho Cordova?
There are 104.32 Females per 100 Males in Rancho Cordova.
What is the Median Population Age in Rancho Cordova?
Median Population Age in Rancho Cordova is 35.4 Years.
What is the Average Family Size in Rancho Cordova
Average Family Size in Rancho Cordova is 3.5 People.
What is the Average Household Size in Rancho Cordova
Average Household Size in Rancho Cordova is 2.9 People.
How Large is the Labor Force in Rancho Cordova?
There are 40,013 People in the Labor Forcein in Rancho Cordova.
What is the Percentage of People in the Labor Force in Rancho Cordova?
65.7% of People are in the Labor Force in Rancho Cordova.
What is the Unemployment Rate in Rancho Cordova?
Unemployment Rate in Rancho Cordova is 6.1%.