Prospect Heights, IL Map & Demographics
Prospect Heights Map
Prospect Heights Overview
$45,909
PER CAPITA INCOME
$97,694
AVG FAMILY INCOME
$84,459
AVG HOUSEHOLD INCOME
44.5%
WAGE / INCOME GAP [ % ]
55.5¢/ $1
WAGE / INCOME GAP [ $ ]
$12,796
FAMILY INCOME DEFICIT
0.45
INEQUALITY / GINI INDEX
15,861
TOTAL POPULATION
7,995
MALE POPULATION
7,866
FEMALE POPULATION
101.64
MALES / 100 FEMALES
98.39
FEMALES / 100 MALES
41.1
MEDIAN AGE
3.0
AVG FAMILY SIZE
2.5
AVG HOUSEHOLD SIZE
8,914
LABOR FORCE [ PEOPLE ]
70.2%
PERCENT IN LABOR FORCE
5.1%
UNEMPLOYMENT RATE
Prospect Heights Zip Codes
Income in Prospect Heights
Income Overview in Prospect Heights
Per Capita Income in Prospect Heights is $45,909, while median incomes of families and households are $97,694 and $84,459 respectively.
| Characteristic | Number | Measure |
| Per Capita Income | 15,861 | $45,909 |
| Median Family Income | 4,265 | $97,694 |
| Mean Family Income | 4,265 | $128,452 |
| Median Household Income | 6,286 | $84,459 |
| Mean Household Income | 6,286 | $113,073 |
| Income Deficit | 4,265 | $12,796 |
| Wage / Income Gap (%) | 15,861 | 44.47% |
| Wage / Income Gap ($) | 15,861 | 55.53¢ per $1 |
| Gini / Inequality Index | 15,861 | 0.45 |
Earnings by Sex in Prospect Heights
Average Earnings in Prospect Heights are $45,580, $56,929 for men and $31,615 for women, a difference of 44.5%.
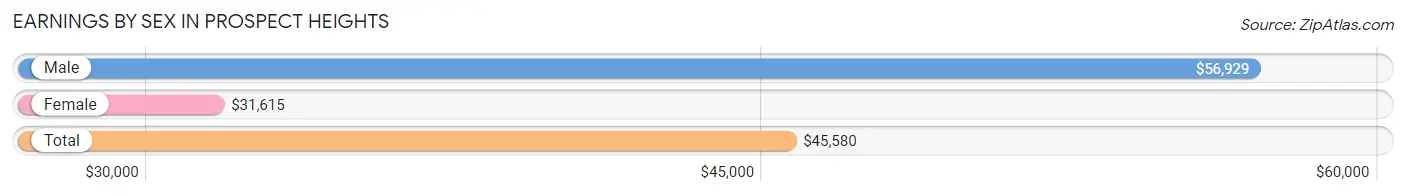
| Sex | Number | Average Earnings |
| Male | 4,885 (53.1%) | $56,929 |
| Female | 4,312 (46.9%) | $31,615 |
| Total | 9,197 (100.0%) | $45,580 |
Earnings by Sex by Income Bracket in Prospect Heights
The most common earnings brackets in Prospect Heights are $100,000+ for men (1,116 | 22.9%) and $25,000 to $29,999 for women (596 | 13.8%).
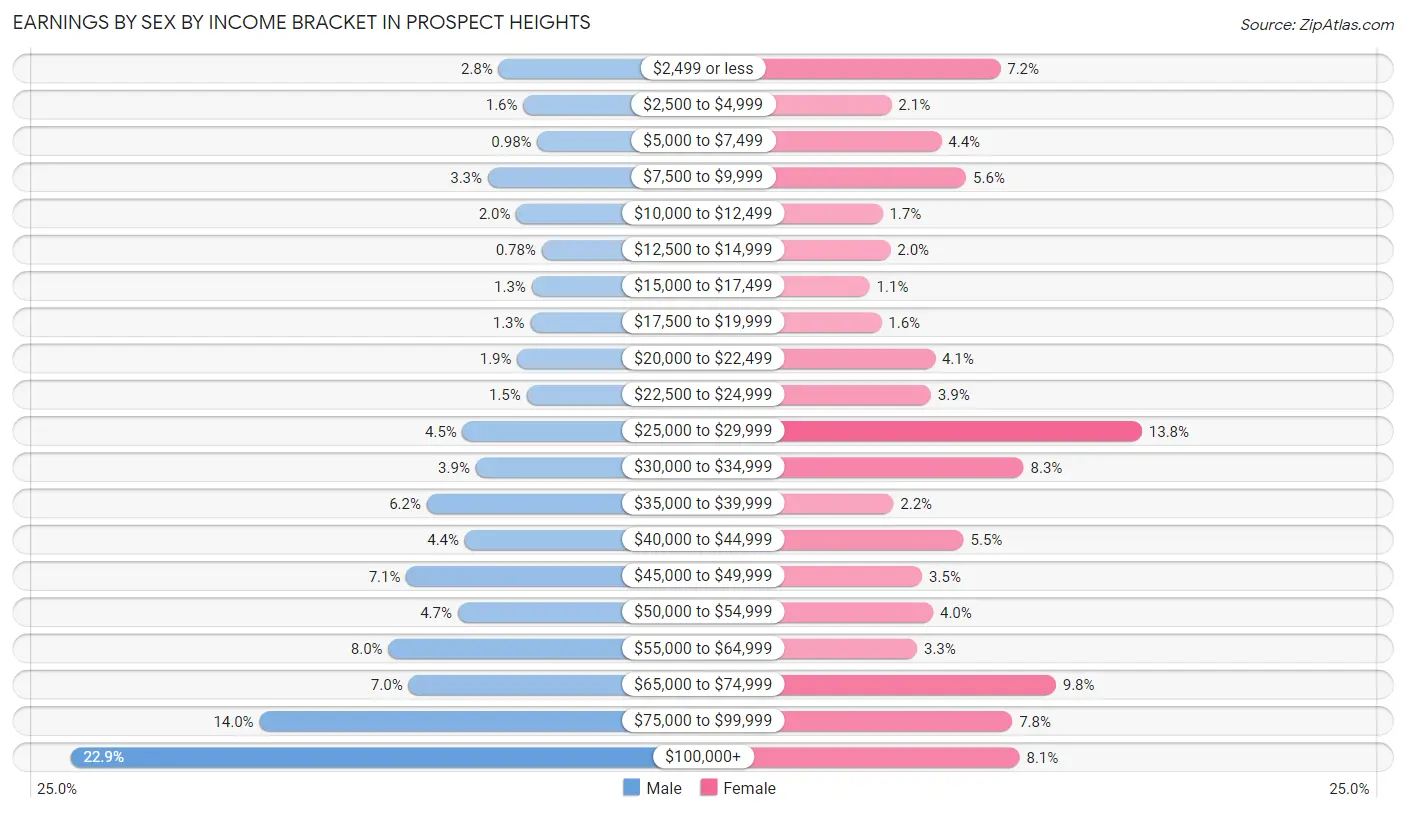
| Income | Male | Female |
| $2,499 or less | 137 (2.8%) | 310 (7.2%) |
| $2,500 to $4,999 | 80 (1.6%) | 90 (2.1%) |
| $5,000 to $7,499 | 48 (1.0%) | 191 (4.4%) |
| $7,500 to $9,999 | 161 (3.3%) | 241 (5.6%) |
| $10,000 to $12,499 | 96 (2.0%) | 72 (1.7%) |
| $12,500 to $14,999 | 38 (0.8%) | 88 (2.0%) |
| $15,000 to $17,499 | 61 (1.3%) | 46 (1.1%) |
| $17,500 to $19,999 | 64 (1.3%) | 70 (1.6%) |
| $20,000 to $22,499 | 94 (1.9%) | 178 (4.1%) |
| $22,500 to $24,999 | 73 (1.5%) | 170 (3.9%) |
| $25,000 to $29,999 | 219 (4.5%) | 596 (13.8%) |
| $30,000 to $34,999 | 189 (3.9%) | 357 (8.3%) |
| $35,000 to $39,999 | 301 (6.2%) | 94 (2.2%) |
| $40,000 to $44,999 | 214 (4.4%) | 236 (5.5%) |
| $45,000 to $49,999 | 348 (7.1%) | 152 (3.5%) |
| $50,000 to $54,999 | 230 (4.7%) | 174 (4.0%) |
| $55,000 to $64,999 | 389 (8.0%) | 142 (3.3%) |
| $65,000 to $74,999 | 343 (7.0%) | 422 (9.8%) |
| $75,000 to $99,999 | 684 (14.0%) | 334 (7.7%) |
| $100,000+ | 1,116 (22.9%) | 349 (8.1%) |
| Total | 4,885 (100.0%) | 4,312 (100.0%) |
Earnings by Sex by Educational Attainment in Prospect Heights
Average earnings in Prospect Heights are $61,316 for men and $33,386 for women, a difference of 45.6%. Men with an educational attainment of bachelor's degree enjoy the highest average annual earnings of $97,867, while those with less than high school education earn the least with $38,654. Women with an educational attainment of graduate degree earn the most with the average annual earnings of $69,625, while those with less than high school education have the smallest earnings of $24,306.
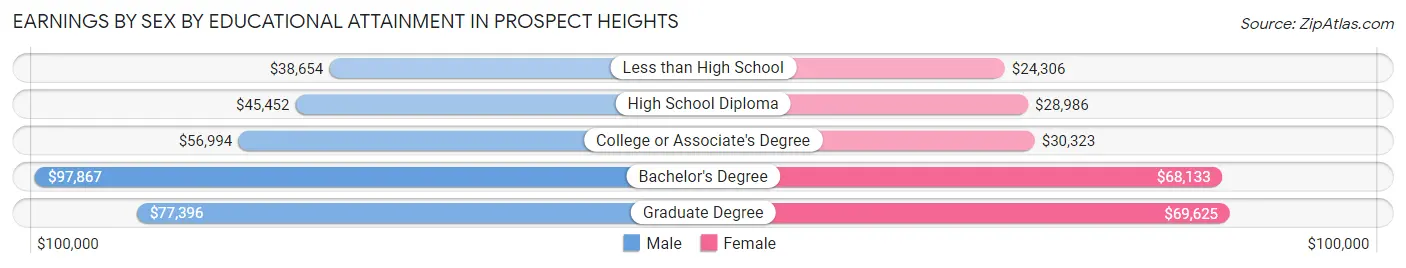
| Educational Attainment | Male Income | Female Income |
| Less than High School | $38,654 | $24,306 |
| High School Diploma | $45,452 | $28,986 |
| College or Associate's Degree | $56,994 | $30,323 |
| Bachelor's Degree | $97,867 | $68,133 |
| Graduate Degree | $77,396 | $69,625 |
| Total | $61,316 | $33,386 |
Family Income in Prospect Heights
Family Income Brackets in Prospect Heights
According to the Prospect Heights family income data, there are 930 families falling into the $100,000 to $149,999 income range, which is the most common income bracket and makes up 21.8% of all families. Conversely, the $10,000 to $14,999 income bracket is the least frequent group with only 21 families (0.5%) belonging to this category.
| Income Bracket | # Families | % Families |
| Less than $10,000 | 111 | 2.6% |
| $10,000 to $14,999 | 21 | 0.5% |
| $15,000 to $24,999 | 34 | 0.8% |
| $25,000 to $34,999 | 290 | 6.8% |
| $35,000 to $49,999 | 375 | 8.8% |
| $50,000 to $74,999 | 687 | 16.1% |
| $75,000 to $99,999 | 682 | 16.0% |
| $100,000 to $149,999 | 930 | 21.8% |
| $150,000 to $199,999 | 380 | 8.9% |
| $200,000+ | 759 | 17.8% |
Family Income by Famaliy Size in Prospect Heights
4-person families (576 | 13.5%) account for the highest median family income in Prospect Heights with $122,941 per family, while 2-person families (2,221 | 52.1%) have the highest median income of $49,428 per family member.
| Income Bracket | # Families | Median Income |
| 2-Person Families | 2,221 (52.1%) | $98,856 |
| 3-Person Families | 1,011 (23.7%) | $93,657 |
| 4-Person Families | 576 (13.5%) | $122,941 |
| 5-Person Families | 307 (7.2%) | $90,750 |
| 6-Person Families | 64 (1.5%) | $62,672 |
| 7+ Person Families | 86 (2.0%) | $0 |
| Total | 4,265 (100.0%) | $97,694 |
Family Income by Number of Earners in Prospect Heights
The median family income in Prospect Heights is $97,694, with families comprising 3+ earners (510) having the highest median family income of $142,167, while families with 1 earner (1,383) have the lowest median family income of $72,539, accounting for 12.0% and 32.4% of families, respectively.
| Number of Earners | # Families | Median Income |
| No Earners | 412 (9.7%) | $98,571 |
| 1 Earner | 1,383 (32.4%) | $72,539 |
| 2 Earners | 1,960 (46.0%) | $102,463 |
| 3+ Earners | 510 (12.0%) | $142,167 |
| Total | 4,265 (100.0%) | $97,694 |
Household Income in Prospect Heights
Household Income Brackets in Prospect Heights
With 1,150 households falling in the category, the $50,000 to $74,999 income range is the most frequent in Prospect Heights, accounting for 18.3% of all households. In contrast, only 82 households (1.3%) fall into the $10,000 to $14,999 income bracket, making it the least populous group.
| Income Bracket | # Households | % Households |
| Less than $10,000 | 207 | 3.3% |
| $10,000 to $14,999 | 82 | 1.3% |
| $15,000 to $24,999 | 195 | 3.1% |
| $25,000 to $34,999 | 572 | 9.1% |
| $35,000 to $49,999 | 773 | 12.3% |
| $50,000 to $74,999 | 1,150 | 18.3% |
| $75,000 to $99,999 | 754 | 12.0% |
| $100,000 to $149,999 | 1,125 | 17.9% |
| $150,000 to $199,999 | 515 | 8.2% |
| $200,000+ | 918 | 14.6% |
Household Income by Householder Age in Prospect Heights
The median household income in Prospect Heights is $84,459, with the highest median household income of $100,018 found in the 25 to 44 years age bracket for the primary householder. A total of 2,293 households (36.5%) fall into this category. Meanwhile, the 15 to 24 years age bracket for the primary householder has the lowest median household income of $40,938, with 84 households (1.3%) in this group.
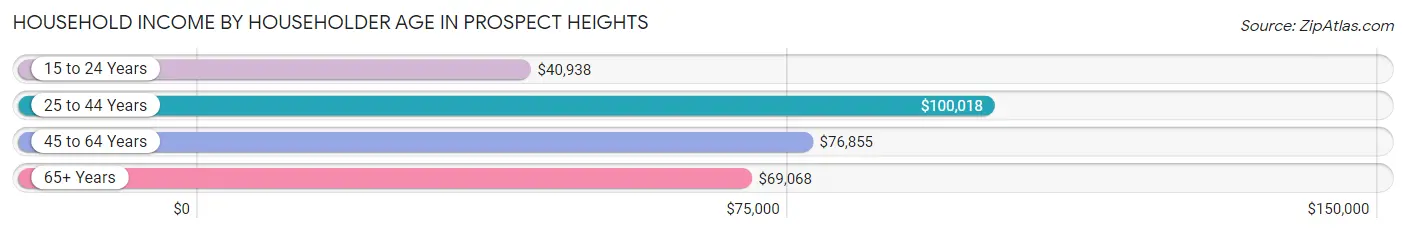
| Income Bracket | # Households | Median Income |
| 15 to 24 Years | 84 (1.3%) | $40,938 |
| 25 to 44 Years | 2,293 (36.5%) | $100,018 |
| 45 to 64 Years | 2,238 (35.6%) | $76,855 |
| 65+ Years | 1,671 (26.6%) | $69,068 |
| Total | 6,286 (100.0%) | $84,459 |
Poverty in Prospect Heights
Income Below Poverty by Sex and Age in Prospect Heights
With 6.5% poverty level for males and 9.9% for females among the residents of Prospect Heights, 15 year old males and 25 to 34 year old females are the most vulnerable to poverty, with 29 males (28.2%) and 199 females (17.1%) in their respective age groups living below the poverty level.
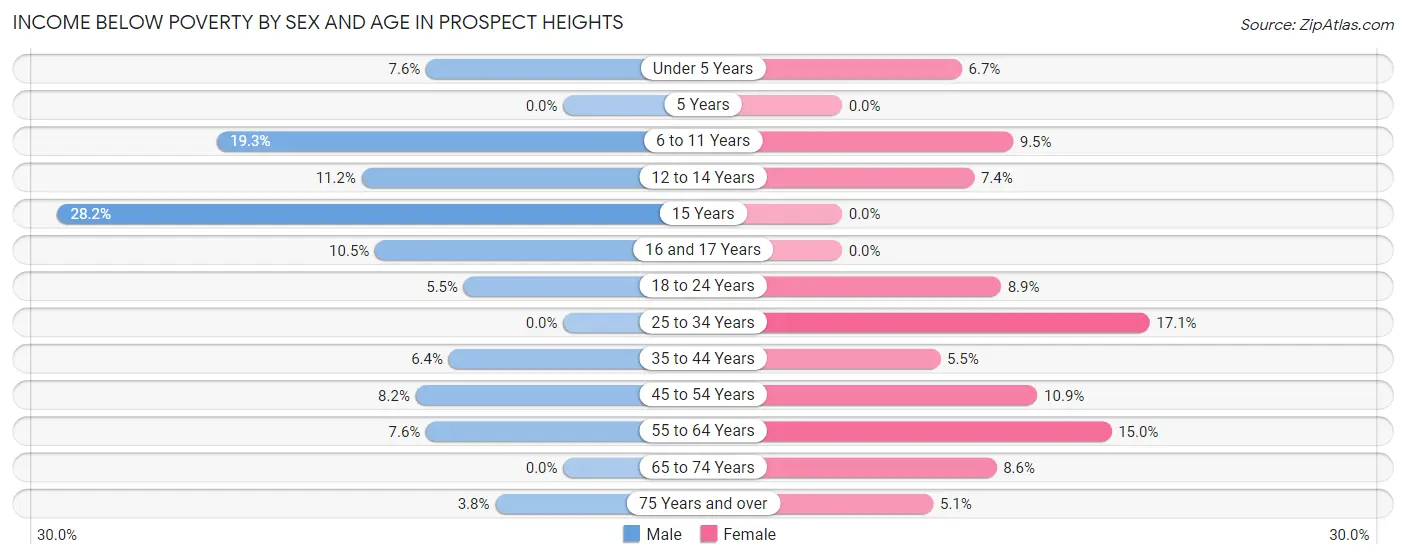
| Age Bracket | Male | Female |
| Under 5 Years | 49 (7.6%) | 29 (6.7%) |
| 5 Years | 0 (0.0%) | 0 (0.0%) |
| 6 to 11 Years | 86 (19.3%) | 22 (9.5%) |
| 12 to 14 Years | 53 (11.2%) | 24 (7.4%) |
| 15 Years | 29 (28.2%) | 0 (0.0%) |
| 16 and 17 Years | 11 (10.5%) | 0 (0.0%) |
| 18 to 24 Years | 20 (5.5%) | 46 (8.8%) |
| 25 to 34 Years | 0 (0.0%) | 199 (17.1%) |
| 35 to 44 Years | 83 (6.4%) | 66 (5.5%) |
| 45 to 54 Years | 75 (8.2%) | 113 (10.9%) |
| 55 to 64 Years | 79 (7.6%) | 161 (15.0%) |
| 65 to 74 Years | 0 (0.0%) | 73 (8.6%) |
| 75 Years and over | 25 (3.8%) | 28 (5.1%) |
| Total | 510 (6.5%) | 761 (9.9%) |
Income Above Poverty by Sex and Age in Prospect Heights
According to the poverty statistics in Prospect Heights, males aged 5 years and females aged 5 years are the age groups that are most secure financially, with 100.0% of males and 100.0% of females in these age groups living above the poverty line.
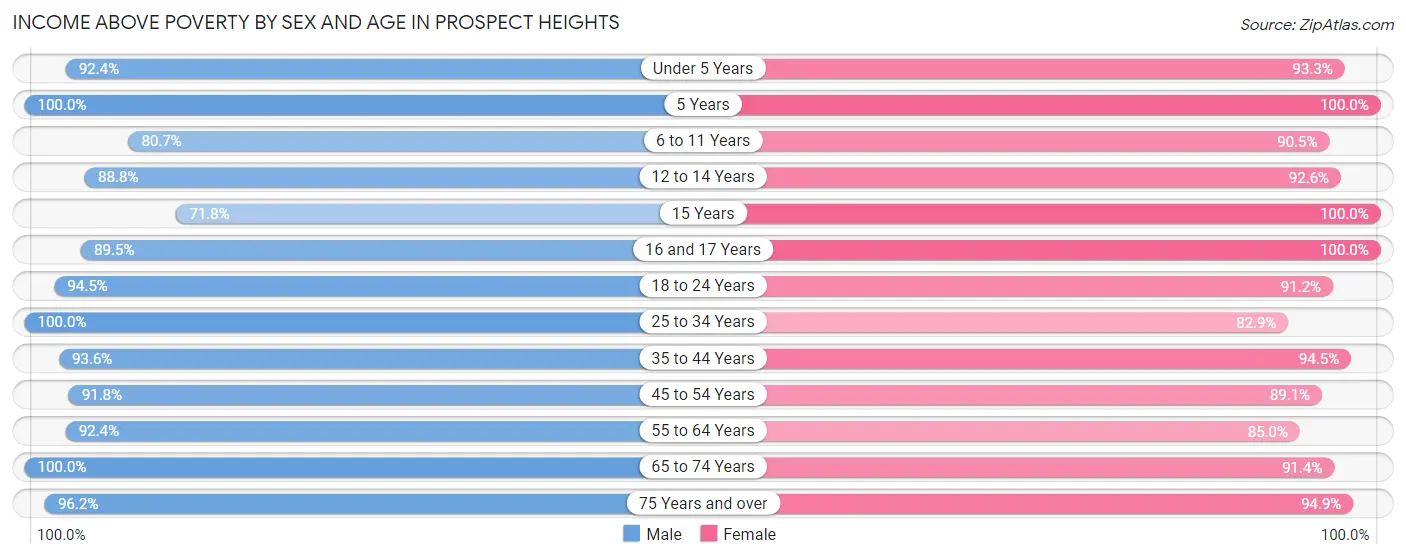
| Age Bracket | Male | Female |
| Under 5 Years | 592 (92.4%) | 406 (93.3%) |
| 5 Years | 90 (100.0%) | 77 (100.0%) |
| 6 to 11 Years | 360 (80.7%) | 209 (90.5%) |
| 12 to 14 Years | 419 (88.8%) | 302 (92.6%) |
| 15 Years | 74 (71.8%) | 111 (100.0%) |
| 16 and 17 Years | 94 (89.5%) | 99 (100.0%) |
| 18 to 24 Years | 341 (94.5%) | 474 (91.1%) |
| 25 to 34 Years | 1,098 (100.0%) | 963 (82.9%) |
| 35 to 44 Years | 1,217 (93.6%) | 1,141 (94.5%) |
| 45 to 54 Years | 837 (91.8%) | 926 (89.1%) |
| 55 to 64 Years | 955 (92.4%) | 912 (85.0%) |
| 65 to 74 Years | 675 (100.0%) | 776 (91.4%) |
| 75 Years and over | 635 (96.2%) | 523 (94.9%) |
| Total | 7,387 (93.5%) | 6,919 (90.1%) |
Income Below Poverty Among Married-Couple Families in Prospect Heights
The poverty statistics for married-couple families in Prospect Heights show that 3.6% or 117 of the total 3,226 families live below the poverty line. Families with 3 or 4 children have the highest poverty rate of 15.3%, comprising of 30 families. On the other hand, families with 5 or more children have the lowest poverty rate of 0.0%, which includes 0 families.
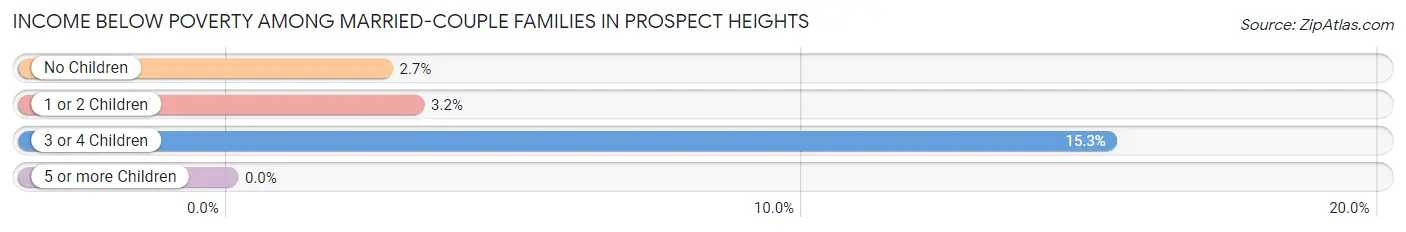
| Children | Above Poverty | Below Poverty |
| No Children | 1,916 (97.3%) | 53 (2.7%) |
| 1 or 2 Children | 1,014 (96.8%) | 34 (3.2%) |
| 3 or 4 Children | 166 (84.7%) | 30 (15.3%) |
| 5 or more Children | 13 (100.0%) | 0 (0.0%) |
| Total | 3,109 (96.4%) | 117 (3.6%) |
Income Below Poverty Among Single-Parent Households in Prospect Heights
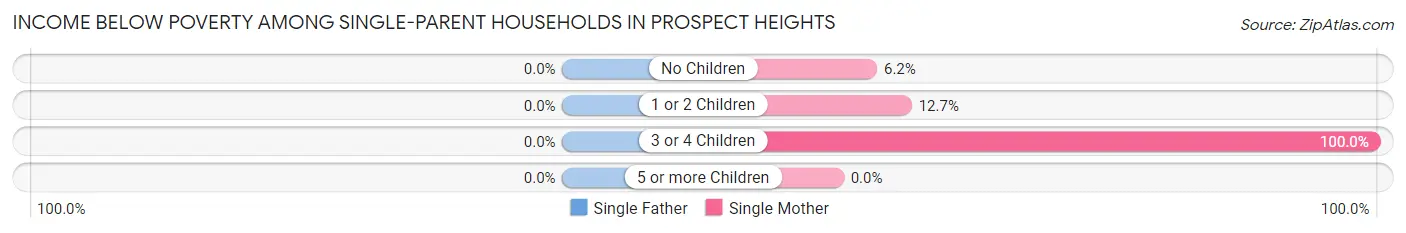
| Children | Single Father | Single Mother |
| No Children | 0 (0.0%) | 23 (6.2%) |
| 1 or 2 Children | 0 (0.0%) | 43 (12.7%) |
| 3 or 4 Children | 0 (0.0%) | 18 (100.0%) |
| 5 or more Children | 0 (0.0%) | 0 (0.0%) |
| Total | 0 (0.0%) | 84 (11.6%) |
Income Below Poverty Among Married-Couple vs Single-Parent Households in Prospect Heights
The poverty data for Prospect Heights shows that 117 of the married-couple family households (3.6%) and 84 of the single-parent households (8.1%) are living below the poverty level. Within the married-couple family households, those with 3 or 4 children have the highest poverty rate, with 30 households (15.3%) falling below the poverty line. Among the single-parent households, those with 3 or 4 children have the highest poverty rate, with 18 household (72.0%) living below poverty.
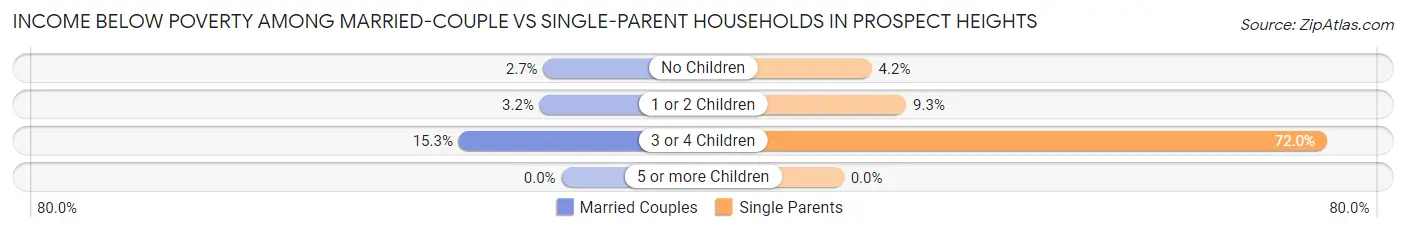
| Children | Married-Couple Families | Single-Parent Households |
| No Children | 53 (2.7%) | 23 (4.2%) |
| 1 or 2 Children | 34 (3.2%) | 43 (9.3%) |
| 3 or 4 Children | 30 (15.3%) | 18 (72.0%) |
| 5 or more Children | 0 (0.0%) | 0 (0.0%) |
| Total | 117 (3.6%) | 84 (8.1%) |
Race in Prospect Heights
The most populous races in Prospect Heights are White / Caucasian (10,820 | 68.2%), Hispanic or Latino (5,041 | 31.8%), and Some other Race (2,623 | 16.5%).
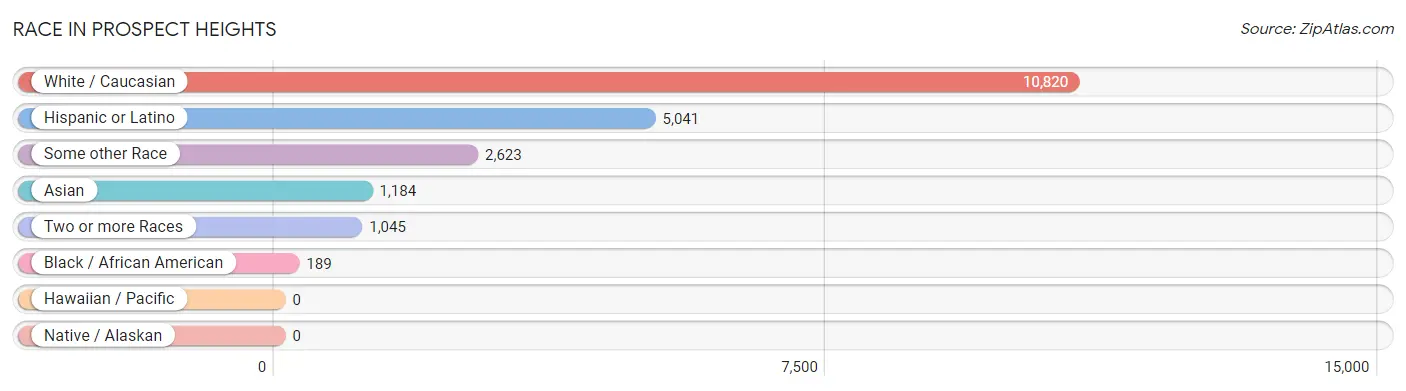
| Race | # Population | % Population |
| Asian | 1,184 | 7.5% |
| Black / African American | 189 | 1.2% |
| Hawaiian / Pacific | 0 | 0.0% |
| Hispanic or Latino | 5,041 | 31.8% |
| Native / Alaskan | 0 | 0.0% |
| White / Caucasian | 10,820 | 68.2% |
| Two or more Races | 1,045 | 6.6% |
| Some other Race | 2,623 | 16.5% |
| Total | 15,861 | 100.0% |
Ancestry in Prospect Heights
The most populous ancestries reported in Prospect Heights are Mexican (4,312 | 27.2%), Polish (2,643 | 16.7%), German (1,623 | 10.2%), Irish (1,327 | 8.4%), and Italian (948 | 6.0%), together accounting for 68.4% of all Prospect Heights residents.
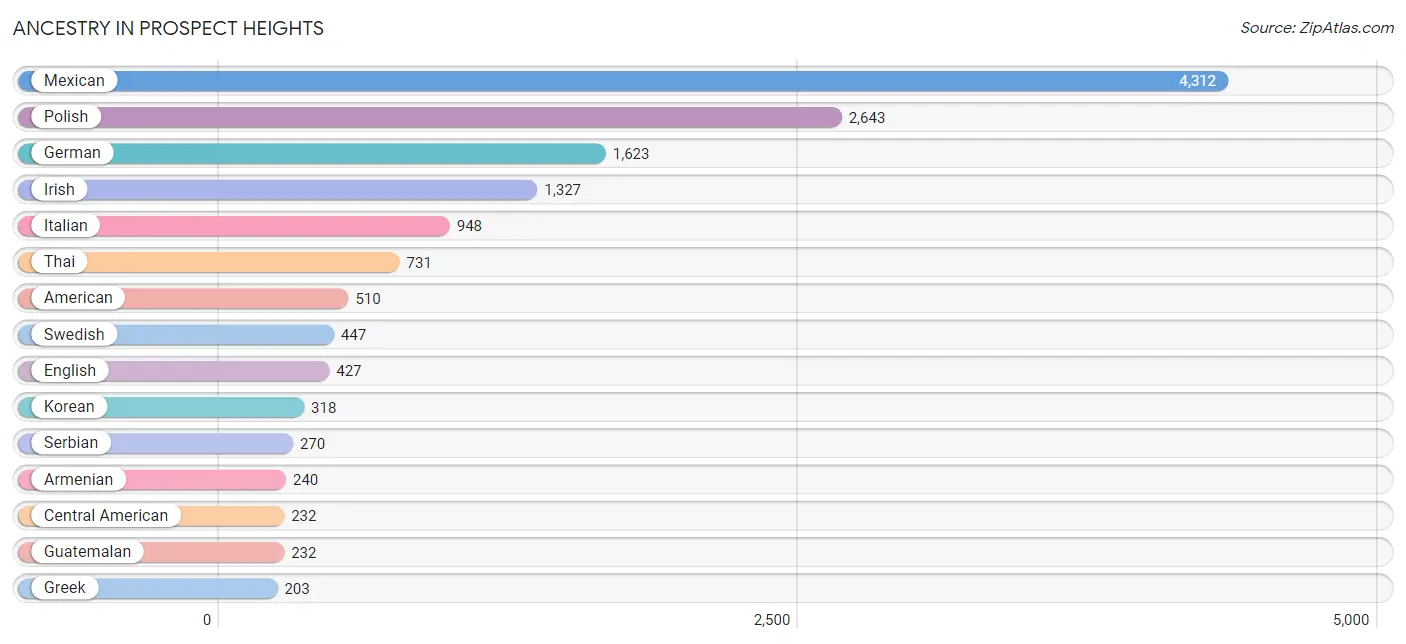
| Ancestry | # Population | % Population |
| African | 1 | 0.0% |
| Albanian | 32 | 0.2% |
| American | 510 | 3.2% |
| Arab | 199 | 1.3% |
| Armenian | 240 | 1.5% |
| Assyrian / Chaldean / Syriac | 9 | 0.1% |
| Austrian | 60 | 0.4% |
| Bhutanese | 1 | 0.0% |
| Bolivian | 22 | 0.1% |
| British | 9 | 0.1% |
| Bulgarian | 136 | 0.9% |
| Burmese | 182 | 1.1% |
| Central American | 232 | 1.5% |
| Chilean | 48 | 0.3% |
| Choctaw | 4 | 0.0% |
| Cuban | 91 | 0.6% |
| Czech | 160 | 1.0% |
| Czechoslovakian | 11 | 0.1% |
| Danish | 67 | 0.4% |
| Dutch | 78 | 0.5% |
| Eastern European | 24 | 0.2% |
| Ecuadorian | 39 | 0.3% |
| Egyptian | 142 | 0.9% |
| English | 427 | 2.7% |
| Estonian | 7 | 0.0% |
| European | 32 | 0.2% |
| French | 52 | 0.3% |
| French Canadian | 62 | 0.4% |
| German | 1,623 | 10.2% |
| Ghanaian | 22 | 0.1% |
| Greek | 203 | 1.3% |
| Guatemalan | 232 | 1.5% |
| Hungarian | 23 | 0.2% |
| Indian (Asian) | 40 | 0.3% |
| Iranian | 108 | 0.7% |
| Irish | 1,327 | 8.4% |
| Italian | 948 | 6.0% |
| Korean | 318 | 2.0% |
| Latvian | 5 | 0.0% |
| Lithuanian | 27 | 0.2% |
| Luxembourger | 5 | 0.0% |
| Mexican | 4,312 | 27.2% |
| Mexican American Indian | 53 | 0.3% |
| Northern European | 28 | 0.2% |
| Norwegian | 130 | 0.8% |
| Pakistani | 19 | 0.1% |
| Palestinian | 57 | 0.4% |
| Polish | 2,643 | 16.7% |
| Puerto Rican | 118 | 0.7% |
| Romanian | 9 | 0.1% |
| Russian | 122 | 0.8% |
| Scandinavian | 66 | 0.4% |
| Scotch-Irish | 46 | 0.3% |
| Scottish | 33 | 0.2% |
| Serbian | 270 | 1.7% |
| Slavic | 10 | 0.1% |
| Slovak | 3 | 0.0% |
| South American | 109 | 0.7% |
| Spaniard | 38 | 0.2% |
| Spanish | 131 | 0.8% |
| Sri Lankan | 3 | 0.0% |
| Subsaharan African | 23 | 0.2% |
| Swedish | 447 | 2.8% |
| Swiss | 63 | 0.4% |
| Thai | 731 | 4.6% |
| Ukrainian | 123 | 0.8% |
| Welsh | 14 | 0.1% |
| Yugoslavian | 28 | 0.2% | View All 68 Rows |
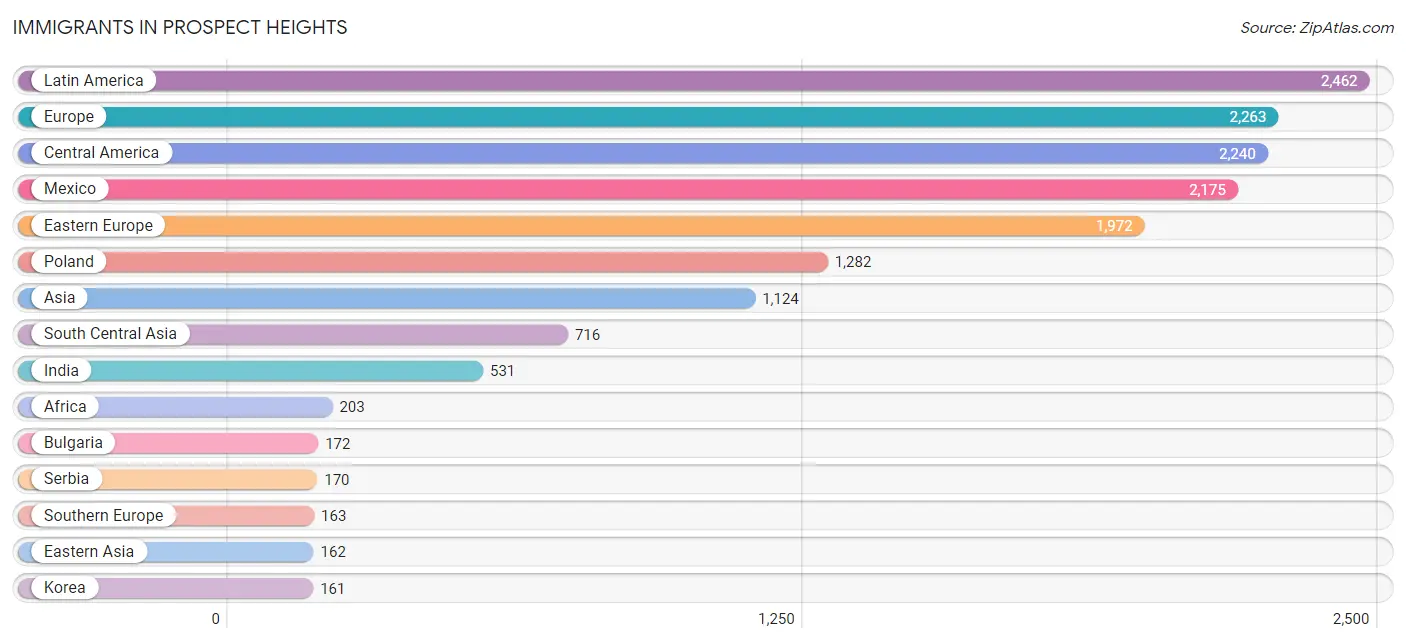
Immigrants in Prospect Heights
The most numerous immigrant groups reported in Prospect Heights came from Latin America (2,462 | 15.5%), Europe (2,263 | 14.3%), Central America (2,240 | 14.1%), Mexico (2,175 | 13.7%), and Eastern Europe (1,972 | 12.4%), together accounting for 70.1% of all Prospect Heights residents.
| Immigration Origin | # Population | % Population |
| Africa | 203 | 1.3% |
| Albania | 10 | 0.1% |
| Armenia | 64 | 0.4% |
| Asia | 1,124 | 7.1% |
| Belarus | 42 | 0.3% |
| Bolivia | 22 | 0.1% |
| Bosnia and Herzegovina | 28 | 0.2% |
| Brazil | 13 | 0.1% |
| Bulgaria | 172 | 1.1% |
| Canada | 35 | 0.2% |
| Caribbean | 156 | 1.0% |
| Central America | 2,240 | 14.1% |
| Chile | 31 | 0.2% |
| Cuba | 117 | 0.7% |
| Czechoslovakia | 40 | 0.3% |
| Eastern Asia | 162 | 1.0% |
| Eastern Europe | 1,972 | 12.4% |
| Egypt | 142 | 0.9% |
| Europe | 2,263 | 14.3% |
| Germany | 36 | 0.2% |
| Ghana | 22 | 0.1% |
| Greece | 10 | 0.1% |
| Guatemala | 65 | 0.4% |
| India | 531 | 3.4% |
| Iran | 127 | 0.8% |
| Ireland | 31 | 0.2% |
| Italy | 153 | 1.0% |
| Jamaica | 39 | 0.3% |
| Japan | 1 | 0.0% |
| Kazakhstan | 58 | 0.4% |
| Korea | 161 | 1.0% |
| Latin America | 2,462 | 15.5% |
| Lithuania | 21 | 0.1% |
| Mexico | 2,175 | 13.7% |
| Middle Africa | 39 | 0.3% |
| Moldova | 30 | 0.2% |
| Northern Africa | 142 | 0.9% |
| Northern Europe | 57 | 0.4% |
| Norway | 15 | 0.1% |
| Philippines | 122 | 0.8% |
| Poland | 1,282 | 8.1% |
| Romania | 37 | 0.2% |
| Russia | 10 | 0.1% |
| Serbia | 170 | 1.1% |
| South America | 66 | 0.4% |
| South Central Asia | 716 | 4.5% |
| South Eastern Asia | 144 | 0.9% |
| Southern Europe | 163 | 1.0% |
| Thailand | 22 | 0.1% |
| Ukraine | 110 | 0.7% |
| Western Africa | 22 | 0.1% |
| Western Asia | 64 | 0.4% |
| Western Europe | 36 | 0.2% | View All 53 Rows |
Sex and Age in Prospect Heights
Sex and Age in Prospect Heights
The most populous age groups in Prospect Heights are 10 to 14 Years (754 | 9.4%) for men and 40 to 44 Years (739 | 9.4%) for women.
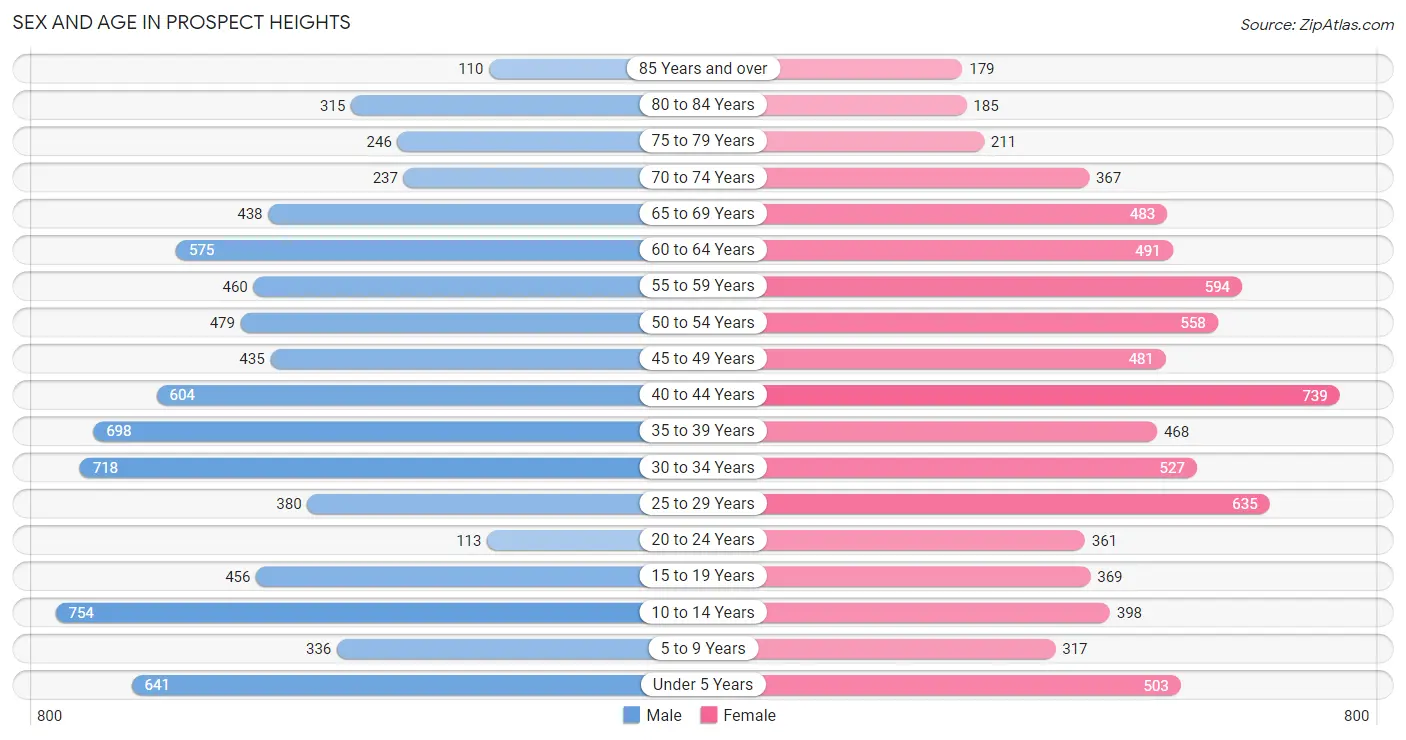
| Age Bracket | Male | Female |
| Under 5 Years | 641 (8.0%) | 503 (6.4%) |
| 5 to 9 Years | 336 (4.2%) | 317 (4.0%) |
| 10 to 14 Years | 754 (9.4%) | 398 (5.1%) |
| 15 to 19 Years | 456 (5.7%) | 369 (4.7%) |
| 20 to 24 Years | 113 (1.4%) | 361 (4.6%) |
| 25 to 29 Years | 380 (4.8%) | 635 (8.1%) |
| 30 to 34 Years | 718 (9.0%) | 527 (6.7%) |
| 35 to 39 Years | 698 (8.7%) | 468 (5.9%) |
| 40 to 44 Years | 604 (7.5%) | 739 (9.4%) |
| 45 to 49 Years | 435 (5.4%) | 481 (6.1%) |
| 50 to 54 Years | 479 (6.0%) | 558 (7.1%) |
| 55 to 59 Years | 460 (5.8%) | 594 (7.5%) |
| 60 to 64 Years | 575 (7.2%) | 491 (6.2%) |
| 65 to 69 Years | 438 (5.5%) | 483 (6.1%) |
| 70 to 74 Years | 237 (3.0%) | 367 (4.7%) |
| 75 to 79 Years | 246 (3.1%) | 211 (2.7%) |
| 80 to 84 Years | 315 (3.9%) | 185 (2.4%) |
| 85 Years and over | 110 (1.4%) | 179 (2.3%) |
| Total | 7,995 (100.0%) | 7,866 (100.0%) |
Families and Households in Prospect Heights
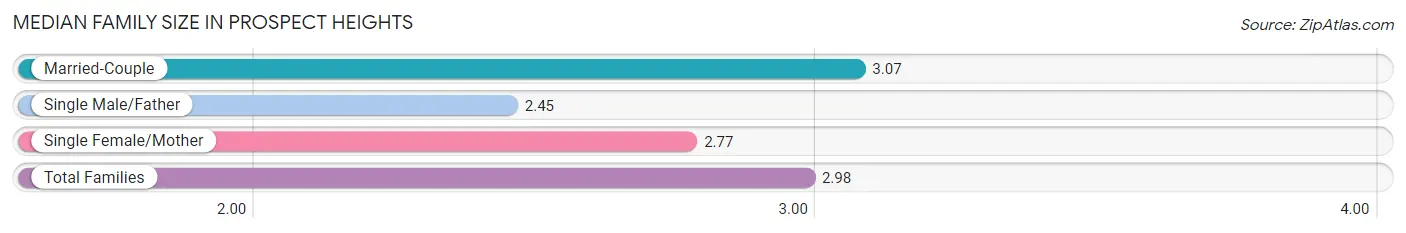
Median Family Size in Prospect Heights
The median family size in Prospect Heights is 2.98 persons per family, with married-couple families (3,226 | 75.6%) accounting for the largest median family size of 3.07 persons per family. On the other hand, single male/father families (312 | 7.3%) represent the smallest median family size with 2.45 persons per family.
| Family Type | # Families | Family Size |
| Married-Couple | 3,226 (75.6%) | 3.07 |
| Single Male/Father | 312 (7.3%) | 2.45 |
| Single Female/Mother | 727 (17.1%) | 2.77 |
| Total Families | 4,265 (100.0%) | 2.98 |
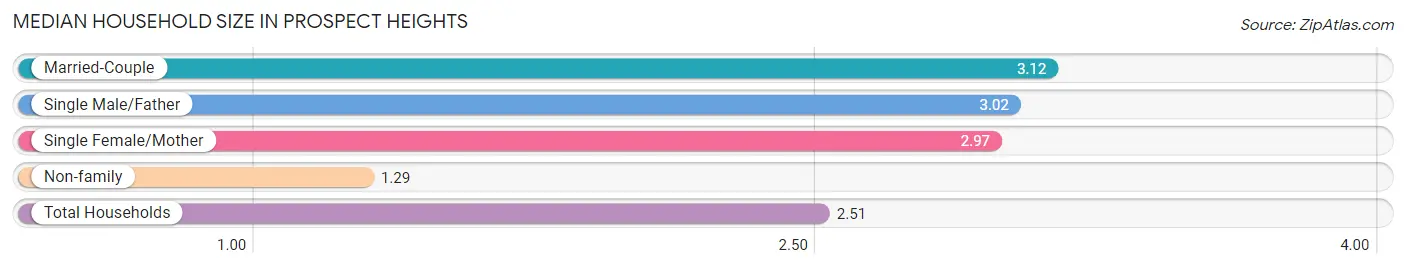
Median Household Size in Prospect Heights
The median household size in Prospect Heights is 2.51 persons per household, with married-couple households (3,226 | 51.3%) accounting for the largest median household size of 3.12 persons per household. non-family households (2,021 | 32.2%) represent the smallest median household size with 1.29 persons per household.
| Household Type | # Households | Household Size |
| Married-Couple | 3,226 (51.3%) | 3.12 |
| Single Male/Father | 312 (5.0%) | 3.02 |
| Single Female/Mother | 727 (11.6%) | 2.97 |
| Non-family | 2,021 (32.2%) | 1.29 |
| Total Households | 6,286 (100.0%) | 2.51 |
Household Size by Marriage Status in Prospect Heights
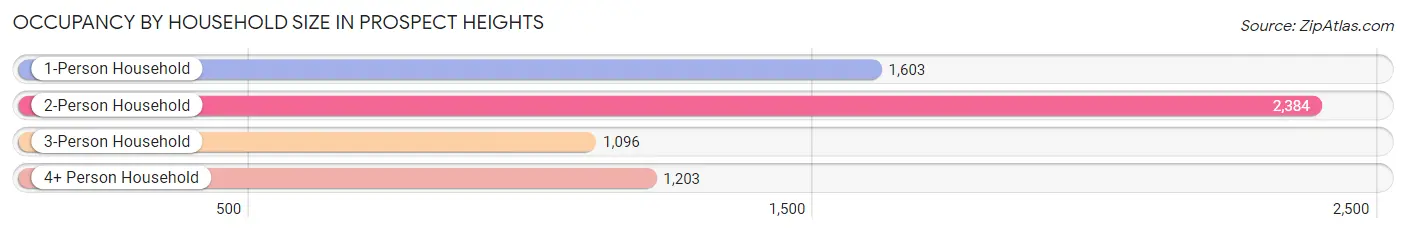
Out of a total of 6,286 households in Prospect Heights, 4,265 (67.8%) are family households, while 2,021 (32.2%) are nonfamily households. The most numerous type of family households are 2-person households, comprising 2,021, and the most common type of nonfamily households are 1-person households, comprising 1,603.
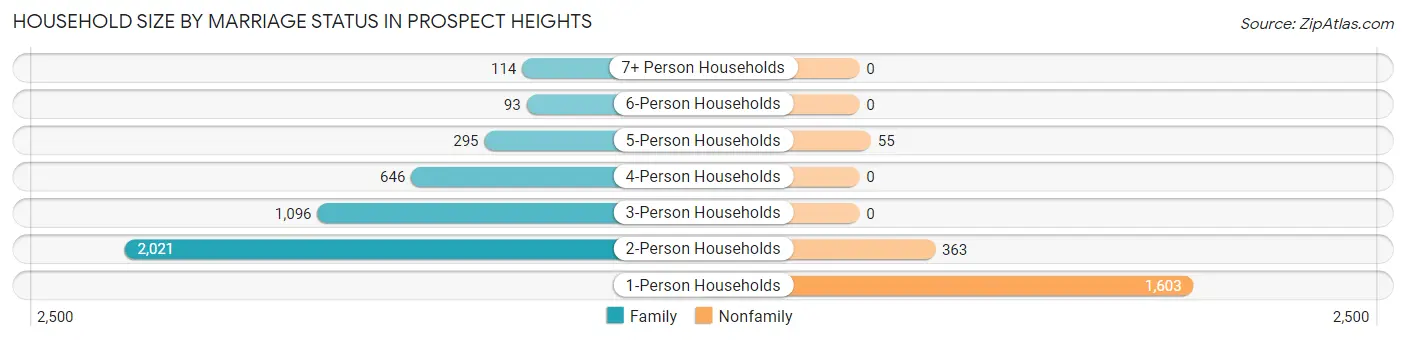
| Household Size | Family Households | Nonfamily Households |
| 1-Person Households | - | 1,603 (25.5%) |
| 2-Person Households | 2,021 (32.2%) | 363 (5.8%) |
| 3-Person Households | 1,096 (17.4%) | 0 (0.0%) |
| 4-Person Households | 646 (10.3%) | 0 (0.0%) |
| 5-Person Households | 295 (4.7%) | 55 (0.9%) |
| 6-Person Households | 93 (1.5%) | 0 (0.0%) |
| 7+ Person Households | 114 (1.8%) | 0 (0.0%) |
| Total | 4,265 (67.8%) | 2,021 (32.2%) |
Female Fertility in Prospect Heights
Fertility by Age in Prospect Heights
Average fertility rate in Prospect Heights is 54.0 births per 1,000 women. Women in the age bracket of 35 to 50 years have the highest fertility rate with 71.0 births per 1,000 women. Women in the age bracket of 35 to 50 years acount for 62.7% of all women with births.
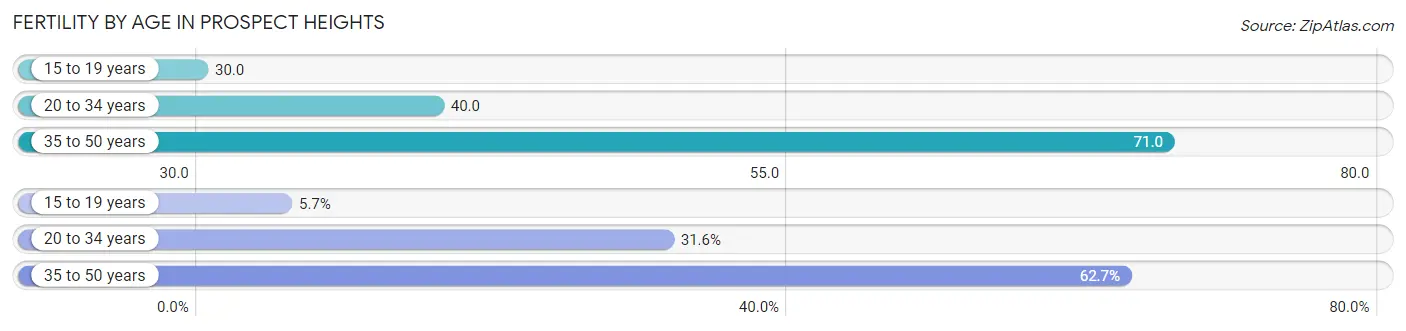
| Age Bracket | Women with Births | Births / 1,000 Women |
| 15 to 19 years | 11 (5.7%) | 30.0 |
| 20 to 34 years | 61 (31.6%) | 40.0 |
| 35 to 50 years | 121 (62.7%) | 71.0 |
| Total | 193 (100.0%) | 54.0 |
Fertility by Age by Marriage Status in Prospect Heights
70.5% of women with births (193) in Prospect Heights are married. The highest percentage of unmarried women with births falls into 15 to 19 years age bracket with 100.0% of them unmarried at the time of birth, while the lowest percentage of unmarried women with births belong to 20 to 34 years age bracket with 11.5% of them unmarried.
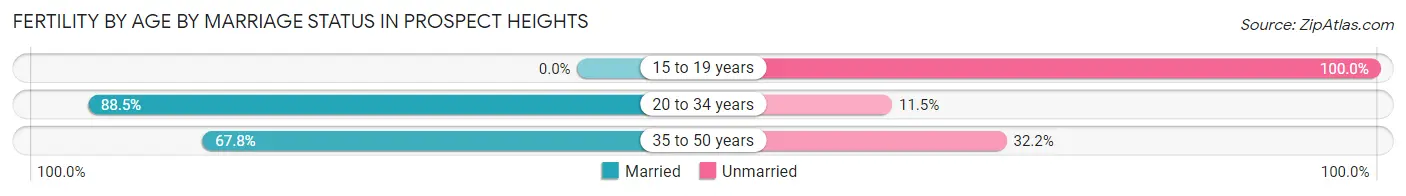
| Age Bracket | Married | Unmarried |
| 15 to 19 years | 0 (0.0%) | 11 (100.0%) |
| 20 to 34 years | 54 (88.5%) | 7 (11.5%) |
| 35 to 50 years | 82 (67.8%) | 39 (32.2%) |
| Total | 136 (70.5%) | 57 (29.5%) |
Fertility by Education in Prospect Heights
Average fertility rate in Prospect Heights is 54.0 births per 1,000 women. Women with the education attainment of high school diploma have the highest fertility rate of 71.0 births per 1,000 women, while women with the education attainment of less than high school have the lowest fertility at 30.0 births per 1,000 women. Women with the education attainment of bachelor's degree represent 31.6% of all women with births.
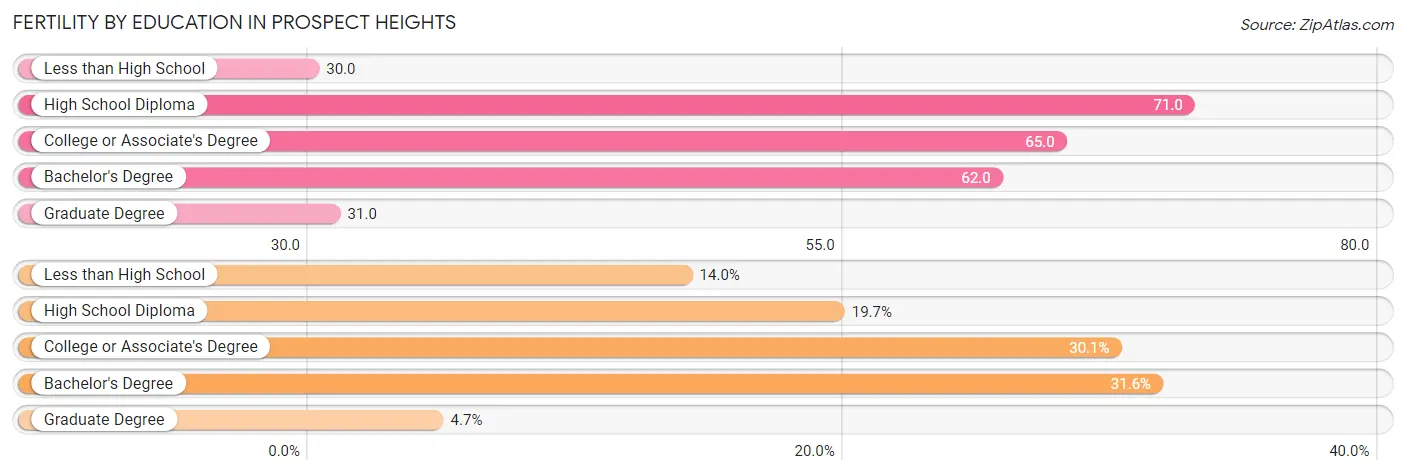
| Educational Attainment | Women with Births | Births / 1,000 Women |
| Less than High School | 27 (14.0%) | 30.0 |
| High School Diploma | 38 (19.7%) | 71.0 |
| College or Associate's Degree | 58 (30.0%) | 65.0 |
| Bachelor's Degree | 61 (31.6%) | 62.0 |
| Graduate Degree | 9 (4.7%) | 31.0 |
| Total | 193 (100.0%) | 54.0 |
Fertility by Education by Marriage Status in Prospect Heights
29.5% of women with births in Prospect Heights are unmarried. Women with the educational attainment of less than high school are most likely to be married with 100.0% of them married at childbirth, while women with the educational attainment of college or associate's degree are least likely to be married with 67.2% of them unmarried at childbirth.
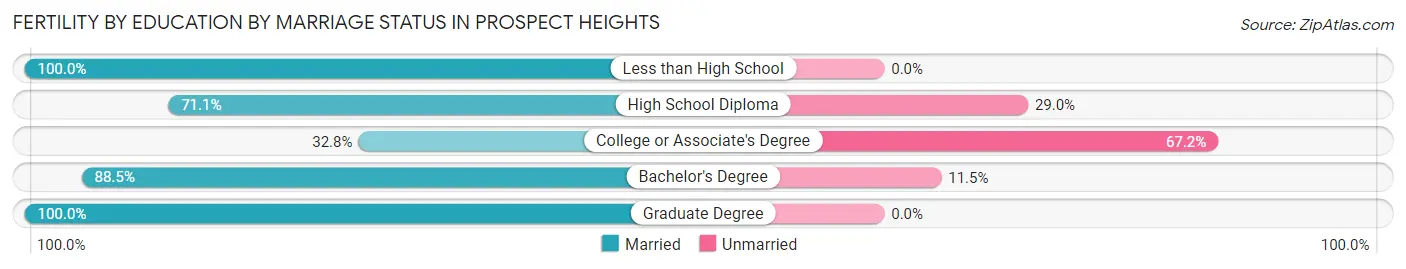
| Educational Attainment | Married | Unmarried |
| Less than High School | 27 (100.0%) | 0 (0.0%) |
| High School Diploma | 27 (71.1%) | 11 (28.9%) |
| College or Associate's Degree | 19 (32.8%) | 39 (67.2%) |
| Bachelor's Degree | 54 (88.5%) | 7 (11.5%) |
| Graduate Degree | 9 (100.0%) | 0 (0.0%) |
| Total | 136 (70.5%) | 57 (29.5%) |
Employment Characteristics in Prospect Heights
Employment by Class of Employer in Prospect Heights
Among the 8,296 employed individuals in Prospect Heights, private company employees (6,221 | 75.0%), self-employed (incorporated) (653 | 7.9%), and not-for-profit organizations (465 | 5.6%) make up the most common classes of employment.
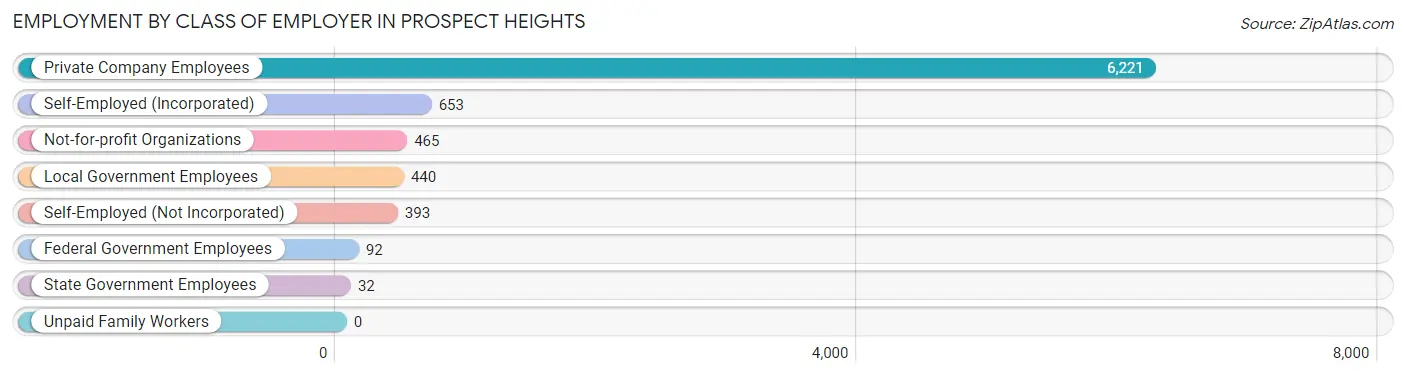
| Employer Class | # Employees | % Employees |
| Private Company Employees | 6,221 | 75.0% |
| Self-Employed (Incorporated) | 653 | 7.9% |
| Self-Employed (Not Incorporated) | 393 | 4.7% |
| Not-for-profit Organizations | 465 | 5.6% |
| Local Government Employees | 440 | 5.3% |
| State Government Employees | 32 | 0.4% |
| Federal Government Employees | 92 | 1.1% |
| Unpaid Family Workers | 0 | 0.0% |
| Total | 8,296 | 100.0% |
Employment Status by Age in Prospect Heights
According to the labor force statistics for Prospect Heights, out of the total population over 16 years of age (12,698), 70.2% or 8,914 individuals are in the labor force, with 5.1% or 455 of them unemployed. The age group with the highest labor force participation rate is 20 to 24 years, with 91.6% or 434 individuals in the labor force. Within the labor force, the 16 to 19 years age range has the highest percentage of unemployed individuals, with 14.0% or 47 of them being unemployed.
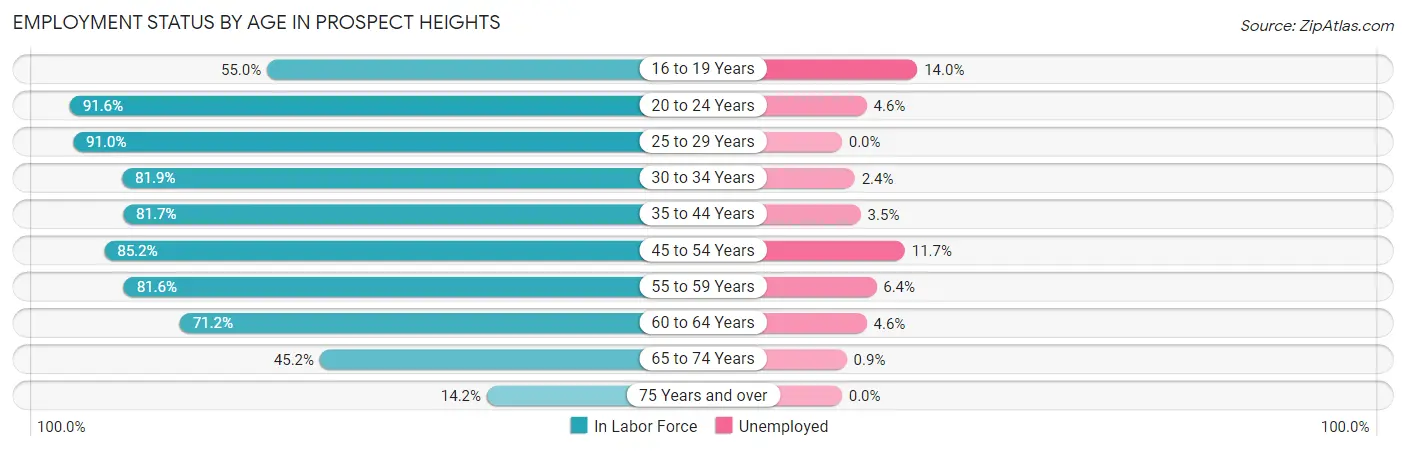
| Age Bracket | In Labor Force | Unemployed |
| 16 to 19 Years | 336 (55.0%) | 47 (14.0%) |
| 20 to 24 Years | 434 (91.6%) | 20 (4.6%) |
| 25 to 29 Years | 924 (91.0%) | 0 (0.0%) |
| 30 to 34 Years | 1,020 (81.9%) | 24 (2.4%) |
| 35 to 44 Years | 2,050 (81.7%) | 72 (3.5%) |
| 45 to 54 Years | 1,664 (85.2%) | 195 (11.7%) |
| 55 to 59 Years | 860 (81.6%) | 55 (6.4%) |
| 60 to 64 Years | 759 (71.2%) | 35 (4.6%) |
| 65 to 74 Years | 689 (45.2%) | 6 (0.9%) |
| 75 Years and over | 177 (14.2%) | 0 (0.0%) |
| Total | 8,914 (70.2%) | 455 (5.1%) |
Employment Status by Educational Attainment in Prospect Heights
According to labor force statistics for Prospect Heights, 82.3% of individuals (7,277) out of the total population between 25 and 64 years of age (8,842) are in the labor force, with 5.2% or 378 of them being unemployed. The group with the highest labor force participation rate are those with the educational attainment of college / associate degree, with 88.6% or 1,884 individuals in the labor force. Within the labor force, individuals with high school diploma education have the highest percentage of unemployment, with 13.4% or 200 of them being unemployed.
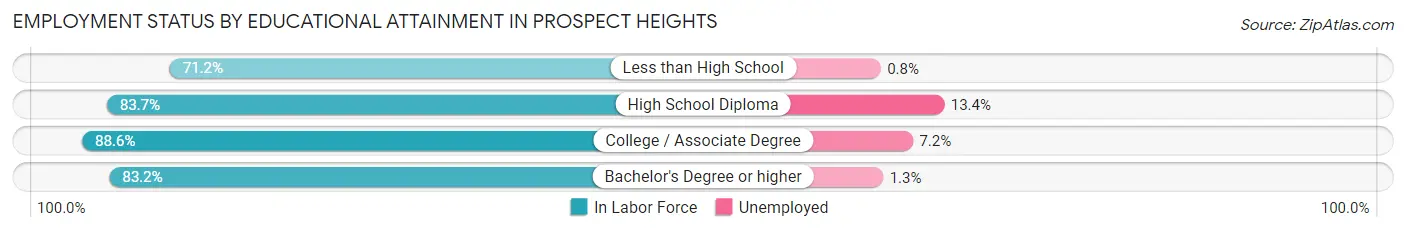
| Educational Attainment | In Labor Force | Unemployed |
| Less than High School | 1,191 (71.2%) | 13 (0.8%) |
| High School Diploma | 1,491 (83.7%) | 239 (13.4%) |
| College / Associate Degree | 1,884 (88.6%) | 153 (7.2%) |
| Bachelor's Degree or higher | 2,714 (83.2%) | 42 (1.3%) |
| Total | 7,277 (82.3%) | 460 (5.2%) |
Employment Occupations by Sex in Prospect Heights
Management, Business, Science and Arts Occupations
The most common Management, Business, Science and Arts occupations in Prospect Heights are Management (727 | 8.6%), Business & Financial (650 | 7.7%), Community & Social Service (638 | 7.5%), Computers, Engineering & Science (567 | 6.7%), and Health Diagnosing & Treating (543 | 6.4%).
Management, Business, Science and Arts Occupations by Sex
Within the Management, Business, Science and Arts occupations in Prospect Heights, the most male-oriented occupations are Legal Services & Support (100.0%), Computers & Mathematics (91.1%), and Computers, Engineering & Science (86.2%), while the most female-oriented occupations are Health Technologists (94.6%), Health Diagnosing & Treating (83.8%), and Education Instruction & Library (77.0%).
| Occupation | Male | Female |
| Management | 435 (59.8%) | 292 (40.2%) |
| Business & Financial | 268 (41.2%) | 382 (58.8%) |
| Computers, Engineering & Science | 489 (86.2%) | 78 (13.8%) |
| Computers & Mathematics | 298 (91.1%) | 29 (8.9%) |
| Architecture & Engineering | 144 (81.8%) | 32 (18.2%) |
| Life, Physical & Social Science | 47 (73.4%) | 17 (26.6%) |
| Community & Social Service | 267 (41.8%) | 371 (58.2%) |
| Education, Arts & Media | 62 (54.9%) | 51 (45.1%) |
| Legal Services & Support | 91 (100.0%) | 0 (0.0%) |
| Education Instruction & Library | 88 (23.0%) | 294 (77.0%) |
| Arts, Media & Entertainment | 26 (50.0%) | 26 (50.0%) |
| Health Diagnosing & Treating | 88 (16.2%) | 455 (83.8%) |
| Health Technologists | 19 (5.4%) | 335 (94.6%) |
| Total (Category) | 1,547 (49.5%) | 1,578 (50.5%) |
| Total (Overall) | 4,465 (52.8%) | 3,996 (47.2%) |
Services Occupations
The most common Services occupations in Prospect Heights are Food Preparation & Serving (543 | 6.4%), Cleaning & Maintenance (343 | 4.1%), Personal Care & Service (218 | 2.6%), Healthcare Support (136 | 1.6%), and Security & Protection (122 | 1.4%).
Services Occupations by Sex
Within the Services occupations in Prospect Heights, the most male-oriented occupations are Firefighting & Prevention (100.0%), Security & Protection (92.6%), and Law Enforcement (90.5%), while the most female-oriented occupations are Personal Care & Service (93.1%), Healthcare Support (88.2%), and Food Preparation & Serving (49.9%).
| Occupation | Male | Female |
| Healthcare Support | 16 (11.8%) | 120 (88.2%) |
| Security & Protection | 113 (92.6%) | 9 (7.4%) |
| Firefighting & Prevention | 27 (100.0%) | 0 (0.0%) |
| Law Enforcement | 86 (90.5%) | 9 (9.5%) |
| Food Preparation & Serving | 272 (50.1%) | 271 (49.9%) |
| Cleaning & Maintenance | 234 (68.2%) | 109 (31.8%) |
| Personal Care & Service | 15 (6.9%) | 203 (93.1%) |
| Total (Category) | 650 (47.7%) | 712 (52.3%) |
| Total (Overall) | 4,465 (52.8%) | 3,996 (47.2%) |
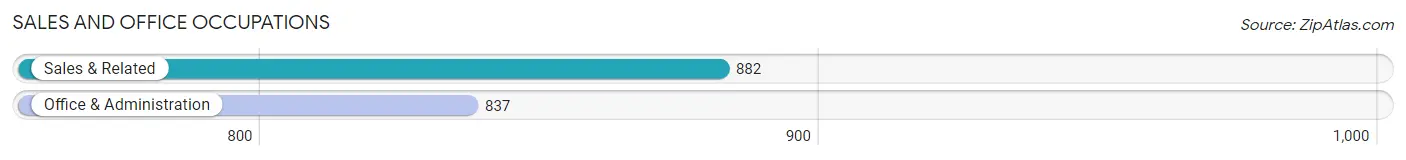
Sales and Office Occupations
The most common Sales and Office occupations in Prospect Heights are Sales & Related (882 | 10.4%), and Office & Administration (837 | 9.9%).
Sales and Office Occupations by Sex
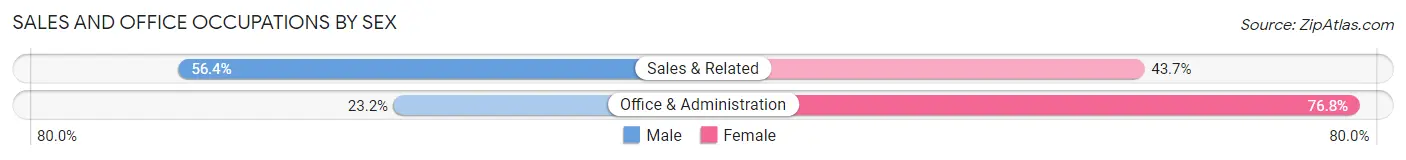
| Occupation | Male | Female |
| Sales & Related | 497 (56.4%) | 385 (43.6%) |
| Office & Administration | 194 (23.2%) | 643 (76.8%) |
| Total (Category) | 691 (40.2%) | 1,028 (59.8%) |
| Total (Overall) | 4,465 (52.8%) | 3,996 (47.2%) |
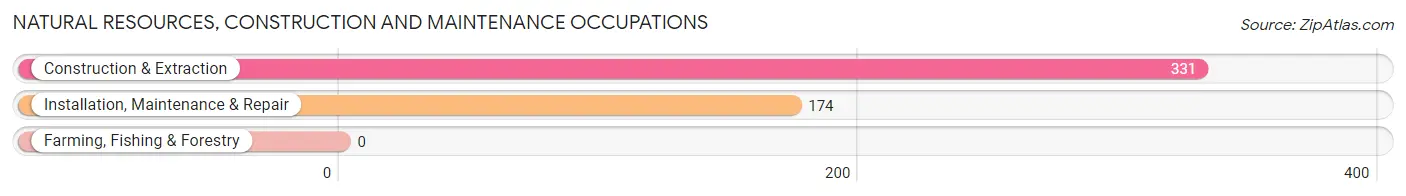
Natural Resources, Construction and Maintenance Occupations
The most common Natural Resources, Construction and Maintenance occupations in Prospect Heights are Construction & Extraction (331 | 3.9%), and Installation, Maintenance & Repair (174 | 2.1%).
Natural Resources, Construction and Maintenance Occupations by Sex
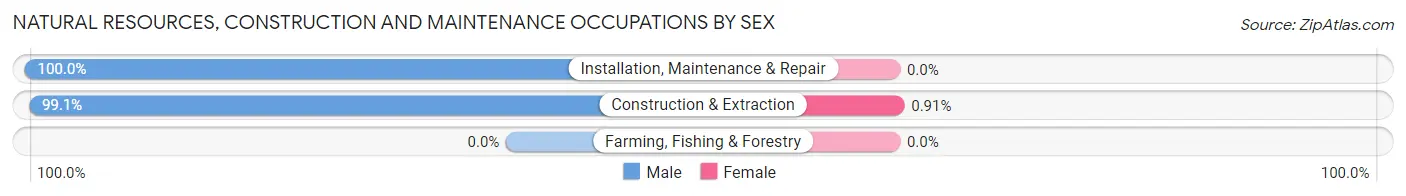
| Occupation | Male | Female |
| Farming, Fishing & Forestry | 0 (0.0%) | 0 (0.0%) |
| Construction & Extraction | 328 (99.1%) | 3 (0.9%) |
| Installation, Maintenance & Repair | 174 (100.0%) | 0 (0.0%) |
| Total (Category) | 502 (99.4%) | 3 (0.6%) |
| Total (Overall) | 4,465 (52.8%) | 3,996 (47.2%) |
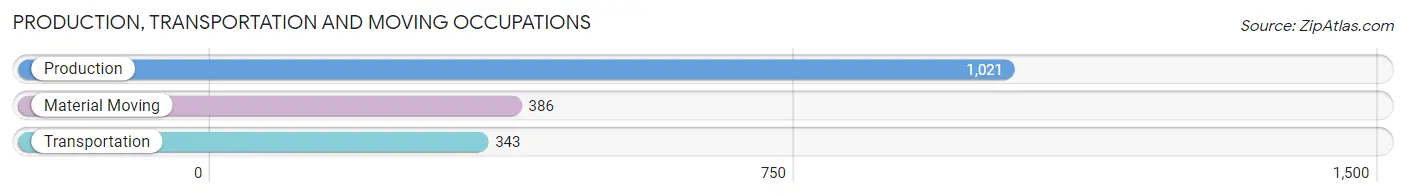
Production, Transportation and Moving Occupations
The most common Production, Transportation and Moving occupations in Prospect Heights are Production (1,021 | 12.1%), Material Moving (386 | 4.6%), and Transportation (343 | 4.1%).
Production, Transportation and Moving Occupations by Sex
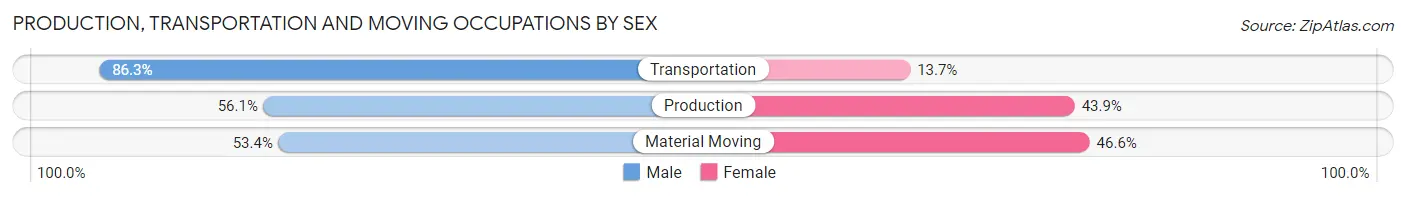
| Occupation | Male | Female |
| Production | 573 (56.1%) | 448 (43.9%) |
| Transportation | 296 (86.3%) | 47 (13.7%) |
| Material Moving | 206 (53.4%) | 180 (46.6%) |
| Total (Category) | 1,075 (61.4%) | 675 (38.6%) |
| Total (Overall) | 4,465 (52.8%) | 3,996 (47.2%) |
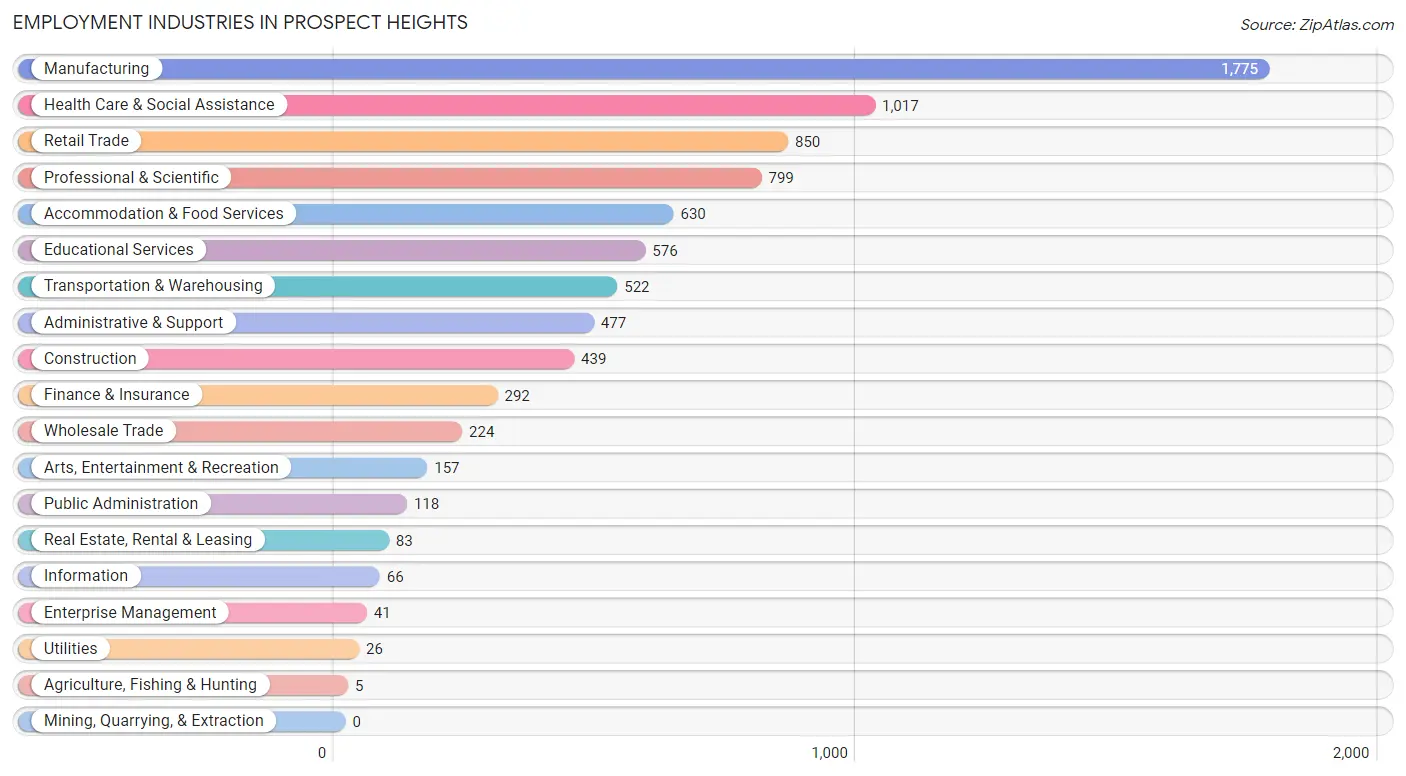
Employment Industries by Sex in Prospect Heights
Employment Industries in Prospect Heights
The major employment industries in Prospect Heights include Manufacturing (1,775 | 21.0%), Health Care & Social Assistance (1,017 | 12.0%), Retail Trade (850 | 10.1%), Professional & Scientific (799 | 9.4%), and Accommodation & Food Services (630 | 7.4%).
Employment Industries by Sex in Prospect Heights
The Prospect Heights industries that see more men than women are Agriculture, Fishing & Hunting (100.0%), Utilities (100.0%), and Real Estate, Rental & Leasing (100.0%), whereas the industries that tend to have a higher number of women are Health Care & Social Assistance (75.5%), Educational Services (74.7%), and Wholesale Trade (68.3%).
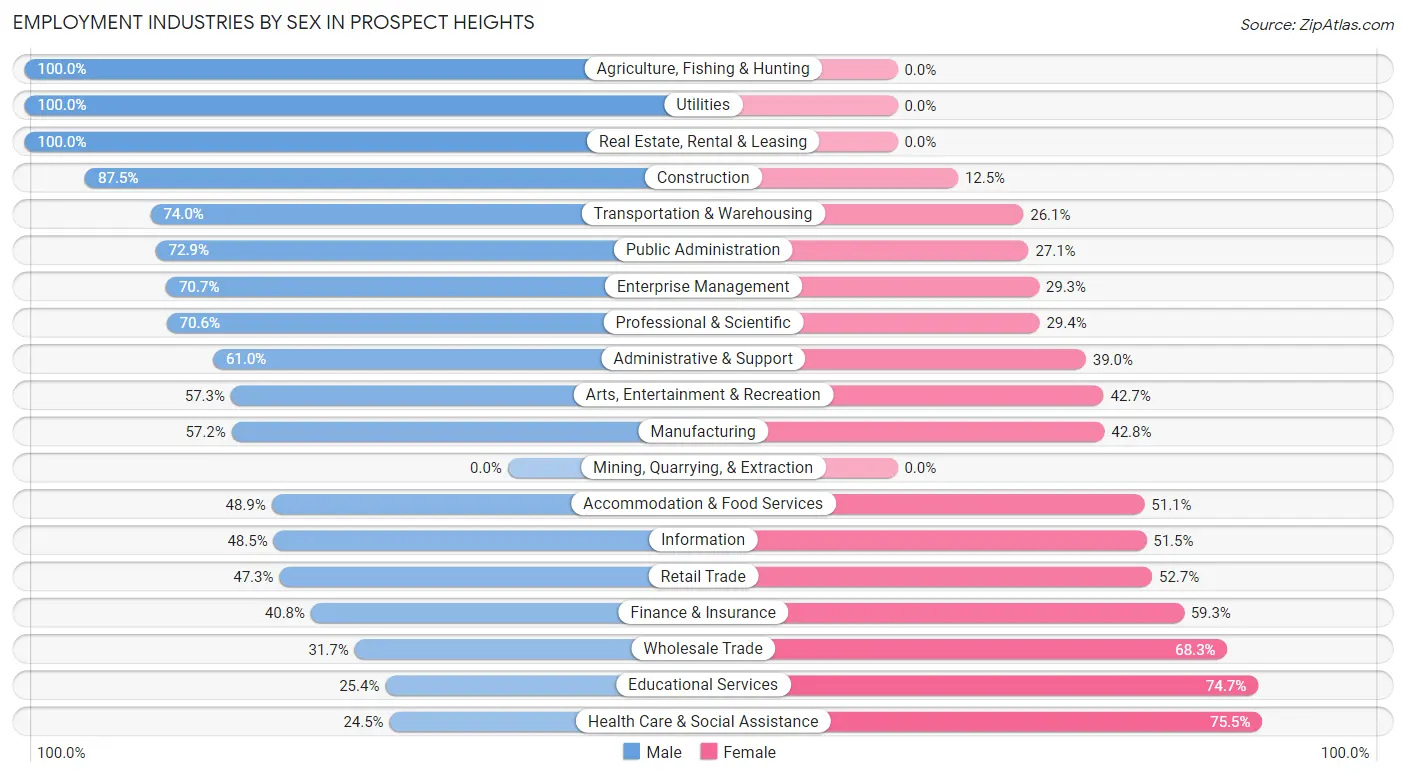
| Industry | Male | Female |
| Agriculture, Fishing & Hunting | 5 (100.0%) | 0 (0.0%) |
| Mining, Quarrying, & Extraction | 0 (0.0%) | 0 (0.0%) |
| Construction | 384 (87.5%) | 55 (12.5%) |
| Manufacturing | 1,015 (57.2%) | 760 (42.8%) |
| Wholesale Trade | 71 (31.7%) | 153 (68.3%) |
| Retail Trade | 402 (47.3%) | 448 (52.7%) |
| Transportation & Warehousing | 386 (74.0%) | 136 (26.1%) |
| Utilities | 26 (100.0%) | 0 (0.0%) |
| Information | 32 (48.5%) | 34 (51.5%) |
| Finance & Insurance | 119 (40.7%) | 173 (59.3%) |
| Real Estate, Rental & Leasing | 83 (100.0%) | 0 (0.0%) |
| Professional & Scientific | 564 (70.6%) | 235 (29.4%) |
| Enterprise Management | 29 (70.7%) | 12 (29.3%) |
| Administrative & Support | 291 (61.0%) | 186 (39.0%) |
| Educational Services | 146 (25.4%) | 430 (74.7%) |
| Health Care & Social Assistance | 249 (24.5%) | 768 (75.5%) |
| Arts, Entertainment & Recreation | 90 (57.3%) | 67 (42.7%) |
| Accommodation & Food Services | 308 (48.9%) | 322 (51.1%) |
| Public Administration | 86 (72.9%) | 32 (27.1%) |
| Total | 4,465 (52.8%) | 3,996 (47.2%) |
Education in Prospect Heights
School Enrollment in Prospect Heights
The most common levels of schooling among the 2,977 students in Prospect Heights are middle school (977 | 32.8%), high school (715 | 24.0%), and elementary school (454 | 15.2%).
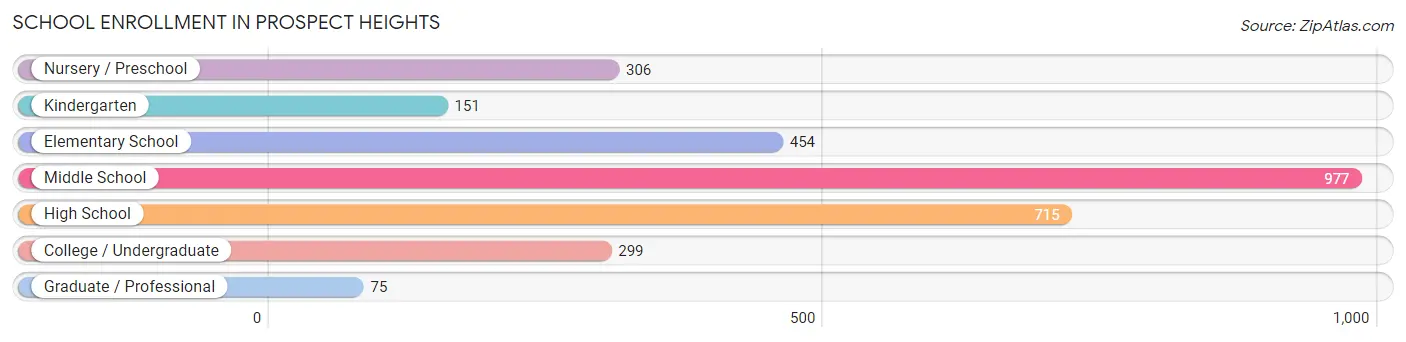
| School Level | # Students | % Students |
| Nursery / Preschool | 306 | 10.3% |
| Kindergarten | 151 | 5.1% |
| Elementary School | 454 | 15.2% |
| Middle School | 977 | 32.8% |
| High School | 715 | 24.0% |
| College / Undergraduate | 299 | 10.0% |
| Graduate / Professional | 75 | 2.5% |
| Total | 2,977 | 100.0% |
School Enrollment by Age by Funding Source in Prospect Heights
Out of a total of 2,977 students who are enrolled in schools in Prospect Heights, 744 (25.0%) attend a private institution, while the remaining 2,233 (75.0%) are enrolled in public schools. The age group of 25 to 34 year olds has the highest likelihood of being enrolled in private schools, with 65 (74.7% in the age bracket) enrolled. Conversely, the age group of 18 to 19 year olds has the lowest likelihood of being enrolled in a private school, with 253 (91.0% in the age bracket) attending a public institution.
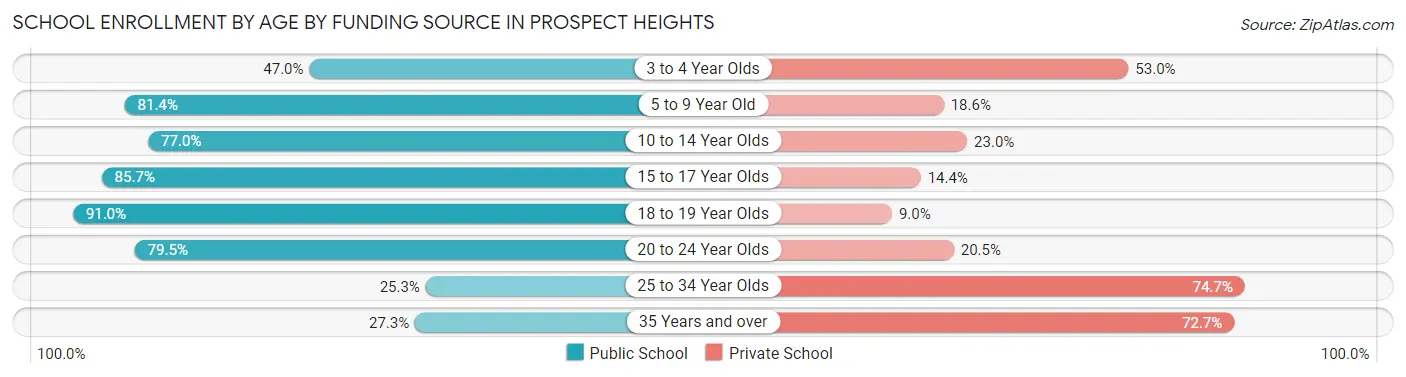
| Age Bracket | Public School | Private School |
| 3 to 4 Year Olds | 139 (47.0%) | 157 (53.0%) |
| 5 to 9 Year Old | 467 (81.4%) | 107 (18.6%) |
| 10 to 14 Year Olds | 887 (77.0%) | 265 (23.0%) |
| 15 to 17 Year Olds | 358 (85.7%) | 60 (14.3%) |
| 18 to 19 Year Olds | 253 (91.0%) | 25 (9.0%) |
| 20 to 24 Year Olds | 93 (79.5%) | 24 (20.5%) |
| 25 to 34 Year Olds | 22 (25.3%) | 65 (74.7%) |
| 35 Years and over | 15 (27.3%) | 40 (72.7%) |
| Total | 2,233 (75.0%) | 744 (25.0%) |
Educational Attainment by Field of Study in Prospect Heights
Business (961 | 20.1%), engineering (605 | 12.7%), education (537 | 11.3%), social sciences (526 | 11.0%), and science & technology (490 | 10.3%) are the most common fields of study among 4,774 individuals in Prospect Heights who have obtained a bachelor's degree or higher.
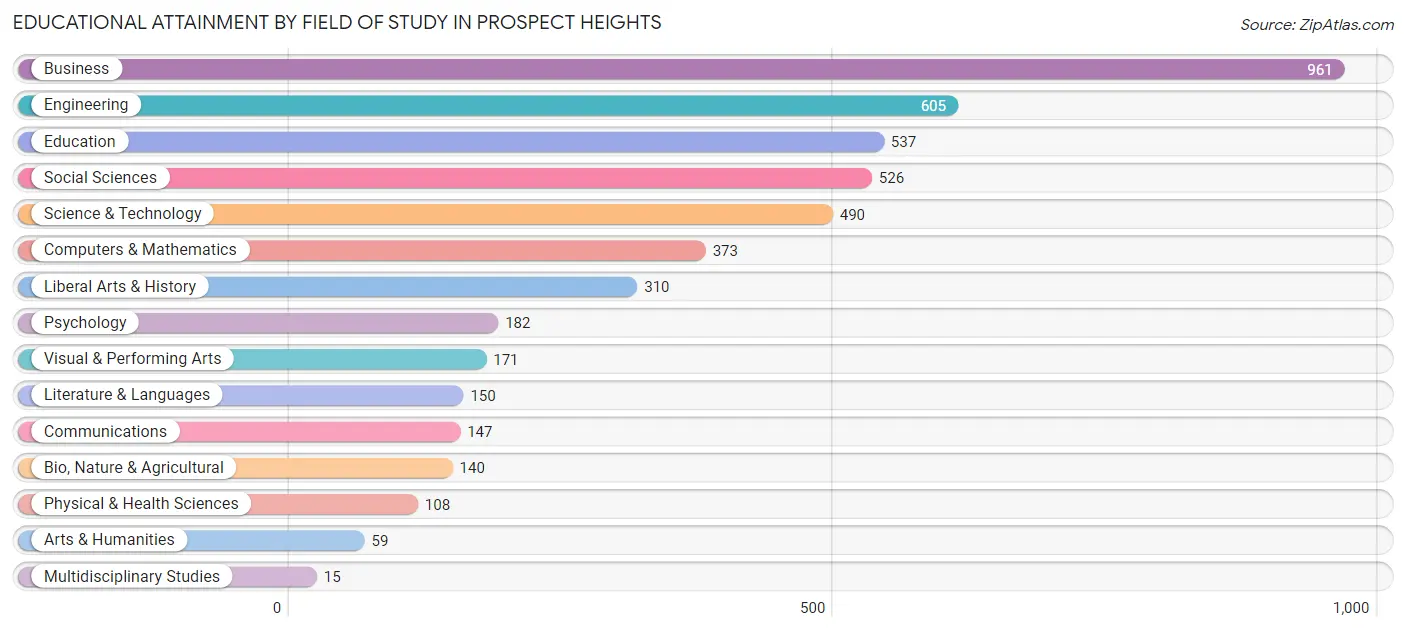
| Field of Study | # Graduates | % Graduates |
| Computers & Mathematics | 373 | 7.8% |
| Bio, Nature & Agricultural | 140 | 2.9% |
| Physical & Health Sciences | 108 | 2.3% |
| Psychology | 182 | 3.8% |
| Social Sciences | 526 | 11.0% |
| Engineering | 605 | 12.7% |
| Multidisciplinary Studies | 15 | 0.3% |
| Science & Technology | 490 | 10.3% |
| Business | 961 | 20.1% |
| Education | 537 | 11.3% |
| Literature & Languages | 150 | 3.1% |
| Liberal Arts & History | 310 | 6.5% |
| Visual & Performing Arts | 171 | 3.6% |
| Communications | 147 | 3.1% |
| Arts & Humanities | 59 | 1.2% |
| Total | 4,774 | 100.0% |
Transportation & Commute in Prospect Heights
Vehicle Availability by Sex in Prospect Heights
The most prevalent vehicle ownership categories in Prospect Heights are males with 2 vehicles (2,212, accounting for 50.8%) and females with 2 vehicles (1,640, making up 56.3%).
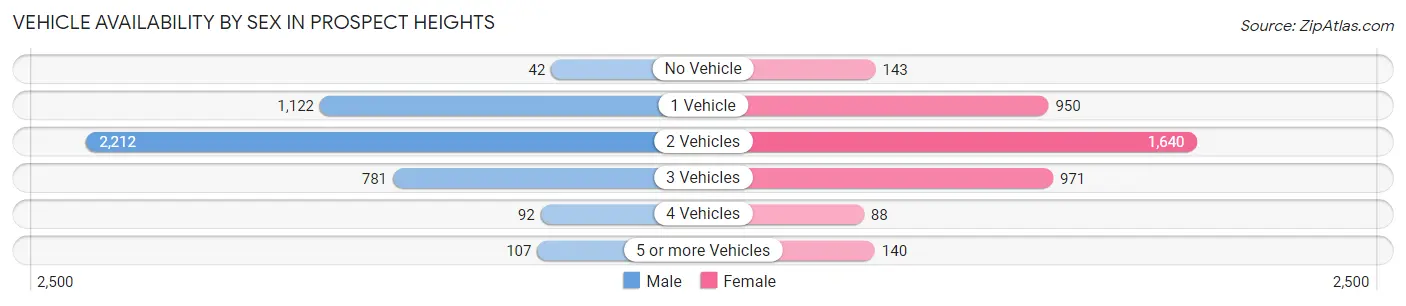
| Vehicles Available | Male | Female |
| No Vehicle | 42 (1.0%) | 143 (3.6%) |
| 1 Vehicle | 1,122 (25.8%) | 950 (24.2%) |
| 2 Vehicles | 2,212 (50.8%) | 1,640 (41.7%) |
| 3 Vehicles | 781 (17.9%) | 971 (24.7%) |
| 4 Vehicles | 92 (2.1%) | 88 (2.2%) |
| 5 or more Vehicles | 107 (2.5%) | 140 (3.6%) |
| Total | 4,356 (100.0%) | 3,932 (100.0%) |
Commute Time in Prospect Heights
The most frequently occuring commute durations in Prospect Heights are 20 to 24 minutes (1,416 commuters, 20.1%), 10 to 14 minutes (947 commuters, 13.4%), and 30 to 34 minutes (931 commuters, 13.2%).
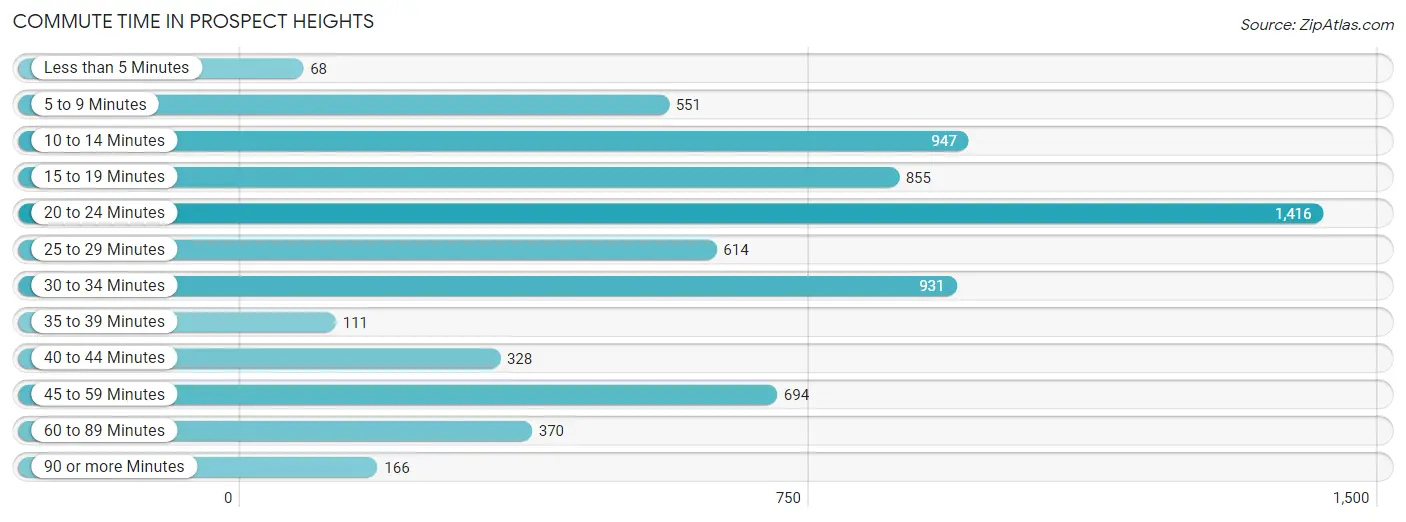
| Commute Time | # Commuters | % Commuters |
| Less than 5 Minutes | 68 | 1.0% |
| 5 to 9 Minutes | 551 | 7.8% |
| 10 to 14 Minutes | 947 | 13.4% |
| 15 to 19 Minutes | 855 | 12.1% |
| 20 to 24 Minutes | 1,416 | 20.1% |
| 25 to 29 Minutes | 614 | 8.7% |
| 30 to 34 Minutes | 931 | 13.2% |
| 35 to 39 Minutes | 111 | 1.6% |
| 40 to 44 Minutes | 328 | 4.6% |
| 45 to 59 Minutes | 694 | 9.8% |
| 60 to 89 Minutes | 370 | 5.2% |
| 90 or more Minutes | 166 | 2.4% |
Commute Time by Sex in Prospect Heights
The most common commute times in Prospect Heights are 20 to 24 minutes (713 commuters, 19.2%) for males and 20 to 24 minutes (703 commuters, 21.1%) for females.
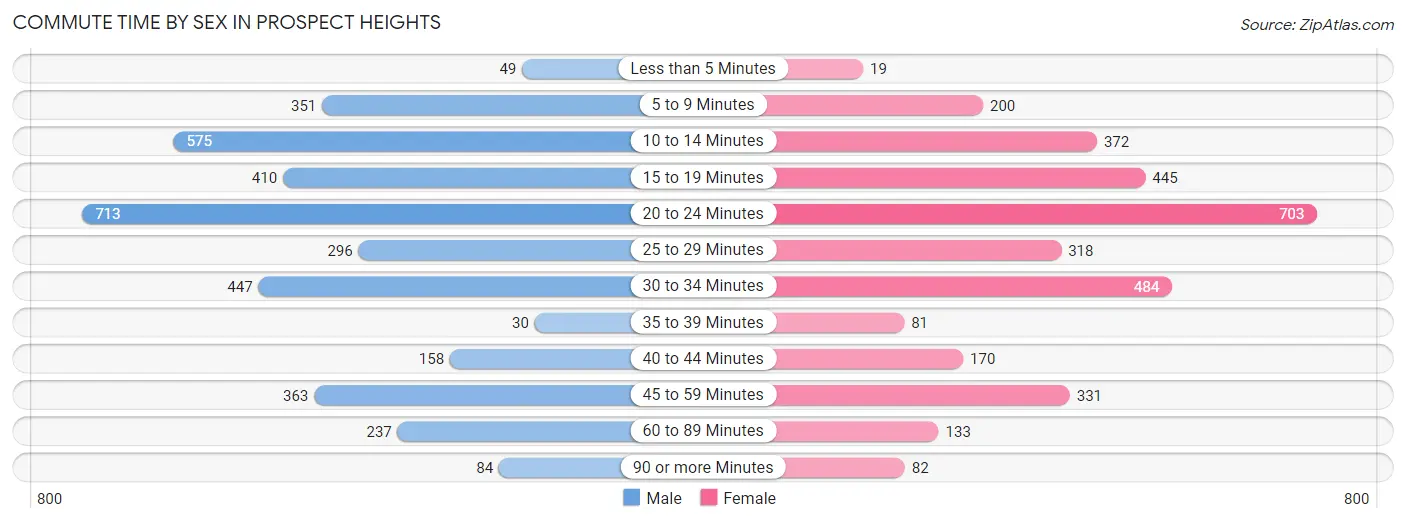
| Commute Time | Male | Female |
| Less than 5 Minutes | 49 (1.3%) | 19 (0.6%) |
| 5 to 9 Minutes | 351 (9.5%) | 200 (6.0%) |
| 10 to 14 Minutes | 575 (15.5%) | 372 (11.1%) |
| 15 to 19 Minutes | 410 (11.0%) | 445 (13.3%) |
| 20 to 24 Minutes | 713 (19.2%) | 703 (21.1%) |
| 25 to 29 Minutes | 296 (8.0%) | 318 (9.5%) |
| 30 to 34 Minutes | 447 (12.0%) | 484 (14.5%) |
| 35 to 39 Minutes | 30 (0.8%) | 81 (2.4%) |
| 40 to 44 Minutes | 158 (4.3%) | 170 (5.1%) |
| 45 to 59 Minutes | 363 (9.8%) | 331 (9.9%) |
| 60 to 89 Minutes | 237 (6.4%) | 133 (4.0%) |
| 90 or more Minutes | 84 (2.3%) | 82 (2.5%) |
Time of Departure to Work by Sex in Prospect Heights
The most frequent times of departure to work in Prospect Heights are 7:00 AM to 7:29 AM (775, 20.9%) for males and 8:00 AM to 8:29 AM (574, 17.2%) for females.
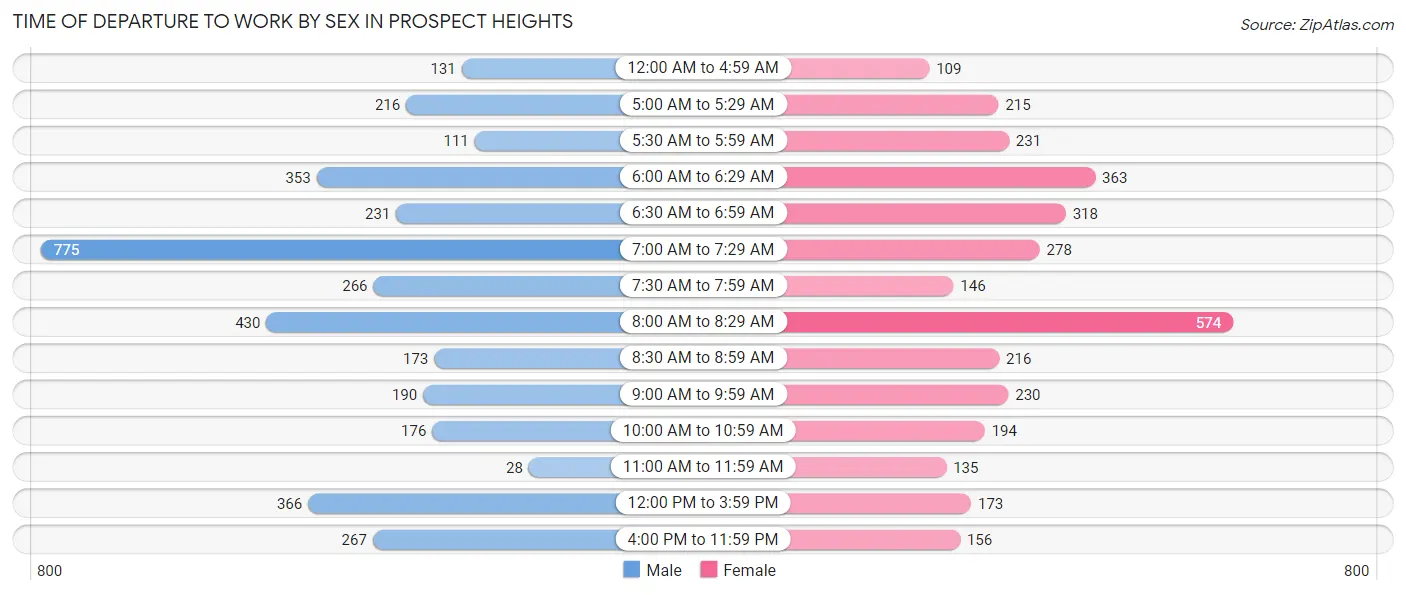
| Time of Departure | Male | Female |
| 12:00 AM to 4:59 AM | 131 (3.5%) | 109 (3.3%) |
| 5:00 AM to 5:29 AM | 216 (5.8%) | 215 (6.4%) |
| 5:30 AM to 5:59 AM | 111 (3.0%) | 231 (6.9%) |
| 6:00 AM to 6:29 AM | 353 (9.5%) | 363 (10.9%) |
| 6:30 AM to 6:59 AM | 231 (6.2%) | 318 (9.5%) |
| 7:00 AM to 7:29 AM | 775 (20.9%) | 278 (8.3%) |
| 7:30 AM to 7:59 AM | 266 (7.2%) | 146 (4.4%) |
| 8:00 AM to 8:29 AM | 430 (11.6%) | 574 (17.2%) |
| 8:30 AM to 8:59 AM | 173 (4.7%) | 216 (6.5%) |
| 9:00 AM to 9:59 AM | 190 (5.1%) | 230 (6.9%) |
| 10:00 AM to 10:59 AM | 176 (4.7%) | 194 (5.8%) |
| 11:00 AM to 11:59 AM | 28 (0.7%) | 135 (4.0%) |
| 12:00 PM to 3:59 PM | 366 (9.9%) | 173 (5.2%) |
| 4:00 PM to 11:59 PM | 267 (7.2%) | 156 (4.7%) |
| Total | 3,713 (100.0%) | 3,338 (100.0%) |
Housing Occupancy in Prospect Heights
Occupancy by Ownership in Prospect Heights
Of the total 6,286 dwellings in Prospect Heights, owner-occupied units account for 4,145 (65.9%), while renter-occupied units make up 2,141 (34.1%).
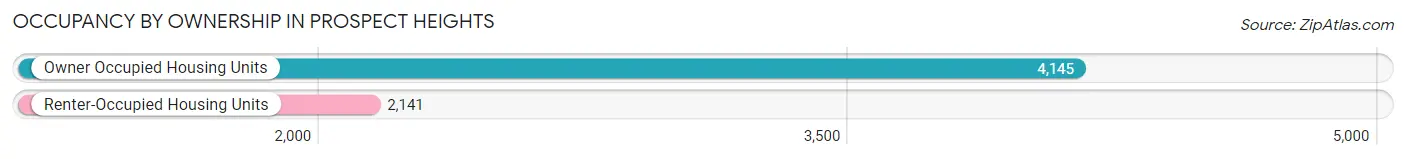
| Occupancy | # Housing Units | % Housing Units |
| Owner Occupied Housing Units | 4,145 | 65.9% |
| Renter-Occupied Housing Units | 2,141 | 34.1% |
| Total Occupied Housing Units | 6,286 | 100.0% |
Occupancy by Household Size in Prospect Heights
| Household Size | # Housing Units | % Housing Units |
| 1-Person Household | 1,603 | 25.5% |
| 2-Person Household | 2,384 | 37.9% |
| 3-Person Household | 1,096 | 17.4% |
| 4+ Person Household | 1,203 | 19.1% |
| Total Housing Units | 6,286 | 100.0% |
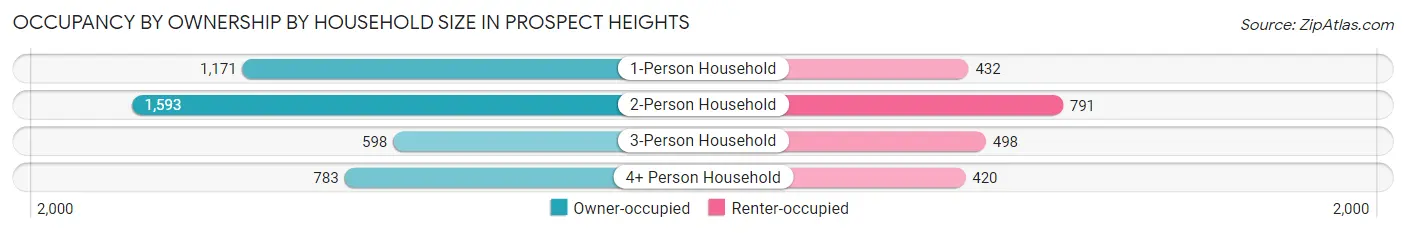
Occupancy by Ownership by Household Size in Prospect Heights
| Household Size | Owner-occupied | Renter-occupied |
| 1-Person Household | 1,171 (73.1%) | 432 (27.0%) |
| 2-Person Household | 1,593 (66.8%) | 791 (33.2%) |
| 3-Person Household | 598 (54.6%) | 498 (45.4%) |
| 4+ Person Household | 783 (65.1%) | 420 (34.9%) |
| Total Housing Units | 4,145 (65.9%) | 2,141 (34.1%) |
Occupancy by Educational Attainment in Prospect Heights
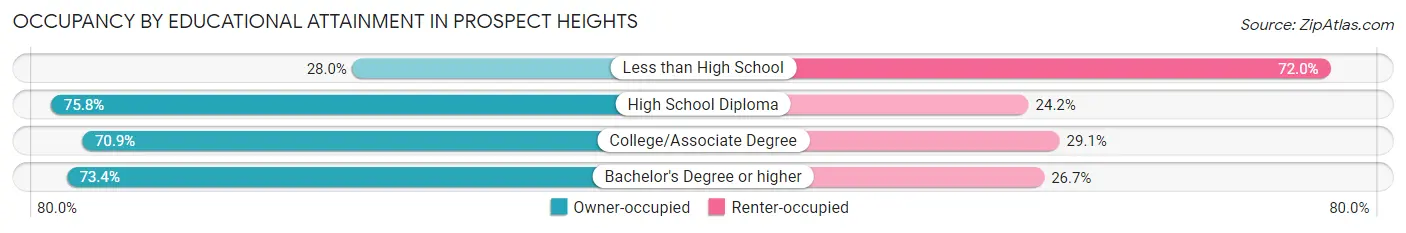
| Household Size | Owner-occupied | Renter-occupied |
| Less than High School | 274 (28.0%) | 706 (72.0%) |
| High School Diploma | 737 (75.8%) | 235 (24.2%) |
| College/Associate Degree | 1,301 (70.9%) | 534 (29.1%) |
| Bachelor's Degree or higher | 1,833 (73.4%) | 666 (26.7%) |
Occupancy by Age of Householder in Prospect Heights
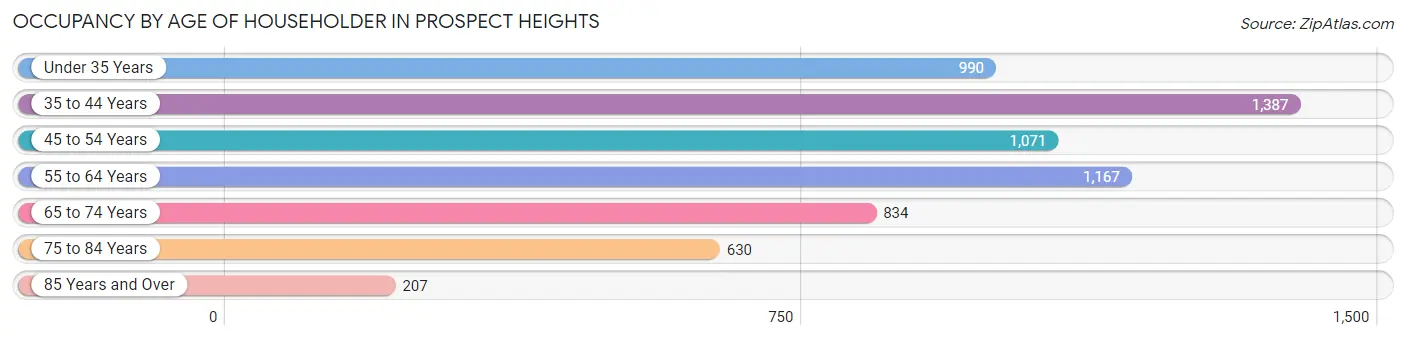
| Age Bracket | # Households | % Households |
| Under 35 Years | 990 | 15.8% |
| 35 to 44 Years | 1,387 | 22.1% |
| 45 to 54 Years | 1,071 | 17.0% |
| 55 to 64 Years | 1,167 | 18.6% |
| 65 to 74 Years | 834 | 13.3% |
| 75 to 84 Years | 630 | 10.0% |
| 85 Years and Over | 207 | 3.3% |
| Total | 6,286 | 100.0% |
Housing Finances in Prospect Heights
Median Income by Occupancy in Prospect Heights
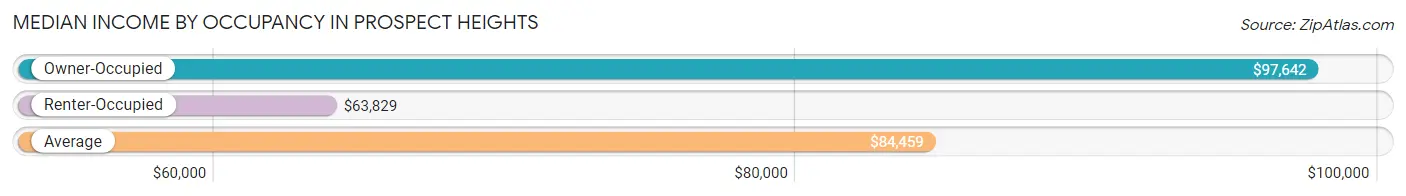
| Occupancy Type | # Households | Median Income |
| Owner-Occupied | 4,145 (65.9%) | $97,642 |
| Renter-Occupied | 2,141 (34.1%) | $63,829 |
| Average | 6,286 (100.0%) | $84,459 |
Occupancy by Householder Income Bracket in Prospect Heights
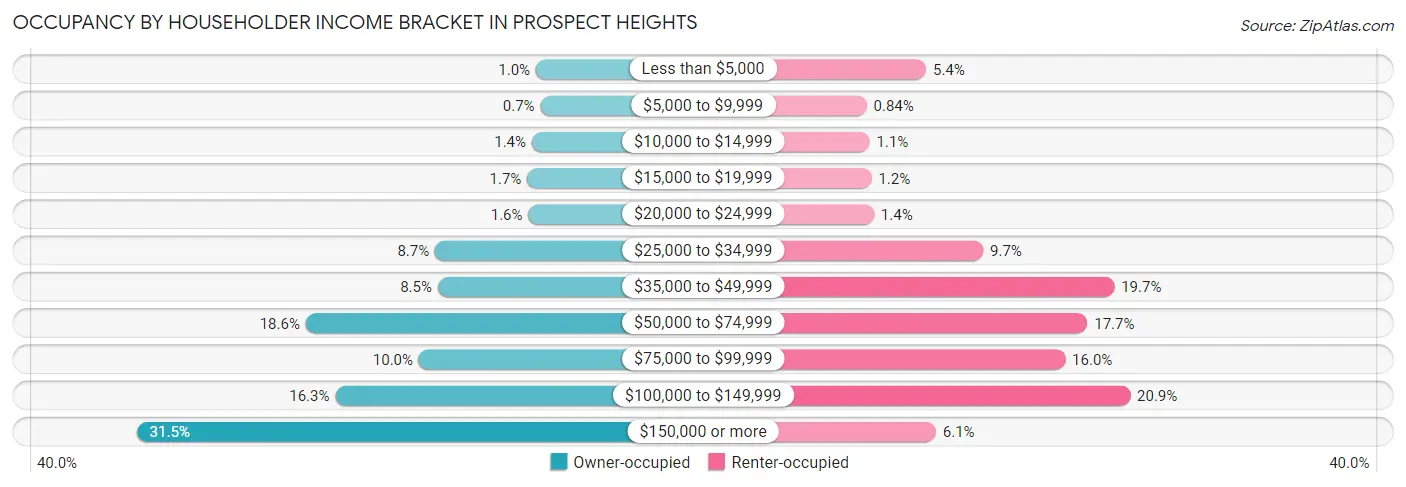
| Income Bracket | Owner-occupied | Renter-occupied |
| Less than $5,000 | 43 (1.0%) | 115 (5.4%) |
| $5,000 to $9,999 | 29 (0.7%) | 18 (0.8%) |
| $10,000 to $14,999 | 56 (1.3%) | 23 (1.1%) |
| $15,000 to $19,999 | 71 (1.7%) | 26 (1.2%) |
| $20,000 to $24,999 | 67 (1.6%) | 30 (1.4%) |
| $25,000 to $34,999 | 362 (8.7%) | 208 (9.7%) |
| $35,000 to $49,999 | 353 (8.5%) | 422 (19.7%) |
| $50,000 to $74,999 | 770 (18.6%) | 378 (17.7%) |
| $75,000 to $99,999 | 413 (10.0%) | 342 (16.0%) |
| $100,000 to $149,999 | 677 (16.3%) | 448 (20.9%) |
| $150,000 or more | 1,304 (31.5%) | 131 (6.1%) |
| Total | 4,145 (100.0%) | 2,141 (100.0%) |
Monthly Housing Cost Tiers in Prospect Heights
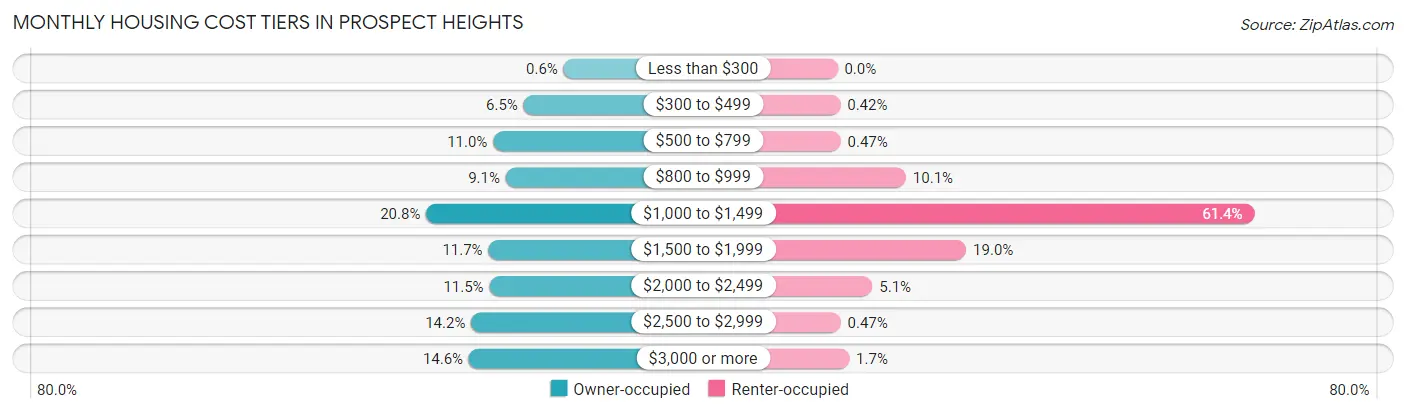
| Monthly Cost | Owner-occupied | Renter-occupied |
| Less than $300 | 25 (0.6%) | 0 (0.0%) |
| $300 to $499 | 269 (6.5%) | 9 (0.4%) |
| $500 to $799 | 455 (11.0%) | 10 (0.5%) |
| $800 to $999 | 378 (9.1%) | 216 (10.1%) |
| $1,000 to $1,499 | 864 (20.8%) | 1,315 (61.4%) |
| $1,500 to $1,999 | 484 (11.7%) | 406 (19.0%) |
| $2,000 to $2,499 | 478 (11.5%) | 110 (5.1%) |
| $2,500 to $2,999 | 589 (14.2%) | 10 (0.5%) |
| $3,000 or more | 603 (14.5%) | 37 (1.7%) |
| Total | 4,145 (100.0%) | 2,141 (100.0%) |
Physical Housing Characteristics in Prospect Heights
Housing Structures in Prospect Heights
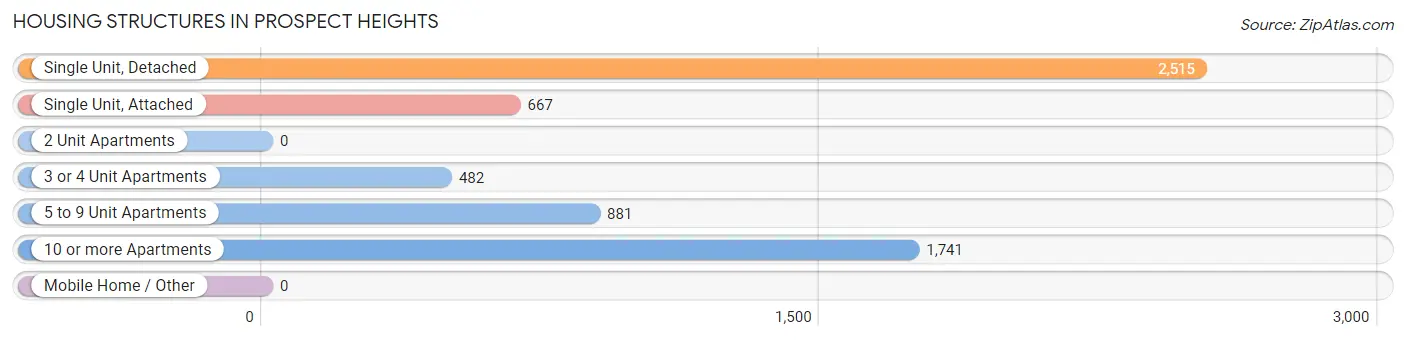
| Structure Type | # Housing Units | % Housing Units |
| Single Unit, Detached | 2,515 | 40.0% |
| Single Unit, Attached | 667 | 10.6% |
| 2 Unit Apartments | 0 | 0.0% |
| 3 or 4 Unit Apartments | 482 | 7.7% |
| 5 to 9 Unit Apartments | 881 | 14.0% |
| 10 or more Apartments | 1,741 | 27.7% |
| Mobile Home / Other | 0 | 0.0% |
| Total | 6,286 | 100.0% |
Housing Structures by Occupancy in Prospect Heights
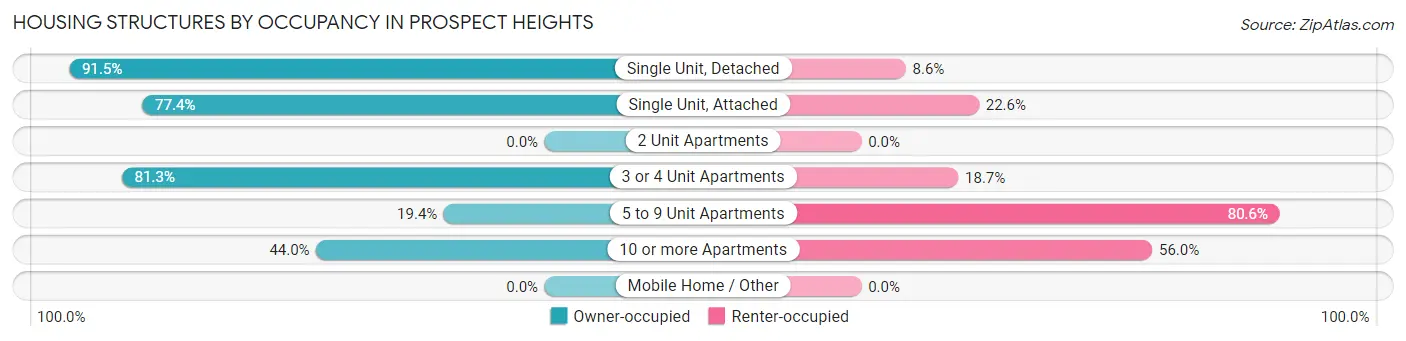
| Structure Type | Owner-occupied | Renter-occupied |
| Single Unit, Detached | 2,300 (91.4%) | 215 (8.6%) |
| Single Unit, Attached | 516 (77.4%) | 151 (22.6%) |
| 2 Unit Apartments | 0 (0.0%) | 0 (0.0%) |
| 3 or 4 Unit Apartments | 392 (81.3%) | 90 (18.7%) |
| 5 to 9 Unit Apartments | 171 (19.4%) | 710 (80.6%) |
| 10 or more Apartments | 766 (44.0%) | 975 (56.0%) |
| Mobile Home / Other | 0 (0.0%) | 0 (0.0%) |
| Total | 4,145 (65.9%) | 2,141 (34.1%) |
Housing Structures by Number of Rooms in Prospect Heights
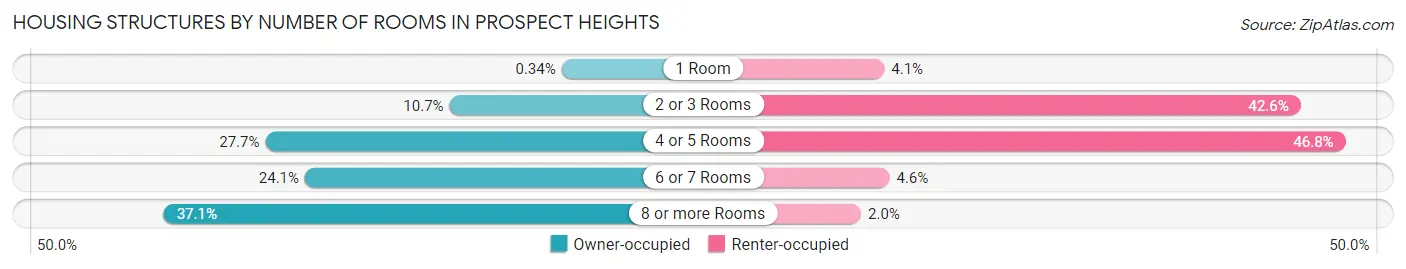
| Number of Rooms | Owner-occupied | Renter-occupied |
| 1 Room | 14 (0.3%) | 88 (4.1%) |
| 2 or 3 Rooms | 444 (10.7%) | 912 (42.6%) |
| 4 or 5 Rooms | 1,150 (27.7%) | 1,001 (46.8%) |
| 6 or 7 Rooms | 998 (24.1%) | 98 (4.6%) |
| 8 or more Rooms | 1,539 (37.1%) | 42 (2.0%) |
| Total | 4,145 (100.0%) | 2,141 (100.0%) |
Housing Structure by Heating Type in Prospect Heights
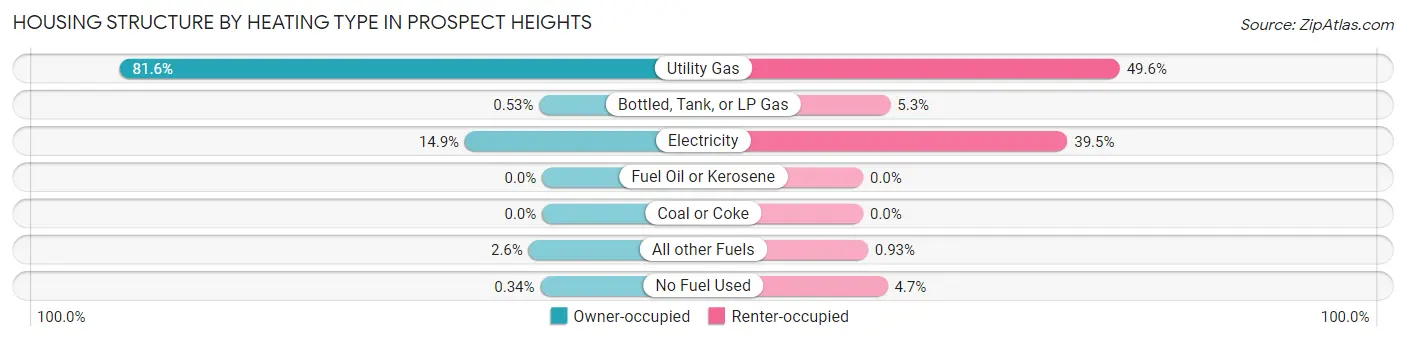
| Heating Type | Owner-occupied | Renter-occupied |
| Utility Gas | 3,383 (81.6%) | 1,062 (49.6%) |
| Bottled, Tank, or LP Gas | 22 (0.5%) | 113 (5.3%) |
| Electricity | 618 (14.9%) | 845 (39.5%) |
| Fuel Oil or Kerosene | 0 (0.0%) | 0 (0.0%) |
| Coal or Coke | 0 (0.0%) | 0 (0.0%) |
| All other Fuels | 108 (2.6%) | 20 (0.9%) |
| No Fuel Used | 14 (0.3%) | 101 (4.7%) |
| Total | 4,145 (100.0%) | 2,141 (100.0%) |
Household Vehicle Usage in Prospect Heights
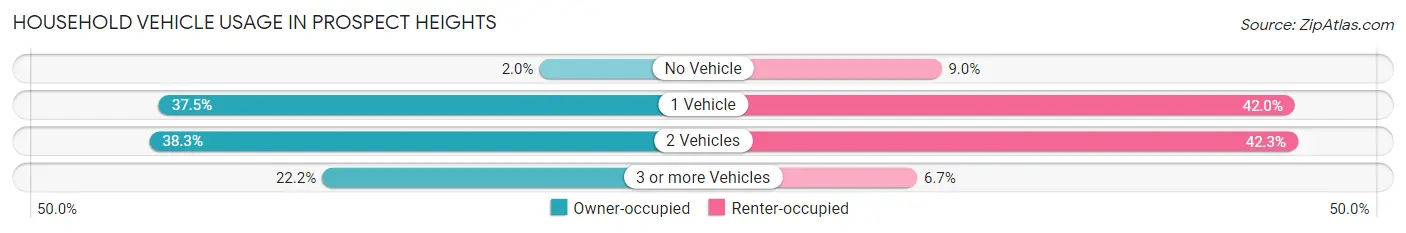
| Vehicles per Household | Owner-occupied | Renter-occupied |
| No Vehicle | 81 (1.9%) | 193 (9.0%) |
| 1 Vehicle | 1,553 (37.5%) | 899 (42.0%) |
| 2 Vehicles | 1,589 (38.3%) | 905 (42.3%) |
| 3 or more Vehicles | 922 (22.2%) | 144 (6.7%) |
| Total | 4,145 (100.0%) | 2,141 (100.0%) |
Real Estate & Mortgages in Prospect Heights
Real Estate and Mortgage Overview in Prospect Heights
| Characteristic | Without Mortgage | With Mortgage |
| Housing Units | 2,081 | 2,064 |
| Median Property Value | $326,000 | $349,500 |
| Median Household Income | $71,961 | $813 |
| Monthly Housing Costs | $1,059 | $520 |
| Real Estate Taxes | $7,285 | $0 |
Property Value by Mortgage Status in Prospect Heights
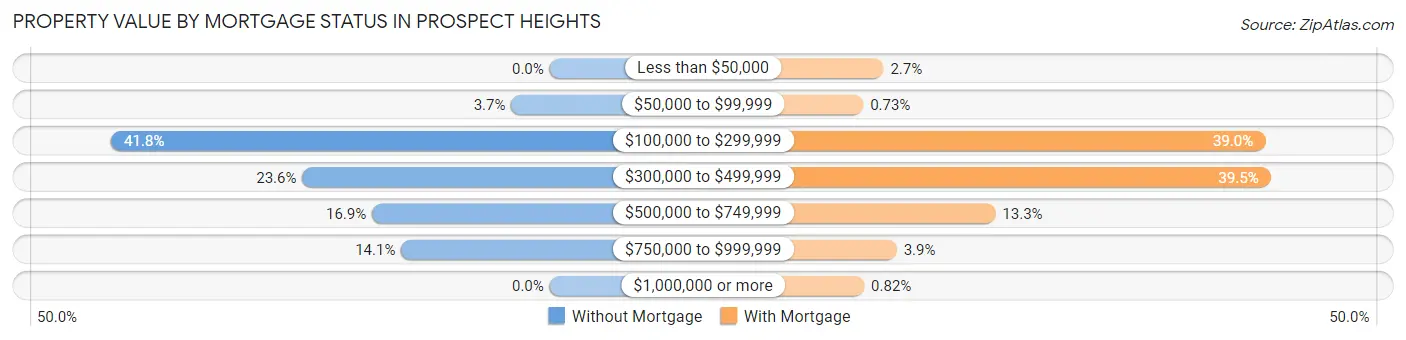
| Property Value | Without Mortgage | With Mortgage |
| Less than $50,000 | 0 (0.0%) | 55 (2.7%) |
| $50,000 to $99,999 | 76 (3.6%) | 15 (0.7%) |
| $100,000 to $299,999 | 869 (41.8%) | 805 (39.0%) |
| $300,000 to $499,999 | 490 (23.5%) | 816 (39.5%) |
| $500,000 to $749,999 | 352 (16.9%) | 275 (13.3%) |
| $750,000 to $999,999 | 294 (14.1%) | 81 (3.9%) |
| $1,000,000 or more | 0 (0.0%) | 17 (0.8%) |
| Total | 2,081 (100.0%) | 2,064 (100.0%) |
Household Income by Mortgage Status in Prospect Heights
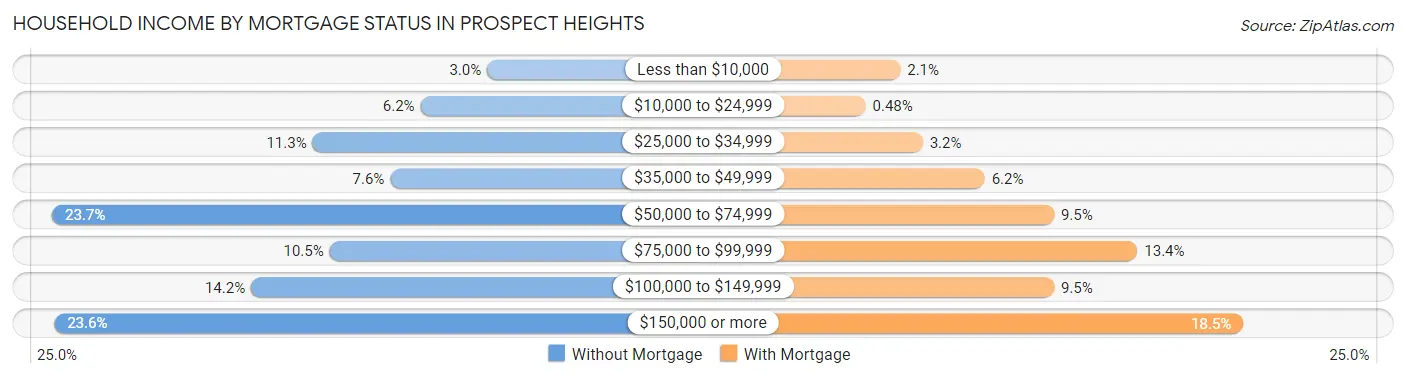
| Household Income | Without Mortgage | With Mortgage |
| Less than $10,000 | 62 (3.0%) | 44 (2.1%) |
| $10,000 to $24,999 | 128 (6.1%) | 10 (0.5%) |
| $25,000 to $34,999 | 235 (11.3%) | 66 (3.2%) |
| $35,000 to $49,999 | 158 (7.6%) | 127 (6.1%) |
| $50,000 to $74,999 | 493 (23.7%) | 195 (9.5%) |
| $75,000 to $99,999 | 218 (10.5%) | 277 (13.4%) |
| $100,000 to $149,999 | 296 (14.2%) | 195 (9.5%) |
| $150,000 or more | 491 (23.6%) | 381 (18.5%) |
| Total | 2,081 (100.0%) | 2,064 (100.0%) |
Property Value to Household Income Ratio in Prospect Heights
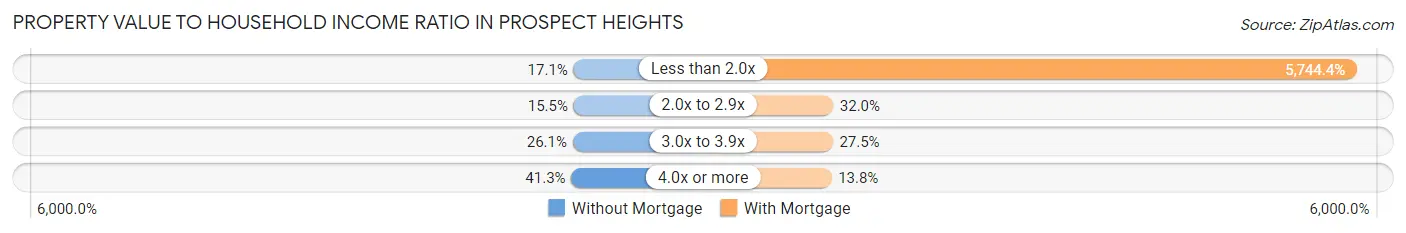
| Value-to-Income Ratio | Without Mortgage | With Mortgage |
| Less than 2.0x | 356 (17.1%) | 118,565 (5,744.4%) |
| 2.0x to 2.9x | 323 (15.5%) | 661 (32.0%) |
| 3.0x to 3.9x | 542 (26.1%) | 567 (27.5%) |
| 4.0x or more | 860 (41.3%) | 285 (13.8%) |
| Total | 2,081 (100.0%) | 2,064 (100.0%) |
Real Estate Taxes by Mortgage Status in Prospect Heights
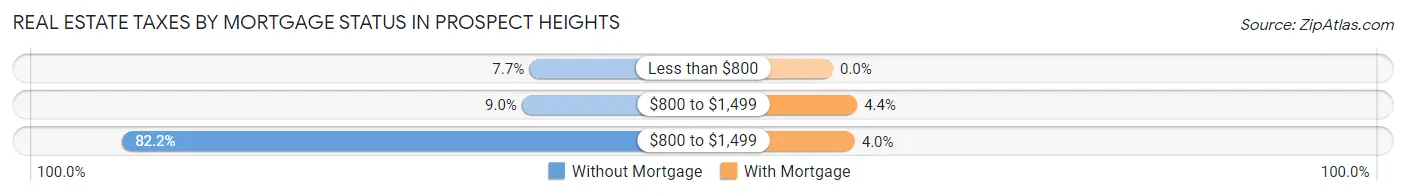
| Property Taxes | Without Mortgage | With Mortgage |
| Less than $800 | 160 (7.7%) | 0 (0.0%) |
| $800 to $1,499 | 188 (9.0%) | 91 (4.4%) |
| $800 to $1,499 | 1,710 (82.2%) | 82 (4.0%) |
| Total | 2,081 (100.0%) | 2,064 (100.0%) |
Health & Disability in Prospect Heights
Health Insurance Coverage by Age in Prospect Heights
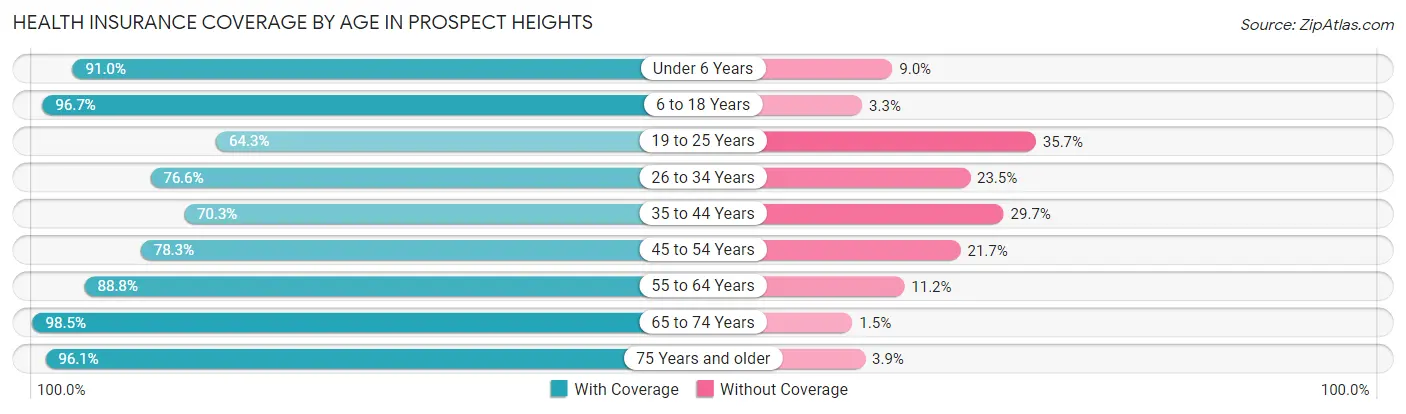
| Age Bracket | With Coverage | Without Coverage |
| Under 6 Years | 1,220 (91.0%) | 120 (9.0%) |
| 6 to 18 Years | 2,174 (96.7%) | 75 (3.3%) |
| 19 to 25 Years | 511 (64.3%) | 284 (35.7%) |
| 26 to 34 Years | 1,626 (76.5%) | 498 (23.4%) |
| 35 to 44 Years | 1,762 (70.3%) | 745 (29.7%) |
| 45 to 54 Years | 1,528 (78.3%) | 423 (21.7%) |
| 55 to 64 Years | 1,871 (88.8%) | 236 (11.2%) |
| 65 to 74 Years | 1,501 (98.5%) | 23 (1.5%) |
| 75 Years and older | 1,164 (96.1%) | 47 (3.9%) |
| Total | 13,357 (84.5%) | 2,451 (15.5%) |
Health Insurance Coverage by Citizenship Status in Prospect Heights
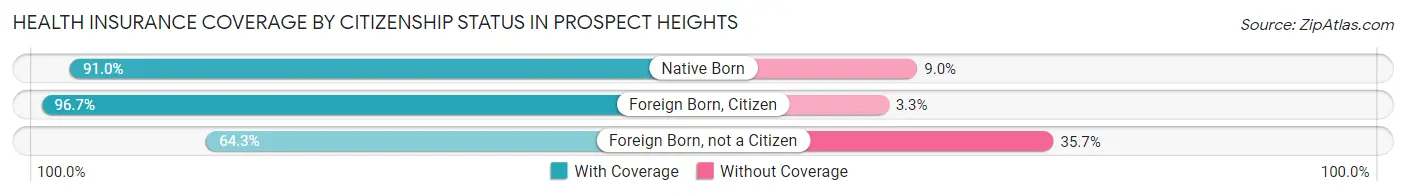
| Citizenship Status | With Coverage | Without Coverage |
| Native Born | 1,220 (91.0%) | 120 (9.0%) |
| Foreign Born, Citizen | 2,174 (96.7%) | 75 (3.3%) |
| Foreign Born, not a Citizen | 511 (64.3%) | 284 (35.7%) |
Health Insurance Coverage by Household Income in Prospect Heights
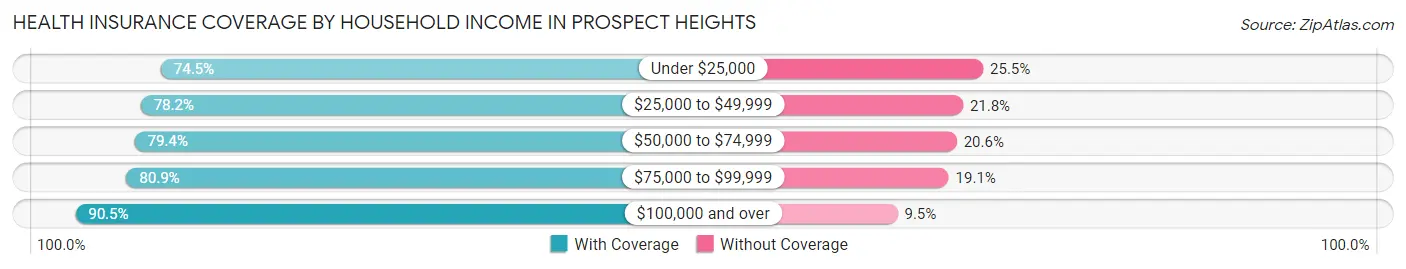
| Household Income | With Coverage | Without Coverage |
| Under $25,000 | 554 (74.5%) | 190 (25.5%) |
| $25,000 to $49,999 | 2,255 (78.2%) | 627 (21.8%) |
| $50,000 to $74,999 | 1,885 (79.4%) | 489 (20.6%) |
| $75,000 to $99,999 | 1,832 (80.9%) | 432 (19.1%) |
| $100,000 and over | 6,782 (90.5%) | 712 (9.5%) |
Public vs Private Health Insurance Coverage by Age in Prospect Heights
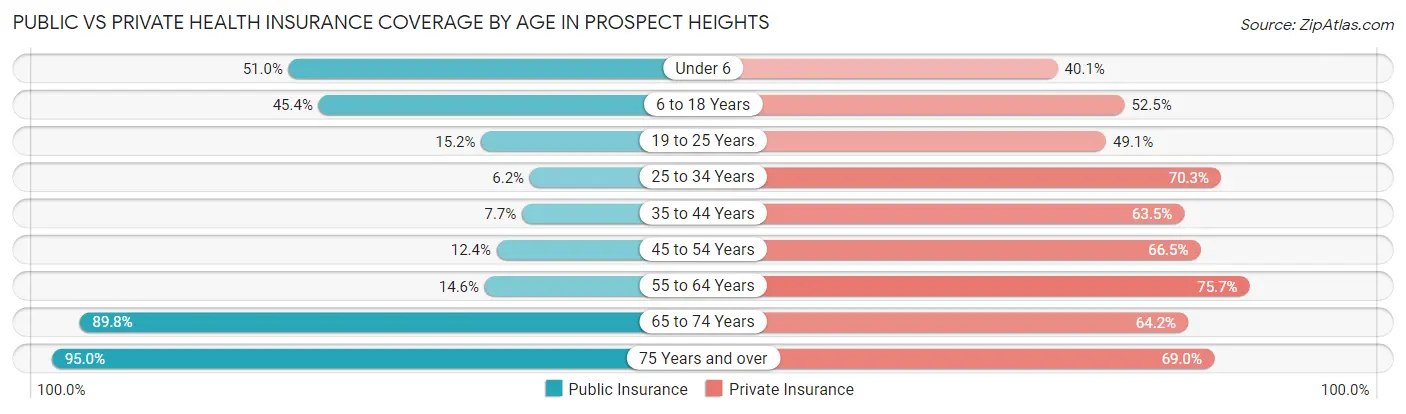
| Age Bracket | Public Insurance | Private Insurance |
| Under 6 | 683 (51.0%) | 537 (40.1%) |
| 6 to 18 Years | 1,021 (45.4%) | 1,180 (52.5%) |
| 19 to 25 Years | 121 (15.2%) | 390 (49.1%) |
| 25 to 34 Years | 132 (6.2%) | 1,494 (70.3%) |
| 35 to 44 Years | 192 (7.7%) | 1,593 (63.5%) |
| 45 to 54 Years | 241 (12.3%) | 1,298 (66.5%) |
| 55 to 64 Years | 307 (14.6%) | 1,594 (75.6%) |
| 65 to 74 Years | 1,369 (89.8%) | 979 (64.2%) |
| 75 Years and over | 1,150 (95.0%) | 836 (69.0%) |
| Total | 5,216 (33.0%) | 9,901 (62.6%) |
Disability Status by Sex by Age in Prospect Heights
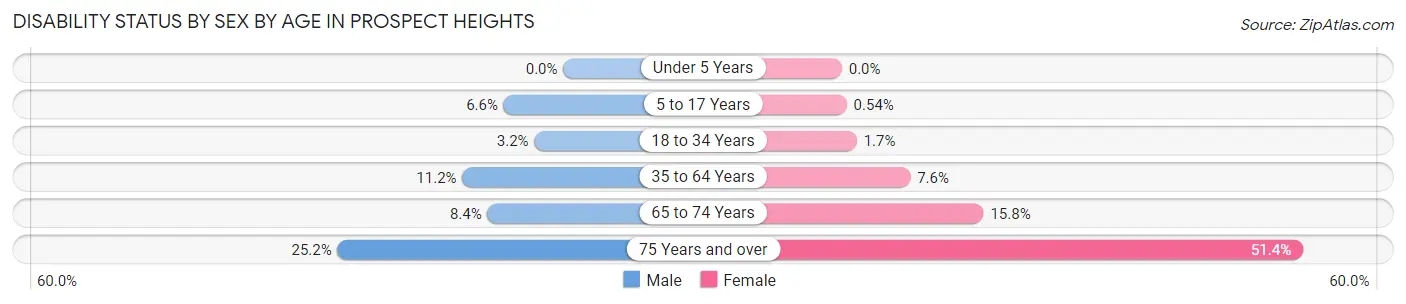
| Age Bracket | Male | Female |
| Under 5 Years | 0 (0.0%) | 0 (0.0%) |
| 5 to 17 Years | 86 (6.6%) | 5 (0.5%) |
| 18 to 34 Years | 47 (3.2%) | 28 (1.7%) |
| 35 to 64 Years | 365 (11.2%) | 253 (7.6%) |
| 65 to 74 Years | 57 (8.4%) | 134 (15.8%) |
| 75 Years and over | 166 (25.2%) | 283 (51.4%) |
Disability Class by Sex by Age in Prospect Heights
Disability Class: Hearing Difficulty
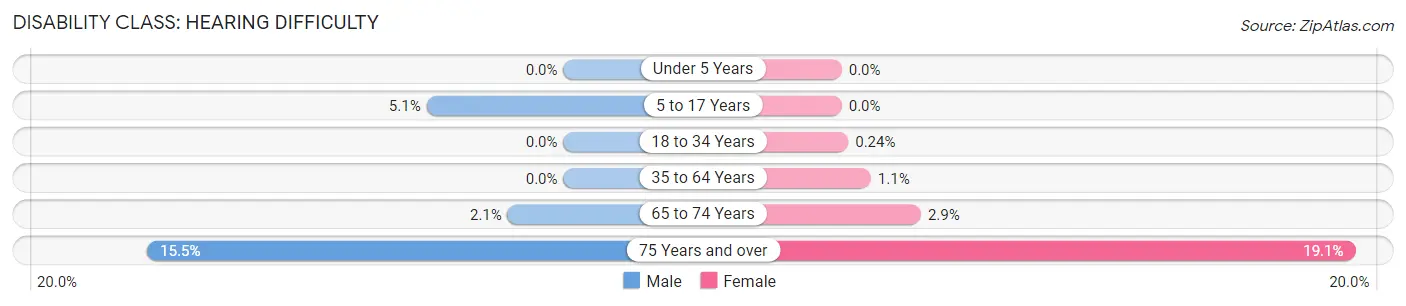
| Age Bracket | Male | Female |
| Under 5 Years | 0 (0.0%) | 0 (0.0%) |
| 5 to 17 Years | 66 (5.1%) | 0 (0.0%) |
| 18 to 34 Years | 0 (0.0%) | 4 (0.2%) |
| 35 to 64 Years | 0 (0.0%) | 36 (1.1%) |
| 65 to 74 Years | 14 (2.1%) | 25 (2.9%) |
| 75 Years and over | 102 (15.4%) | 105 (19.1%) |
Disability Class: Vision Difficulty
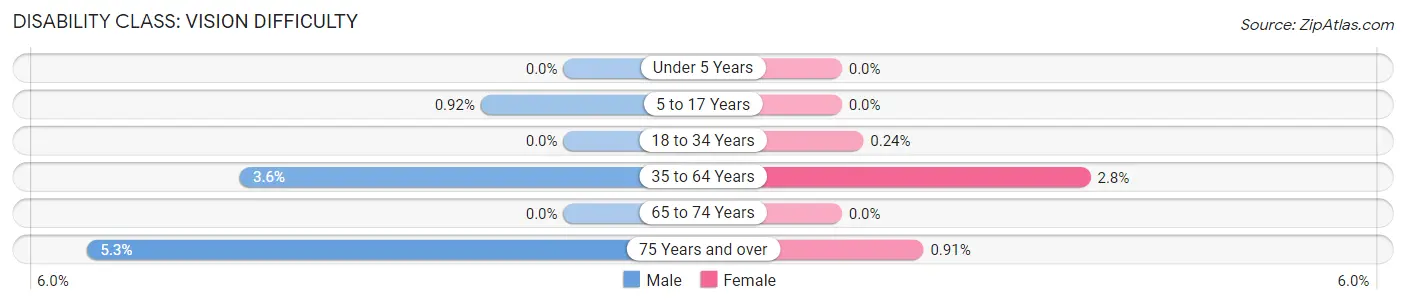
| Age Bracket | Male | Female |
| Under 5 Years | 0 (0.0%) | 0 (0.0%) |
| 5 to 17 Years | 12 (0.9%) | 0 (0.0%) |
| 18 to 34 Years | 0 (0.0%) | 4 (0.2%) |
| 35 to 64 Years | 117 (3.6%) | 92 (2.8%) |
| 65 to 74 Years | 0 (0.0%) | 0 (0.0%) |
| 75 Years and over | 35 (5.3%) | 5 (0.9%) |
Disability Class: Cognitive Difficulty
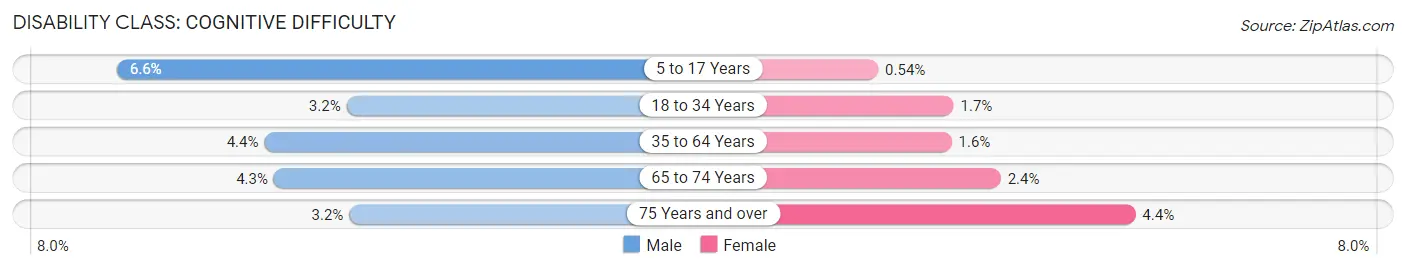
| Age Bracket | Male | Female |
| 5 to 17 Years | 86 (6.6%) | 5 (0.5%) |
| 18 to 34 Years | 47 (3.2%) | 28 (1.7%) |
| 35 to 64 Years | 144 (4.4%) | 54 (1.6%) |
| 65 to 74 Years | 29 (4.3%) | 20 (2.4%) |
| 75 Years and over | 21 (3.2%) | 24 (4.4%) |
Disability Class: Ambulatory Difficulty
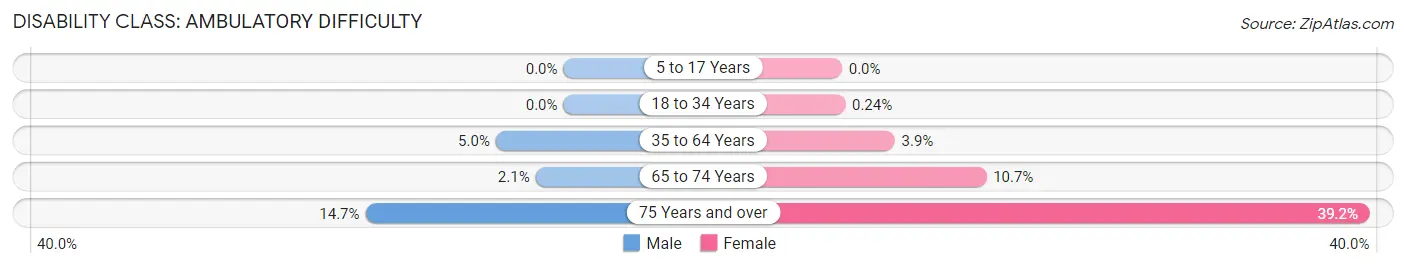
| Age Bracket | Male | Female |
| 5 to 17 Years | 0 (0.0%) | 0 (0.0%) |
| 18 to 34 Years | 0 (0.0%) | 4 (0.2%) |
| 35 to 64 Years | 163 (5.0%) | 130 (3.9%) |
| 65 to 74 Years | 14 (2.1%) | 91 (10.7%) |
| 75 Years and over | 97 (14.7%) | 216 (39.2%) |
Disability Class: Self-Care Difficulty
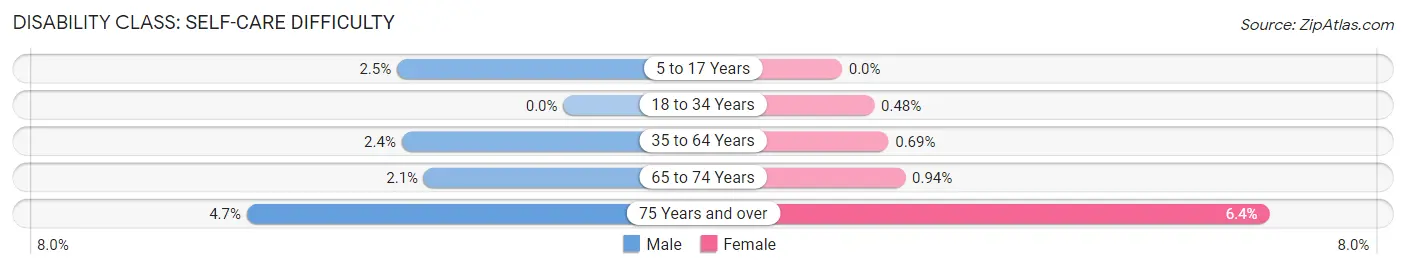
| Age Bracket | Male | Female |
| 5 to 17 Years | 32 (2.5%) | 0 (0.0%) |
| 18 to 34 Years | 0 (0.0%) | 8 (0.5%) |
| 35 to 64 Years | 78 (2.4%) | 23 (0.7%) |
| 65 to 74 Years | 14 (2.1%) | 8 (0.9%) |
| 75 Years and over | 31 (4.7%) | 35 (6.4%) |
Technology Access in Prospect Heights
Computing Device Access in Prospect Heights
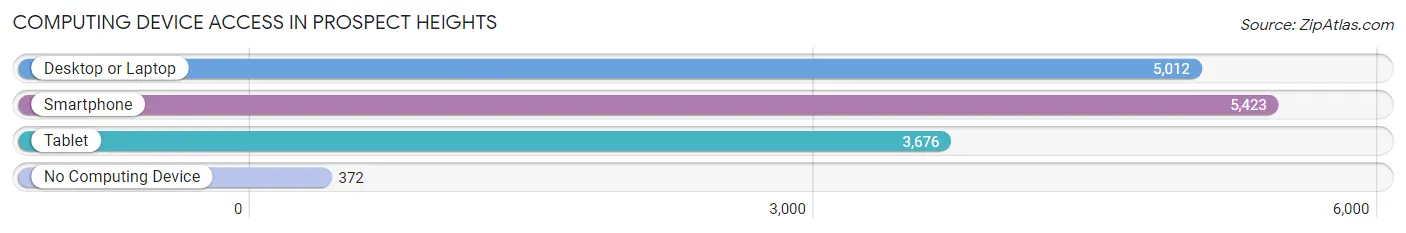
| Device Type | # Households | % Households |
| Desktop or Laptop | 5,012 | 79.7% |
| Smartphone | 5,423 | 86.3% |
| Tablet | 3,676 | 58.5% |
| No Computing Device | 372 | 5.9% |
| Total | 6,286 | 100.0% |
Internet Access in Prospect Heights
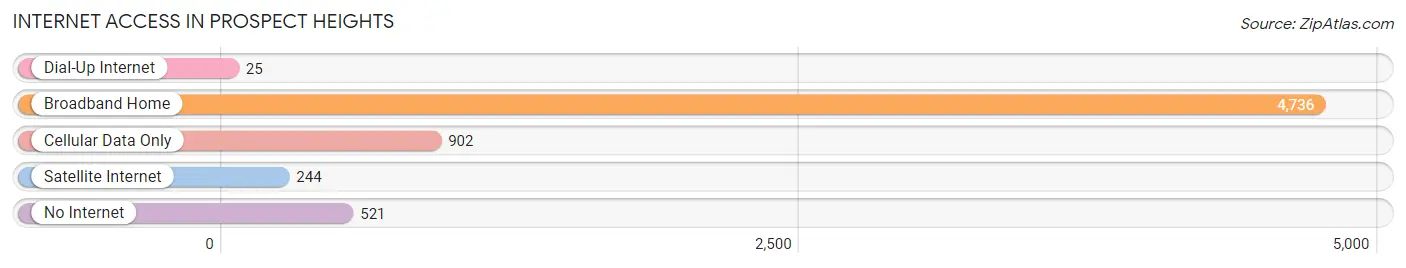
| Internet Type | # Households | % Households |
| Dial-Up Internet | 25 | 0.4% |
| Broadband Home | 4,736 | 75.3% |
| Cellular Data Only | 902 | 14.3% |
| Satellite Internet | 244 | 3.9% |
| No Internet | 521 | 8.3% |
| Total | 6,286 | 100.0% |
Prospect Heights Summary
Prospect Heights is a city located in Cook County, Illinois, United States. It is a suburb of Chicago, located about 25 miles northwest of the city. As of the 2010 census, the city had a population of 16,256.
History
Prospect Heights was first settled in the late 19th century by German and Swedish immigrants. The area was originally known as “Prospect” and was part of the larger town of Wheeling. In 1872, the town was officially incorporated as Prospect Heights.
The city experienced rapid growth in the early 20th century, as the population increased from just over 1,000 in 1900 to over 5,000 by 1930. This growth was largely due to the construction of the Chicago and North Western Railway, which ran through the city.
In the 1950s, Prospect Heights began to experience a decline in population as many of its residents moved to the suburbs. This trend continued until the late 1980s, when the city began to experience a resurgence in population growth.
Geography
Prospect Heights is located in northeastern Illinois, about 25 miles northwest of Chicago. It is bordered by the cities of Wheeling to the north, Arlington Heights to the east, Mount Prospect to the south, and Des Plaines to the west.
The city covers an area of 4.2 square miles, with a population density of 3,845 people per square mile. The terrain is mostly flat, with some rolling hills in the northern part of the city.
Economy
Prospect Heights is home to a variety of businesses, including retail stores, restaurants, and professional services. The city is also home to several industrial parks, which provide employment opportunities for many of its residents.
The largest employers in the city are the Prospect Heights School District, the City of Prospect Heights, and the Prospect Heights Park District. Other major employers include the Prospect Heights Public Library, the Prospect Heights Fire Department, and the Prospect Heights Police Department.
Demographics
As of the 2010 census, the population of Prospect Heights was 16,256. The racial makeup of the city was 79.2% White, 8.2% African American, 0.3% Native American, 5.7% Asian, and 4.3% from other races. Hispanic or Latino of any race were 11.2% of the population.
The median household income in Prospect Heights was $63,945, and the median family income was $76,945. The per capita income was $30,945. About 4.3% of families and 5.7% of the population were below the poverty line.
The city is served by the Prospect Heights School District, which includes two elementary schools, one middle school, and one high school. The city is also home to several private schools, including St. Alphonsus Catholic School and Prospect Heights Christian Academy.
Common Questions
What is Per Capita Income in Prospect Heights?
Per Capita income in Prospect Heights is $45,909.
What is the Median Family Income in Prospect Heights?
Median Family Income in Prospect Heights is $97,694.
What is the Median Household income in Prospect Heights?
Median Household Income in Prospect Heights is $84,459.
What is Income or Wage Gap in Prospect Heights?
Income or Wage Gap in Prospect Heights is 44.5%.
Women in Prospect Heights earn 55.5 cents for every dollar earned by a man.
What is Family Income Deficit in Prospect Heights?
Family Income Deficit in Prospect Heights is $12,796.
Families that are below poverty line in Prospect Heights earn $12,796 less on average than the poverty threshold level.
What is Inequality or Gini Index in Prospect Heights?
Inequality or Gini Index in Prospect Heights is 0.45.
What is the Total Population of Prospect Heights?
Total Population of Prospect Heights is 15,861.
What is the Total Male Population of Prospect Heights?
Total Male Population of Prospect Heights is 7,995.
What is the Total Female Population of Prospect Heights?
Total Female Population of Prospect Heights is 7,866.
What is the Ratio of Males per 100 Females in Prospect Heights?
There are 101.64 Males per 100 Females in Prospect Heights.
What is the Ratio of Females per 100 Males in Prospect Heights?
There are 98.39 Females per 100 Males in Prospect Heights.
What is the Median Population Age in Prospect Heights?
Median Population Age in Prospect Heights is 41.1 Years.
What is the Average Family Size in Prospect Heights
Average Family Size in Prospect Heights is 3.0 People.
What is the Average Household Size in Prospect Heights
Average Household Size in Prospect Heights is 2.5 People.
How Large is the Labor Force in Prospect Heights?
There are 8,914 People in the Labor Forcein in Prospect Heights.
What is the Percentage of People in the Labor Force in Prospect Heights?
70.2% of People are in the Labor Force in Prospect Heights.
What is the Unemployment Rate in Prospect Heights?
Unemployment Rate in Prospect Heights is 5.1%.