Belmont, MA Map & Demographics
Belmont Map
Belmont Overview
$88,841
PER CAPITA INCOME
$201,977
AVG FAMILY INCOME
$164,918
AVG HOUSEHOLD INCOME
43.6%
WAGE / INCOME GAP [ % ]
56.4¢/ $1
WAGE / INCOME GAP [ $ ]
0.48
INEQUALITY / GINI INDEX
26,997
TOTAL POPULATION
12,595
MALE POPULATION
14,402
FEMALE POPULATION
87.45
MALES / 100 FEMALES
114.35
FEMALES / 100 MALES
42.0
MEDIAN AGE
3.1
AVG FAMILY SIZE
2.6
AVG HOUSEHOLD SIZE
14,870
LABOR FORCE [ PEOPLE ]
69.1%
PERCENT IN LABOR FORCE
4.7%
UNEMPLOYMENT RATE
Belmont Zip Codes
Income in Belmont
Income Overview in Belmont
Per Capita Income in Belmont is $88,841, while median incomes of families and households are $201,977 and $164,918 respectively.
| Characteristic | Number | Measure |
| Per Capita Income | 26,997 | $88,841 |
| Median Family Income | 7,576 | $201,977 |
| Mean Family Income | 7,576 | $269,857 |
| Median Household Income | 10,431 | $164,918 |
| Mean Household Income | 10,431 | $227,993 |
| Income Deficit | 7,576 | $0 |
| Wage / Income Gap (%) | 26,997 | 43.58% |
| Wage / Income Gap ($) | 26,997 | 56.42¢ per $1 |
| Gini / Inequality Index | 26,997 | 0.48 |
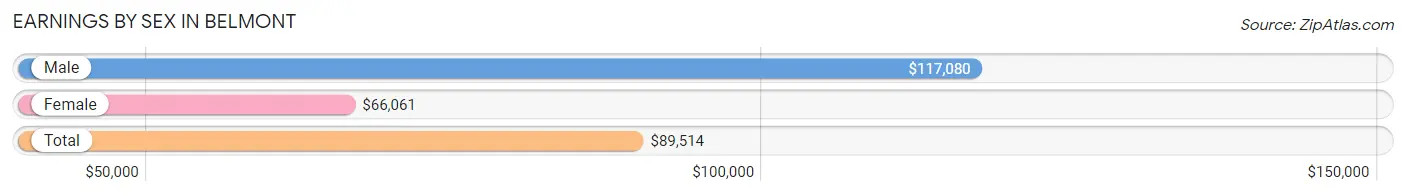
Earnings by Sex in Belmont
Average Earnings in Belmont are $89,514, $117,080 for men and $66,061 for women, a difference of 43.6%.
| Sex | Number | Average Earnings |
| Male | 7,920 (50.6%) | $117,080 |
| Female | 7,720 (49.4%) | $66,061 |
| Total | 15,640 (100.0%) | $89,514 |
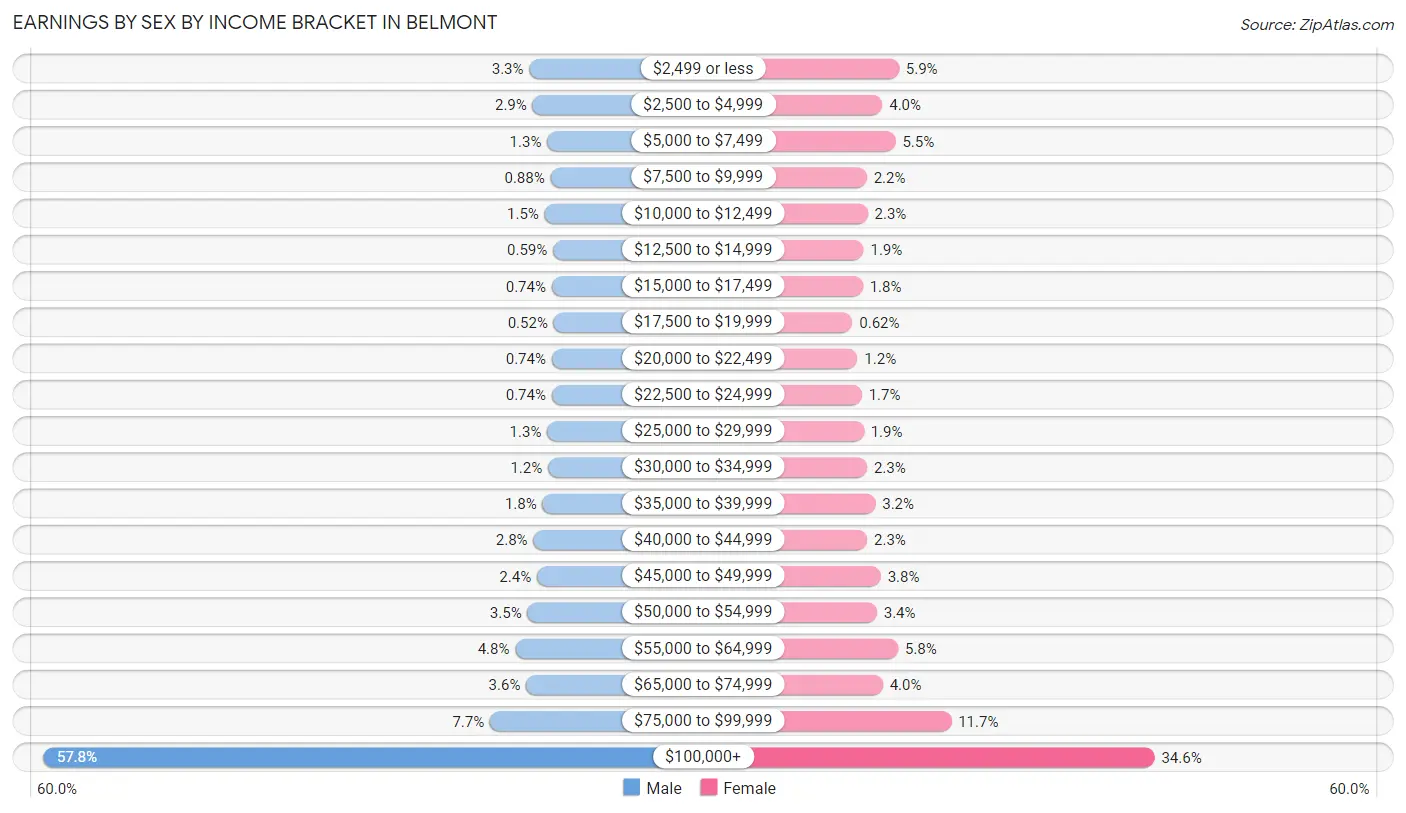
Earnings by Sex by Income Bracket in Belmont
The most common earnings brackets in Belmont are $100,000+ for men (4,581 | 57.8%) and $100,000+ for women (2,670 | 34.6%).
| Income | Male | Female |
| $2,499 or less | 258 (3.3%) | 452 (5.9%) |
| $2,500 to $4,999 | 229 (2.9%) | 308 (4.0%) |
| $5,000 to $7,499 | 99 (1.3%) | 422 (5.5%) |
| $7,500 to $9,999 | 70 (0.9%) | 173 (2.2%) |
| $10,000 to $12,499 | 122 (1.5%) | 181 (2.3%) |
| $12,500 to $14,999 | 47 (0.6%) | 145 (1.9%) |
| $15,000 to $17,499 | 59 (0.7%) | 138 (1.8%) |
| $17,500 to $19,999 | 41 (0.5%) | 48 (0.6%) |
| $20,000 to $22,499 | 59 (0.7%) | 92 (1.2%) |
| $22,500 to $24,999 | 59 (0.7%) | 130 (1.7%) |
| $25,000 to $29,999 | 99 (1.3%) | 147 (1.9%) |
| $30,000 to $34,999 | 92 (1.2%) | 175 (2.3%) |
| $35,000 to $39,999 | 141 (1.8%) | 247 (3.2%) |
| $40,000 to $44,999 | 222 (2.8%) | 176 (2.3%) |
| $45,000 to $49,999 | 190 (2.4%) | 294 (3.8%) |
| $50,000 to $54,999 | 275 (3.5%) | 260 (3.4%) |
| $55,000 to $64,999 | 383 (4.8%) | 444 (5.8%) |
| $65,000 to $74,999 | 286 (3.6%) | 312 (4.0%) |
| $75,000 to $99,999 | 608 (7.7%) | 906 (11.7%) |
| $100,000+ | 4,581 (57.8%) | 2,670 (34.6%) |
| Total | 7,920 (100.0%) | 7,720 (100.0%) |
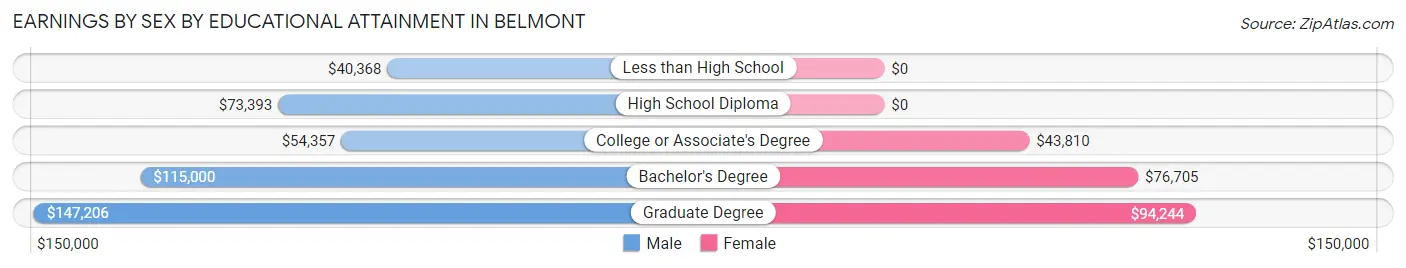
Earnings by Sex by Educational Attainment in Belmont
Average earnings in Belmont are $128,048 for men and $79,965 for women, a difference of 37.6%. Men with an educational attainment of graduate degree enjoy the highest average annual earnings of $147,206, while those with less than high school education earn the least with $40,368. Women with an educational attainment of graduate degree earn the most with the average annual earnings of $94,244, while those with college or associate's degree education have the smallest earnings of $43,810.
| Educational Attainment | Male Income | Female Income |
| Less than High School | $40,368 | $0 |
| High School Diploma | $73,393 | $0 |
| College or Associate's Degree | $54,357 | $43,810 |
| Bachelor's Degree | $115,000 | $76,705 |
| Graduate Degree | $147,206 | $94,244 |
| Total | $128,048 | $79,965 |
Family Income in Belmont
Family Income Brackets in Belmont
According to the Belmont family income data, there are 3,856 families falling into the $200,000+ income range, which is the most common income bracket and makes up 50.9% of all families. Conversely, the $25,000 to $34,999 income bracket is the least frequent group with only 8 families (0.1%) belonging to this category.
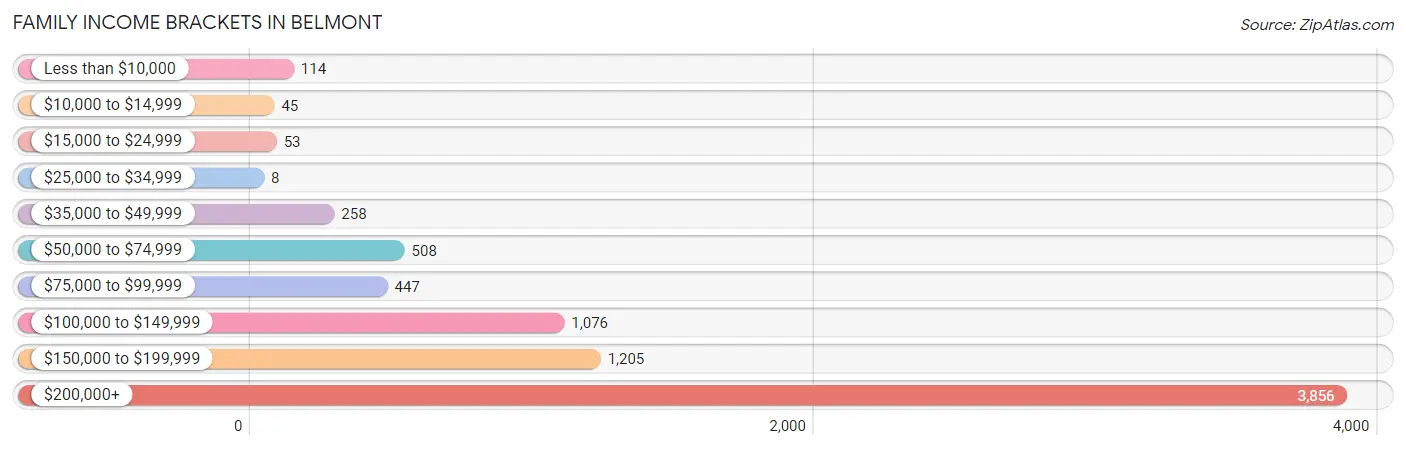
| Income Bracket | # Families | % Families |
| Less than $10,000 | 114 | 1.5% |
| $10,000 to $14,999 | 45 | 0.6% |
| $15,000 to $24,999 | 53 | 0.7% |
| $25,000 to $34,999 | 8 | 0.1% |
| $35,000 to $49,999 | 258 | 3.4% |
| $50,000 to $74,999 | 508 | 6.7% |
| $75,000 to $99,999 | 447 | 5.9% |
| $100,000 to $149,999 | 1,076 | 14.2% |
| $150,000 to $199,999 | 1,205 | 15.9% |
| $200,000+ | 3,856 | 50.9% |
Family Income by Famaliy Size in Belmont
4-person families (1,703 | 22.5%) account for the highest median family income in Belmont with $250,001 per family, while 2-person families (2,937 | 38.8%) have the highest median income of $81,674 per family member.
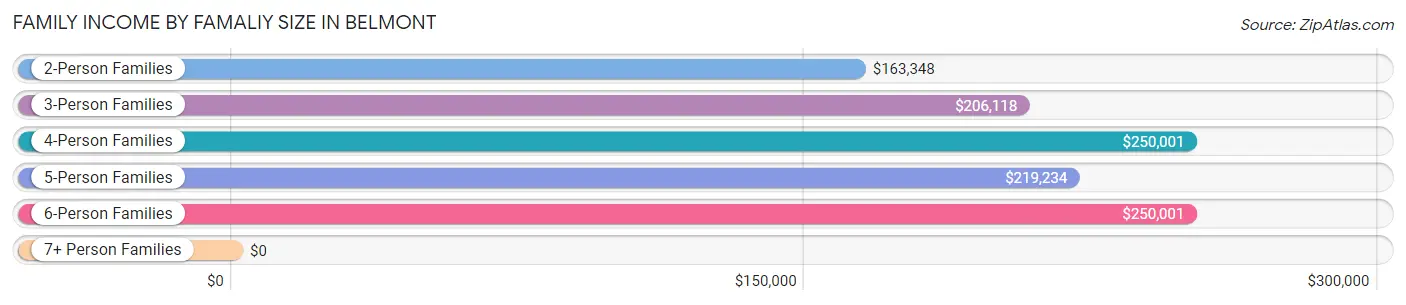
| Income Bracket | # Families | Median Income |
| 2-Person Families | 2,937 (38.8%) | $163,348 |
| 3-Person Families | 2,233 (29.5%) | $206,118 |
| 4-Person Families | 1,703 (22.5%) | $250,001 |
| 5-Person Families | 553 (7.3%) | $219,234 |
| 6-Person Families | 128 (1.7%) | $250,001 |
| 7+ Person Families | 22 (0.3%) | $0 |
| Total | 7,576 (100.0%) | $201,977 |
Family Income by Number of Earners in Belmont
The median family income in Belmont is $201,977, with families comprising 3+ earners (948) having the highest median family income of $250,001, while families with no earners (547) have the lowest median family income of $81,118, accounting for 12.5% and 7.2% of families, respectively.
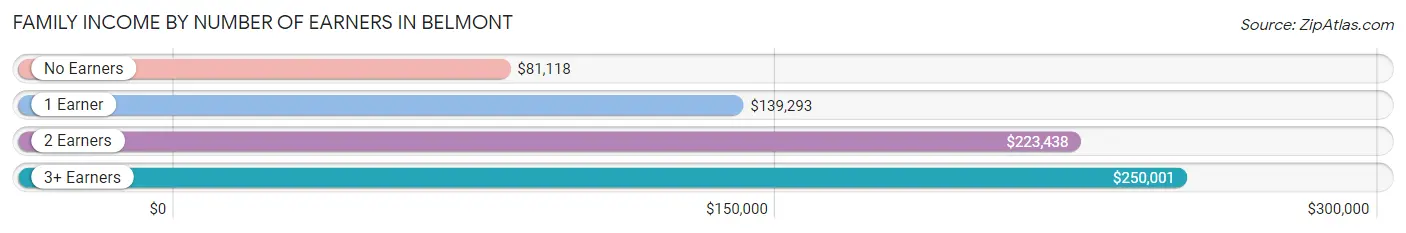
| Number of Earners | # Families | Median Income |
| No Earners | 547 (7.2%) | $81,118 |
| 1 Earner | 2,057 (27.2%) | $139,293 |
| 2 Earners | 4,024 (53.1%) | $223,438 |
| 3+ Earners | 948 (12.5%) | $250,001 |
| Total | 7,576 (100.0%) | $201,977 |
Household Income in Belmont
Household Income Brackets in Belmont
With 4,308 households falling in the category, the $200,000+ income range is the most frequent in Belmont, accounting for 41.3% of all households. In contrast, only 104 households (1.0%) fall into the $10,000 to $14,999 income bracket, making it the least populous group.
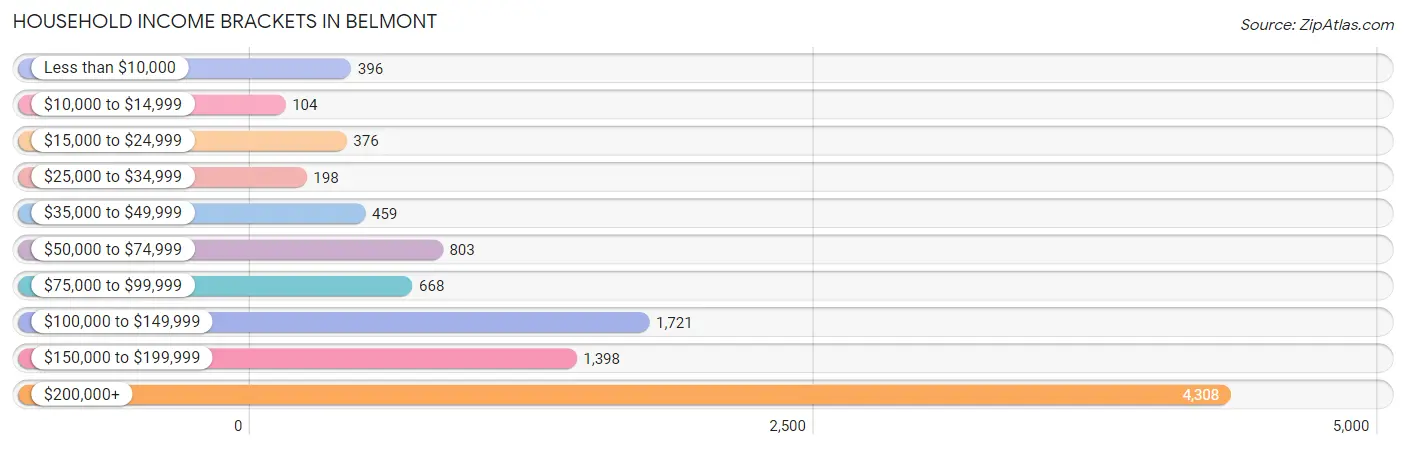
| Income Bracket | # Households | % Households |
| Less than $10,000 | 396 | 3.8% |
| $10,000 to $14,999 | 104 | 1.0% |
| $15,000 to $24,999 | 376 | 3.6% |
| $25,000 to $34,999 | 198 | 1.9% |
| $35,000 to $49,999 | 459 | 4.4% |
| $50,000 to $74,999 | 803 | 7.7% |
| $75,000 to $99,999 | 668 | 6.4% |
| $100,000 to $149,999 | 1,721 | 16.5% |
| $150,000 to $199,999 | 1,398 | 13.4% |
| $200,000+ | 4,308 | 41.3% |
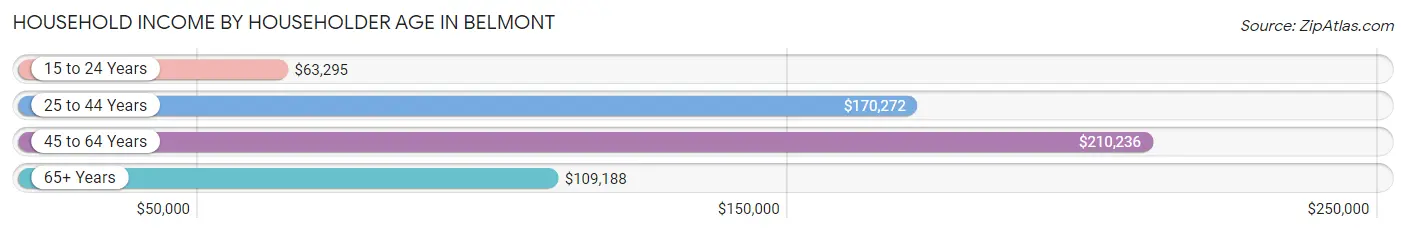
Household Income by Householder Age in Belmont
The median household income in Belmont is $164,918, with the highest median household income of $210,236 found in the 45 to 64 years age bracket for the primary householder. A total of 4,245 households (40.7%) fall into this category. Meanwhile, the 15 to 24 years age bracket for the primary householder has the lowest median household income of $63,295, with 121 households (1.2%) in this group.
| Income Bracket | # Households | Median Income |
| 15 to 24 Years | 121 (1.2%) | $63,295 |
| 25 to 44 Years | 3,298 (31.6%) | $170,272 |
| 45 to 64 Years | 4,245 (40.7%) | $210,236 |
| 65+ Years | 2,767 (26.5%) | $109,188 |
| Total | 10,431 (100.0%) | $164,918 |
Poverty in Belmont
Income Below Poverty by Sex and Age in Belmont
With 2.5% poverty level for males and 5.1% for females among the residents of Belmont, 16 and 17 year old males and 75 year old and over females are the most vulnerable to poverty, with 53 males (9.0%) and 177 females (15.8%) in their respective age groups living below the poverty level.
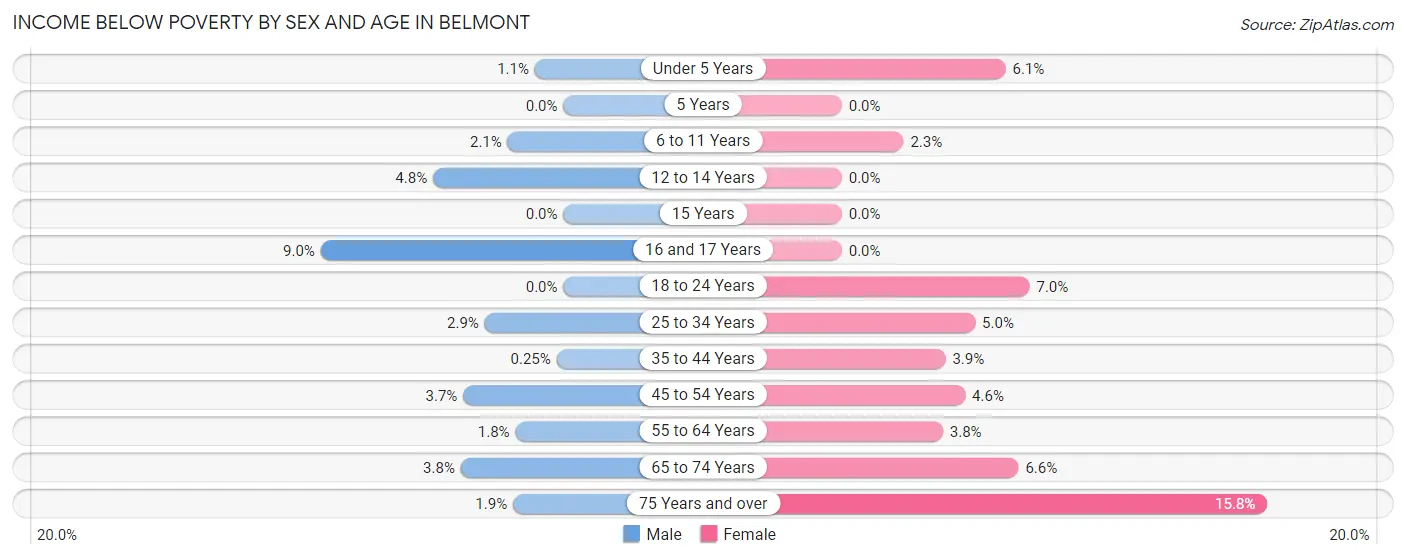
| Age Bracket | Male | Female |
| Under 5 Years | 6 (1.1%) | 50 (6.1%) |
| 5 Years | 0 (0.0%) | 0 (0.0%) |
| 6 to 11 Years | 20 (2.1%) | 31 (2.3%) |
| 12 to 14 Years | 26 (4.8%) | 0 (0.0%) |
| 15 Years | 0 (0.0%) | 0 (0.0%) |
| 16 and 17 Years | 53 (9.0%) | 0 (0.0%) |
| 18 to 24 Years | 0 (0.0%) | 63 (7.0%) |
| 25 to 34 Years | 37 (2.9%) | 65 (5.0%) |
| 35 to 44 Years | 5 (0.3%) | 83 (3.8%) |
| 45 to 54 Years | 77 (3.7%) | 87 (4.6%) |
| 55 to 64 Years | 27 (1.8%) | 74 (3.7%) |
| 65 to 74 Years | 50 (3.8%) | 95 (6.6%) |
| 75 Years and over | 14 (1.9%) | 177 (15.8%) |
| Total | 315 (2.5%) | 725 (5.1%) |
Income Above Poverty by Sex and Age in Belmont
According to the poverty statistics in Belmont, males aged 5 years and females aged 5 years are the age groups that are most secure financially, with 100.0% of males and 100.0% of females in these age groups living above the poverty line.
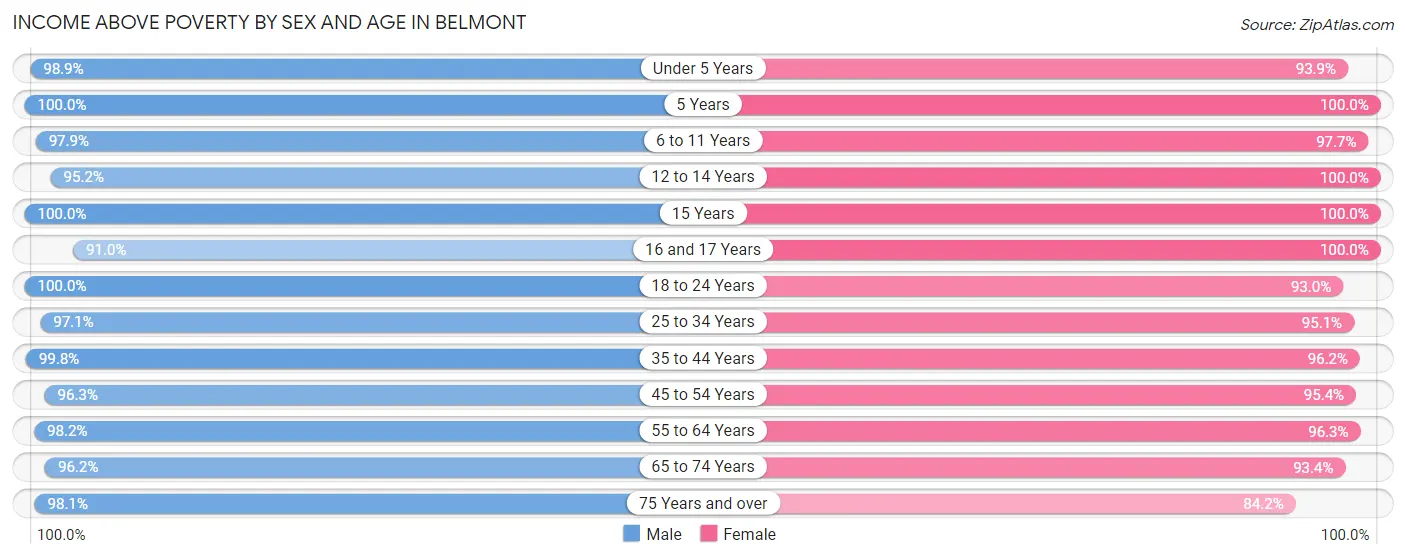
| Age Bracket | Male | Female |
| Under 5 Years | 562 (98.9%) | 772 (93.9%) |
| 5 Years | 167 (100.0%) | 157 (100.0%) |
| 6 to 11 Years | 945 (97.9%) | 1,324 (97.7%) |
| 12 to 14 Years | 511 (95.2%) | 530 (100.0%) |
| 15 Years | 226 (100.0%) | 130 (100.0%) |
| 16 and 17 Years | 535 (91.0%) | 487 (100.0%) |
| 18 to 24 Years | 571 (100.0%) | 841 (93.0%) |
| 25 to 34 Years | 1,230 (97.1%) | 1,249 (95.1%) |
| 35 to 44 Years | 1,961 (99.8%) | 2,072 (96.2%) |
| 45 to 54 Years | 1,994 (96.3%) | 1,811 (95.4%) |
| 55 to 64 Years | 1,490 (98.2%) | 1,897 (96.3%) |
| 65 to 74 Years | 1,264 (96.2%) | 1,354 (93.4%) |
| 75 Years and over | 734 (98.1%) | 944 (84.2%) |
| Total | 12,190 (97.5%) | 13,568 (94.9%) |
Income Below Poverty Among Married-Couple Families in Belmont
The poverty statistics for married-couple families in Belmont show that 1.3% or 86 of the total 6,556 families live below the poverty line. Families with no children have the highest poverty rate of 1.7%, comprising of 51 families. On the other hand, families with 3 or 4 children have the lowest poverty rate of 0.0%, which includes 0 families.
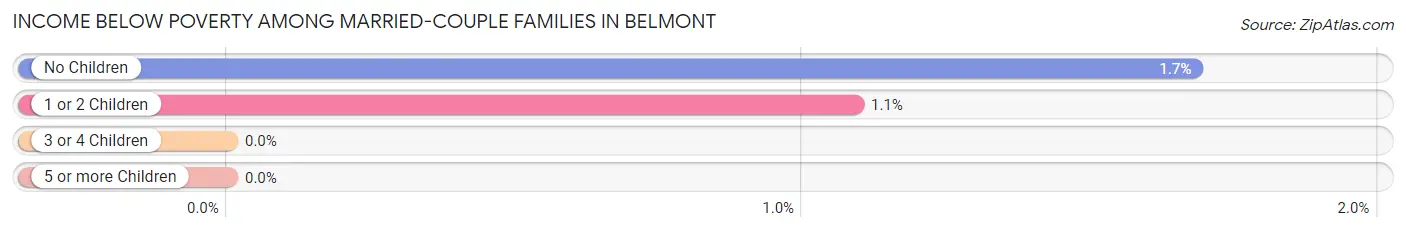
| Children | Above Poverty | Below Poverty |
| No Children | 2,980 (98.3%) | 51 (1.7%) |
| 1 or 2 Children | 3,162 (98.9%) | 35 (1.1%) |
| 3 or 4 Children | 328 (100.0%) | 0 (0.0%) |
| 5 or more Children | 0 (0.0%) | 0 (0.0%) |
| Total | 6,470 (98.7%) | 86 (1.3%) |
Income Below Poverty Among Single-Parent Households in Belmont
According to the poverty data in Belmont, 6.9% or 23 single-father households and 10.1% or 69 single-mother households are living below the poverty line. Among single-father households, those with no children have the highest poverty rate, with 23 households (13.7%) experiencing poverty. Likewise, among single-mother households, those with 1 or 2 children have the highest poverty rate, with 58 households (15.9%) falling below the poverty line.
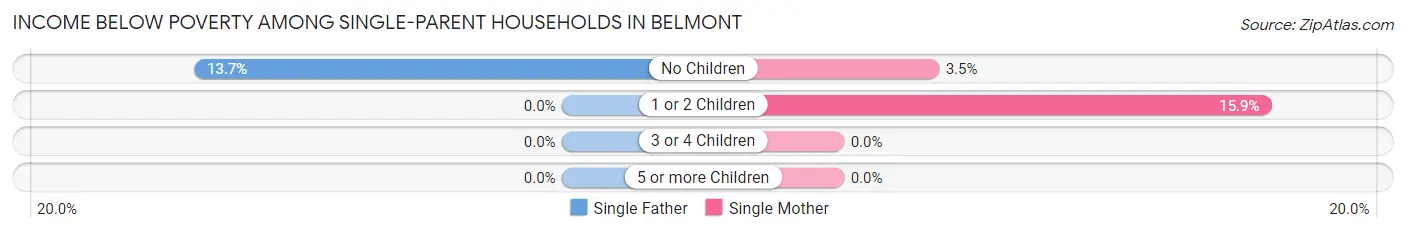
| Children | Single Father | Single Mother |
| No Children | 23 (13.7%) | 11 (3.5%) |
| 1 or 2 Children | 0 (0.0%) | 58 (15.9%) |
| 3 or 4 Children | 0 (0.0%) | 0 (0.0%) |
| 5 or more Children | 0 (0.0%) | 0 (0.0%) |
| Total | 23 (6.9%) | 69 (10.1%) |
Income Below Poverty Among Married-Couple vs Single-Parent Households in Belmont
The poverty data for Belmont shows that 86 of the married-couple family households (1.3%) and 92 of the single-parent households (9.0%) are living below the poverty level. Within the married-couple family households, those with no children have the highest poverty rate, with 51 households (1.7%) falling below the poverty line. Among the single-parent households, those with 1 or 2 children have the highest poverty rate, with 58 household (10.9%) living below poverty.
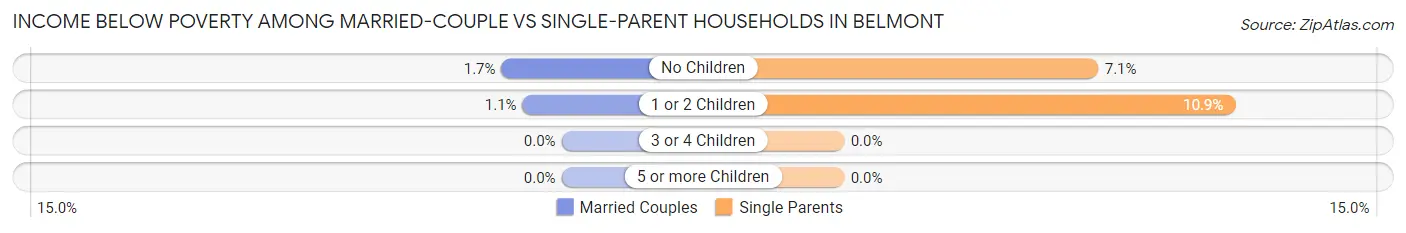
| Children | Married-Couple Families | Single-Parent Households |
| No Children | 51 (1.7%) | 34 (7.1%) |
| 1 or 2 Children | 35 (1.1%) | 58 (10.9%) |
| 3 or 4 Children | 0 (0.0%) | 0 (0.0%) |
| 5 or more Children | 0 (0.0%) | 0 (0.0%) |
| Total | 86 (1.3%) | 92 (9.0%) |
Race in Belmont
The most populous races in Belmont are White / Caucasian (19,542 | 72.4%), Asian (4,881 | 18.1%), and Two or more Races (1,751 | 6.5%).
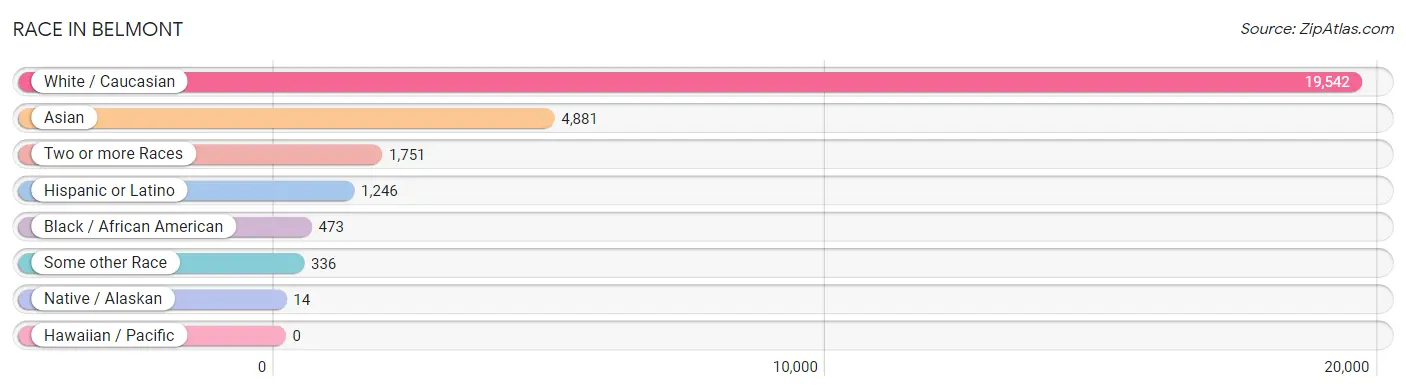
| Race | # Population | % Population |
| Asian | 4,881 | 18.1% |
| Black / African American | 473 | 1.8% |
| Hawaiian / Pacific | 0 | 0.0% |
| Hispanic or Latino | 1,246 | 4.6% |
| Native / Alaskan | 14 | 0.1% |
| White / Caucasian | 19,542 | 72.4% |
| Two or more Races | 1,751 | 6.5% |
| Some other Race | 336 | 1.2% |
| Total | 26,997 | 100.0% |
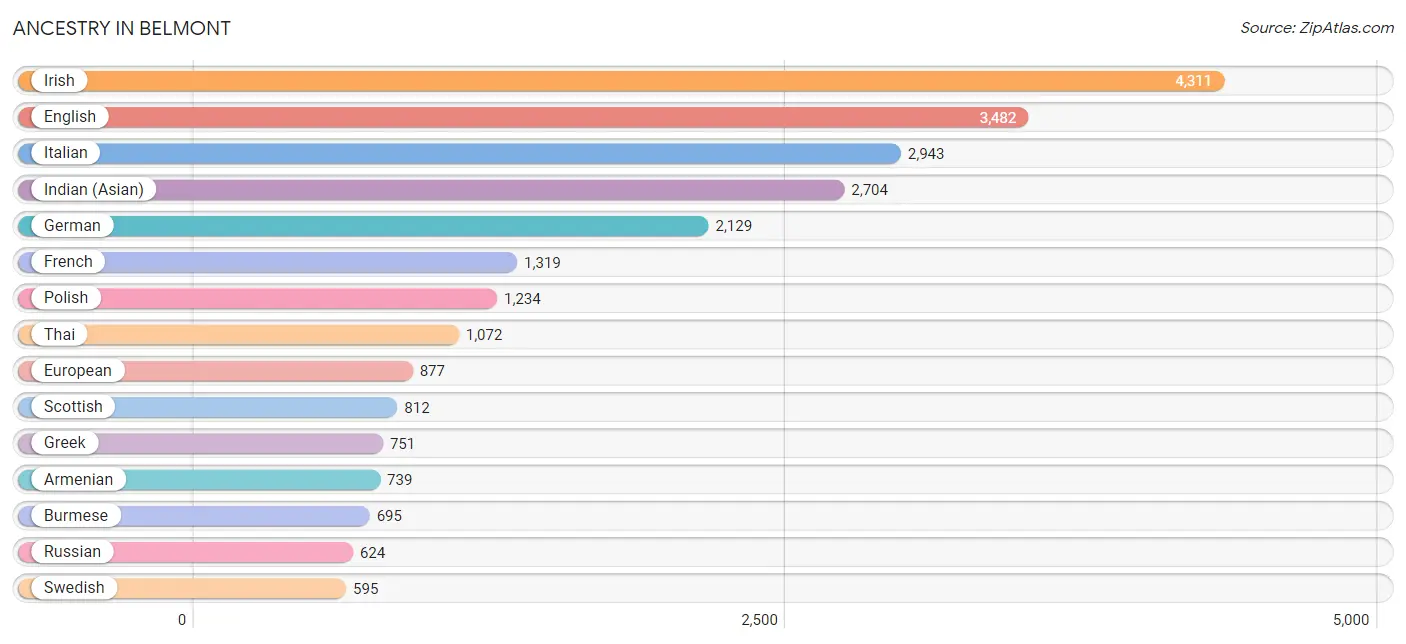
Ancestry in Belmont
The most populous ancestries reported in Belmont are Irish (4,311 | 16.0%), English (3,482 | 12.9%), Italian (2,943 | 10.9%), Indian (Asian) (2,704 | 10.0%), and German (2,129 | 7.9%), together accounting for 57.7% of all Belmont residents.
| Ancestry | # Population | % Population |
| African | 51 | 0.2% |
| Albanian | 225 | 0.8% |
| American | 434 | 1.6% |
| Arab | 419 | 1.5% |
| Argentinean | 31 | 0.1% |
| Armenian | 739 | 2.7% |
| Australian | 4 | 0.0% |
| Austrian | 107 | 0.4% |
| Basque | 21 | 0.1% |
| Belgian | 7 | 0.0% |
| Bhutanese | 356 | 1.3% |
| Brazilian | 72 | 0.3% |
| British | 284 | 1.1% |
| British West Indian | 5 | 0.0% |
| Bulgarian | 9 | 0.0% |
| Burmese | 695 | 2.6% |
| Canadian | 58 | 0.2% |
| Celtic | 5 | 0.0% |
| Central American | 227 | 0.8% |
| Central American Indian | 9 | 0.0% |
| Cherokee | 5 | 0.0% |
| Chilean | 93 | 0.3% |
| Colombian | 236 | 0.9% |
| Costa Rican | 12 | 0.0% |
| Croatian | 105 | 0.4% |
| Cuban | 26 | 0.1% |
| Cypriot | 6 | 0.0% |
| Czech | 191 | 0.7% |
| Czechoslovakian | 6 | 0.0% |
| Danish | 85 | 0.3% |
| Dominican | 11 | 0.0% |
| Dutch | 172 | 0.6% |
| Eastern European | 280 | 1.0% |
| Egyptian | 38 | 0.1% |
| English | 3,482 | 12.9% |
| Estonian | 11 | 0.0% |
| Ethiopian | 11 | 0.0% |
| European | 877 | 3.3% |
| Filipino | 133 | 0.5% |
| Finnish | 53 | 0.2% |
| French | 1,319 | 4.9% |
| French Canadian | 443 | 1.6% |
| German | 2,129 | 7.9% |
| Ghanaian | 25 | 0.1% |
| Greek | 751 | 2.8% |
| Guatemalan | 9 | 0.0% |
| Haitian | 13 | 0.1% |
| Hungarian | 253 | 0.9% |
| Icelander | 22 | 0.1% |
| Indian (Asian) | 2,704 | 10.0% |
| Iranian | 208 | 0.8% |
| Irish | 4,311 | 16.0% |
| Iroquois | 2 | 0.0% |
| Israeli | 21 | 0.1% |
| Italian | 2,943 | 10.9% |
| Jamaican | 35 | 0.1% |
| Korean | 221 | 0.8% |
| Laotian | 59 | 0.2% |
| Lebanese | 161 | 0.6% |
| Lithuanian | 251 | 0.9% |
| Luxembourger | 12 | 0.0% |
| Macedonian | 13 | 0.1% |
| Mexican | 166 | 0.6% |
| Mongolian | 74 | 0.3% |
| New Zealander | 14 | 0.1% |
| Nicaraguan | 93 | 0.3% |
| Nigerian | 13 | 0.1% |
| Northern European | 124 | 0.5% |
| Norwegian | 188 | 0.7% |
| Okinawan | 17 | 0.1% |
| Pakistani | 21 | 0.1% |
| Palestinian | 45 | 0.2% |
| Panamanian | 14 | 0.1% |
| Peruvian | 118 | 0.4% |
| Polish | 1,234 | 4.6% |
| Portuguese | 235 | 0.9% |
| Puerto Rican | 84 | 0.3% |
| Romanian | 78 | 0.3% |
| Russian | 624 | 2.3% |
| Salvadoran | 99 | 0.4% |
| Scandinavian | 121 | 0.4% |
| Scotch-Irish | 126 | 0.5% |
| Scottish | 812 | 3.0% |
| Serbian | 18 | 0.1% |
| Slavic | 8 | 0.0% |
| Slovak | 11 | 0.0% |
| Slovene | 15 | 0.1% |
| South African | 9 | 0.0% |
| South American | 504 | 1.9% |
| South American Indian | 17 | 0.1% |
| Spaniard | 142 | 0.5% |
| Spanish | 35 | 0.1% |
| Sri Lankan | 65 | 0.2% |
| Subsaharan African | 140 | 0.5% |
| Sudanese | 33 | 0.1% |
| Swedish | 595 | 2.2% |
| Swiss | 133 | 0.5% |
| Syrian | 31 | 0.1% |
| Thai | 1,072 | 4.0% |
| Turkish | 202 | 0.7% |
| Ukrainian | 157 | 0.6% |
| Uruguayan | 21 | 0.1% |
| Venezuelan | 5 | 0.0% |
| Vietnamese | 2 | 0.0% |
| Welsh | 80 | 0.3% |
| West Indian | 10 | 0.0% |
| Yugoslavian | 24 | 0.1% | View All 107 Rows |
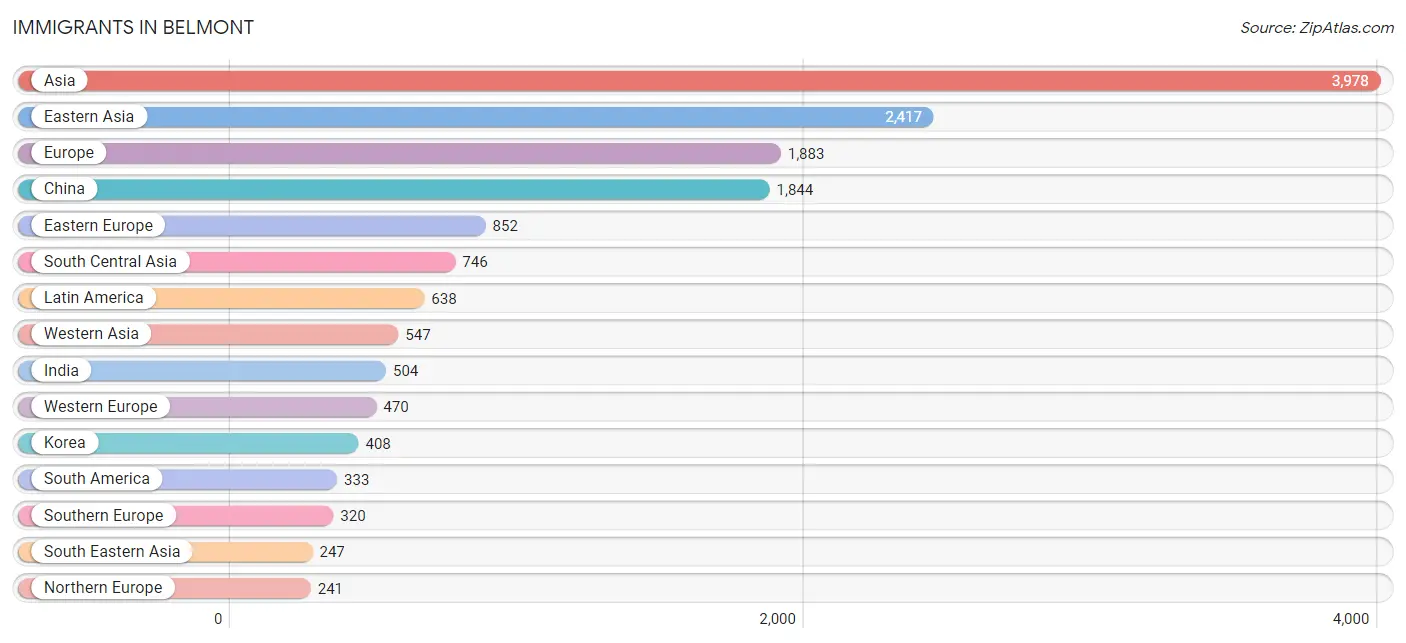
Immigrants in Belmont
The most numerous immigrant groups reported in Belmont came from Asia (3,978 | 14.7%), Eastern Asia (2,417 | 8.9%), Europe (1,883 | 7.0%), China (1,844 | 6.8%), and Eastern Europe (852 | 3.2%), together accounting for 40.6% of all Belmont residents.
| Immigration Origin | # Population | % Population |
| Africa | 201 | 0.7% |
| Albania | 201 | 0.7% |
| Armenia | 112 | 0.4% |
| Asia | 3,978 | 14.7% |
| Australia | 17 | 0.1% |
| Austria | 6 | 0.0% |
| Azores | 4 | 0.0% |
| Bangladesh | 9 | 0.0% |
| Belarus | 30 | 0.1% |
| Bosnia and Herzegovina | 32 | 0.1% |
| Brazil | 93 | 0.3% |
| Canada | 181 | 0.7% |
| Caribbean | 195 | 0.7% |
| Central America | 110 | 0.4% |
| Chile | 30 | 0.1% |
| China | 1,844 | 6.8% |
| Colombia | 92 | 0.3% |
| Croatia | 41 | 0.2% |
| Cuba | 11 | 0.0% |
| Czechoslovakia | 29 | 0.1% |
| Dominica | 20 | 0.1% |
| Eastern Africa | 76 | 0.3% |
| Eastern Asia | 2,417 | 8.9% |
| Eastern Europe | 852 | 3.2% |
| Ecuador | 5 | 0.0% |
| Egypt | 44 | 0.2% |
| El Salvador | 14 | 0.1% |
| England | 82 | 0.3% |
| Ethiopia | 12 | 0.0% |
| Europe | 1,883 | 7.0% |
| France | 182 | 0.7% |
| Germany | 158 | 0.6% |
| Ghana | 12 | 0.0% |
| Greece | 145 | 0.5% |
| Guatemala | 9 | 0.0% |
| Hong Kong | 103 | 0.4% |
| Hungary | 80 | 0.3% |
| India | 504 | 1.9% |
| Indonesia | 13 | 0.1% |
| Iran | 112 | 0.4% |
| Iraq | 26 | 0.1% |
| Ireland | 52 | 0.2% |
| Israel | 17 | 0.1% |
| Italy | 148 | 0.5% |
| Jamaica | 164 | 0.6% |
| Japan | 165 | 0.6% |
| Jordan | 28 | 0.1% |
| Korea | 408 | 1.5% |
| Latin America | 638 | 2.4% |
| Lebanon | 72 | 0.3% |
| Malaysia | 36 | 0.1% |
| Mexico | 80 | 0.3% |
| Nepal | 43 | 0.2% |
| Netherlands | 75 | 0.3% |
| Nicaragua | 7 | 0.0% |
| Northern Africa | 77 | 0.3% |
| Northern Europe | 241 | 0.9% |
| Oceania | 36 | 0.1% |
| Pakistan | 78 | 0.3% |
| Peru | 103 | 0.4% |
| Philippines | 141 | 0.5% |
| Poland | 99 | 0.4% |
| Portugal | 4 | 0.0% |
| Romania | 43 | 0.2% |
| Russia | 179 | 0.7% |
| Saudi Arabia | 6 | 0.0% |
| Senegal | 11 | 0.0% |
| Serbia | 16 | 0.1% |
| Singapore | 12 | 0.0% |
| South Africa | 13 | 0.1% |
| South America | 333 | 1.2% |
| South Central Asia | 746 | 2.8% |
| South Eastern Asia | 247 | 0.9% |
| Southern Europe | 320 | 1.2% |
| Spain | 23 | 0.1% |
| Sudan | 33 | 0.1% |
| Sweden | 11 | 0.0% |
| Switzerland | 49 | 0.2% |
| Syria | 94 | 0.4% |
| Taiwan | 129 | 0.5% |
| Thailand | 13 | 0.1% |
| Turkey | 186 | 0.7% |
| Uganda | 19 | 0.1% |
| Ukraine | 84 | 0.3% |
| Venezuela | 10 | 0.0% |
| Vietnam | 32 | 0.1% |
| Western Africa | 35 | 0.1% |
| Western Asia | 547 | 2.0% |
| Western Europe | 470 | 1.7% |
| Zimbabwe | 5 | 0.0% | View All 90 Rows |
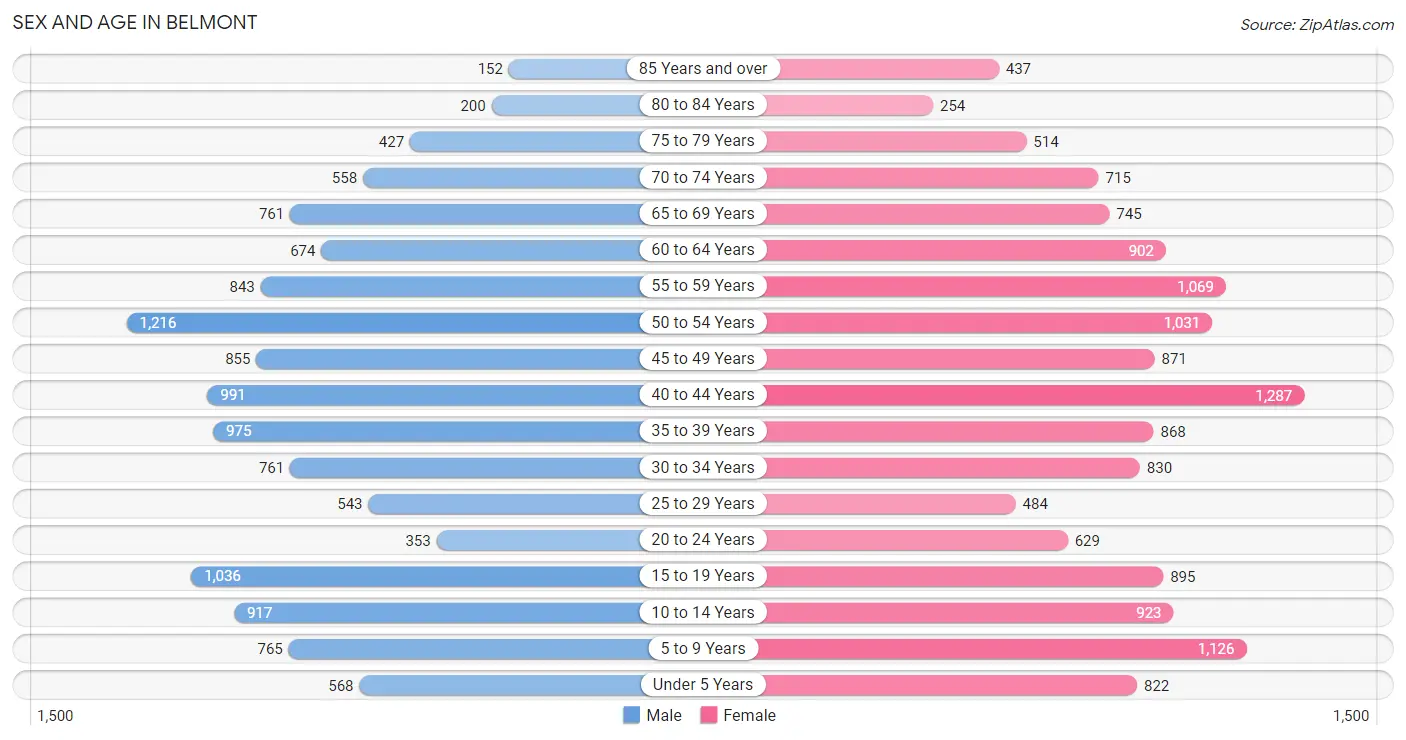
Sex and Age in Belmont
Sex and Age in Belmont
The most populous age groups in Belmont are 50 to 54 Years (1,216 | 9.7%) for men and 40 to 44 Years (1,287 | 8.9%) for women.
| Age Bracket | Male | Female |
| Under 5 Years | 568 (4.5%) | 822 (5.7%) |
| 5 to 9 Years | 765 (6.1%) | 1,126 (7.8%) |
| 10 to 14 Years | 917 (7.3%) | 923 (6.4%) |
| 15 to 19 Years | 1,036 (8.2%) | 895 (6.2%) |
| 20 to 24 Years | 353 (2.8%) | 629 (4.4%) |
| 25 to 29 Years | 543 (4.3%) | 484 (3.4%) |
| 30 to 34 Years | 761 (6.0%) | 830 (5.8%) |
| 35 to 39 Years | 975 (7.7%) | 868 (6.0%) |
| 40 to 44 Years | 991 (7.9%) | 1,287 (8.9%) |
| 45 to 49 Years | 855 (6.8%) | 871 (6.0%) |
| 50 to 54 Years | 1,216 (9.7%) | 1,031 (7.2%) |
| 55 to 59 Years | 843 (6.7%) | 1,069 (7.4%) |
| 60 to 64 Years | 674 (5.3%) | 902 (6.3%) |
| 65 to 69 Years | 761 (6.0%) | 745 (5.2%) |
| 70 to 74 Years | 558 (4.4%) | 715 (5.0%) |
| 75 to 79 Years | 427 (3.4%) | 514 (3.6%) |
| 80 to 84 Years | 200 (1.6%) | 254 (1.8%) |
| 85 Years and over | 152 (1.2%) | 437 (3.0%) |
| Total | 12,595 (100.0%) | 14,402 (100.0%) |
Families and Households in Belmont
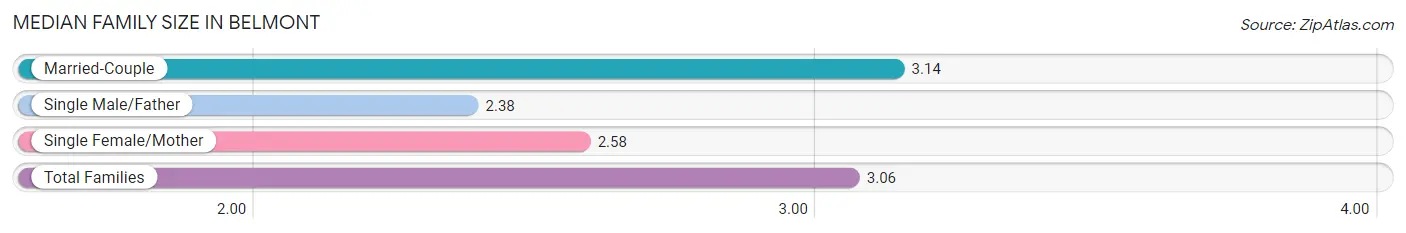
Median Family Size in Belmont
The median family size in Belmont is 3.06 persons per family, with married-couple families (6,556 | 86.5%) accounting for the largest median family size of 3.14 persons per family. On the other hand, single male/father families (334 | 4.4%) represent the smallest median family size with 2.38 persons per family.
| Family Type | # Families | Family Size |
| Married-Couple | 6,556 (86.5%) | 3.14 |
| Single Male/Father | 334 (4.4%) | 2.38 |
| Single Female/Mother | 686 (9.0%) | 2.58 |
| Total Families | 7,576 (100.0%) | 3.06 |
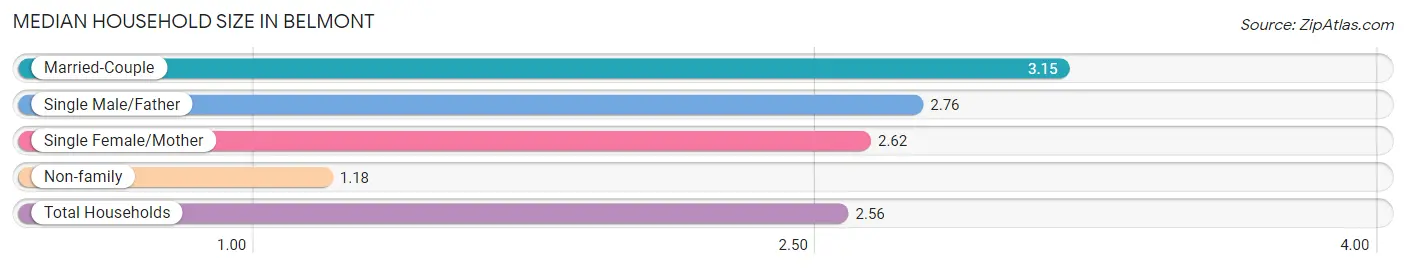
Median Household Size in Belmont
The median household size in Belmont is 2.56 persons per household, with married-couple households (6,556 | 62.8%) accounting for the largest median household size of 3.15 persons per household. non-family households (2,855 | 27.4%) represent the smallest median household size with 1.18 persons per household.
| Household Type | # Households | Household Size |
| Married-Couple | 6,556 (62.8%) | 3.15 |
| Single Male/Father | 334 (3.2%) | 2.76 |
| Single Female/Mother | 686 (6.6%) | 2.62 |
| Non-family | 2,855 (27.4%) | 1.18 |
| Total Households | 10,431 (100.0%) | 2.56 |
Household Size by Marriage Status in Belmont
Out of a total of 10,431 households in Belmont, 7,576 (72.6%) are family households, while 2,855 (27.4%) are nonfamily households. The most numerous type of family households are 2-person households, comprising 2,811, and the most common type of nonfamily households are 1-person households, comprising 2,391.
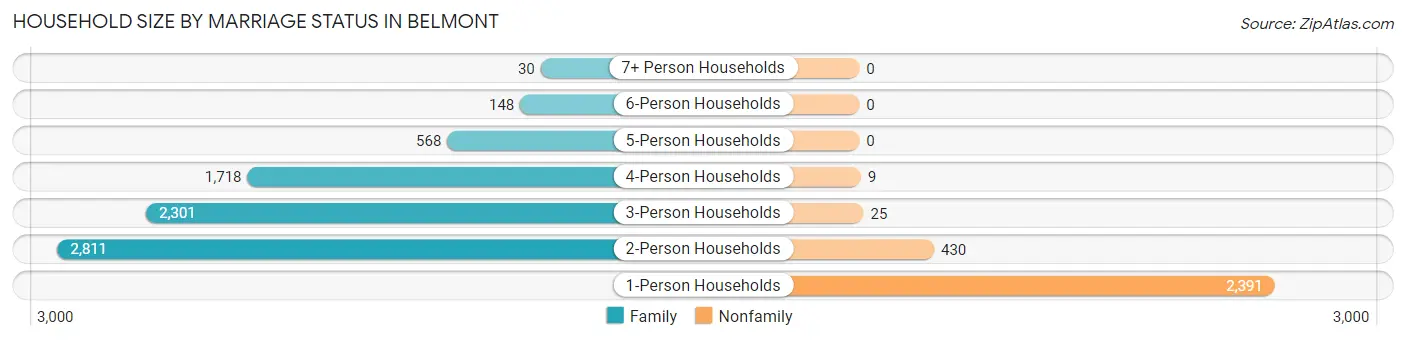
| Household Size | Family Households | Nonfamily Households |
| 1-Person Households | - | 2,391 (22.9%) |
| 2-Person Households | 2,811 (27.0%) | 430 (4.1%) |
| 3-Person Households | 2,301 (22.1%) | 25 (0.2%) |
| 4-Person Households | 1,718 (16.5%) | 9 (0.1%) |
| 5-Person Households | 568 (5.4%) | 0 (0.0%) |
| 6-Person Households | 148 (1.4%) | 0 (0.0%) |
| 7+ Person Households | 30 (0.3%) | 0 (0.0%) |
| Total | 7,576 (72.6%) | 2,855 (27.4%) |
Female Fertility in Belmont
Fertility by Age in Belmont
Average fertility rate in Belmont is 38.0 births per 1,000 women. Women in the age bracket of 20 to 34 years have the highest fertility rate with 64.0 births per 1,000 women. Women in the age bracket of 20 to 34 years acount for 53.0% of all women with births.
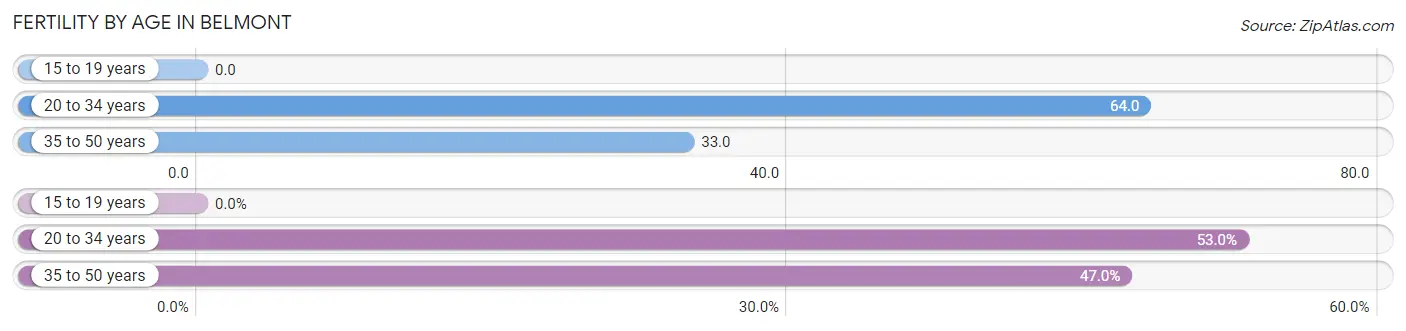
| Age Bracket | Women with Births | Births / 1,000 Women |
| 15 to 19 years | 0 (0.0%) | 0.0 |
| 20 to 34 years | 125 (53.0%) | 64.0 |
| 35 to 50 years | 111 (47.0%) | 33.0 |
| Total | 236 (100.0%) | 38.0 |
Fertility by Age by Marriage Status in Belmont
93.6% of women with births (236) in Belmont are married. The highest percentage of unmarried women with births falls into 35 to 50 years age bracket with 13.5% of them unmarried at the time of birth, while the lowest percentage of unmarried women with births belong to 20 to 34 years age bracket with 0.0% of them unmarried.
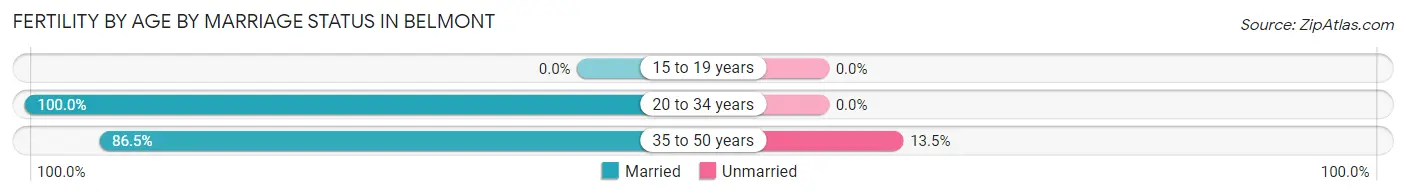
| Age Bracket | Married | Unmarried |
| 15 to 19 years | 0 (0.0%) | 0 (0.0%) |
| 20 to 34 years | 125 (100.0%) | 0 (0.0%) |
| 35 to 50 years | 96 (86.5%) | 15 (13.5%) |
| Total | 221 (93.6%) | 15 (6.4%) |
Fertility by Education in Belmont
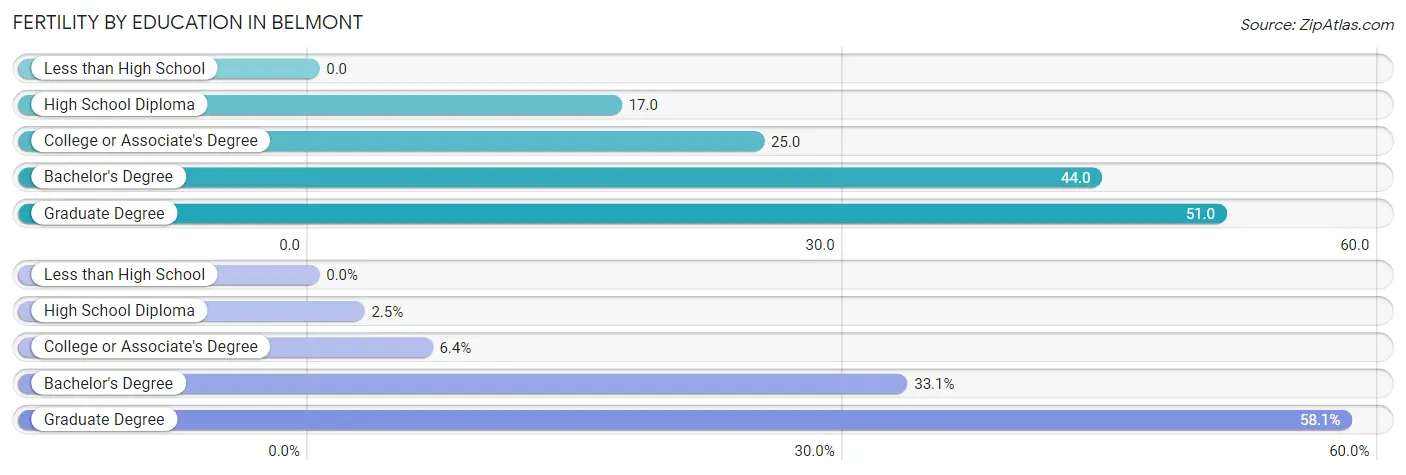
| Educational Attainment | Women with Births | Births / 1,000 Women |
| Less than High School | 0 (0.0%) | 0.0 |
| High School Diploma | 6 (2.5%) | 17.0 |
| College or Associate's Degree | 15 (6.4%) | 25.0 |
| Bachelor's Degree | 78 (33.1%) | 44.0 |
| Graduate Degree | 137 (58.1%) | 51.0 |
| Total | 236 (100.0%) | 38.0 |
Fertility by Education by Marriage Status in Belmont
6.4% of women with births in Belmont are unmarried. Women with the educational attainment of high school diploma are most likely to be married with 100.0% of them married at childbirth, while women with the educational attainment of college or associate's degree are least likely to be married with 100.0% of them unmarried at childbirth.
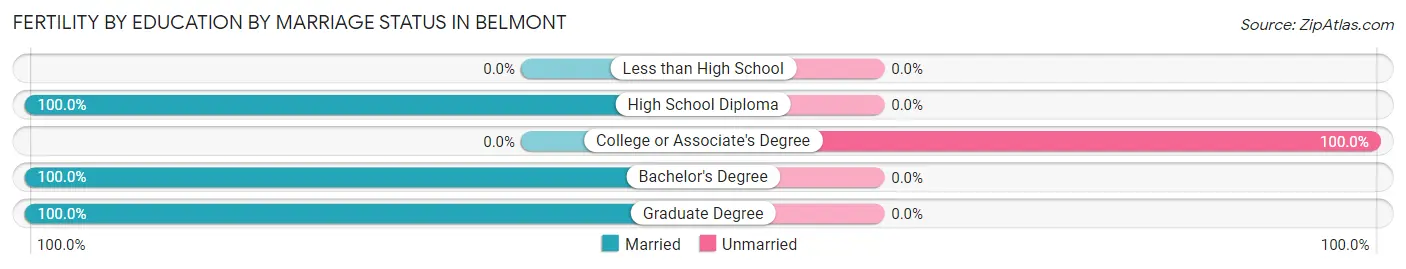
| Educational Attainment | Married | Unmarried |
| Less than High School | 0 (0.0%) | 0 (0.0%) |
| High School Diploma | 6 (100.0%) | 0 (0.0%) |
| College or Associate's Degree | 0 (0.0%) | 15 (100.0%) |
| Bachelor's Degree | 78 (100.0%) | 0 (0.0%) |
| Graduate Degree | 137 (100.0%) | 0 (0.0%) |
| Total | 221 (93.6%) | 15 (6.4%) |
Employment Characteristics in Belmont
Employment by Class of Employer in Belmont
Among the 13,919 employed individuals in Belmont, private company employees (8,485 | 61.0%), not-for-profit organizations (2,850 | 20.5%), and self-employed (not incorporated) (891 | 6.4%) make up the most common classes of employment.
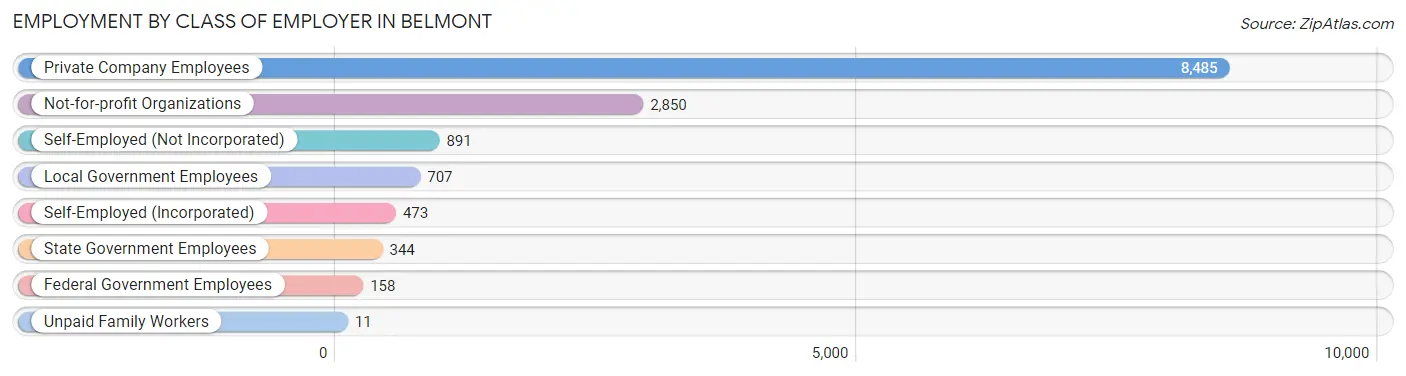
| Employer Class | # Employees | % Employees |
| Private Company Employees | 8,485 | 61.0% |
| Self-Employed (Incorporated) | 473 | 3.4% |
| Self-Employed (Not Incorporated) | 891 | 6.4% |
| Not-for-profit Organizations | 2,850 | 20.5% |
| Local Government Employees | 707 | 5.1% |
| State Government Employees | 344 | 2.5% |
| Federal Government Employees | 158 | 1.1% |
| Unpaid Family Workers | 11 | 0.1% |
| Total | 13,919 | 100.0% |
Employment Status by Age in Belmont
According to the labor force statistics for Belmont, out of the total population over 16 years of age (21,520), 69.1% or 14,870 individuals are in the labor force, with 4.7% or 699 of them unemployed. The age group with the highest labor force participation rate is 45 to 54 years, with 89.3% or 3,548 individuals in the labor force. Within the labor force, the 20 to 24 years age range has the highest percentage of unemployed individuals, with 25.7% or 195 of them being unemployed.
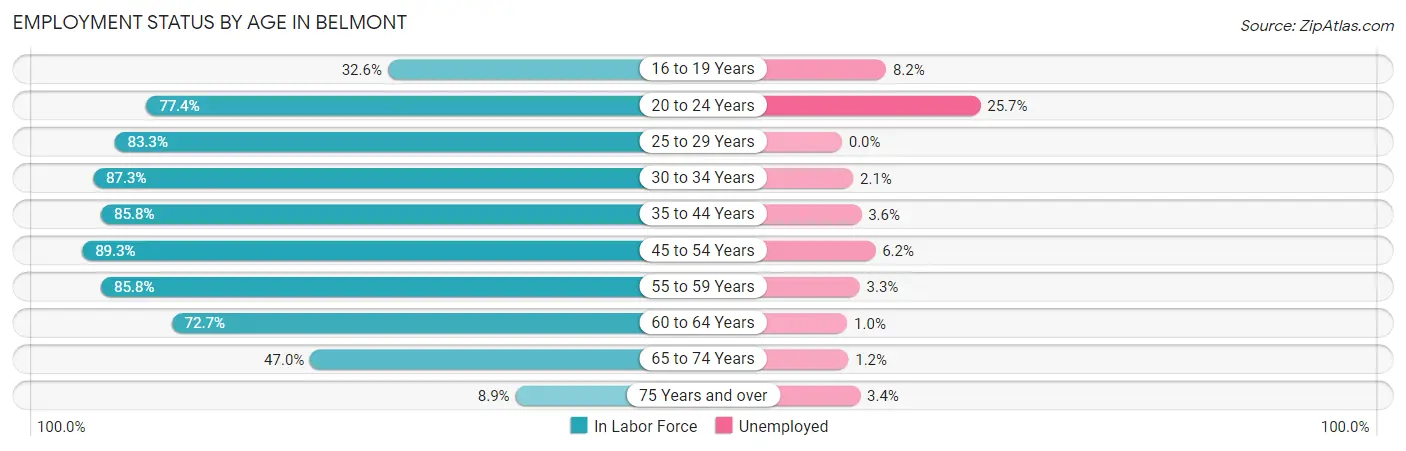
| Age Bracket | In Labor Force | Unemployed |
| 16 to 19 Years | 513 (32.6%) | 42 (8.2%) |
| 20 to 24 Years | 760 (77.4%) | 195 (25.7%) |
| 25 to 29 Years | 855 (83.3%) | 0 (0.0%) |
| 30 to 34 Years | 1,389 (87.3%) | 29 (2.1%) |
| 35 to 44 Years | 3,536 (85.8%) | 127 (3.6%) |
| 45 to 54 Years | 3,548 (89.3%) | 220 (6.2%) |
| 55 to 59 Years | 1,640 (85.8%) | 54 (3.3%) |
| 60 to 64 Years | 1,146 (72.7%) | 11 (1.0%) |
| 65 to 74 Years | 1,306 (47.0%) | 16 (1.2%) |
| 75 Years and over | 177 (8.9%) | 6 (3.4%) |
| Total | 14,870 (69.1%) | 699 (4.7%) |
Employment Status by Educational Attainment in Belmont
According to labor force statistics for Belmont, 85.3% of individuals (12,113) out of the total population between 25 and 64 years of age (14,200) are in the labor force, with 3.6% or 436 of them being unemployed. The group with the highest labor force participation rate are those with the educational attainment of bachelor's degree or higher, with 87.2% or 10,576 individuals in the labor force. Within the labor force, individuals with college / associate degree education have the highest percentage of unemployment, with 5.3% or 46 of them being unemployed.
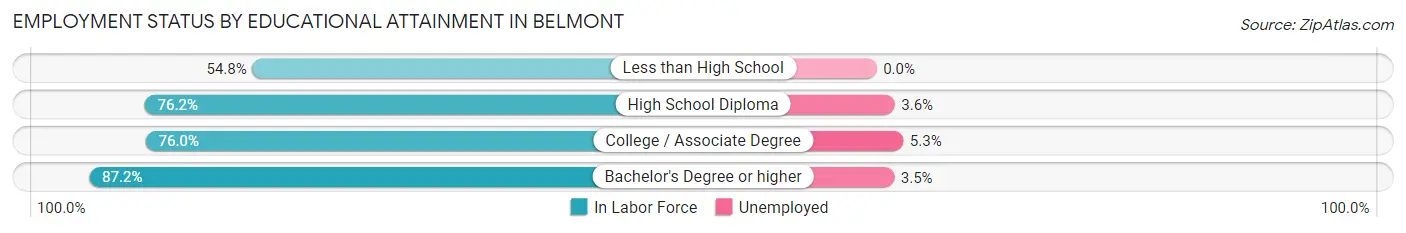
| Educational Attainment | In Labor Force | Unemployed |
| Less than High School | 86 (54.8%) | 0 (0.0%) |
| High School Diploma | 585 (76.2%) | 28 (3.6%) |
| College / Associate Degree | 871 (76.0%) | 61 (5.3%) |
| Bachelor's Degree or higher | 10,576 (87.2%) | 425 (3.5%) |
| Total | 12,113 (85.3%) | 511 (3.6%) |
Employment Occupations by Sex in Belmont
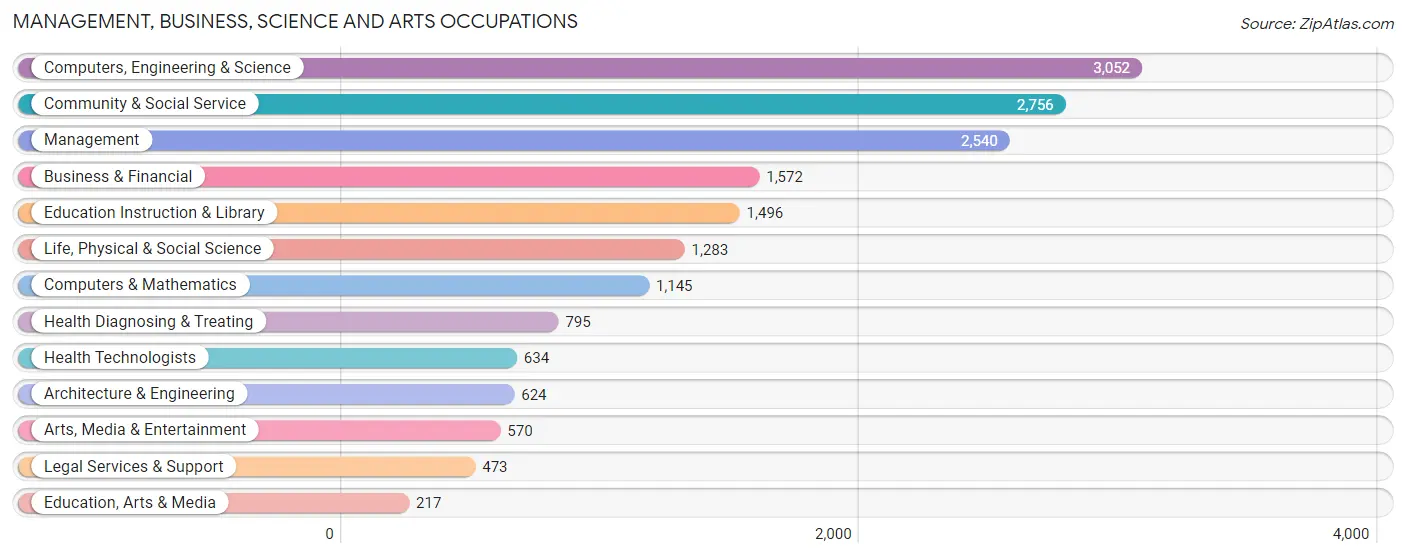
Management, Business, Science and Arts Occupations
The most common Management, Business, Science and Arts occupations in Belmont are Computers, Engineering & Science (3,052 | 21.6%), Community & Social Service (2,756 | 19.5%), Management (2,540 | 17.9%), Business & Financial (1,572 | 11.1%), and Education Instruction & Library (1,496 | 10.6%).
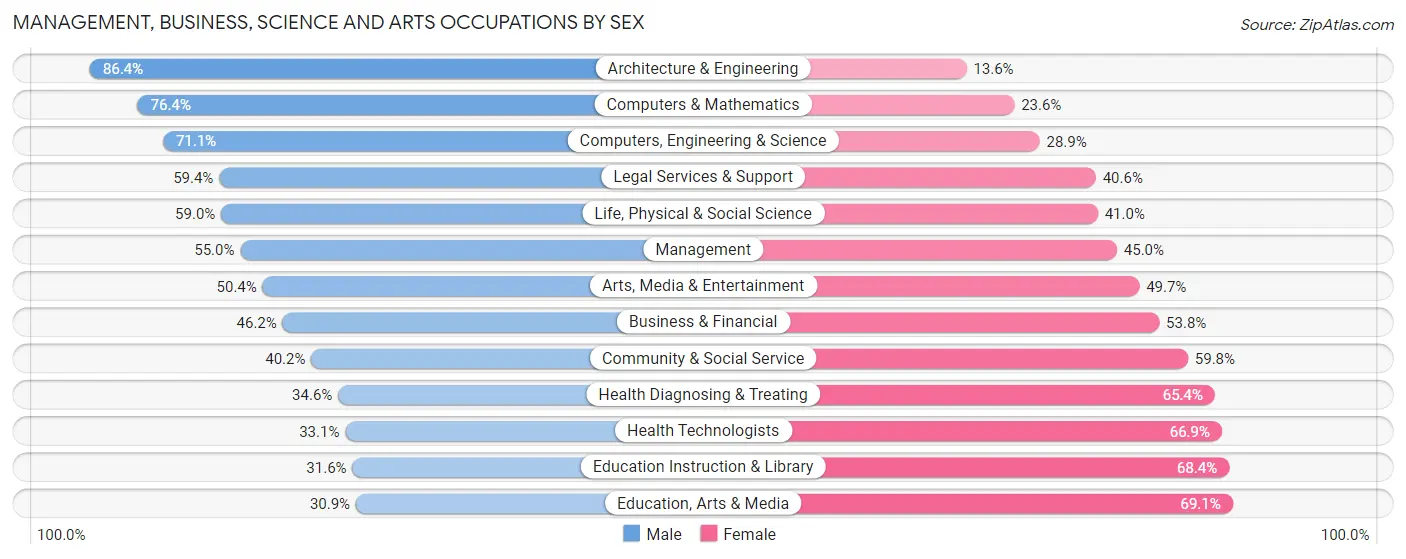
Management, Business, Science and Arts Occupations by Sex
Within the Management, Business, Science and Arts occupations in Belmont, the most male-oriented occupations are Architecture & Engineering (86.4%), Computers & Mathematics (76.4%), and Computers, Engineering & Science (71.1%), while the most female-oriented occupations are Education, Arts & Media (69.1%), Education Instruction & Library (68.4%), and Health Technologists (66.9%).
| Occupation | Male | Female |
| Management | 1,397 (55.0%) | 1,143 (45.0%) |
| Business & Financial | 726 (46.2%) | 846 (53.8%) |
| Computers, Engineering & Science | 2,171 (71.1%) | 881 (28.9%) |
| Computers & Mathematics | 875 (76.4%) | 270 (23.6%) |
| Architecture & Engineering | 539 (86.4%) | 85 (13.6%) |
| Life, Physical & Social Science | 757 (59.0%) | 526 (41.0%) |
| Community & Social Service | 1,108 (40.2%) | 1,648 (59.8%) |
| Education, Arts & Media | 67 (30.9%) | 150 (69.1%) |
| Legal Services & Support | 281 (59.4%) | 192 (40.6%) |
| Education Instruction & Library | 473 (31.6%) | 1,023 (68.4%) |
| Arts, Media & Entertainment | 287 (50.3%) | 283 (49.6%) |
| Health Diagnosing & Treating | 275 (34.6%) | 520 (65.4%) |
| Health Technologists | 210 (33.1%) | 424 (66.9%) |
| Total (Category) | 5,677 (53.0%) | 5,038 (47.0%) |
| Total (Overall) | 7,373 (52.1%) | 6,780 (47.9%) |
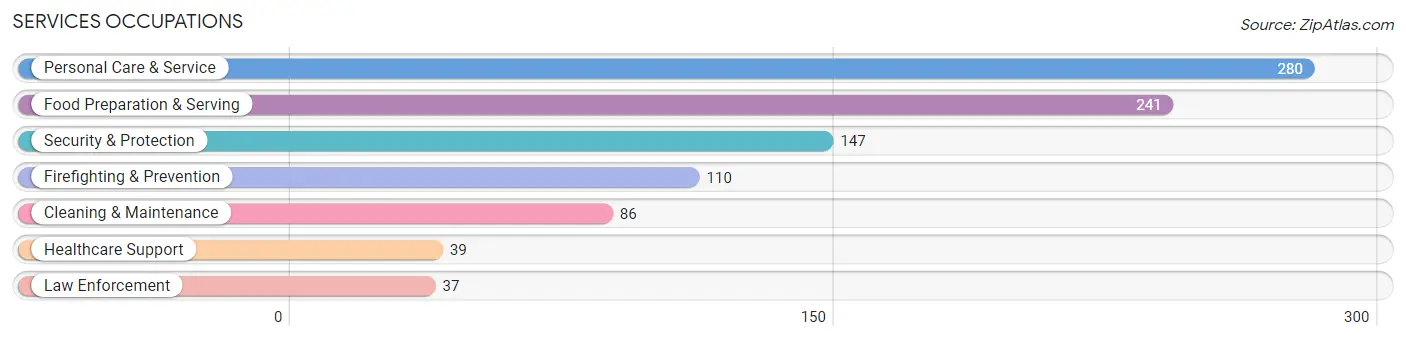
Services Occupations
The most common Services occupations in Belmont are Personal Care & Service (280 | 2.0%), Food Preparation & Serving (241 | 1.7%), Security & Protection (147 | 1.0%), Firefighting & Prevention (110 | 0.8%), and Cleaning & Maintenance (86 | 0.6%).
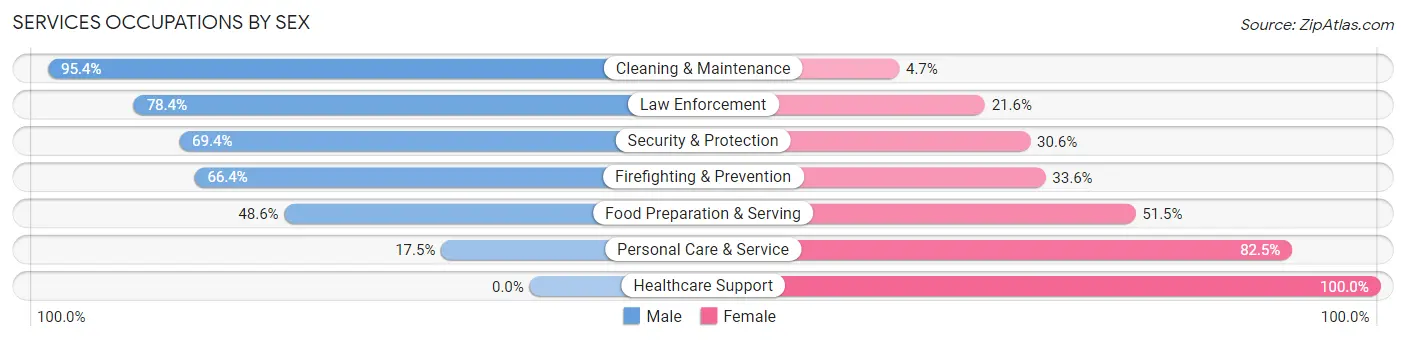
Services Occupations by Sex
Within the Services occupations in Belmont, the most male-oriented occupations are Cleaning & Maintenance (95.4%), Law Enforcement (78.4%), and Security & Protection (69.4%), while the most female-oriented occupations are Healthcare Support (100.0%), Personal Care & Service (82.5%), and Food Preparation & Serving (51.4%).
| Occupation | Male | Female |
| Healthcare Support | 0 (0.0%) | 39 (100.0%) |
| Security & Protection | 102 (69.4%) | 45 (30.6%) |
| Firefighting & Prevention | 73 (66.4%) | 37 (33.6%) |
| Law Enforcement | 29 (78.4%) | 8 (21.6%) |
| Food Preparation & Serving | 117 (48.5%) | 124 (51.4%) |
| Cleaning & Maintenance | 82 (95.4%) | 4 (4.6%) |
| Personal Care & Service | 49 (17.5%) | 231 (82.5%) |
| Total (Category) | 350 (44.1%) | 443 (55.9%) |
| Total (Overall) | 7,373 (52.1%) | 6,780 (47.9%) |
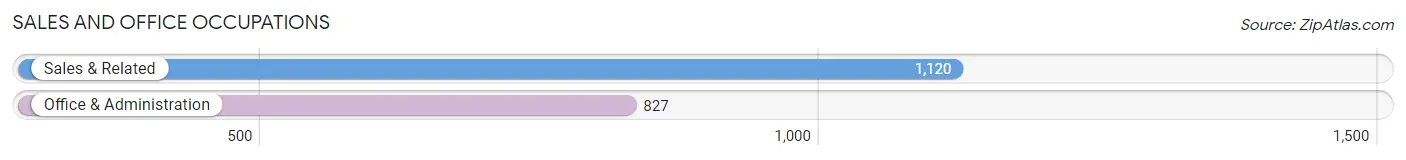
Sales and Office Occupations
The most common Sales and Office occupations in Belmont are Sales & Related (1,120 | 7.9%), and Office & Administration (827 | 5.8%).
Sales and Office Occupations by Sex
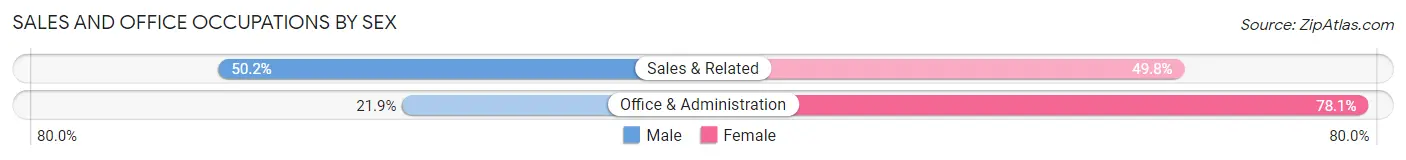
| Occupation | Male | Female |
| Sales & Related | 562 (50.2%) | 558 (49.8%) |
| Office & Administration | 181 (21.9%) | 646 (78.1%) |
| Total (Category) | 743 (38.2%) | 1,204 (61.8%) |
| Total (Overall) | 7,373 (52.1%) | 6,780 (47.9%) |
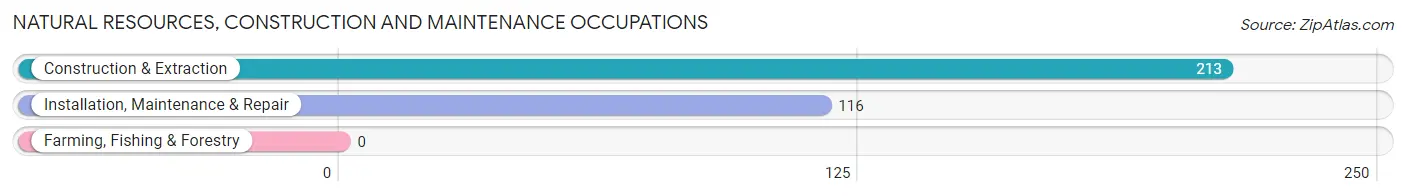
Natural Resources, Construction and Maintenance Occupations
The most common Natural Resources, Construction and Maintenance occupations in Belmont are Construction & Extraction (213 | 1.5%), and Installation, Maintenance & Repair (116 | 0.8%).
Natural Resources, Construction and Maintenance Occupations by Sex
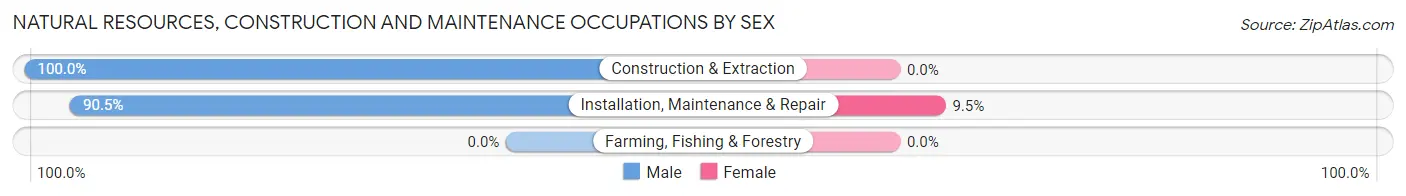
| Occupation | Male | Female |
| Farming, Fishing & Forestry | 0 (0.0%) | 0 (0.0%) |
| Construction & Extraction | 213 (100.0%) | 0 (0.0%) |
| Installation, Maintenance & Repair | 105 (90.5%) | 11 (9.5%) |
| Total (Category) | 318 (96.7%) | 11 (3.3%) |
| Total (Overall) | 7,373 (52.1%) | 6,780 (47.9%) |
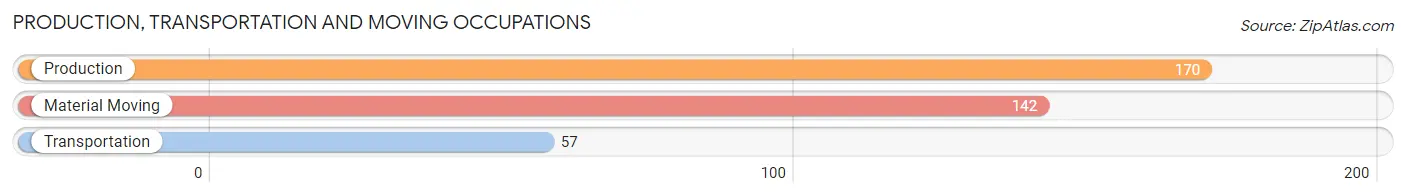
Production, Transportation and Moving Occupations
The most common Production, Transportation and Moving occupations in Belmont are Production (170 | 1.2%), Material Moving (142 | 1.0%), and Transportation (57 | 0.4%).
Production, Transportation and Moving Occupations by Sex
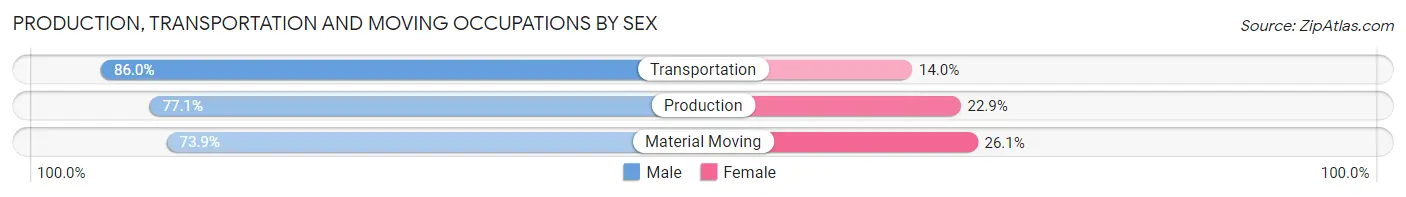
| Occupation | Male | Female |
| Production | 131 (77.1%) | 39 (22.9%) |
| Transportation | 49 (86.0%) | 8 (14.0%) |
| Material Moving | 105 (73.9%) | 37 (26.1%) |
| Total (Category) | 285 (77.2%) | 84 (22.8%) |
| Total (Overall) | 7,373 (52.1%) | 6,780 (47.9%) |
Employment Industries by Sex in Belmont
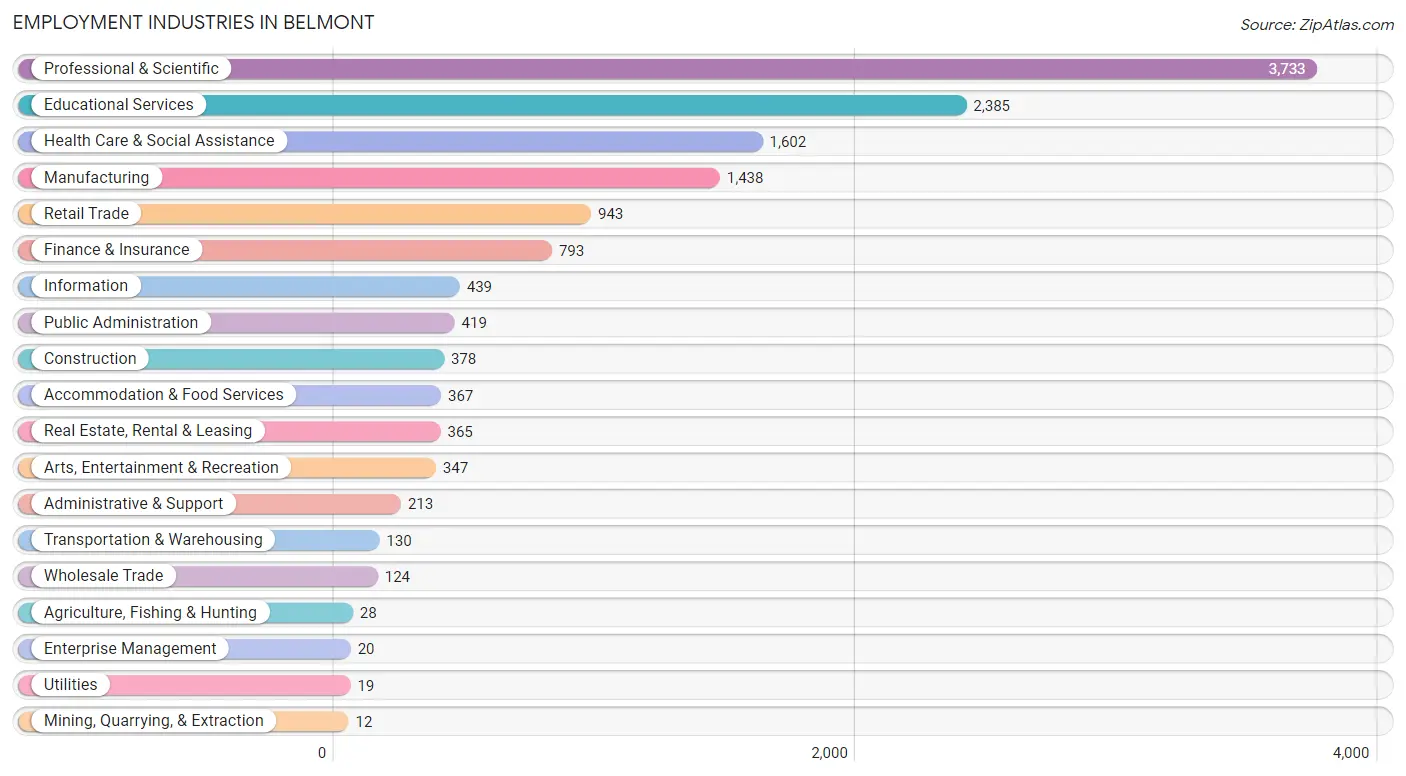
Employment Industries in Belmont
The major employment industries in Belmont include Professional & Scientific (3,733 | 26.4%), Educational Services (2,385 | 16.9%), Health Care & Social Assistance (1,602 | 11.3%), Manufacturing (1,438 | 10.2%), and Retail Trade (943 | 6.7%).
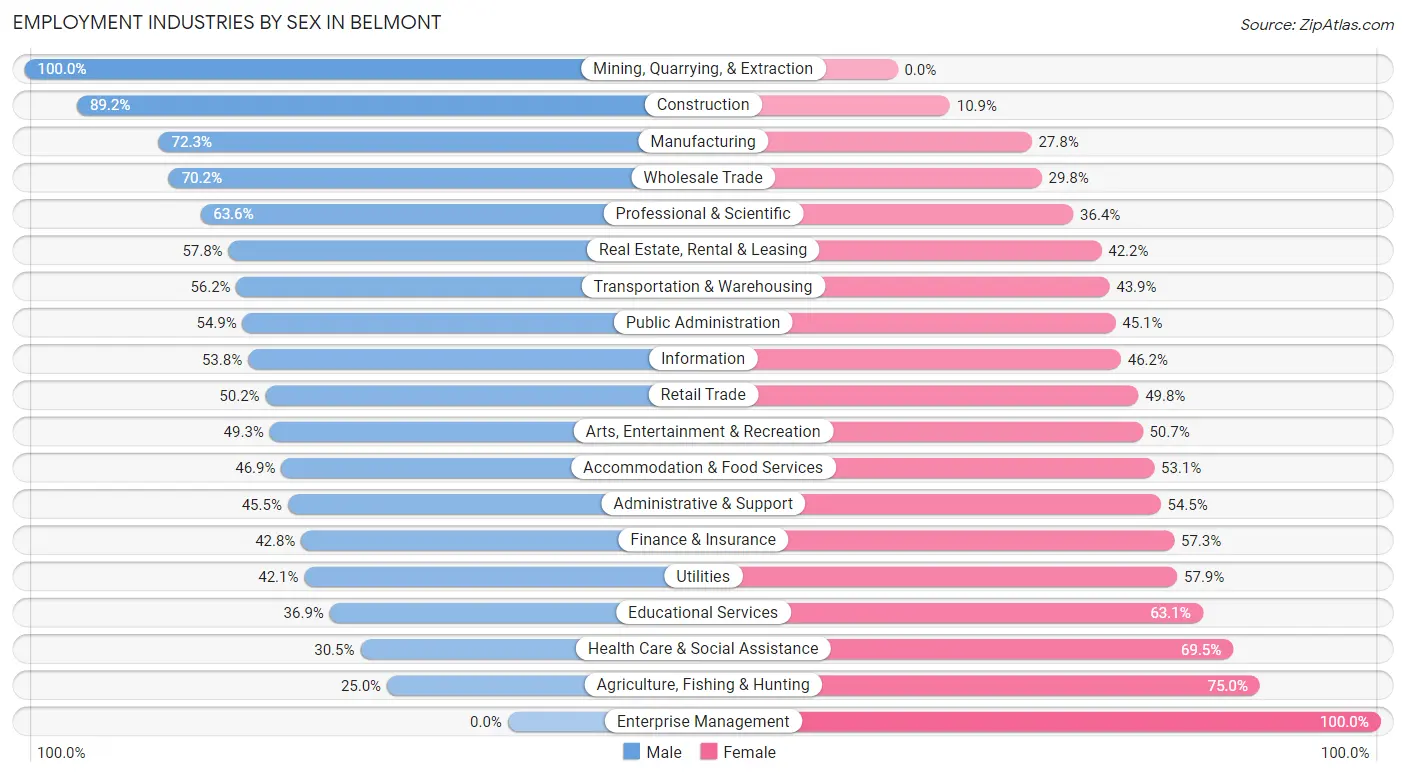
Employment Industries by Sex in Belmont
The Belmont industries that see more men than women are Mining, Quarrying, & Extraction (100.0%), Construction (89.1%), and Manufacturing (72.3%), whereas the industries that tend to have a higher number of women are Enterprise Management (100.0%), Agriculture, Fishing & Hunting (75.0%), and Health Care & Social Assistance (69.5%).
| Industry | Male | Female |
| Agriculture, Fishing & Hunting | 7 (25.0%) | 21 (75.0%) |
| Mining, Quarrying, & Extraction | 12 (100.0%) | 0 (0.0%) |
| Construction | 337 (89.1%) | 41 (10.8%) |
| Manufacturing | 1,039 (72.3%) | 399 (27.8%) |
| Wholesale Trade | 87 (70.2%) | 37 (29.8%) |
| Retail Trade | 473 (50.2%) | 470 (49.8%) |
| Transportation & Warehousing | 73 (56.1%) | 57 (43.9%) |
| Utilities | 8 (42.1%) | 11 (57.9%) |
| Information | 236 (53.8%) | 203 (46.2%) |
| Finance & Insurance | 339 (42.7%) | 454 (57.3%) |
| Real Estate, Rental & Leasing | 211 (57.8%) | 154 (42.2%) |
| Professional & Scientific | 2,375 (63.6%) | 1,358 (36.4%) |
| Enterprise Management | 0 (0.0%) | 20 (100.0%) |
| Administrative & Support | 97 (45.5%) | 116 (54.5%) |
| Educational Services | 879 (36.9%) | 1,506 (63.1%) |
| Health Care & Social Assistance | 489 (30.5%) | 1,113 (69.5%) |
| Arts, Entertainment & Recreation | 171 (49.3%) | 176 (50.7%) |
| Accommodation & Food Services | 172 (46.9%) | 195 (53.1%) |
| Public Administration | 230 (54.9%) | 189 (45.1%) |
| Total | 7,373 (52.1%) | 6,780 (47.9%) |
Education in Belmont
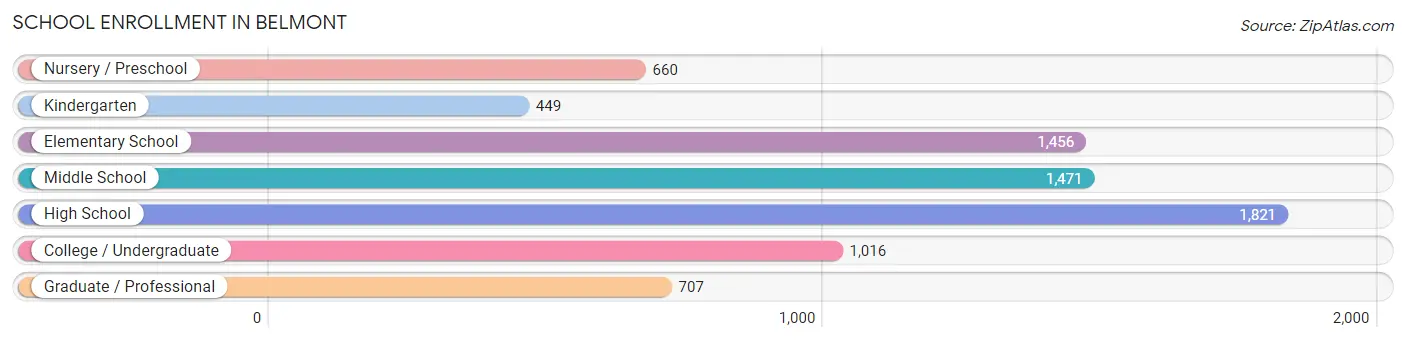
School Enrollment in Belmont
The most common levels of schooling among the 7,580 students in Belmont are high school (1,821 | 24.0%), middle school (1,471 | 19.4%), and elementary school (1,456 | 19.2%).
| School Level | # Students | % Students |
| Nursery / Preschool | 660 | 8.7% |
| Kindergarten | 449 | 5.9% |
| Elementary School | 1,456 | 19.2% |
| Middle School | 1,471 | 19.4% |
| High School | 1,821 | 24.0% |
| College / Undergraduate | 1,016 | 13.4% |
| Graduate / Professional | 707 | 9.3% |
| Total | 7,580 | 100.0% |
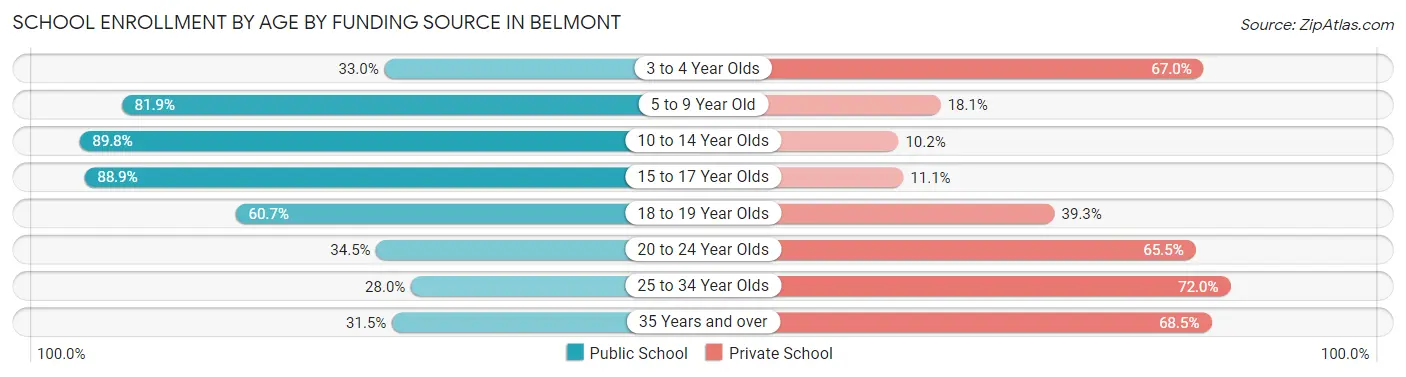
School Enrollment by Age by Funding Source in Belmont
Out of a total of 7,580 students who are enrolled in schools in Belmont, 2,229 (29.4%) attend a private institution, while the remaining 5,351 (70.6%) are enrolled in public schools. The age group of 25 to 34 year olds has the highest likelihood of being enrolled in private schools, with 324 (72.0% in the age bracket) enrolled. Conversely, the age group of 10 to 14 year olds has the lowest likelihood of being enrolled in a private school, with 1,645 (89.8% in the age bracket) attending a public institution.
| Age Bracket | Public School | Private School |
| 3 to 4 Year Olds | 177 (33.0%) | 360 (67.0%) |
| 5 to 9 Year Old | 1,510 (81.9%) | 333 (18.1%) |
| 10 to 14 Year Olds | 1,645 (89.8%) | 187 (10.2%) |
| 15 to 17 Year Olds | 1,269 (88.9%) | 159 (11.1%) |
| 18 to 19 Year Olds | 289 (60.7%) | 187 (39.3%) |
| 20 to 24 Year Olds | 202 (34.5%) | 384 (65.5%) |
| 25 to 34 Year Olds | 126 (28.0%) | 324 (72.0%) |
| 35 Years and over | 135 (31.5%) | 293 (68.5%) |
| Total | 5,351 (70.6%) | 2,229 (29.4%) |
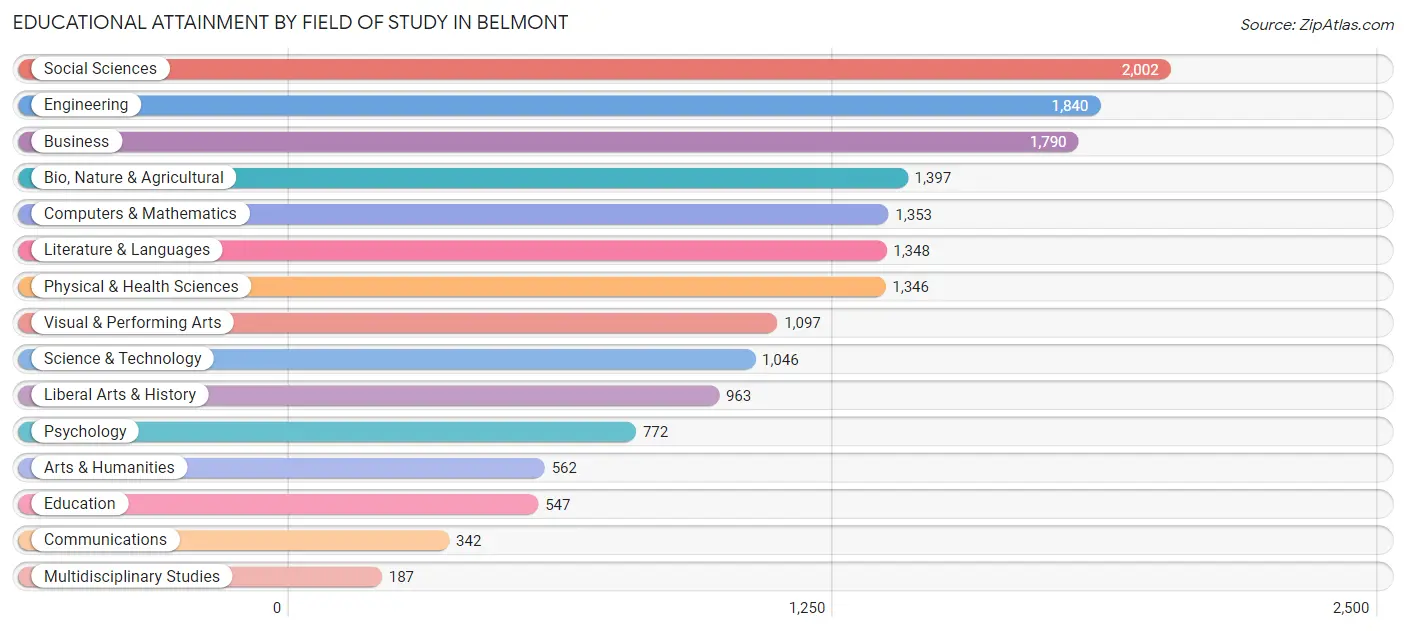
Educational Attainment by Field of Study in Belmont
Social sciences (2,002 | 12.1%), engineering (1,840 | 11.1%), business (1,790 | 10.8%), bio, nature & agricultural (1,397 | 8.4%), and computers & mathematics (1,353 | 8.2%) are the most common fields of study among 16,592 individuals in Belmont who have obtained a bachelor's degree or higher.
| Field of Study | # Graduates | % Graduates |
| Computers & Mathematics | 1,353 | 8.2% |
| Bio, Nature & Agricultural | 1,397 | 8.4% |
| Physical & Health Sciences | 1,346 | 8.1% |
| Psychology | 772 | 4.6% |
| Social Sciences | 2,002 | 12.1% |
| Engineering | 1,840 | 11.1% |
| Multidisciplinary Studies | 187 | 1.1% |
| Science & Technology | 1,046 | 6.3% |
| Business | 1,790 | 10.8% |
| Education | 547 | 3.3% |
| Literature & Languages | 1,348 | 8.1% |
| Liberal Arts & History | 963 | 5.8% |
| Visual & Performing Arts | 1,097 | 6.6% |
| Communications | 342 | 2.1% |
| Arts & Humanities | 562 | 3.4% |
| Total | 16,592 | 100.0% |
Transportation & Commute in Belmont
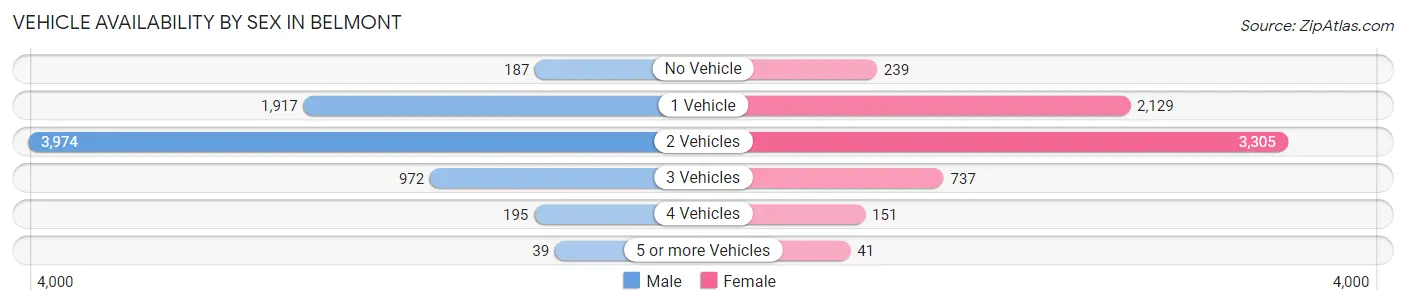
Vehicle Availability by Sex in Belmont
The most prevalent vehicle ownership categories in Belmont are males with 2 vehicles (3,974, accounting for 54.6%) and females with 2 vehicles (3,305, making up 60.2%).
| Vehicles Available | Male | Female |
| No Vehicle | 187 (2.6%) | 239 (3.6%) |
| 1 Vehicle | 1,917 (26.3%) | 2,129 (32.3%) |
| 2 Vehicles | 3,974 (54.6%) | 3,305 (50.1%) |
| 3 Vehicles | 972 (13.3%) | 737 (11.2%) |
| 4 Vehicles | 195 (2.7%) | 151 (2.3%) |
| 5 or more Vehicles | 39 (0.5%) | 41 (0.6%) |
| Total | 7,284 (100.0%) | 6,602 (100.0%) |
Commute Time in Belmont
The most frequently occuring commute durations in Belmont are 30 to 34 minutes (1,885 commuters, 18.0%), 45 to 59 minutes (1,519 commuters, 14.5%), and 20 to 24 minutes (1,382 commuters, 13.2%).
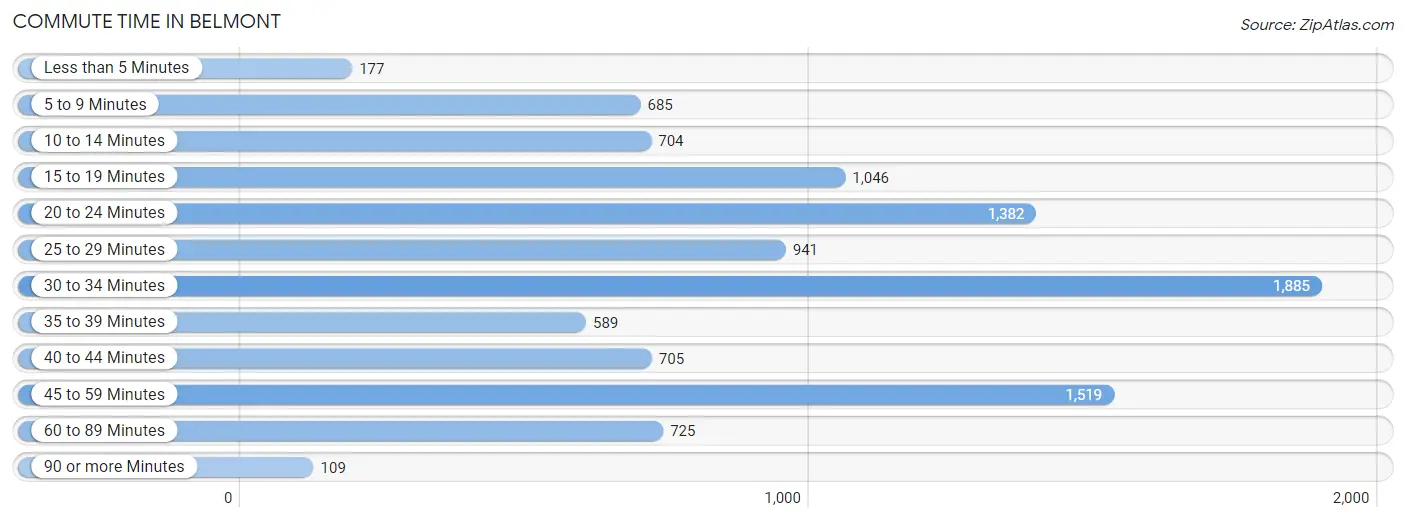
| Commute Time | # Commuters | % Commuters |
| Less than 5 Minutes | 177 | 1.7% |
| 5 to 9 Minutes | 685 | 6.5% |
| 10 to 14 Minutes | 704 | 6.7% |
| 15 to 19 Minutes | 1,046 | 10.0% |
| 20 to 24 Minutes | 1,382 | 13.2% |
| 25 to 29 Minutes | 941 | 9.0% |
| 30 to 34 Minutes | 1,885 | 18.0% |
| 35 to 39 Minutes | 589 | 5.6% |
| 40 to 44 Minutes | 705 | 6.7% |
| 45 to 59 Minutes | 1,519 | 14.5% |
| 60 to 89 Minutes | 725 | 6.9% |
| 90 or more Minutes | 109 | 1.0% |
Commute Time by Sex in Belmont
The most common commute times in Belmont are 30 to 34 minutes (1,030 commuters, 19.0%) for males and 30 to 34 minutes (855 commuters, 16.9%) for females.
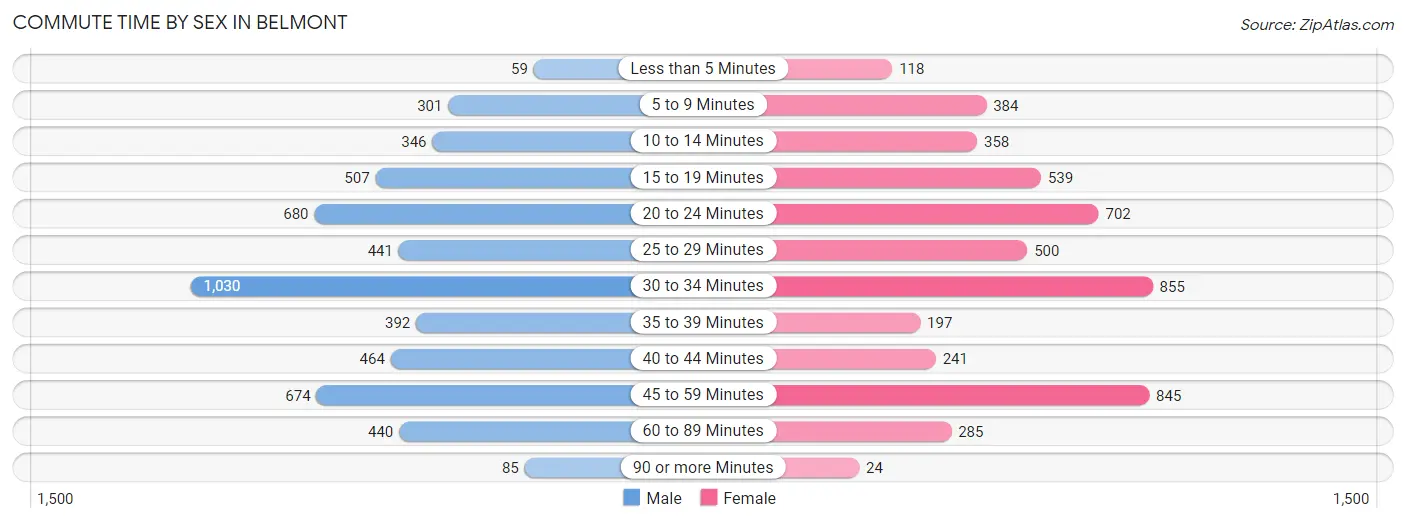
| Commute Time | Male | Female |
| Less than 5 Minutes | 59 (1.1%) | 118 (2.3%) |
| 5 to 9 Minutes | 301 (5.6%) | 384 (7.6%) |
| 10 to 14 Minutes | 346 (6.4%) | 358 (7.1%) |
| 15 to 19 Minutes | 507 (9.4%) | 539 (10.7%) |
| 20 to 24 Minutes | 680 (12.6%) | 702 (13.9%) |
| 25 to 29 Minutes | 441 (8.1%) | 500 (9.9%) |
| 30 to 34 Minutes | 1,030 (19.0%) | 855 (16.9%) |
| 35 to 39 Minutes | 392 (7.2%) | 197 (3.9%) |
| 40 to 44 Minutes | 464 (8.6%) | 241 (4.8%) |
| 45 to 59 Minutes | 674 (12.4%) | 845 (16.7%) |
| 60 to 89 Minutes | 440 (8.1%) | 285 (5.7%) |
| 90 or more Minutes | 85 (1.6%) | 24 (0.5%) |
Time of Departure to Work by Sex in Belmont
The most frequent times of departure to work in Belmont are 7:30 AM to 7:59 AM (979, 18.1%) for males and 7:00 AM to 7:29 AM (1,002, 19.9%) for females.
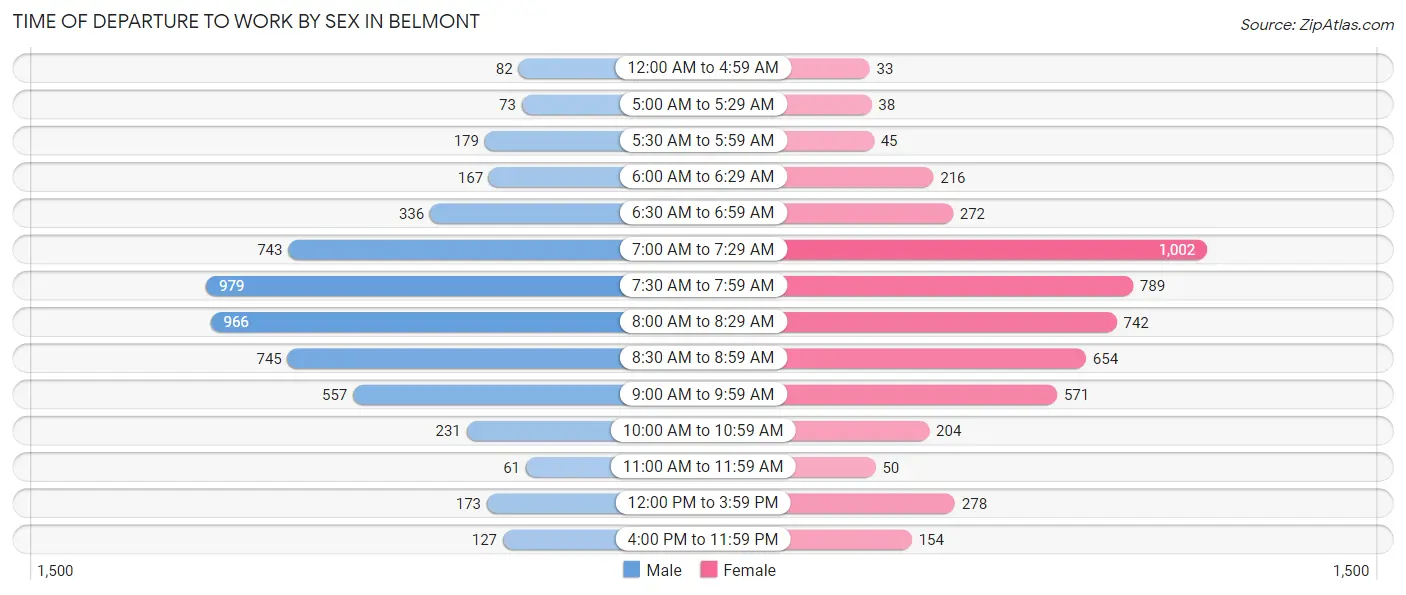
| Time of Departure | Male | Female |
| 12:00 AM to 4:59 AM | 82 (1.5%) | 33 (0.6%) |
| 5:00 AM to 5:29 AM | 73 (1.3%) | 38 (0.7%) |
| 5:30 AM to 5:59 AM | 179 (3.3%) | 45 (0.9%) |
| 6:00 AM to 6:29 AM | 167 (3.1%) | 216 (4.3%) |
| 6:30 AM to 6:59 AM | 336 (6.2%) | 272 (5.4%) |
| 7:00 AM to 7:29 AM | 743 (13.7%) | 1,002 (19.9%) |
| 7:30 AM to 7:59 AM | 979 (18.1%) | 789 (15.6%) |
| 8:00 AM to 8:29 AM | 966 (17.8%) | 742 (14.7%) |
| 8:30 AM to 8:59 AM | 745 (13.8%) | 654 (13.0%) |
| 9:00 AM to 9:59 AM | 557 (10.3%) | 571 (11.3%) |
| 10:00 AM to 10:59 AM | 231 (4.3%) | 204 (4.0%) |
| 11:00 AM to 11:59 AM | 61 (1.1%) | 50 (1.0%) |
| 12:00 PM to 3:59 PM | 173 (3.2%) | 278 (5.5%) |
| 4:00 PM to 11:59 PM | 127 (2.3%) | 154 (3.0%) |
| Total | 5,419 (100.0%) | 5,048 (100.0%) |
Housing Occupancy in Belmont
Occupancy by Ownership in Belmont
Of the total 10,431 dwellings in Belmont, owner-occupied units account for 6,623 (63.5%), while renter-occupied units make up 3,808 (36.5%).
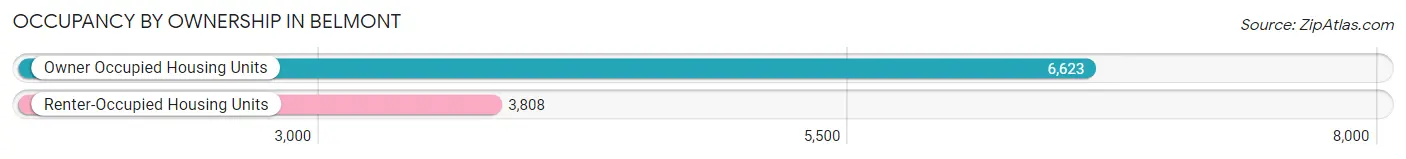
| Occupancy | # Housing Units | % Housing Units |
| Owner Occupied Housing Units | 6,623 | 63.5% |
| Renter-Occupied Housing Units | 3,808 | 36.5% |
| Total Occupied Housing Units | 10,431 | 100.0% |
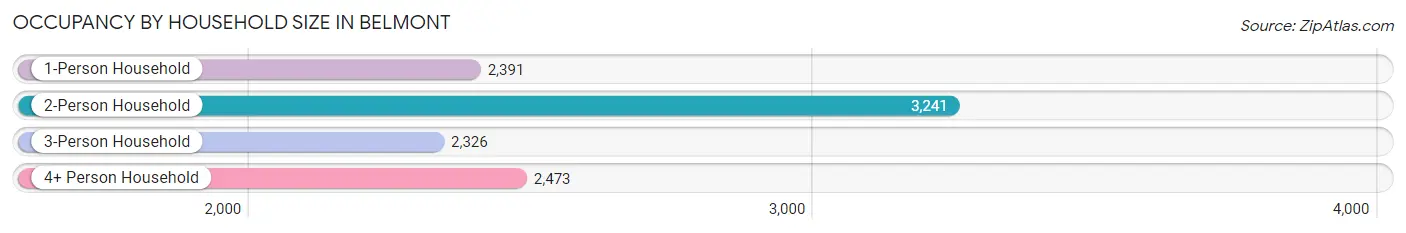
Occupancy by Household Size in Belmont
| Household Size | # Housing Units | % Housing Units |
| 1-Person Household | 2,391 | 22.9% |
| 2-Person Household | 3,241 | 31.1% |
| 3-Person Household | 2,326 | 22.3% |
| 4+ Person Household | 2,473 | 23.7% |
| Total Housing Units | 10,431 | 100.0% |
Occupancy by Ownership by Household Size in Belmont
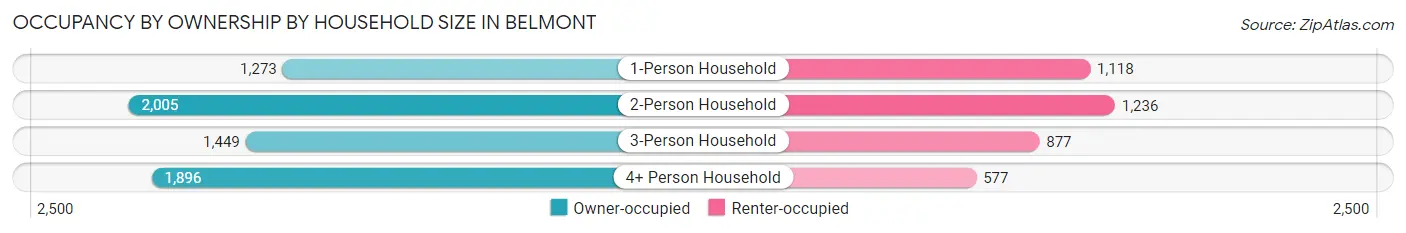
| Household Size | Owner-occupied | Renter-occupied |
| 1-Person Household | 1,273 (53.2%) | 1,118 (46.8%) |
| 2-Person Household | 2,005 (61.9%) | 1,236 (38.1%) |
| 3-Person Household | 1,449 (62.3%) | 877 (37.7%) |
| 4+ Person Household | 1,896 (76.7%) | 577 (23.3%) |
| Total Housing Units | 6,623 (63.5%) | 3,808 (36.5%) |
Occupancy by Educational Attainment in Belmont
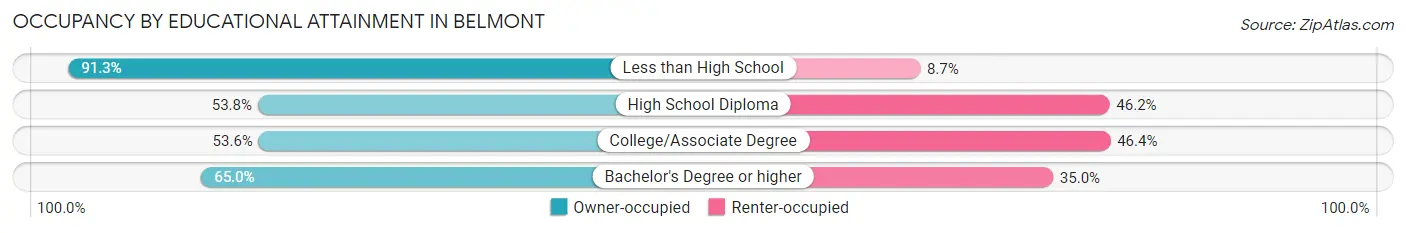
| Household Size | Owner-occupied | Renter-occupied |
| Less than High School | 200 (91.3%) | 19 (8.7%) |
| High School Diploma | 429 (53.8%) | 369 (46.2%) |
| College/Associate Degree | 574 (53.6%) | 497 (46.4%) |
| Bachelor's Degree or higher | 5,420 (65.0%) | 2,923 (35.0%) |
Occupancy by Age of Householder in Belmont
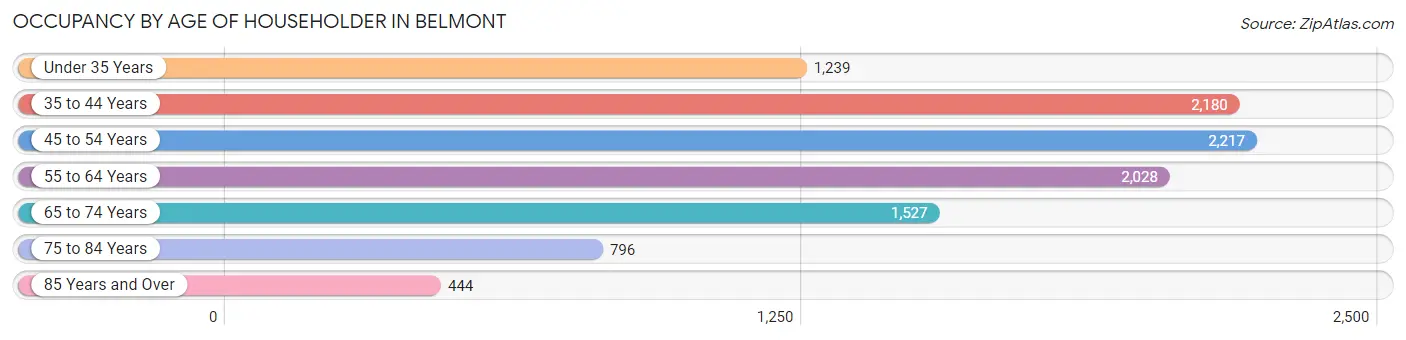
| Age Bracket | # Households | % Households |
| Under 35 Years | 1,239 | 11.9% |
| 35 to 44 Years | 2,180 | 20.9% |
| 45 to 54 Years | 2,217 | 21.2% |
| 55 to 64 Years | 2,028 | 19.4% |
| 65 to 74 Years | 1,527 | 14.6% |
| 75 to 84 Years | 796 | 7.6% |
| 85 Years and Over | 444 | 4.3% |
| Total | 10,431 | 100.0% |
Housing Finances in Belmont
Median Income by Occupancy in Belmont
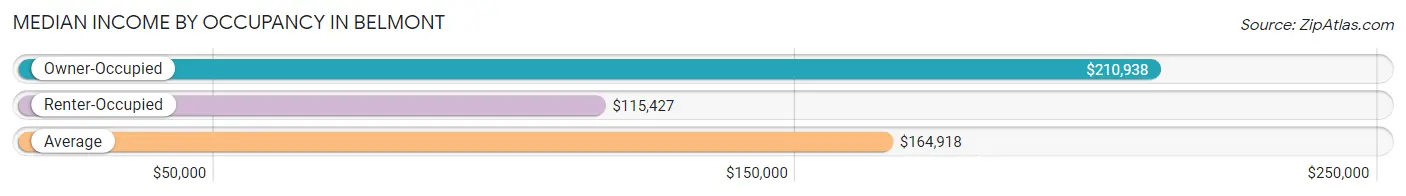
| Occupancy Type | # Households | Median Income |
| Owner-Occupied | 6,623 (63.5%) | $210,938 |
| Renter-Occupied | 3,808 (36.5%) | $115,427 |
| Average | 10,431 (100.0%) | $164,918 |
Occupancy by Householder Income Bracket in Belmont
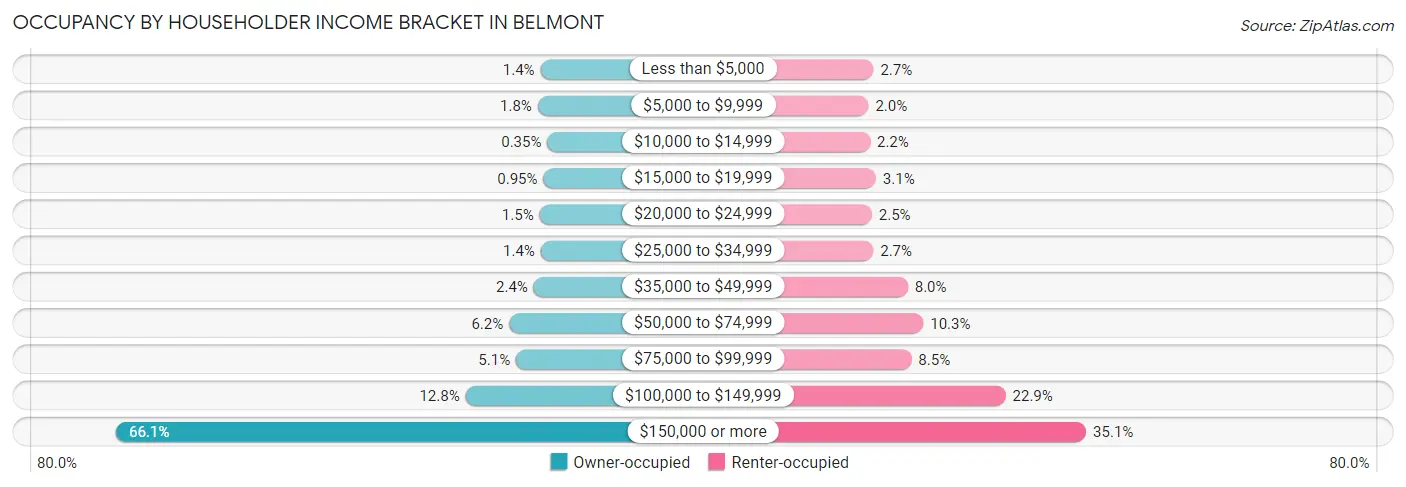
| Income Bracket | Owner-occupied | Renter-occupied |
| Less than $5,000 | 93 (1.4%) | 104 (2.7%) |
| $5,000 to $9,999 | 120 (1.8%) | 75 (2.0%) |
| $10,000 to $14,999 | 23 (0.4%) | 84 (2.2%) |
| $15,000 to $19,999 | 63 (0.9%) | 118 (3.1%) |
| $20,000 to $24,999 | 102 (1.5%) | 95 (2.5%) |
| $25,000 to $34,999 | 90 (1.4%) | 103 (2.7%) |
| $35,000 to $49,999 | 160 (2.4%) | 303 (8.0%) |
| $50,000 to $74,999 | 409 (6.2%) | 393 (10.3%) |
| $75,000 to $99,999 | 339 (5.1%) | 324 (8.5%) |
| $100,000 to $149,999 | 849 (12.8%) | 871 (22.9%) |
| $150,000 or more | 4,375 (66.1%) | 1,338 (35.1%) |
| Total | 6,623 (100.0%) | 3,808 (100.0%) |
Monthly Housing Cost Tiers in Belmont
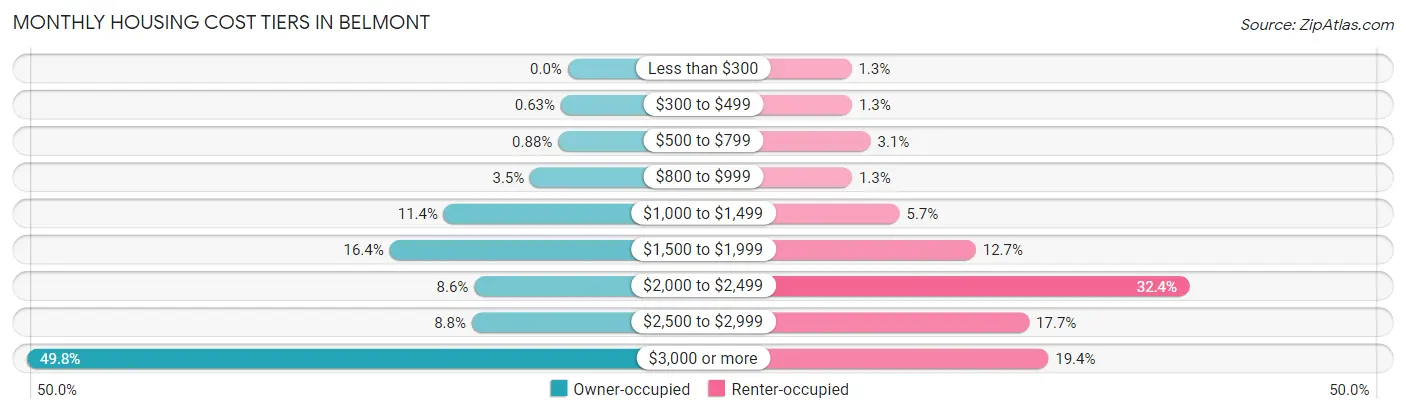
| Monthly Cost | Owner-occupied | Renter-occupied |
| Less than $300 | 0 (0.0%) | 49 (1.3%) |
| $300 to $499 | 42 (0.6%) | 51 (1.3%) |
| $500 to $799 | 58 (0.9%) | 116 (3.0%) |
| $800 to $999 | 229 (3.5%) | 51 (1.3%) |
| $1,000 to $1,499 | 756 (11.4%) | 218 (5.7%) |
| $1,500 to $1,999 | 1,086 (16.4%) | 485 (12.7%) |
| $2,000 to $2,499 | 570 (8.6%) | 1,232 (32.4%) |
| $2,500 to $2,999 | 585 (8.8%) | 672 (17.6%) |
| $3,000 or more | 3,297 (49.8%) | 739 (19.4%) |
| Total | 6,623 (100.0%) | 3,808 (100.0%) |
Physical Housing Characteristics in Belmont
Housing Structures in Belmont
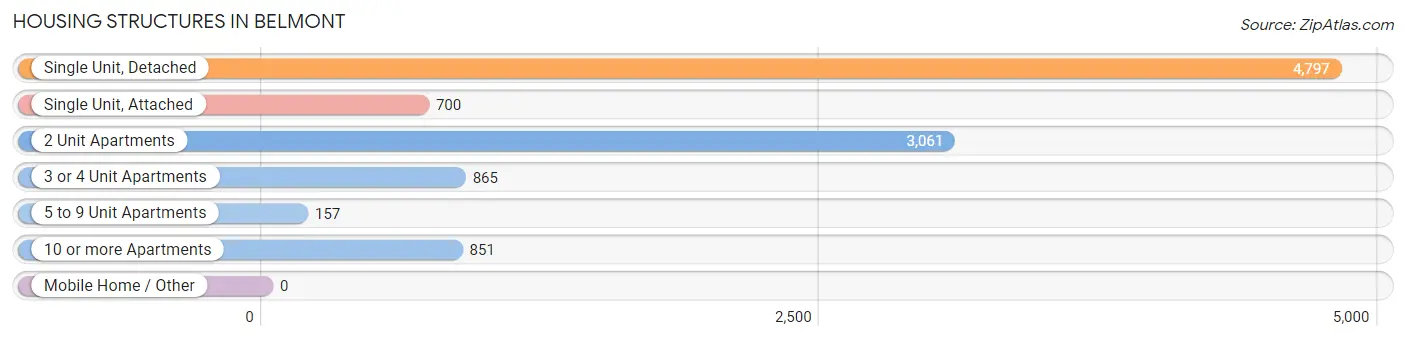
| Structure Type | # Housing Units | % Housing Units |
| Single Unit, Detached | 4,797 | 46.0% |
| Single Unit, Attached | 700 | 6.7% |
| 2 Unit Apartments | 3,061 | 29.3% |
| 3 or 4 Unit Apartments | 865 | 8.3% |
| 5 to 9 Unit Apartments | 157 | 1.5% |
| 10 or more Apartments | 851 | 8.2% |
| Mobile Home / Other | 0 | 0.0% |
| Total | 10,431 | 100.0% |
Housing Structures by Occupancy in Belmont
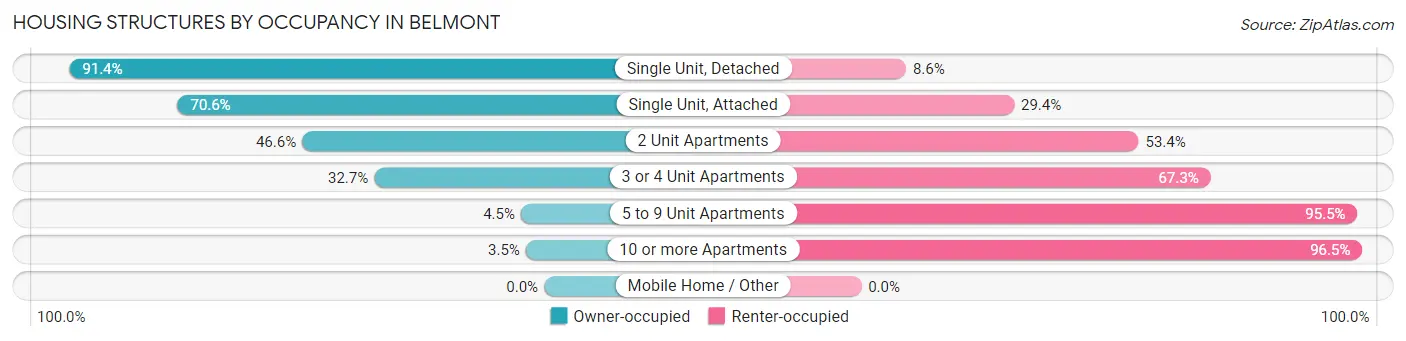
| Structure Type | Owner-occupied | Renter-occupied |
| Single Unit, Detached | 4,383 (91.4%) | 414 (8.6%) |
| Single Unit, Attached | 494 (70.6%) | 206 (29.4%) |
| 2 Unit Apartments | 1,426 (46.6%) | 1,635 (53.4%) |
| 3 or 4 Unit Apartments | 283 (32.7%) | 582 (67.3%) |
| 5 to 9 Unit Apartments | 7 (4.5%) | 150 (95.5%) |
| 10 or more Apartments | 30 (3.5%) | 821 (96.5%) |
| Mobile Home / Other | 0 (0.0%) | 0 (0.0%) |
| Total | 6,623 (63.5%) | 3,808 (36.5%) |
Housing Structures by Number of Rooms in Belmont
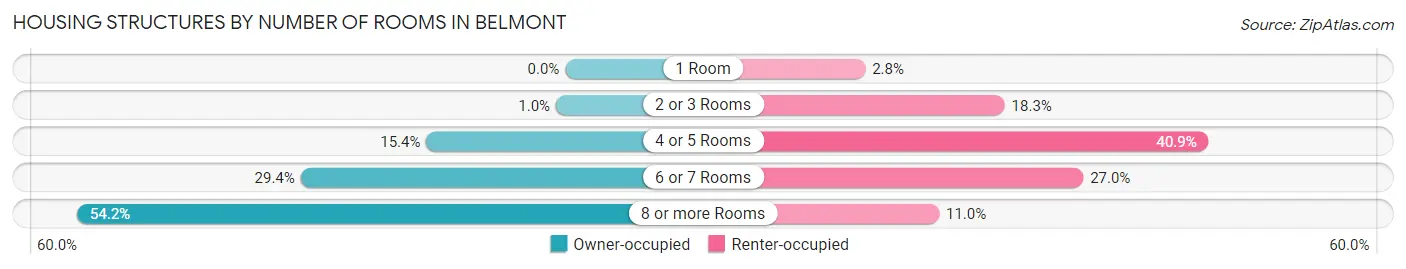
| Number of Rooms | Owner-occupied | Renter-occupied |
| 1 Room | 0 (0.0%) | 107 (2.8%) |
| 2 or 3 Rooms | 68 (1.0%) | 696 (18.3%) |
| 4 or 5 Rooms | 1,021 (15.4%) | 1,558 (40.9%) |
| 6 or 7 Rooms | 1,945 (29.4%) | 1,028 (27.0%) |
| 8 or more Rooms | 3,589 (54.2%) | 419 (11.0%) |
| Total | 6,623 (100.0%) | 3,808 (100.0%) |
Housing Structure by Heating Type in Belmont
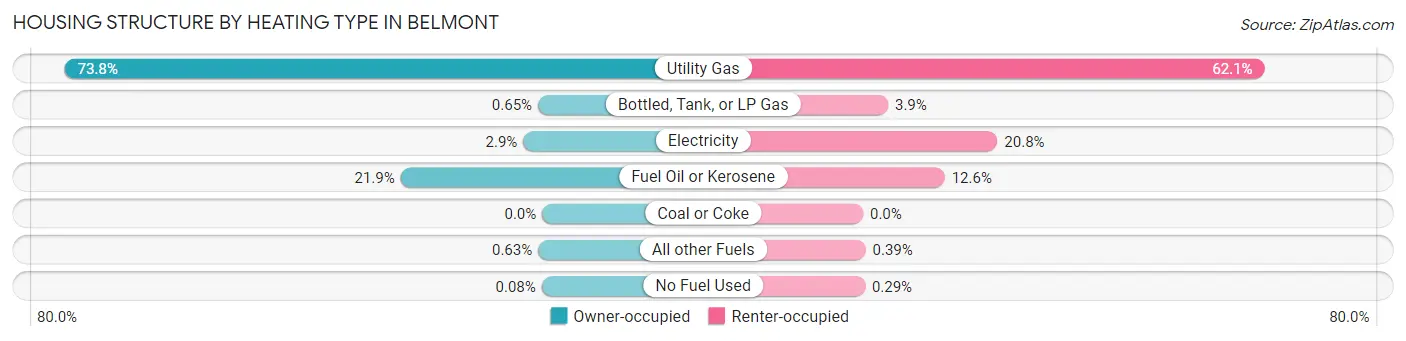
| Heating Type | Owner-occupied | Renter-occupied |
| Utility Gas | 4,889 (73.8%) | 2,363 (62.1%) |
| Bottled, Tank, or LP Gas | 43 (0.6%) | 147 (3.9%) |
| Electricity | 194 (2.9%) | 791 (20.8%) |
| Fuel Oil or Kerosene | 1,450 (21.9%) | 481 (12.6%) |
| Coal or Coke | 0 (0.0%) | 0 (0.0%) |
| All other Fuels | 42 (0.6%) | 15 (0.4%) |
| No Fuel Used | 5 (0.1%) | 11 (0.3%) |
| Total | 6,623 (100.0%) | 3,808 (100.0%) |
Household Vehicle Usage in Belmont
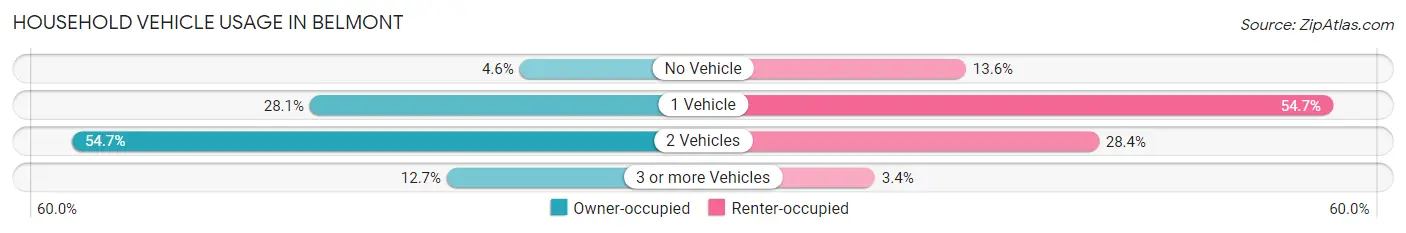
| Vehicles per Household | Owner-occupied | Renter-occupied |
| No Vehicle | 302 (4.6%) | 516 (13.6%) |
| 1 Vehicle | 1,858 (28.1%) | 2,081 (54.6%) |
| 2 Vehicles | 3,622 (54.7%) | 1,083 (28.4%) |
| 3 or more Vehicles | 841 (12.7%) | 128 (3.4%) |
| Total | 6,623 (100.0%) | 3,808 (100.0%) |
Real Estate & Mortgages in Belmont
Real Estate and Mortgage Overview in Belmont
| Characteristic | Without Mortgage | With Mortgage |
| Housing Units | 2,331 | 4,292 |
| Median Property Value | $995,400 | $1,094,000 |
| Median Household Income | $126,410 | $3,325 |
| Monthly Housing Costs | $1,501 | $3,243 |
| Real Estate Taxes | $10,001 | $21 |
Property Value by Mortgage Status in Belmont
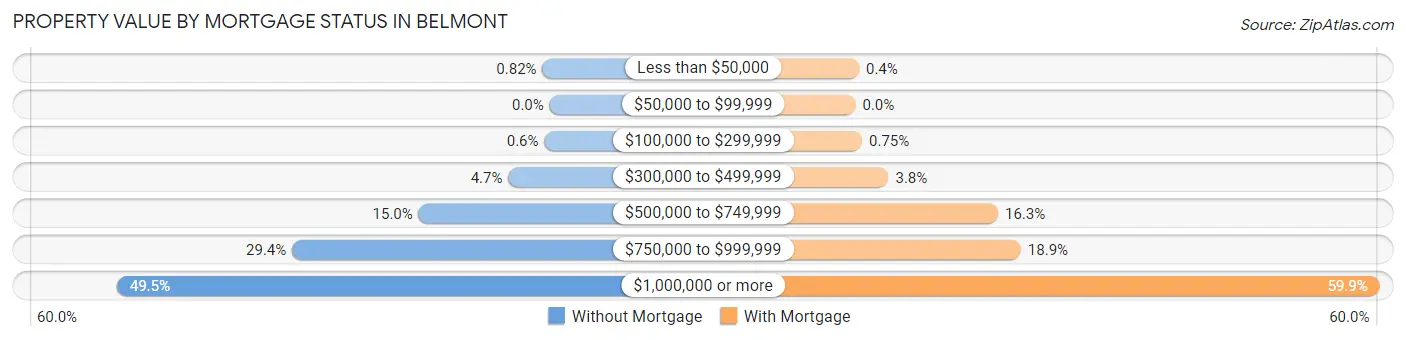
| Property Value | Without Mortgage | With Mortgage |
| Less than $50,000 | 19 (0.8%) | 17 (0.4%) |
| $50,000 to $99,999 | 0 (0.0%) | 0 (0.0%) |
| $100,000 to $299,999 | 14 (0.6%) | 32 (0.7%) |
| $300,000 to $499,999 | 110 (4.7%) | 162 (3.8%) |
| $500,000 to $749,999 | 349 (15.0%) | 699 (16.3%) |
| $750,000 to $999,999 | 686 (29.4%) | 811 (18.9%) |
| $1,000,000 or more | 1,153 (49.5%) | 2,571 (59.9%) |
| Total | 2,331 (100.0%) | 4,292 (100.0%) |
Household Income by Mortgage Status in Belmont
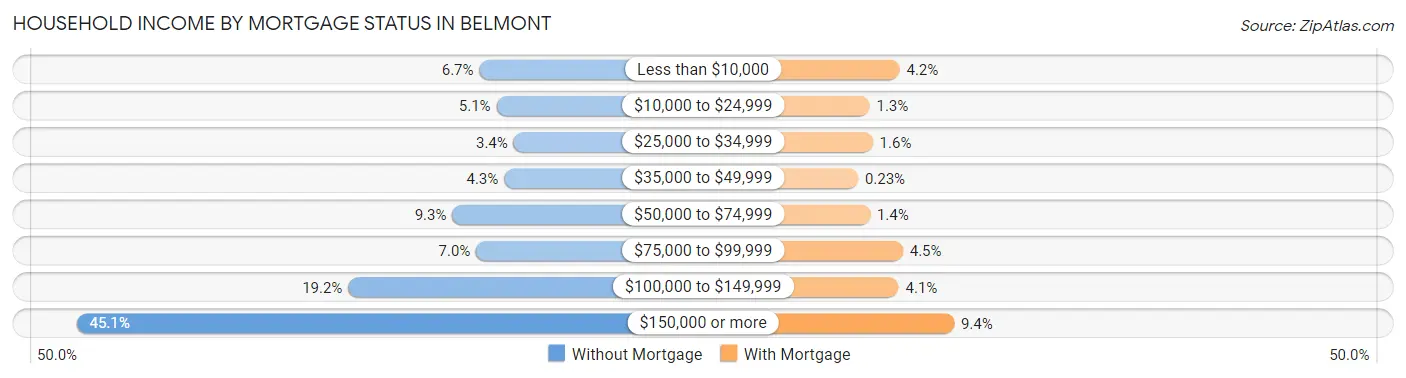
| Household Income | Without Mortgage | With Mortgage |
| Less than $10,000 | 156 (6.7%) | 180 (4.2%) |
| $10,000 to $24,999 | 118 (5.1%) | 57 (1.3%) |
| $25,000 to $34,999 | 80 (3.4%) | 70 (1.6%) |
| $35,000 to $49,999 | 101 (4.3%) | 10 (0.2%) |
| $50,000 to $74,999 | 216 (9.3%) | 59 (1.4%) |
| $75,000 to $99,999 | 163 (7.0%) | 193 (4.5%) |
| $100,000 to $149,999 | 447 (19.2%) | 176 (4.1%) |
| $150,000 or more | 1,050 (45.1%) | 402 (9.4%) |
| Total | 2,331 (100.0%) | 4,292 (100.0%) |
Property Value to Household Income Ratio in Belmont
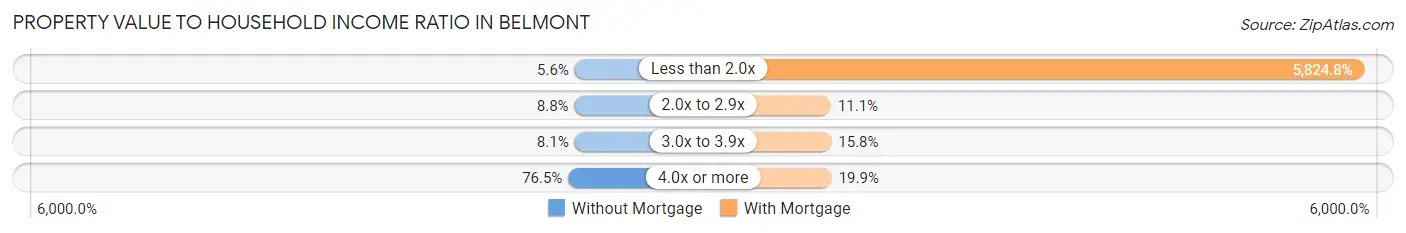
| Value-to-Income Ratio | Without Mortgage | With Mortgage |
| Less than 2.0x | 131 (5.6%) | 250,001 (5,824.8%) |
| 2.0x to 2.9x | 204 (8.7%) | 478 (11.1%) |
| 3.0x to 3.9x | 188 (8.1%) | 676 (15.8%) |
| 4.0x or more | 1,782 (76.4%) | 853 (19.9%) |
| Total | 2,331 (100.0%) | 4,292 (100.0%) |
Real Estate Taxes by Mortgage Status in Belmont
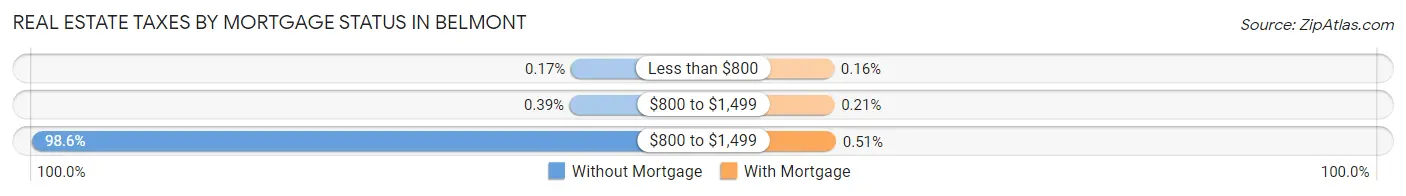
| Property Taxes | Without Mortgage | With Mortgage |
| Less than $800 | 4 (0.2%) | 7 (0.2%) |
| $800 to $1,499 | 9 (0.4%) | 9 (0.2%) |
| $800 to $1,499 | 2,299 (98.6%) | 22 (0.5%) |
| Total | 2,331 (100.0%) | 4,292 (100.0%) |
Health & Disability in Belmont
Health Insurance Coverage by Age in Belmont
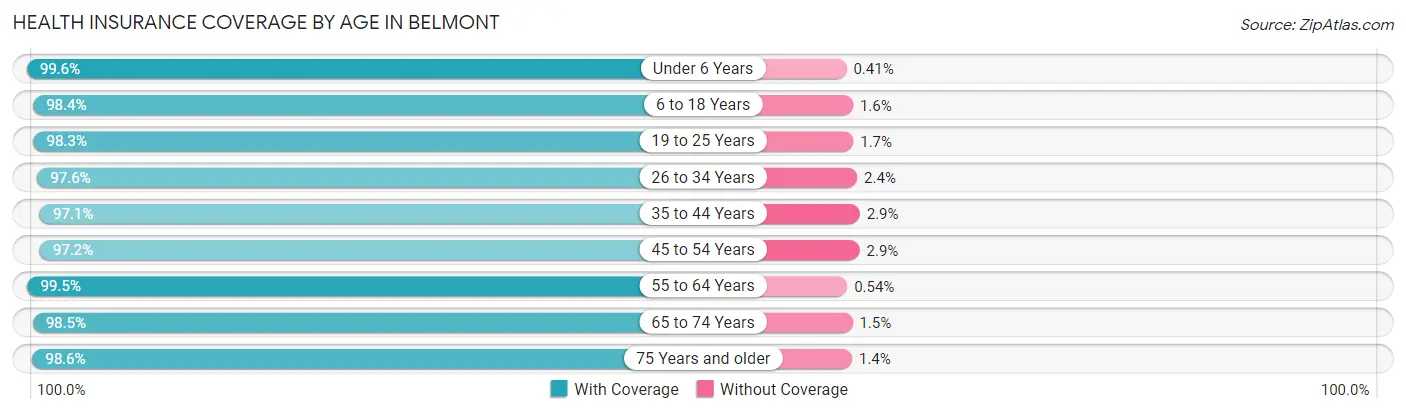
| Age Bracket | With Coverage | Without Coverage |
| Under 6 Years | 1,707 (99.6%) | 7 (0.4%) |
| 6 to 18 Years | 5,055 (98.4%) | 83 (1.6%) |
| 19 to 25 Years | 1,342 (98.3%) | 23 (1.7%) |
| 26 to 34 Years | 2,317 (97.6%) | 57 (2.4%) |
| 35 to 44 Years | 4,002 (97.1%) | 119 (2.9%) |
| 45 to 54 Years | 3,856 (97.2%) | 113 (2.9%) |
| 55 to 64 Years | 3,469 (99.5%) | 19 (0.5%) |
| 65 to 74 Years | 2,721 (98.5%) | 42 (1.5%) |
| 75 Years and older | 1,842 (98.6%) | 27 (1.4%) |
| Total | 26,311 (98.2%) | 490 (1.8%) |
Health Insurance Coverage by Citizenship Status in Belmont
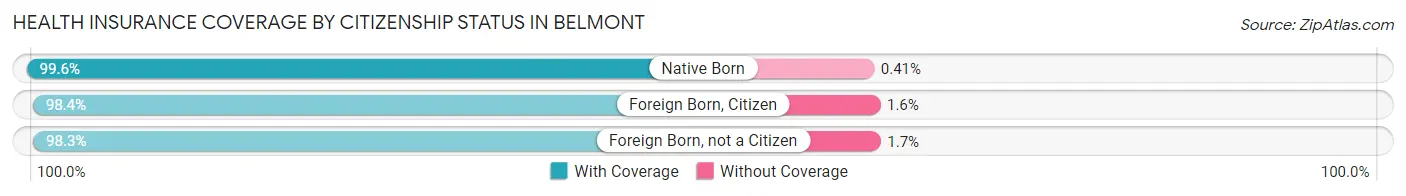
| Citizenship Status | With Coverage | Without Coverage |
| Native Born | 1,707 (99.6%) | 7 (0.4%) |
| Foreign Born, Citizen | 5,055 (98.4%) | 83 (1.6%) |
| Foreign Born, not a Citizen | 1,342 (98.3%) | 23 (1.7%) |
Health Insurance Coverage by Household Income in Belmont
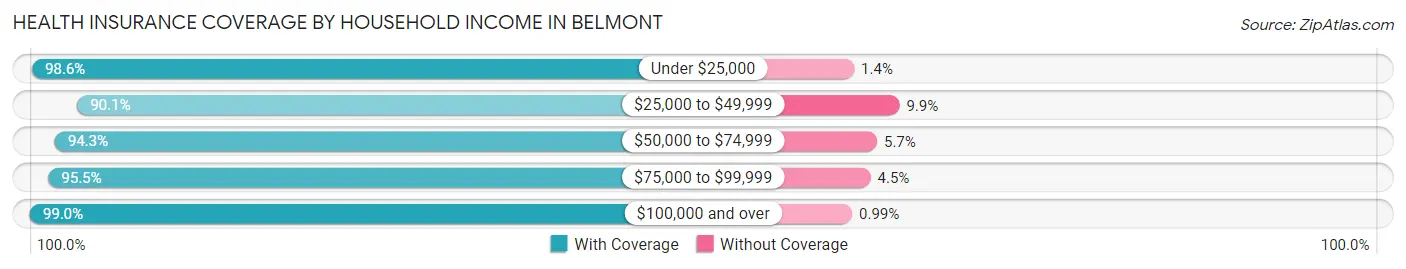
| Household Income | With Coverage | Without Coverage |
| Under $25,000 | 1,213 (98.6%) | 17 (1.4%) |
| $25,000 to $49,999 | 931 (90.1%) | 102 (9.9%) |
| $50,000 to $74,999 | 1,514 (94.3%) | 91 (5.7%) |
| $75,000 to $99,999 | 1,435 (95.5%) | 67 (4.5%) |
| $100,000 and over | 21,149 (99.0%) | 211 (1.0%) |
Public vs Private Health Insurance Coverage by Age in Belmont
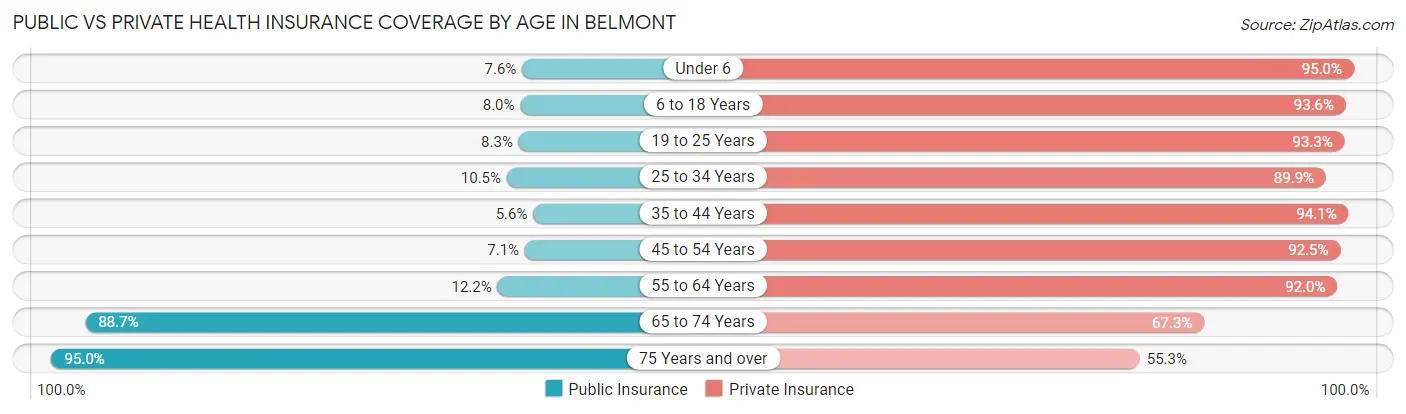
| Age Bracket | Public Insurance | Private Insurance |
| Under 6 | 131 (7.6%) | 1,629 (95.0%) |
| 6 to 18 Years | 410 (8.0%) | 4,807 (93.6%) |
| 19 to 25 Years | 113 (8.3%) | 1,274 (93.3%) |
| 25 to 34 Years | 249 (10.5%) | 2,133 (89.8%) |
| 35 to 44 Years | 230 (5.6%) | 3,876 (94.1%) |
| 45 to 54 Years | 283 (7.1%) | 3,672 (92.5%) |
| 55 to 64 Years | 426 (12.2%) | 3,208 (92.0%) |
| 65 to 74 Years | 2,452 (88.7%) | 1,858 (67.2%) |
| 75 Years and over | 1,776 (95.0%) | 1,034 (55.3%) |
| Total | 6,070 (22.7%) | 23,491 (87.6%) |
Disability Status by Sex by Age in Belmont
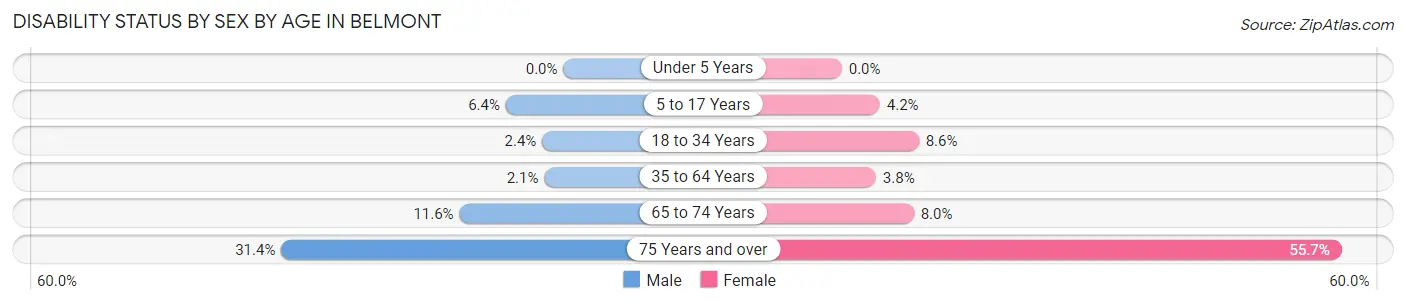
| Age Bracket | Male | Female |
| Under 5 Years | 0 (0.0%) | 0 (0.0%) |
| 5 to 17 Years | 160 (6.4%) | 113 (4.2%) |
| 18 to 34 Years | 43 (2.4%) | 190 (8.6%) |
| 35 to 64 Years | 118 (2.1%) | 229 (3.8%) |
| 65 to 74 Years | 152 (11.6%) | 116 (8.0%) |
| 75 Years and over | 235 (31.4%) | 624 (55.7%) |
Disability Class by Sex by Age in Belmont
Disability Class: Hearing Difficulty
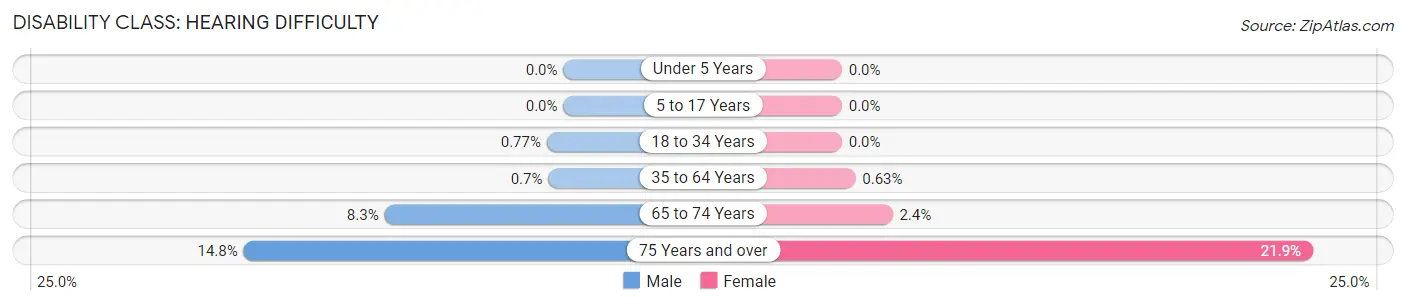
| Age Bracket | Male | Female |
| Under 5 Years | 0 (0.0%) | 0 (0.0%) |
| 5 to 17 Years | 0 (0.0%) | 0 (0.0%) |
| 18 to 34 Years | 14 (0.8%) | 0 (0.0%) |
| 35 to 64 Years | 39 (0.7%) | 38 (0.6%) |
| 65 to 74 Years | 109 (8.3%) | 34 (2.4%) |
| 75 Years and over | 111 (14.8%) | 245 (21.9%) |
Disability Class: Vision Difficulty
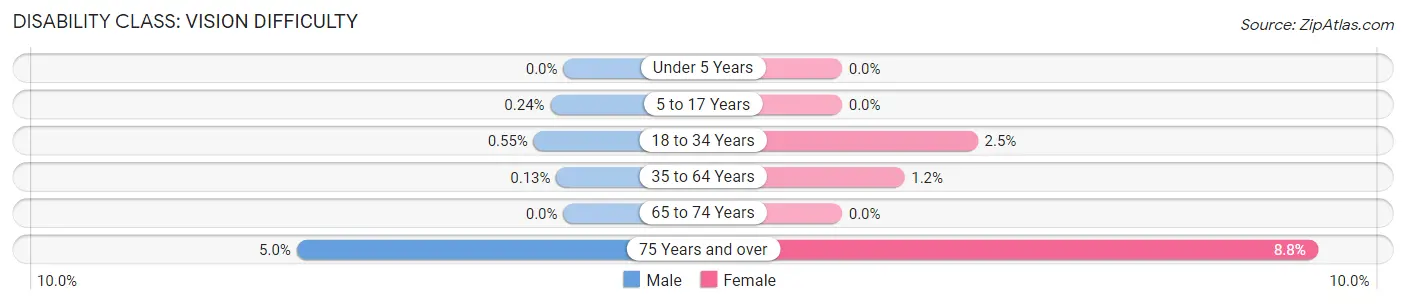
| Age Bracket | Male | Female |
| Under 5 Years | 0 (0.0%) | 0 (0.0%) |
| 5 to 17 Years | 6 (0.2%) | 0 (0.0%) |
| 18 to 34 Years | 10 (0.5%) | 56 (2.5%) |
| 35 to 64 Years | 7 (0.1%) | 70 (1.2%) |
| 65 to 74 Years | 0 (0.0%) | 0 (0.0%) |
| 75 Years and over | 37 (5.0%) | 99 (8.8%) |
Disability Class: Cognitive Difficulty
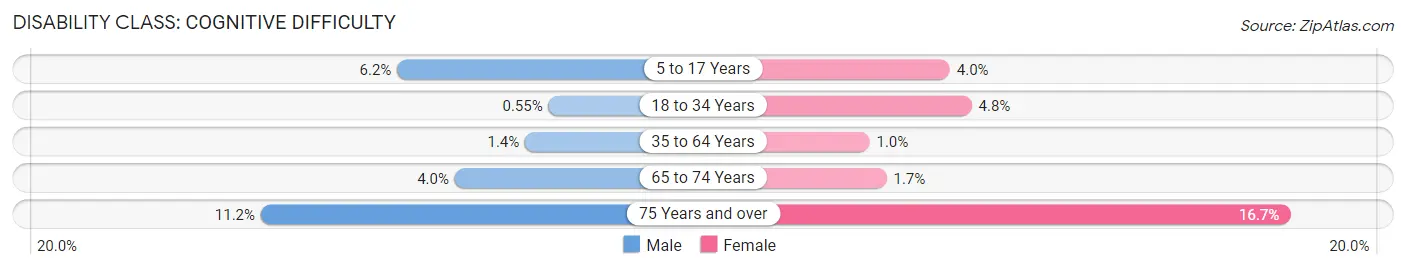
| Age Bracket | Male | Female |
| 5 to 17 Years | 154 (6.2%) | 107 (4.0%) |
| 18 to 34 Years | 10 (0.5%) | 107 (4.8%) |
| 35 to 64 Years | 79 (1.4%) | 62 (1.0%) |
| 65 to 74 Years | 53 (4.0%) | 24 (1.7%) |
| 75 Years and over | 84 (11.2%) | 187 (16.7%) |
Disability Class: Ambulatory Difficulty
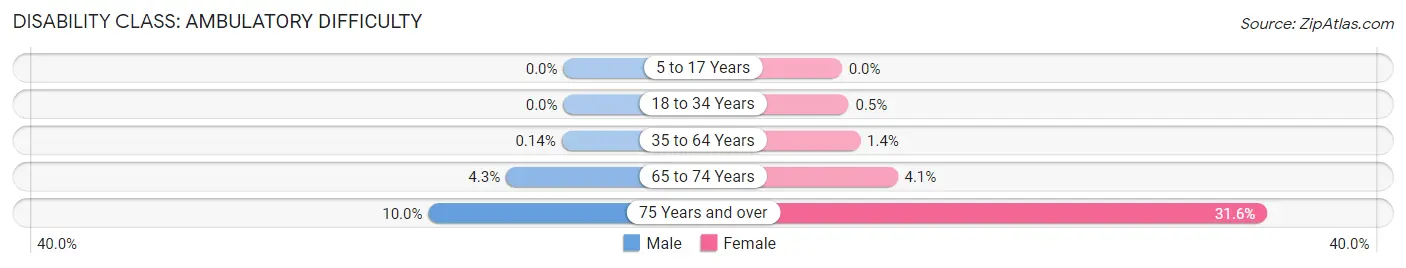
| Age Bracket | Male | Female |
| 5 to 17 Years | 0 (0.0%) | 0 (0.0%) |
| 18 to 34 Years | 0 (0.0%) | 11 (0.5%) |
| 35 to 64 Years | 8 (0.1%) | 82 (1.4%) |
| 65 to 74 Years | 56 (4.3%) | 60 (4.1%) |
| 75 Years and over | 75 (10.0%) | 354 (31.6%) |
Disability Class: Self-Care Difficulty
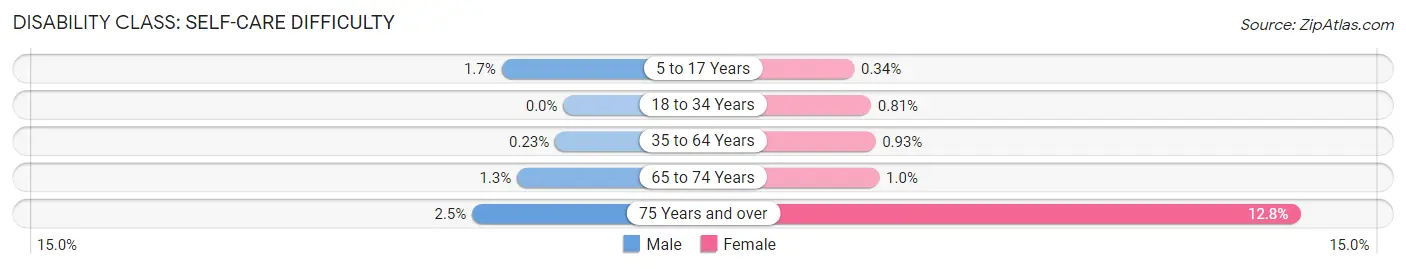
| Age Bracket | Male | Female |
| 5 to 17 Years | 43 (1.7%) | 9 (0.3%) |
| 18 to 34 Years | 0 (0.0%) | 18 (0.8%) |
| 35 to 64 Years | 13 (0.2%) | 56 (0.9%) |
| 65 to 74 Years | 17 (1.3%) | 15 (1.0%) |
| 75 Years and over | 19 (2.5%) | 143 (12.8%) |
Technology Access in Belmont
Computing Device Access in Belmont
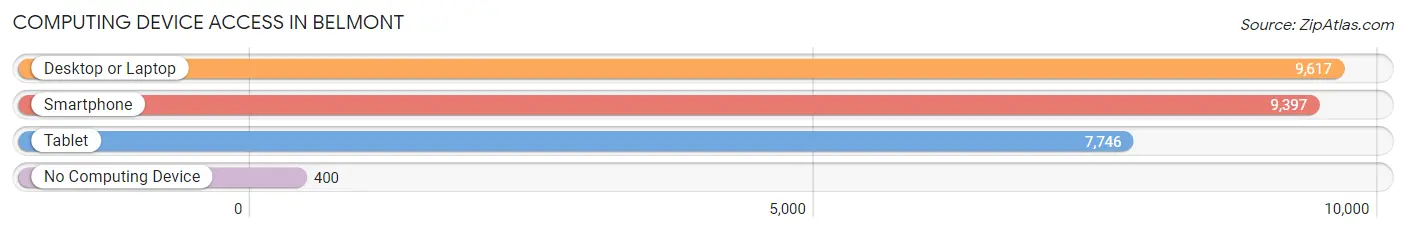
| Device Type | # Households | % Households |
| Desktop or Laptop | 9,617 | 92.2% |
| Smartphone | 9,397 | 90.1% |
| Tablet | 7,746 | 74.3% |
| No Computing Device | 400 | 3.8% |
| Total | 10,431 | 100.0% |
Internet Access in Belmont
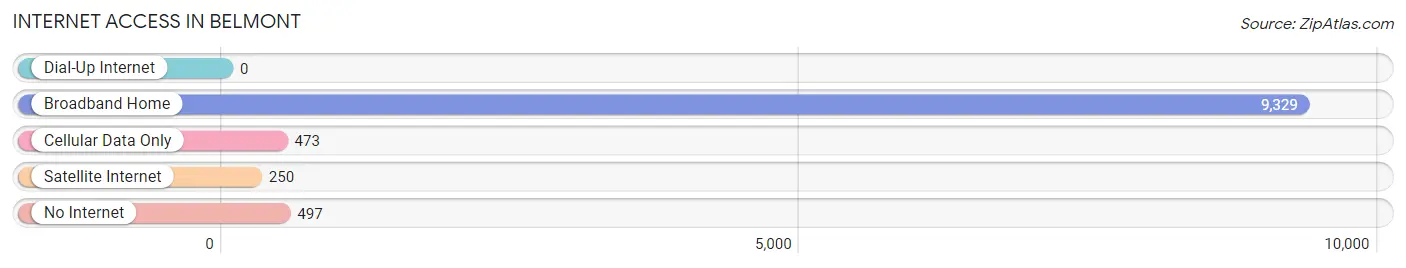
| Internet Type | # Households | % Households |
| Dial-Up Internet | 0 | 0.0% |
| Broadband Home | 9,329 | 89.4% |
| Cellular Data Only | 473 | 4.5% |
| Satellite Internet | 250 | 2.4% |
| No Internet | 497 | 4.8% |
| Total | 10,431 | 100.0% |
Belmont Summary
Belmont, Massachusetts is a town located in Middlesex County, just west of Boston. It is a suburban community with a population of approximately 25,000 people. Belmont is known for its excellent schools, beautiful parks, and vibrant downtown area.
History
Belmont was first settled in 1636 by English settlers. The town was originally part of Watertown, but was incorporated as its own town in 1859. The town was named after Bellmont, a town in England.
Belmont was a rural farming community until the late 19th century. In the late 1800s, the town began to develop into a residential suburb of Boston. The town was connected to Boston by the Fitchburg Railroad in 1845, and the population began to grow rapidly.
In the early 20th century, Belmont became a popular summer destination for wealthy Bostonians. The town was home to many large estates, and the population grew to over 10,000 by the 1920s.
Geography
Belmont is located in Middlesex County, just west of Boston. It is bordered by Cambridge to the north, Watertown to the east, Waltham to the south, and Arlington to the west.
The town is located on the Charles River, and is home to several parks and recreational areas. The town is also home to the Belmont Hill School, a private school.
Economy
Belmont is a primarily residential community, and the majority of its residents are employed in the Boston area. The town is home to several large employers, including the Belmont Public Schools, the Belmont Hill School, and the Belmont Country Club.
The town is also home to several small businesses, including restaurants, retail stores, and professional services.
Demographics
As of the 2010 census, Belmont had a population of 24,729 people. The racial makeup of the town was 87.3% White, 4.2% Asian, 3.2% African American, and 2.3% Hispanic or Latino.
The median household income in Belmont was $107,817, and the median family income was $133,817. The per capita income was $50,945.
Belmont is a highly educated community, with over 80% of the population having a bachelor's degree or higher. The town is also home to several prestigious universities, including Harvard University and the Massachusetts Institute of Technology.
Common Questions
What is Per Capita Income in Belmont?
Per Capita income in Belmont is $88,841.
What is the Median Family Income in Belmont?
Median Family Income in Belmont is $201,977.
What is the Median Household income in Belmont?
Median Household Income in Belmont is $164,918.
What is Income or Wage Gap in Belmont?
Income or Wage Gap in Belmont is 43.6%.
Women in Belmont earn 56.4 cents for every dollar earned by a man.
What is Inequality or Gini Index in Belmont?
Inequality or Gini Index in Belmont is 0.48.
What is the Total Population of Belmont?
Total Population of Belmont is 26,997.
What is the Total Male Population of Belmont?
Total Male Population of Belmont is 12,595.
What is the Total Female Population of Belmont?
Total Female Population of Belmont is 14,402.
What is the Ratio of Males per 100 Females in Belmont?
There are 87.45 Males per 100 Females in Belmont.
What is the Ratio of Females per 100 Males in Belmont?
There are 114.35 Females per 100 Males in Belmont.
What is the Median Population Age in Belmont?
Median Population Age in Belmont is 42.0 Years.
What is the Average Family Size in Belmont
Average Family Size in Belmont is 3.1 People.
What is the Average Household Size in Belmont
Average Household Size in Belmont is 2.6 People.
How Large is the Labor Force in Belmont?
There are 14,870 People in the Labor Forcein in Belmont.
What is the Percentage of People in the Labor Force in Belmont?
69.1% of People are in the Labor Force in Belmont.
What is the Unemployment Rate in Belmont?
Unemployment Rate in Belmont is 4.7%.