Lexington, MA Map & Demographics
Lexington Map
Lexington Overview
$102,776
PER CAPITA INCOME
$248,773
AVG FAMILY INCOME
$206,323
AVG HOUSEHOLD INCOME
48.1%
WAGE / INCOME GAP [ % ]
51.9¢/ $1
WAGE / INCOME GAP [ $ ]
$14,487
FAMILY INCOME DEFICIT
0.46
INEQUALITY / GINI INDEX
34,221
TOTAL POPULATION
16,499
MALE POPULATION
17,722
FEMALE POPULATION
93.10
MALES / 100 FEMALES
107.41
FEMALES / 100 MALES
46.8
MEDIAN AGE
3.1
AVG FAMILY SIZE
2.7
AVG HOUSEHOLD SIZE
16,986
LABOR FORCE [ PEOPLE ]
63.5%
PERCENT IN LABOR FORCE
3.7%
UNEMPLOYMENT RATE
Income in Lexington
Income Overview in Lexington
Per Capita Income in Lexington is $102,776, while median incomes of families and households are $248,773 and $206,323 respectively.
| Characteristic | Number | Measure |
| Per Capita Income | 34,221 | $102,776 |
| Median Family Income | 9,791 | $248,773 |
| Mean Family Income | 9,791 | $321,569 |
| Median Household Income | 12,385 | $206,323 |
| Mean Household Income | 12,385 | $281,187 |
| Income Deficit | 9,791 | $14,487 |
| Wage / Income Gap (%) | 34,221 | 48.11% |
| Wage / Income Gap ($) | 34,221 | 51.89¢ per $1 |
| Gini / Inequality Index | 34,221 | 0.46 |
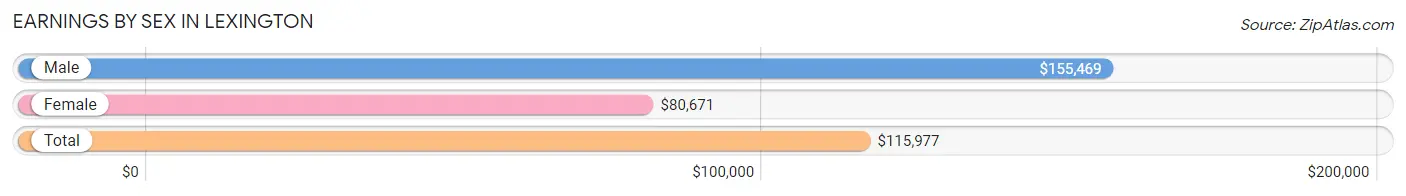
Earnings by Sex in Lexington
Average Earnings in Lexington are $115,977, $155,469 for men and $80,671 for women, a difference of 48.1%.
| Sex | Number | Average Earnings |
| Male | 9,390 (53.2%) | $155,469 |
| Female | 8,253 (46.8%) | $80,671 |
| Total | 17,643 (100.0%) | $115,977 |
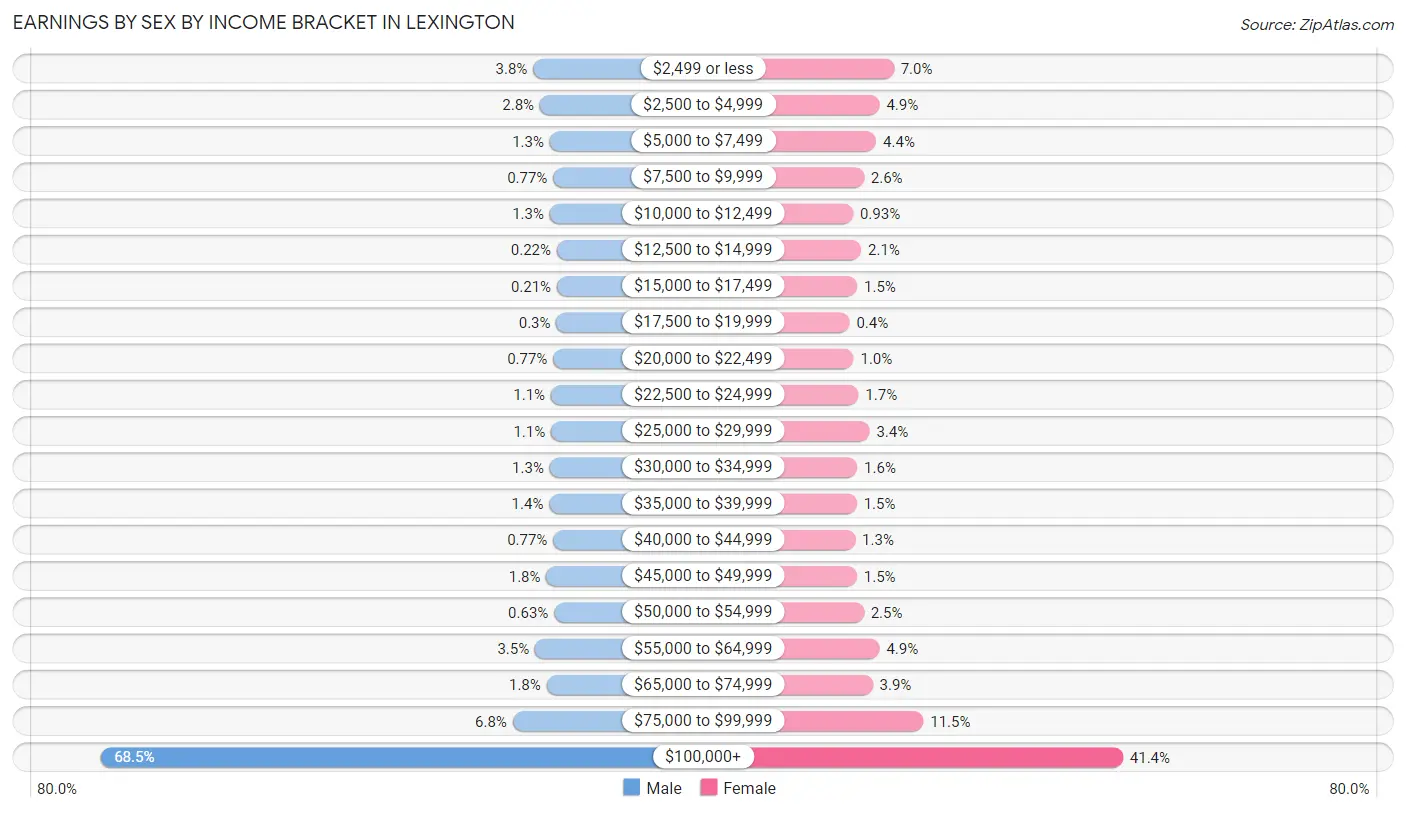
Earnings by Sex by Income Bracket in Lexington
The most common earnings brackets in Lexington are $100,000+ for men (6,433 | 68.5%) and $100,000+ for women (3,415 | 41.4%).
| Income | Male | Female |
| $2,499 or less | 354 (3.8%) | 580 (7.0%) |
| $2,500 to $4,999 | 259 (2.8%) | 404 (4.9%) |
| $5,000 to $7,499 | 120 (1.3%) | 363 (4.4%) |
| $7,500 to $9,999 | 72 (0.8%) | 211 (2.6%) |
| $10,000 to $12,499 | 120 (1.3%) | 77 (0.9%) |
| $12,500 to $14,999 | 21 (0.2%) | 177 (2.1%) |
| $15,000 to $17,499 | 20 (0.2%) | 127 (1.5%) |
| $17,500 to $19,999 | 28 (0.3%) | 33 (0.4%) |
| $20,000 to $22,499 | 72 (0.8%) | 83 (1.0%) |
| $22,500 to $24,999 | 104 (1.1%) | 144 (1.7%) |
| $25,000 to $29,999 | 102 (1.1%) | 281 (3.4%) |
| $30,000 to $34,999 | 121 (1.3%) | 128 (1.5%) |
| $35,000 to $39,999 | 129 (1.4%) | 123 (1.5%) |
| $40,000 to $44,999 | 72 (0.8%) | 103 (1.3%) |
| $45,000 to $49,999 | 169 (1.8%) | 125 (1.5%) |
| $50,000 to $54,999 | 59 (0.6%) | 209 (2.5%) |
| $55,000 to $64,999 | 328 (3.5%) | 404 (4.9%) |
| $65,000 to $74,999 | 165 (1.8%) | 319 (3.9%) |
| $75,000 to $99,999 | 642 (6.8%) | 947 (11.5%) |
| $100,000+ | 6,433 (68.5%) | 3,415 (41.4%) |
| Total | 9,390 (100.0%) | 8,253 (100.0%) |
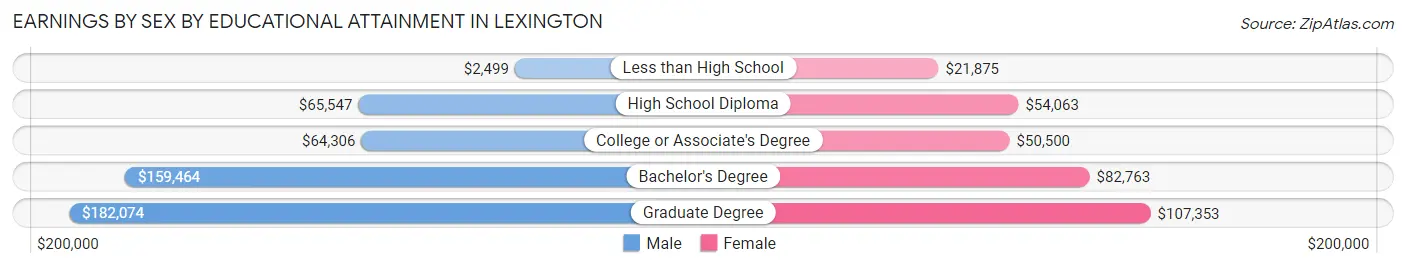
Earnings by Sex by Educational Attainment in Lexington
Average earnings in Lexington are $167,826 for men and $96,864 for women, a difference of 42.3%. Men with an educational attainment of graduate degree enjoy the highest average annual earnings of $182,074, while those with less than high school education earn the least with $2,499. Women with an educational attainment of graduate degree earn the most with the average annual earnings of $107,353, while those with less than high school education have the smallest earnings of $21,875.
| Educational Attainment | Male Income | Female Income |
| Less than High School | $2,499 | $21,875 |
| High School Diploma | $65,547 | $54,063 |
| College or Associate's Degree | $64,306 | $50,500 |
| Bachelor's Degree | $159,464 | $82,763 |
| Graduate Degree | $182,074 | $107,353 |
| Total | $167,826 | $96,864 |
Family Income in Lexington
Family Income Brackets in Lexington
According to the Lexington family income data, there are 6,012 families falling into the $200,000+ income range, which is the most common income bracket and makes up 61.4% of all families. Conversely, the $10,000 to $14,999 income bracket is the least frequent group with only 39 families (0.4%) belonging to this category.
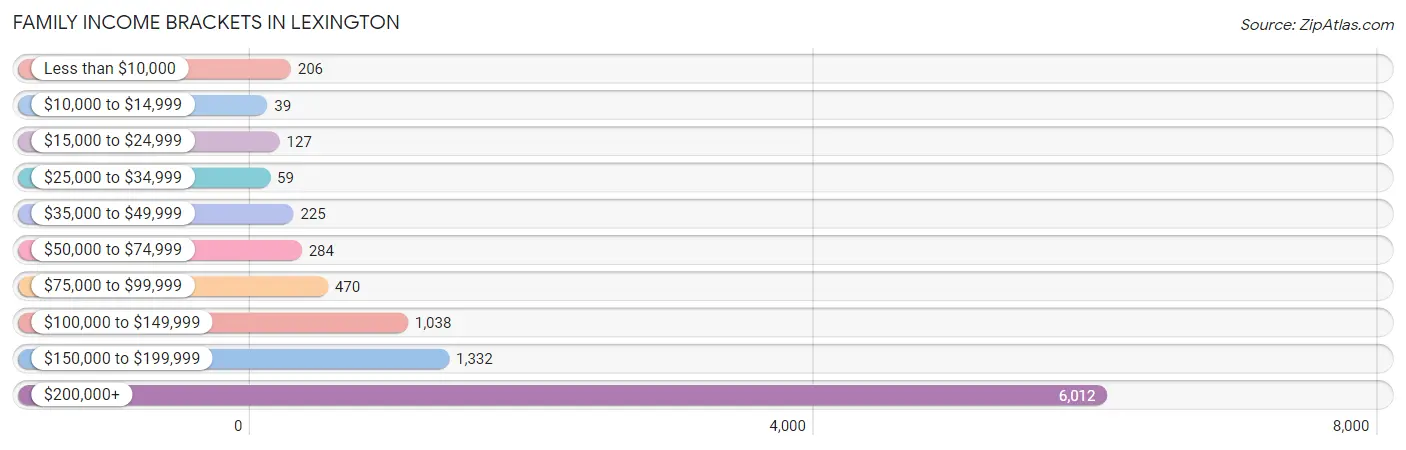
| Income Bracket | # Families | % Families |
| Less than $10,000 | 206 | 2.1% |
| $10,000 to $14,999 | 39 | 0.4% |
| $15,000 to $24,999 | 127 | 1.3% |
| $25,000 to $34,999 | 59 | 0.6% |
| $35,000 to $49,999 | 225 | 2.3% |
| $50,000 to $74,999 | 284 | 2.9% |
| $75,000 to $99,999 | 470 | 4.8% |
| $100,000 to $149,999 | 1,038 | 10.6% |
| $150,000 to $199,999 | 1,332 | 13.6% |
| $200,000+ | 6,012 | 61.4% |
Family Income by Famaliy Size in Lexington
3-person families (2,315 | 23.6%) account for the highest median family income in Lexington with $250,001 per family, while 2-person families (3,753 | 38.3%) have the highest median income of $93,666 per family member.
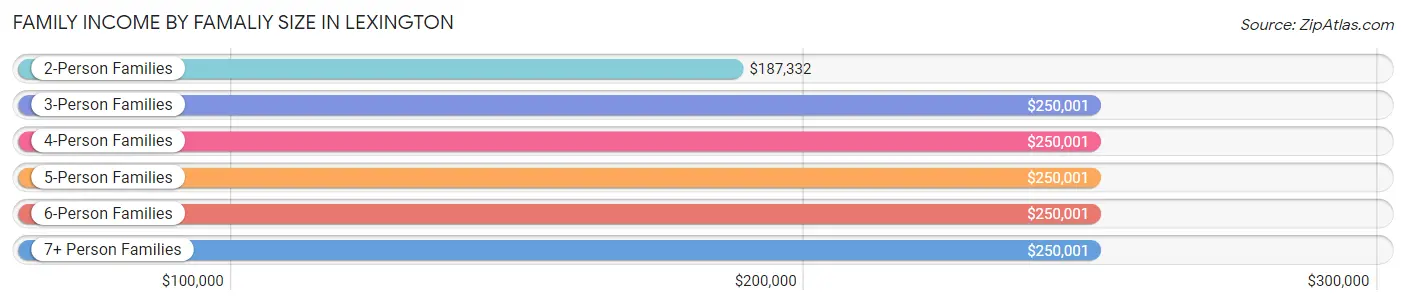
| Income Bracket | # Families | Median Income |
| 2-Person Families | 3,753 (38.3%) | $187,332 |
| 3-Person Families | 2,315 (23.6%) | $250,001 |
| 4-Person Families | 2,450 (25.0%) | $250,001 |
| 5-Person Families | 1,032 (10.5%) | $250,001 |
| 6-Person Families | 218 (2.2%) | $250,001 |
| 7+ Person Families | 23 (0.2%) | $250,001 |
| Total | 9,791 (100.0%) | $248,773 |
Family Income by Number of Earners in Lexington
The median family income in Lexington is $248,773, with families comprising 2 earners (4,654) having the highest median family income of $250,001, while families with no earners (1,272) have the lowest median family income of $95,841, accounting for 47.5% and 13.0% of families, respectively.
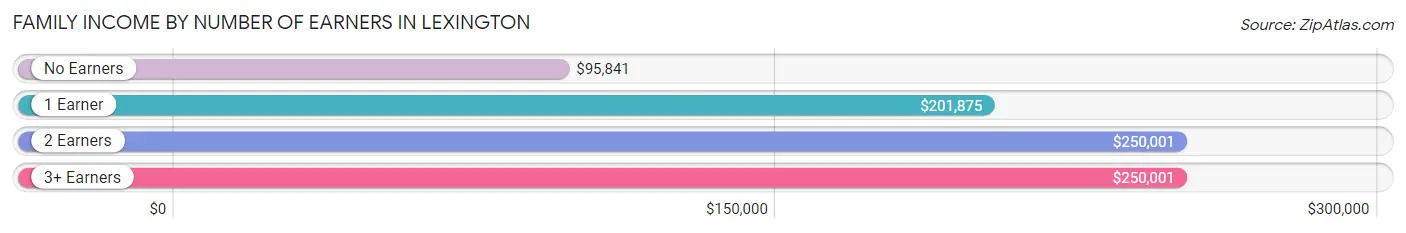
| Number of Earners | # Families | Median Income |
| No Earners | 1,272 (13.0%) | $95,841 |
| 1 Earner | 2,657 (27.1%) | $201,875 |
| 2 Earners | 4,654 (47.5%) | $250,001 |
| 3+ Earners | 1,208 (12.3%) | $250,001 |
| Total | 9,791 (100.0%) | $248,773 |
Household Income in Lexington
Household Income Brackets in Lexington
With 6,378 households falling in the category, the $200,000+ income range is the most frequent in Lexington, accounting for 51.5% of all households. In contrast, only 136 households (1.1%) fall into the $10,000 to $14,999 income bracket, making it the least populous group.
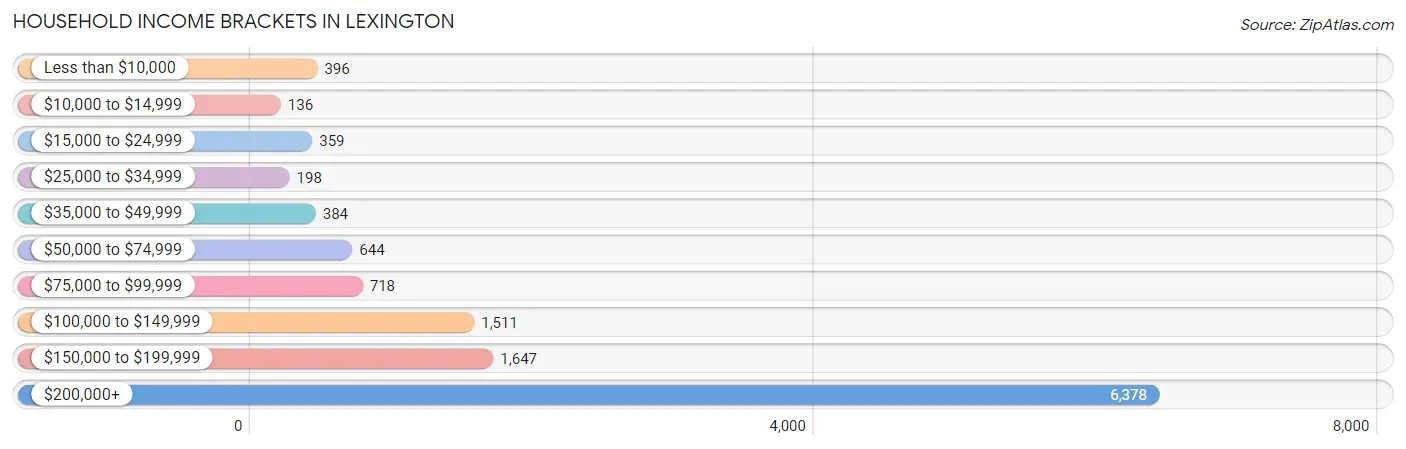
| Income Bracket | # Households | % Households |
| Less than $10,000 | 396 | 3.2% |
| $10,000 to $14,999 | 136 | 1.1% |
| $15,000 to $24,999 | 359 | 2.9% |
| $25,000 to $34,999 | 198 | 1.6% |
| $35,000 to $49,999 | 384 | 3.1% |
| $50,000 to $74,999 | 644 | 5.2% |
| $75,000 to $99,999 | 718 | 5.8% |
| $100,000 to $149,999 | 1,511 | 12.2% |
| $150,000 to $199,999 | 1,647 | 13.3% |
| $200,000+ | 6,378 | 51.5% |
Household Income by Householder Age in Lexington
The median household income in Lexington is $206,323, with the highest median household income of $250,001 found in the 25 to 44 years age bracket for the primary householder. A total of 2,279 households (18.4%) fall into this category. Meanwhile, the 15 to 24 years age bracket for the primary householder has the lowest median household income of $0, with 11 households (0.1%) in this group.
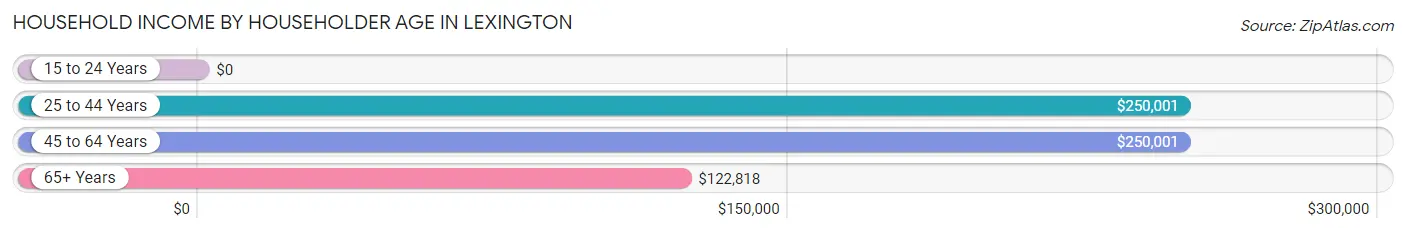
| Income Bracket | # Households | Median Income |
| 15 to 24 Years | 11 (0.1%) | $0 |
| 25 to 44 Years | 2,279 (18.4%) | $250,001 |
| 45 to 64 Years | 6,054 (48.9%) | $250,001 |
| 65+ Years | 4,041 (32.6%) | $122,818 |
| Total | 12,385 (100.0%) | $206,323 |
Poverty in Lexington
Income Below Poverty by Sex and Age in Lexington
With 2.8% poverty level for males and 5.4% for females among the residents of Lexington, under 5 year old males and 75 year old and over females are the most vulnerable to poverty, with 58 males (9.4%) and 255 females (15.5%) in their respective age groups living below the poverty level.
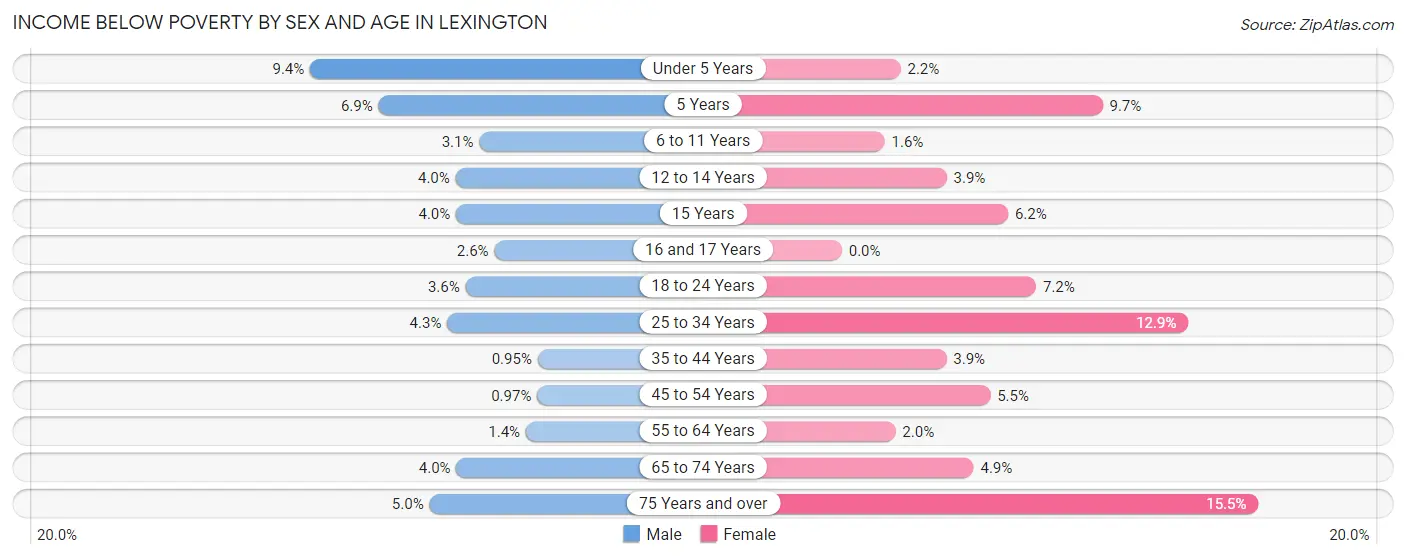
| Age Bracket | Male | Female |
| Under 5 Years | 58 (9.4%) | 13 (2.2%) |
| 5 Years | 12 (6.9%) | 15 (9.7%) |
| 6 to 11 Years | 44 (3.1%) | 23 (1.6%) |
| 12 to 14 Years | 46 (4.0%) | 45 (3.9%) |
| 15 Years | 13 (4.0%) | 24 (6.2%) |
| 16 and 17 Years | 17 (2.6%) | 0 (0.0%) |
| 18 to 24 Years | 27 (3.6%) | 69 (7.2%) |
| 25 to 34 Years | 25 (4.3%) | 93 (12.9%) |
| 35 to 44 Years | 17 (0.9%) | 80 (3.9%) |
| 45 to 54 Years | 33 (1.0%) | 183 (5.5%) |
| 55 to 64 Years | 33 (1.4%) | 44 (2.0%) |
| 65 to 74 Years | 74 (4.0%) | 101 (4.9%) |
| 75 Years and over | 68 (5.0%) | 255 (15.5%) |
| Total | 467 (2.8%) | 945 (5.4%) |
Income Above Poverty by Sex and Age in Lexington
According to the poverty statistics in Lexington, males aged 35 to 44 years and females aged 16 and 17 years are the age groups that are most secure financially, with 99.1% of males and 100.0% of females in these age groups living above the poverty line.
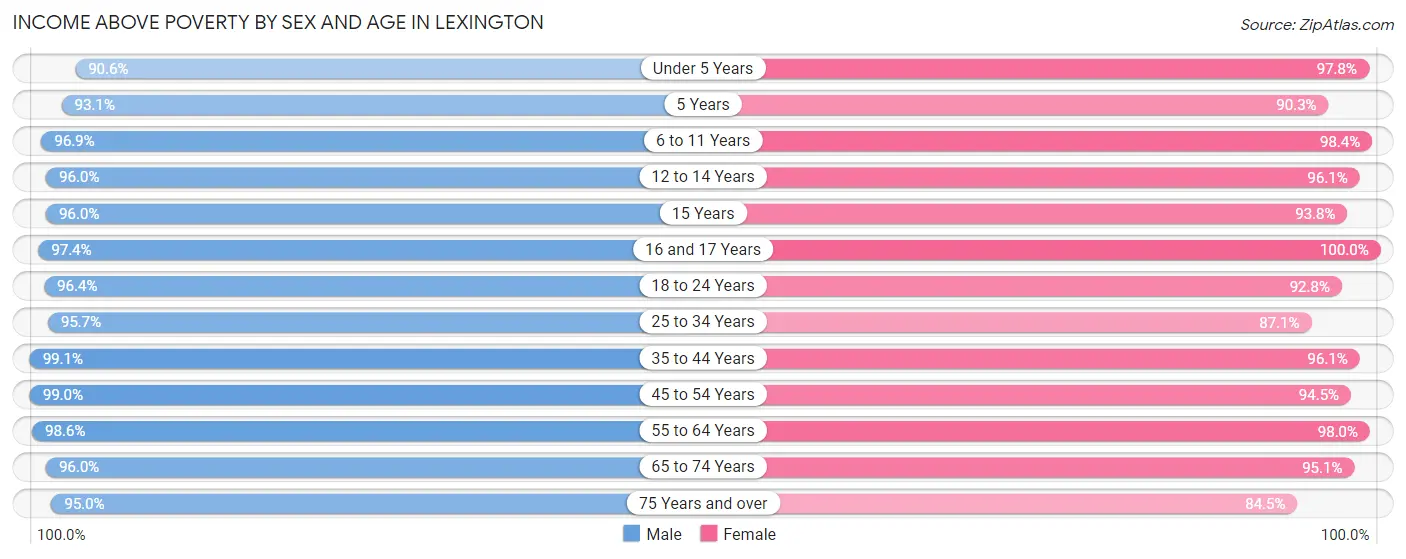
| Age Bracket | Male | Female |
| Under 5 Years | 559 (90.6%) | 582 (97.8%) |
| 5 Years | 163 (93.1%) | 140 (90.3%) |
| 6 to 11 Years | 1,367 (96.9%) | 1,424 (98.4%) |
| 12 to 14 Years | 1,105 (96.0%) | 1,112 (96.1%) |
| 15 Years | 314 (96.0%) | 365 (93.8%) |
| 16 and 17 Years | 647 (97.4%) | 746 (100.0%) |
| 18 to 24 Years | 717 (96.4%) | 888 (92.8%) |
| 25 to 34 Years | 555 (95.7%) | 630 (87.1%) |
| 35 to 44 Years | 1,775 (99.1%) | 1,982 (96.1%) |
| 45 to 54 Years | 3,352 (99.0%) | 3,136 (94.5%) |
| 55 to 64 Years | 2,344 (98.6%) | 2,162 (98.0%) |
| 65 to 74 Years | 1,789 (96.0%) | 1,966 (95.1%) |
| 75 Years and over | 1,301 (95.0%) | 1,394 (84.5%) |
| Total | 15,988 (97.2%) | 16,527 (94.6%) |
Income Below Poverty Among Married-Couple Families in Lexington
The poverty statistics for married-couple families in Lexington show that 1.5% or 136 of the total 8,766 families live below the poverty line. Families with no children have the highest poverty rate of 2.1%, comprising of 87 families. On the other hand, families with 1 or 2 children have the lowest poverty rate of 0.9%, which includes 37 families.
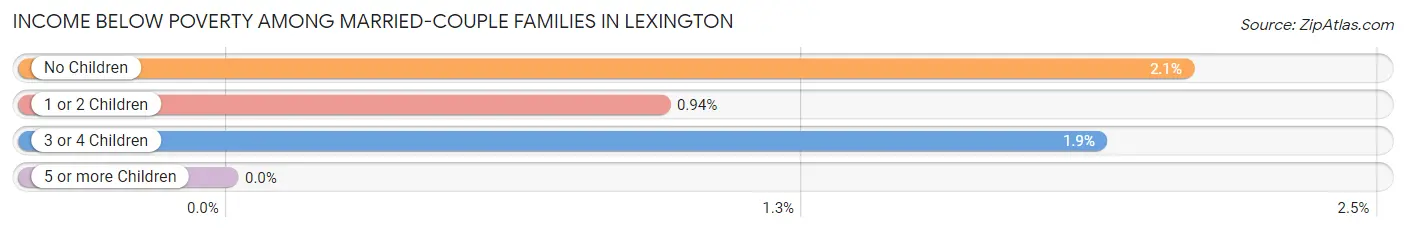
| Children | Above Poverty | Below Poverty |
| No Children | 4,096 (97.9%) | 87 (2.1%) |
| 1 or 2 Children | 3,910 (99.1%) | 37 (0.9%) |
| 3 or 4 Children | 624 (98.1%) | 12 (1.9%) |
| 5 or more Children | 0 (0.0%) | 0 (0.0%) |
| Total | 8,630 (98.5%) | 136 (1.5%) |
Income Below Poverty Among Single-Parent Households in Lexington
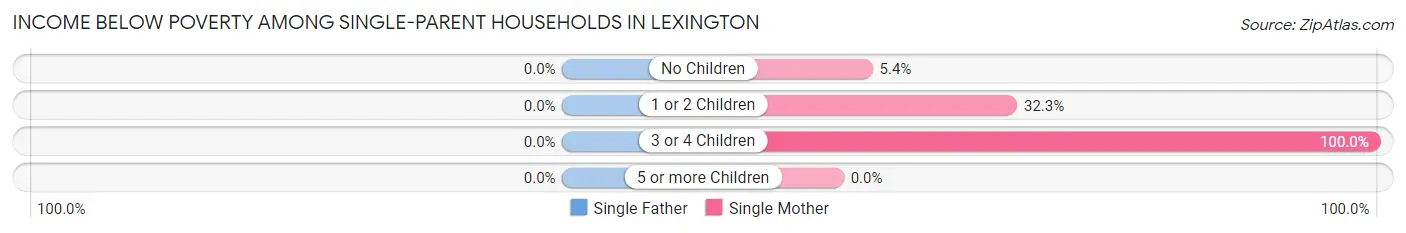
| Children | Single Father | Single Mother |
| No Children | 0 (0.0%) | 9 (5.4%) |
| 1 or 2 Children | 0 (0.0%) | 124 (32.3%) |
| 3 or 4 Children | 0 (0.0%) | 22 (100.0%) |
| 5 or more Children | 0 (0.0%) | 0 (0.0%) |
| Total | 0 (0.0%) | 155 (27.1%) |
Income Below Poverty Among Married-Couple vs Single-Parent Households in Lexington
The poverty data for Lexington shows that 136 of the married-couple family households (1.5%) and 155 of the single-parent households (15.1%) are living below the poverty level. Within the married-couple family households, those with no children have the highest poverty rate, with 87 households (2.1%) falling below the poverty line. Among the single-parent households, those with 3 or 4 children have the highest poverty rate, with 22 household (64.7%) living below poverty.
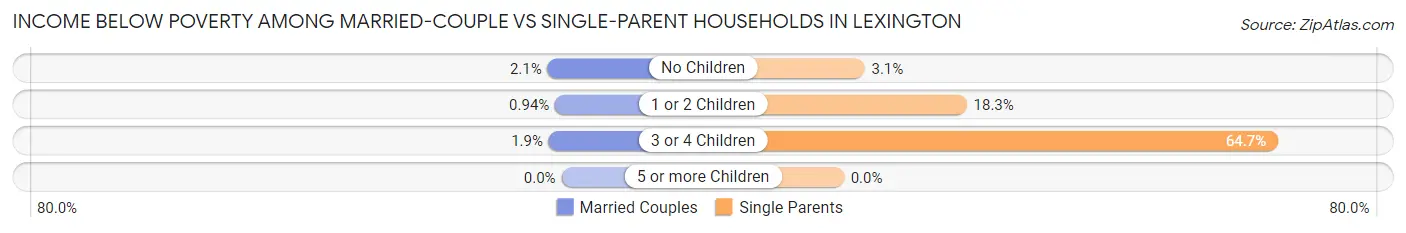
| Children | Married-Couple Families | Single-Parent Households |
| No Children | 87 (2.1%) | 9 (3.1%) |
| 1 or 2 Children | 37 (0.9%) | 124 (18.3%) |
| 3 or 4 Children | 12 (1.9%) | 22 (64.7%) |
| 5 or more Children | 0 (0.0%) | 0 (0.0%) |
| Total | 136 (1.5%) | 155 (15.1%) |
Race in Lexington
The most populous races in Lexington are White / Caucasian (20,085 | 58.7%), Asian (10,822 | 31.6%), and Two or more Races (2,111 | 6.2%).
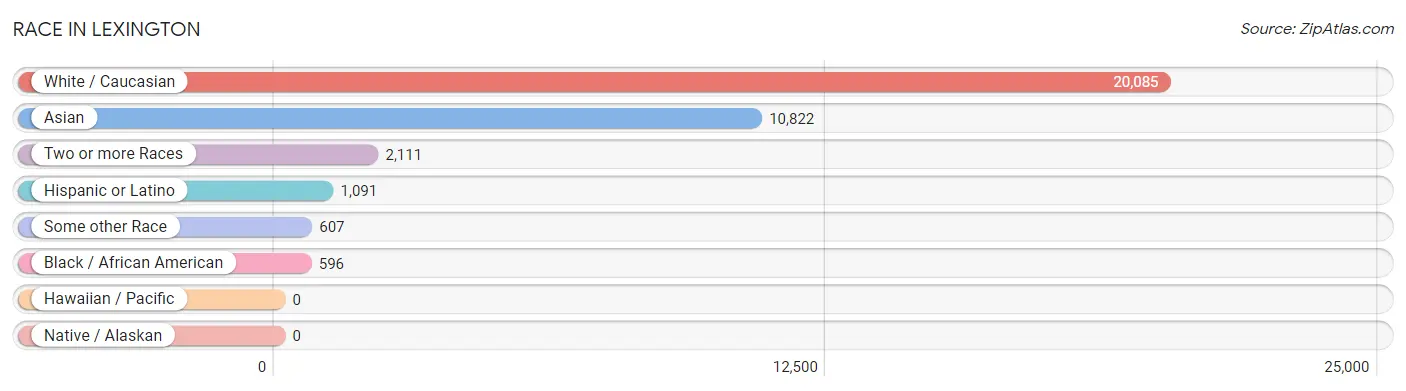
| Race | # Population | % Population |
| Asian | 10,822 | 31.6% |
| Black / African American | 596 | 1.7% |
| Hawaiian / Pacific | 0 | 0.0% |
| Hispanic or Latino | 1,091 | 3.2% |
| Native / Alaskan | 0 | 0.0% |
| White / Caucasian | 20,085 | 58.7% |
| Two or more Races | 2,111 | 6.2% |
| Some other Race | 607 | 1.8% |
| Total | 34,221 | 100.0% |
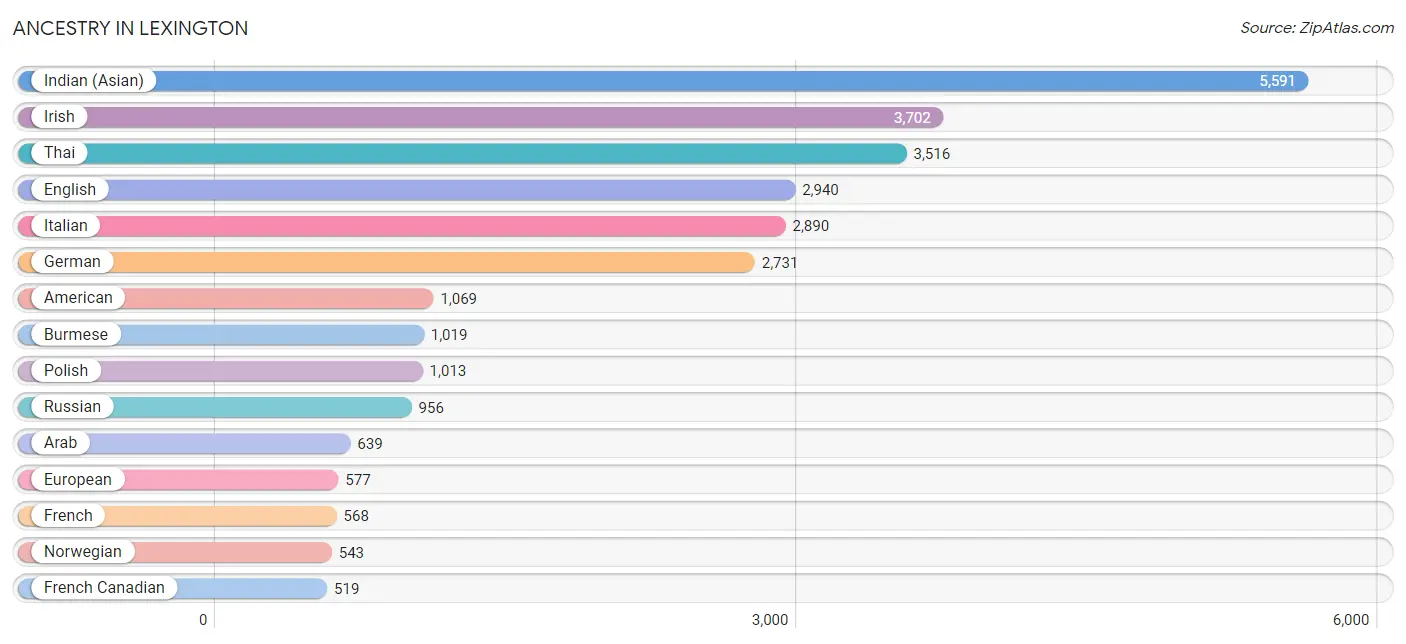
Ancestry in Lexington
The most populous ancestries reported in Lexington are Indian (Asian) (5,591 | 16.3%), Irish (3,702 | 10.8%), Thai (3,516 | 10.3%), English (2,940 | 8.6%), and Italian (2,890 | 8.5%), together accounting for 54.5% of all Lexington residents.
| Ancestry | # Population | % Population |
| African | 102 | 0.3% |
| Albanian | 127 | 0.4% |
| American | 1,069 | 3.1% |
| Arab | 639 | 1.9% |
| Argentinean | 82 | 0.2% |
| Armenian | 243 | 0.7% |
| Austrian | 128 | 0.4% |
| Belgian | 73 | 0.2% |
| Bhutanese | 354 | 1.0% |
| Blackfeet | 20 | 0.1% |
| Brazilian | 173 | 0.5% |
| British | 195 | 0.6% |
| Bulgarian | 177 | 0.5% |
| Burmese | 1,019 | 3.0% |
| Canadian | 122 | 0.4% |
| Cape Verdean | 21 | 0.1% |
| Central American | 68 | 0.2% |
| Cherokee | 32 | 0.1% |
| Chilean | 74 | 0.2% |
| Colombian | 79 | 0.2% |
| Croatian | 5 | 0.0% |
| Cuban | 63 | 0.2% |
| Cypriot | 10 | 0.0% |
| Czech | 48 | 0.1% |
| Danish | 144 | 0.4% |
| Dominican | 12 | 0.0% |
| Dutch | 273 | 0.8% |
| Eastern European | 439 | 1.3% |
| Egyptian | 35 | 0.1% |
| English | 2,940 | 8.6% |
| Ethiopian | 8 | 0.0% |
| European | 577 | 1.7% |
| Filipino | 279 | 0.8% |
| Finnish | 63 | 0.2% |
| French | 568 | 1.7% |
| French Canadian | 519 | 1.5% |
| German | 2,731 | 8.0% |
| Greek | 425 | 1.2% |
| Guatemalan | 9 | 0.0% |
| Hungarian | 275 | 0.8% |
| Indian (Asian) | 5,591 | 16.3% |
| Iranian | 181 | 0.5% |
| Irish | 3,702 | 10.8% |
| Israeli | 212 | 0.6% |
| Italian | 2,890 | 8.5% |
| Jamaican | 38 | 0.1% |
| Japanese | 41 | 0.1% |
| Jordanian | 52 | 0.2% |
| Korean | 87 | 0.3% |
| Laotian | 62 | 0.2% |
| Latvian | 47 | 0.1% |
| Lebanese | 103 | 0.3% |
| Lithuanian | 234 | 0.7% |
| Luxembourger | 19 | 0.1% |
| Mexican | 215 | 0.6% |
| Moroccan | 76 | 0.2% |
| New Zealander | 46 | 0.1% |
| Nigerian | 51 | 0.2% |
| Northern European | 131 | 0.4% |
| Norwegian | 543 | 1.6% |
| Pakistani | 79 | 0.2% |
| Panamanian | 18 | 0.1% |
| Peruvian | 85 | 0.3% |
| Polish | 1,013 | 3.0% |
| Portuguese | 240 | 0.7% |
| Puerto Rican | 277 | 0.8% |
| Romanian | 71 | 0.2% |
| Russian | 956 | 2.8% |
| Salvadoran | 41 | 0.1% |
| Scandinavian | 32 | 0.1% |
| Scotch-Irish | 283 | 0.8% |
| Scottish | 516 | 1.5% |
| Serbian | 46 | 0.1% |
| Sioux | 12 | 0.0% |
| Slovak | 48 | 0.1% |
| Slovene | 46 | 0.1% |
| South American | 330 | 1.0% |
| Spaniard | 22 | 0.1% |
| Spanish | 87 | 0.3% |
| Sri Lankan | 144 | 0.4% |
| Subsaharan African | 196 | 0.6% |
| Swedish | 342 | 1.0% |
| Swiss | 79 | 0.2% |
| Syrian | 198 | 0.6% |
| Thai | 3,516 | 10.3% |
| Turkish | 52 | 0.2% |
| Ukrainian | 415 | 1.2% |
| Uruguayan | 10 | 0.0% |
| Vietnamese | 280 | 0.8% |
| Welsh | 159 | 0.5% | View All 90 Rows |
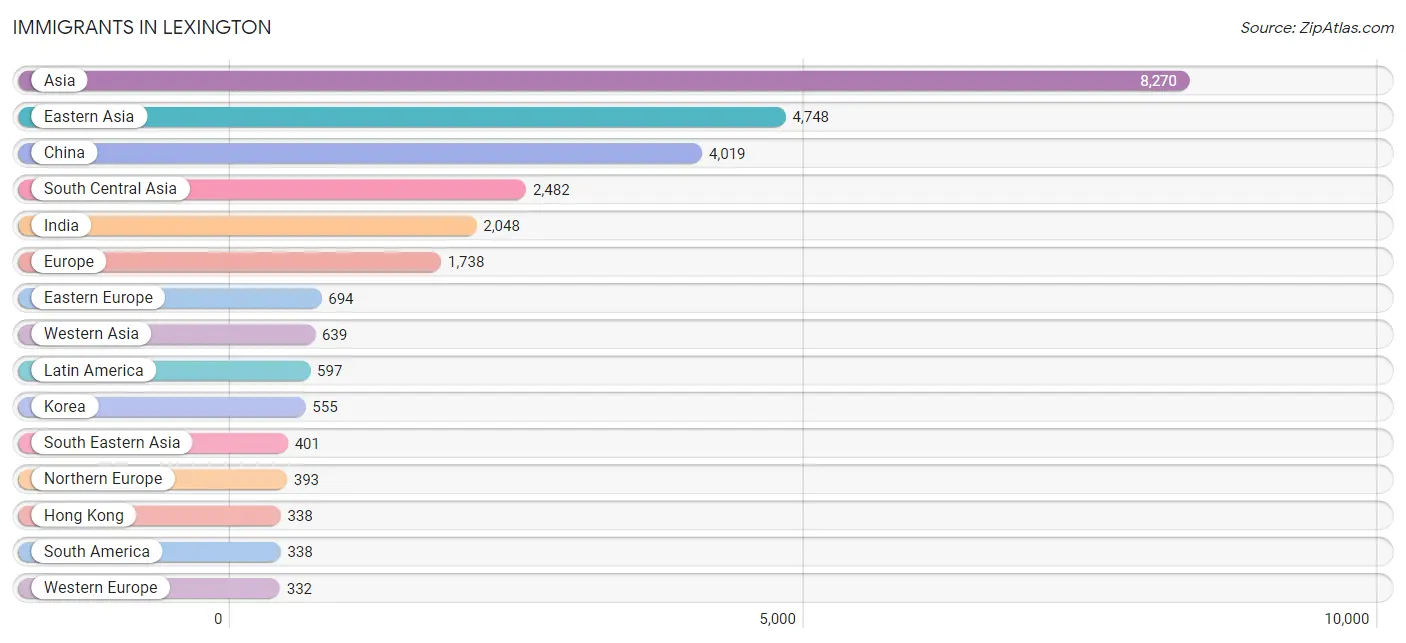
Immigrants in Lexington
The most numerous immigrant groups reported in Lexington came from Asia (8,270 | 24.2%), Eastern Asia (4,748 | 13.9%), China (4,019 | 11.7%), South Central Asia (2,482 | 7.2%), and India (2,048 | 6.0%), together accounting for 63.0% of all Lexington residents.
| Immigration Origin | # Population | % Population |
| Africa | 259 | 0.8% |
| Argentina | 82 | 0.2% |
| Armenia | 156 | 0.5% |
| Asia | 8,270 | 24.2% |
| Australia | 11 | 0.0% |
| Austria | 7 | 0.0% |
| Azores | 20 | 0.1% |
| Bangladesh | 204 | 0.6% |
| Belgium | 29 | 0.1% |
| Brazil | 193 | 0.6% |
| Bulgaria | 61 | 0.2% |
| Cabo Verde | 10 | 0.0% |
| Cambodia | 21 | 0.1% |
| Canada | 320 | 0.9% |
| Caribbean | 60 | 0.2% |
| Central America | 199 | 0.6% |
| Chile | 21 | 0.1% |
| China | 4,019 | 11.7% |
| Colombia | 22 | 0.1% |
| Cuba | 17 | 0.1% |
| Czechoslovakia | 26 | 0.1% |
| Denmark | 73 | 0.2% |
| Dominican Republic | 2 | 0.0% |
| Eastern Africa | 85 | 0.3% |
| Eastern Asia | 4,748 | 13.9% |
| Eastern Europe | 694 | 2.0% |
| Egypt | 36 | 0.1% |
| El Salvador | 26 | 0.1% |
| England | 116 | 0.3% |
| Europe | 1,738 | 5.1% |
| France | 128 | 0.4% |
| Germany | 129 | 0.4% |
| Ghana | 22 | 0.1% |
| Greece | 136 | 0.4% |
| Guatemala | 9 | 0.0% |
| Hong Kong | 338 | 1.0% |
| Hungary | 57 | 0.2% |
| India | 2,048 | 6.0% |
| Indonesia | 34 | 0.1% |
| Iran | 95 | 0.3% |
| Ireland | 21 | 0.1% |
| Israel | 267 | 0.8% |
| Italy | 76 | 0.2% |
| Jamaica | 41 | 0.1% |
| Japan | 174 | 0.5% |
| Jordan | 45 | 0.1% |
| Kenya | 22 | 0.1% |
| Korea | 555 | 1.6% |
| Latin America | 597 | 1.7% |
| Latvia | 16 | 0.1% |
| Lebanon | 39 | 0.1% |
| Lithuania | 31 | 0.1% |
| Malaysia | 34 | 0.1% |
| Mexico | 164 | 0.5% |
| Morocco | 20 | 0.1% |
| Netherlands | 10 | 0.0% |
| Nigeria | 24 | 0.1% |
| Northern Africa | 73 | 0.2% |
| Northern Europe | 393 | 1.1% |
| Norway | 14 | 0.0% |
| Oceania | 73 | 0.2% |
| Pakistan | 83 | 0.2% |
| Philippines | 88 | 0.3% |
| Poland | 126 | 0.4% |
| Portugal | 98 | 0.3% |
| Russia | 301 | 0.9% |
| Saudi Arabia | 19 | 0.1% |
| Singapore | 30 | 0.1% |
| South Africa | 45 | 0.1% |
| South America | 338 | 1.0% |
| South Central Asia | 2,482 | 7.2% |
| South Eastern Asia | 401 | 1.2% |
| Southern Europe | 319 | 0.9% |
| Spain | 9 | 0.0% |
| Sri Lanka | 44 | 0.1% |
| Sweden | 19 | 0.1% |
| Switzerland | 29 | 0.1% |
| Syria | 33 | 0.1% |
| Taiwan | 317 | 0.9% |
| Thailand | 105 | 0.3% |
| Turkey | 9 | 0.0% |
| Uganda | 30 | 0.1% |
| Ukraine | 33 | 0.1% |
| Uruguay | 20 | 0.1% |
| Vietnam | 64 | 0.2% |
| Western Africa | 56 | 0.2% |
| Western Asia | 639 | 1.9% |
| Western Europe | 332 | 1.0% |
| Yemen | 46 | 0.1% | View All 89 Rows |
Sex and Age in Lexington
Sex and Age in Lexington
The most populous age groups in Lexington are 45 to 49 Years (1,855 | 11.2%) for men and 45 to 49 Years (2,070 | 11.7%) for women.
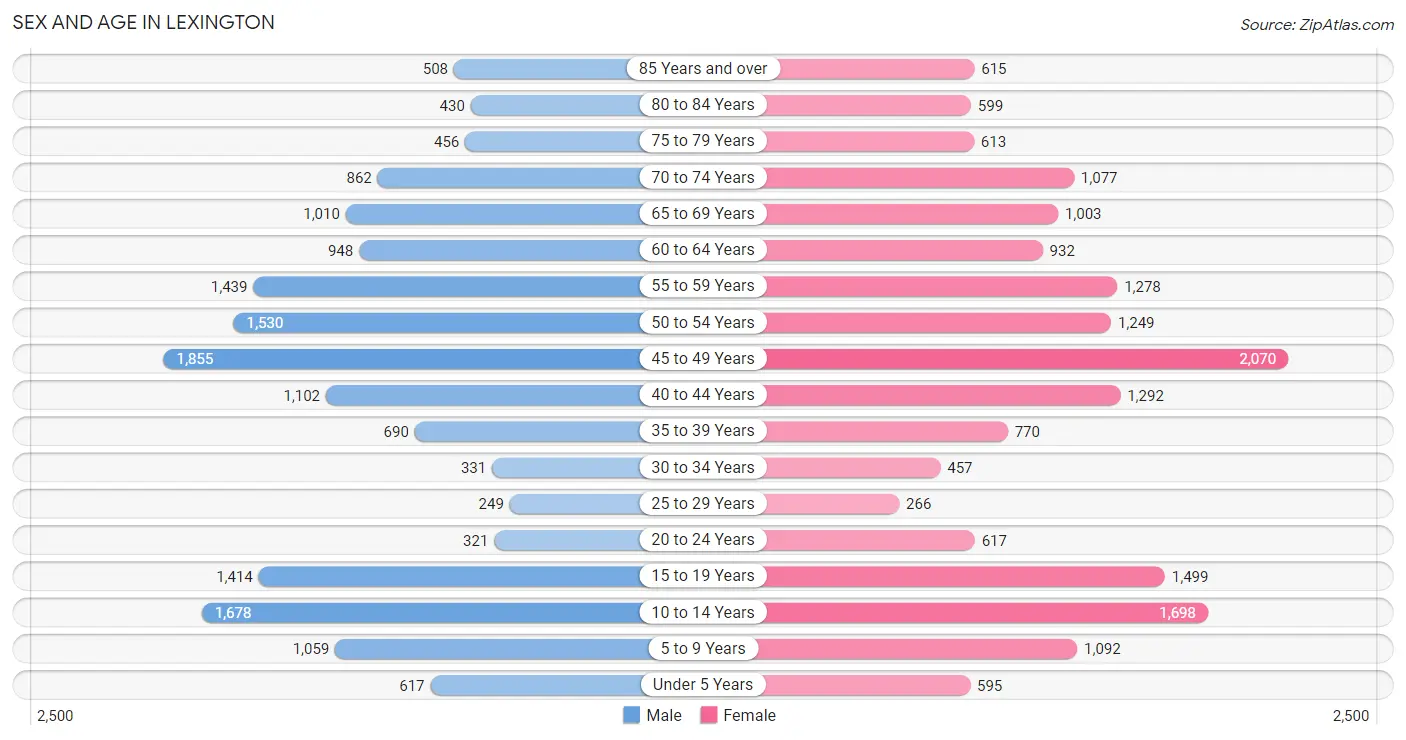
| Age Bracket | Male | Female |
| Under 5 Years | 617 (3.7%) | 595 (3.4%) |
| 5 to 9 Years | 1,059 (6.4%) | 1,092 (6.2%) |
| 10 to 14 Years | 1,678 (10.2%) | 1,698 (9.6%) |
| 15 to 19 Years | 1,414 (8.6%) | 1,499 (8.5%) |
| 20 to 24 Years | 321 (1.9%) | 617 (3.5%) |
| 25 to 29 Years | 249 (1.5%) | 266 (1.5%) |
| 30 to 34 Years | 331 (2.0%) | 457 (2.6%) |
| 35 to 39 Years | 690 (4.2%) | 770 (4.3%) |
| 40 to 44 Years | 1,102 (6.7%) | 1,292 (7.3%) |
| 45 to 49 Years | 1,855 (11.2%) | 2,070 (11.7%) |
| 50 to 54 Years | 1,530 (9.3%) | 1,249 (7.0%) |
| 55 to 59 Years | 1,439 (8.7%) | 1,278 (7.2%) |
| 60 to 64 Years | 948 (5.8%) | 932 (5.3%) |
| 65 to 69 Years | 1,010 (6.1%) | 1,003 (5.7%) |
| 70 to 74 Years | 862 (5.2%) | 1,077 (6.1%) |
| 75 to 79 Years | 456 (2.8%) | 613 (3.5%) |
| 80 to 84 Years | 430 (2.6%) | 599 (3.4%) |
| 85 Years and over | 508 (3.1%) | 615 (3.5%) |
| Total | 16,499 (100.0%) | 17,722 (100.0%) |
Families and Households in Lexington
Median Family Size in Lexington
The median family size in Lexington is 3.11 persons per family, with married-couple families (8,766 | 89.5%) accounting for the largest median family size of 3.17 persons per family. On the other hand, single female/mother families (573 | 5.9%) represent the smallest median family size with 2.61 persons per family.
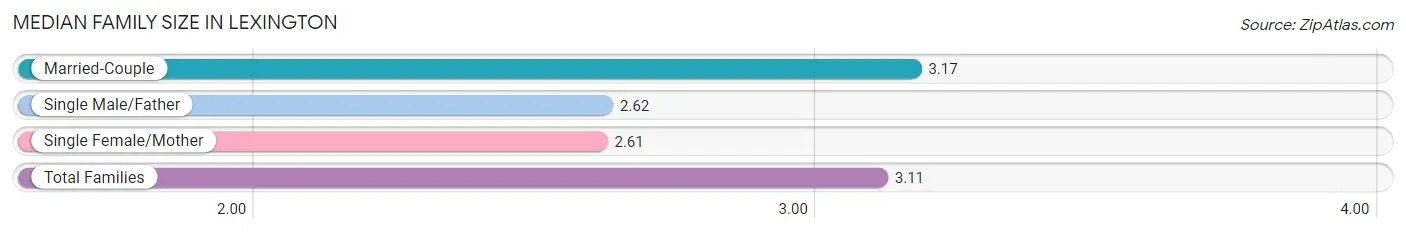
| Family Type | # Families | Family Size |
| Married-Couple | 8,766 (89.5%) | 3.17 |
| Single Male/Father | 452 (4.6%) | 2.62 |
| Single Female/Mother | 573 (5.9%) | 2.61 |
| Total Families | 9,791 (100.0%) | 3.11 |
Median Household Size in Lexington
The median household size in Lexington is 2.73 persons per household, with married-couple households (8,766 | 70.8%) accounting for the largest median household size of 3.18 persons per household. non-family households (2,594 | 20.9%) represent the smallest median household size with 1.15 persons per household.
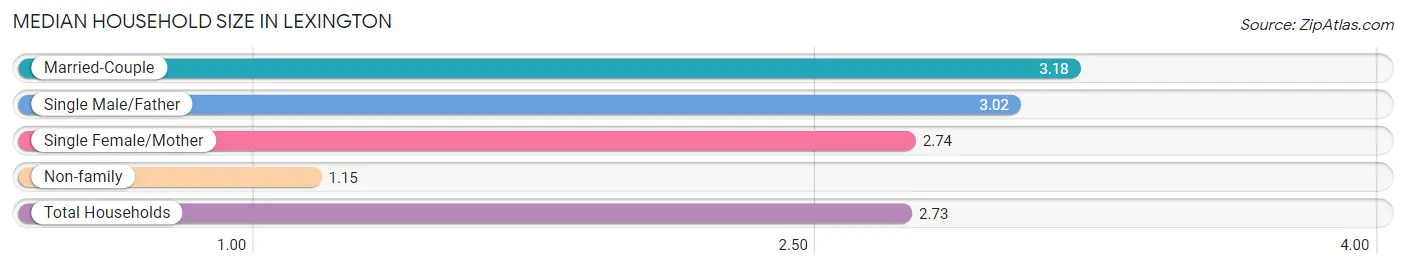
| Household Type | # Households | Household Size |
| Married-Couple | 8,766 (70.8%) | 3.18 |
| Single Male/Father | 452 (3.6%) | 3.02 |
| Single Female/Mother | 573 (4.6%) | 2.74 |
| Non-family | 2,594 (20.9%) | 1.15 |
| Total Households | 12,385 (100.0%) | 2.73 |
Household Size by Marriage Status in Lexington
Out of a total of 12,385 households in Lexington, 9,791 (79.1%) are family households, while 2,594 (20.9%) are nonfamily households. The most numerous type of family households are 2-person households, comprising 3,570, and the most common type of nonfamily households are 1-person households, comprising 2,304.
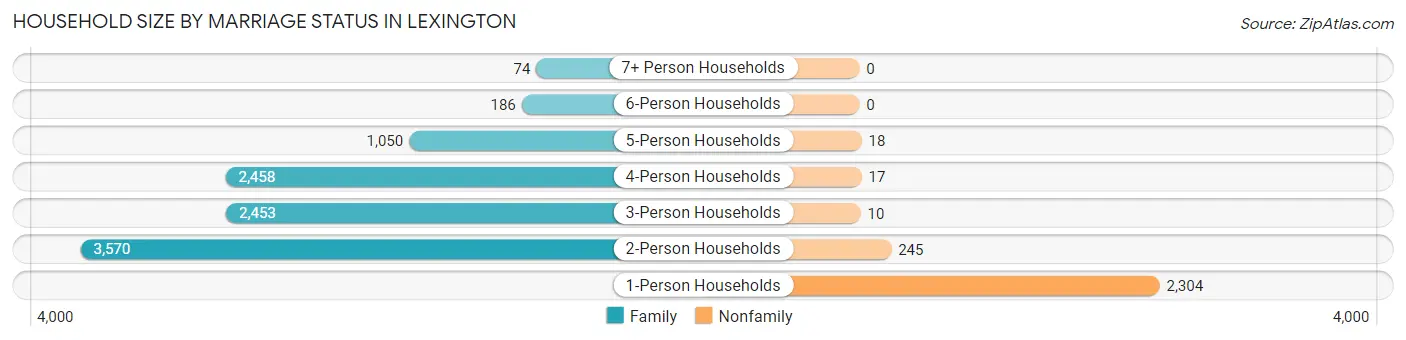
| Household Size | Family Households | Nonfamily Households |
| 1-Person Households | - | 2,304 (18.6%) |
| 2-Person Households | 3,570 (28.8%) | 245 (2.0%) |
| 3-Person Households | 2,453 (19.8%) | 10 (0.1%) |
| 4-Person Households | 2,458 (19.9%) | 17 (0.1%) |
| 5-Person Households | 1,050 (8.5%) | 18 (0.2%) |
| 6-Person Households | 186 (1.5%) | 0 (0.0%) |
| 7+ Person Households | 74 (0.6%) | 0 (0.0%) |
| Total | 9,791 (79.1%) | 2,594 (20.9%) |
Female Fertility in Lexington
Fertility by Age in Lexington
Average fertility rate in Lexington is 30.0 births per 1,000 women. Women in the age bracket of 20 to 34 years have the highest fertility rate with 84.0 births per 1,000 women. Women in the age bracket of 20 to 34 years acount for 52.3% of all women with births.
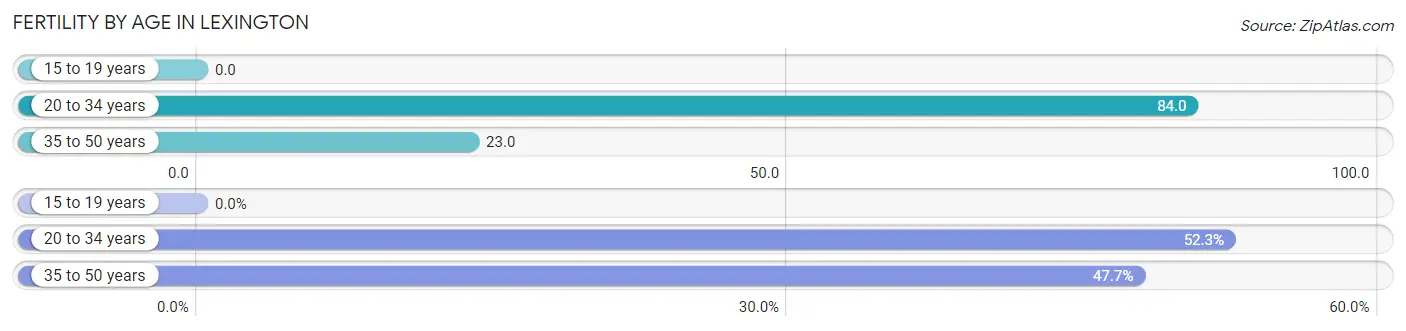
| Age Bracket | Women with Births | Births / 1,000 Women |
| 15 to 19 years | 0 (0.0%) | 0.0 |
| 20 to 34 years | 113 (52.3%) | 84.0 |
| 35 to 50 years | 103 (47.7%) | 23.0 |
| Total | 216 (100.0%) | 30.0 |
Fertility by Age by Marriage Status in Lexington
89.8% of women with births (216) in Lexington are married. The highest percentage of unmarried women with births falls into 20 to 34 years age bracket with 19.5% of them unmarried at the time of birth, while the lowest percentage of unmarried women with births belong to 35 to 50 years age bracket with 0.0% of them unmarried.
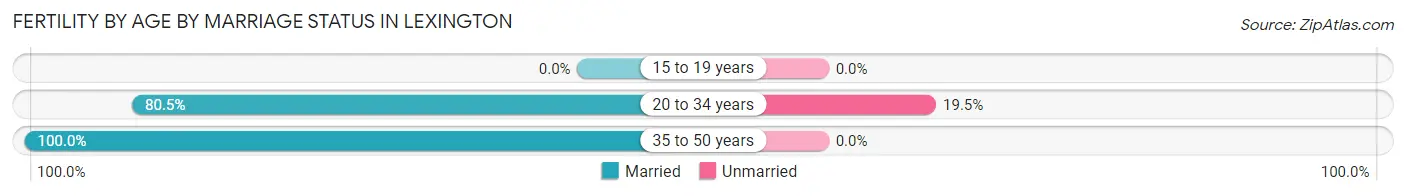
| Age Bracket | Married | Unmarried |
| 15 to 19 years | 0 (0.0%) | 0 (0.0%) |
| 20 to 34 years | 91 (80.5%) | 22 (19.5%) |
| 35 to 50 years | 103 (100.0%) | 0 (0.0%) |
| Total | 194 (89.8%) | 22 (10.2%) |
Fertility by Education in Lexington
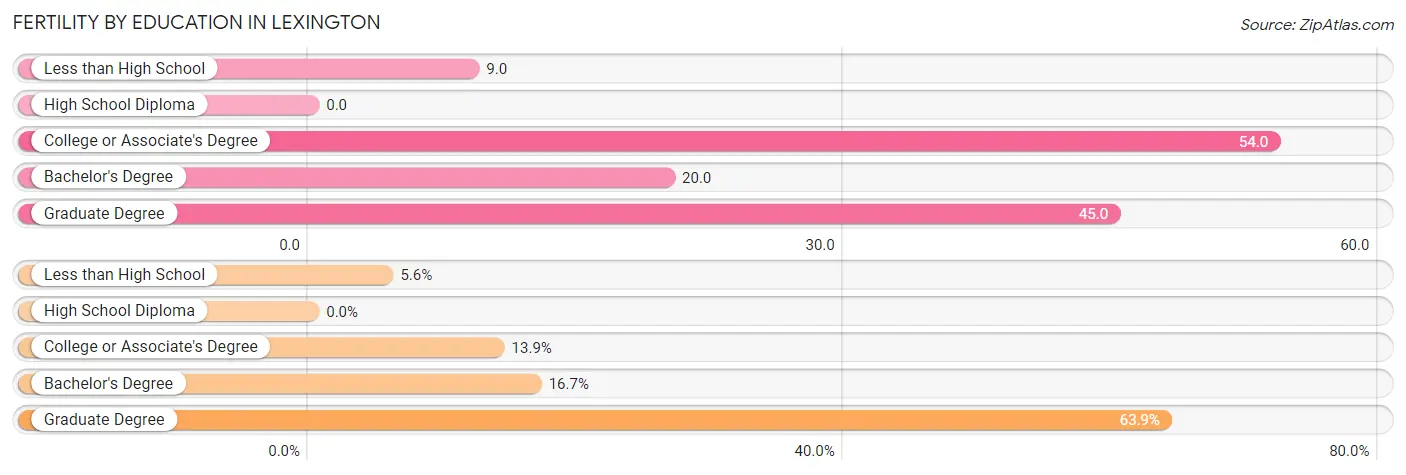
| Educational Attainment | Women with Births | Births / 1,000 Women |
| Less than High School | 12 (5.6%) | 9.0 |
| High School Diploma | 0 (0.0%) | 0.0 |
| College or Associate's Degree | 30 (13.9%) | 54.0 |
| Bachelor's Degree | 36 (16.7%) | 20.0 |
| Graduate Degree | 138 (63.9%) | 45.0 |
| Total | 216 (100.0%) | 30.0 |
Fertility by Education by Marriage Status in Lexington
10.2% of women with births in Lexington are unmarried. Women with the educational attainment of less than high school are most likely to be married with 100.0% of them married at childbirth, while women with the educational attainment of college or associate's degree are least likely to be married with 73.3% of them unmarried at childbirth.
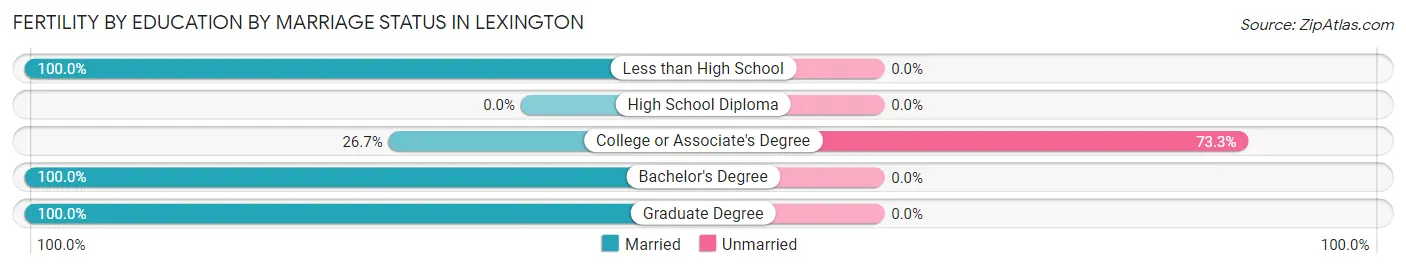
| Educational Attainment | Married | Unmarried |
| Less than High School | 12 (100.0%) | 0 (0.0%) |
| High School Diploma | 0 (0.0%) | 0 (0.0%) |
| College or Associate's Degree | 8 (26.7%) | 22 (73.3%) |
| Bachelor's Degree | 36 (100.0%) | 0 (0.0%) |
| Graduate Degree | 138 (100.0%) | 0 (0.0%) |
| Total | 194 (89.8%) | 22 (10.2%) |
Employment Characteristics in Lexington
Employment by Class of Employer in Lexington
Among the 16,188 employed individuals in Lexington, private company employees (10,619 | 65.6%), not-for-profit organizations (2,326 | 14.4%), and self-employed (not incorporated) (1,237 | 7.6%) make up the most common classes of employment.
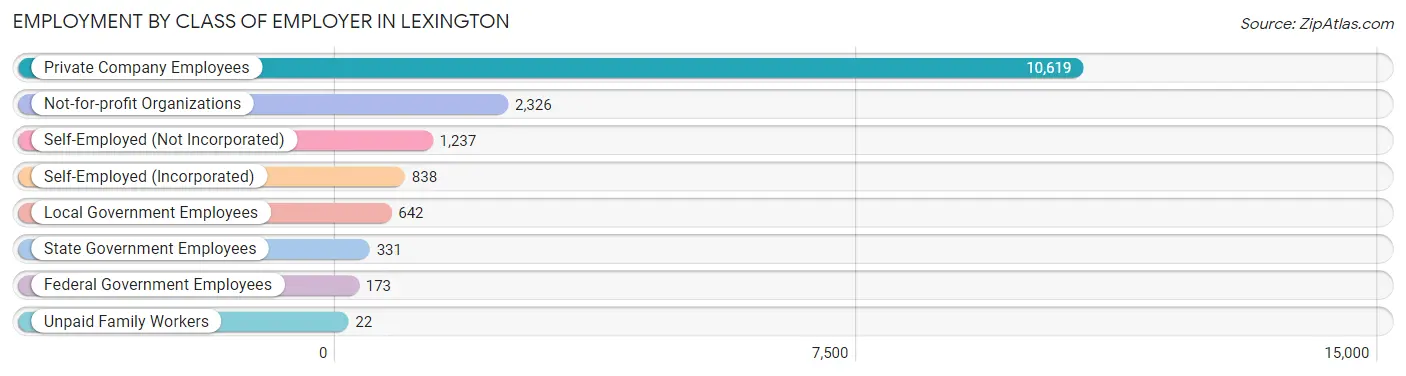
| Employer Class | # Employees | % Employees |
| Private Company Employees | 10,619 | 65.6% |
| Self-Employed (Incorporated) | 838 | 5.2% |
| Self-Employed (Not Incorporated) | 1,237 | 7.6% |
| Not-for-profit Organizations | 2,326 | 14.4% |
| Local Government Employees | 642 | 4.0% |
| State Government Employees | 331 | 2.0% |
| Federal Government Employees | 173 | 1.1% |
| Unpaid Family Workers | 22 | 0.1% |
| Total | 16,188 | 100.0% |
Employment Status by Age in Lexington
According to the labor force statistics for Lexington, out of the total population over 16 years of age (26,749), 63.5% or 16,986 individuals are in the labor force, with 3.7% or 628 of them unemployed. The age group with the highest labor force participation rate is 45 to 54 years, with 85.5% or 5,732 individuals in the labor force. Within the labor force, the 20 to 24 years age range has the highest percentage of unemployed individuals, with 10.6% or 76 of them being unemployed.
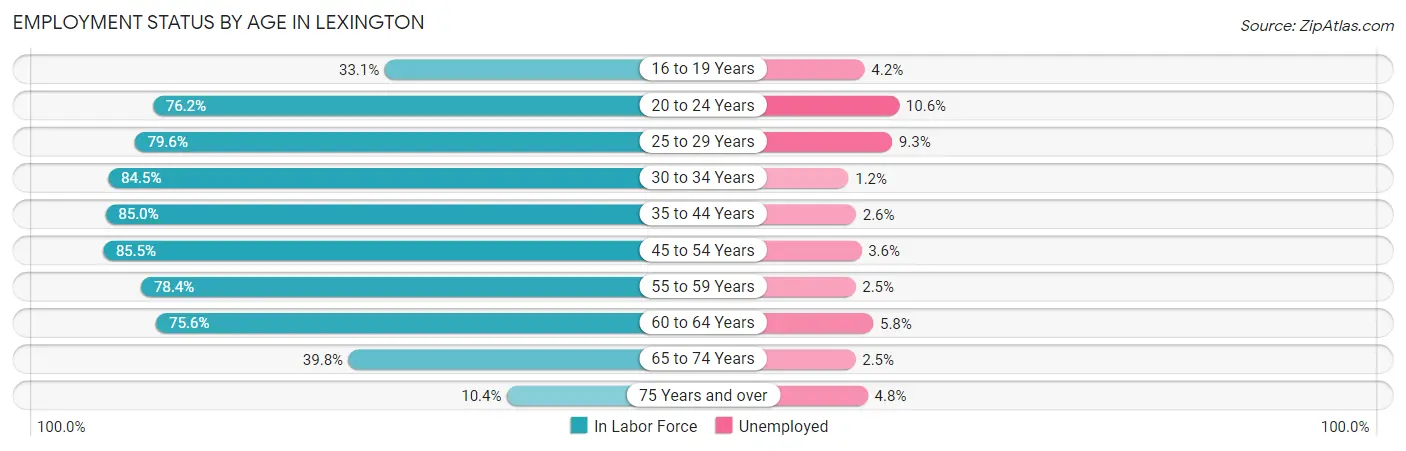
| Age Bracket | In Labor Force | Unemployed |
| 16 to 19 Years | 722 (33.1%) | 30 (4.2%) |
| 20 to 24 Years | 715 (76.2%) | 76 (10.6%) |
| 25 to 29 Years | 410 (79.6%) | 38 (9.3%) |
| 30 to 34 Years | 666 (84.5%) | 8 (1.2%) |
| 35 to 44 Years | 3,276 (85.0%) | 85 (2.6%) |
| 45 to 54 Years | 5,732 (85.5%) | 206 (3.6%) |
| 55 to 59 Years | 2,130 (78.4%) | 53 (2.5%) |
| 60 to 64 Years | 1,421 (75.6%) | 82 (5.8%) |
| 65 to 74 Years | 1,573 (39.8%) | 39 (2.5%) |
| 75 Years and over | 335 (10.4%) | 16 (4.8%) |
| Total | 16,986 (63.5%) | 628 (3.7%) |
Employment Status by Educational Attainment in Lexington
According to labor force statistics for Lexington, 82.9% of individuals (13,644) out of the total population between 25 and 64 years of age (16,458) are in the labor force, with 3.4% or 464 of them being unemployed. The group with the highest labor force participation rate are those with the educational attainment of bachelor's degree or higher, with 85.7% or 12,289 individuals in the labor force. Within the labor force, individuals with less than high school education have the highest percentage of unemployment, with 13.4% or 17 of them being unemployed.
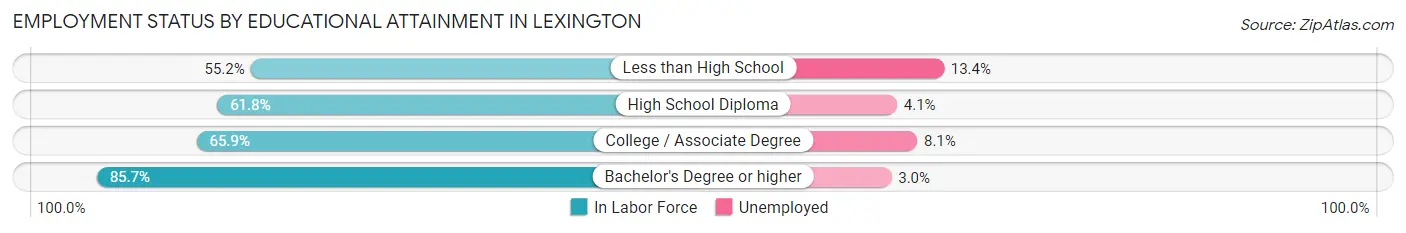
| Educational Attainment | In Labor Force | Unemployed |
| Less than High School | 127 (55.2%) | 31 (13.4%) |
| High School Diploma | 439 (61.8%) | 29 (4.1%) |
| College / Associate Degree | 777 (65.9%) | 95 (8.1%) |
| Bachelor's Degree or higher | 12,289 (85.7%) | 430 (3.0%) |
| Total | 13,644 (82.9%) | 560 (3.4%) |
Employment Occupations by Sex in Lexington
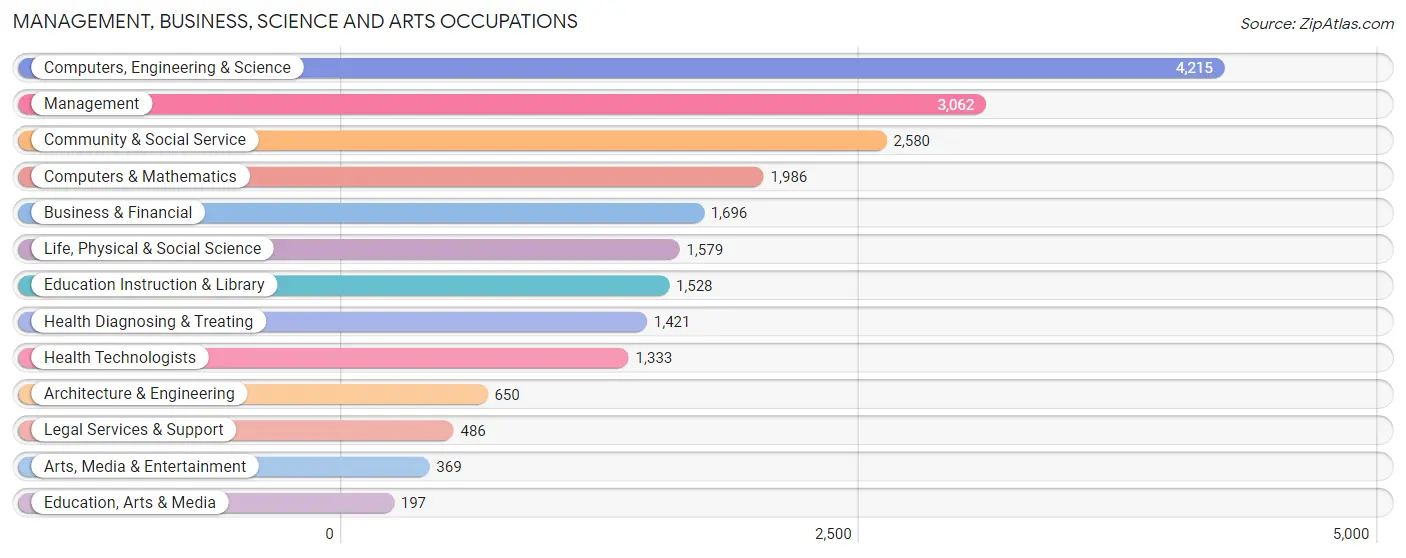
Management, Business, Science and Arts Occupations
The most common Management, Business, Science and Arts occupations in Lexington are Computers, Engineering & Science (4,215 | 25.8%), Management (3,062 | 18.7%), Community & Social Service (2,580 | 15.8%), Computers & Mathematics (1,986 | 12.1%), and Business & Financial (1,696 | 10.4%).
Management, Business, Science and Arts Occupations by Sex
Within the Management, Business, Science and Arts occupations in Lexington, the most male-oriented occupations are Architecture & Engineering (80.5%), Legal Services & Support (71.0%), and Management (63.6%), while the most female-oriented occupations are Education, Arts & Media (82.7%), Arts, Media & Entertainment (81.8%), and Health Diagnosing & Treating (56.2%).
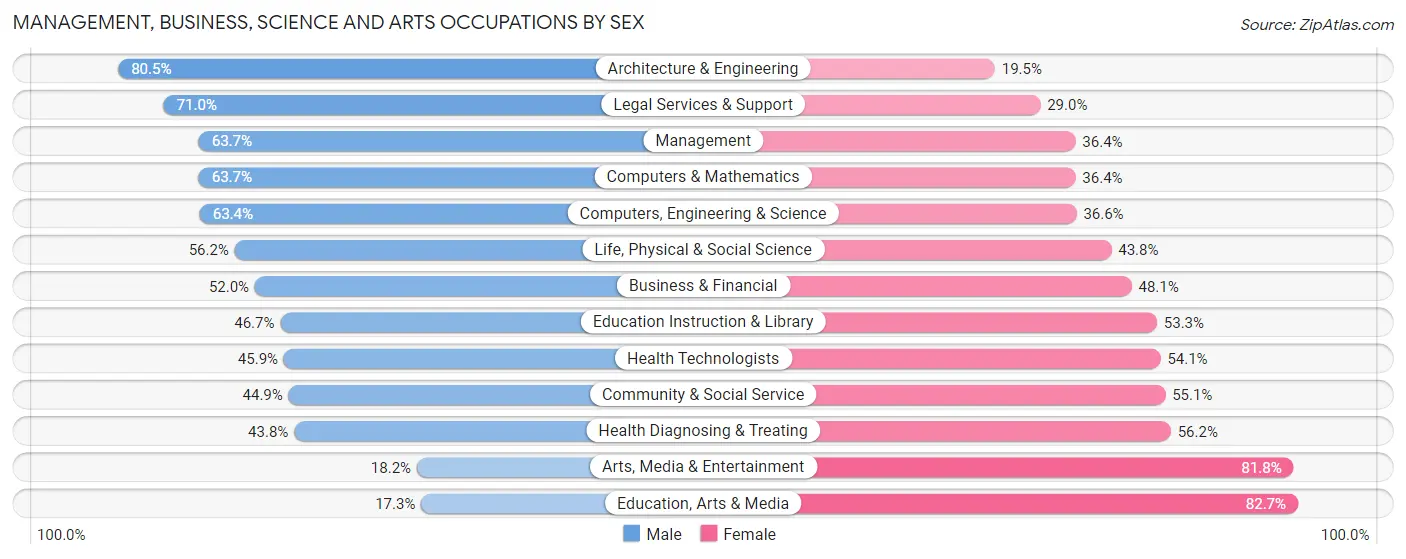
| Occupation | Male | Female |
| Management | 1,949 (63.6%) | 1,113 (36.3%) |
| Business & Financial | 881 (51.9%) | 815 (48.0%) |
| Computers, Engineering & Science | 2,674 (63.4%) | 1,541 (36.6%) |
| Computers & Mathematics | 1,264 (63.6%) | 722 (36.3%) |
| Architecture & Engineering | 523 (80.5%) | 127 (19.5%) |
| Life, Physical & Social Science | 887 (56.2%) | 692 (43.8%) |
| Community & Social Service | 1,159 (44.9%) | 1,421 (55.1%) |
| Education, Arts & Media | 34 (17.3%) | 163 (82.7%) |
| Legal Services & Support | 345 (71.0%) | 141 (29.0%) |
| Education Instruction & Library | 713 (46.7%) | 815 (53.3%) |
| Arts, Media & Entertainment | 67 (18.2%) | 302 (81.8%) |
| Health Diagnosing & Treating | 622 (43.8%) | 799 (56.2%) |
| Health Technologists | 612 (45.9%) | 721 (54.1%) |
| Total (Category) | 7,285 (56.1%) | 5,689 (43.9%) |
| Total (Overall) | 8,913 (54.5%) | 7,437 (45.5%) |
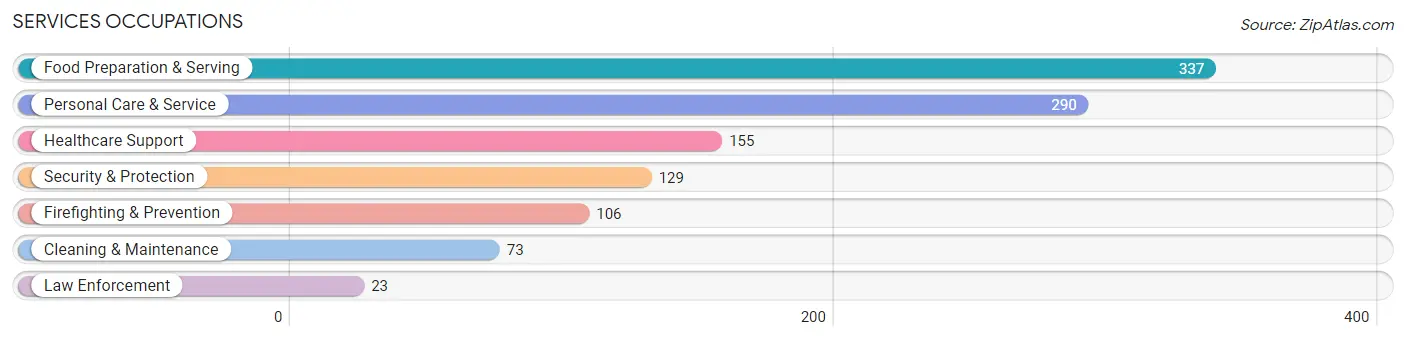
Services Occupations
The most common Services occupations in Lexington are Food Preparation & Serving (337 | 2.1%), Personal Care & Service (290 | 1.8%), Healthcare Support (155 | 0.9%), Security & Protection (129 | 0.8%), and Firefighting & Prevention (106 | 0.6%).
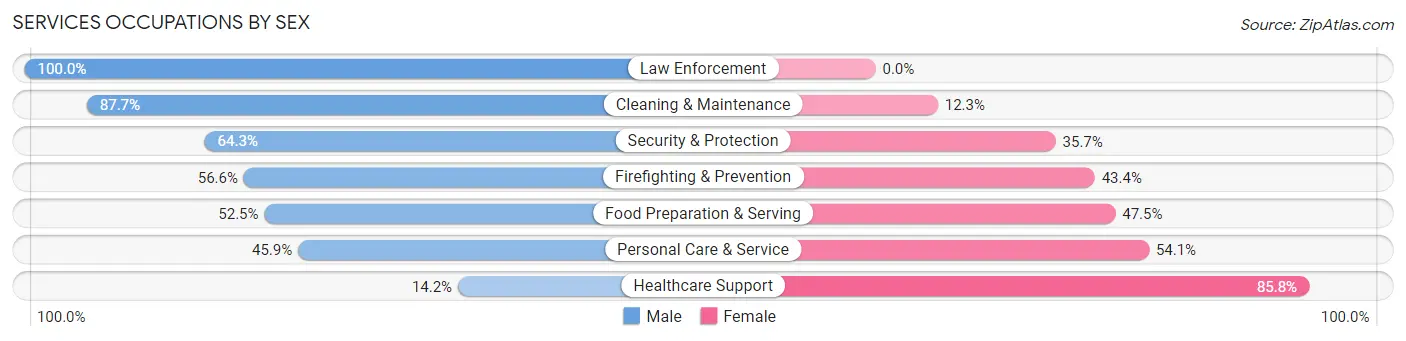
Services Occupations by Sex
Within the Services occupations in Lexington, the most male-oriented occupations are Law Enforcement (100.0%), Cleaning & Maintenance (87.7%), and Security & Protection (64.3%), while the most female-oriented occupations are Healthcare Support (85.8%), Personal Care & Service (54.1%), and Food Preparation & Serving (47.5%).
| Occupation | Male | Female |
| Healthcare Support | 22 (14.2%) | 133 (85.8%) |
| Security & Protection | 83 (64.3%) | 46 (35.7%) |
| Firefighting & Prevention | 60 (56.6%) | 46 (43.4%) |
| Law Enforcement | 23 (100.0%) | 0 (0.0%) |
| Food Preparation & Serving | 177 (52.5%) | 160 (47.5%) |
| Cleaning & Maintenance | 64 (87.7%) | 9 (12.3%) |
| Personal Care & Service | 133 (45.9%) | 157 (54.1%) |
| Total (Category) | 479 (48.7%) | 505 (51.3%) |
| Total (Overall) | 8,913 (54.5%) | 7,437 (45.5%) |
Sales and Office Occupations
The most common Sales and Office occupations in Lexington are Sales & Related (953 | 5.8%), and Office & Administration (807 | 4.9%).

Sales and Office Occupations by Sex
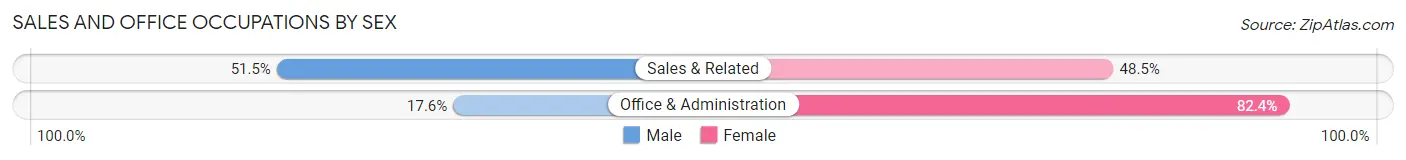
| Occupation | Male | Female |
| Sales & Related | 491 (51.5%) | 462 (48.5%) |
| Office & Administration | 142 (17.6%) | 665 (82.4%) |
| Total (Category) | 633 (36.0%) | 1,127 (64.0%) |
| Total (Overall) | 8,913 (54.5%) | 7,437 (45.5%) |
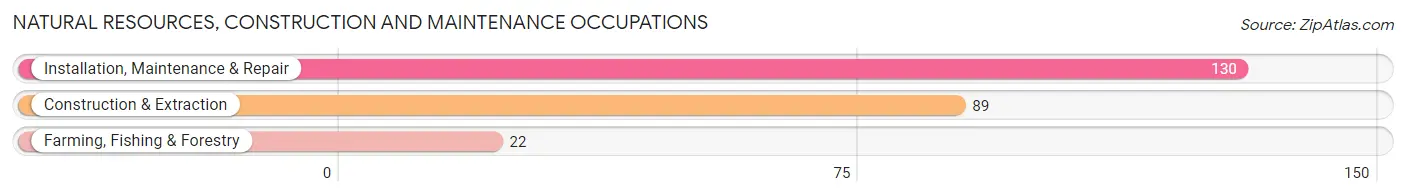
Natural Resources, Construction and Maintenance Occupations
The most common Natural Resources, Construction and Maintenance occupations in Lexington are Installation, Maintenance & Repair (130 | 0.8%), Construction & Extraction (89 | 0.5%), and Farming, Fishing & Forestry (22 | 0.1%).
Natural Resources, Construction and Maintenance Occupations by Sex
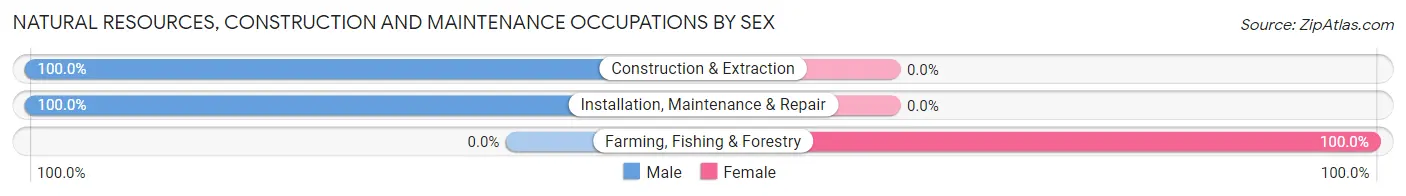
| Occupation | Male | Female |
| Farming, Fishing & Forestry | 0 (0.0%) | 22 (100.0%) |
| Construction & Extraction | 89 (100.0%) | 0 (0.0%) |
| Installation, Maintenance & Repair | 130 (100.0%) | 0 (0.0%) |
| Total (Category) | 219 (90.9%) | 22 (9.1%) |
| Total (Overall) | 8,913 (54.5%) | 7,437 (45.5%) |
Production, Transportation and Moving Occupations
The most common Production, Transportation and Moving occupations in Lexington are Production (219 | 1.3%), Transportation (119 | 0.7%), and Material Moving (53 | 0.3%).
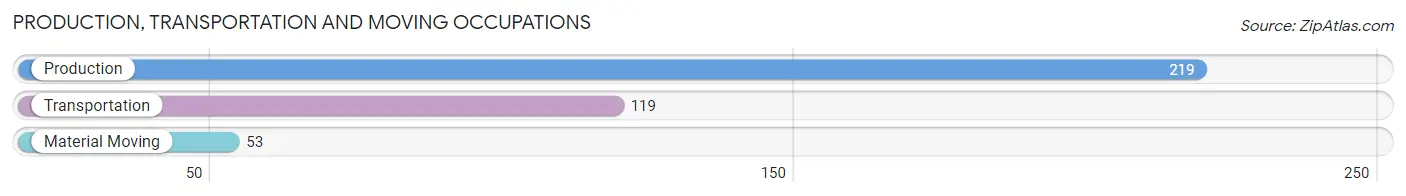
Production, Transportation and Moving Occupations by Sex
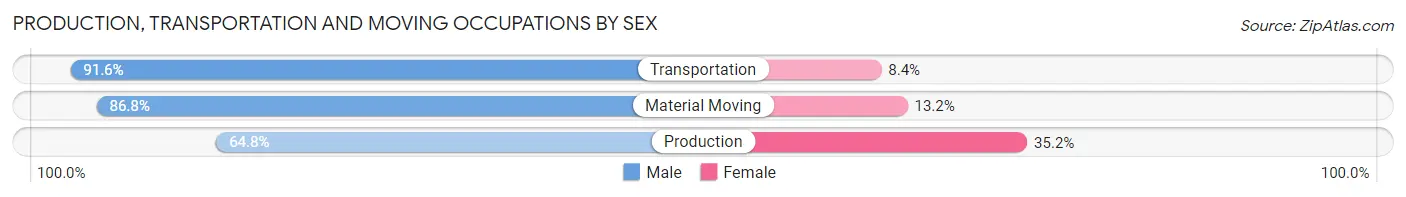
| Occupation | Male | Female |
| Production | 142 (64.8%) | 77 (35.2%) |
| Transportation | 109 (91.6%) | 10 (8.4%) |
| Material Moving | 46 (86.8%) | 7 (13.2%) |
| Total (Category) | 297 (76.0%) | 94 (24.0%) |
| Total (Overall) | 8,913 (54.5%) | 7,437 (45.5%) |
Employment Industries by Sex in Lexington
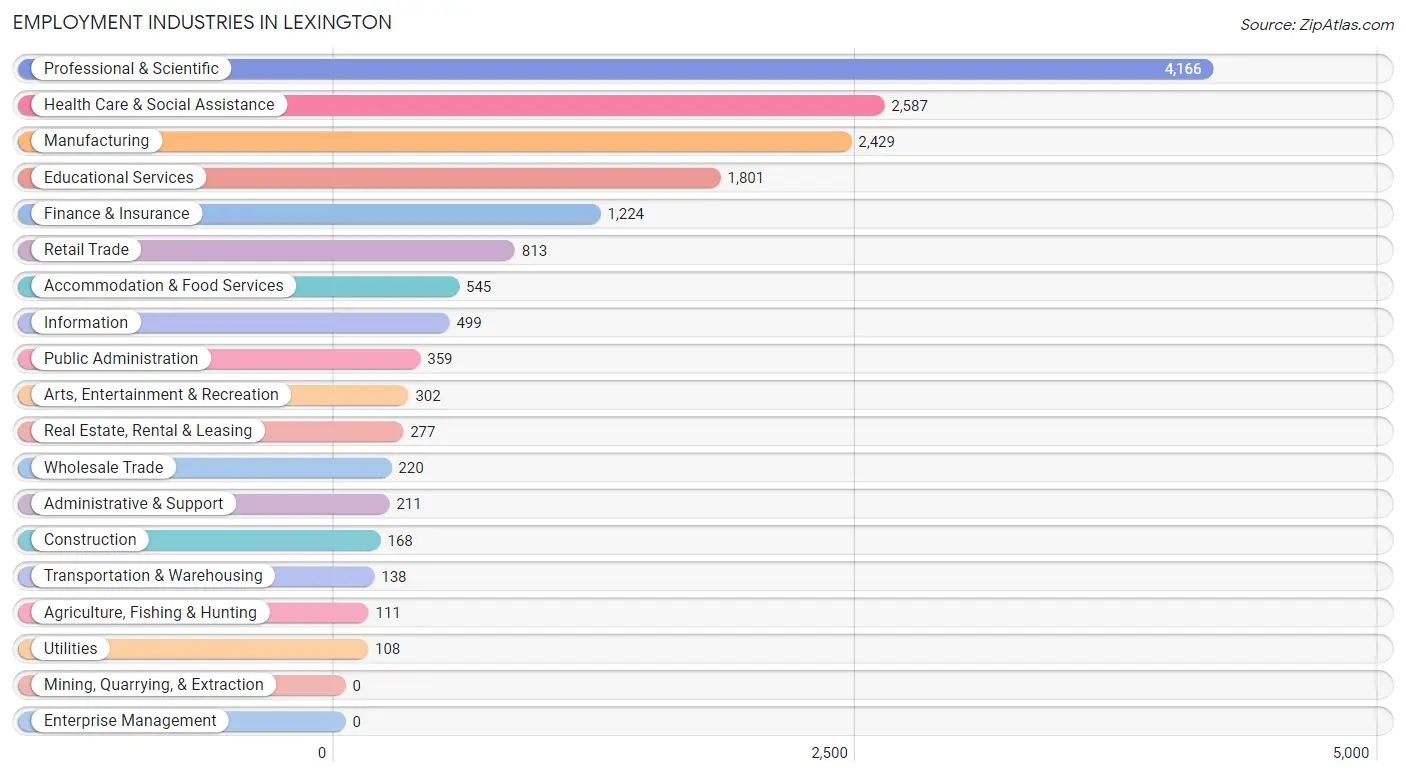
Employment Industries in Lexington
The major employment industries in Lexington include Professional & Scientific (4,166 | 25.5%), Health Care & Social Assistance (2,587 | 15.8%), Manufacturing (2,429 | 14.9%), Educational Services (1,801 | 11.0%), and Finance & Insurance (1,224 | 7.5%).
Employment Industries by Sex in Lexington
The Lexington industries that see more men than women are Construction (82.7%), Transportation & Warehousing (81.9%), and Wholesale Trade (75.4%), whereas the industries that tend to have a higher number of women are Real Estate, Rental & Leasing (74.0%), Health Care & Social Assistance (65.2%), and Public Administration (53.2%).
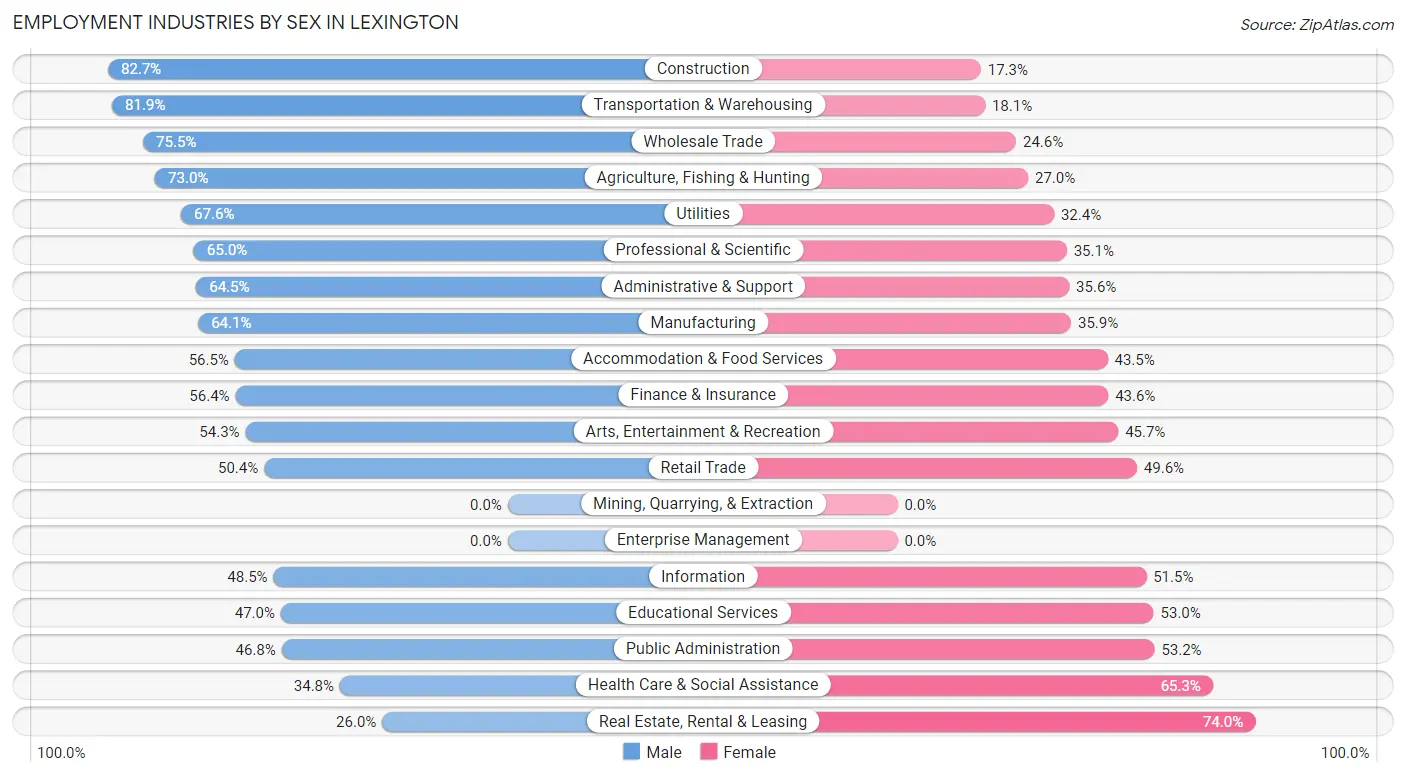
| Industry | Male | Female |
| Agriculture, Fishing & Hunting | 81 (73.0%) | 30 (27.0%) |
| Mining, Quarrying, & Extraction | 0 (0.0%) | 0 (0.0%) |
| Construction | 139 (82.7%) | 29 (17.3%) |
| Manufacturing | 1,556 (64.1%) | 873 (35.9%) |
| Wholesale Trade | 166 (75.4%) | 54 (24.5%) |
| Retail Trade | 410 (50.4%) | 403 (49.6%) |
| Transportation & Warehousing | 113 (81.9%) | 25 (18.1%) |
| Utilities | 73 (67.6%) | 35 (32.4%) |
| Information | 242 (48.5%) | 257 (51.5%) |
| Finance & Insurance | 690 (56.4%) | 534 (43.6%) |
| Real Estate, Rental & Leasing | 72 (26.0%) | 205 (74.0%) |
| Professional & Scientific | 2,706 (64.9%) | 1,460 (35.0%) |
| Enterprise Management | 0 (0.0%) | 0 (0.0%) |
| Administrative & Support | 136 (64.4%) | 75 (35.5%) |
| Educational Services | 846 (47.0%) | 955 (53.0%) |
| Health Care & Social Assistance | 899 (34.7%) | 1,688 (65.2%) |
| Arts, Entertainment & Recreation | 164 (54.3%) | 138 (45.7%) |
| Accommodation & Food Services | 308 (56.5%) | 237 (43.5%) |
| Public Administration | 168 (46.8%) | 191 (53.2%) |
| Total | 8,913 (54.5%) | 7,437 (45.5%) |
Education in Lexington
School Enrollment in Lexington
The most common levels of schooling among the 9,664 students in Lexington are high school (2,917 | 30.2%), middle school (2,645 | 27.4%), and elementary school (2,019 | 20.9%).
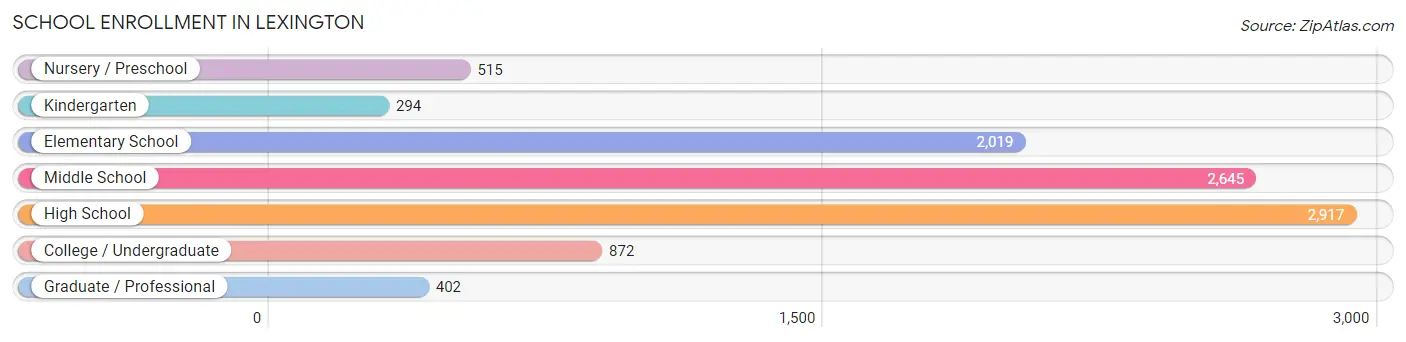
| School Level | # Students | % Students |
| Nursery / Preschool | 515 | 5.3% |
| Kindergarten | 294 | 3.0% |
| Elementary School | 2,019 | 20.9% |
| Middle School | 2,645 | 27.4% |
| High School | 2,917 | 30.2% |
| College / Undergraduate | 872 | 9.0% |
| Graduate / Professional | 402 | 4.2% |
| Total | 9,664 | 100.0% |
School Enrollment by Age by Funding Source in Lexington
Out of a total of 9,664 students who are enrolled in schools in Lexington, 2,068 (21.4%) attend a private institution, while the remaining 7,596 (78.6%) are enrolled in public schools. The age group of 3 to 4 year olds has the highest likelihood of being enrolled in private schools, with 388 (86.4% in the age bracket) enrolled. Conversely, the age group of 10 to 14 year olds has the lowest likelihood of being enrolled in a private school, with 3,037 (92.1% in the age bracket) attending a public institution.
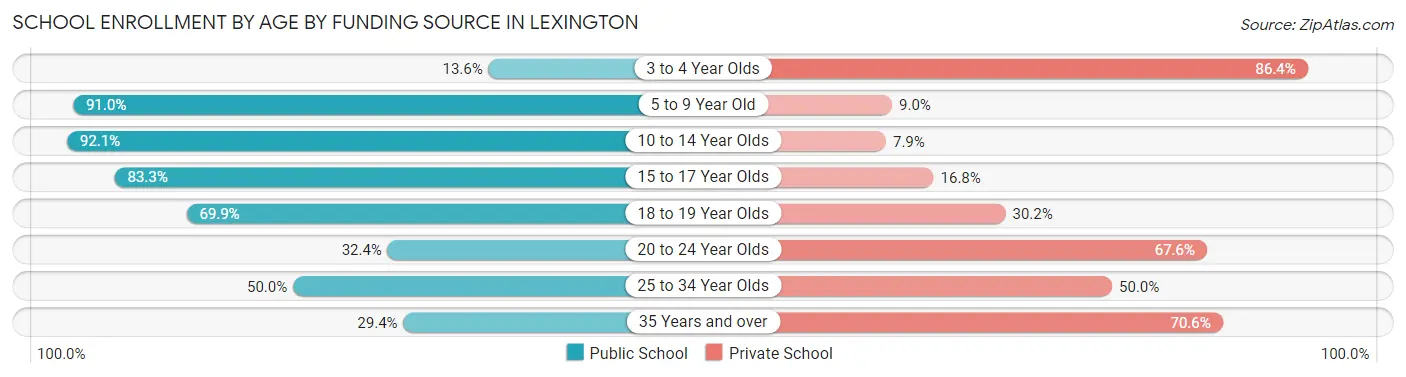
| Age Bracket | Public School | Private School |
| 3 to 4 Year Olds | 61 (13.6%) | 388 (86.4%) |
| 5 to 9 Year Old | 1,877 (91.0%) | 186 (9.0%) |
| 10 to 14 Year Olds | 3,037 (92.1%) | 260 (7.9%) |
| 15 to 17 Year Olds | 1,779 (83.3%) | 358 (16.8%) |
| 18 to 19 Year Olds | 519 (69.9%) | 224 (30.1%) |
| 20 to 24 Year Olds | 134 (32.4%) | 280 (67.6%) |
| 25 to 34 Year Olds | 58 (50.0%) | 58 (50.0%) |
| 35 Years and over | 131 (29.4%) | 314 (70.6%) |
| Total | 7,596 (78.6%) | 2,068 (21.4%) |
Educational Attainment by Field of Study in Lexington
Engineering (3,729 | 17.4%), social sciences (2,369 | 11.1%), physical & health sciences (2,183 | 10.2%), bio, nature & agricultural (2,143 | 10.0%), and business (1,856 | 8.7%) are the most common fields of study among 21,439 individuals in Lexington who have obtained a bachelor's degree or higher.
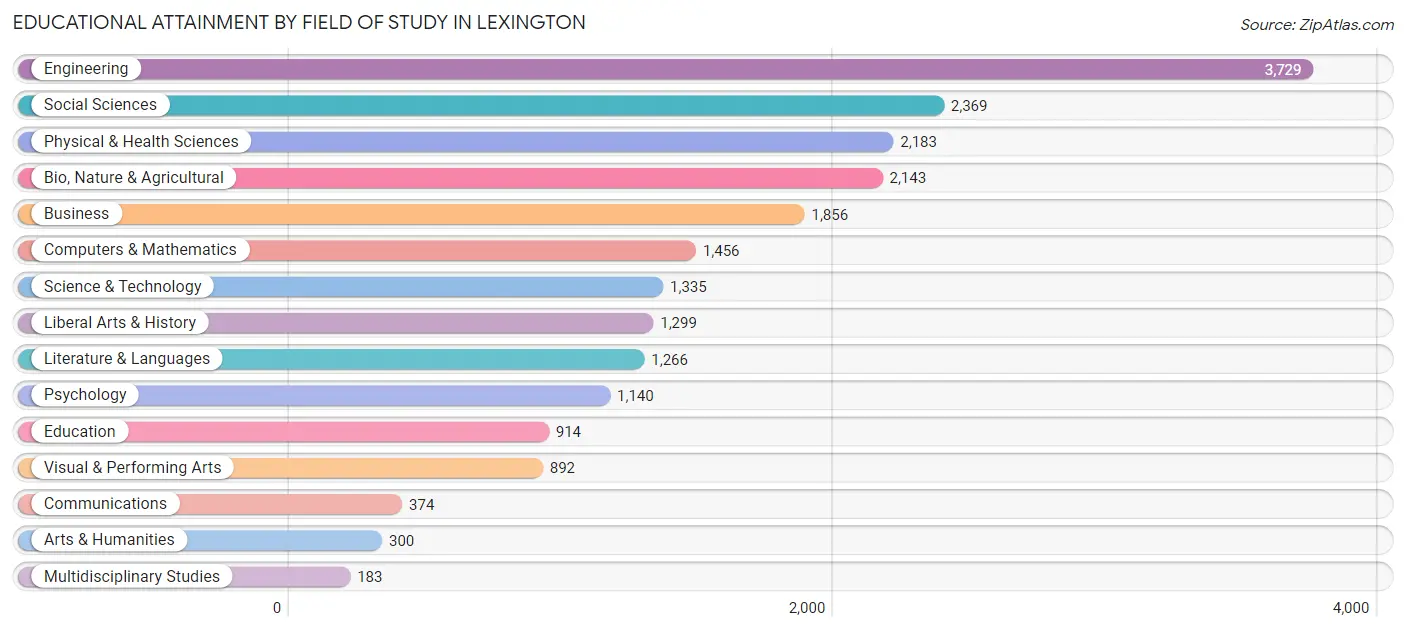
| Field of Study | # Graduates | % Graduates |
| Computers & Mathematics | 1,456 | 6.8% |
| Bio, Nature & Agricultural | 2,143 | 10.0% |
| Physical & Health Sciences | 2,183 | 10.2% |
| Psychology | 1,140 | 5.3% |
| Social Sciences | 2,369 | 11.1% |
| Engineering | 3,729 | 17.4% |
| Multidisciplinary Studies | 183 | 0.9% |
| Science & Technology | 1,335 | 6.2% |
| Business | 1,856 | 8.7% |
| Education | 914 | 4.3% |
| Literature & Languages | 1,266 | 5.9% |
| Liberal Arts & History | 1,299 | 6.1% |
| Visual & Performing Arts | 892 | 4.2% |
| Communications | 374 | 1.7% |
| Arts & Humanities | 300 | 1.4% |
| Total | 21,439 | 100.0% |
Transportation & Commute in Lexington
Vehicle Availability by Sex in Lexington
The most prevalent vehicle ownership categories in Lexington are males with 2 vehicles (5,366, accounting for 60.9%) and females with 2 vehicles (4,377, making up 72.9%).
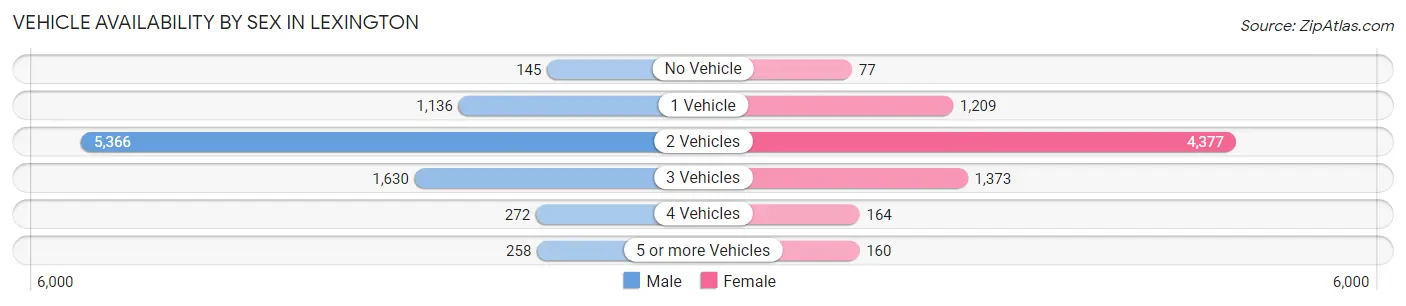
| Vehicles Available | Male | Female |
| No Vehicle | 145 (1.7%) | 77 (1.1%) |
| 1 Vehicle | 1,136 (12.9%) | 1,209 (16.4%) |
| 2 Vehicles | 5,366 (60.9%) | 4,377 (59.5%) |
| 3 Vehicles | 1,630 (18.5%) | 1,373 (18.6%) |
| 4 Vehicles | 272 (3.1%) | 164 (2.2%) |
| 5 or more Vehicles | 258 (2.9%) | 160 (2.2%) |
| Total | 8,807 (100.0%) | 7,360 (100.0%) |
Commute Time in Lexington
The most frequently occuring commute durations in Lexington are 45 to 59 minutes (1,845 commuters, 15.9%), 30 to 34 minutes (1,674 commuters, 14.4%), and 10 to 14 minutes (1,470 commuters, 12.6%).
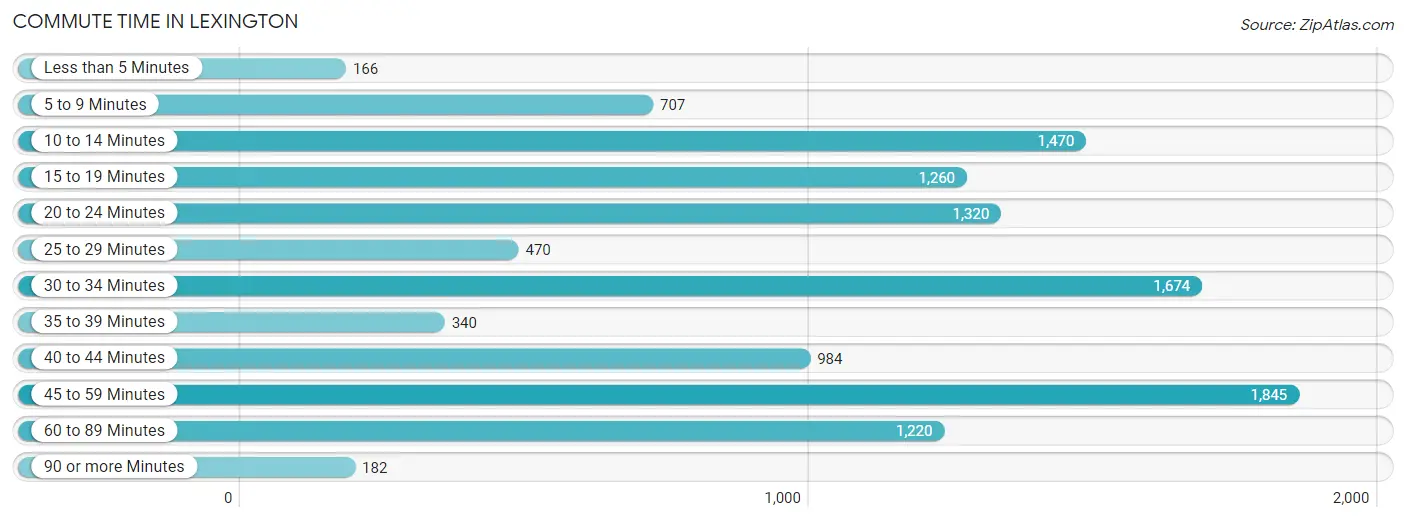
| Commute Time | # Commuters | % Commuters |
| Less than 5 Minutes | 166 | 1.4% |
| 5 to 9 Minutes | 707 | 6.1% |
| 10 to 14 Minutes | 1,470 | 12.6% |
| 15 to 19 Minutes | 1,260 | 10.8% |
| 20 to 24 Minutes | 1,320 | 11.3% |
| 25 to 29 Minutes | 470 | 4.0% |
| 30 to 34 Minutes | 1,674 | 14.4% |
| 35 to 39 Minutes | 340 | 2.9% |
| 40 to 44 Minutes | 984 | 8.5% |
| 45 to 59 Minutes | 1,845 | 15.9% |
| 60 to 89 Minutes | 1,220 | 10.5% |
| 90 or more Minutes | 182 | 1.6% |
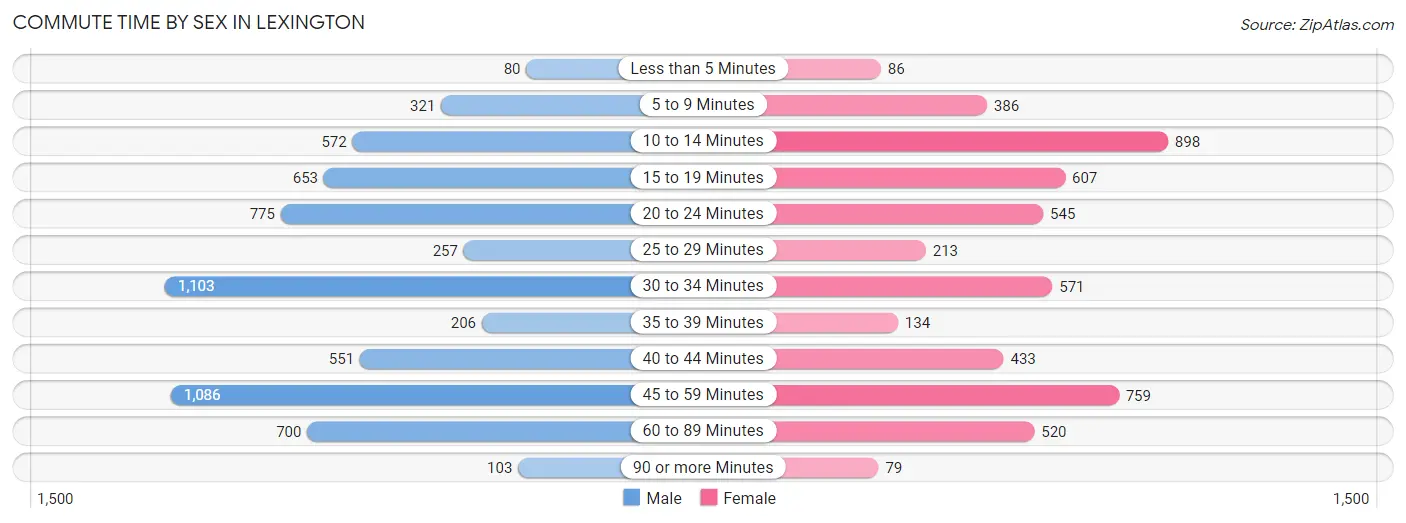
Commute Time by Sex in Lexington
The most common commute times in Lexington are 30 to 34 minutes (1,103 commuters, 17.2%) for males and 10 to 14 minutes (898 commuters, 17.2%) for females.
| Commute Time | Male | Female |
| Less than 5 Minutes | 80 (1.3%) | 86 (1.6%) |
| 5 to 9 Minutes | 321 (5.0%) | 386 (7.4%) |
| 10 to 14 Minutes | 572 (8.9%) | 898 (17.2%) |
| 15 to 19 Minutes | 653 (10.2%) | 607 (11.6%) |
| 20 to 24 Minutes | 775 (12.1%) | 545 (10.4%) |
| 25 to 29 Minutes | 257 (4.0%) | 213 (4.1%) |
| 30 to 34 Minutes | 1,103 (17.2%) | 571 (10.9%) |
| 35 to 39 Minutes | 206 (3.2%) | 134 (2.6%) |
| 40 to 44 Minutes | 551 (8.6%) | 433 (8.3%) |
| 45 to 59 Minutes | 1,086 (17.0%) | 759 (14.5%) |
| 60 to 89 Minutes | 700 (10.9%) | 520 (9.9%) |
| 90 or more Minutes | 103 (1.6%) | 79 (1.5%) |
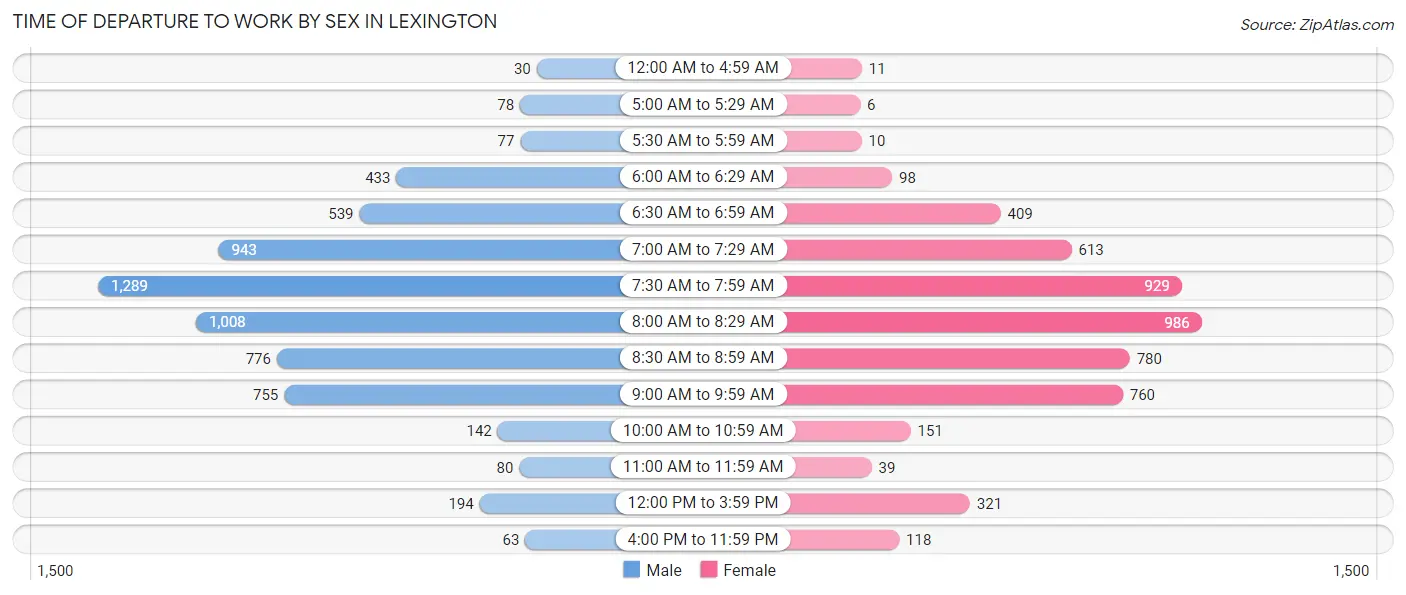
Time of Departure to Work by Sex in Lexington
The most frequent times of departure to work in Lexington are 7:30 AM to 7:59 AM (1,289, 20.1%) for males and 8:00 AM to 8:29 AM (986, 18.9%) for females.
| Time of Departure | Male | Female |
| 12:00 AM to 4:59 AM | 30 (0.5%) | 11 (0.2%) |
| 5:00 AM to 5:29 AM | 78 (1.2%) | 6 (0.1%) |
| 5:30 AM to 5:59 AM | 77 (1.2%) | 10 (0.2%) |
| 6:00 AM to 6:29 AM | 433 (6.8%) | 98 (1.9%) |
| 6:30 AM to 6:59 AM | 539 (8.4%) | 409 (7.8%) |
| 7:00 AM to 7:29 AM | 943 (14.7%) | 613 (11.7%) |
| 7:30 AM to 7:59 AM | 1,289 (20.1%) | 929 (17.8%) |
| 8:00 AM to 8:29 AM | 1,008 (15.7%) | 986 (18.9%) |
| 8:30 AM to 8:59 AM | 776 (12.1%) | 780 (14.9%) |
| 9:00 AM to 9:59 AM | 755 (11.8%) | 760 (14.5%) |
| 10:00 AM to 10:59 AM | 142 (2.2%) | 151 (2.9%) |
| 11:00 AM to 11:59 AM | 80 (1.3%) | 39 (0.7%) |
| 12:00 PM to 3:59 PM | 194 (3.0%) | 321 (6.1%) |
| 4:00 PM to 11:59 PM | 63 (1.0%) | 118 (2.3%) |
| Total | 6,407 (100.0%) | 5,231 (100.0%) |
Housing Occupancy in Lexington
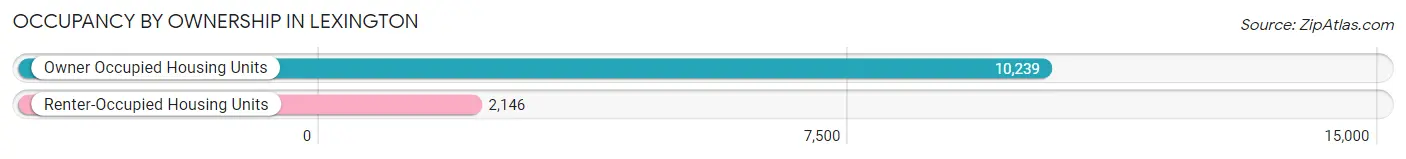
Occupancy by Ownership in Lexington
Of the total 12,385 dwellings in Lexington, owner-occupied units account for 10,239 (82.7%), while renter-occupied units make up 2,146 (17.3%).
| Occupancy | # Housing Units | % Housing Units |
| Owner Occupied Housing Units | 10,239 | 82.7% |
| Renter-Occupied Housing Units | 2,146 | 17.3% |
| Total Occupied Housing Units | 12,385 | 100.0% |
Occupancy by Household Size in Lexington
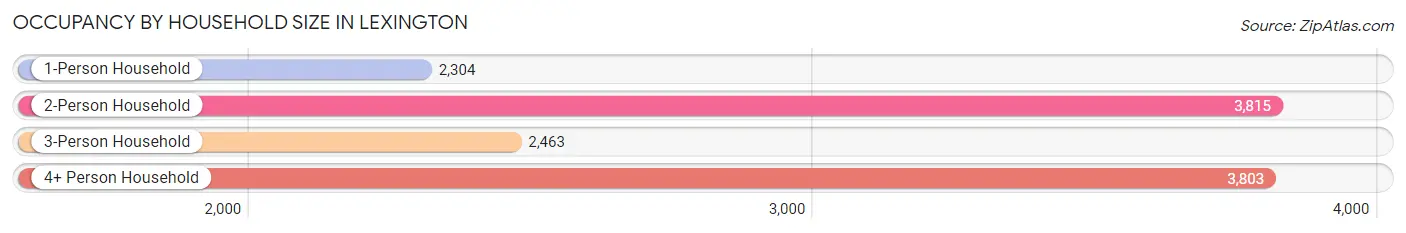
| Household Size | # Housing Units | % Housing Units |
| 1-Person Household | 2,304 | 18.6% |
| 2-Person Household | 3,815 | 30.8% |
| 3-Person Household | 2,463 | 19.9% |
| 4+ Person Household | 3,803 | 30.7% |
| Total Housing Units | 12,385 | 100.0% |
Occupancy by Ownership by Household Size in Lexington
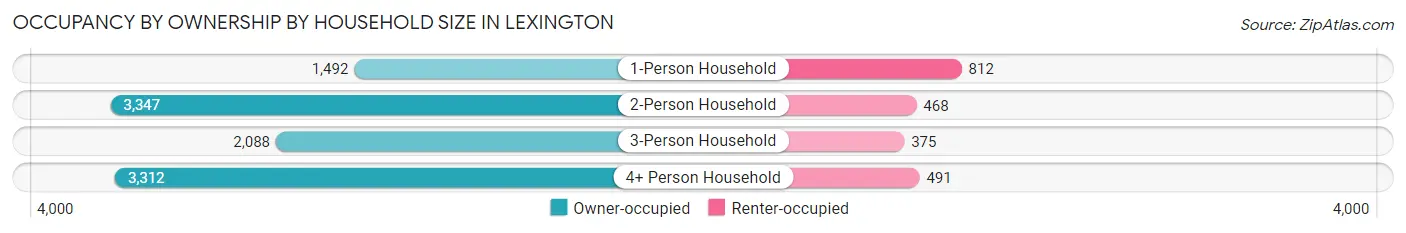
| Household Size | Owner-occupied | Renter-occupied |
| 1-Person Household | 1,492 (64.8%) | 812 (35.2%) |
| 2-Person Household | 3,347 (87.7%) | 468 (12.3%) |
| 3-Person Household | 2,088 (84.8%) | 375 (15.2%) |
| 4+ Person Household | 3,312 (87.1%) | 491 (12.9%) |
| Total Housing Units | 10,239 (82.7%) | 2,146 (17.3%) |
Occupancy by Educational Attainment in Lexington
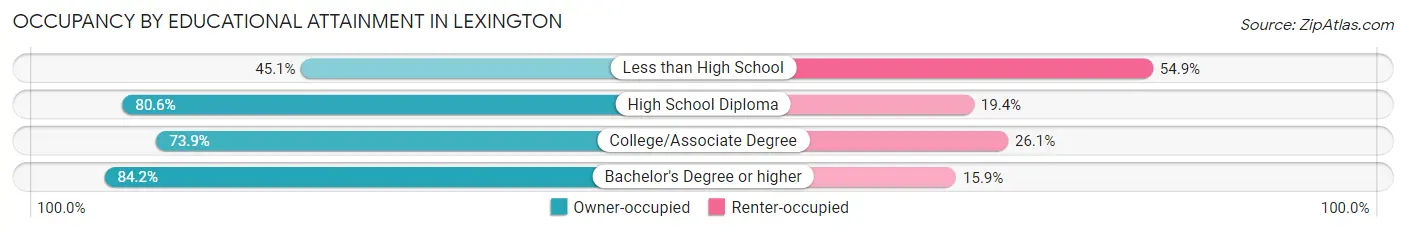
| Household Size | Owner-occupied | Renter-occupied |
| Less than High School | 88 (45.1%) | 107 (54.9%) |
| High School Diploma | 362 (80.6%) | 87 (19.4%) |
| College/Associate Degree | 650 (73.9%) | 230 (26.1%) |
| Bachelor's Degree or higher | 9,139 (84.2%) | 1,722 (15.9%) |
Occupancy by Age of Householder in Lexington
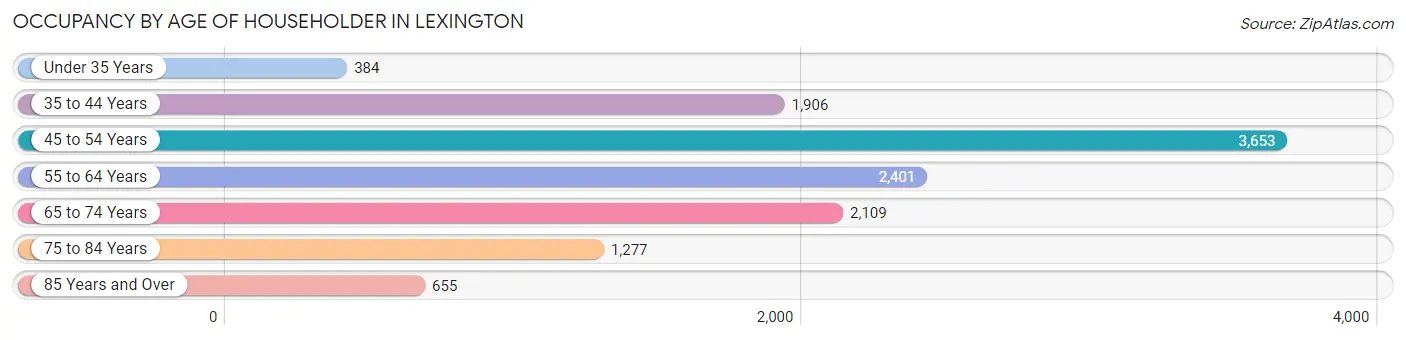
| Age Bracket | # Households | % Households |
| Under 35 Years | 384 | 3.1% |
| 35 to 44 Years | 1,906 | 15.4% |
| 45 to 54 Years | 3,653 | 29.5% |
| 55 to 64 Years | 2,401 | 19.4% |
| 65 to 74 Years | 2,109 | 17.0% |
| 75 to 84 Years | 1,277 | 10.3% |
| 85 Years and Over | 655 | 5.3% |
| Total | 12,385 | 100.0% |
Housing Finances in Lexington
Median Income by Occupancy in Lexington
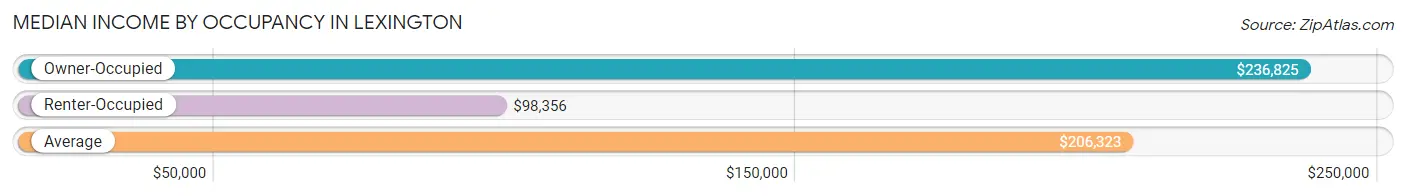
| Occupancy Type | # Households | Median Income |
| Owner-Occupied | 10,239 (82.7%) | $236,825 |
| Renter-Occupied | 2,146 (17.3%) | $98,356 |
| Average | 12,385 (100.0%) | $206,323 |
Occupancy by Householder Income Bracket in Lexington
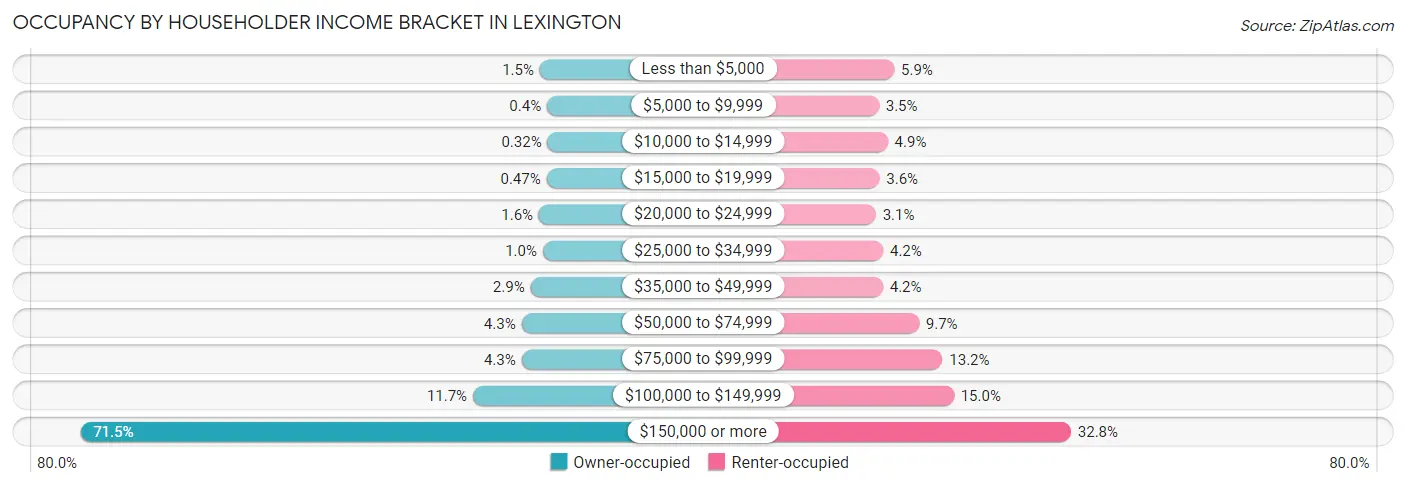
| Income Bracket | Owner-occupied | Renter-occupied |
| Less than $5,000 | 153 (1.5%) | 126 (5.9%) |
| $5,000 to $9,999 | 41 (0.4%) | 76 (3.5%) |
| $10,000 to $14,999 | 33 (0.3%) | 105 (4.9%) |
| $15,000 to $19,999 | 48 (0.5%) | 78 (3.6%) |
| $20,000 to $24,999 | 167 (1.6%) | 66 (3.1%) |
| $25,000 to $34,999 | 105 (1.0%) | 90 (4.2%) |
| $35,000 to $49,999 | 298 (2.9%) | 89 (4.2%) |
| $50,000 to $74,999 | 438 (4.3%) | 207 (9.7%) |
| $75,000 to $99,999 | 437 (4.3%) | 284 (13.2%) |
| $100,000 to $149,999 | 1,196 (11.7%) | 321 (15.0%) |
| $150,000 or more | 7,323 (71.5%) | 704 (32.8%) |
| Total | 10,239 (100.0%) | 2,146 (100.0%) |
Monthly Housing Cost Tiers in Lexington
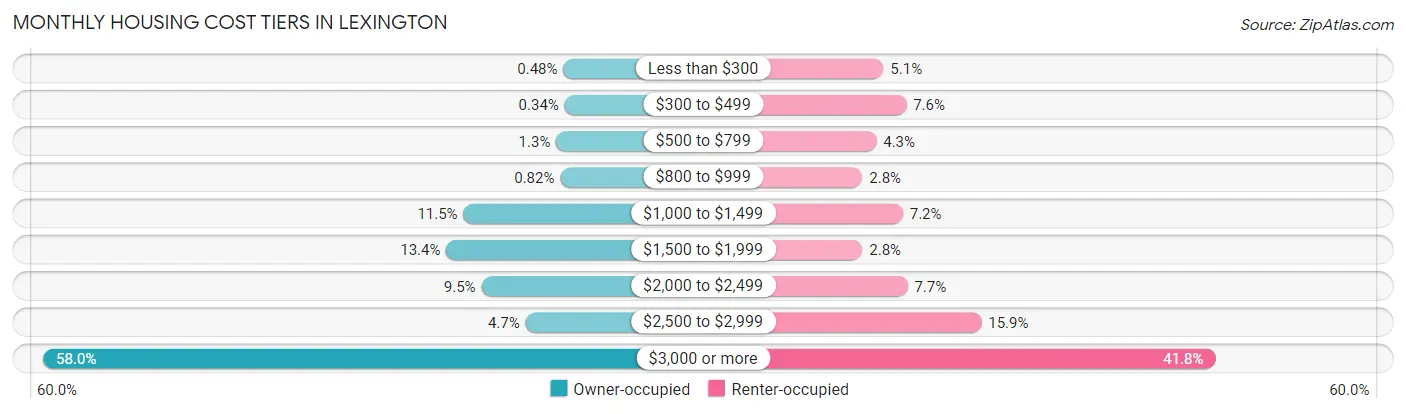
| Monthly Cost | Owner-occupied | Renter-occupied |
| Less than $300 | 49 (0.5%) | 109 (5.1%) |
| $300 to $499 | 35 (0.3%) | 163 (7.6%) |
| $500 to $799 | 130 (1.3%) | 92 (4.3%) |
| $800 to $999 | 84 (0.8%) | 59 (2.8%) |
| $1,000 to $1,499 | 1,180 (11.5%) | 155 (7.2%) |
| $1,500 to $1,999 | 1,373 (13.4%) | 59 (2.8%) |
| $2,000 to $2,499 | 976 (9.5%) | 166 (7.7%) |
| $2,500 to $2,999 | 477 (4.7%) | 341 (15.9%) |
| $3,000 or more | 5,935 (58.0%) | 896 (41.7%) |
| Total | 10,239 (100.0%) | 2,146 (100.0%) |
Physical Housing Characteristics in Lexington
Housing Structures in Lexington
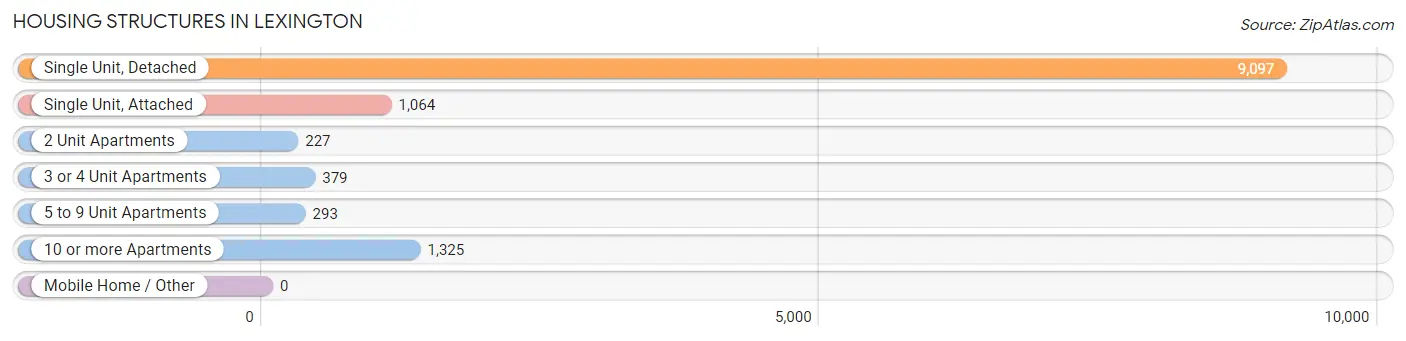
| Structure Type | # Housing Units | % Housing Units |
| Single Unit, Detached | 9,097 | 73.5% |
| Single Unit, Attached | 1,064 | 8.6% |
| 2 Unit Apartments | 227 | 1.8% |
| 3 or 4 Unit Apartments | 379 | 3.1% |
| 5 to 9 Unit Apartments | 293 | 2.4% |
| 10 or more Apartments | 1,325 | 10.7% |
| Mobile Home / Other | 0 | 0.0% |
| Total | 12,385 | 100.0% |
Housing Structures by Occupancy in Lexington
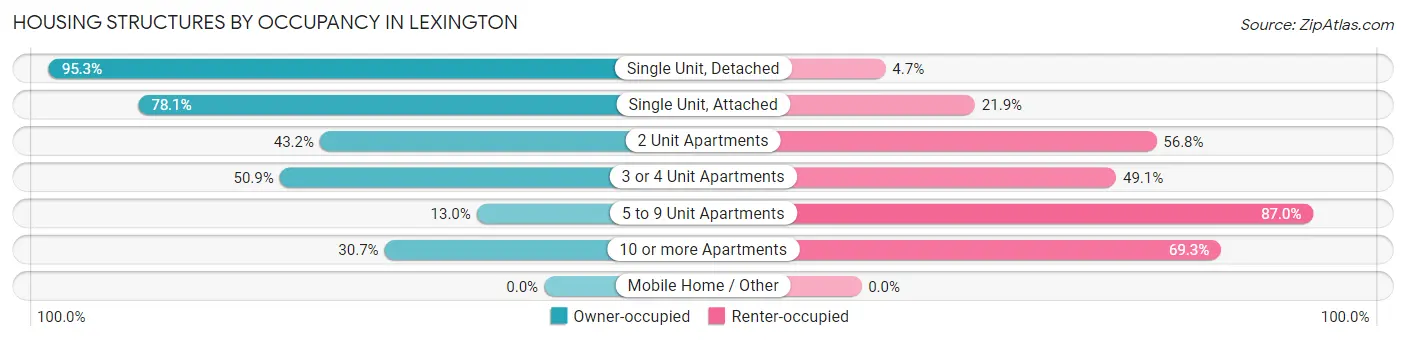
| Structure Type | Owner-occupied | Renter-occupied |
| Single Unit, Detached | 8,672 (95.3%) | 425 (4.7%) |
| Single Unit, Attached | 831 (78.1%) | 233 (21.9%) |
| 2 Unit Apartments | 98 (43.2%) | 129 (56.8%) |
| 3 or 4 Unit Apartments | 193 (50.9%) | 186 (49.1%) |
| 5 to 9 Unit Apartments | 38 (13.0%) | 255 (87.0%) |
| 10 or more Apartments | 407 (30.7%) | 918 (69.3%) |
| Mobile Home / Other | 0 (0.0%) | 0 (0.0%) |
| Total | 10,239 (82.7%) | 2,146 (17.3%) |
Housing Structures by Number of Rooms in Lexington
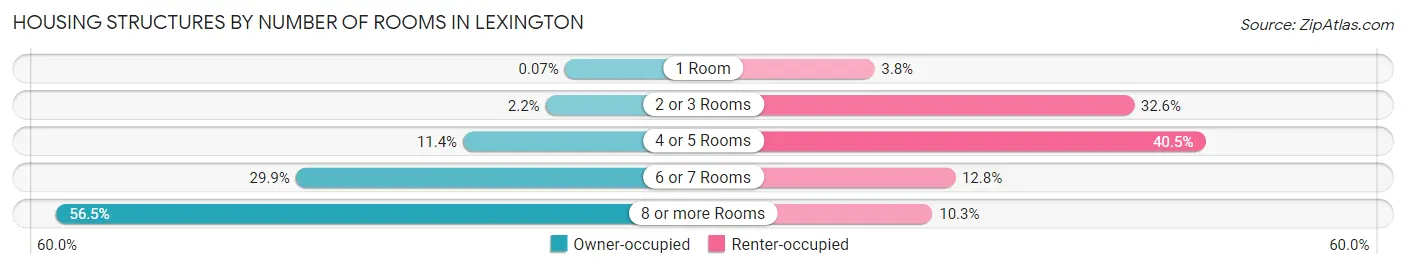
| Number of Rooms | Owner-occupied | Renter-occupied |
| 1 Room | 7 (0.1%) | 82 (3.8%) |
| 2 or 3 Rooms | 225 (2.2%) | 700 (32.6%) |
| 4 or 5 Rooms | 1,162 (11.4%) | 870 (40.5%) |
| 6 or 7 Rooms | 3,063 (29.9%) | 274 (12.8%) |
| 8 or more Rooms | 5,782 (56.5%) | 220 (10.2%) |
| Total | 10,239 (100.0%) | 2,146 (100.0%) |
Housing Structure by Heating Type in Lexington
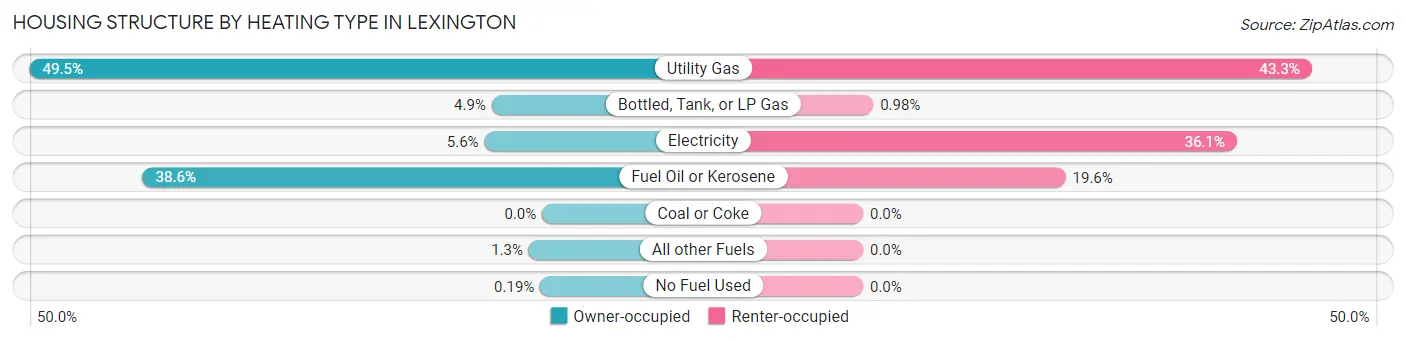
| Heating Type | Owner-occupied | Renter-occupied |
| Utility Gas | 5,069 (49.5%) | 930 (43.3%) |
| Bottled, Tank, or LP Gas | 499 (4.9%) | 21 (1.0%) |
| Electricity | 570 (5.6%) | 775 (36.1%) |
| Fuel Oil or Kerosene | 3,951 (38.6%) | 420 (19.6%) |
| Coal or Coke | 0 (0.0%) | 0 (0.0%) |
| All other Fuels | 131 (1.3%) | 0 (0.0%) |
| No Fuel Used | 19 (0.2%) | 0 (0.0%) |
| Total | 10,239 (100.0%) | 2,146 (100.0%) |
Household Vehicle Usage in Lexington
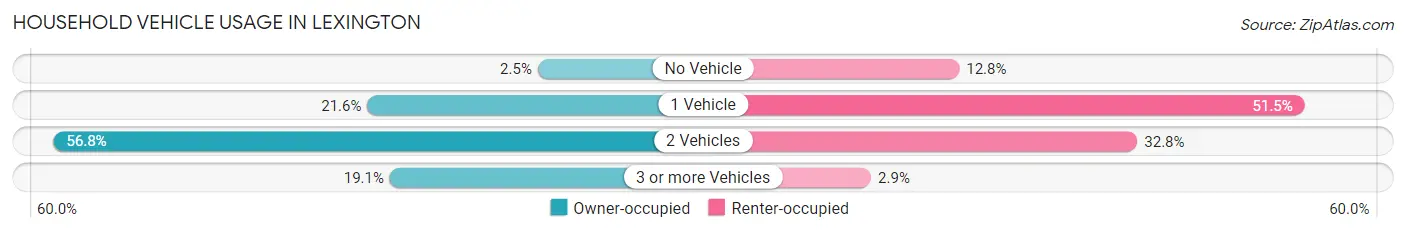
| Vehicles per Household | Owner-occupied | Renter-occupied |
| No Vehicle | 258 (2.5%) | 275 (12.8%) |
| 1 Vehicle | 2,213 (21.6%) | 1,105 (51.5%) |
| 2 Vehicles | 5,813 (56.8%) | 703 (32.8%) |
| 3 or more Vehicles | 1,955 (19.1%) | 63 (2.9%) |
| Total | 10,239 (100.0%) | 2,146 (100.0%) |
Real Estate & Mortgages in Lexington
Real Estate and Mortgage Overview in Lexington
| Characteristic | Without Mortgage | With Mortgage |
| Housing Units | 3,899 | 6,340 |
| Median Property Value | $985,800 | $1,133,000 |
| Median Household Income | $166,080 | $5,254 |
| Monthly Housing Costs | $1,501 | $5,512 |
| Real Estate Taxes | $10,001 | $15 |
Property Value by Mortgage Status in Lexington
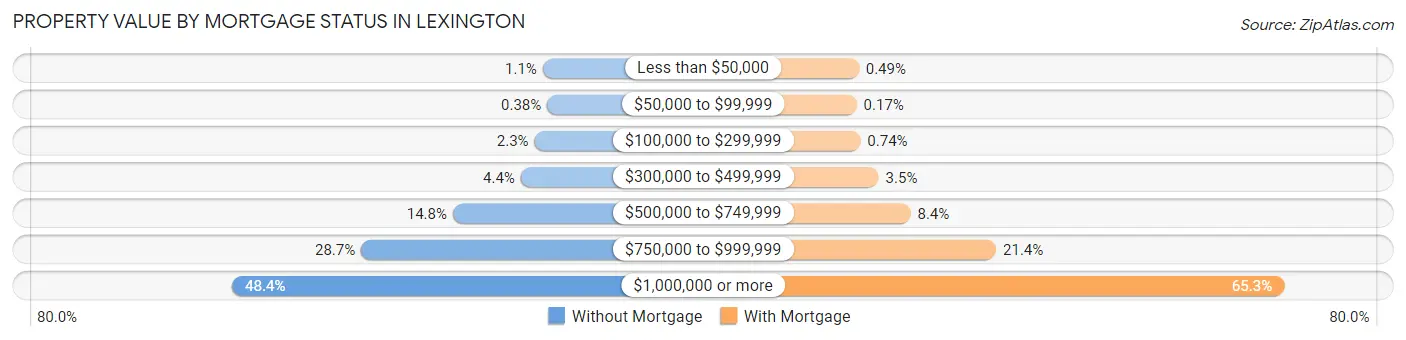
| Property Value | Without Mortgage | With Mortgage |
| Less than $50,000 | 41 (1.1%) | 31 (0.5%) |
| $50,000 to $99,999 | 15 (0.4%) | 11 (0.2%) |
| $100,000 to $299,999 | 90 (2.3%) | 47 (0.7%) |
| $300,000 to $499,999 | 172 (4.4%) | 223 (3.5%) |
| $500,000 to $749,999 | 575 (14.7%) | 531 (8.4%) |
| $750,000 to $999,999 | 1,120 (28.7%) | 1,358 (21.4%) |
| $1,000,000 or more | 1,886 (48.4%) | 4,139 (65.3%) |
| Total | 3,899 (100.0%) | 6,340 (100.0%) |
Household Income by Mortgage Status in Lexington
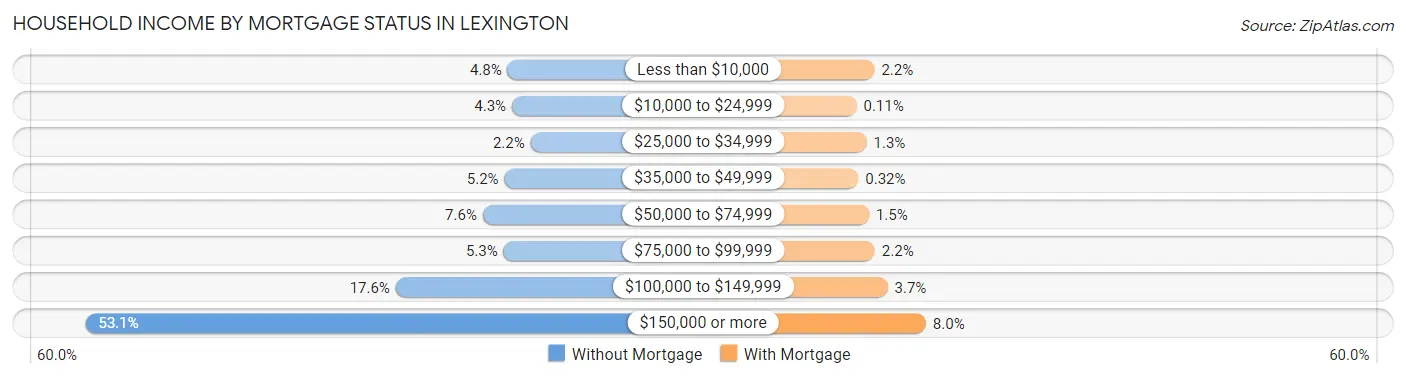
| Household Income | Without Mortgage | With Mortgage |
| Less than $10,000 | 187 (4.8%) | 137 (2.2%) |
| $10,000 to $24,999 | 168 (4.3%) | 7 (0.1%) |
| $25,000 to $34,999 | 85 (2.2%) | 80 (1.3%) |
| $35,000 to $49,999 | 201 (5.2%) | 20 (0.3%) |
| $50,000 to $74,999 | 298 (7.6%) | 97 (1.5%) |
| $75,000 to $99,999 | 205 (5.3%) | 140 (2.2%) |
| $100,000 to $149,999 | 686 (17.6%) | 232 (3.7%) |
| $150,000 or more | 2,069 (53.1%) | 510 (8.0%) |
| Total | 3,899 (100.0%) | 6,340 (100.0%) |
Property Value to Household Income Ratio in Lexington
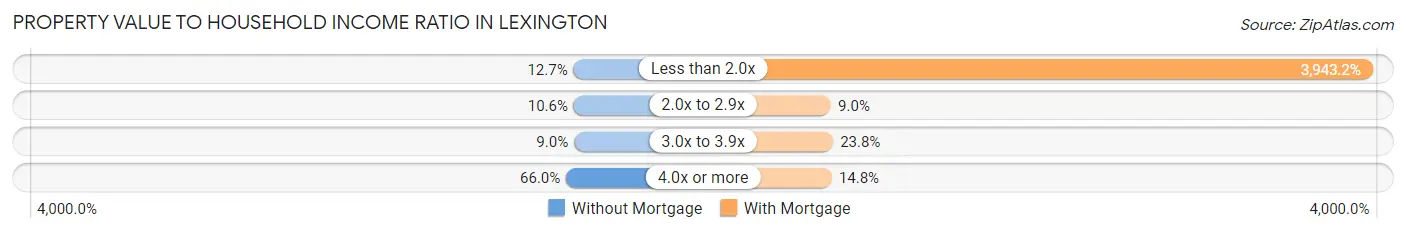
| Value-to-Income Ratio | Without Mortgage | With Mortgage |
| Less than 2.0x | 496 (12.7%) | 250,001 (3,943.2%) |
| 2.0x to 2.9x | 414 (10.6%) | 573 (9.0%) |
| 3.0x to 3.9x | 349 (8.9%) | 1,509 (23.8%) |
| 4.0x or more | 2,574 (66.0%) | 935 (14.7%) |
| Total | 3,899 (100.0%) | 6,340 (100.0%) |
Real Estate Taxes by Mortgage Status in Lexington
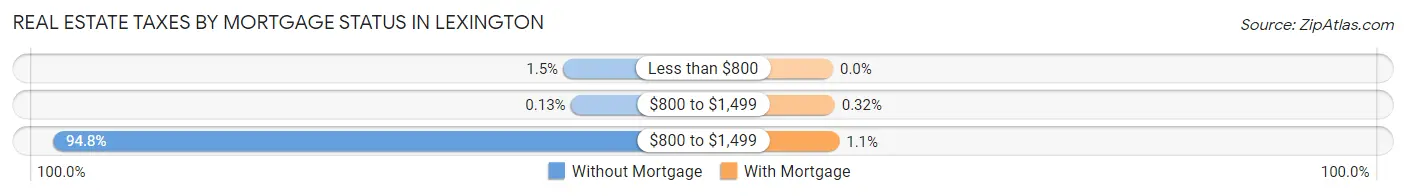
| Property Taxes | Without Mortgage | With Mortgage |
| Less than $800 | 58 (1.5%) | 0 (0.0%) |
| $800 to $1,499 | 5 (0.1%) | 20 (0.3%) |
| $800 to $1,499 | 3,696 (94.8%) | 72 (1.1%) |
| Total | 3,899 (100.0%) | 6,340 (100.0%) |
Health & Disability in Lexington
Health Insurance Coverage by Age in Lexington
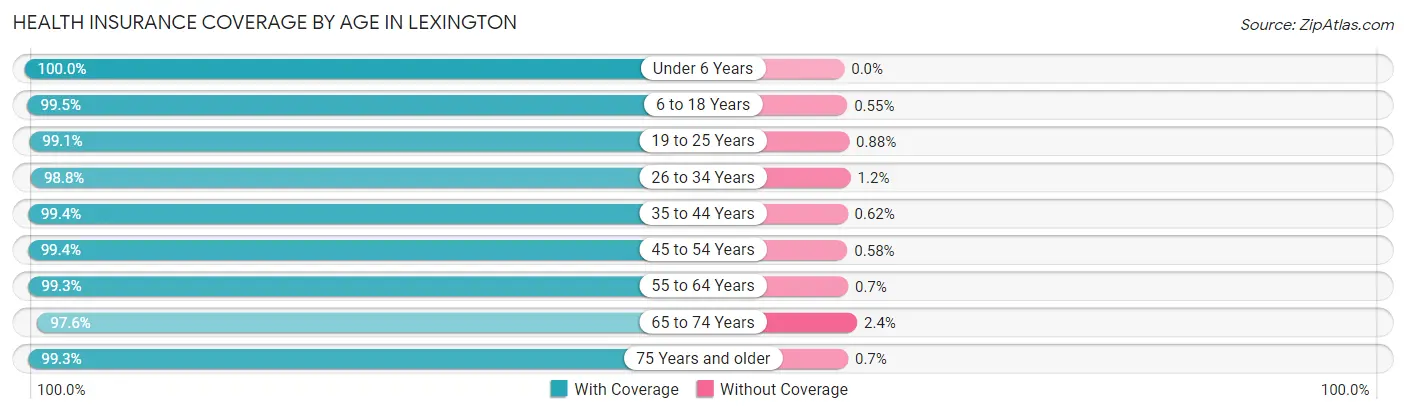
| Age Bracket | With Coverage | Without Coverage |
| Under 6 Years | 1,542 (100.0%) | 0 (0.0%) |
| 6 to 18 Years | 7,754 (99.5%) | 43 (0.5%) |
| 19 to 25 Years | 1,344 (99.1%) | 12 (0.9%) |
| 26 to 34 Years | 1,160 (98.8%) | 14 (1.2%) |
| 35 to 44 Years | 3,830 (99.4%) | 24 (0.6%) |
| 45 to 54 Years | 6,665 (99.4%) | 39 (0.6%) |
| 55 to 64 Years | 4,551 (99.3%) | 32 (0.7%) |
| 65 to 74 Years | 3,836 (97.6%) | 94 (2.4%) |
| 75 Years and older | 2,997 (99.3%) | 21 (0.7%) |
| Total | 33,679 (99.2%) | 279 (0.8%) |
Health Insurance Coverage by Citizenship Status in Lexington
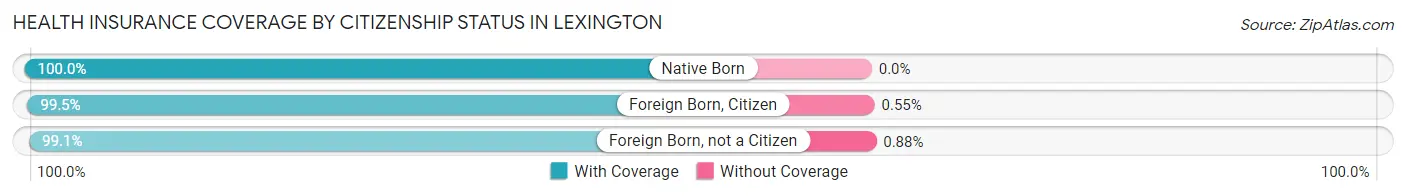
| Citizenship Status | With Coverage | Without Coverage |
| Native Born | 1,542 (100.0%) | 0 (0.0%) |
| Foreign Born, Citizen | 7,754 (99.5%) | 43 (0.5%) |
| Foreign Born, not a Citizen | 1,344 (99.1%) | 12 (0.9%) |
Health Insurance Coverage by Household Income in Lexington
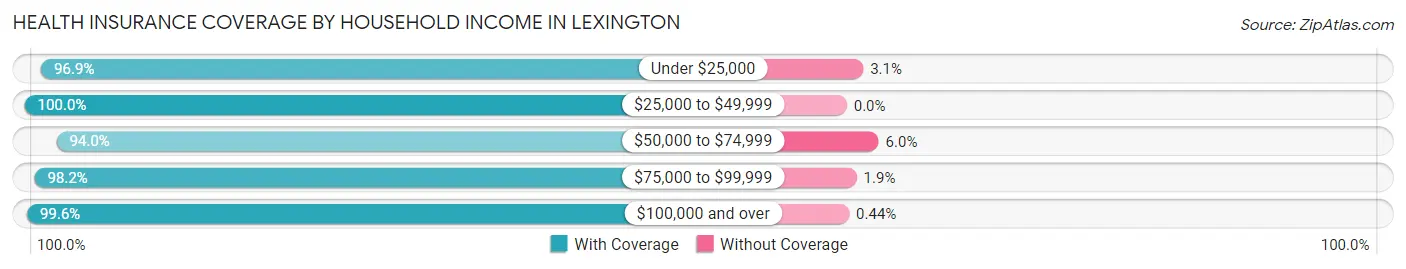
| Household Income | With Coverage | Without Coverage |
| Under $25,000 | 1,414 (96.9%) | 45 (3.1%) |
| $25,000 to $49,999 | 985 (100.0%) | 0 (0.0%) |
| $50,000 to $74,999 | 1,228 (94.0%) | 78 (6.0%) |
| $75,000 to $99,999 | 1,432 (98.2%) | 27 (1.8%) |
| $100,000 and over | 28,485 (99.6%) | 127 (0.4%) |
Public vs Private Health Insurance Coverage by Age in Lexington
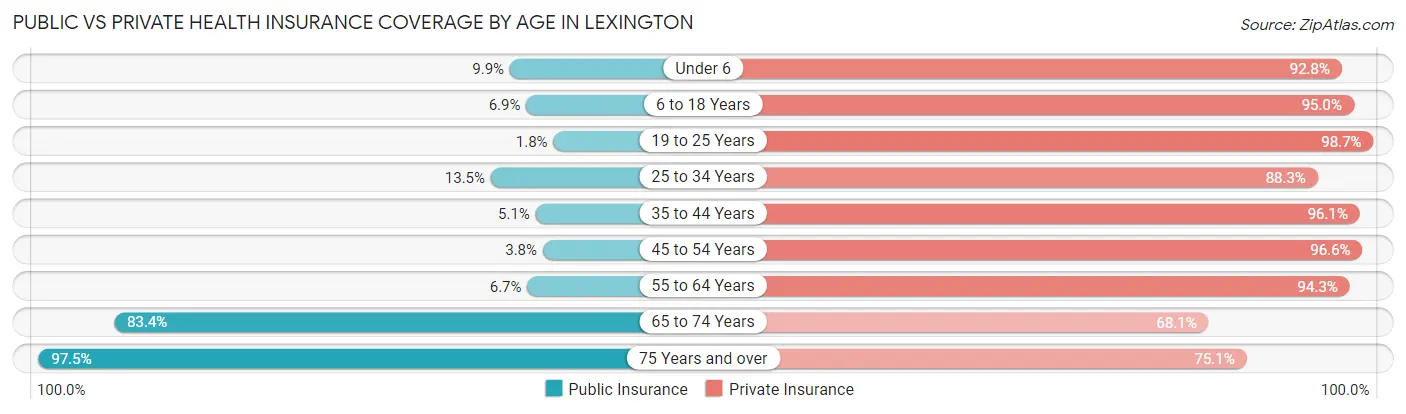
| Age Bracket | Public Insurance | Private Insurance |
| Under 6 | 153 (9.9%) | 1,431 (92.8%) |
| 6 to 18 Years | 536 (6.9%) | 7,409 (95.0%) |
| 19 to 25 Years | 25 (1.8%) | 1,338 (98.7%) |
| 25 to 34 Years | 158 (13.5%) | 1,037 (88.3%) |
| 35 to 44 Years | 198 (5.1%) | 3,705 (96.1%) |
| 45 to 54 Years | 255 (3.8%) | 6,478 (96.6%) |
| 55 to 64 Years | 306 (6.7%) | 4,320 (94.3%) |
| 65 to 74 Years | 3,278 (83.4%) | 2,676 (68.1%) |
| 75 Years and over | 2,941 (97.5%) | 2,267 (75.1%) |
| Total | 7,850 (23.1%) | 30,661 (90.3%) |
Disability Status by Sex by Age in Lexington
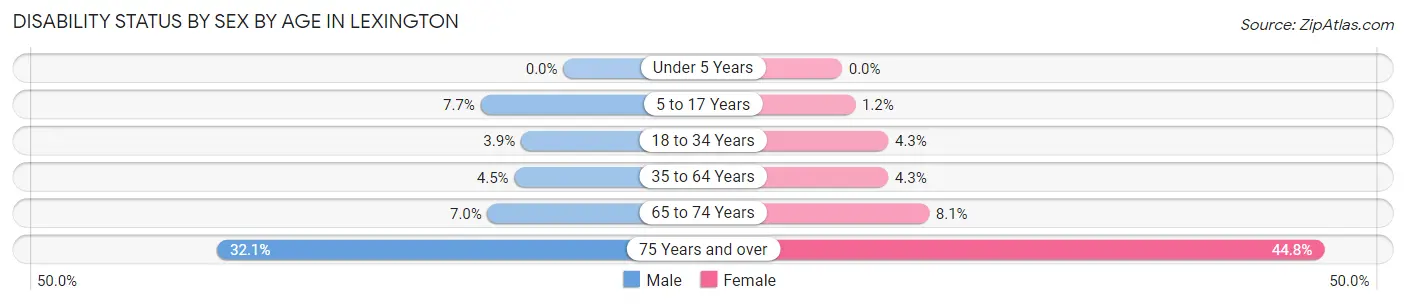
| Age Bracket | Male | Female |
| Under 5 Years | 0 (0.0%) | 0 (0.0%) |
| 5 to 17 Years | 286 (7.7%) | 48 (1.2%) |
| 18 to 34 Years | 52 (3.9%) | 72 (4.3%) |
| 35 to 64 Years | 343 (4.5%) | 325 (4.3%) |
| 65 to 74 Years | 131 (7.0%) | 167 (8.1%) |
| 75 Years and over | 440 (32.1%) | 738 (44.8%) |
Disability Class by Sex by Age in Lexington
Disability Class: Hearing Difficulty
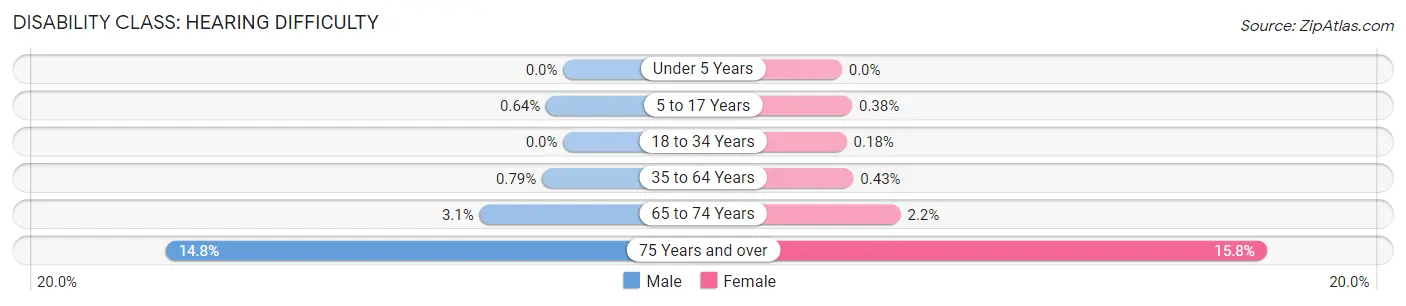
| Age Bracket | Male | Female |
| Under 5 Years | 0 (0.0%) | 0 (0.0%) |
| 5 to 17 Years | 24 (0.6%) | 15 (0.4%) |
| 18 to 34 Years | 0 (0.0%) | 3 (0.2%) |
| 35 to 64 Years | 60 (0.8%) | 33 (0.4%) |
| 65 to 74 Years | 58 (3.1%) | 45 (2.2%) |
| 75 Years and over | 202 (14.8%) | 260 (15.8%) |
Disability Class: Vision Difficulty
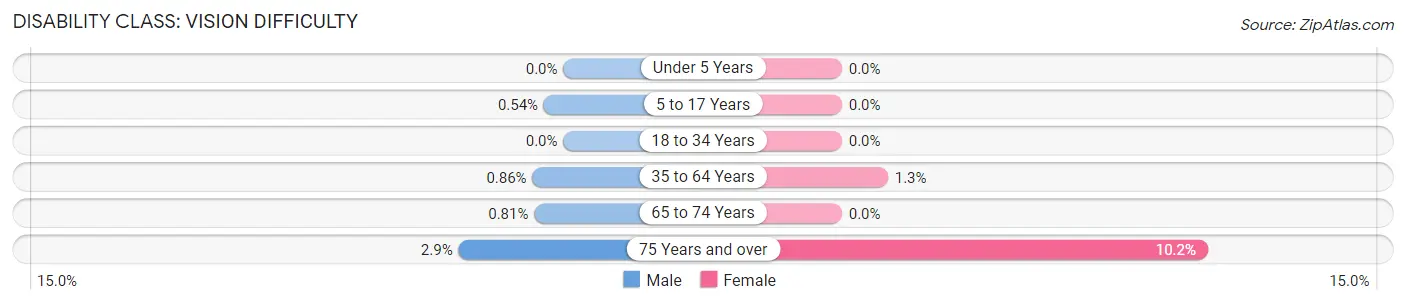
| Age Bracket | Male | Female |
| Under 5 Years | 0 (0.0%) | 0 (0.0%) |
| 5 to 17 Years | 20 (0.5%) | 0 (0.0%) |
| 18 to 34 Years | 0 (0.0%) | 0 (0.0%) |
| 35 to 64 Years | 65 (0.9%) | 97 (1.3%) |
| 65 to 74 Years | 15 (0.8%) | 0 (0.0%) |
| 75 Years and over | 40 (2.9%) | 168 (10.2%) |
Disability Class: Cognitive Difficulty
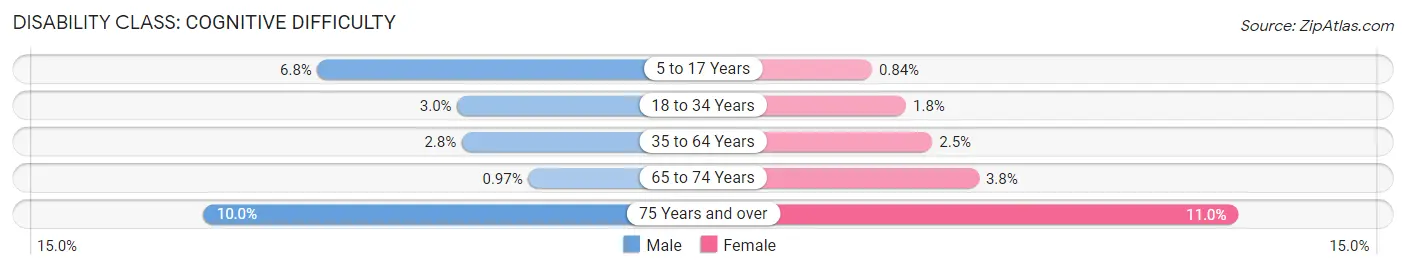
| Age Bracket | Male | Female |
| 5 to 17 Years | 255 (6.8%) | 33 (0.8%) |
| 18 to 34 Years | 39 (2.9%) | 30 (1.8%) |
| 35 to 64 Years | 213 (2.8%) | 191 (2.5%) |
| 65 to 74 Years | 18 (1.0%) | 79 (3.8%) |
| 75 Years and over | 137 (10.0%) | 182 (11.0%) |
Disability Class: Ambulatory Difficulty
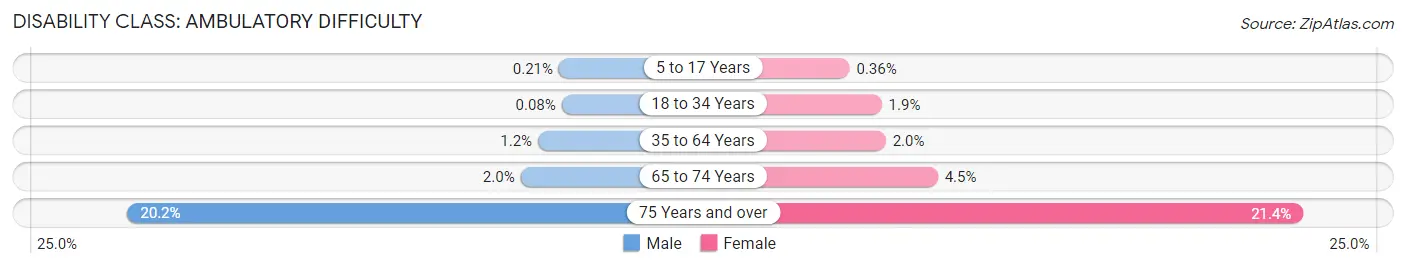
| Age Bracket | Male | Female |
| 5 to 17 Years | 8 (0.2%) | 14 (0.4%) |
| 18 to 34 Years | 1 (0.1%) | 31 (1.8%) |
| 35 to 64 Years | 89 (1.2%) | 155 (2.0%) |
| 65 to 74 Years | 37 (2.0%) | 92 (4.4%) |
| 75 Years and over | 277 (20.2%) | 353 (21.4%) |
Disability Class: Self-Care Difficulty
| Age Bracket | Male | Female |
| 5 to 17 Years | 52 (1.4%) | 14 (0.4%) |
| 18 to 34 Years | 10 (0.8%) | 31 (1.8%) |
| 35 to 64 Years | 14 (0.2%) | 133 (1.8%) |
| 65 to 74 Years | 42 (2.2%) | 46 (2.2%) |
| 75 Years and over | 153 (11.2%) | 171 (10.4%) |
Technology Access in Lexington
Computing Device Access in Lexington
| Device Type | # Households | % Households |
| Desktop or Laptop | 11,894 | 96.0% |
| Smartphone | 11,455 | 92.5% |
| Tablet | 9,625 | 77.7% |
| No Computing Device | 326 | 2.6% |
| Total | 12,385 | 100.0% |
Internet Access in Lexington
| Internet Type | # Households | % Households |
| Dial-Up Internet | 0 | 0.0% |
| Broadband Home | 11,457 | 92.5% |
| Cellular Data Only | 550 | 4.4% |
| Satellite Internet | 146 | 1.2% |
| No Internet | 357 | 2.9% |
| Total | 12,385 | 100.0% |
Lexington Summary
Lexington, Massachusetts is a town located in Middlesex County, Massachusetts, United States. It is part of the Greater Boston area and is located approximately 10 miles northwest of downtown Boston. As of the 2010 census, the town had a population of 31,394.
History
The area now known as Lexington was first settled in 1642 by a group of colonists from Cambridge, England. The colonists named the area after the Battle of Lexington, which had taken place in England in 1641. The town was officially incorporated in 1713 and was the first town to be incorporated in Middlesex County.
In the late 18th century, Lexington was an important center of the Revolutionary War. It was the site of the first battle of the American Revolution, the Battle of Lexington and Concord, which took place on April 19, 1775. The town was also the site of the first muster of the Massachusetts militia, which took place on April 19, 1775.
Geography
Lexington is located in eastern Massachusetts, approximately 10 miles northwest of downtown Boston. It is bordered by the towns of Bedford, Burlington, Woburn, and Arlington. The town covers an area of 16.5 square miles and is located in the Concord River Valley. The town is mostly flat, with some hills in the western part of town.
The town is home to several bodies of water, including the Concord River, the Mystic River, and the Aberjona River. The town is also home to several parks, including the Lexington Battle Green, the Minuteman National Historical Park, and the Great Meadows National Wildlife Refuge.
Economy
The economy of Lexington is largely based on technology and healthcare. The town is home to several major employers, including Raytheon, BAE Systems, and the Massachusetts General Hospital. The town is also home to several smaller businesses, including software companies, medical device companies, and biotechnology companies.
Demographics
As of the 2010 census, the town had a population of 31,394. The racial makeup of the town was 87.3% White, 4.2% Asian, 3.2% African American, 0.3% Native American, and 4.9% from other races. The median household income was $128,867, and the median family income was $152,895.
The town is home to several educational institutions, including the Lexington Public Schools, the Lexington Montessori School, and the Lexington Christian Academy. The town is also home to several private schools, including the Lexington School for the Deaf and the Lexington Latin School.
Conclusion
Lexington, Massachusetts is a town located in Middlesex County, Massachusetts, United States. It is part of the Greater Boston area and is located approximately 10 miles northwest of downtown Boston. As of the 2010 census, the town had a population of 31,394. The town is home to several major employers, including Raytheon, BAE Systems, and the Massachusetts General Hospital. The economy of Lexington is largely based on technology and healthcare. The racial makeup of the town was 87.3% White, 4.2% Asian, 3.2% African American, 0.3% Native American, and 4.9% from other races. The town is home to several educational institutions, including the Lexington Public Schools, the Lexington Montessori School, and the Lexington Christian Academy.
Common Questions
What is Per Capita Income in Lexington?
Per Capita income in Lexington is $102,776.
What is the Median Family Income in Lexington?
Median Family Income in Lexington is $248,773.
What is the Median Household income in Lexington?
Median Household Income in Lexington is $206,323.
What is Income or Wage Gap in Lexington?
Income or Wage Gap in Lexington is 48.1%.
Women in Lexington earn 51.9 cents for every dollar earned by a man.
What is Family Income Deficit in Lexington?
Family Income Deficit in Lexington is $14,487.
Families that are below poverty line in Lexington earn $14,487 less on average than the poverty threshold level.
What is Inequality or Gini Index in Lexington?
Inequality or Gini Index in Lexington is 0.46.
What is the Total Population of Lexington?
Total Population of Lexington is 34,221.
What is the Total Male Population of Lexington?
Total Male Population of Lexington is 16,499.
What is the Total Female Population of Lexington?
Total Female Population of Lexington is 17,722.
What is the Ratio of Males per 100 Females in Lexington?
There are 93.10 Males per 100 Females in Lexington.
What is the Ratio of Females per 100 Males in Lexington?
There are 107.41 Females per 100 Males in Lexington.
What is the Median Population Age in Lexington?
Median Population Age in Lexington is 46.8 Years.
What is the Average Family Size in Lexington
Average Family Size in Lexington is 3.1 People.
What is the Average Household Size in Lexington
Average Household Size in Lexington is 2.7 People.
How Large is the Labor Force in Lexington?
There are 16,986 People in the Labor Forcein in Lexington.
What is the Percentage of People in the Labor Force in Lexington?
63.5% of People are in the Labor Force in Lexington.
What is the Unemployment Rate in Lexington?
Unemployment Rate in Lexington is 3.7%.