Downey, CA Map & Demographics
Downey Map

Downey Overview
$35,375
PER CAPITA INCOME
$90,236
AVG FAMILY INCOME
$84,236
AVG HOUSEHOLD INCOME
26.1%
WAGE / INCOME GAP [ % ]
73.9¢/ $1
WAGE / INCOME GAP [ $ ]
$10,684
FAMILY INCOME DEFICIT
0.43
INEQUALITY / GINI INDEX
113,052
TOTAL POPULATION
55,143
MALE POPULATION
57,909
FEMALE POPULATION
95.22
MALES / 100 FEMALES
105.02
FEMALES / 100 MALES
36.5
MEDIAN AGE
3.6
AVG FAMILY SIZE
3.2
AVG HOUSEHOLD SIZE
60,146
LABOR FORCE [ PEOPLE ]
66.1%
PERCENT IN LABOR FORCE
5.6%
UNEMPLOYMENT RATE
Downey Area Codes
Income in Downey
Income Overview in Downey
Per Capita Income in Downey is $35,375, while median incomes of families and households are $90,236 and $84,236 respectively.
| Characteristic | Number | Measure |
| Per Capita Income | 113,052 | $35,375 |
| Median Family Income | 27,116 | $90,236 |
| Mean Family Income | 27,116 | $118,391 |
| Median Household Income | 34,788 | $84,236 |
| Mean Household Income | 34,788 | $110,699 |
| Income Deficit | 27,116 | $10,684 |
| Wage / Income Gap (%) | 113,052 | 26.08% |
| Wage / Income Gap ($) | 113,052 | 73.92¢ per $1 |
| Gini / Inequality Index | 113,052 | 0.43 |
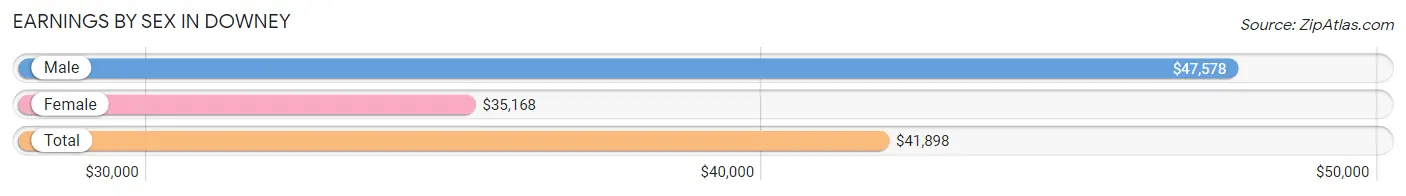
Earnings by Sex in Downey
Average Earnings in Downey are $41,898, $47,578 for men and $35,168 for women, a difference of 26.1%.
| Sex | Number | Average Earnings |
| Male | 32,987 (54.3%) | $47,578 |
| Female | 27,795 (45.7%) | $35,168 |
| Total | 60,782 (100.0%) | $41,898 |
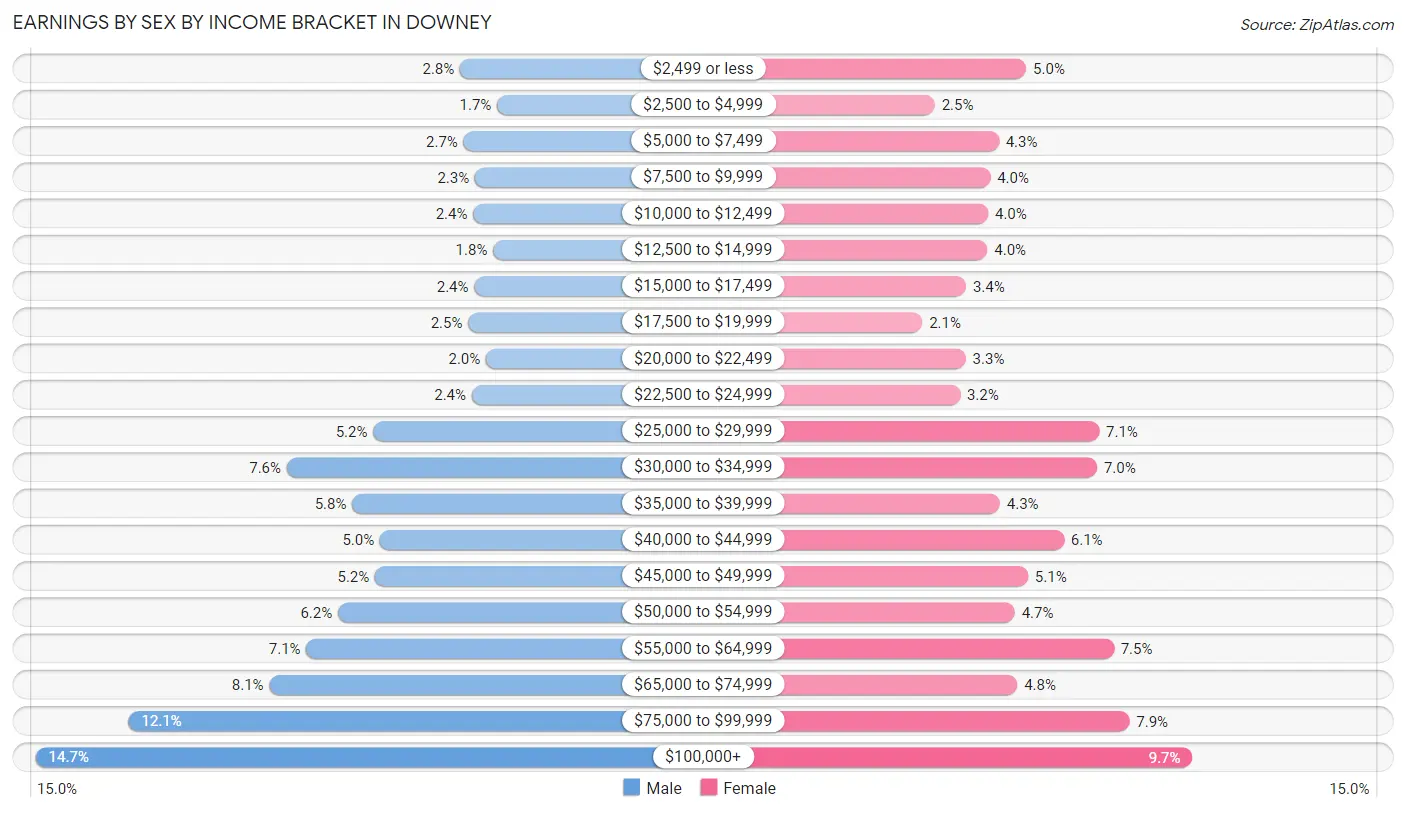
Earnings by Sex by Income Bracket in Downey
The most common earnings brackets in Downey are $100,000+ for men (4,847 | 14.7%) and $100,000+ for women (2,700 | 9.7%).
| Income | Male | Female |
| $2,499 or less | 909 (2.8%) | 1,402 (5.0%) |
| $2,500 to $4,999 | 568 (1.7%) | 687 (2.5%) |
| $5,000 to $7,499 | 878 (2.7%) | 1,187 (4.3%) |
| $7,500 to $9,999 | 772 (2.3%) | 1,119 (4.0%) |
| $10,000 to $12,499 | 790 (2.4%) | 1,104 (4.0%) |
| $12,500 to $14,999 | 605 (1.8%) | 1,099 (4.0%) |
| $15,000 to $17,499 | 779 (2.4%) | 930 (3.4%) |
| $17,500 to $19,999 | 834 (2.5%) | 590 (2.1%) |
| $20,000 to $22,499 | 670 (2.0%) | 927 (3.3%) |
| $22,500 to $24,999 | 801 (2.4%) | 884 (3.2%) |
| $25,000 to $29,999 | 1,716 (5.2%) | 1,971 (7.1%) |
| $30,000 to $34,999 | 2,516 (7.6%) | 1,955 (7.0%) |
| $35,000 to $39,999 | 1,911 (5.8%) | 1,196 (4.3%) |
| $40,000 to $44,999 | 1,651 (5.0%) | 1,695 (6.1%) |
| $45,000 to $49,999 | 1,698 (5.1%) | 1,414 (5.1%) |
| $50,000 to $54,999 | 2,043 (6.2%) | 1,311 (4.7%) |
| $55,000 to $64,999 | 2,336 (7.1%) | 2,086 (7.5%) |
| $65,000 to $74,999 | 2,677 (8.1%) | 1,332 (4.8%) |
| $75,000 to $99,999 | 3,986 (12.1%) | 2,206 (7.9%) |
| $100,000+ | 4,847 (14.7%) | 2,700 (9.7%) |
| Total | 32,987 (100.0%) | 27,795 (100.0%) |
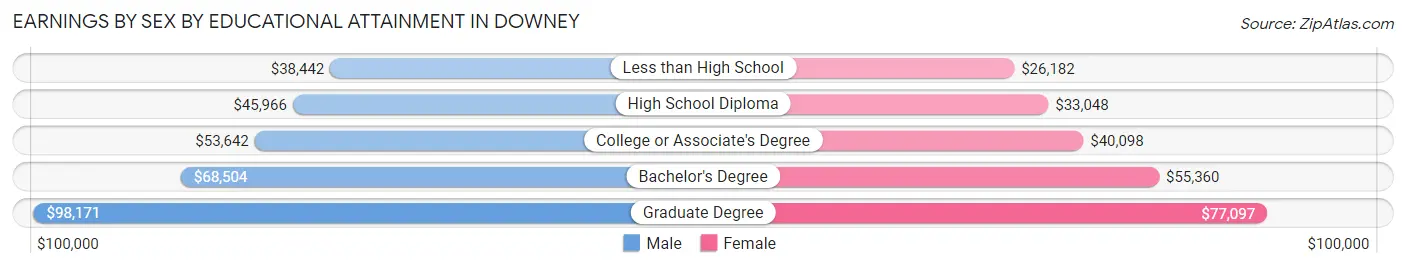
Earnings by Sex by Educational Attainment in Downey
Average earnings in Downey are $52,752 for men and $41,837 for women, a difference of 20.7%. Men with an educational attainment of graduate degree enjoy the highest average annual earnings of $98,171, while those with less than high school education earn the least with $38,442. Women with an educational attainment of graduate degree earn the most with the average annual earnings of $77,097, while those with less than high school education have the smallest earnings of $26,182.
| Educational Attainment | Male Income | Female Income |
| Less than High School | $38,442 | $26,182 |
| High School Diploma | $45,966 | $33,048 |
| College or Associate's Degree | $53,642 | $40,098 |
| Bachelor's Degree | $68,504 | $55,360 |
| Graduate Degree | $98,171 | $77,097 |
| Total | $52,752 | $41,837 |
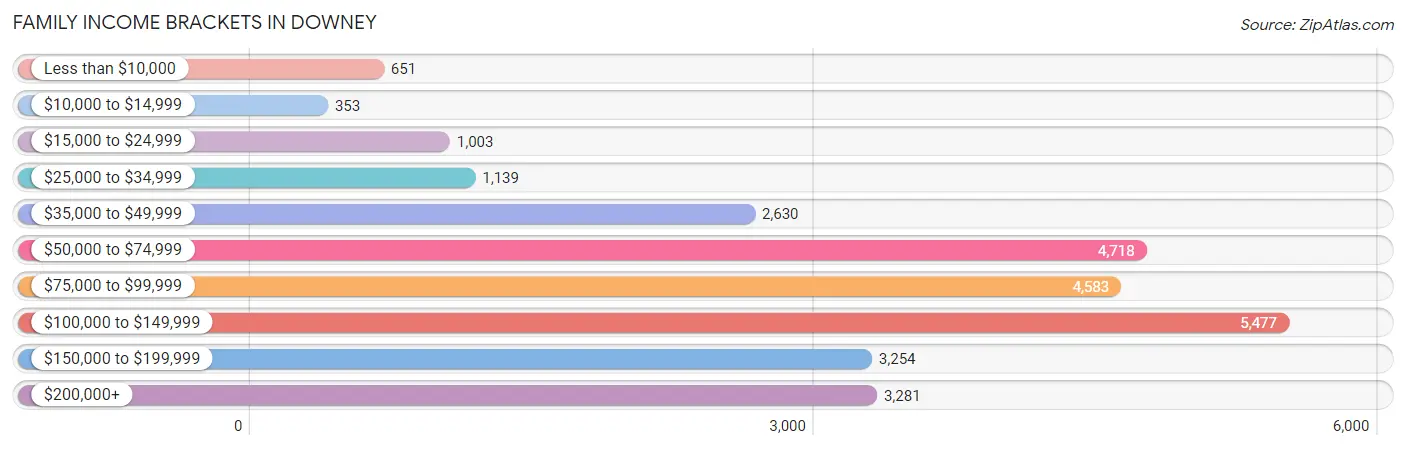
Family Income in Downey
Family Income Brackets in Downey
According to the Downey family income data, there are 5,477 families falling into the $100,000 to $149,999 income range, which is the most common income bracket and makes up 20.2% of all families. Conversely, the $10,000 to $14,999 income bracket is the least frequent group with only 353 families (1.3%) belonging to this category.
| Income Bracket | # Families | % Families |
| Less than $10,000 | 651 | 2.4% |
| $10,000 to $14,999 | 353 | 1.3% |
| $15,000 to $24,999 | 1,003 | 3.7% |
| $25,000 to $34,999 | 1,139 | 4.2% |
| $35,000 to $49,999 | 2,630 | 9.7% |
| $50,000 to $74,999 | 4,718 | 17.4% |
| $75,000 to $99,999 | 4,583 | 16.9% |
| $100,000 to $149,999 | 5,477 | 20.2% |
| $150,000 to $199,999 | 3,254 | 12.0% |
| $200,000+ | 3,281 | 12.1% |
Family Income by Famaliy Size in Downey
7+ person families (707 | 2.6%) account for the highest median family income in Downey with $121,750 per family, while 2-person families (8,409 | 31.0%) have the highest median income of $36,812 per family member.
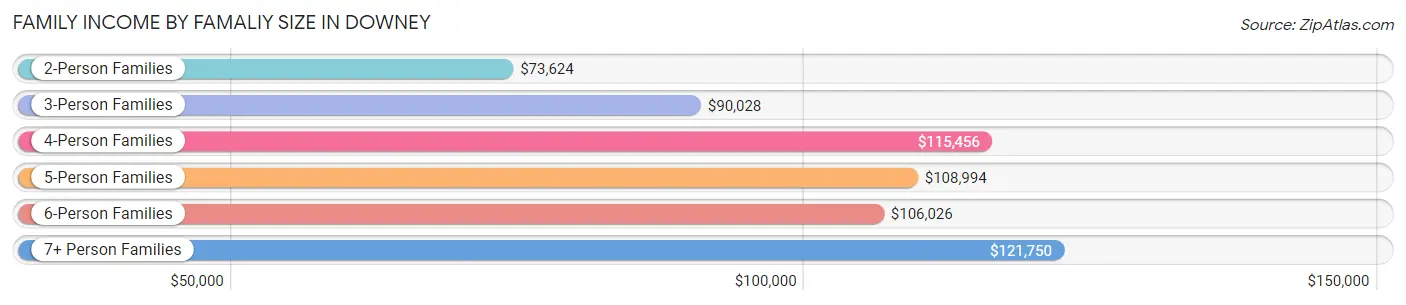
| Income Bracket | # Families | Median Income |
| 2-Person Families | 8,409 (31.0%) | $73,624 |
| 3-Person Families | 7,314 (27.0%) | $90,028 |
| 4-Person Families | 5,939 (21.9%) | $115,456 |
| 5-Person Families | 3,483 (12.8%) | $108,994 |
| 6-Person Families | 1,264 (4.7%) | $106,026 |
| 7+ Person Families | 707 (2.6%) | $121,750 |
| Total | 27,116 (100.0%) | $90,236 |
Family Income by Number of Earners in Downey
The median family income in Downey is $90,236, with families comprising 3+ earners (5,406) having the highest median family income of $157,637, while families with no earners (2,287) have the lowest median family income of $35,165, accounting for 19.9% and 8.4% of families, respectively.
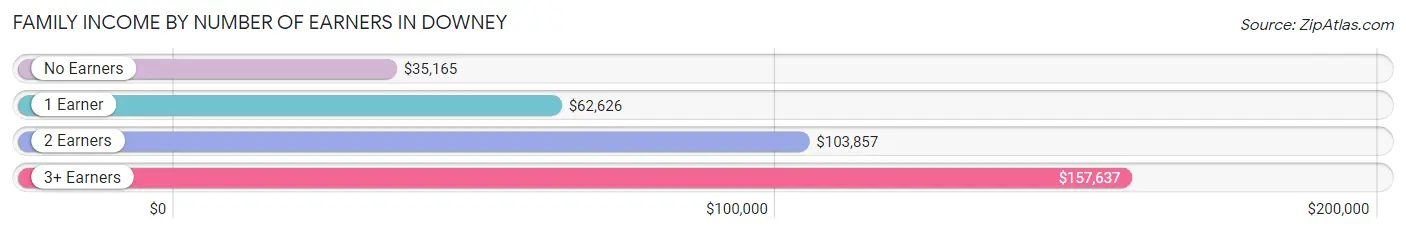
| Number of Earners | # Families | Median Income |
| No Earners | 2,287 (8.4%) | $35,165 |
| 1 Earner | 8,581 (31.7%) | $62,626 |
| 2 Earners | 10,842 (40.0%) | $103,857 |
| 3+ Earners | 5,406 (19.9%) | $157,637 |
| Total | 27,116 (100.0%) | $90,236 |
Household Income in Downey
Household Income Brackets in Downey
With 6,401 households falling in the category, the $100,000 to $149,999 income range is the most frequent in Downey, accounting for 18.4% of all households. In contrast, only 765 households (2.2%) fall into the $10,000 to $14,999 income bracket, making it the least populous group.
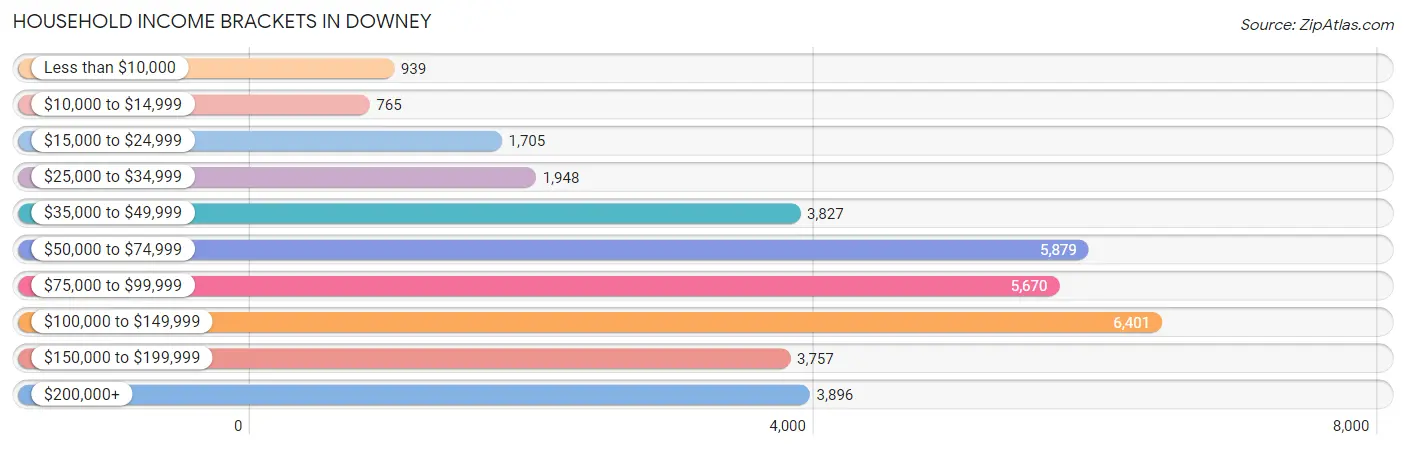
| Income Bracket | # Households | % Households |
| Less than $10,000 | 939 | 2.7% |
| $10,000 to $14,999 | 765 | 2.2% |
| $15,000 to $24,999 | 1,705 | 4.9% |
| $25,000 to $34,999 | 1,948 | 5.6% |
| $35,000 to $49,999 | 3,827 | 11.0% |
| $50,000 to $74,999 | 5,879 | 16.9% |
| $75,000 to $99,999 | 5,670 | 16.3% |
| $100,000 to $149,999 | 6,401 | 18.4% |
| $150,000 to $199,999 | 3,757 | 10.8% |
| $200,000+ | 3,896 | 11.2% |
Household Income by Householder Age in Downey
The median household income in Downey is $84,236, with the highest median household income of $94,515 found in the 45 to 64 years age bracket for the primary householder. A total of 15,269 households (43.9%) fall into this category. Meanwhile, the 65+ years age bracket for the primary householder has the lowest median household income of $64,651, with 7,375 households (21.2%) in this group.
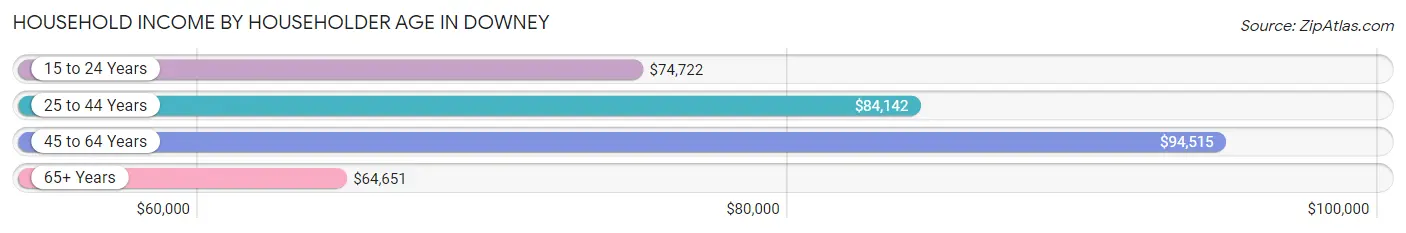
| Income Bracket | # Households | Median Income |
| 15 to 24 Years | 690 (2.0%) | $74,722 |
| 25 to 44 Years | 11,454 (32.9%) | $84,142 |
| 45 to 64 Years | 15,269 (43.9%) | $94,515 |
| 65+ Years | 7,375 (21.2%) | $64,651 |
| Total | 34,788 (100.0%) | $84,236 |
Poverty in Downey
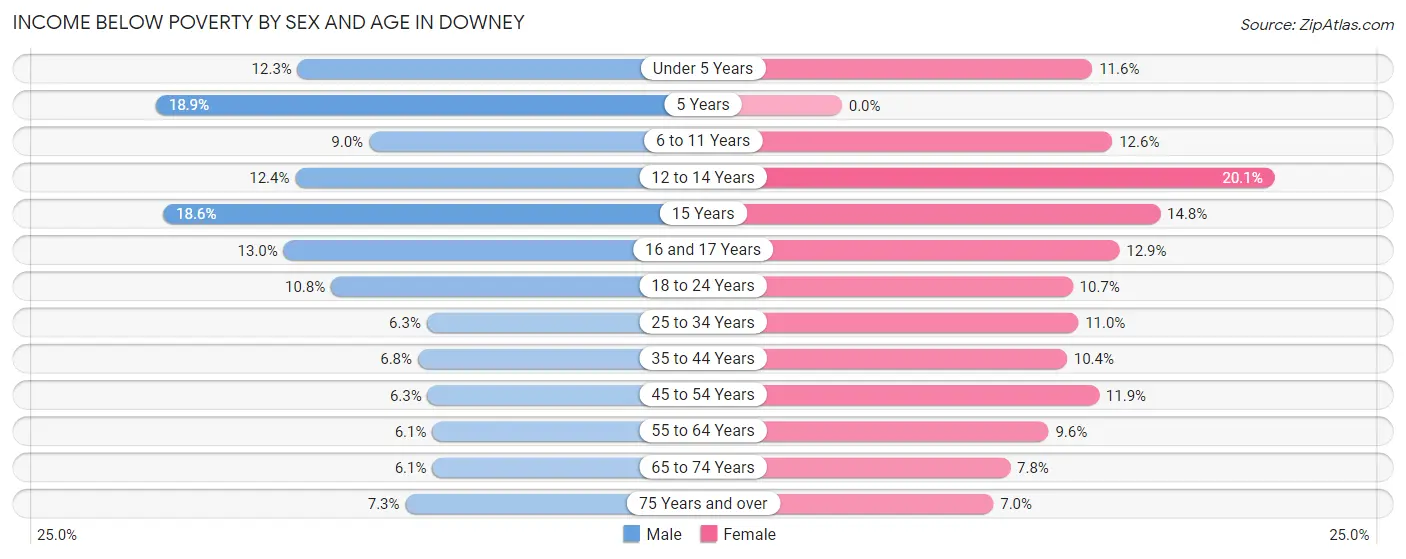
Income Below Poverty by Sex and Age in Downey
With 8.1% poverty level for males and 10.9% for females among the residents of Downey, 5 year old males and 12 to 14 year old females are the most vulnerable to poverty, with 115 males (18.9%) and 470 females (20.1%) in their respective age groups living below the poverty level.
| Age Bracket | Male | Female |
| Under 5 Years | 318 (12.3%) | 337 (11.6%) |
| 5 Years | 115 (18.9%) | 0 (0.0%) |
| 6 to 11 Years | 401 (9.0%) | 554 (12.6%) |
| 12 to 14 Years | 267 (12.4%) | 470 (20.1%) |
| 15 Years | 135 (18.6%) | 135 (14.8%) |
| 16 and 17 Years | 225 (13.0%) | 219 (12.9%) |
| 18 to 24 Years | 563 (10.8%) | 595 (10.7%) |
| 25 to 34 Years | 582 (6.3%) | 903 (11.0%) |
| 35 to 44 Years | 514 (6.8%) | 805 (10.4%) |
| 45 to 54 Years | 518 (6.3%) | 945 (11.9%) |
| 55 to 64 Years | 376 (6.1%) | 636 (9.6%) |
| 65 to 74 Years | 240 (6.1%) | 393 (7.8%) |
| 75 Years and over | 163 (7.3%) | 236 (7.0%) |
| Total | 4,417 (8.1%) | 6,228 (10.9%) |
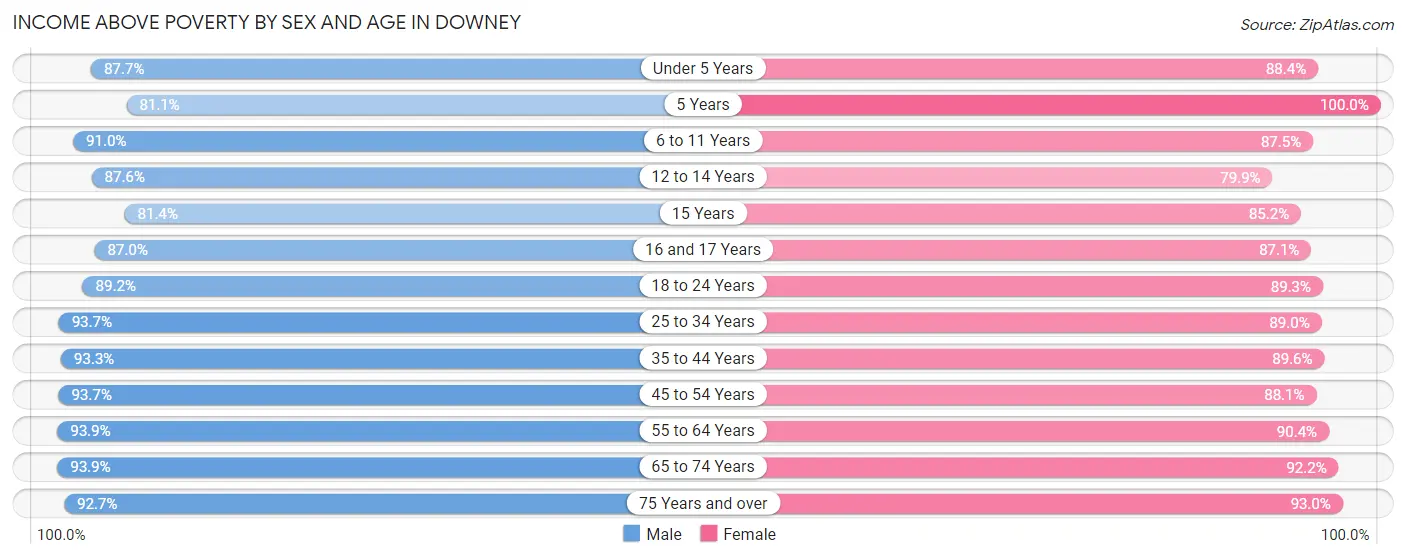
Income Above Poverty by Sex and Age in Downey
According to the poverty statistics in Downey, males aged 55 to 64 years and females aged 5 years are the age groups that are most secure financially, with 93.9% of males and 100.0% of females in these age groups living above the poverty line.
| Age Bracket | Male | Female |
| Under 5 Years | 2,262 (87.7%) | 2,564 (88.4%) |
| 5 Years | 493 (81.1%) | 588 (100.0%) |
| 6 to 11 Years | 4,046 (91.0%) | 3,859 (87.5%) |
| 12 to 14 Years | 1,880 (87.6%) | 1,871 (79.9%) |
| 15 Years | 592 (81.4%) | 779 (85.2%) |
| 16 and 17 Years | 1,509 (87.0%) | 1,481 (87.1%) |
| 18 to 24 Years | 4,662 (89.2%) | 4,962 (89.3%) |
| 25 to 34 Years | 8,595 (93.7%) | 7,328 (89.0%) |
| 35 to 44 Years | 7,105 (93.2%) | 6,903 (89.6%) |
| 45 to 54 Years | 7,704 (93.7%) | 6,973 (88.1%) |
| 55 to 64 Years | 5,804 (93.9%) | 5,995 (90.4%) |
| 65 to 74 Years | 3,706 (93.9%) | 4,637 (92.2%) |
| 75 Years and over | 2,062 (92.7%) | 3,121 (93.0%) |
| Total | 50,420 (91.9%) | 51,061 (89.1%) |
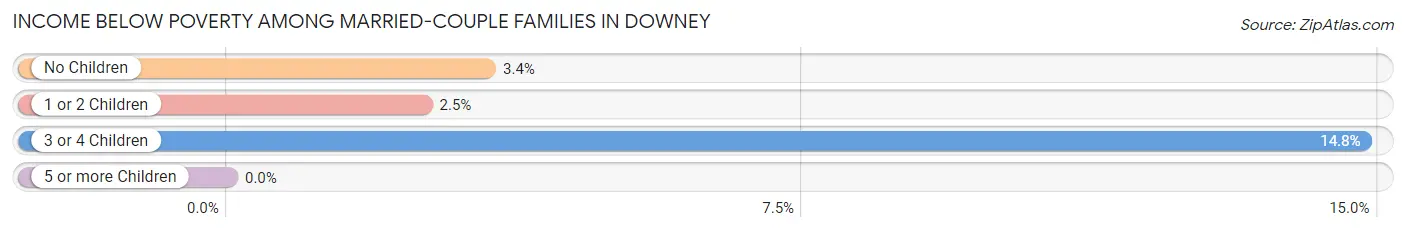
Income Below Poverty Among Married-Couple Families in Downey
The poverty statistics for married-couple families in Downey show that 4.1% or 679 of the total 16,760 families live below the poverty line. Families with 3 or 4 children have the highest poverty rate of 14.8%, comprising of 220 families. On the other hand, families with 5 or more children have the lowest poverty rate of 0.0%, which includes 0 families.
| Children | Above Poverty | Below Poverty |
| No Children | 8,403 (96.6%) | 293 (3.4%) |
| 1 or 2 Children | 6,375 (97.5%) | 166 (2.5%) |
| 3 or 4 Children | 1,265 (85.2%) | 220 (14.8%) |
| 5 or more Children | 38 (100.0%) | 0 (0.0%) |
| Total | 16,081 (96.0%) | 679 (4.1%) |
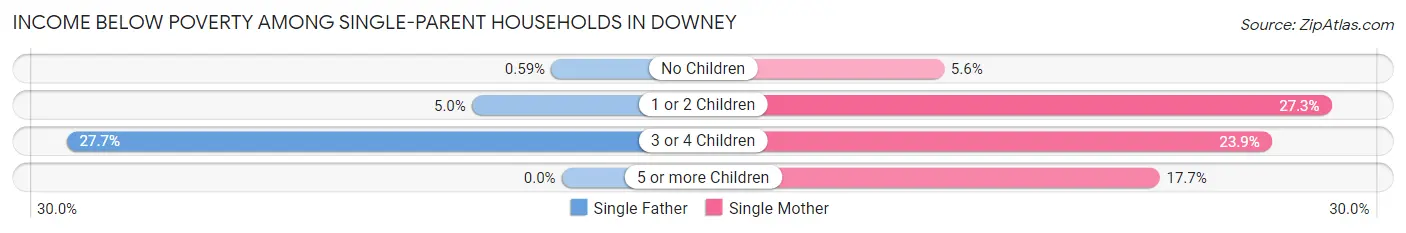
Income Below Poverty Among Single-Parent Households in Downey
According to the poverty data in Downey, 4.5% or 164 single-father households and 16.6% or 1,114 single-mother households are living below the poverty line. Among single-father households, those with 3 or 4 children have the highest poverty rate, with 60 households (27.7%) experiencing poverty. Likewise, among single-mother households, those with 1 or 2 children have the highest poverty rate, with 858 households (27.3%) falling below the poverty line.
| Children | Single Father | Single Mother |
| No Children | 9 (0.6%) | 181 (5.6%) |
| 1 or 2 Children | 95 (5.0%) | 858 (27.3%) |
| 3 or 4 Children | 60 (27.7%) | 66 (23.9%) |
| 5 or more Children | 0 (0.0%) | 9 (17.6%) |
| Total | 164 (4.5%) | 1,114 (16.6%) |
Income Below Poverty Among Married-Couple vs Single-Parent Households in Downey
The poverty data for Downey shows that 679 of the married-couple family households (4.1%) and 1,278 of the single-parent households (12.3%) are living below the poverty level. Within the married-couple family households, those with 3 or 4 children have the highest poverty rate, with 220 households (14.8%) falling below the poverty line. Among the single-parent households, those with 3 or 4 children have the highest poverty rate, with 126 household (25.6%) living below poverty.
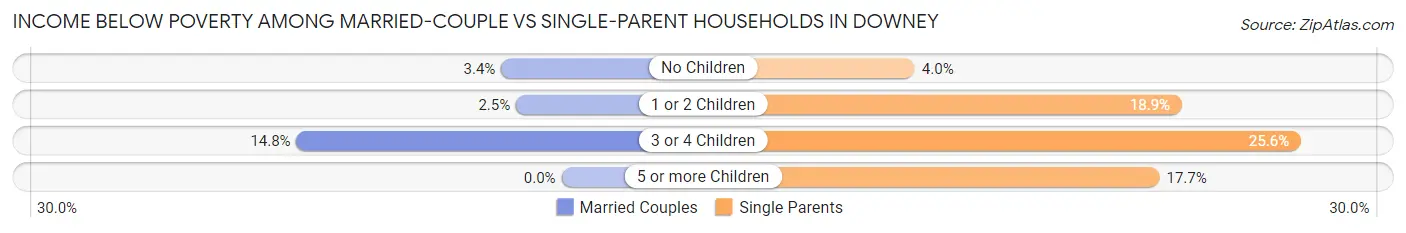
| Children | Married-Couple Families | Single-Parent Households |
| No Children | 293 (3.4%) | 190 (4.0%) |
| 1 or 2 Children | 166 (2.5%) | 953 (18.9%) |
| 3 or 4 Children | 220 (14.8%) | 126 (25.6%) |
| 5 or more Children | 0 (0.0%) | 9 (17.6%) |
| Total | 679 (4.1%) | 1,278 (12.3%) |
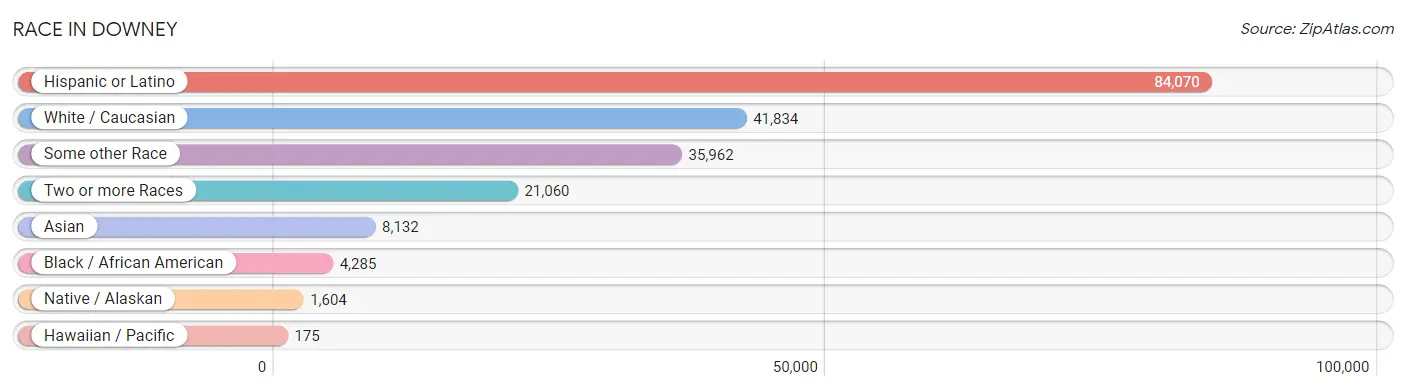
Race in Downey
The most populous races in Downey are Hispanic or Latino (84,070 | 74.4%), White / Caucasian (41,834 | 37.0%), and Some other Race (35,962 | 31.8%).
| Race | # Population | % Population |
| Asian | 8,132 | 7.2% |
| Black / African American | 4,285 | 3.8% |
| Hawaiian / Pacific | 175 | 0.2% |
| Hispanic or Latino | 84,070 | 74.4% |
| Native / Alaskan | 1,604 | 1.4% |
| White / Caucasian | 41,834 | 37.0% |
| Two or more Races | 21,060 | 18.6% |
| Some other Race | 35,962 | 31.8% |
| Total | 113,052 | 100.0% |
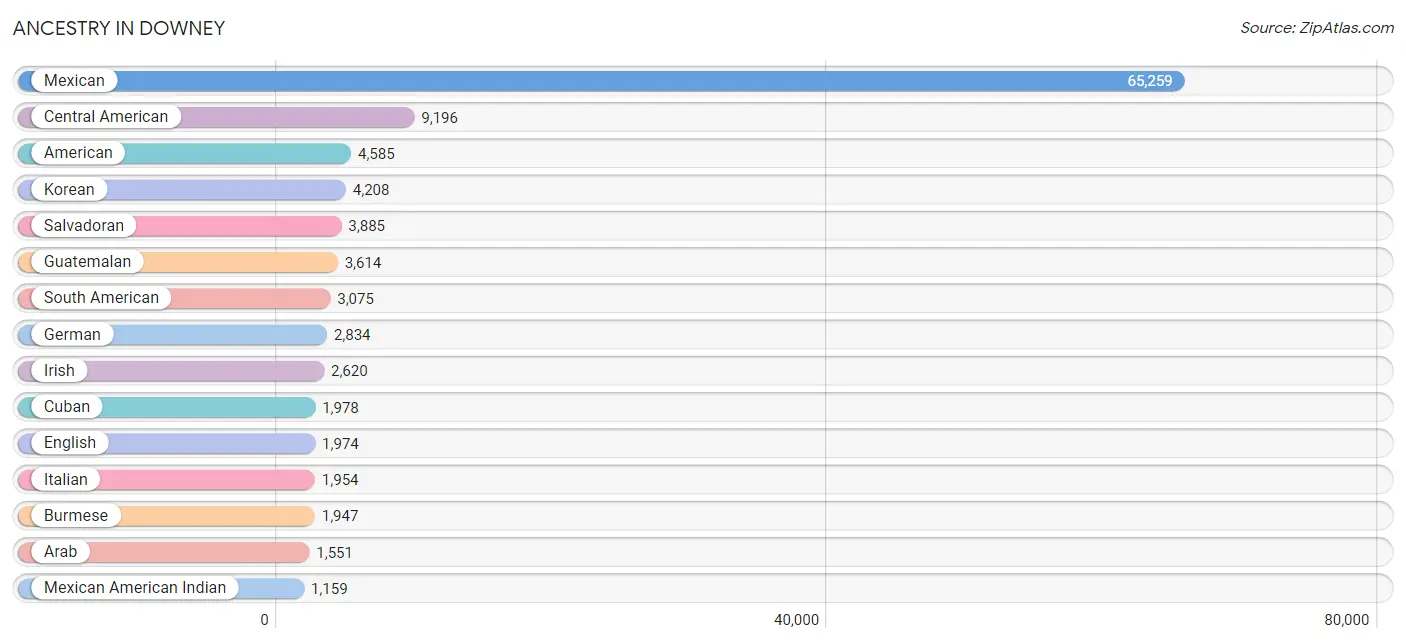
Ancestry in Downey
The most populous ancestries reported in Downey are Mexican (65,259 | 57.7%), Central American (9,196 | 8.1%), American (4,585 | 4.1%), Korean (4,208 | 3.7%), and Salvadoran (3,885 | 3.4%), together accounting for 77.1% of all Downey residents.
| Ancestry | # Population | % Population |
| African | 278 | 0.3% |
| American | 4,585 | 4.1% |
| Apache | 8 | 0.0% |
| Arab | 1,551 | 1.4% |
| Argentinean | 427 | 0.4% |
| Armenian | 403 | 0.4% |
| Austrian | 16 | 0.0% |
| Basque | 56 | 0.1% |
| Belizean | 189 | 0.2% |
| Bhutanese | 365 | 0.3% |
| Bolivian | 129 | 0.1% |
| Brazilian | 65 | 0.1% |
| British | 264 | 0.2% |
| Burmese | 1,947 | 1.7% |
| Canadian | 32 | 0.0% |
| Cape Verdean | 8 | 0.0% |
| Central American | 9,196 | 8.1% |
| Central American Indian | 582 | 0.5% |
| Cherokee | 17 | 0.0% |
| Chilean | 109 | 0.1% |
| Chippewa | 43 | 0.0% |
| Choctaw | 106 | 0.1% |
| Colombian | 406 | 0.4% |
| Costa Rican | 221 | 0.2% |
| Croatian | 75 | 0.1% |
| Crow | 7 | 0.0% |
| Cuban | 1,978 | 1.8% |
| Czech | 77 | 0.1% |
| Czechoslovakian | 37 | 0.0% |
| Danish | 62 | 0.1% |
| Dominican | 54 | 0.1% |
| Dutch | 174 | 0.2% |
| Eastern European | 29 | 0.0% |
| Ecuadorian | 944 | 0.8% |
| Egyptian | 443 | 0.4% |
| English | 1,974 | 1.8% |
| Ethiopian | 9 | 0.0% |
| European | 943 | 0.8% |
| Filipino | 65 | 0.1% |
| Finnish | 11 | 0.0% |
| French | 720 | 0.6% |
| French Canadian | 365 | 0.3% |
| German | 2,834 | 2.5% |
| Ghanaian | 42 | 0.0% |
| Greek | 492 | 0.4% |
| Guamanian / Chamorro | 106 | 0.1% |
| Guatemalan | 3,614 | 3.2% |
| Haitian | 22 | 0.0% |
| Honduran | 345 | 0.3% |
| Hungarian | 173 | 0.2% |
| Indian (Asian) | 779 | 0.7% |
| Iranian | 148 | 0.1% |
| Iraqi | 10 | 0.0% |
| Irish | 2,620 | 2.3% |
| Israeli | 18 | 0.0% |
| Italian | 1,954 | 1.7% |
| Jamaican | 25 | 0.0% |
| Japanese | 122 | 0.1% |
| Jordanian | 175 | 0.2% |
| Kenyan | 61 | 0.1% |
| Korean | 4,208 | 3.7% |
| Laotian | 24 | 0.0% |
| Lebanese | 550 | 0.5% |
| Lithuanian | 89 | 0.1% |
| Macedonian | 33 | 0.0% |
| Malaysian | 56 | 0.1% |
| Mexican | 65,259 | 57.7% |
| Mexican American Indian | 1,159 | 1.0% |
| Native Hawaiian | 21 | 0.0% |
| Navajo | 80 | 0.1% |
| Nicaraguan | 975 | 0.9% |
| Nigerian | 75 | 0.1% |
| Northern European | 33 | 0.0% |
| Norwegian | 293 | 0.3% |
| Pakistani | 190 | 0.2% |
| Palestinian | 44 | 0.0% |
| Panamanian | 71 | 0.1% |
| Peruvian | 1,051 | 0.9% |
| Polish | 578 | 0.5% |
| Portuguese | 358 | 0.3% |
| Puerto Rican | 813 | 0.7% |
| Romanian | 365 | 0.3% |
| Russian | 227 | 0.2% |
| Salvadoran | 3,885 | 3.4% |
| Samoan | 148 | 0.1% |
| Scandinavian | 188 | 0.2% |
| Scotch-Irish | 132 | 0.1% |
| Scottish | 393 | 0.4% |
| Slavic | 29 | 0.0% |
| Slovak | 5 | 0.0% |
| Somali | 6 | 0.0% |
| South American | 3,075 | 2.7% |
| South American Indian | 53 | 0.1% |
| Spaniard | 777 | 0.7% |
| Spanish | 188 | 0.2% |
| Spanish American | 19 | 0.0% |
| Spanish American Indian | 17 | 0.0% |
| Sri Lankan | 445 | 0.4% |
| Subsaharan African | 490 | 0.4% |
| Swedish | 109 | 0.1% |
| Swiss | 23 | 0.0% |
| Syrian | 29 | 0.0% |
| Thai | 791 | 0.7% |
| Trinidadian and Tobagonian | 14 | 0.0% |
| Venezuelan | 9 | 0.0% |
| Vietnamese | 237 | 0.2% |
| Welsh | 77 | 0.1% |
| Yakama | 14 | 0.0% |
| Yaqui | 28 | 0.0% |
| Yugoslavian | 57 | 0.1% | View All 110 Rows |
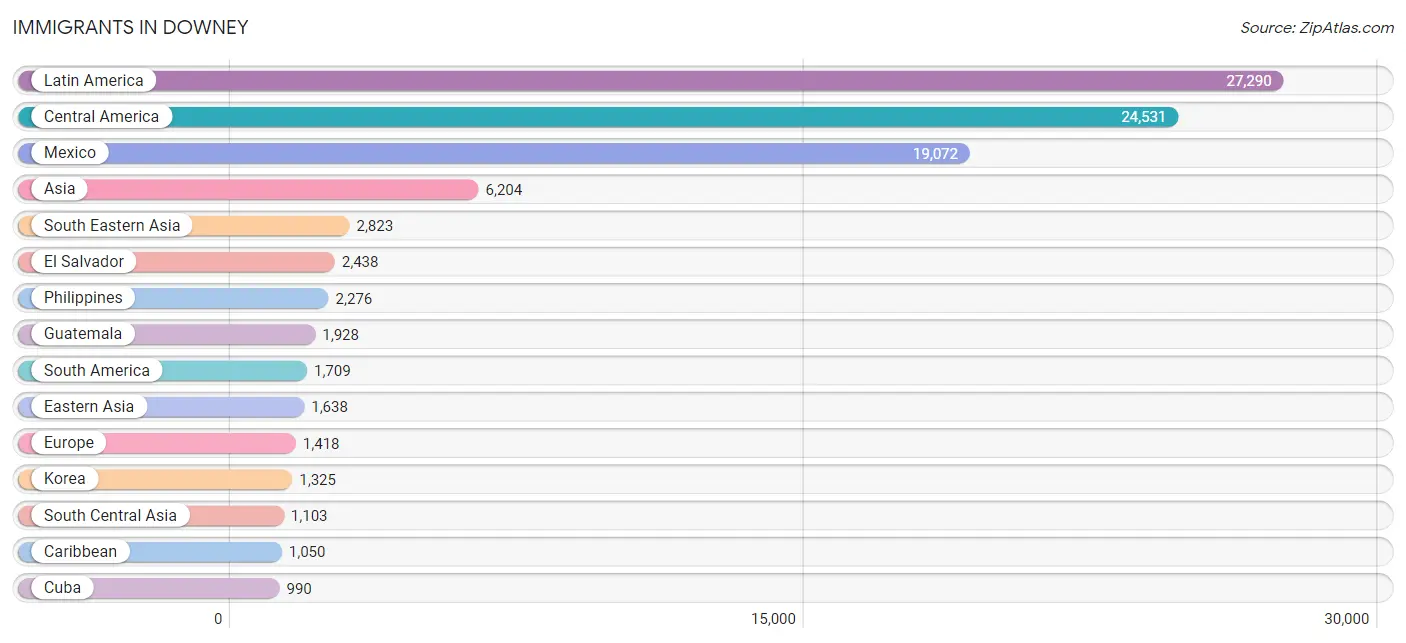
Immigrants in Downey
The most numerous immigrant groups reported in Downey came from Latin America (27,290 | 24.1%), Central America (24,531 | 21.7%), Mexico (19,072 | 16.9%), Asia (6,204 | 5.5%), and South Eastern Asia (2,823 | 2.5%), together accounting for 70.7% of all Downey residents.
| Immigration Origin | # Population | % Population |
| Africa | 654 | 0.6% |
| Argentina | 260 | 0.2% |
| Armenia | 64 | 0.1% |
| Asia | 6,204 | 5.5% |
| Australia | 58 | 0.1% |
| Bangladesh | 237 | 0.2% |
| Belize | 166 | 0.2% |
| Bolivia | 67 | 0.1% |
| Brazil | 127 | 0.1% |
| Cambodia | 76 | 0.1% |
| Cameroon | 1 | 0.0% |
| Canada | 107 | 0.1% |
| Caribbean | 1,050 | 0.9% |
| Central America | 24,531 | 21.7% |
| Chile | 109 | 0.1% |
| China | 256 | 0.2% |
| Colombia | 217 | 0.2% |
| Costa Rica | 168 | 0.2% |
| Cuba | 990 | 0.9% |
| Czechoslovakia | 22 | 0.0% |
| Dominican Republic | 37 | 0.0% |
| Eastern Africa | 102 | 0.1% |
| Eastern Asia | 1,638 | 1.5% |
| Eastern Europe | 693 | 0.6% |
| Ecuador | 291 | 0.3% |
| Egypt | 374 | 0.3% |
| El Salvador | 2,438 | 2.2% |
| England | 166 | 0.2% |
| Eritrea | 9 | 0.0% |
| Europe | 1,418 | 1.3% |
| France | 6 | 0.0% |
| Germany | 42 | 0.0% |
| Ghana | 36 | 0.0% |
| Greece | 99 | 0.1% |
| Guatemala | 1,928 | 1.7% |
| Honduras | 316 | 0.3% |
| Hong Kong | 13 | 0.0% |
| India | 706 | 0.6% |
| Indonesia | 42 | 0.0% |
| Iran | 44 | 0.0% |
| Iraq | 23 | 0.0% |
| Ireland | 21 | 0.0% |
| Israel | 15 | 0.0% |
| Italy | 34 | 0.0% |
| Jamaica | 23 | 0.0% |
| Japan | 57 | 0.1% |
| Jordan | 32 | 0.0% |
| Kenya | 61 | 0.1% |
| Korea | 1,325 | 1.2% |
| Laos | 23 | 0.0% |
| Latin America | 27,290 | 24.1% |
| Lebanon | 187 | 0.2% |
| Liberia | 7 | 0.0% |
| Mexico | 19,072 | 16.9% |
| Middle Africa | 6 | 0.0% |
| Moldova | 46 | 0.0% |
| Morocco | 16 | 0.0% |
| Nicaragua | 420 | 0.4% |
| Nigeria | 92 | 0.1% |
| Northern Africa | 402 | 0.4% |
| Northern Europe | 392 | 0.4% |
| Norway | 11 | 0.0% |
| Oceania | 58 | 0.1% |
| Pakistan | 116 | 0.1% |
| Panama | 23 | 0.0% |
| Peru | 638 | 0.6% |
| Philippines | 2,276 | 2.0% |
| Poland | 49 | 0.0% |
| Portugal | 36 | 0.0% |
| Romania | 158 | 0.1% |
| Russia | 76 | 0.1% |
| Saudi Arabia | 17 | 0.0% |
| Somalia | 6 | 0.0% |
| South Africa | 9 | 0.0% |
| South America | 1,709 | 1.5% |
| South Central Asia | 1,103 | 1.0% |
| South Eastern Asia | 2,823 | 2.5% |
| Southern Europe | 280 | 0.3% |
| Spain | 85 | 0.1% |
| Switzerland | 5 | 0.0% |
| Syria | 228 | 0.2% |
| Taiwan | 112 | 0.1% |
| Thailand | 126 | 0.1% |
| Turkey | 9 | 0.0% |
| Ukraine | 8 | 0.0% |
| Vietnam | 280 | 0.3% |
| Western Africa | 135 | 0.1% |
| Western Asia | 575 | 0.5% |
| Western Europe | 53 | 0.1% |
| Zaire | 5 | 0.0% | View All 90 Rows |
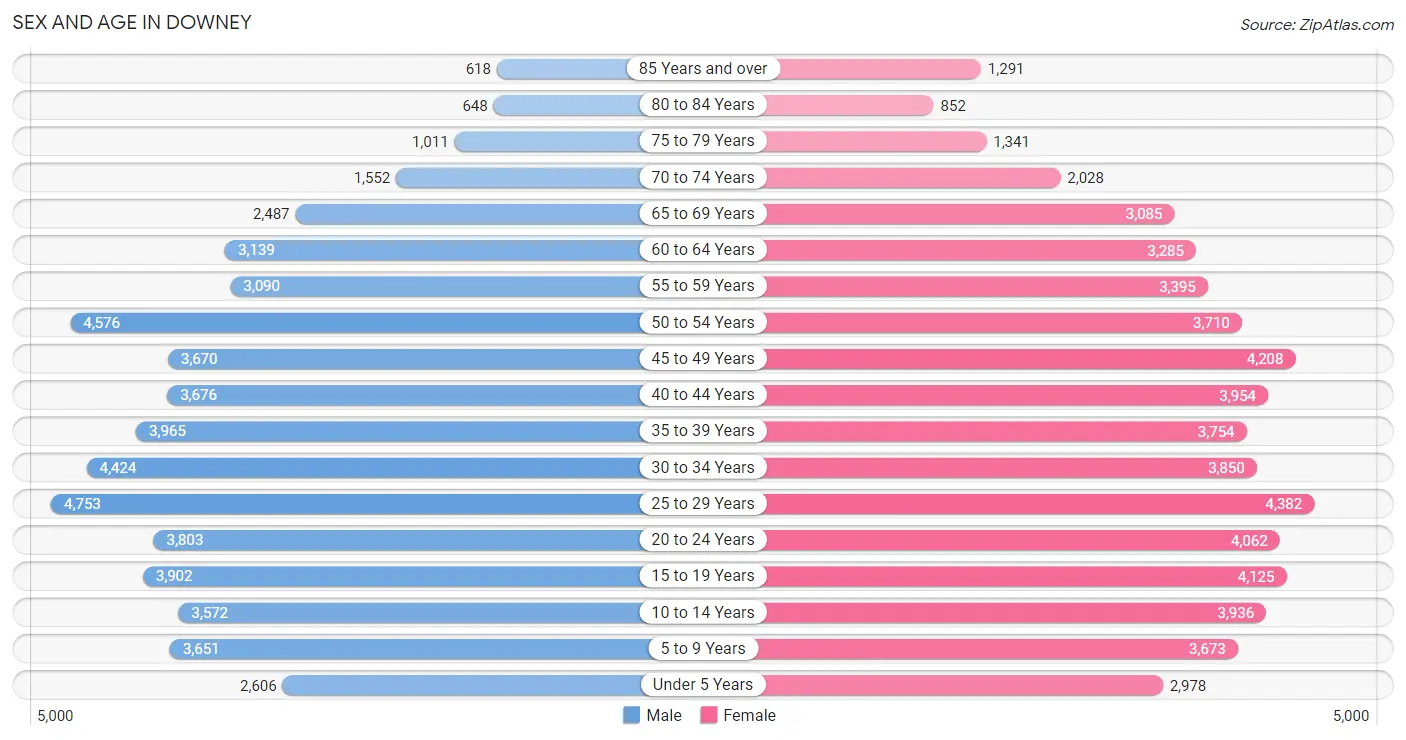
Sex and Age in Downey
Sex and Age in Downey
The most populous age groups in Downey are 25 to 29 Years (4,753 | 8.6%) for men and 25 to 29 Years (4,382 | 7.6%) for women.
| Age Bracket | Male | Female |
| Under 5 Years | 2,606 (4.7%) | 2,978 (5.1%) |
| 5 to 9 Years | 3,651 (6.6%) | 3,673 (6.3%) |
| 10 to 14 Years | 3,572 (6.5%) | 3,936 (6.8%) |
| 15 to 19 Years | 3,902 (7.1%) | 4,125 (7.1%) |
| 20 to 24 Years | 3,803 (6.9%) | 4,062 (7.0%) |
| 25 to 29 Years | 4,753 (8.6%) | 4,382 (7.6%) |
| 30 to 34 Years | 4,424 (8.0%) | 3,850 (6.7%) |
| 35 to 39 Years | 3,965 (7.2%) | 3,754 (6.5%) |
| 40 to 44 Years | 3,676 (6.7%) | 3,954 (6.8%) |
| 45 to 49 Years | 3,670 (6.7%) | 4,208 (7.3%) |
| 50 to 54 Years | 4,576 (8.3%) | 3,710 (6.4%) |
| 55 to 59 Years | 3,090 (5.6%) | 3,395 (5.9%) |
| 60 to 64 Years | 3,139 (5.7%) | 3,285 (5.7%) |
| 65 to 69 Years | 2,487 (4.5%) | 3,085 (5.3%) |
| 70 to 74 Years | 1,552 (2.8%) | 2,028 (3.5%) |
| 75 to 79 Years | 1,011 (1.8%) | 1,341 (2.3%) |
| 80 to 84 Years | 648 (1.2%) | 852 (1.5%) |
| 85 Years and over | 618 (1.1%) | 1,291 (2.2%) |
| Total | 55,143 (100.0%) | 57,909 (100.0%) |
Families and Households in Downey
Median Family Size in Downey
The median family size in Downey is 3.62 persons per family, with married-couple families (16,760 | 61.8%) accounting for the largest median family size of 3.84 persons per family. On the other hand, single male/father families (3,647 | 13.5%) represent the smallest median family size with 3.18 persons per family.
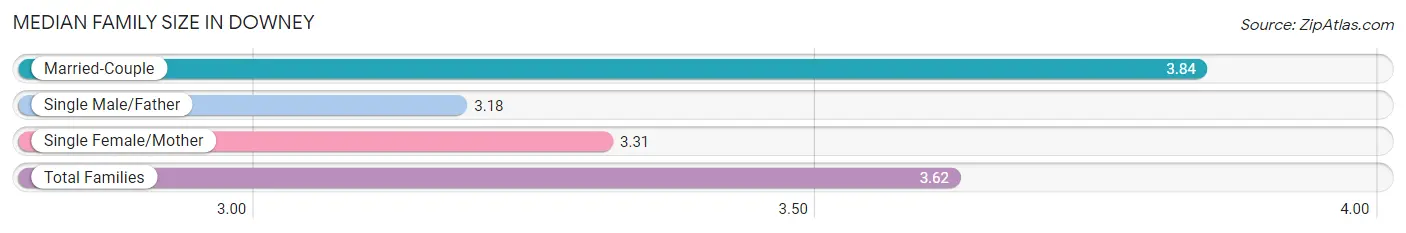
| Family Type | # Families | Family Size |
| Married-Couple | 16,760 (61.8%) | 3.84 |
| Single Male/Father | 3,647 (13.5%) | 3.18 |
| Single Female/Mother | 6,709 (24.7%) | 3.31 |
| Total Families | 27,116 (100.0%) | 3.62 |
Median Household Size in Downey
The median household size in Downey is 3.22 persons per household, with married-couple households (16,760 | 48.2%) accounting for the largest median household size of 3.88 persons per household. non-family households (7,672 | 22.1%) represent the smallest median household size with 1.30 persons per household.
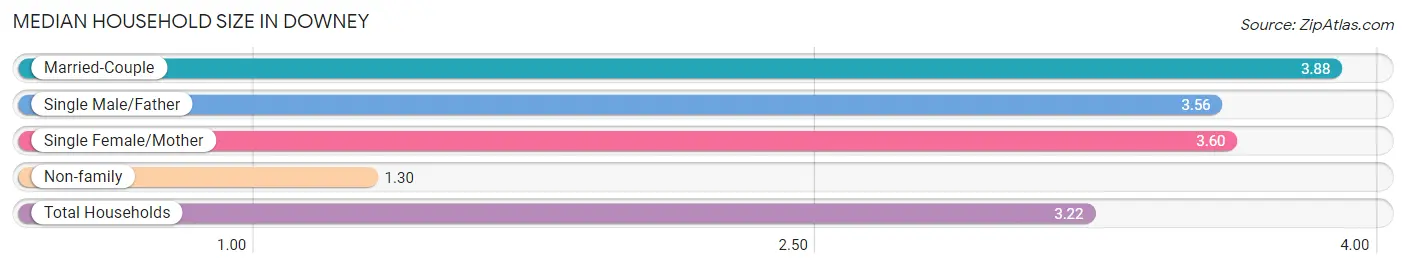
| Household Type | # Households | Household Size |
| Married-Couple | 16,760 (48.2%) | 3.88 |
| Single Male/Father | 3,647 (10.5%) | 3.56 |
| Single Female/Mother | 6,709 (19.3%) | 3.60 |
| Non-family | 7,672 (22.1%) | 1.30 |
| Total Households | 34,788 (100.0%) | 3.22 |
Household Size by Marriage Status in Downey
Out of a total of 34,788 households in Downey, 27,116 (77.9%) are family households, while 7,672 (22.1%) are nonfamily households. The most numerous type of family households are 3-person households, comprising 7,357, and the most common type of nonfamily households are 1-person households, comprising 5,917.
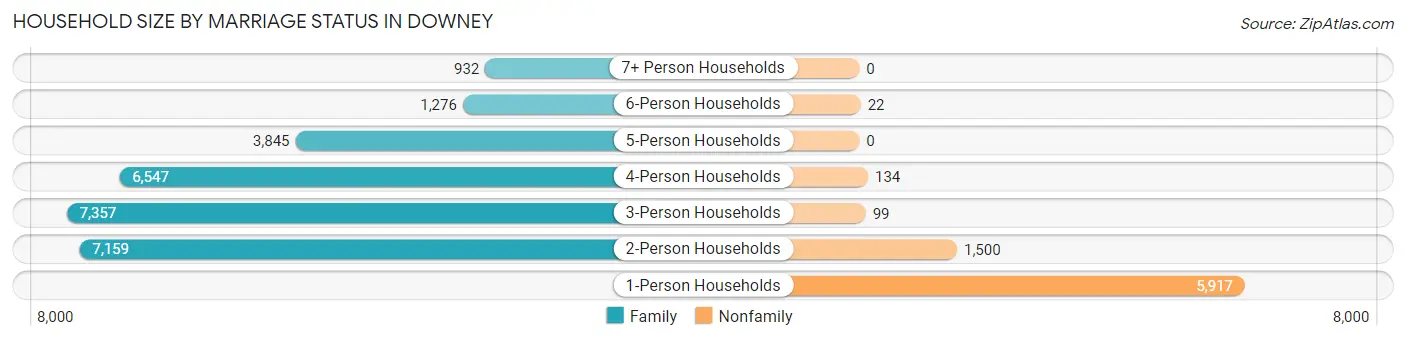
| Household Size | Family Households | Nonfamily Households |
| 1-Person Households | - | 5,917 (17.0%) |
| 2-Person Households | 7,159 (20.6%) | 1,500 (4.3%) |
| 3-Person Households | 7,357 (21.1%) | 99 (0.3%) |
| 4-Person Households | 6,547 (18.8%) | 134 (0.4%) |
| 5-Person Households | 3,845 (11.1%) | 0 (0.0%) |
| 6-Person Households | 1,276 (3.7%) | 22 (0.1%) |
| 7+ Person Households | 932 (2.7%) | 0 (0.0%) |
| Total | 27,116 (77.9%) | 7,672 (22.1%) |
Female Fertility in Downey
Fertility by Age in Downey
Average fertility rate in Downey is 45.0 births per 1,000 women. Women in the age bracket of 20 to 34 years have the highest fertility rate with 70.0 births per 1,000 women. Women in the age bracket of 20 to 34 years acount for 66.0% of all women with births.
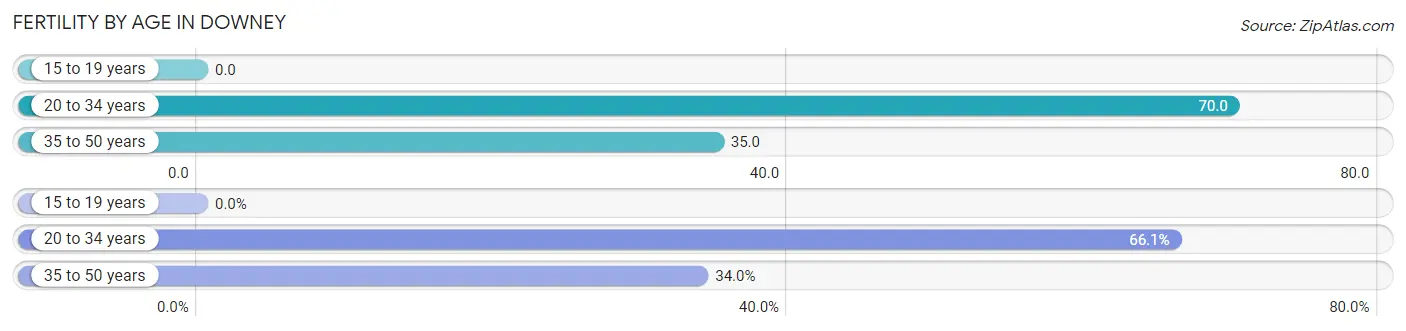
| Age Bracket | Women with Births | Births / 1,000 Women |
| 15 to 19 years | 0 (0.0%) | 0.0 |
| 20 to 34 years | 856 (66.0%) | 70.0 |
| 35 to 50 years | 440 (34.0%) | 35.0 |
| Total | 1,296 (100.0%) | 45.0 |
Fertility by Age by Marriage Status in Downey
71.9% of women with births (1,296) in Downey are married. The highest percentage of unmarried women with births falls into 20 to 34 years age bracket with 35.9% of them unmarried at the time of birth, while the lowest percentage of unmarried women with births belong to 35 to 50 years age bracket with 12.9% of them unmarried.
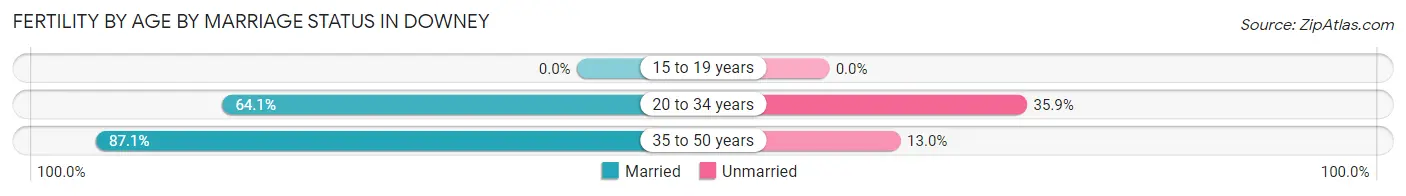
| Age Bracket | Married | Unmarried |
| 15 to 19 years | 0 (0.0%) | 0 (0.0%) |
| 20 to 34 years | 549 (64.1%) | 307 (35.9%) |
| 35 to 50 years | 383 (87.1%) | 57 (13.0%) |
| Total | 932 (71.9%) | 364 (28.1%) |
Fertility by Education in Downey
Average fertility rate in Downey is 45.0 births per 1,000 women. Women with the education attainment of high school diploma have the highest fertility rate of 62.0 births per 1,000 women, while women with the education attainment of less than high school have the lowest fertility at 27.0 births per 1,000 women. Women with the education attainment of high school diploma represent 31.6% of all women with births.
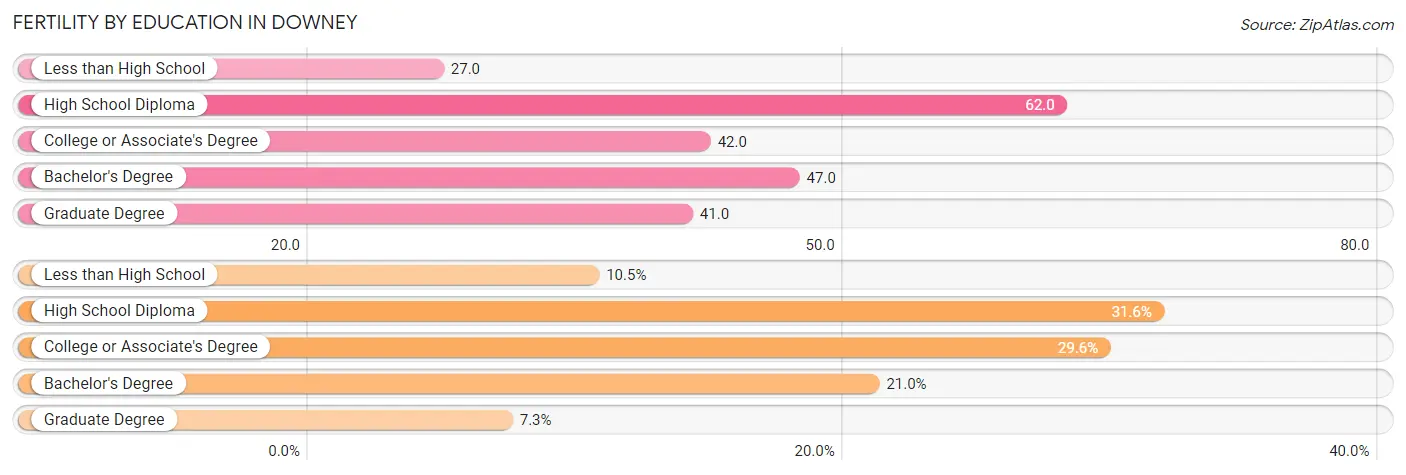
| Educational Attainment | Women with Births | Births / 1,000 Women |
| Less than High School | 136 (10.5%) | 27.0 |
| High School Diploma | 410 (31.6%) | 62.0 |
| College or Associate's Degree | 384 (29.6%) | 42.0 |
| Bachelor's Degree | 272 (21.0%) | 47.0 |
| Graduate Degree | 94 (7.2%) | 41.0 |
| Total | 1,296 (100.0%) | 45.0 |
Fertility by Education by Marriage Status in Downey
28.1% of women with births in Downey are unmarried. Women with the educational attainment of bachelor's degree are most likely to be married with 90.4% of them married at childbirth, while women with the educational attainment of graduate degree are least likely to be married with 38.3% of them unmarried at childbirth.
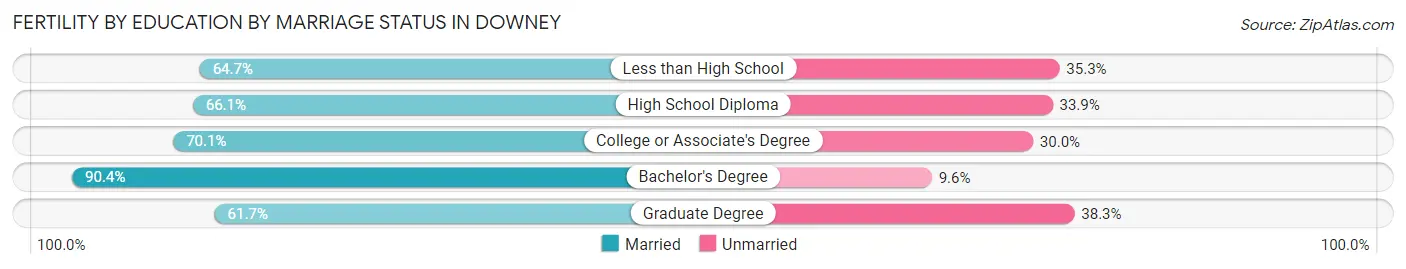
| Educational Attainment | Married | Unmarried |
| Less than High School | 88 (64.7%) | 48 (35.3%) |
| High School Diploma | 271 (66.1%) | 139 (33.9%) |
| College or Associate's Degree | 269 (70.1%) | 115 (29.9%) |
| Bachelor's Degree | 246 (90.4%) | 26 (9.6%) |
| Graduate Degree | 58 (61.7%) | 36 (38.3%) |
| Total | 932 (71.9%) | 364 (28.1%) |
Employment Characteristics in Downey
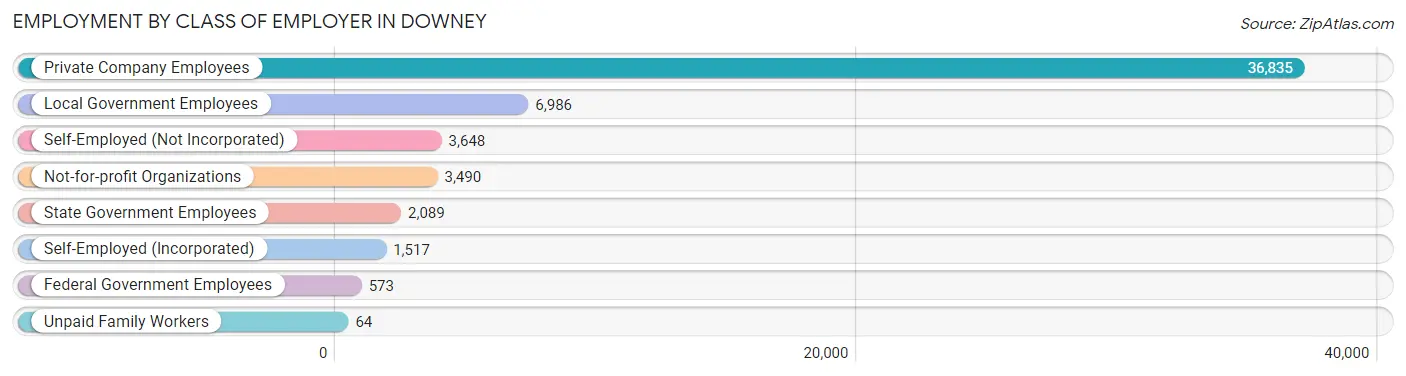
Employment by Class of Employer in Downey
Among the 55,202 employed individuals in Downey, private company employees (36,835 | 66.7%), local government employees (6,986 | 12.7%), and self-employed (not incorporated) (3,648 | 6.6%) make up the most common classes of employment.
| Employer Class | # Employees | % Employees |
| Private Company Employees | 36,835 | 66.7% |
| Self-Employed (Incorporated) | 1,517 | 2.8% |
| Self-Employed (Not Incorporated) | 3,648 | 6.6% |
| Not-for-profit Organizations | 3,490 | 6.3% |
| Local Government Employees | 6,986 | 12.7% |
| State Government Employees | 2,089 | 3.8% |
| Federal Government Employees | 573 | 1.0% |
| Unpaid Family Workers | 64 | 0.1% |
| Total | 55,202 | 100.0% |
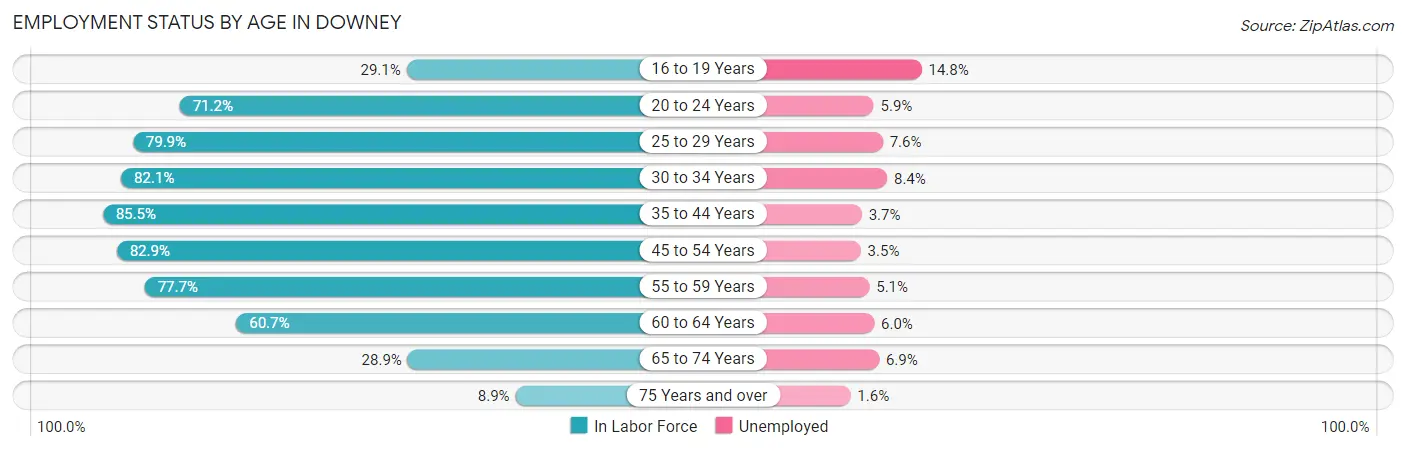
Employment Status by Age in Downey
According to the labor force statistics for Downey, out of the total population over 16 years of age (90,992), 66.1% or 60,146 individuals are in the labor force, with 5.6% or 3,368 of them unemployed. The age group with the highest labor force participation rate is 35 to 44 years, with 85.5% or 13,123 individuals in the labor force. Within the labor force, the 16 to 19 years age range has the highest percentage of unemployed individuals, with 14.8% or 275 of them being unemployed.
| Age Bracket | In Labor Force | Unemployed |
| 16 to 19 Years | 1,857 (29.1%) | 275 (14.8%) |
| 20 to 24 Years | 5,600 (71.2%) | 330 (5.9%) |
| 25 to 29 Years | 7,299 (79.9%) | 555 (7.6%) |
| 30 to 34 Years | 6,793 (82.1%) | 571 (8.4%) |
| 35 to 44 Years | 13,123 (85.5%) | 486 (3.7%) |
| 45 to 54 Years | 13,400 (82.9%) | 469 (3.5%) |
| 55 to 59 Years | 5,039 (77.7%) | 257 (5.1%) |
| 60 to 64 Years | 3,899 (60.7%) | 234 (6.0%) |
| 65 to 74 Years | 2,645 (28.9%) | 183 (6.9%) |
| 75 Years and over | 513 (8.9%) | 8 (1.6%) |
| Total | 60,146 (66.1%) | 3,368 (5.6%) |
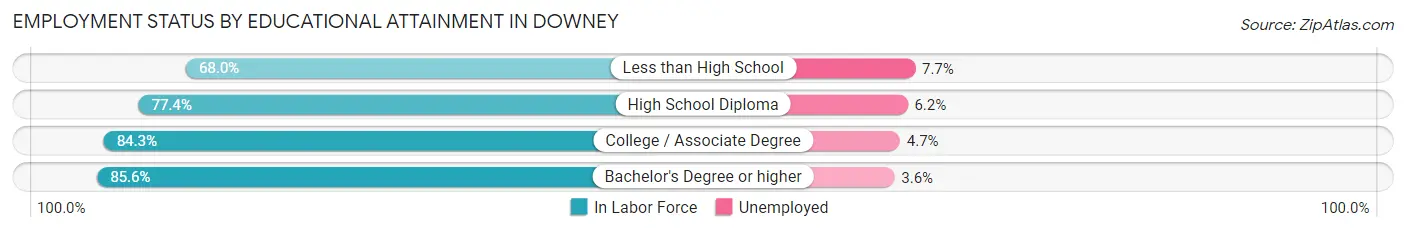
Employment Status by Educational Attainment in Downey
According to labor force statistics for Downey, 80.2% of individuals (49,588) out of the total population between 25 and 64 years of age (61,831) are in the labor force, with 5.2% or 2,579 of them being unemployed. The group with the highest labor force participation rate are those with the educational attainment of bachelor's degree or higher, with 85.6% or 14,115 individuals in the labor force. Within the labor force, individuals with less than high school education have the highest percentage of unemployment, with 7.7% or 527 of them being unemployed.
| Educational Attainment | In Labor Force | Unemployed |
| Less than High School | 6,846 (68.0%) | 775 (7.7%) |
| High School Diploma | 12,765 (77.4%) | 1,023 (6.2%) |
| College / Associate Degree | 15,834 (84.3%) | 883 (4.7%) |
| Bachelor's Degree or higher | 14,115 (85.6%) | 594 (3.6%) |
| Total | 49,588 (80.2%) | 3,215 (5.2%) |
Employment Occupations by Sex in Downey
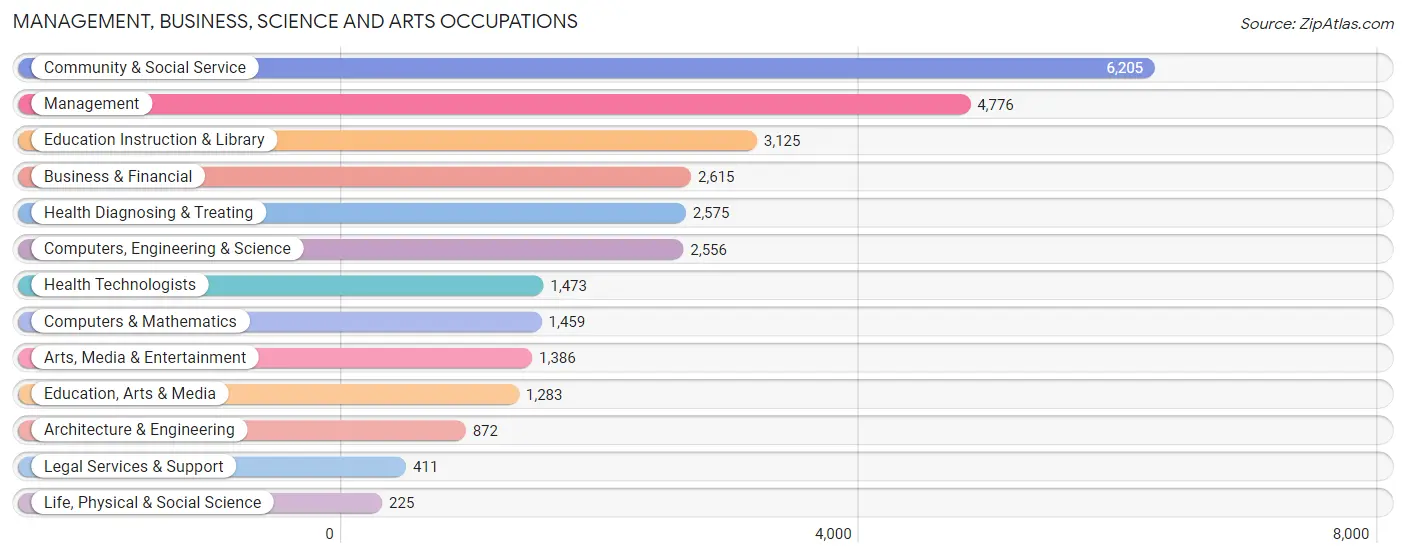
Management, Business, Science and Arts Occupations
The most common Management, Business, Science and Arts occupations in Downey are Community & Social Service (6,205 | 11.0%), Management (4,776 | 8.4%), Education Instruction & Library (3,125 | 5.5%), Business & Financial (2,615 | 4.6%), and Health Diagnosing & Treating (2,575 | 4.5%).
Management, Business, Science and Arts Occupations by Sex
Within the Management, Business, Science and Arts occupations in Downey, the most male-oriented occupations are Architecture & Engineering (95.0%), Computers, Engineering & Science (84.7%), and Computers & Mathematics (81.7%), while the most female-oriented occupations are Education Instruction & Library (80.3%), Education, Arts & Media (79.6%), and Health Technologists (74.1%).
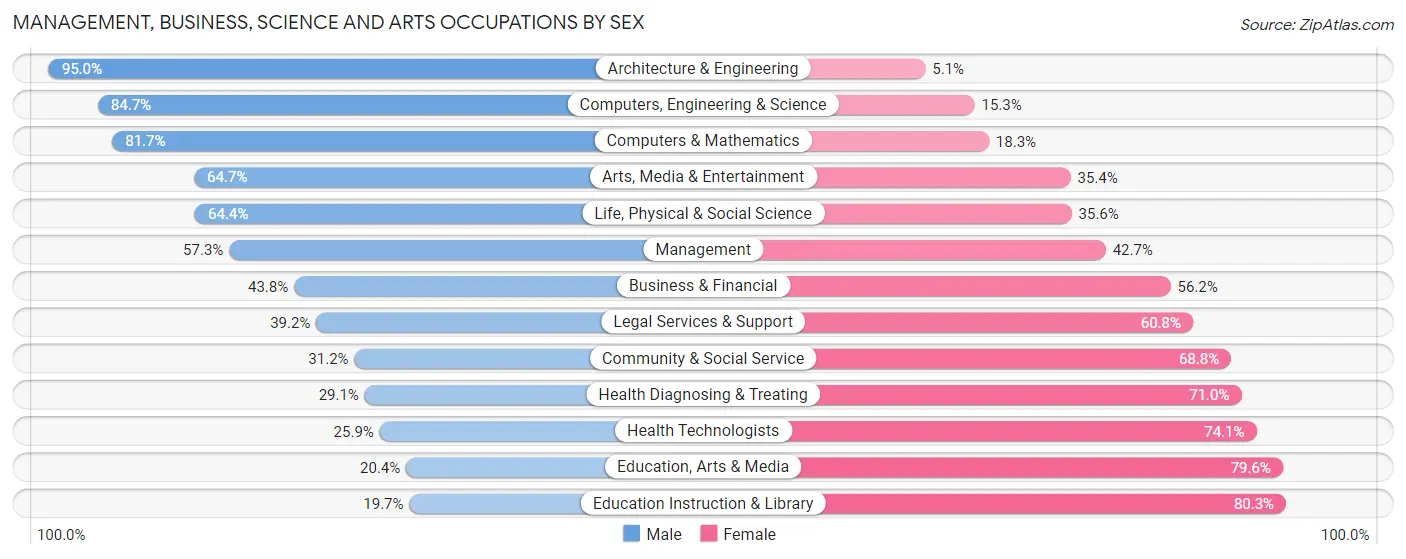
| Occupation | Male | Female |
| Management | 2,738 (57.3%) | 2,038 (42.7%) |
| Business & Financial | 1,145 (43.8%) | 1,470 (56.2%) |
| Computers, Engineering & Science | 2,165 (84.7%) | 391 (15.3%) |
| Computers & Mathematics | 1,192 (81.7%) | 267 (18.3%) |
| Architecture & Engineering | 828 (95.0%) | 44 (5.1%) |
| Life, Physical & Social Science | 145 (64.4%) | 80 (35.6%) |
| Community & Social Service | 1,936 (31.2%) | 4,269 (68.8%) |
| Education, Arts & Media | 262 (20.4%) | 1,021 (79.6%) |
| Legal Services & Support | 161 (39.2%) | 250 (60.8%) |
| Education Instruction & Library | 617 (19.7%) | 2,508 (80.3%) |
| Arts, Media & Entertainment | 896 (64.6%) | 490 (35.3%) |
| Health Diagnosing & Treating | 748 (29.0%) | 1,827 (71.0%) |
| Health Technologists | 382 (25.9%) | 1,091 (74.1%) |
| Total (Category) | 8,732 (46.6%) | 9,995 (53.4%) |
| Total (Overall) | 30,822 (54.4%) | 25,866 (45.6%) |
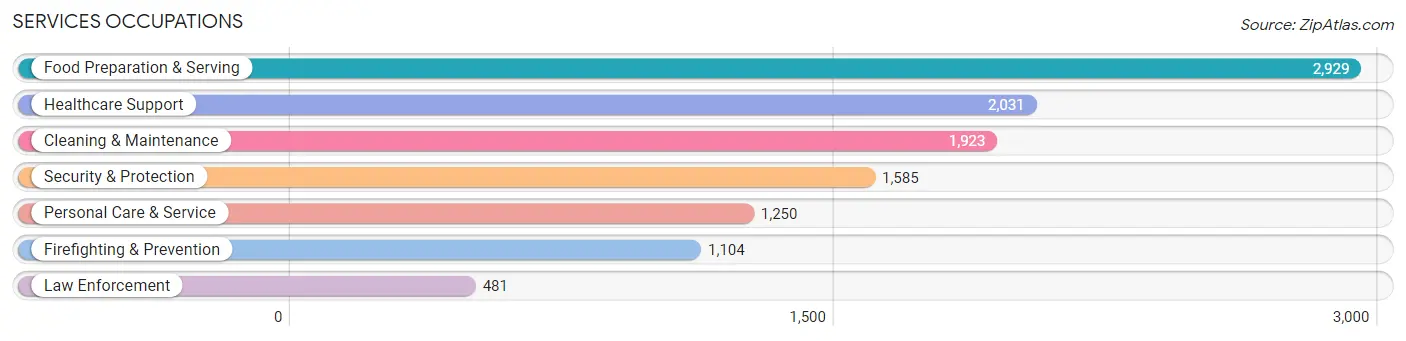
Services Occupations
The most common Services occupations in Downey are Food Preparation & Serving (2,929 | 5.2%), Healthcare Support (2,031 | 3.6%), Cleaning & Maintenance (1,923 | 3.4%), Security & Protection (1,585 | 2.8%), and Personal Care & Service (1,250 | 2.2%).
Services Occupations by Sex
Within the Services occupations in Downey, the most male-oriented occupations are Firefighting & Prevention (81.5%), Security & Protection (79.6%), and Law Enforcement (75.3%), while the most female-oriented occupations are Healthcare Support (80.5%), Personal Care & Service (75.5%), and Cleaning & Maintenance (50.1%).
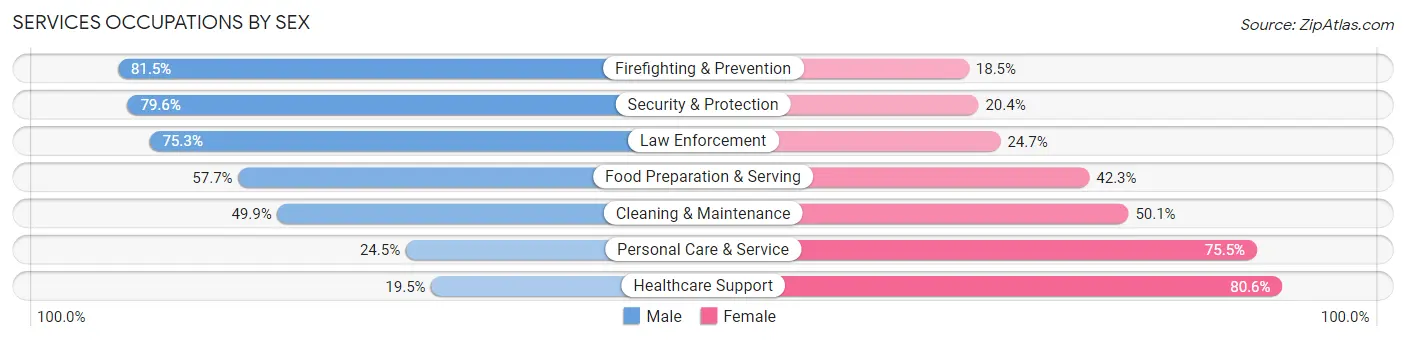
| Occupation | Male | Female |
| Healthcare Support | 395 (19.5%) | 1,636 (80.5%) |
| Security & Protection | 1,262 (79.6%) | 323 (20.4%) |
| Firefighting & Prevention | 900 (81.5%) | 204 (18.5%) |
| Law Enforcement | 362 (75.3%) | 119 (24.7%) |
| Food Preparation & Serving | 1,689 (57.7%) | 1,240 (42.3%) |
| Cleaning & Maintenance | 960 (49.9%) | 963 (50.1%) |
| Personal Care & Service | 306 (24.5%) | 944 (75.5%) |
| Total (Category) | 4,612 (47.5%) | 5,106 (52.5%) |
| Total (Overall) | 30,822 (54.4%) | 25,866 (45.6%) |
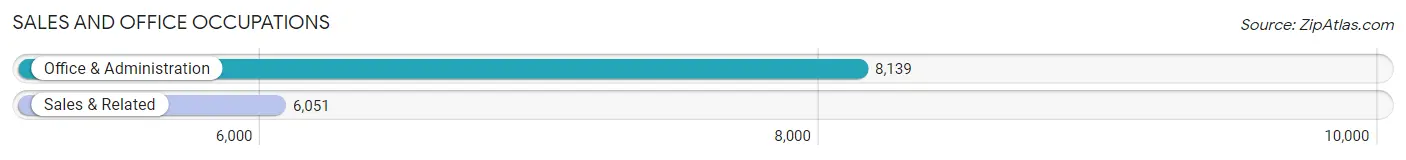
Sales and Office Occupations
The most common Sales and Office occupations in Downey are Office & Administration (8,139 | 14.4%), and Sales & Related (6,051 | 10.7%).
Sales and Office Occupations by Sex
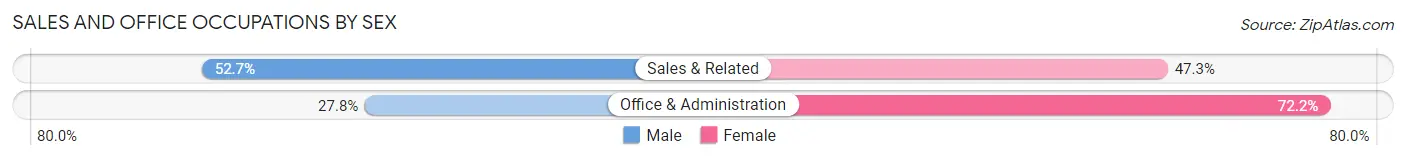
| Occupation | Male | Female |
| Sales & Related | 3,191 (52.7%) | 2,860 (47.3%) |
| Office & Administration | 2,259 (27.8%) | 5,880 (72.2%) |
| Total (Category) | 5,450 (38.4%) | 8,740 (61.6%) |
| Total (Overall) | 30,822 (54.4%) | 25,866 (45.6%) |
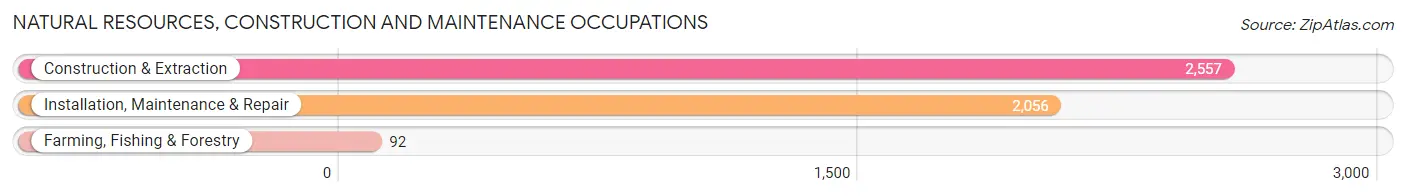
Natural Resources, Construction and Maintenance Occupations
The most common Natural Resources, Construction and Maintenance occupations in Downey are Construction & Extraction (2,557 | 4.5%), Installation, Maintenance & Repair (2,056 | 3.6%), and Farming, Fishing & Forestry (92 | 0.2%).
Natural Resources, Construction and Maintenance Occupations by Sex
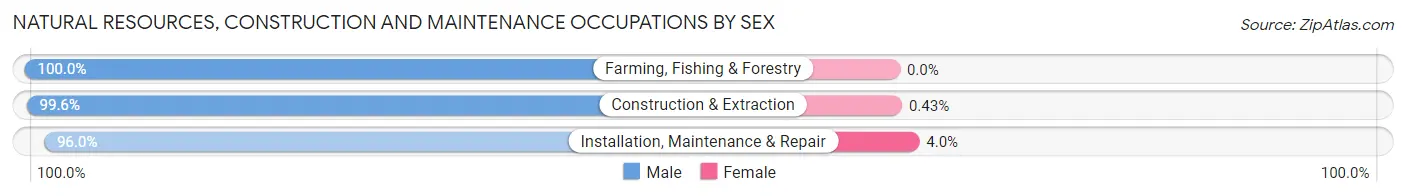
| Occupation | Male | Female |
| Farming, Fishing & Forestry | 92 (100.0%) | 0 (0.0%) |
| Construction & Extraction | 2,546 (99.6%) | 11 (0.4%) |
| Installation, Maintenance & Repair | 1,973 (96.0%) | 83 (4.0%) |
| Total (Category) | 4,611 (98.0%) | 94 (2.0%) |
| Total (Overall) | 30,822 (54.4%) | 25,866 (45.6%) |
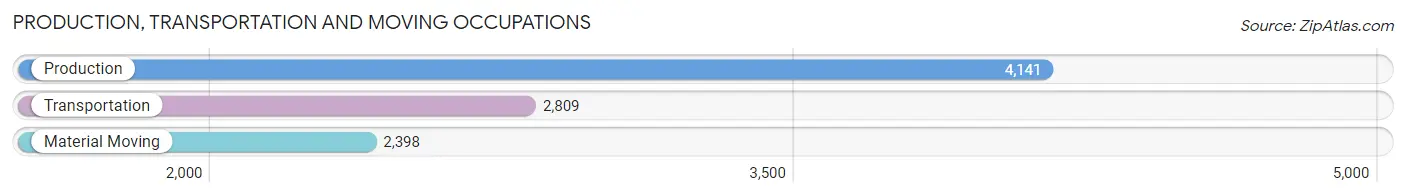
Production, Transportation and Moving Occupations
The most common Production, Transportation and Moving occupations in Downey are Production (4,141 | 7.3%), Transportation (2,809 | 5.0%), and Material Moving (2,398 | 4.2%).
Production, Transportation and Moving Occupations by Sex
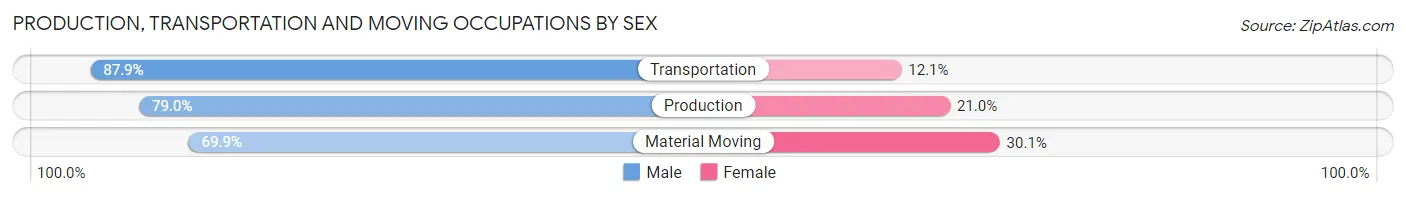
| Occupation | Male | Female |
| Production | 3,271 (79.0%) | 870 (21.0%) |
| Transportation | 2,470 (87.9%) | 339 (12.1%) |
| Material Moving | 1,676 (69.9%) | 722 (30.1%) |
| Total (Category) | 7,417 (79.3%) | 1,931 (20.7%) |
| Total (Overall) | 30,822 (54.4%) | 25,866 (45.6%) |
Employment Industries by Sex in Downey
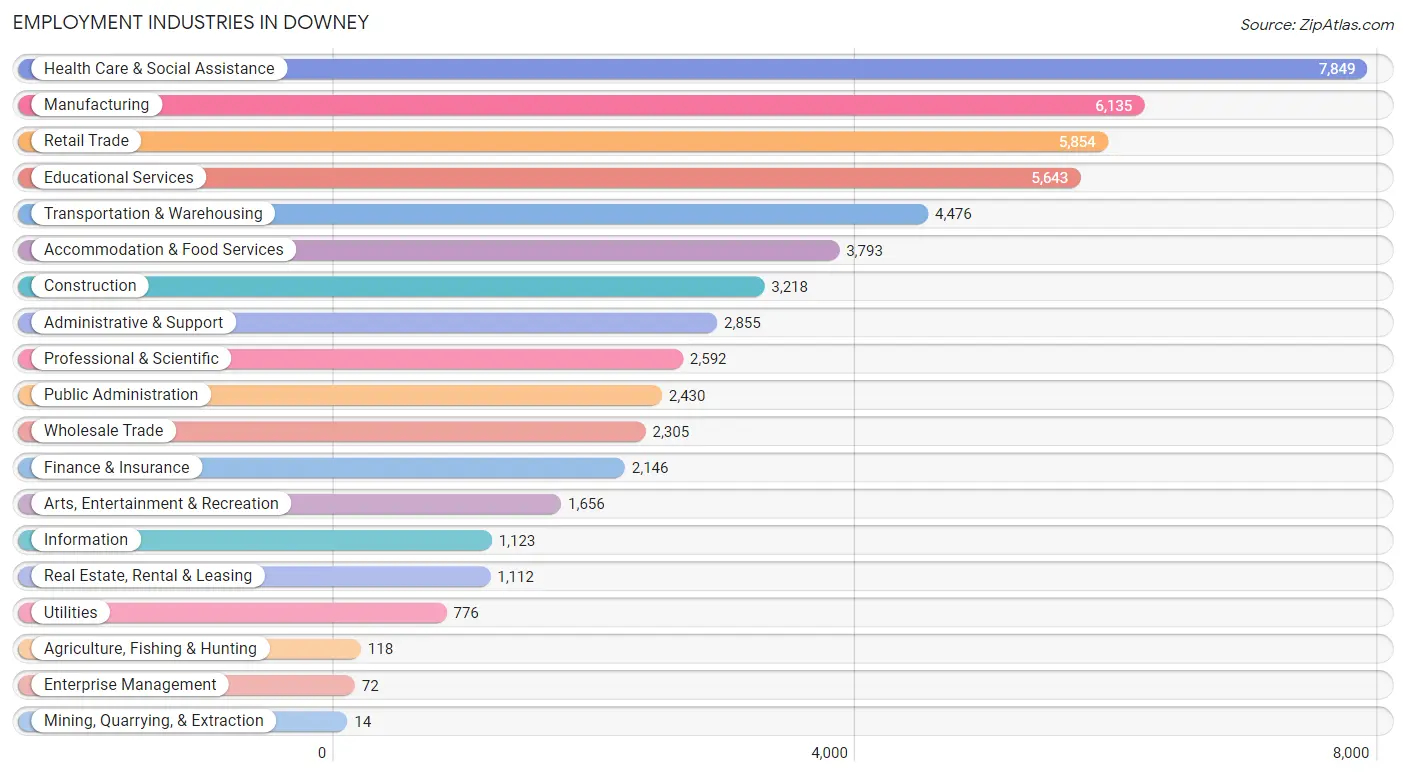
Employment Industries in Downey
The major employment industries in Downey include Health Care & Social Assistance (7,849 | 13.9%), Manufacturing (6,135 | 10.8%), Retail Trade (5,854 | 10.3%), Educational Services (5,643 | 10.0%), and Transportation & Warehousing (4,476 | 7.9%).
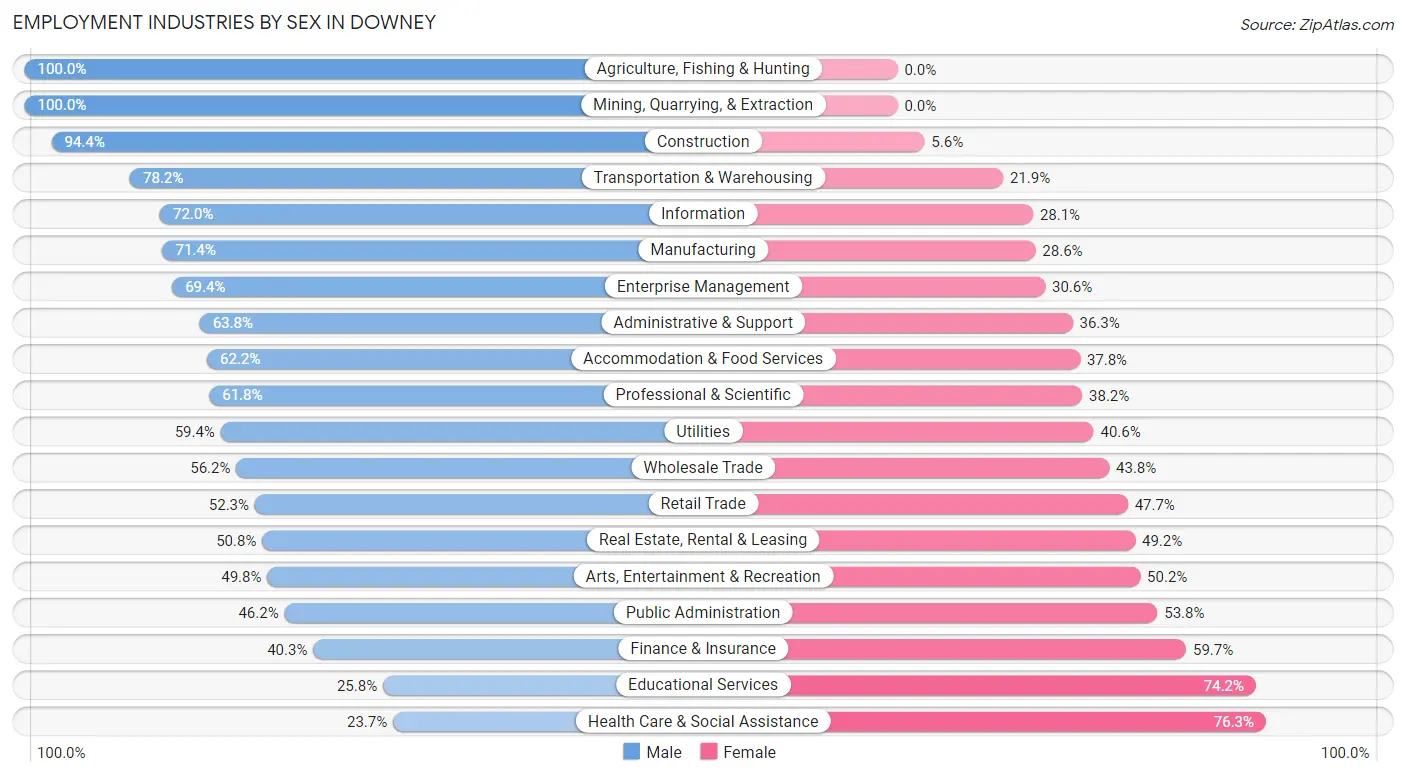
Employment Industries by Sex in Downey
The Downey industries that see more men than women are Agriculture, Fishing & Hunting (100.0%), Mining, Quarrying, & Extraction (100.0%), and Construction (94.4%), whereas the industries that tend to have a higher number of women are Health Care & Social Assistance (76.3%), Educational Services (74.2%), and Finance & Insurance (59.7%).
| Industry | Male | Female |
| Agriculture, Fishing & Hunting | 118 (100.0%) | 0 (0.0%) |
| Mining, Quarrying, & Extraction | 14 (100.0%) | 0 (0.0%) |
| Construction | 3,038 (94.4%) | 180 (5.6%) |
| Manufacturing | 4,383 (71.4%) | 1,752 (28.6%) |
| Wholesale Trade | 1,295 (56.2%) | 1,010 (43.8%) |
| Retail Trade | 3,064 (52.3%) | 2,790 (47.7%) |
| Transportation & Warehousing | 3,498 (78.1%) | 978 (21.8%) |
| Utilities | 461 (59.4%) | 315 (40.6%) |
| Information | 808 (72.0%) | 315 (28.1%) |
| Finance & Insurance | 864 (40.3%) | 1,282 (59.7%) |
| Real Estate, Rental & Leasing | 565 (50.8%) | 547 (49.2%) |
| Professional & Scientific | 1,601 (61.8%) | 991 (38.2%) |
| Enterprise Management | 50 (69.4%) | 22 (30.6%) |
| Administrative & Support | 1,820 (63.7%) | 1,035 (36.2%) |
| Educational Services | 1,457 (25.8%) | 4,186 (74.2%) |
| Health Care & Social Assistance | 1,863 (23.7%) | 5,986 (76.3%) |
| Arts, Entertainment & Recreation | 824 (49.8%) | 832 (50.2%) |
| Accommodation & Food Services | 2,360 (62.2%) | 1,433 (37.8%) |
| Public Administration | 1,123 (46.2%) | 1,307 (53.8%) |
| Total | 30,822 (54.4%) | 25,866 (45.6%) |
Education in Downey
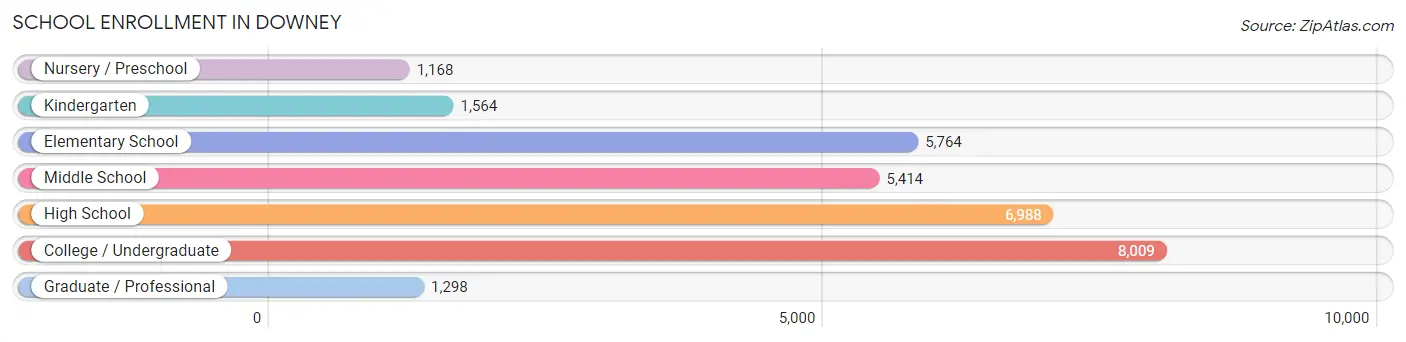
School Enrollment in Downey
The most common levels of schooling among the 30,205 students in Downey are college / undergraduate (8,009 | 26.5%), high school (6,988 | 23.1%), and elementary school (5,764 | 19.1%).
| School Level | # Students | % Students |
| Nursery / Preschool | 1,168 | 3.9% |
| Kindergarten | 1,564 | 5.2% |
| Elementary School | 5,764 | 19.1% |
| Middle School | 5,414 | 17.9% |
| High School | 6,988 | 23.1% |
| College / Undergraduate | 8,009 | 26.5% |
| Graduate / Professional | 1,298 | 4.3% |
| Total | 30,205 | 100.0% |
School Enrollment by Age by Funding Source in Downey
Out of a total of 30,205 students who are enrolled in schools in Downey, 4,138 (13.7%) attend a private institution, while the remaining 26,067 (86.3%) are enrolled in public schools. The age group of 3 to 4 year olds has the highest likelihood of being enrolled in private schools, with 535 (54.2% in the age bracket) enrolled. Conversely, the age group of 15 to 17 year olds has the lowest likelihood of being enrolled in a private school, with 4,657 (94.2% in the age bracket) attending a public institution.
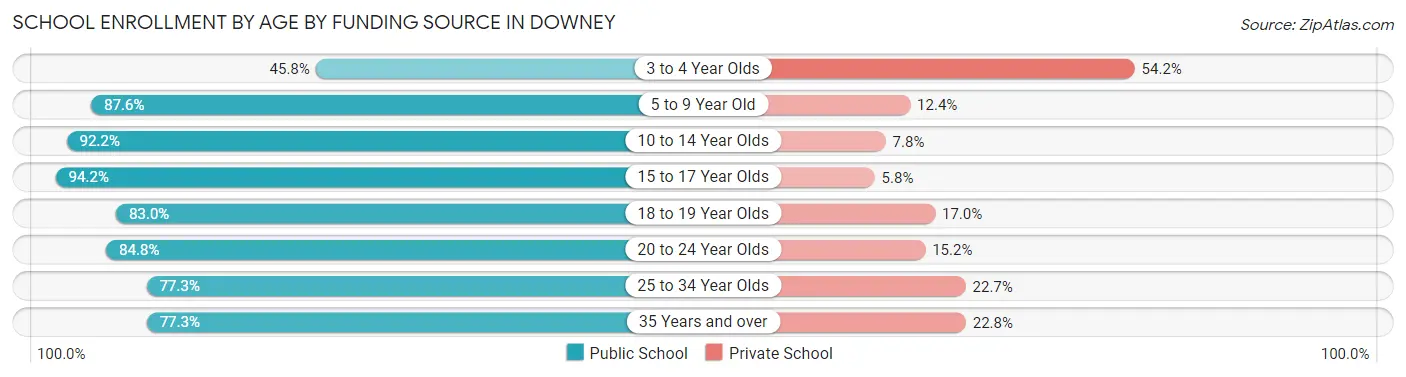
| Age Bracket | Public School | Private School |
| 3 to 4 Year Olds | 452 (45.8%) | 535 (54.2%) |
| 5 to 9 Year Old | 6,045 (87.6%) | 854 (12.4%) |
| 10 to 14 Year Olds | 6,621 (92.2%) | 562 (7.8%) |
| 15 to 17 Year Olds | 4,657 (94.2%) | 285 (5.8%) |
| 18 to 19 Year Olds | 1,896 (83.0%) | 389 (17.0%) |
| 20 to 24 Year Olds | 3,077 (84.8%) | 551 (15.2%) |
| 25 to 34 Year Olds | 1,906 (77.3%) | 560 (22.7%) |
| 35 Years and over | 1,402 (77.2%) | 413 (22.8%) |
| Total | 26,067 (86.3%) | 4,138 (13.7%) |
Educational Attainment by Field of Study in Downey
Business (4,069 | 20.0%), science & technology (2,071 | 10.2%), arts & humanities (1,924 | 9.5%), social sciences (1,908 | 9.4%), and engineering (1,708 | 8.4%) are the most common fields of study among 20,357 individuals in Downey who have obtained a bachelor's degree or higher.
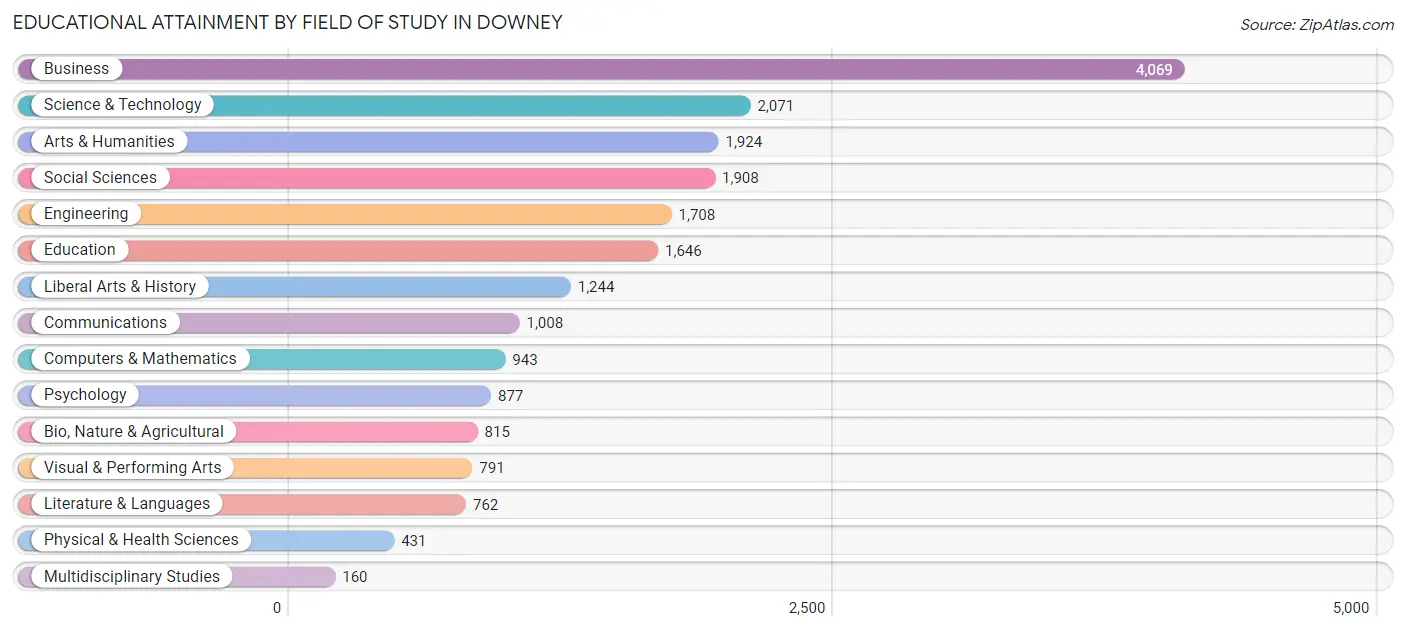
| Field of Study | # Graduates | % Graduates |
| Computers & Mathematics | 943 | 4.6% |
| Bio, Nature & Agricultural | 815 | 4.0% |
| Physical & Health Sciences | 431 | 2.1% |
| Psychology | 877 | 4.3% |
| Social Sciences | 1,908 | 9.4% |
| Engineering | 1,708 | 8.4% |
| Multidisciplinary Studies | 160 | 0.8% |
| Science & Technology | 2,071 | 10.2% |
| Business | 4,069 | 20.0% |
| Education | 1,646 | 8.1% |
| Literature & Languages | 762 | 3.7% |
| Liberal Arts & History | 1,244 | 6.1% |
| Visual & Performing Arts | 791 | 3.9% |
| Communications | 1,008 | 5.0% |
| Arts & Humanities | 1,924 | 9.5% |
| Total | 20,357 | 100.0% |
Transportation & Commute in Downey
Vehicle Availability by Sex in Downey
The most prevalent vehicle ownership categories in Downey are males with 2 vehicles (10,403, accounting for 34.6%) and females with 2 vehicles (8,268, making up 41.4%).
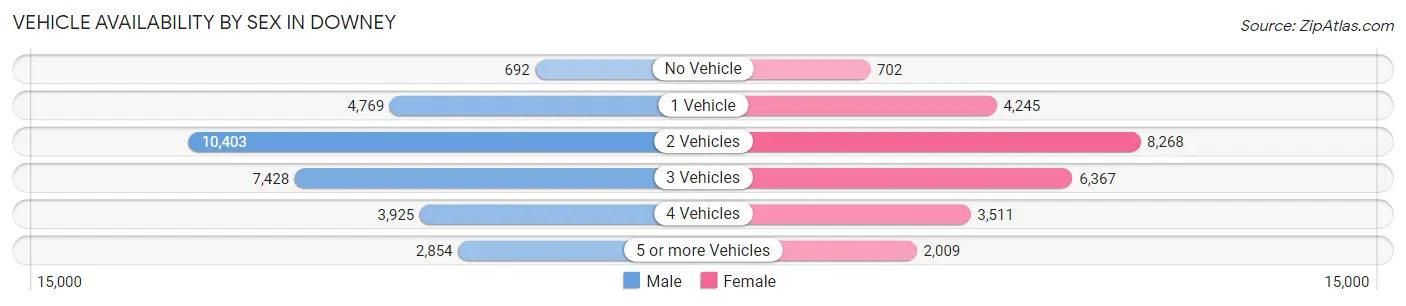
| Vehicles Available | Male | Female |
| No Vehicle | 692 (2.3%) | 702 (2.8%) |
| 1 Vehicle | 4,769 (15.9%) | 4,245 (16.9%) |
| 2 Vehicles | 10,403 (34.6%) | 8,268 (32.9%) |
| 3 Vehicles | 7,428 (24.7%) | 6,367 (25.4%) |
| 4 Vehicles | 3,925 (13.1%) | 3,511 (14.0%) |
| 5 or more Vehicles | 2,854 (9.5%) | 2,009 (8.0%) |
| Total | 30,071 (100.0%) | 25,102 (100.0%) |
Commute Time in Downey
The most frequently occuring commute durations in Downey are 30 to 34 minutes (9,666 commuters, 18.9%), 20 to 24 minutes (8,218 commuters, 16.1%), and 45 to 59 minutes (6,106 commuters, 11.9%).
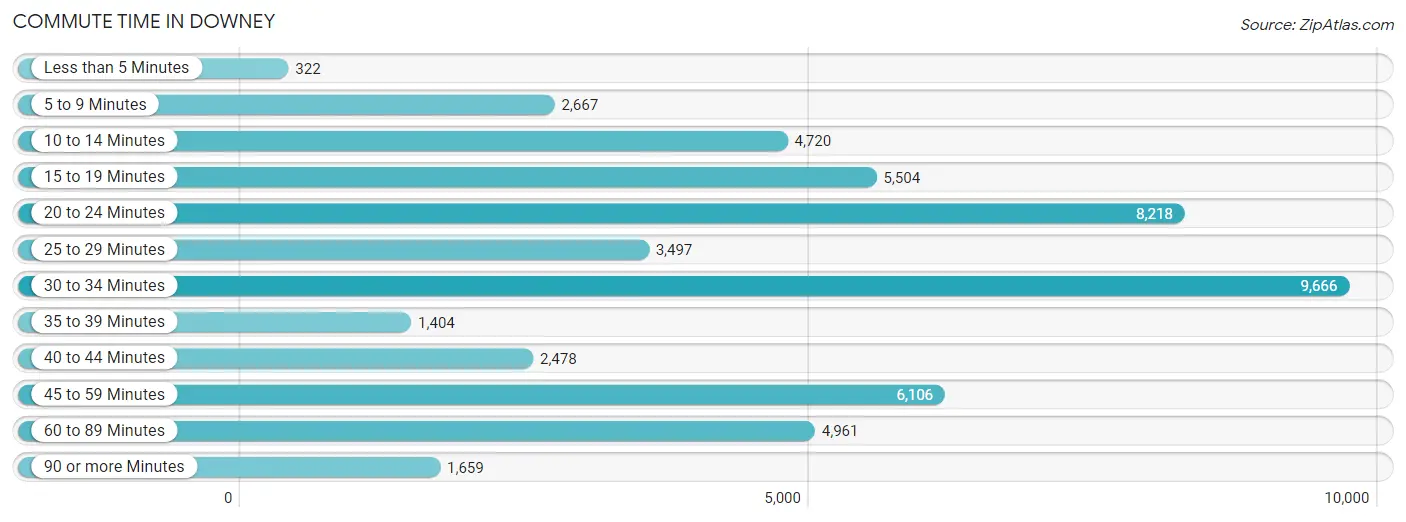
| Commute Time | # Commuters | % Commuters |
| Less than 5 Minutes | 322 | 0.6% |
| 5 to 9 Minutes | 2,667 | 5.2% |
| 10 to 14 Minutes | 4,720 | 9.2% |
| 15 to 19 Minutes | 5,504 | 10.7% |
| 20 to 24 Minutes | 8,218 | 16.1% |
| 25 to 29 Minutes | 3,497 | 6.8% |
| 30 to 34 Minutes | 9,666 | 18.9% |
| 35 to 39 Minutes | 1,404 | 2.7% |
| 40 to 44 Minutes | 2,478 | 4.8% |
| 45 to 59 Minutes | 6,106 | 11.9% |
| 60 to 89 Minutes | 4,961 | 9.7% |
| 90 or more Minutes | 1,659 | 3.2% |
Commute Time by Sex in Downey
The most common commute times in Downey are 30 to 34 minutes (6,034 commuters, 21.3%) for males and 30 to 34 minutes (3,632 commuters, 15.9%) for females.
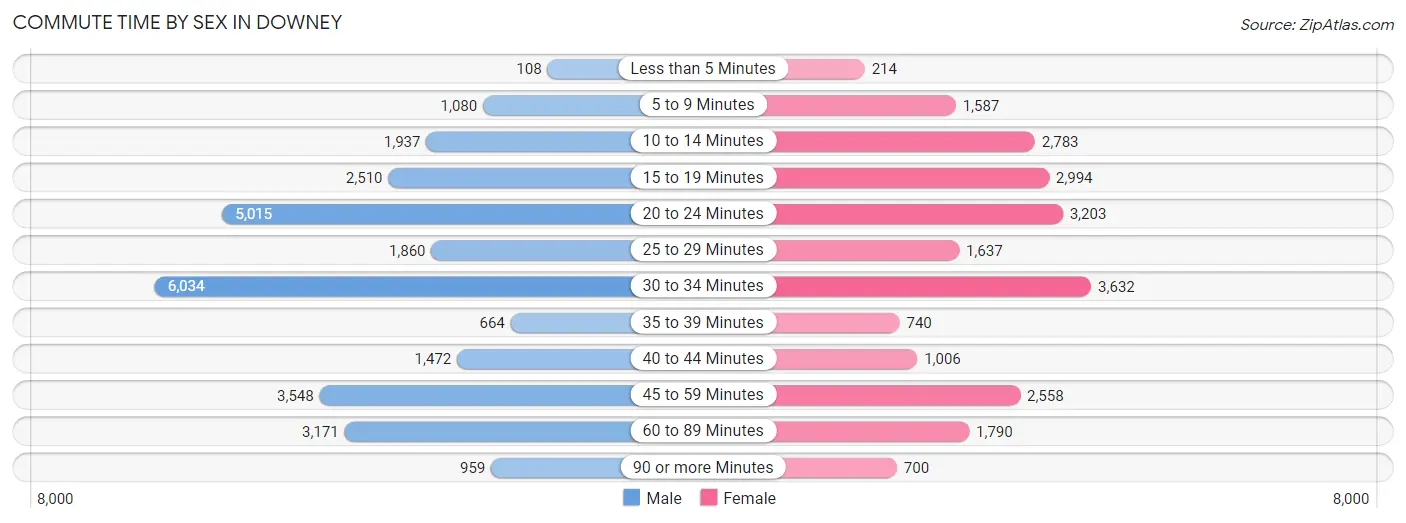
| Commute Time | Male | Female |
| Less than 5 Minutes | 108 (0.4%) | 214 (0.9%) |
| 5 to 9 Minutes | 1,080 (3.8%) | 1,587 (7.0%) |
| 10 to 14 Minutes | 1,937 (6.8%) | 2,783 (12.2%) |
| 15 to 19 Minutes | 2,510 (8.8%) | 2,994 (13.1%) |
| 20 to 24 Minutes | 5,015 (17.7%) | 3,203 (14.0%) |
| 25 to 29 Minutes | 1,860 (6.6%) | 1,637 (7.2%) |
| 30 to 34 Minutes | 6,034 (21.3%) | 3,632 (15.9%) |
| 35 to 39 Minutes | 664 (2.3%) | 740 (3.2%) |
| 40 to 44 Minutes | 1,472 (5.2%) | 1,006 (4.4%) |
| 45 to 59 Minutes | 3,548 (12.5%) | 2,558 (11.2%) |
| 60 to 89 Minutes | 3,171 (11.2%) | 1,790 (7.8%) |
| 90 or more Minutes | 959 (3.4%) | 700 (3.1%) |
Time of Departure to Work by Sex in Downey
The most frequent times of departure to work in Downey are 7:00 AM to 7:29 AM (3,973, 14.0%) for males and 7:00 AM to 7:29 AM (3,386, 14.8%) for females.
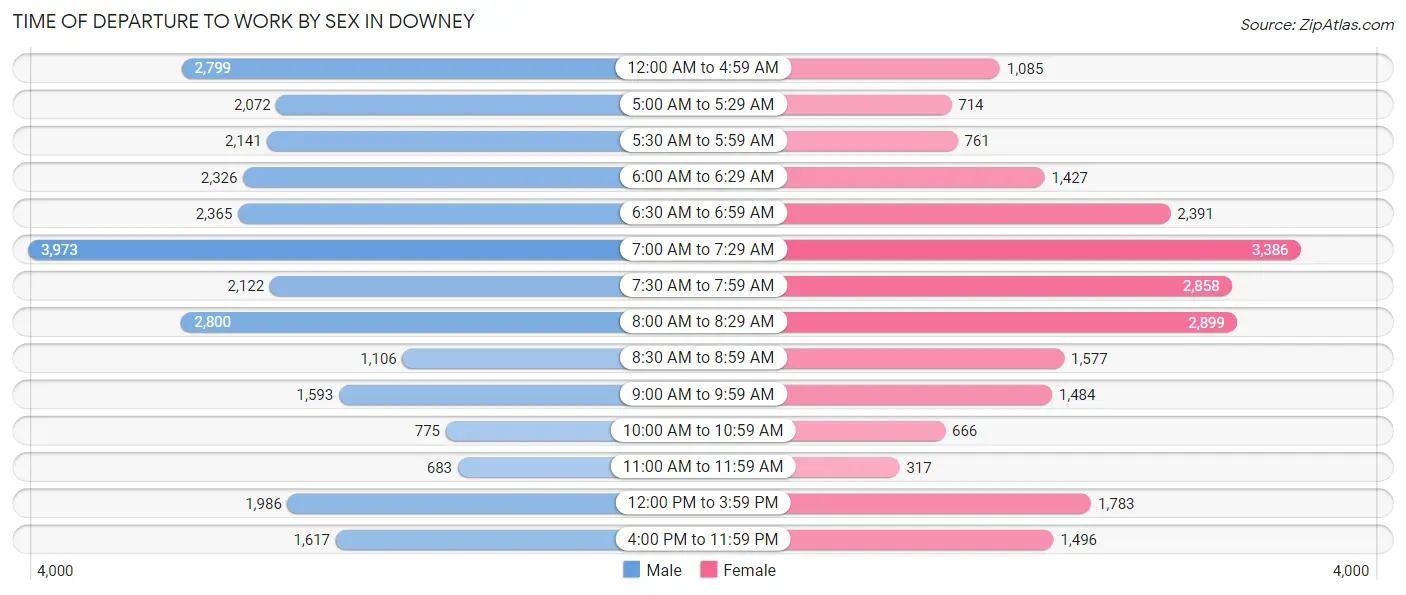
| Time of Departure | Male | Female |
| 12:00 AM to 4:59 AM | 2,799 (9.9%) | 1,085 (4.8%) |
| 5:00 AM to 5:29 AM | 2,072 (7.3%) | 714 (3.1%) |
| 5:30 AM to 5:59 AM | 2,141 (7.5%) | 761 (3.3%) |
| 6:00 AM to 6:29 AM | 2,326 (8.2%) | 1,427 (6.2%) |
| 6:30 AM to 6:59 AM | 2,365 (8.3%) | 2,391 (10.5%) |
| 7:00 AM to 7:29 AM | 3,973 (14.0%) | 3,386 (14.8%) |
| 7:30 AM to 7:59 AM | 2,122 (7.5%) | 2,858 (12.5%) |
| 8:00 AM to 8:29 AM | 2,800 (9.9%) | 2,899 (12.7%) |
| 8:30 AM to 8:59 AM | 1,106 (3.9%) | 1,577 (6.9%) |
| 9:00 AM to 9:59 AM | 1,593 (5.6%) | 1,484 (6.5%) |
| 10:00 AM to 10:59 AM | 775 (2.7%) | 666 (2.9%) |
| 11:00 AM to 11:59 AM | 683 (2.4%) | 317 (1.4%) |
| 12:00 PM to 3:59 PM | 1,986 (7.0%) | 1,783 (7.8%) |
| 4:00 PM to 11:59 PM | 1,617 (5.7%) | 1,496 (6.6%) |
| Total | 28,358 (100.0%) | 22,844 (100.0%) |
Housing Occupancy in Downey
Occupancy by Ownership in Downey
Of the total 34,788 dwellings in Downey, owner-occupied units account for 17,201 (49.4%), while renter-occupied units make up 17,587 (50.5%).
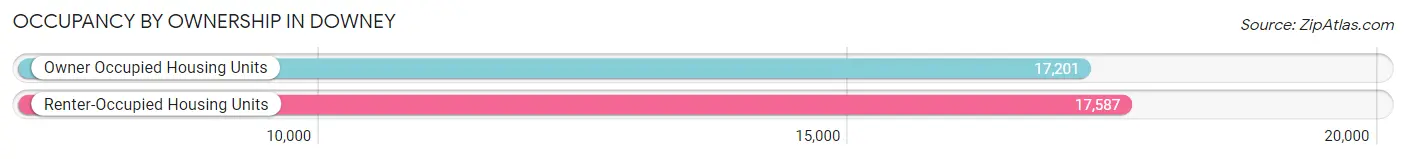
| Occupancy | # Housing Units | % Housing Units |
| Owner Occupied Housing Units | 17,201 | 49.4% |
| Renter-Occupied Housing Units | 17,587 | 50.5% |
| Total Occupied Housing Units | 34,788 | 100.0% |
Occupancy by Household Size in Downey
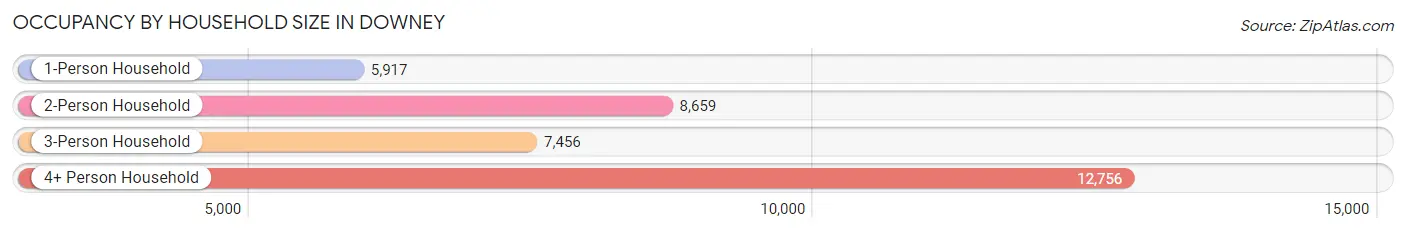
| Household Size | # Housing Units | % Housing Units |
| 1-Person Household | 5,917 | 17.0% |
| 2-Person Household | 8,659 | 24.9% |
| 3-Person Household | 7,456 | 21.4% |
| 4+ Person Household | 12,756 | 36.7% |
| Total Housing Units | 34,788 | 100.0% |
Occupancy by Ownership by Household Size in Downey
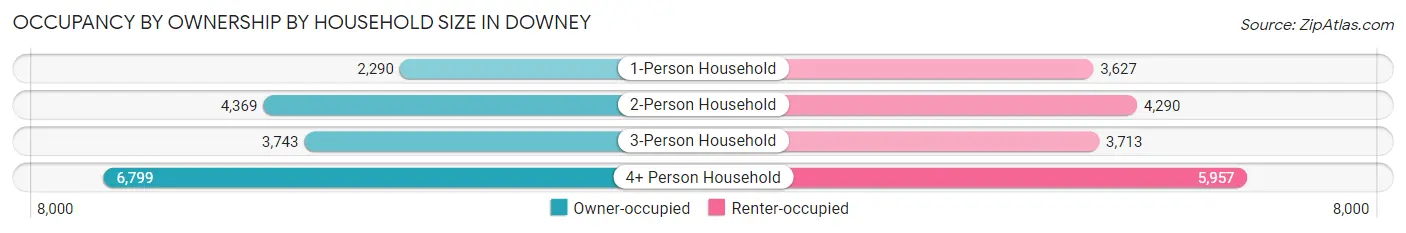
| Household Size | Owner-occupied | Renter-occupied |
| 1-Person Household | 2,290 (38.7%) | 3,627 (61.3%) |
| 2-Person Household | 4,369 (50.5%) | 4,290 (49.5%) |
| 3-Person Household | 3,743 (50.2%) | 3,713 (49.8%) |
| 4+ Person Household | 6,799 (53.3%) | 5,957 (46.7%) |
| Total Housing Units | 17,201 (49.4%) | 17,587 (50.5%) |
Occupancy by Educational Attainment in Downey
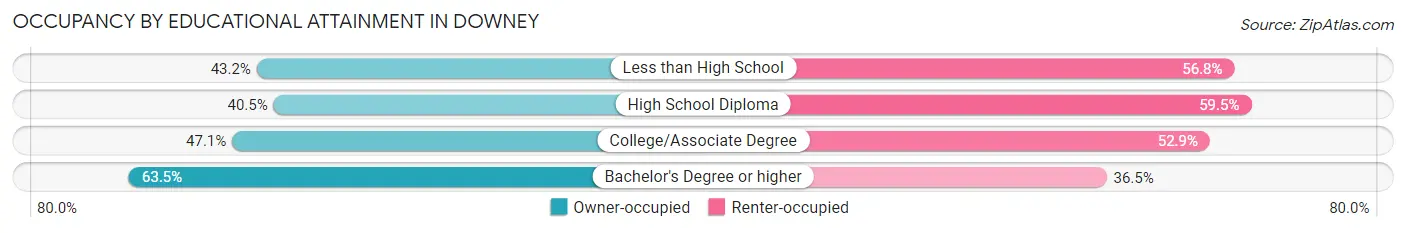
| Household Size | Owner-occupied | Renter-occupied |
| Less than High School | 2,353 (43.2%) | 3,095 (56.8%) |
| High School Diploma | 3,370 (40.5%) | 4,947 (59.5%) |
| College/Associate Degree | 5,357 (47.1%) | 6,020 (52.9%) |
| Bachelor's Degree or higher | 6,121 (63.5%) | 3,525 (36.5%) |
Occupancy by Age of Householder in Downey
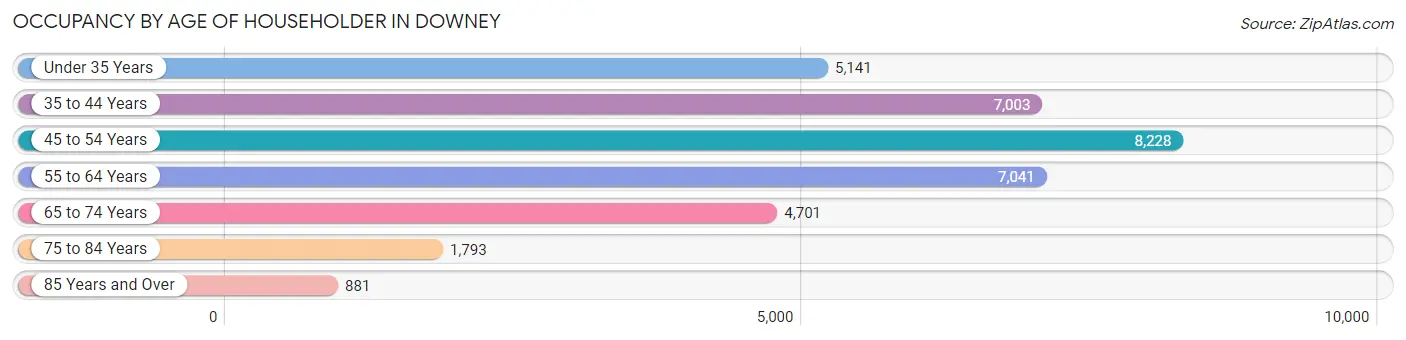
| Age Bracket | # Households | % Households |
| Under 35 Years | 5,141 | 14.8% |
| 35 to 44 Years | 7,003 | 20.1% |
| 45 to 54 Years | 8,228 | 23.6% |
| 55 to 64 Years | 7,041 | 20.2% |
| 65 to 74 Years | 4,701 | 13.5% |
| 75 to 84 Years | 1,793 | 5.1% |
| 85 Years and Over | 881 | 2.5% |
| Total | 34,788 | 100.0% |
Housing Finances in Downey
Median Income by Occupancy in Downey
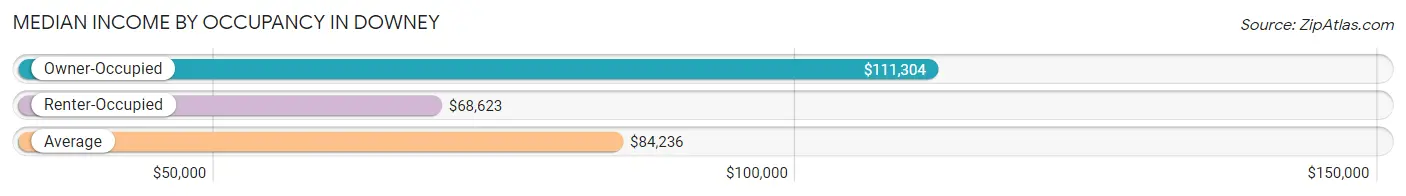
| Occupancy Type | # Households | Median Income |
| Owner-Occupied | 17,201 (49.4%) | $111,304 |
| Renter-Occupied | 17,587 (50.5%) | $68,623 |
| Average | 34,788 (100.0%) | $84,236 |
Occupancy by Householder Income Bracket in Downey
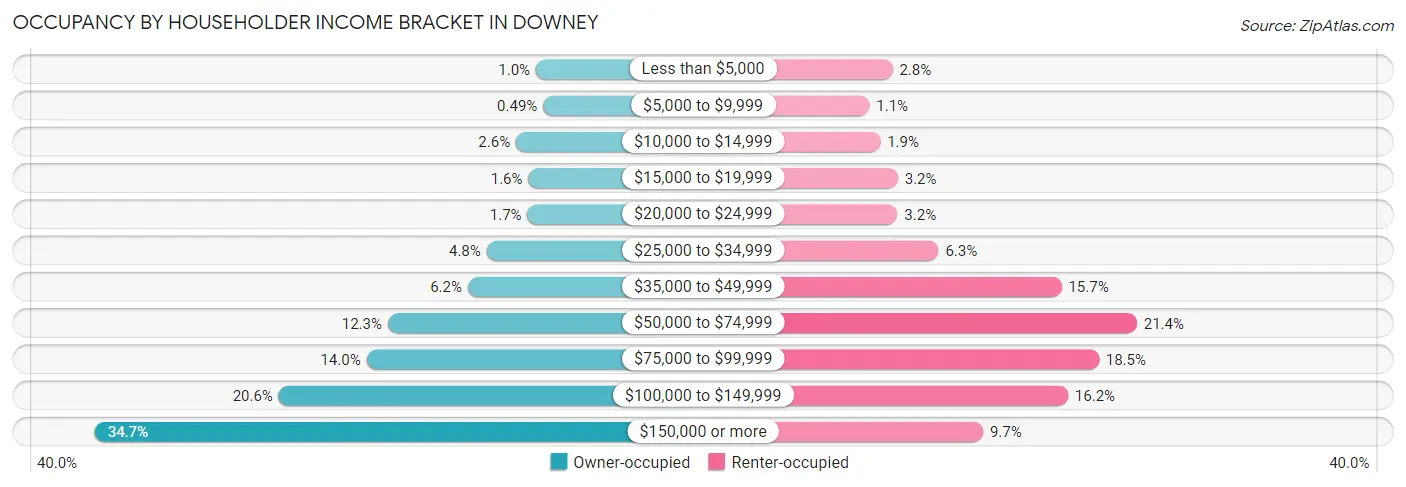
| Income Bracket | Owner-occupied | Renter-occupied |
| Less than $5,000 | 179 (1.0%) | 495 (2.8%) |
| $5,000 to $9,999 | 85 (0.5%) | 184 (1.1%) |
| $10,000 to $14,999 | 440 (2.6%) | 331 (1.9%) |
| $15,000 to $19,999 | 278 (1.6%) | 566 (3.2%) |
| $20,000 to $24,999 | 290 (1.7%) | 561 (3.2%) |
| $25,000 to $34,999 | 825 (4.8%) | 1,111 (6.3%) |
| $35,000 to $49,999 | 1,072 (6.2%) | 2,759 (15.7%) |
| $50,000 to $74,999 | 2,121 (12.3%) | 3,769 (21.4%) |
| $75,000 to $99,999 | 2,400 (14.0%) | 3,258 (18.5%) |
| $100,000 to $149,999 | 3,551 (20.6%) | 2,845 (16.2%) |
| $150,000 or more | 5,960 (34.6%) | 1,708 (9.7%) |
| Total | 17,201 (100.0%) | 17,587 (100.0%) |
Monthly Housing Cost Tiers in Downey
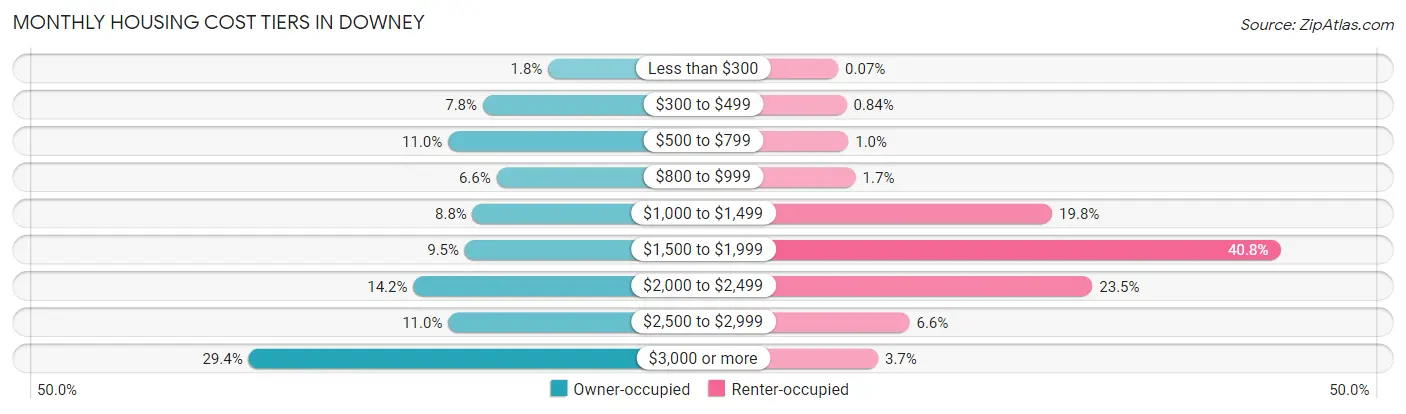
| Monthly Cost | Owner-occupied | Renter-occupied |
| Less than $300 | 310 (1.8%) | 13 (0.1%) |
| $300 to $499 | 1,344 (7.8%) | 148 (0.8%) |
| $500 to $799 | 1,893 (11.0%) | 176 (1.0%) |
| $800 to $999 | 1,126 (6.6%) | 296 (1.7%) |
| $1,000 to $1,499 | 1,505 (8.7%) | 3,477 (19.8%) |
| $1,500 to $1,999 | 1,629 (9.5%) | 7,169 (40.8%) |
| $2,000 to $2,499 | 2,446 (14.2%) | 4,127 (23.5%) |
| $2,500 to $2,999 | 1,892 (11.0%) | 1,167 (6.6%) |
| $3,000 or more | 5,056 (29.4%) | 658 (3.7%) |
| Total | 17,201 (100.0%) | 17,587 (100.0%) |
Physical Housing Characteristics in Downey
Housing Structures in Downey
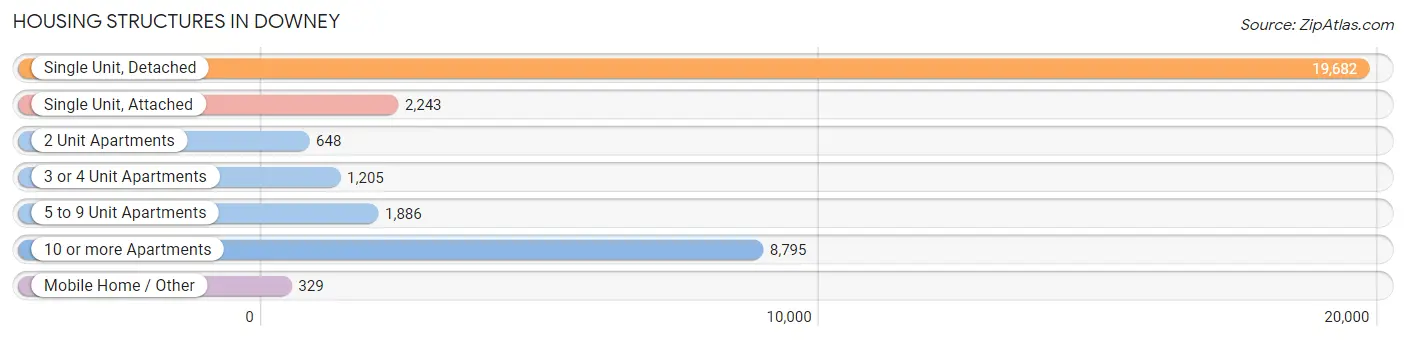
| Structure Type | # Housing Units | % Housing Units |
| Single Unit, Detached | 19,682 | 56.6% |
| Single Unit, Attached | 2,243 | 6.5% |
| 2 Unit Apartments | 648 | 1.9% |
| 3 or 4 Unit Apartments | 1,205 | 3.5% |
| 5 to 9 Unit Apartments | 1,886 | 5.4% |
| 10 or more Apartments | 8,795 | 25.3% |
| Mobile Home / Other | 329 | 0.9% |
| Total | 34,788 | 100.0% |
Housing Structures by Occupancy in Downey
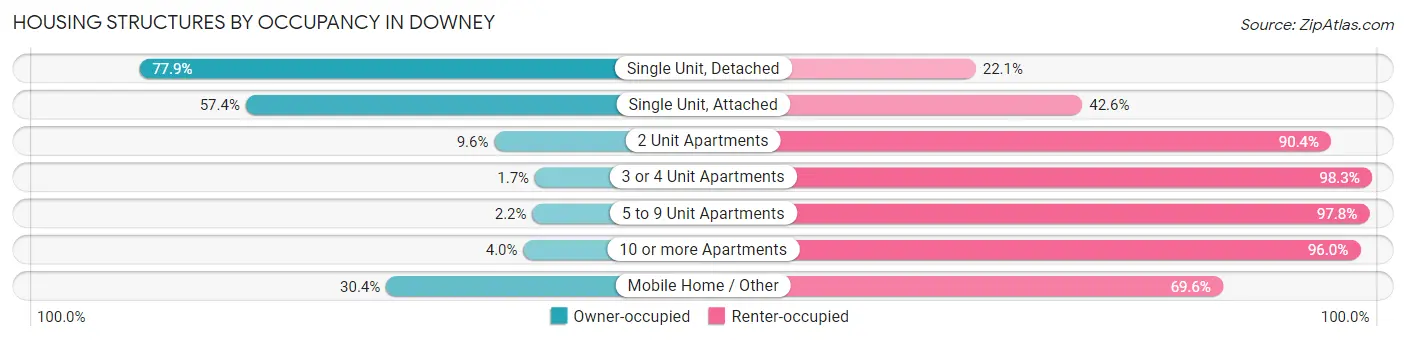
| Structure Type | Owner-occupied | Renter-occupied |
| Single Unit, Detached | 15,339 (77.9%) | 4,343 (22.1%) |
| Single Unit, Attached | 1,288 (57.4%) | 955 (42.6%) |
| 2 Unit Apartments | 62 (9.6%) | 586 (90.4%) |
| 3 or 4 Unit Apartments | 21 (1.7%) | 1,184 (98.3%) |
| 5 to 9 Unit Apartments | 42 (2.2%) | 1,844 (97.8%) |
| 10 or more Apartments | 349 (4.0%) | 8,446 (96.0%) |
| Mobile Home / Other | 100 (30.4%) | 229 (69.6%) |
| Total | 17,201 (49.4%) | 17,587 (50.5%) |
Housing Structures by Number of Rooms in Downey
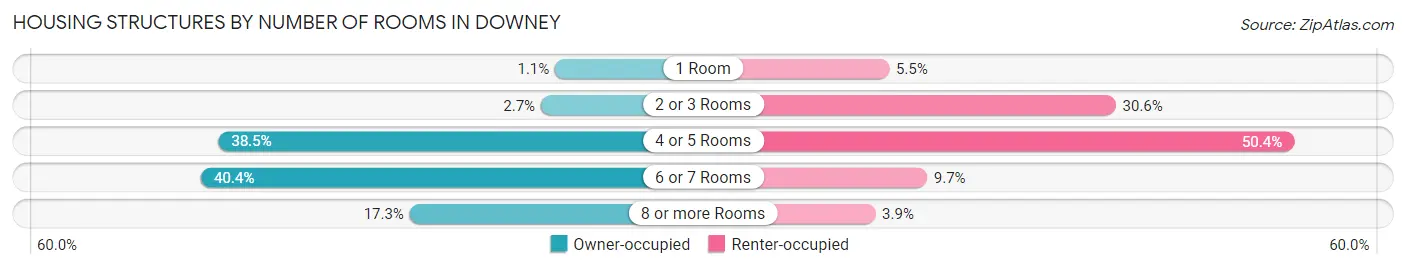
| Number of Rooms | Owner-occupied | Renter-occupied |
| 1 Room | 193 (1.1%) | 958 (5.4%) |
| 2 or 3 Rooms | 464 (2.7%) | 5,382 (30.6%) |
| 4 or 5 Rooms | 6,623 (38.5%) | 8,862 (50.4%) |
| 6 or 7 Rooms | 6,952 (40.4%) | 1,698 (9.7%) |
| 8 or more Rooms | 2,969 (17.3%) | 687 (3.9%) |
| Total | 17,201 (100.0%) | 17,587 (100.0%) |
Housing Structure by Heating Type in Downey
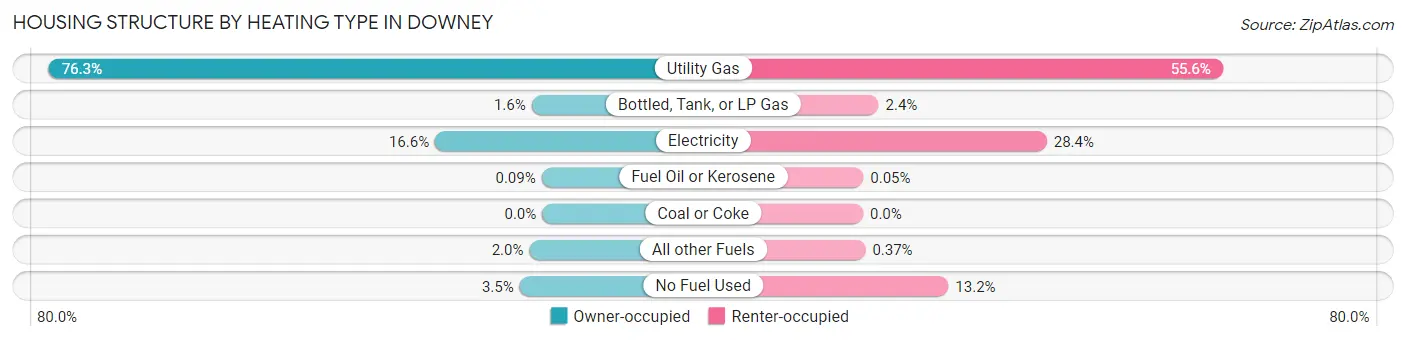
| Heating Type | Owner-occupied | Renter-occupied |
| Utility Gas | 13,117 (76.3%) | 9,776 (55.6%) |
| Bottled, Tank, or LP Gas | 280 (1.6%) | 422 (2.4%) |
| Electricity | 2,849 (16.6%) | 4,994 (28.4%) |
| Fuel Oil or Kerosene | 15 (0.1%) | 9 (0.1%) |
| Coal or Coke | 0 (0.0%) | 0 (0.0%) |
| All other Fuels | 340 (2.0%) | 65 (0.4%) |
| No Fuel Used | 600 (3.5%) | 2,321 (13.2%) |
| Total | 17,201 (100.0%) | 17,587 (100.0%) |
Household Vehicle Usage in Downey
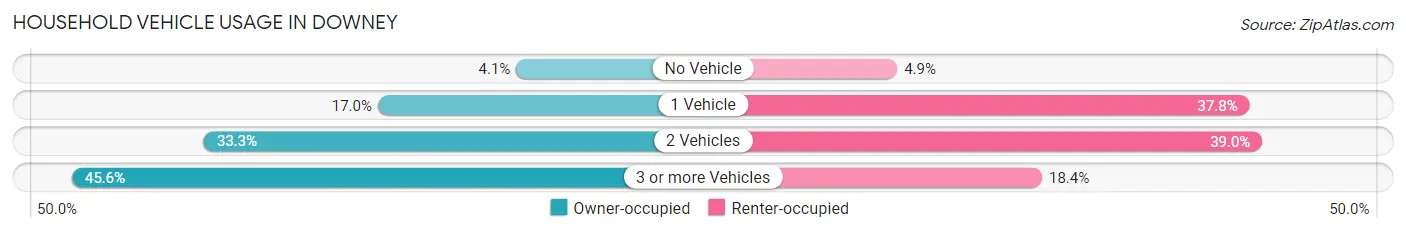
| Vehicles per Household | Owner-occupied | Renter-occupied |
| No Vehicle | 707 (4.1%) | 859 (4.9%) |
| 1 Vehicle | 2,930 (17.0%) | 6,642 (37.8%) |
| 2 Vehicles | 5,722 (33.3%) | 6,850 (39.0%) |
| 3 or more Vehicles | 7,842 (45.6%) | 3,236 (18.4%) |
| Total | 17,201 (100.0%) | 17,587 (100.0%) |
Real Estate & Mortgages in Downey
Real Estate and Mortgage Overview in Downey
| Characteristic | Without Mortgage | With Mortgage |
| Housing Units | 5,264 | 11,937 |
| Median Property Value | $669,700 | $682,600 |
| Median Household Income | $86,631 | $4,599 |
| Monthly Housing Costs | $605 | $5,056 |
| Real Estate Taxes | $4,050 | $274 |
Property Value by Mortgage Status in Downey
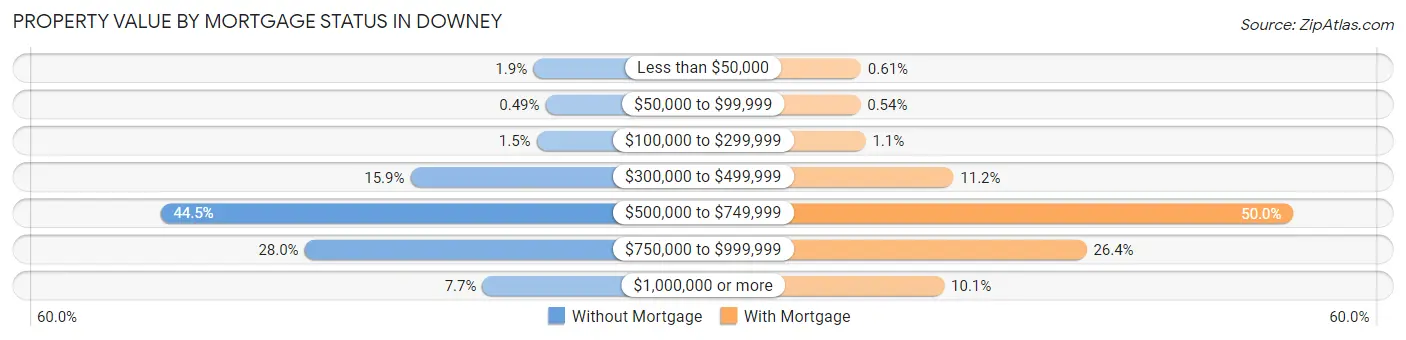
| Property Value | Without Mortgage | With Mortgage |
| Less than $50,000 | 100 (1.9%) | 73 (0.6%) |
| $50,000 to $99,999 | 26 (0.5%) | 64 (0.5%) |
| $100,000 to $299,999 | 79 (1.5%) | 135 (1.1%) |
| $300,000 to $499,999 | 838 (15.9%) | 1,335 (11.2%) |
| $500,000 to $749,999 | 2,341 (44.5%) | 5,972 (50.0%) |
| $750,000 to $999,999 | 1,475 (28.0%) | 3,150 (26.4%) |
| $1,000,000 or more | 405 (7.7%) | 1,208 (10.1%) |
| Total | 5,264 (100.0%) | 11,937 (100.0%) |
Household Income by Mortgage Status in Downey
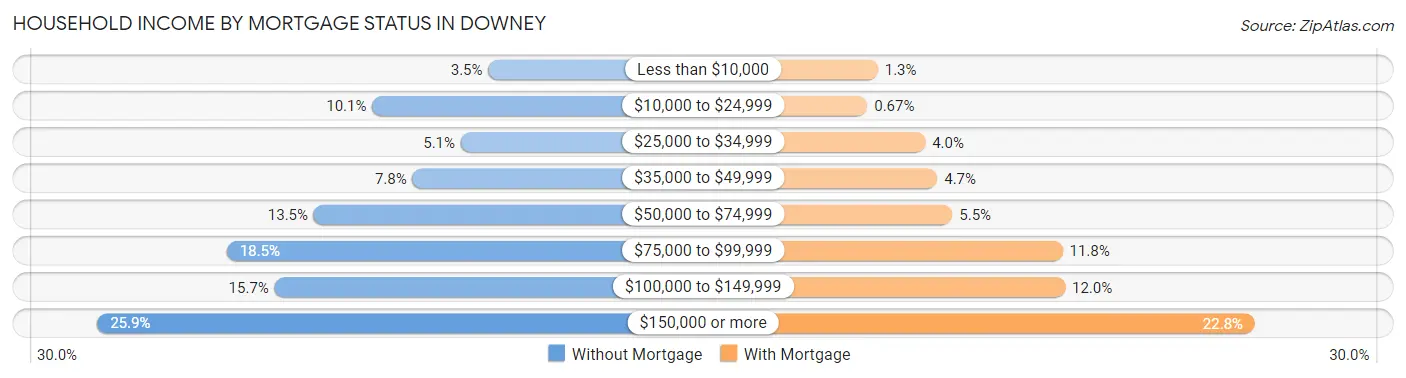
| Household Income | Without Mortgage | With Mortgage |
| Less than $10,000 | 184 (3.5%) | 152 (1.3%) |
| $10,000 to $24,999 | 533 (10.1%) | 80 (0.7%) |
| $25,000 to $34,999 | 267 (5.1%) | 475 (4.0%) |
| $35,000 to $49,999 | 412 (7.8%) | 558 (4.7%) |
| $50,000 to $74,999 | 709 (13.5%) | 660 (5.5%) |
| $75,000 to $99,999 | 971 (18.4%) | 1,412 (11.8%) |
| $100,000 to $149,999 | 827 (15.7%) | 1,429 (12.0%) |
| $150,000 or more | 1,361 (25.9%) | 2,724 (22.8%) |
| Total | 5,264 (100.0%) | 11,937 (100.0%) |
Property Value to Household Income Ratio in Downey
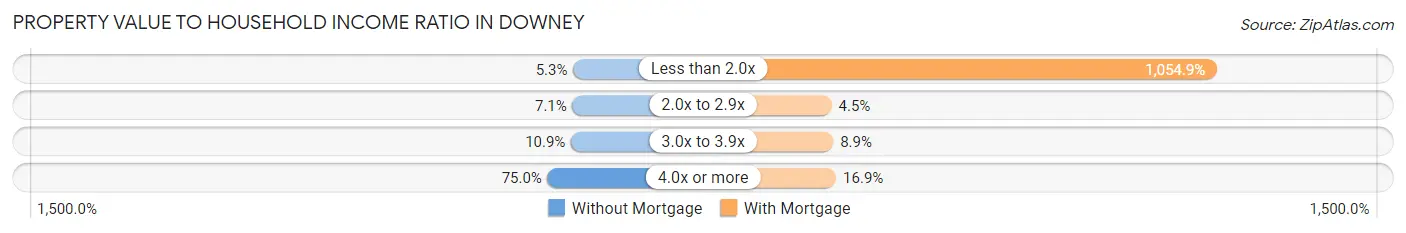
| Value-to-Income Ratio | Without Mortgage | With Mortgage |
| Less than 2.0x | 279 (5.3%) | 125,921 (1,054.9%) |
| 2.0x to 2.9x | 373 (7.1%) | 538 (4.5%) |
| 3.0x to 3.9x | 575 (10.9%) | 1,062 (8.9%) |
| 4.0x or more | 3,948 (75.0%) | 2,021 (16.9%) |
| Total | 5,264 (100.0%) | 11,937 (100.0%) |
Real Estate Taxes by Mortgage Status in Downey
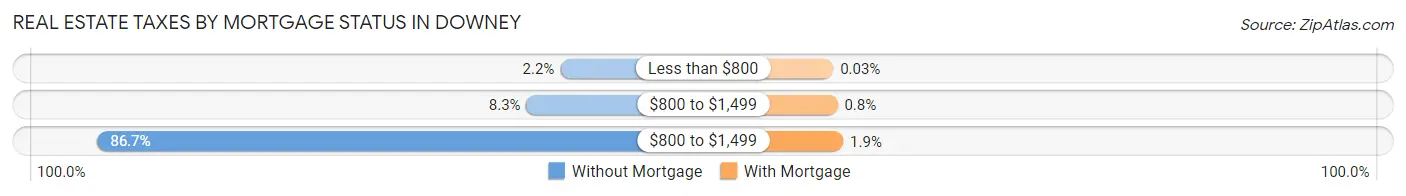
| Property Taxes | Without Mortgage | With Mortgage |
| Less than $800 | 114 (2.2%) | 4 (0.0%) |
| $800 to $1,499 | 439 (8.3%) | 96 (0.8%) |
| $800 to $1,499 | 4,565 (86.7%) | 221 (1.8%) |
| Total | 5,264 (100.0%) | 11,937 (100.0%) |
Health & Disability in Downey
Health Insurance Coverage by Age in Downey
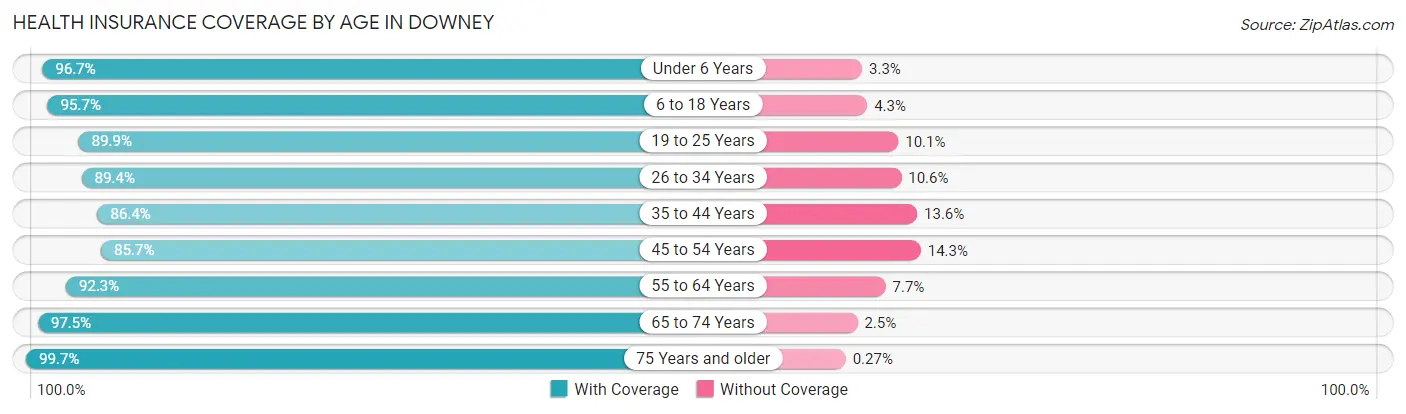
| Age Bracket | With Coverage | Without Coverage |
| Under 6 Years | 6,634 (96.7%) | 228 (3.3%) |
| 6 to 18 Years | 19,243 (95.7%) | 858 (4.3%) |
| 19 to 25 Years | 9,872 (89.9%) | 1,105 (10.1%) |
| 26 to 34 Years | 14,005 (89.4%) | 1,665 (10.6%) |
| 35 to 44 Years | 13,232 (86.4%) | 2,079 (13.6%) |
| 45 to 54 Years | 13,809 (85.7%) | 2,296 (14.3%) |
| 55 to 64 Years | 11,825 (92.3%) | 986 (7.7%) |
| 65 to 74 Years | 8,755 (97.5%) | 221 (2.5%) |
| 75 Years and older | 5,567 (99.7%) | 15 (0.3%) |
| Total | 102,942 (91.6%) | 9,453 (8.4%) |
Health Insurance Coverage by Citizenship Status in Downey
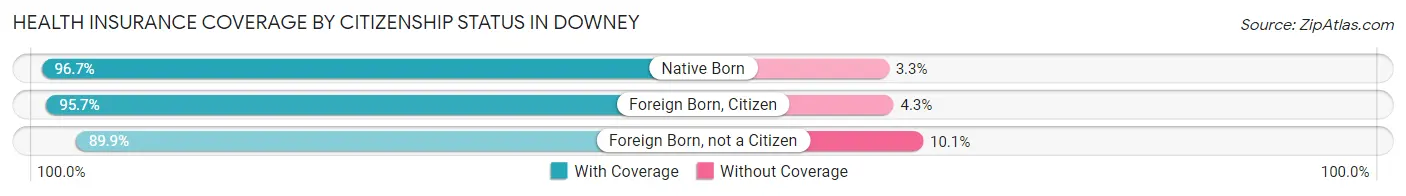
| Citizenship Status | With Coverage | Without Coverage |
| Native Born | 6,634 (96.7%) | 228 (3.3%) |
| Foreign Born, Citizen | 19,243 (95.7%) | 858 (4.3%) |
| Foreign Born, not a Citizen | 9,872 (89.9%) | 1,105 (10.1%) |
Health Insurance Coverage by Household Income in Downey
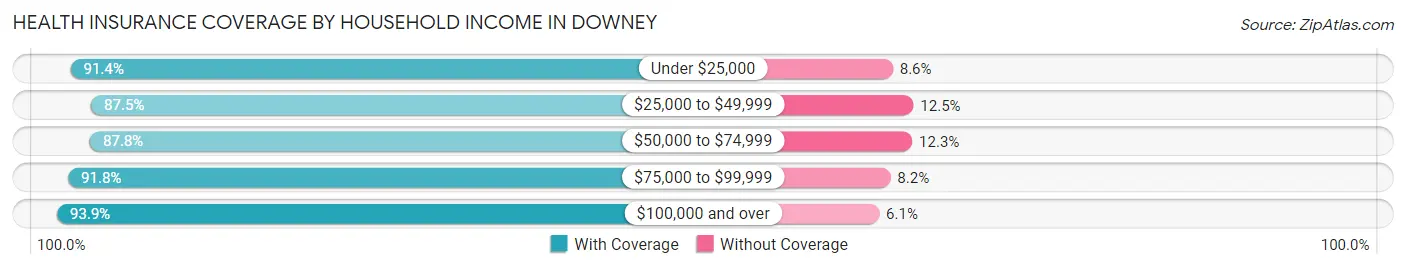
| Household Income | With Coverage | Without Coverage |
| Under $25,000 | 6,284 (91.4%) | 593 (8.6%) |
| $25,000 to $49,999 | 13,467 (87.5%) | 1,921 (12.5%) |
| $50,000 to $74,999 | 15,622 (87.7%) | 2,180 (12.2%) |
| $75,000 to $99,999 | 17,120 (91.8%) | 1,523 (8.2%) |
| $100,000 and over | 50,025 (93.9%) | 3,227 (6.1%) |
Public vs Private Health Insurance Coverage by Age in Downey
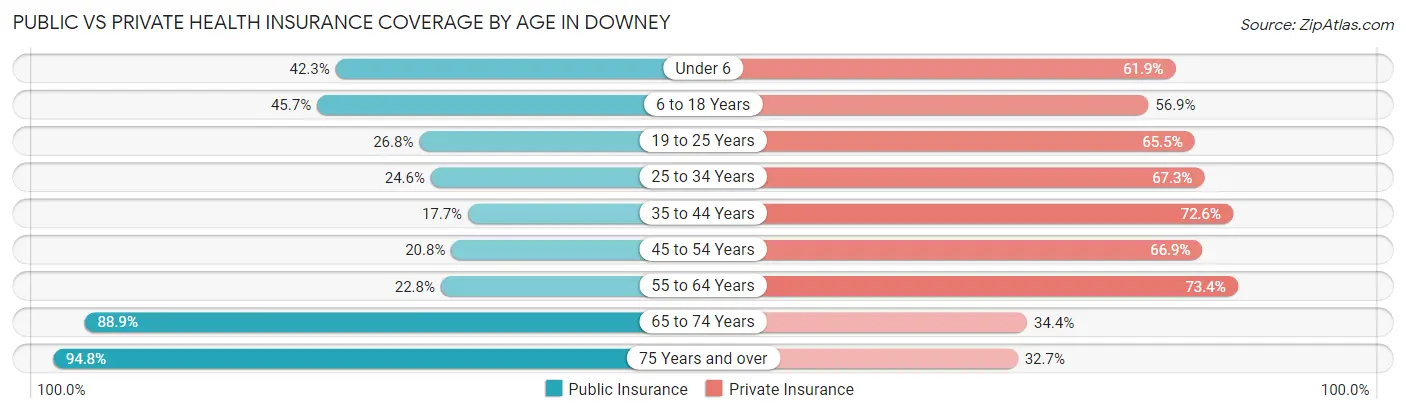
| Age Bracket | Public Insurance | Private Insurance |
| Under 6 | 2,902 (42.3%) | 4,246 (61.9%) |
| 6 to 18 Years | 9,193 (45.7%) | 11,438 (56.9%) |
| 19 to 25 Years | 2,936 (26.8%) | 7,186 (65.5%) |
| 25 to 34 Years | 3,857 (24.6%) | 10,539 (67.3%) |
| 35 to 44 Years | 2,711 (17.7%) | 11,111 (72.6%) |
| 45 to 54 Years | 3,351 (20.8%) | 10,777 (66.9%) |
| 55 to 64 Years | 2,914 (22.8%) | 9,409 (73.4%) |
| 65 to 74 Years | 7,978 (88.9%) | 3,087 (34.4%) |
| 75 Years and over | 5,289 (94.8%) | 1,823 (32.7%) |
| Total | 41,131 (36.6%) | 69,616 (61.9%) |
Disability Status by Sex by Age in Downey
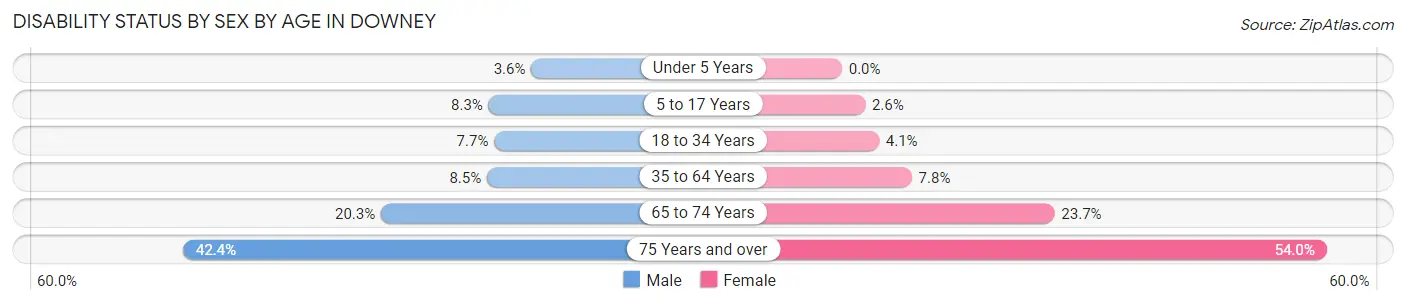
| Age Bracket | Male | Female |
| Under 5 Years | 93 (3.6%) | 0 (0.0%) |
| 5 to 17 Years | 806 (8.3%) | 264 (2.6%) |
| 18 to 34 Years | 1,103 (7.7%) | 569 (4.1%) |
| 35 to 64 Years | 1,868 (8.5%) | 1,731 (7.8%) |
| 65 to 74 Years | 801 (20.3%) | 1,191 (23.7%) |
| 75 Years and over | 943 (42.4%) | 1,813 (54.0%) |
Disability Class by Sex by Age in Downey
Disability Class: Hearing Difficulty
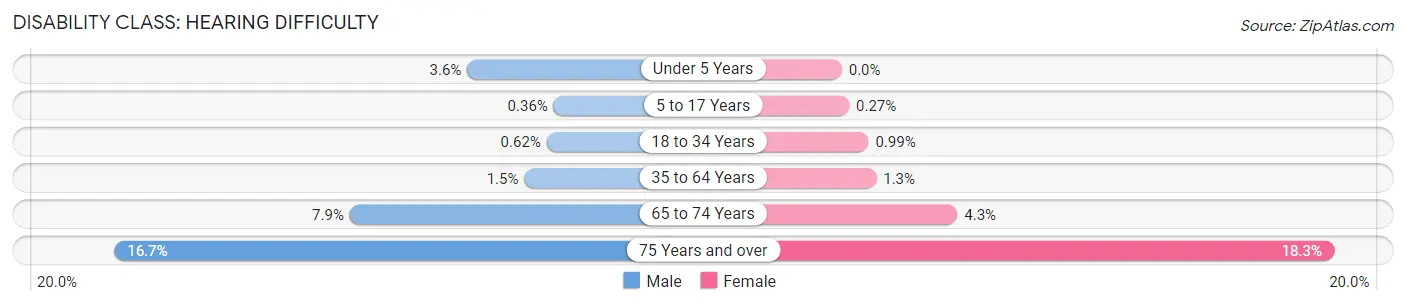
| Age Bracket | Male | Female |
| Under 5 Years | 93 (3.6%) | 0 (0.0%) |
| 5 to 17 Years | 35 (0.4%) | 28 (0.3%) |
| 18 to 34 Years | 89 (0.6%) | 137 (1.0%) |
| 35 to 64 Years | 318 (1.5%) | 284 (1.3%) |
| 65 to 74 Years | 313 (7.9%) | 216 (4.3%) |
| 75 Years and over | 371 (16.7%) | 613 (18.3%) |
Disability Class: Vision Difficulty
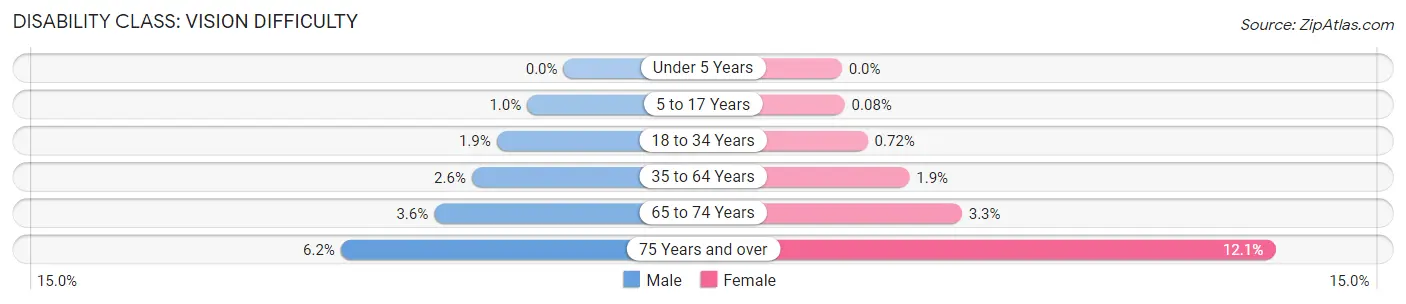
| Age Bracket | Male | Female |
| Under 5 Years | 0 (0.0%) | 0 (0.0%) |
| 5 to 17 Years | 98 (1.0%) | 8 (0.1%) |
| 18 to 34 Years | 267 (1.9%) | 99 (0.7%) |
| 35 to 64 Years | 561 (2.5%) | 418 (1.9%) |
| 65 to 74 Years | 142 (3.6%) | 168 (3.3%) |
| 75 Years and over | 138 (6.2%) | 405 (12.1%) |
Disability Class: Cognitive Difficulty
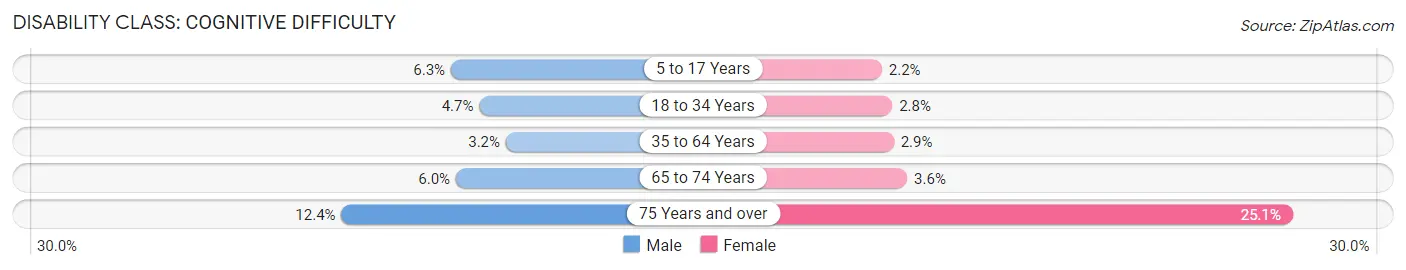
| Age Bracket | Male | Female |
| 5 to 17 Years | 606 (6.3%) | 228 (2.2%) |
| 18 to 34 Years | 671 (4.7%) | 387 (2.8%) |
| 35 to 64 Years | 703 (3.2%) | 643 (2.9%) |
| 65 to 74 Years | 236 (6.0%) | 183 (3.6%) |
| 75 Years and over | 275 (12.4%) | 843 (25.1%) |
Disability Class: Ambulatory Difficulty
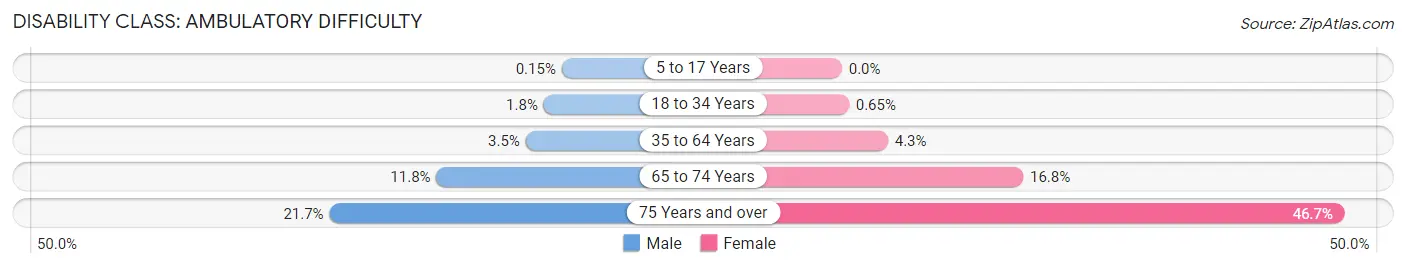
| Age Bracket | Male | Female |
| 5 to 17 Years | 15 (0.2%) | 0 (0.0%) |
| 18 to 34 Years | 261 (1.8%) | 90 (0.6%) |
| 35 to 64 Years | 768 (3.5%) | 950 (4.3%) |
| 65 to 74 Years | 465 (11.8%) | 846 (16.8%) |
| 75 Years and over | 483 (21.7%) | 1,567 (46.7%) |
Disability Class: Self-Care Difficulty
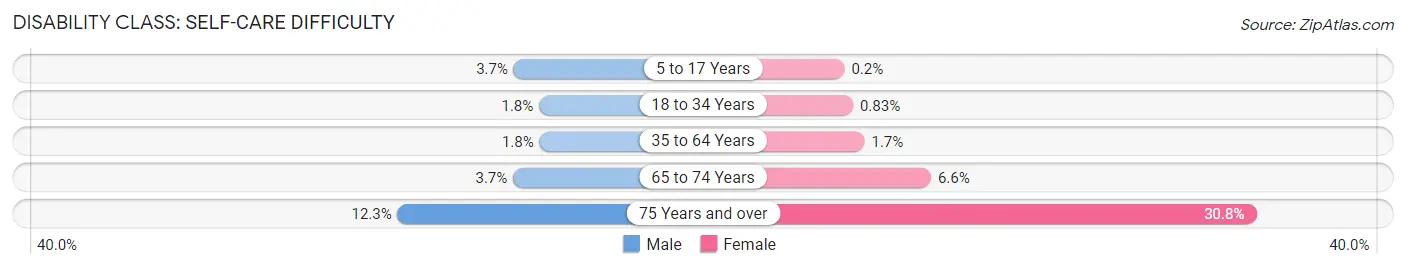
| Age Bracket | Male | Female |
| 5 to 17 Years | 356 (3.7%) | 20 (0.2%) |
| 18 to 34 Years | 258 (1.8%) | 115 (0.8%) |
| 35 to 64 Years | 388 (1.8%) | 377 (1.7%) |
| 65 to 74 Years | 147 (3.7%) | 333 (6.6%) |
| 75 Years and over | 274 (12.3%) | 1,033 (30.8%) |
Technology Access in Downey
Computing Device Access in Downey
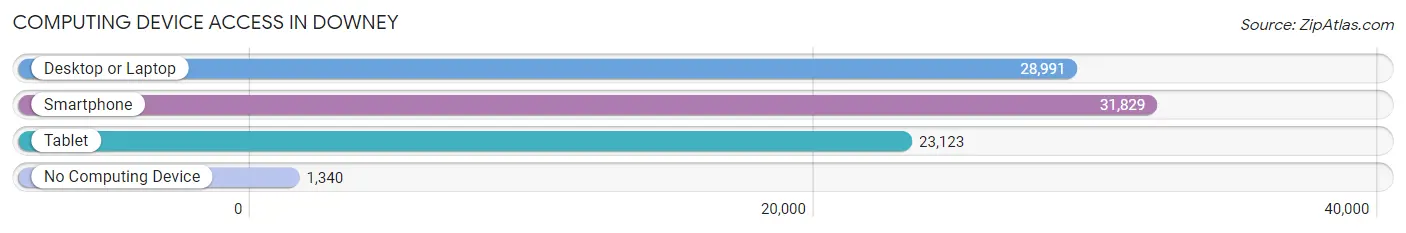
| Device Type | # Households | % Households |
| Desktop or Laptop | 28,991 | 83.3% |
| Smartphone | 31,829 | 91.5% |
| Tablet | 23,123 | 66.5% |
| No Computing Device | 1,340 | 3.8% |
| Total | 34,788 | 100.0% |
Internet Access in Downey
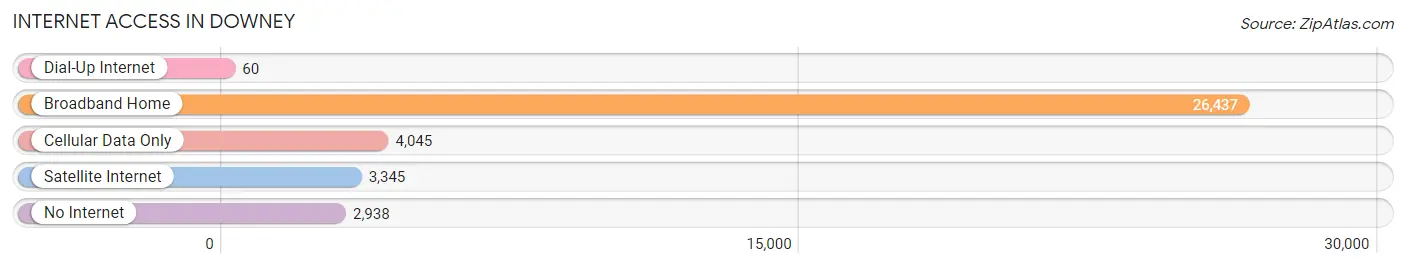
| Internet Type | # Households | % Households |
| Dial-Up Internet | 60 | 0.2% |
| Broadband Home | 26,437 | 76.0% |
| Cellular Data Only | 4,045 | 11.6% |
| Satellite Internet | 3,345 | 9.6% |
| No Internet | 2,938 | 8.5% |
| Total | 34,788 | 100.0% |
Downey Summary
Downey, California is a city located in Los Angeles County, California. It is situated 13 miles southeast of downtown Los Angeles and is part of the Gateway Cities region. As of the 2010 United States Census, the city had a population of 111,772, making it the 18th most populous city in California.
Geography
Downey is located at 33°55'N 118°7'W (33.917, -118.117). According to the United States Census Bureau, the city has a total area of 11.4 square miles (29.5 km2), all of it land.
Downey is bordered by the cities of Bellflower to the northwest, Norwalk and Cerritos to the east, Paramount to the south, and South Gate and Lynwood to the west.
History
Downey was founded in 1873 by John G. Downey, a former governor of California. The city was incorporated in 1956, and it is the oldest city in the county.
Downey was once home to the world's largest manufacturing plant of the Hughes Aircraft Company, which was founded in 1947. The plant closed in 2003, and the site is now occupied by the Columbia Memorial Space Center, a museum and educational facility.
Economy
Downey's economy is largely based on manufacturing and retail. The city is home to several large companies, including Boeing, Northrop Grumman, and St. John Knits.
Downey is also home to the Downey Landing Shopping Center, which is the largest shopping center in the city. The center features over 100 stores and restaurants, including Target, Best Buy, and Home Depot.
Demographics
As of the 2010 United States Census, there were 111,772 people, 36,845 households, and 27,845 families residing in the city. The population density was 9,817.3 people per square mile (3,791.2/km2). There were 39,945 housing units at an average density of 3,521.3 per square mile (1,364.2/km2). The racial makeup of the city was 57.2% White, 2.3% African American, 1.2% Native American, 11.2% Asian, 0.4% Pacific Islander, 25.2% from other races, and 3.5% from two or more races. Hispanic or Latino of any race were 57.2% of the population.
The median income for a household in the city was $50,945, and the median income for a family was $58,945. Males had a median income of $41,945 versus $32,945 for females. The per capita income for the city was $21,945. About 11.2% of families and 14.2% of the population were below the poverty line, including 19.2% of those under age 18 and 8.2% of those age 65 or over.
Downey is a diverse city, with a large Hispanic population. The city is also home to a large Filipino American population, as well as a growing Asian American population.
Common Questions
What is Per Capita Income in Downey?
Per Capita income in Downey is $35,375.
What is the Median Family Income in Downey?
Median Family Income in Downey is $90,236.
What is the Median Household income in Downey?
Median Household Income in Downey is $84,236.
What is Income or Wage Gap in Downey?
Income or Wage Gap in Downey is 26.1%.
Women in Downey earn 73.9 cents for every dollar earned by a man.
What is Family Income Deficit in Downey?
Family Income Deficit in Downey is $10,684.
Families that are below poverty line in Downey earn $10,684 less on average than the poverty threshold level.
What is Inequality or Gini Index in Downey?
Inequality or Gini Index in Downey is 0.43.
What is the Total Population of Downey?
Total Population of Downey is 113,052.
What is the Total Male Population of Downey?
Total Male Population of Downey is 55,143.
What is the Total Female Population of Downey?
Total Female Population of Downey is 57,909.
What is the Ratio of Males per 100 Females in Downey?
There are 95.22 Males per 100 Females in Downey.
What is the Ratio of Females per 100 Males in Downey?
There are 105.02 Females per 100 Males in Downey.
What is the Median Population Age in Downey?
Median Population Age in Downey is 36.5 Years.
What is the Average Family Size in Downey
Average Family Size in Downey is 3.6 People.
What is the Average Household Size in Downey
Average Household Size in Downey is 3.2 People.
How Large is the Labor Force in Downey?
There are 60,146 People in the Labor Forcein in Downey.
What is the Percentage of People in the Labor Force in Downey?
66.1% of People are in the Labor Force in Downey.
What is the Unemployment Rate in Downey?
Unemployment Rate in Downey is 5.6%.