Altadena, CA Map & Demographics
Altadena Map
Altadena Overview
$61,334
PER CAPITA INCOME
$140,072
AVG FAMILY INCOME
$123,869
AVG HOUSEHOLD INCOME
24.4%
WAGE / INCOME GAP [ % ]
75.6¢/ $1
WAGE / INCOME GAP [ $ ]
$8,591
FAMILY INCOME DEFICIT
0.47
INEQUALITY / GINI INDEX
42,719
TOTAL POPULATION
20,251
MALE POPULATION
22,468
FEMALE POPULATION
90.13
MALES / 100 FEMALES
110.95
FEMALES / 100 MALES
43.8
MEDIAN AGE
3.3
AVG FAMILY SIZE
2.8
AVG HOUSEHOLD SIZE
22,552
LABOR FORCE [ PEOPLE ]
64.6%
PERCENT IN LABOR FORCE
6.7%
UNEMPLOYMENT RATE
Altadena Zip Codes
Altadena Area Codes
Income in Altadena
Income Overview in Altadena
Per Capita Income in Altadena is $61,334, while median incomes of families and households are $140,072 and $123,869 respectively.
| Characteristic | Number | Measure |
| Per Capita Income | 42,719 | $61,334 |
| Median Family Income | 10,914 | $140,072 |
| Mean Family Income | 10,914 | $189,482 |
| Median Household Income | 14,768 | $123,869 |
| Mean Household Income | 14,768 | $172,340 |
| Income Deficit | 10,914 | $8,591 |
| Wage / Income Gap (%) | 42,719 | 24.41% |
| Wage / Income Gap ($) | 42,719 | 75.59¢ per $1 |
| Gini / Inequality Index | 42,719 | 0.47 |
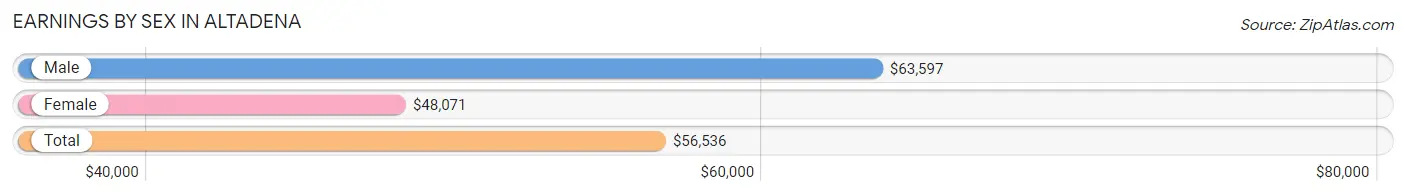
Earnings by Sex in Altadena
Average Earnings in Altadena are $56,536, $63,597 for men and $48,071 for women, a difference of 24.4%.
| Sex | Number | Average Earnings |
| Male | 11,885 (50.6%) | $63,597 |
| Female | 11,617 (49.4%) | $48,071 |
| Total | 23,502 (100.0%) | $56,536 |
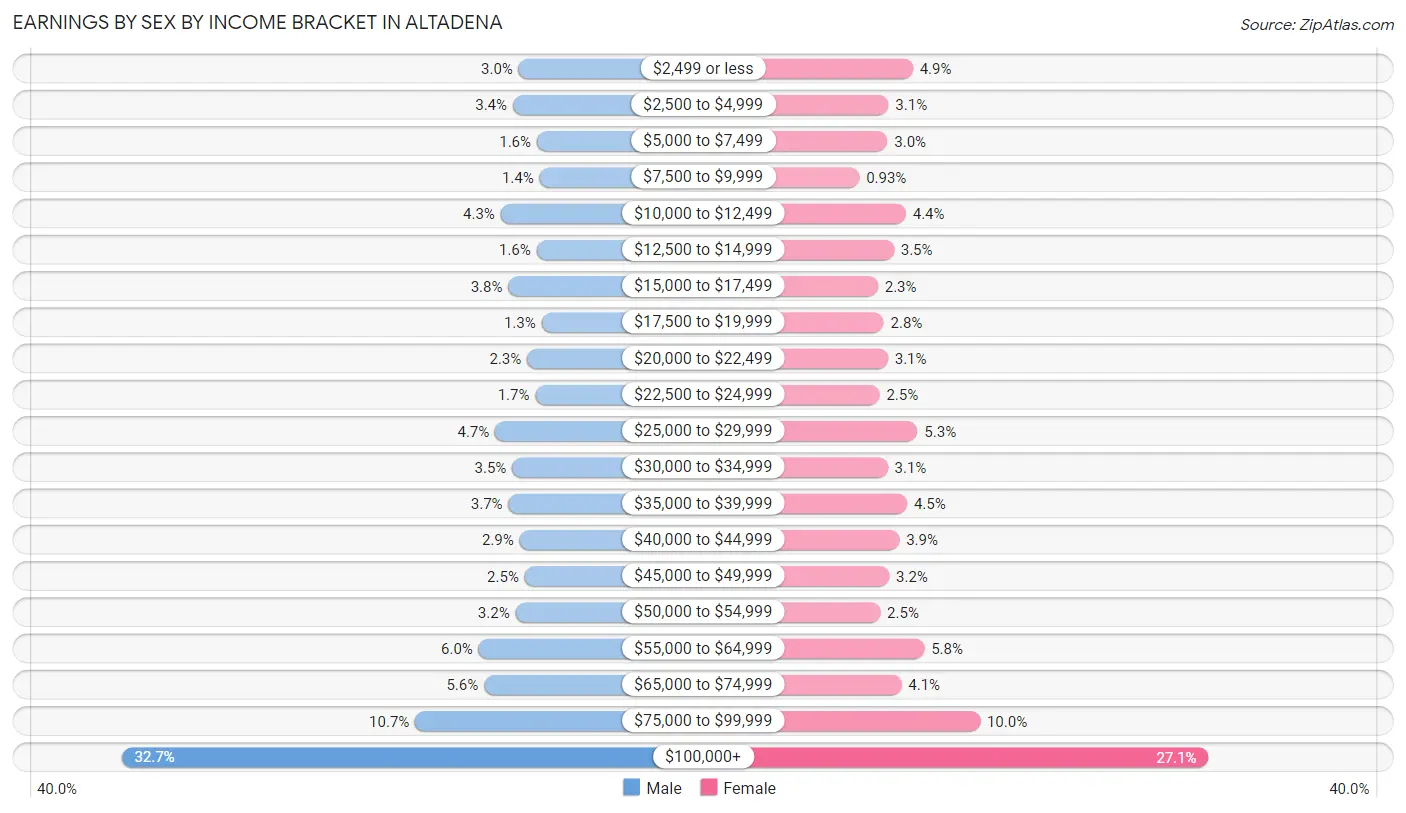
Earnings by Sex by Income Bracket in Altadena
The most common earnings brackets in Altadena are $100,000+ for men (3,891 | 32.7%) and $100,000+ for women (3,148 | 27.1%).
| Income | Male | Female |
| $2,499 or less | 353 (3.0%) | 574 (4.9%) |
| $2,500 to $4,999 | 405 (3.4%) | 362 (3.1%) |
| $5,000 to $7,499 | 191 (1.6%) | 353 (3.0%) |
| $7,500 to $9,999 | 167 (1.4%) | 108 (0.9%) |
| $10,000 to $12,499 | 513 (4.3%) | 513 (4.4%) |
| $12,500 to $14,999 | 194 (1.6%) | 409 (3.5%) |
| $15,000 to $17,499 | 446 (3.7%) | 270 (2.3%) |
| $17,500 to $19,999 | 150 (1.3%) | 321 (2.8%) |
| $20,000 to $22,499 | 278 (2.3%) | 357 (3.1%) |
| $22,500 to $24,999 | 206 (1.7%) | 285 (2.5%) |
| $25,000 to $29,999 | 563 (4.7%) | 615 (5.3%) |
| $30,000 to $34,999 | 411 (3.5%) | 355 (3.1%) |
| $35,000 to $39,999 | 444 (3.7%) | 524 (4.5%) |
| $40,000 to $44,999 | 346 (2.9%) | 457 (3.9%) |
| $45,000 to $49,999 | 299 (2.5%) | 368 (3.2%) |
| $50,000 to $54,999 | 382 (3.2%) | 290 (2.5%) |
| $55,000 to $64,999 | 709 (6.0%) | 674 (5.8%) |
| $65,000 to $74,999 | 662 (5.6%) | 475 (4.1%) |
| $75,000 to $99,999 | 1,275 (10.7%) | 1,159 (10.0%) |
| $100,000+ | 3,891 (32.7%) | 3,148 (27.1%) |
| Total | 11,885 (100.0%) | 11,617 (100.0%) |
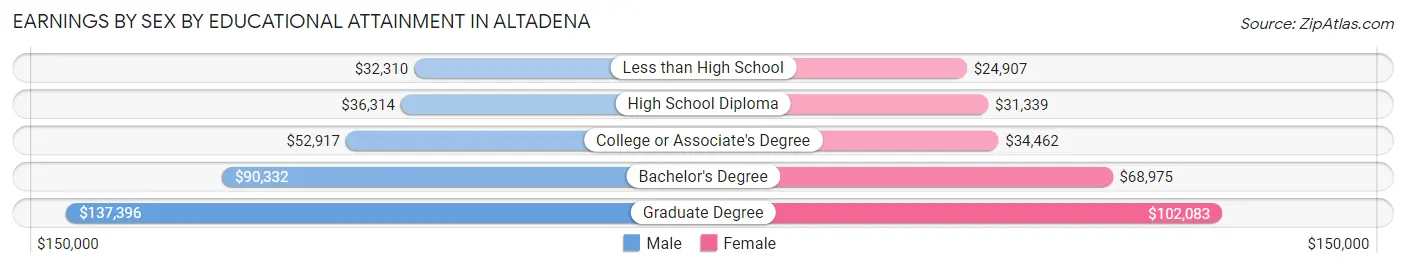
Earnings by Sex by Educational Attainment in Altadena
Average earnings in Altadena are $68,974 for men and $55,550 for women, a difference of 19.5%. Men with an educational attainment of graduate degree enjoy the highest average annual earnings of $137,396, while those with less than high school education earn the least with $32,310. Women with an educational attainment of graduate degree earn the most with the average annual earnings of $102,083, while those with less than high school education have the smallest earnings of $24,907.
| Educational Attainment | Male Income | Female Income |
| Less than High School | $32,310 | $24,907 |
| High School Diploma | $36,314 | $31,339 |
| College or Associate's Degree | $52,917 | $34,462 |
| Bachelor's Degree | $90,332 | $68,975 |
| Graduate Degree | $137,396 | $102,083 |
| Total | $68,974 | $55,550 |
Family Income in Altadena
Family Income Brackets in Altadena
According to the Altadena family income data, there are 3,656 families falling into the $200,000+ income range, which is the most common income bracket and makes up 33.5% of all families. Conversely, the $10,000 to $14,999 income bracket is the least frequent group with only 87 families (0.8%) belonging to this category.
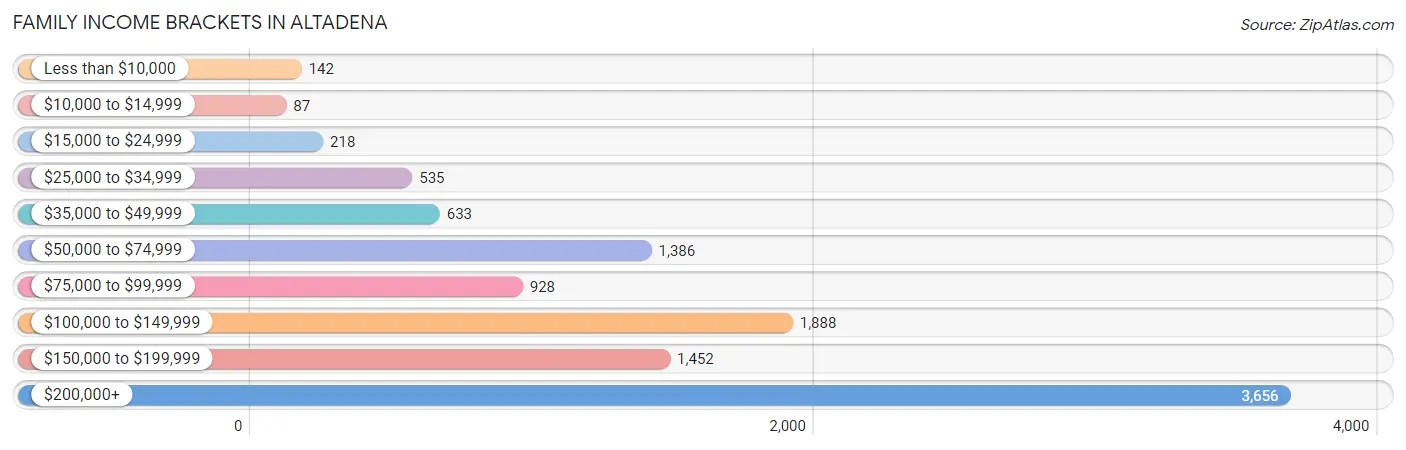
| Income Bracket | # Families | % Families |
| Less than $10,000 | 142 | 1.3% |
| $10,000 to $14,999 | 87 | 0.8% |
| $15,000 to $24,999 | 218 | 2.0% |
| $25,000 to $34,999 | 535 | 4.9% |
| $35,000 to $49,999 | 633 | 5.8% |
| $50,000 to $74,999 | 1,386 | 12.7% |
| $75,000 to $99,999 | 928 | 8.5% |
| $100,000 to $149,999 | 1,888 | 17.3% |
| $150,000 to $199,999 | 1,452 | 13.3% |
| $200,000+ | 3,656 | 33.5% |
Family Income by Famaliy Size in Altadena
4-person families (1,738 | 15.9%) account for the highest median family income in Altadena with $198,125 per family, while 2-person families (4,575 | 41.9%) have the highest median income of $59,098 per family member.
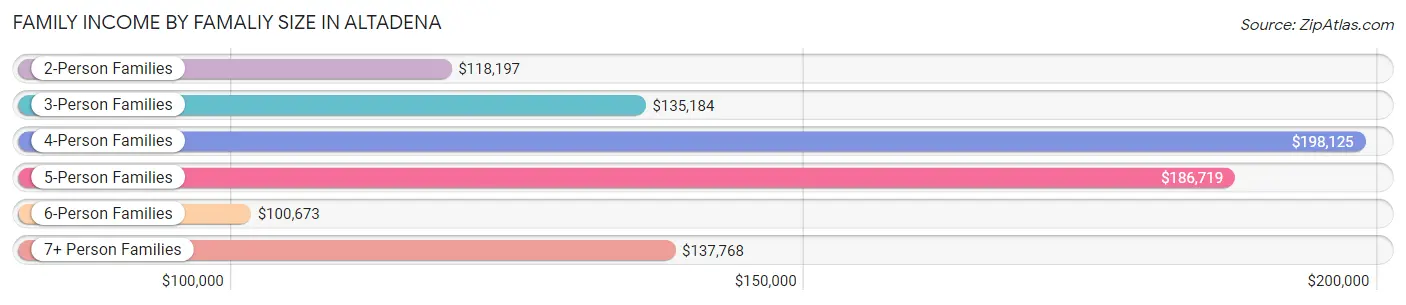
| Income Bracket | # Families | Median Income |
| 2-Person Families | 4,575 (41.9%) | $118,197 |
| 3-Person Families | 3,172 (29.1%) | $135,184 |
| 4-Person Families | 1,738 (15.9%) | $198,125 |
| 5-Person Families | 1,011 (9.3%) | $186,719 |
| 6-Person Families | 151 (1.4%) | $100,673 |
| 7+ Person Families | 267 (2.5%) | $137,768 |
| Total | 10,914 (100.0%) | $140,072 |
Family Income by Number of Earners in Altadena
The median family income in Altadena is $140,072, with families comprising 3+ earners (1,456) having the highest median family income of $191,485, while families with no earners (1,092) have the lowest median family income of $63,472, accounting for 13.3% and 10.0% of families, respectively.
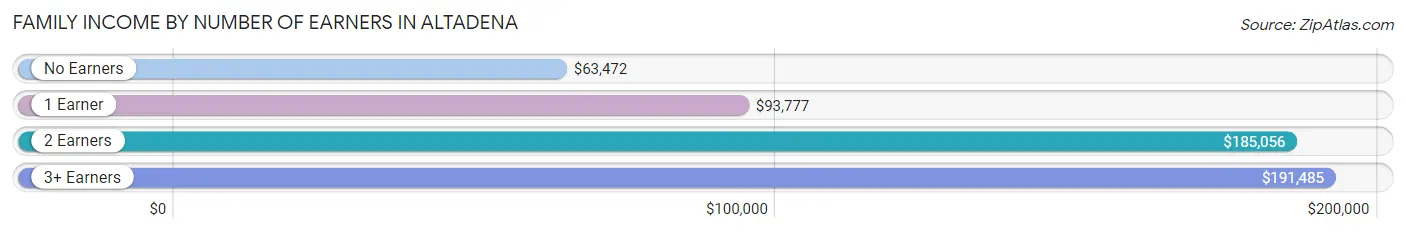
| Number of Earners | # Families | Median Income |
| No Earners | 1,092 (10.0%) | $63,472 |
| 1 Earner | 3,194 (29.3%) | $93,777 |
| 2 Earners | 5,172 (47.4%) | $185,056 |
| 3+ Earners | 1,456 (13.3%) | $191,485 |
| Total | 10,914 (100.0%) | $140,072 |
Household Income in Altadena
Household Income Brackets in Altadena
With 4,371 households falling in the category, the $200,000+ income range is the most frequent in Altadena, accounting for 29.6% of all households. In contrast, only 207 households (1.4%) fall into the $10,000 to $14,999 income bracket, making it the least populous group.
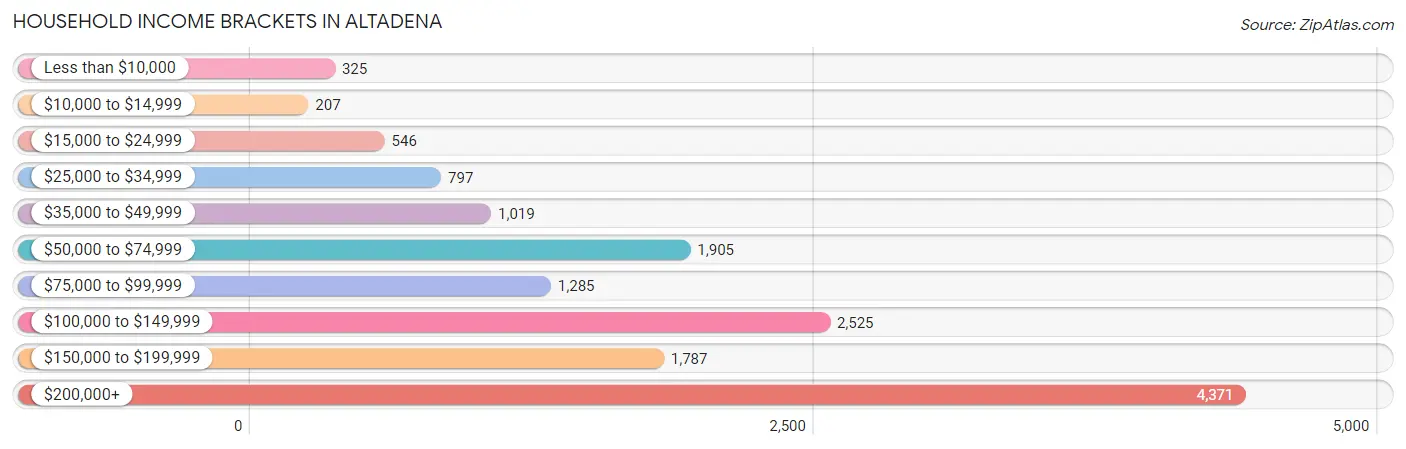
| Income Bracket | # Households | % Households |
| Less than $10,000 | 325 | 2.2% |
| $10,000 to $14,999 | 207 | 1.4% |
| $15,000 to $24,999 | 546 | 3.7% |
| $25,000 to $34,999 | 797 | 5.4% |
| $35,000 to $49,999 | 1,019 | 6.9% |
| $50,000 to $74,999 | 1,905 | 12.9% |
| $75,000 to $99,999 | 1,285 | 8.7% |
| $100,000 to $149,999 | 2,525 | 17.1% |
| $150,000 to $199,999 | 1,787 | 12.1% |
| $200,000+ | 4,371 | 29.6% |
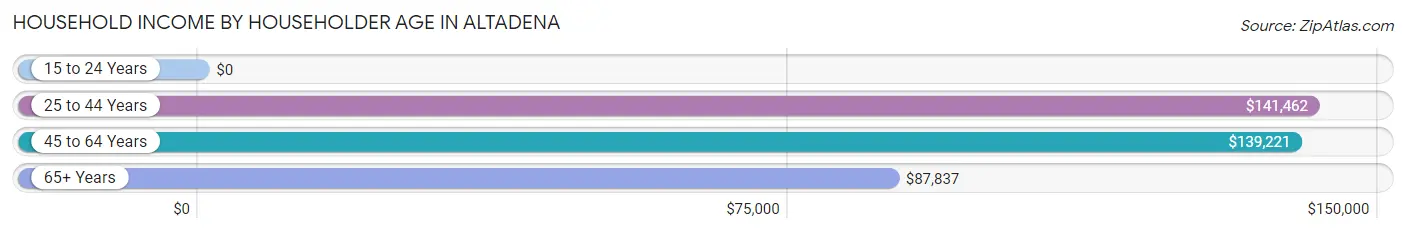
Household Income by Householder Age in Altadena
The median household income in Altadena is $123,869, with the highest median household income of $141,462 found in the 25 to 44 years age bracket for the primary householder. A total of 3,604 households (24.4%) fall into this category. Meanwhile, the 15 to 24 years age bracket for the primary householder has the lowest median household income of $0, with 131 households (0.9%) in this group.
| Income Bracket | # Households | Median Income |
| 15 to 24 Years | 131 (0.9%) | $0 |
| 25 to 44 Years | 3,604 (24.4%) | $141,462 |
| 45 to 64 Years | 6,337 (42.9%) | $139,221 |
| 65+ Years | 4,696 (31.8%) | $87,837 |
| Total | 14,768 (100.0%) | $123,869 |
Poverty in Altadena
Income Below Poverty by Sex and Age in Altadena
With 5.8% poverty level for males and 7.7% for females among the residents of Altadena, 12 to 14 year old males and 15 year old females are the most vulnerable to poverty, with 69 males (11.2%) and 58 females (28.3%) in their respective age groups living below the poverty level.
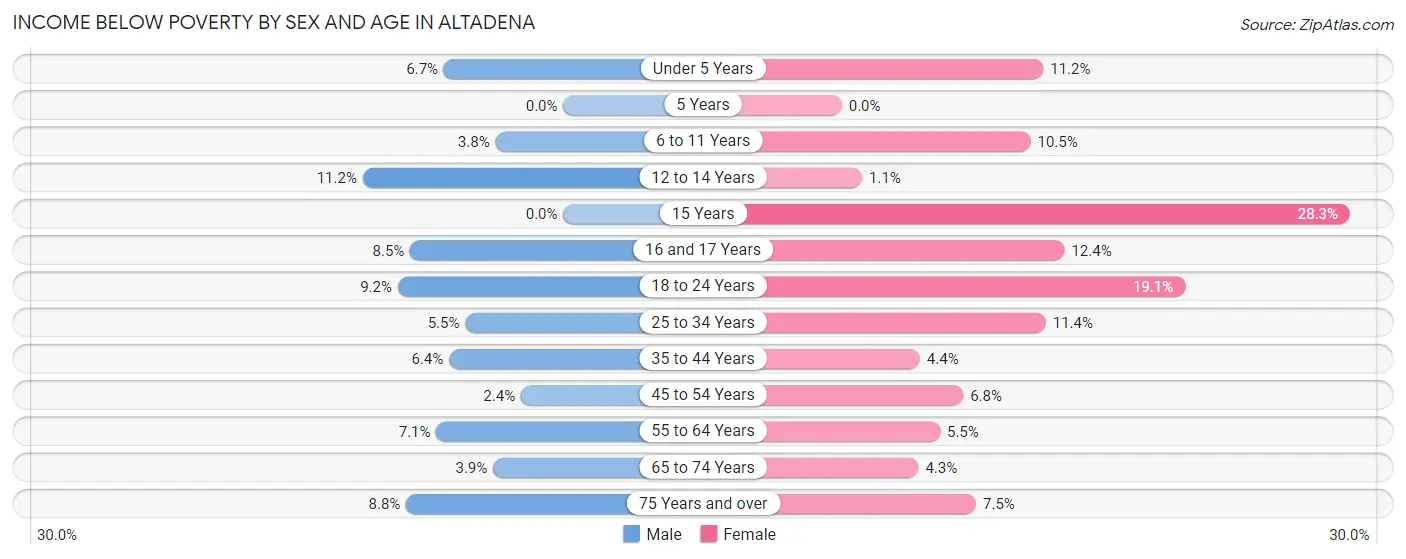
| Age Bracket | Male | Female |
| Under 5 Years | 74 (6.7%) | 135 (11.2%) |
| 5 Years | 0 (0.0%) | 0 (0.0%) |
| 6 to 11 Years | 54 (3.8%) | 172 (10.5%) |
| 12 to 14 Years | 69 (11.2%) | 8 (1.1%) |
| 15 Years | 0 (0.0%) | 58 (28.3%) |
| 16 and 17 Years | 32 (8.5%) | 62 (12.4%) |
| 18 to 24 Years | 120 (9.2%) | 215 (19.1%) |
| 25 to 34 Years | 143 (5.5%) | 273 (11.4%) |
| 35 to 44 Years | 176 (6.4%) | 129 (4.3%) |
| 45 to 54 Years | 72 (2.4%) | 212 (6.8%) |
| 55 to 64 Years | 193 (7.1%) | 184 (5.5%) |
| 65 to 74 Years | 74 (3.9%) | 109 (4.3%) |
| 75 Years and over | 145 (8.7%) | 172 (7.5%) |
| Total | 1,152 (5.8%) | 1,729 (7.7%) |
Income Above Poverty by Sex and Age in Altadena
According to the poverty statistics in Altadena, males aged 5 years and females aged 5 years are the age groups that are most secure financially, with 100.0% of males and 100.0% of females in these age groups living above the poverty line.
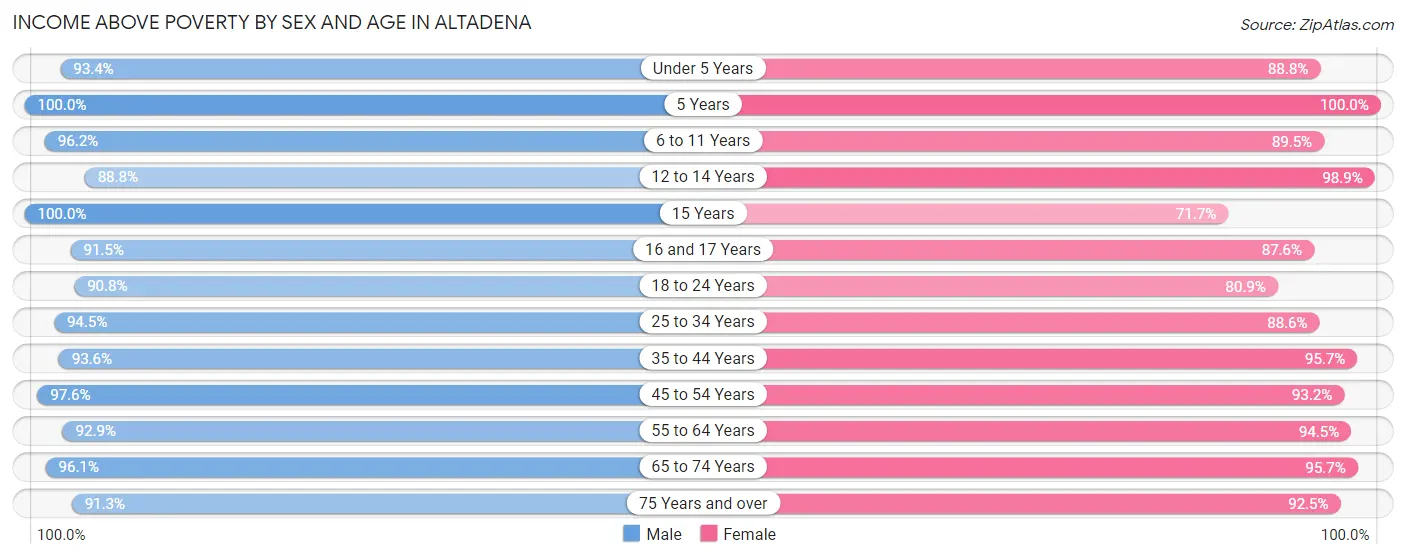
| Age Bracket | Male | Female |
| Under 5 Years | 1,039 (93.3%) | 1,068 (88.8%) |
| 5 Years | 269 (100.0%) | 221 (100.0%) |
| 6 to 11 Years | 1,375 (96.2%) | 1,465 (89.5%) |
| 12 to 14 Years | 549 (88.8%) | 697 (98.9%) |
| 15 Years | 150 (100.0%) | 147 (71.7%) |
| 16 and 17 Years | 343 (91.5%) | 438 (87.6%) |
| 18 to 24 Years | 1,182 (90.8%) | 910 (80.9%) |
| 25 to 34 Years | 2,475 (94.5%) | 2,131 (88.6%) |
| 35 to 44 Years | 2,591 (93.6%) | 2,837 (95.7%) |
| 45 to 54 Years | 2,984 (97.6%) | 2,923 (93.2%) |
| 55 to 64 Years | 2,536 (92.9%) | 3,177 (94.5%) |
| 65 to 74 Years | 1,821 (96.1%) | 2,443 (95.7%) |
| 75 Years and over | 1,513 (91.2%) | 2,127 (92.5%) |
| Total | 18,827 (94.2%) | 20,584 (92.2%) |
Income Below Poverty Among Married-Couple Families in Altadena
The poverty statistics for married-couple families in Altadena show that 2.3% or 175 of the total 7,586 families live below the poverty line. Families with 3 or 4 children have the highest poverty rate of 8.0%, comprising of 25 families. On the other hand, families with 5 or more children have the lowest poverty rate of 0.0%, which includes 0 families.
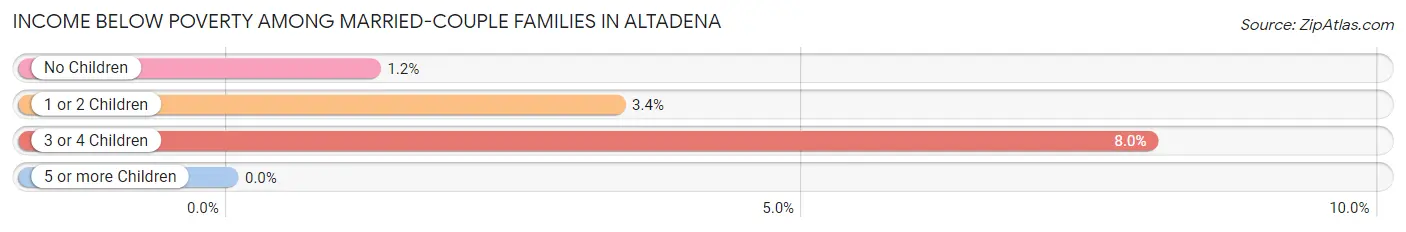
| Children | Above Poverty | Below Poverty |
| No Children | 4,375 (98.8%) | 55 (1.2%) |
| 1 or 2 Children | 2,728 (96.6%) | 95 (3.4%) |
| 3 or 4 Children | 287 (92.0%) | 25 (8.0%) |
| 5 or more Children | 21 (100.0%) | 0 (0.0%) |
| Total | 7,411 (97.7%) | 175 (2.3%) |
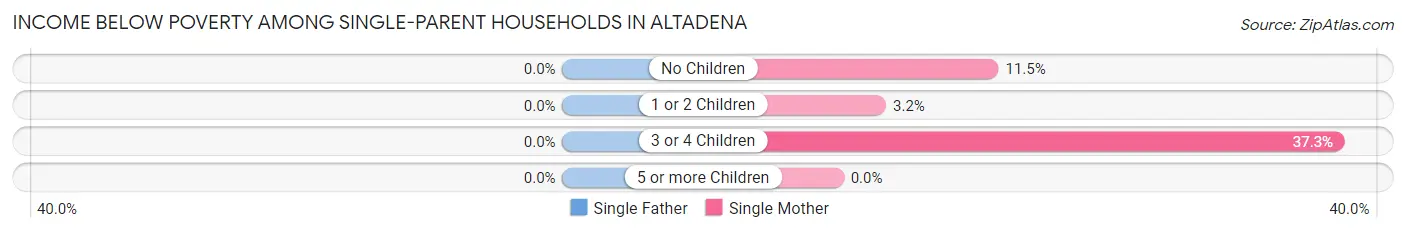
Income Below Poverty Among Single-Parent Households in Altadena
| Children | Single Father | Single Mother |
| No Children | 0 (0.0%) | 164 (11.5%) |
| 1 or 2 Children | 0 (0.0%) | 32 (3.2%) |
| 3 or 4 Children | 0 (0.0%) | 87 (37.3%) |
| 5 or more Children | 0 (0.0%) | 0 (0.0%) |
| Total | 0 (0.0%) | 283 (10.6%) |
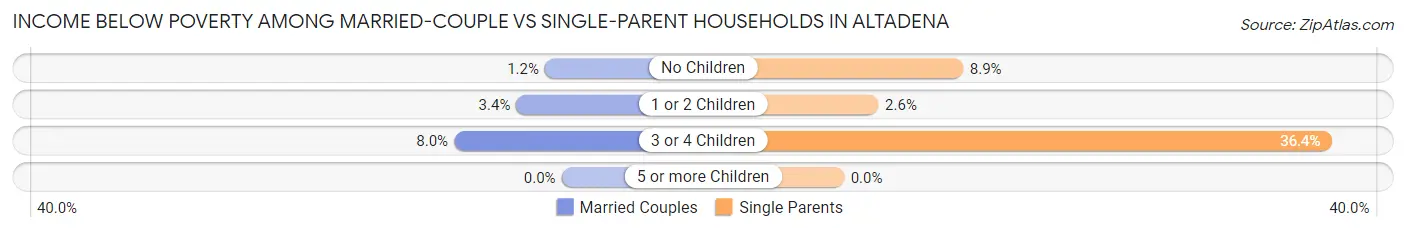
Income Below Poverty Among Married-Couple vs Single-Parent Households in Altadena
The poverty data for Altadena shows that 175 of the married-couple family households (2.3%) and 283 of the single-parent households (8.5%) are living below the poverty level. Within the married-couple family households, those with 3 or 4 children have the highest poverty rate, with 25 households (8.0%) falling below the poverty line. Among the single-parent households, those with 3 or 4 children have the highest poverty rate, with 87 household (36.4%) living below poverty.
| Children | Married-Couple Families | Single-Parent Households |
| No Children | 55 (1.2%) | 164 (8.9%) |
| 1 or 2 Children | 95 (3.4%) | 32 (2.6%) |
| 3 or 4 Children | 25 (8.0%) | 87 (36.4%) |
| 5 or more Children | 0 (0.0%) | 0 (0.0%) |
| Total | 175 (2.3%) | 283 (8.5%) |
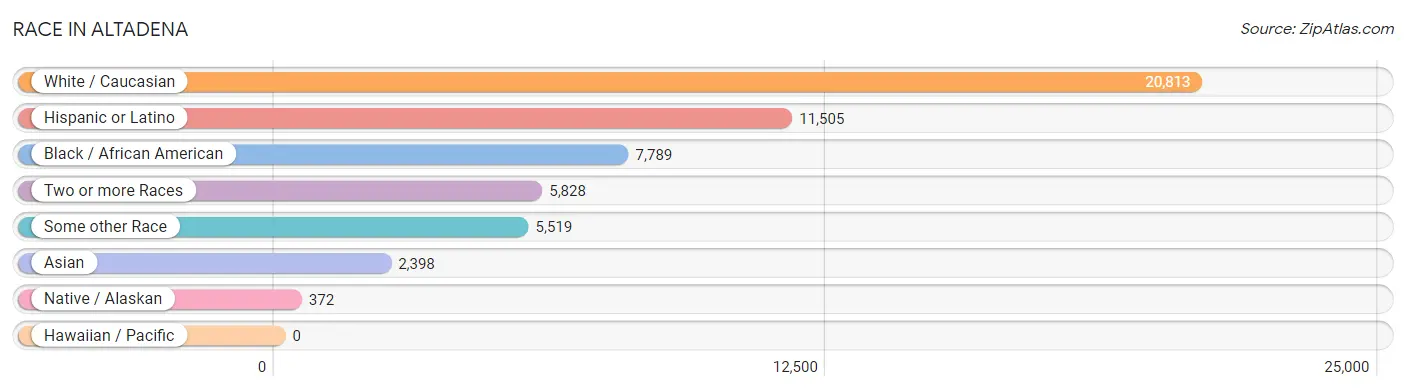
Race in Altadena
The most populous races in Altadena are White / Caucasian (20,813 | 48.7%), Hispanic or Latino (11,505 | 26.9%), and Black / African American (7,789 | 18.2%).
| Race | # Population | % Population |
| Asian | 2,398 | 5.6% |
| Black / African American | 7,789 | 18.2% |
| Hawaiian / Pacific | 0 | 0.0% |
| Hispanic or Latino | 11,505 | 26.9% |
| Native / Alaskan | 372 | 0.9% |
| White / Caucasian | 20,813 | 48.7% |
| Two or more Races | 5,828 | 13.6% |
| Some other Race | 5,519 | 12.9% |
| Total | 42,719 | 100.0% |
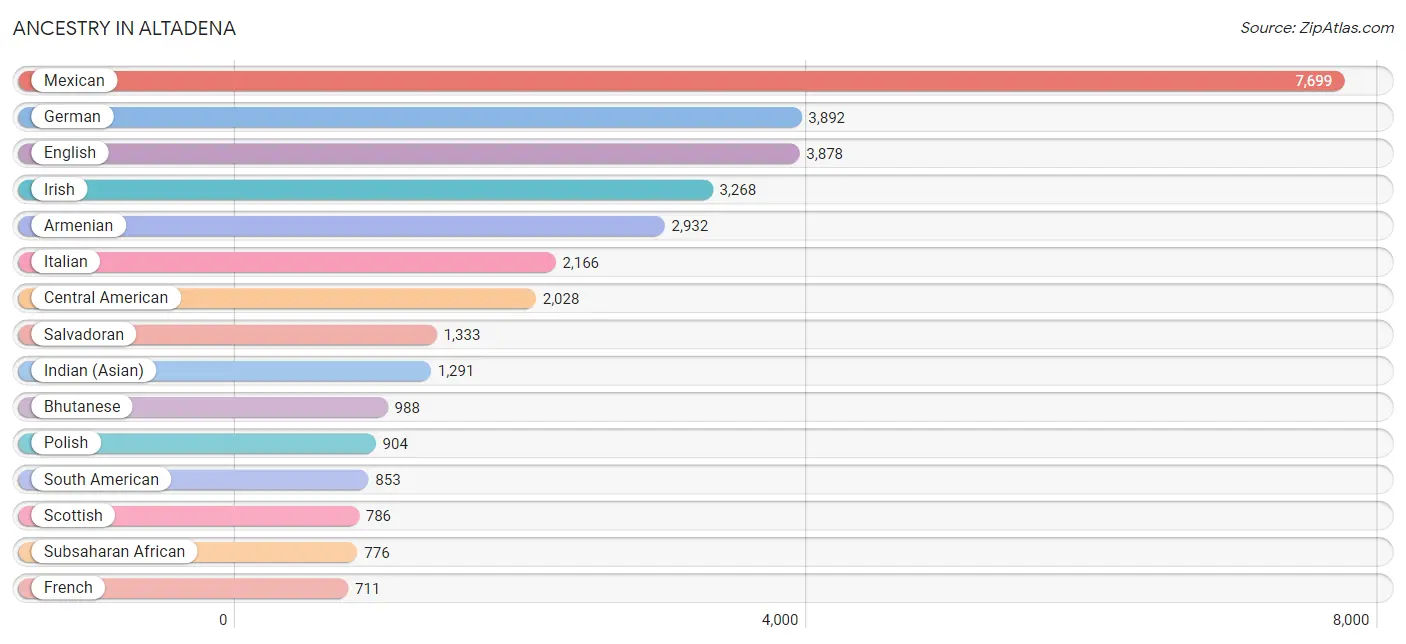
Ancestry in Altadena
The most populous ancestries reported in Altadena are Mexican (7,699 | 18.0%), German (3,892 | 9.1%), English (3,878 | 9.1%), Irish (3,268 | 7.6%), and Armenian (2,932 | 6.9%), together accounting for 50.7% of all Altadena residents.
| Ancestry | # Population | % Population |
| Afghan | 25 | 0.1% |
| African | 306 | 0.7% |
| American | 649 | 1.5% |
| Apache | 20 | 0.1% |
| Arab | 457 | 1.1% |
| Argentinean | 140 | 0.3% |
| Armenian | 2,932 | 6.9% |
| Australian | 16 | 0.0% |
| Austrian | 86 | 0.2% |
| Basque | 36 | 0.1% |
| Belgian | 31 | 0.1% |
| Belizean | 85 | 0.2% |
| Bhutanese | 988 | 2.3% |
| Blackfeet | 98 | 0.2% |
| Bolivian | 100 | 0.2% |
| Brazilian | 157 | 0.4% |
| British | 314 | 0.7% |
| Burmese | 449 | 1.1% |
| Cajun | 21 | 0.1% |
| Canadian | 64 | 0.2% |
| Celtic | 9 | 0.0% |
| Central American | 2,028 | 4.8% |
| Central American Indian | 50 | 0.1% |
| Cherokee | 92 | 0.2% |
| Chilean | 77 | 0.2% |
| Colombian | 410 | 1.0% |
| Costa Rican | 93 | 0.2% |
| Croatian | 66 | 0.2% |
| Cuban | 222 | 0.5% |
| Cypriot | 7 | 0.0% |
| Czech | 150 | 0.4% |
| Danish | 218 | 0.5% |
| Dominican | 75 | 0.2% |
| Dutch | 348 | 0.8% |
| Eastern European | 129 | 0.3% |
| Egyptian | 43 | 0.1% |
| English | 3,878 | 9.1% |
| Estonian | 97 | 0.2% |
| Ethiopian | 22 | 0.1% |
| European | 618 | 1.5% |
| Filipino | 144 | 0.3% |
| Finnish | 72 | 0.2% |
| French | 711 | 1.7% |
| French Canadian | 236 | 0.5% |
| German | 3,892 | 9.1% |
| Ghanaian | 21 | 0.1% |
| Greek | 46 | 0.1% |
| Guatemalan | 235 | 0.5% |
| Guyanese | 14 | 0.0% |
| Haitian | 13 | 0.0% |
| Honduran | 41 | 0.1% |
| Hungarian | 449 | 1.1% |
| Icelander | 8 | 0.0% |
| Indian (Asian) | 1,291 | 3.0% |
| Indonesian | 21 | 0.1% |
| Iranian | 83 | 0.2% |
| Iraqi | 16 | 0.0% |
| Irish | 3,268 | 7.6% |
| Iroquois | 24 | 0.1% |
| Italian | 2,166 | 5.1% |
| Jamaican | 86 | 0.2% |
| Japanese | 21 | 0.1% |
| Jordanian | 38 | 0.1% |
| Kenyan | 371 | 0.9% |
| Korean | 659 | 1.5% |
| Laotian | 59 | 0.1% |
| Latvian | 41 | 0.1% |
| Lebanese | 195 | 0.5% |
| Liberian | 13 | 0.0% |
| Lithuanian | 105 | 0.3% |
| Mexican | 7,699 | 18.0% |
| Mexican American Indian | 340 | 0.8% |
| Mongolian | 22 | 0.1% |
| Navajo | 51 | 0.1% |
| New Zealander | 7 | 0.0% |
| Nicaraguan | 326 | 0.8% |
| Northern European | 80 | 0.2% |
| Norwegian | 349 | 0.8% |
| Pakistani | 40 | 0.1% |
| Palestinian | 82 | 0.2% |
| Pennsylvania German | 14 | 0.0% |
| Peruvian | 119 | 0.3% |
| Polish | 904 | 2.1% |
| Portuguese | 77 | 0.2% |
| Potawatomi | 20 | 0.1% |
| Pueblo | 57 | 0.1% |
| Puerto Rican | 43 | 0.1% |
| Romanian | 52 | 0.1% |
| Russian | 373 | 0.9% |
| Salvadoran | 1,333 | 3.1% |
| Scandinavian | 219 | 0.5% |
| Scotch-Irish | 187 | 0.4% |
| Scottish | 786 | 1.8% |
| Sierra Leonean | 7 | 0.0% |
| Slovak | 51 | 0.1% |
| Slovene | 56 | 0.1% |
| South African | 12 | 0.0% |
| South American | 853 | 2.0% |
| Spaniard | 91 | 0.2% |
| Spanish | 414 | 1.0% |
| Sri Lankan | 215 | 0.5% |
| Subsaharan African | 776 | 1.8% |
| Swedish | 410 | 1.0% |
| Swiss | 157 | 0.4% |
| Syrian | 19 | 0.0% |
| Thai | 611 | 1.4% |
| Trinidadian and Tobagonian | 70 | 0.2% |
| Turkish | 11 | 0.0% |
| Ukrainian | 130 | 0.3% |
| Venezuelan | 7 | 0.0% |
| Vietnamese | 97 | 0.2% |
| Welsh | 259 | 0.6% |
| Yaqui | 9 | 0.0% | View All 113 Rows |
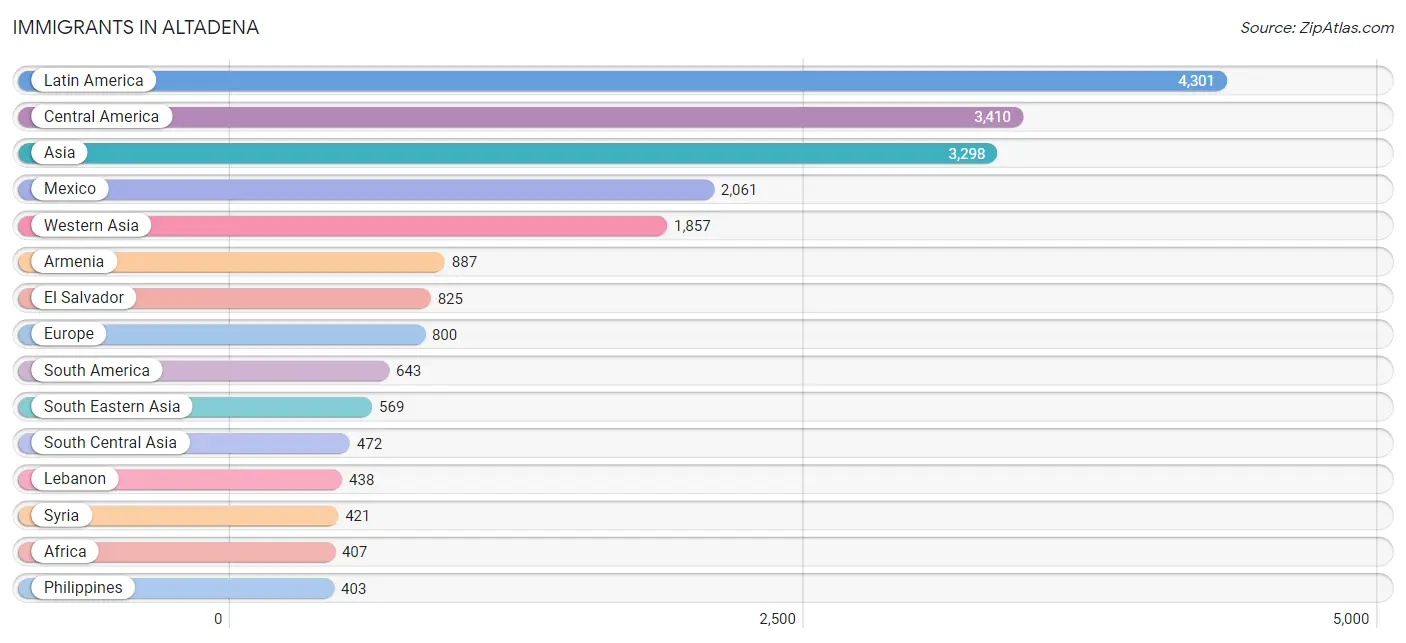
Immigrants in Altadena
The most numerous immigrant groups reported in Altadena came from Latin America (4,301 | 10.1%), Central America (3,410 | 8.0%), Asia (3,298 | 7.7%), Mexico (2,061 | 4.8%), and Western Asia (1,857 | 4.3%), together accounting for 34.9% of all Altadena residents.
| Immigration Origin | # Population | % Population |
| Afghanistan | 12 | 0.0% |
| Africa | 407 | 0.9% |
| Argentina | 86 | 0.2% |
| Armenia | 887 | 2.1% |
| Asia | 3,298 | 7.7% |
| Australia | 62 | 0.2% |
| Bangladesh | 18 | 0.0% |
| Belarus | 8 | 0.0% |
| Belize | 27 | 0.1% |
| Brazil | 35 | 0.1% |
| Canada | 237 | 0.5% |
| Caribbean | 248 | 0.6% |
| Central America | 3,410 | 8.0% |
| Chile | 30 | 0.1% |
| China | 177 | 0.4% |
| Colombia | 239 | 0.6% |
| Costa Rica | 45 | 0.1% |
| Cuba | 61 | 0.1% |
| Czechoslovakia | 6 | 0.0% |
| Denmark | 30 | 0.1% |
| Eastern Africa | 273 | 0.6% |
| Eastern Asia | 400 | 0.9% |
| Eastern Europe | 138 | 0.3% |
| Egypt | 7 | 0.0% |
| El Salvador | 825 | 1.9% |
| England | 119 | 0.3% |
| Europe | 800 | 1.9% |
| France | 50 | 0.1% |
| Germany | 168 | 0.4% |
| Greece | 12 | 0.0% |
| Guatemala | 223 | 0.5% |
| Guyana | 14 | 0.0% |
| Honduras | 15 | 0.0% |
| Hong Kong | 8 | 0.0% |
| Hungary | 6 | 0.0% |
| India | 278 | 0.6% |
| Iran | 162 | 0.4% |
| Iraq | 49 | 0.1% |
| Ireland | 15 | 0.0% |
| Israel | 18 | 0.0% |
| Italy | 47 | 0.1% |
| Jamaica | 170 | 0.4% |
| Japan | 160 | 0.4% |
| Jordan | 19 | 0.0% |
| Kenya | 273 | 0.6% |
| Korea | 63 | 0.2% |
| Kuwait | 12 | 0.0% |
| Latin America | 4,301 | 10.1% |
| Lebanon | 438 | 1.0% |
| Lithuania | 5 | 0.0% |
| Malaysia | 38 | 0.1% |
| Mexico | 2,061 | 4.8% |
| Nepal | 2 | 0.0% |
| Netherlands | 76 | 0.2% |
| Nicaragua | 214 | 0.5% |
| Northern Africa | 20 | 0.1% |
| Northern Europe | 296 | 0.7% |
| Oceania | 100 | 0.2% |
| Peru | 39 | 0.1% |
| Philippines | 403 | 0.9% |
| Poland | 28 | 0.1% |
| Romania | 5 | 0.0% |
| Russia | 18 | 0.0% |
| Sierra Leone | 7 | 0.0% |
| Singapore | 22 | 0.1% |
| South Africa | 102 | 0.2% |
| South America | 643 | 1.5% |
| South Central Asia | 472 | 1.1% |
| South Eastern Asia | 569 | 1.3% |
| Southern Europe | 72 | 0.2% |
| Spain | 13 | 0.0% |
| Syria | 421 | 1.0% |
| Taiwan | 18 | 0.0% |
| Thailand | 5 | 0.0% |
| Trinidad and Tobago | 17 | 0.0% |
| Turkey | 6 | 0.0% |
| Ukraine | 34 | 0.1% |
| Venezuela | 200 | 0.5% |
| Vietnam | 101 | 0.2% |
| Western Africa | 7 | 0.0% |
| Western Asia | 1,857 | 4.3% |
| Western Europe | 294 | 0.7% | View All 82 Rows |
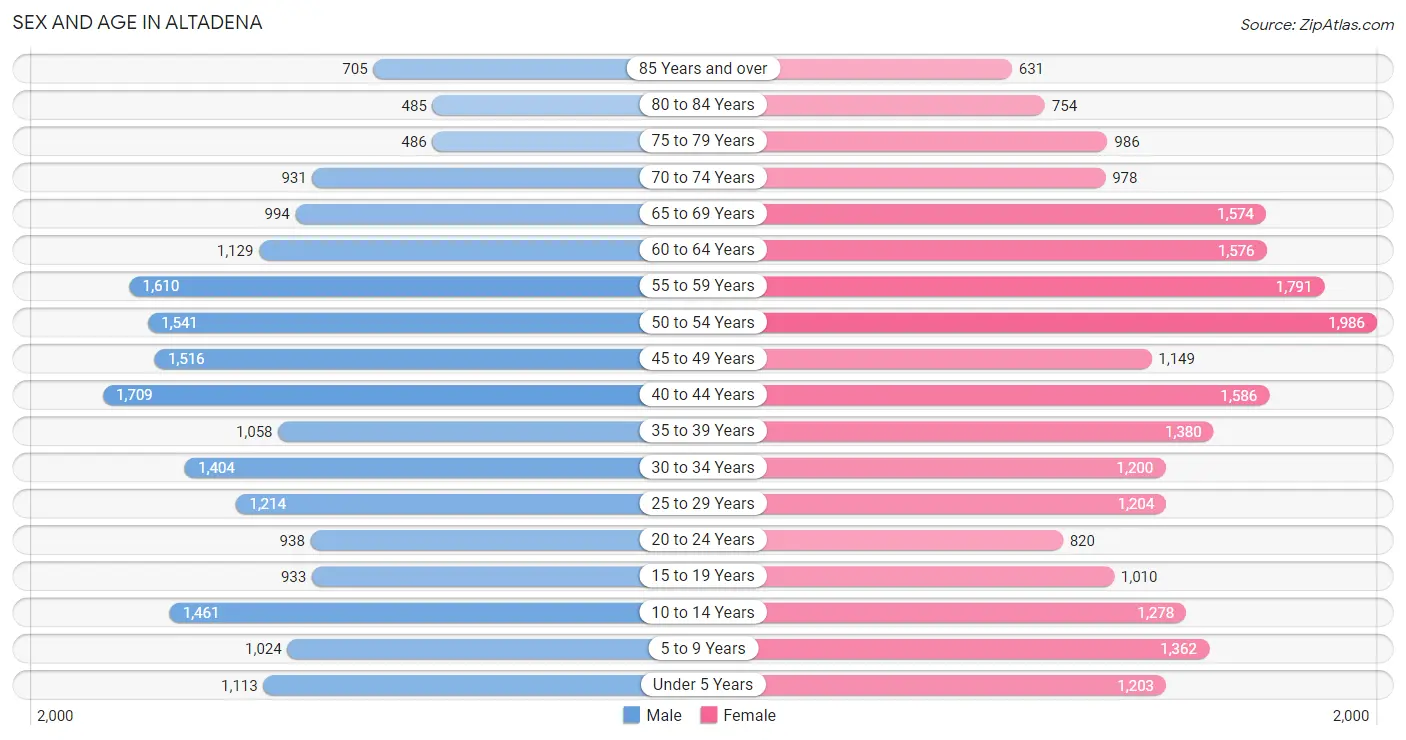
Sex and Age in Altadena
Sex and Age in Altadena
The most populous age groups in Altadena are 40 to 44 Years (1,709 | 8.4%) for men and 50 to 54 Years (1,986 | 8.8%) for women.
| Age Bracket | Male | Female |
| Under 5 Years | 1,113 (5.5%) | 1,203 (5.3%) |
| 5 to 9 Years | 1,024 (5.1%) | 1,362 (6.1%) |
| 10 to 14 Years | 1,461 (7.2%) | 1,278 (5.7%) |
| 15 to 19 Years | 933 (4.6%) | 1,010 (4.5%) |
| 20 to 24 Years | 938 (4.6%) | 820 (3.6%) |
| 25 to 29 Years | 1,214 (6.0%) | 1,204 (5.4%) |
| 30 to 34 Years | 1,404 (6.9%) | 1,200 (5.3%) |
| 35 to 39 Years | 1,058 (5.2%) | 1,380 (6.1%) |
| 40 to 44 Years | 1,709 (8.4%) | 1,586 (7.1%) |
| 45 to 49 Years | 1,516 (7.5%) | 1,149 (5.1%) |
| 50 to 54 Years | 1,541 (7.6%) | 1,986 (8.8%) |
| 55 to 59 Years | 1,610 (8.0%) | 1,791 (8.0%) |
| 60 to 64 Years | 1,129 (5.6%) | 1,576 (7.0%) |
| 65 to 69 Years | 994 (4.9%) | 1,574 (7.0%) |
| 70 to 74 Years | 931 (4.6%) | 978 (4.3%) |
| 75 to 79 Years | 486 (2.4%) | 986 (4.4%) |
| 80 to 84 Years | 485 (2.4%) | 754 (3.4%) |
| 85 Years and over | 705 (3.5%) | 631 (2.8%) |
| Total | 20,251 (100.0%) | 22,468 (100.0%) |
Families and Households in Altadena
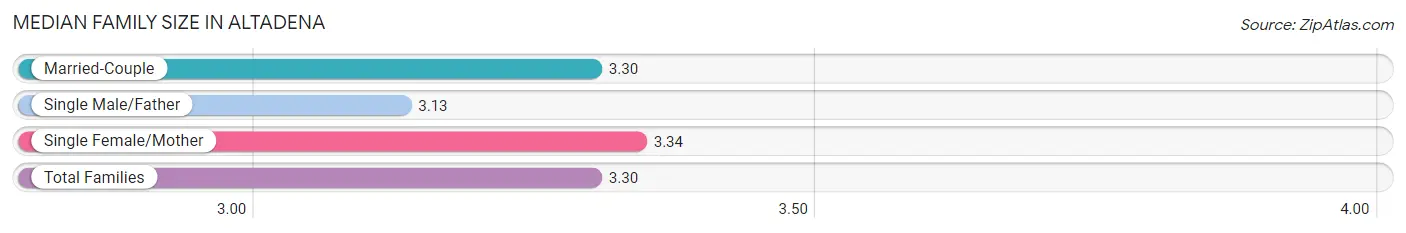
Median Family Size in Altadena
The median family size in Altadena is 3.30 persons per family, with single female/mother families (2,667 | 24.4%) accounting for the largest median family size of 3.34 persons per family. On the other hand, single male/father families (661 | 6.1%) represent the smallest median family size with 3.13 persons per family.
| Family Type | # Families | Family Size |
| Married-Couple | 7,586 (69.5%) | 3.30 |
| Single Male/Father | 661 (6.1%) | 3.13 |
| Single Female/Mother | 2,667 (24.4%) | 3.34 |
| Total Families | 10,914 (100.0%) | 3.30 |
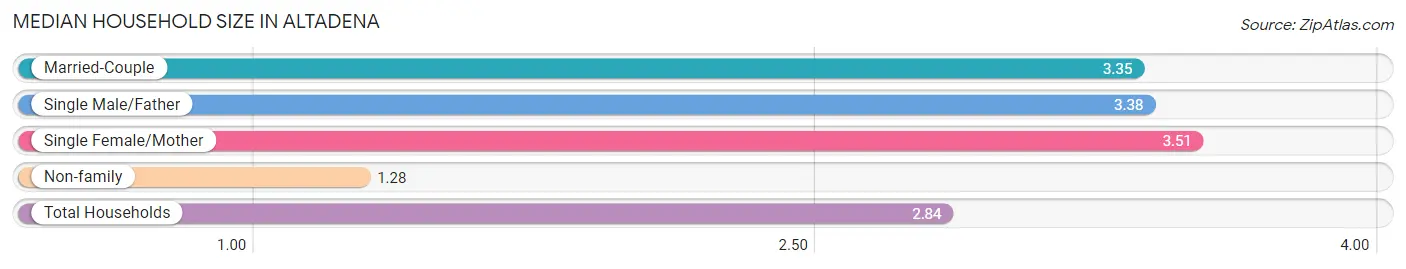
Median Household Size in Altadena
The median household size in Altadena is 2.84 persons per household, with single female/mother households (2,667 | 18.1%) accounting for the largest median household size of 3.51 persons per household. non-family households (3,854 | 26.1%) represent the smallest median household size with 1.28 persons per household.
| Household Type | # Households | Household Size |
| Married-Couple | 7,586 (51.4%) | 3.35 |
| Single Male/Father | 661 (4.5%) | 3.38 |
| Single Female/Mother | 2,667 (18.1%) | 3.51 |
| Non-family | 3,854 (26.1%) | 1.28 |
| Total Households | 14,768 (100.0%) | 2.84 |
Household Size by Marriage Status in Altadena
Out of a total of 14,768 households in Altadena, 10,914 (73.9%) are family households, while 3,854 (26.1%) are nonfamily households. The most numerous type of family households are 2-person households, comprising 4,297, and the most common type of nonfamily households are 1-person households, comprising 3,168.
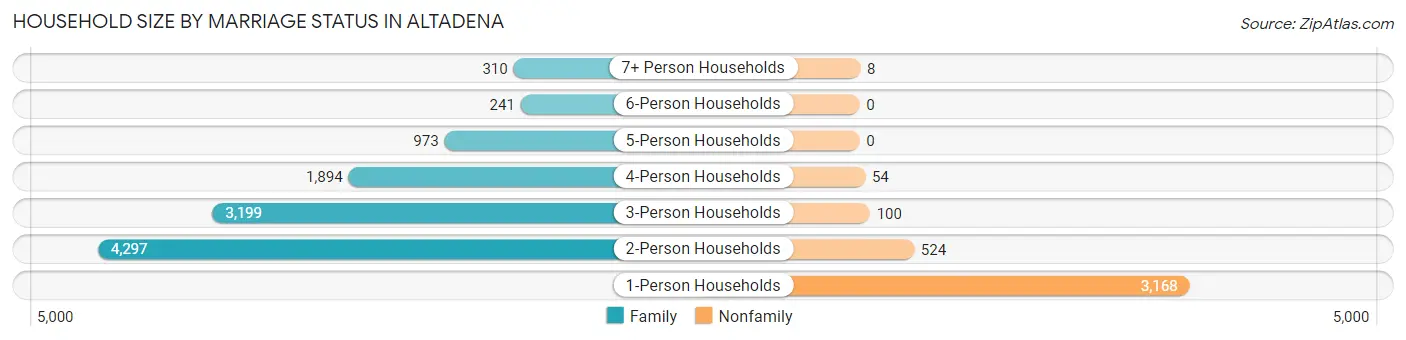
| Household Size | Family Households | Nonfamily Households |
| 1-Person Households | - | 3,168 (21.4%) |
| 2-Person Households | 4,297 (29.1%) | 524 (3.5%) |
| 3-Person Households | 3,199 (21.7%) | 100 (0.7%) |
| 4-Person Households | 1,894 (12.8%) | 54 (0.4%) |
| 5-Person Households | 973 (6.6%) | 0 (0.0%) |
| 6-Person Households | 241 (1.6%) | 0 (0.0%) |
| 7+ Person Households | 310 (2.1%) | 8 (0.1%) |
| Total | 10,914 (73.9%) | 3,854 (26.1%) |
Female Fertility in Altadena
Fertility by Age in Altadena
Average fertility rate in Altadena is 36.0 births per 1,000 women. Women in the age bracket of 20 to 34 years have the highest fertility rate with 43.0 births per 1,000 women. Women in the age bracket of 35 to 50 years acount for 55.2% of all women with births.
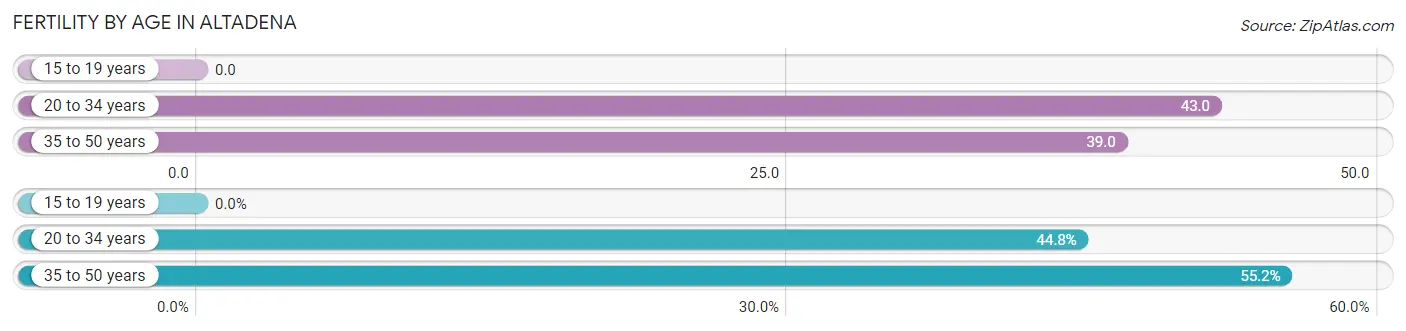
| Age Bracket | Women with Births | Births / 1,000 Women |
| 15 to 19 years | 0 (0.0%) | 0.0 |
| 20 to 34 years | 138 (44.8%) | 43.0 |
| 35 to 50 years | 170 (55.2%) | 39.0 |
| Total | 308 (100.0%) | 36.0 |
Fertility by Age by Marriage Status in Altadena
92.9% of women with births (308) in Altadena are married. The highest percentage of unmarried women with births falls into 20 to 34 years age bracket with 15.9% of them unmarried at the time of birth, while the lowest percentage of unmarried women with births belong to 35 to 50 years age bracket with 0.0% of them unmarried.
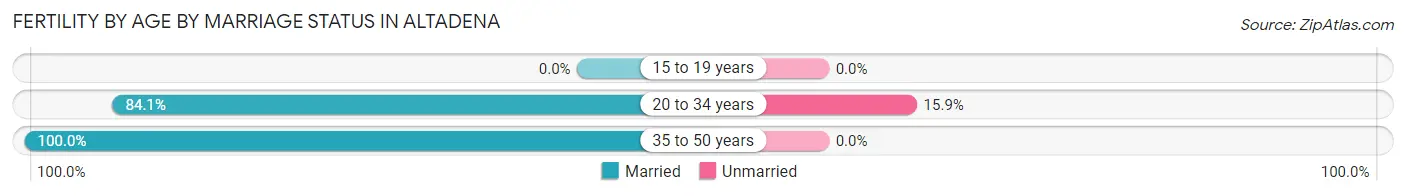
| Age Bracket | Married | Unmarried |
| 15 to 19 years | 0 (0.0%) | 0 (0.0%) |
| 20 to 34 years | 116 (84.1%) | 22 (15.9%) |
| 35 to 50 years | 170 (100.0%) | 0 (0.0%) |
| Total | 286 (92.9%) | 22 (7.1%) |
Fertility by Education in Altadena
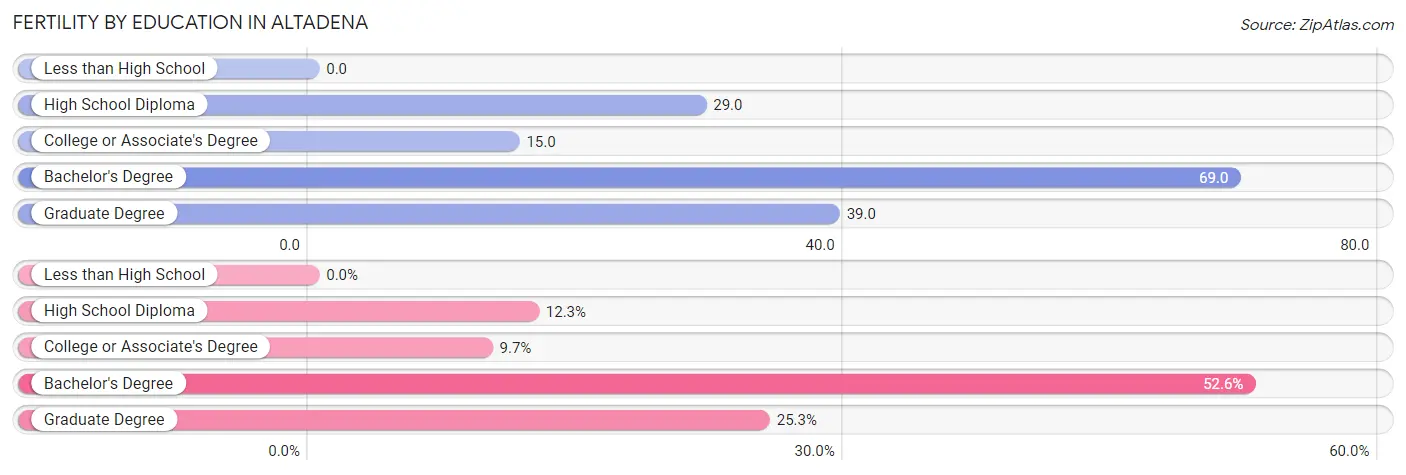
| Educational Attainment | Women with Births | Births / 1,000 Women |
| Less than High School | 0 (0.0%) | 0.0 |
| High School Diploma | 38 (12.3%) | 29.0 |
| College or Associate's Degree | 30 (9.7%) | 15.0 |
| Bachelor's Degree | 162 (52.6%) | 69.0 |
| Graduate Degree | 78 (25.3%) | 39.0 |
| Total | 308 (100.0%) | 36.0 |
Fertility by Education by Marriage Status in Altadena
7.1% of women with births in Altadena are unmarried. Women with the educational attainment of college or associate's degree are most likely to be married with 100.0% of them married at childbirth, while women with the educational attainment of high school diploma are least likely to be married with 57.9% of them unmarried at childbirth.
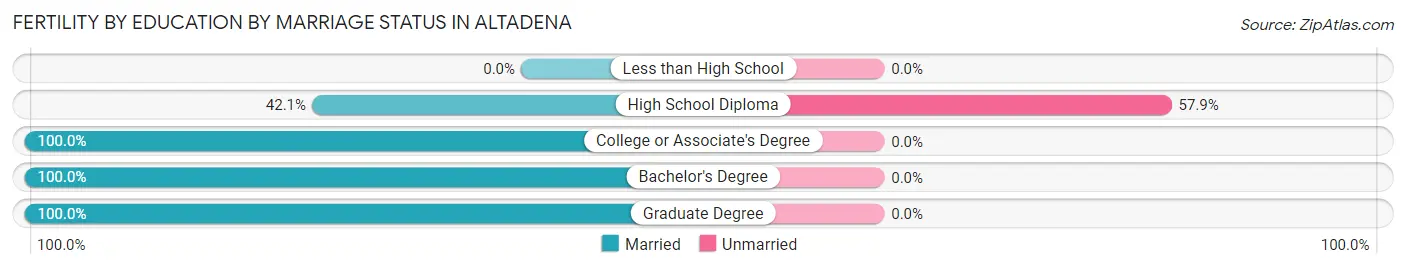
| Educational Attainment | Married | Unmarried |
| Less than High School | 0 (0.0%) | 0 (0.0%) |
| High School Diploma | 16 (42.1%) | 22 (57.9%) |
| College or Associate's Degree | 30 (100.0%) | 0 (0.0%) |
| Bachelor's Degree | 162 (100.0%) | 0 (0.0%) |
| Graduate Degree | 78 (100.0%) | 0 (0.0%) |
| Total | 286 (92.9%) | 22 (7.1%) |
Employment Characteristics in Altadena
Employment by Class of Employer in Altadena
Among the 20,624 employed individuals in Altadena, private company employees (9,883 | 47.9%), not-for-profit organizations (3,390 | 16.4%), and self-employed (not incorporated) (2,967 | 14.4%) make up the most common classes of employment.
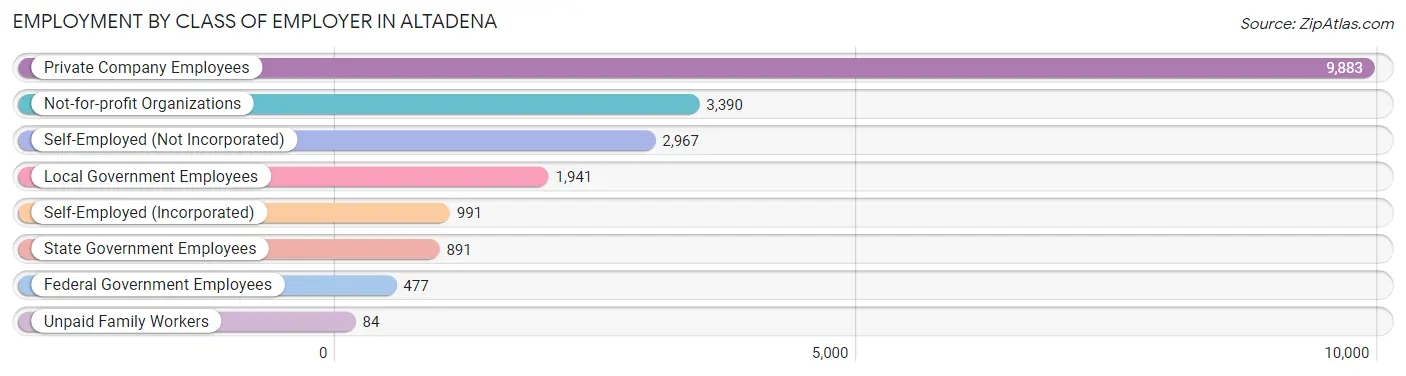
| Employer Class | # Employees | % Employees |
| Private Company Employees | 9,883 | 47.9% |
| Self-Employed (Incorporated) | 991 | 4.8% |
| Self-Employed (Not Incorporated) | 2,967 | 14.4% |
| Not-for-profit Organizations | 3,390 | 16.4% |
| Local Government Employees | 1,941 | 9.4% |
| State Government Employees | 891 | 4.3% |
| Federal Government Employees | 477 | 2.3% |
| Unpaid Family Workers | 84 | 0.4% |
| Total | 20,624 | 100.0% |
Employment Status by Age in Altadena
According to the labor force statistics for Altadena, out of the total population over 16 years of age (34,910), 64.6% or 22,552 individuals are in the labor force, with 6.7% or 1,511 of them unemployed. The age group with the highest labor force participation rate is 35 to 44 years, with 85.8% or 4,919 individuals in the labor force. Within the labor force, the 16 to 19 years age range has the highest percentage of unemployed individuals, with 29.1% or 105 of them being unemployed.
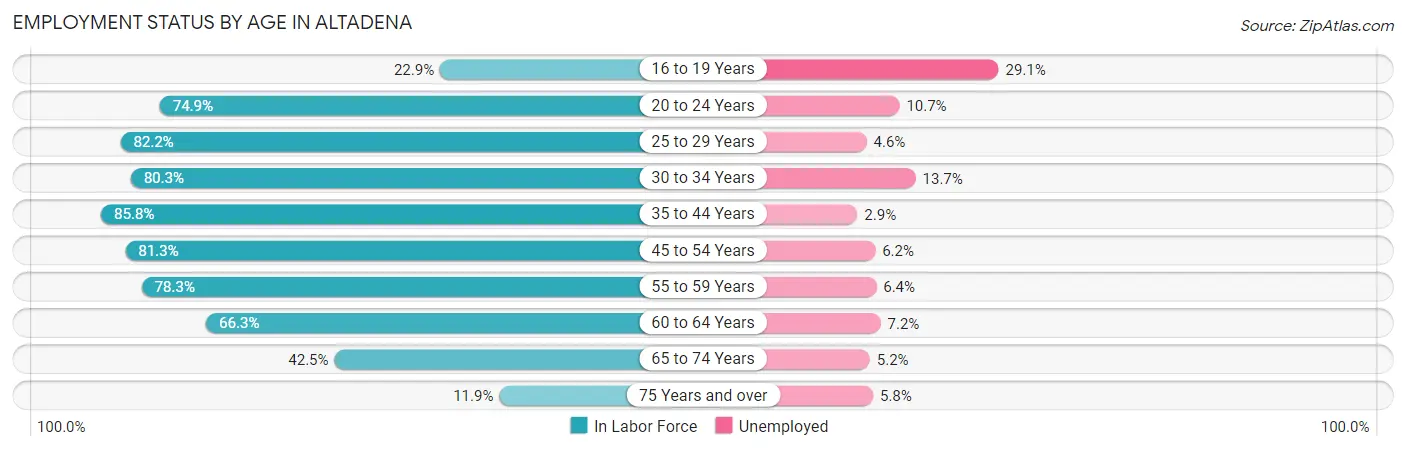
| Age Bracket | In Labor Force | Unemployed |
| 16 to 19 Years | 361 (22.9%) | 105 (29.1%) |
| 20 to 24 Years | 1,317 (74.9%) | 141 (10.7%) |
| 25 to 29 Years | 1,988 (82.2%) | 91 (4.6%) |
| 30 to 34 Years | 2,091 (80.3%) | 286 (13.7%) |
| 35 to 44 Years | 4,919 (85.8%) | 143 (2.9%) |
| 45 to 54 Years | 5,034 (81.3%) | 312 (6.2%) |
| 55 to 59 Years | 2,663 (78.3%) | 170 (6.4%) |
| 60 to 64 Years | 1,793 (66.3%) | 129 (7.2%) |
| 65 to 74 Years | 1,903 (42.5%) | 99 (5.2%) |
| 75 Years and over | 482 (11.9%) | 28 (5.8%) |
| Total | 22,552 (64.6%) | 1,511 (6.7%) |
Employment Status by Educational Attainment in Altadena
According to labor force statistics for Altadena, 80.2% of individuals (18,489) out of the total population between 25 and 64 years of age (23,053) are in the labor force, with 6.1% or 1,128 of them being unemployed. The group with the highest labor force participation rate are those with the educational attainment of bachelor's degree or higher, with 84.5% or 10,777 individuals in the labor force. Within the labor force, individuals with college / associate degree education have the highest percentage of unemployment, with 10.2% or 433 of them being unemployed.
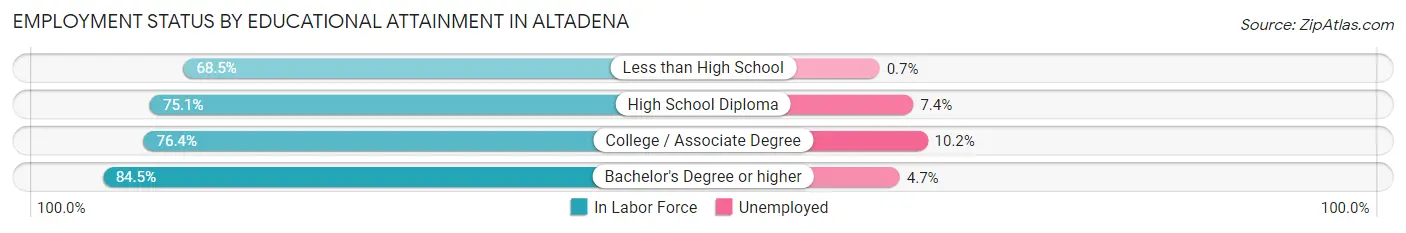
| Educational Attainment | In Labor Force | Unemployed |
| Less than High School | 997 (68.5%) | 10 (0.7%) |
| High School Diploma | 2,472 (75.1%) | 244 (7.4%) |
| College / Associate Degree | 4,242 (76.4%) | 566 (10.2%) |
| Bachelor's Degree or higher | 10,777 (84.5%) | 599 (4.7%) |
| Total | 18,489 (80.2%) | 1,406 (6.1%) |
Employment Occupations by Sex in Altadena
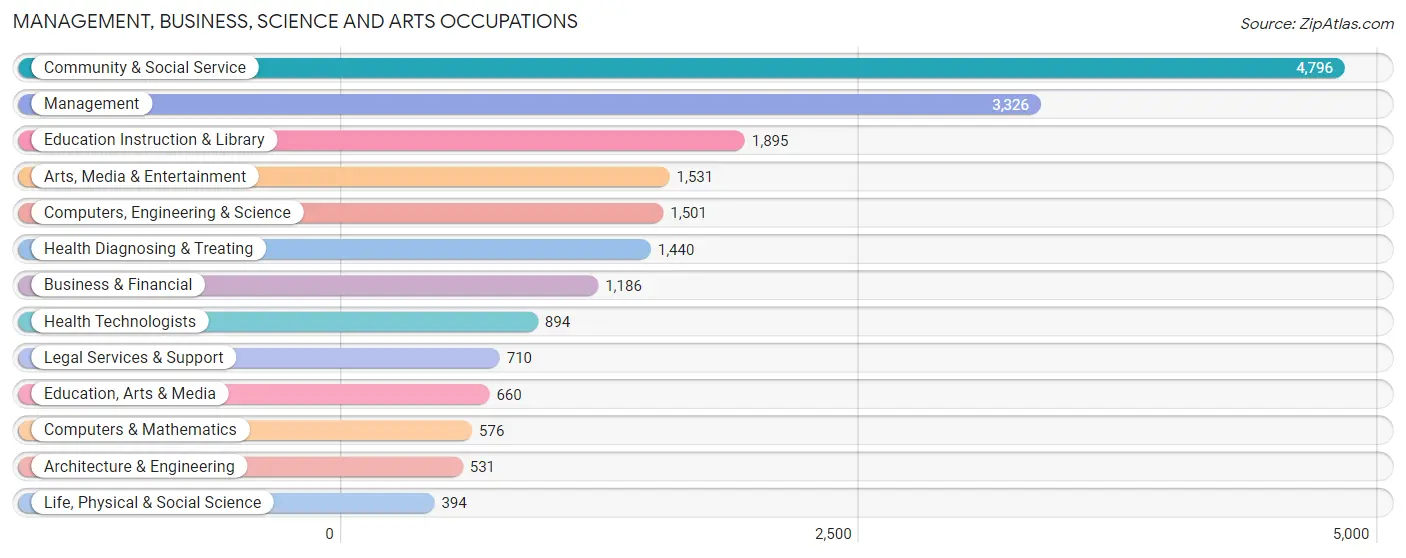
Management, Business, Science and Arts Occupations
The most common Management, Business, Science and Arts occupations in Altadena are Community & Social Service (4,796 | 22.8%), Management (3,326 | 15.8%), Education Instruction & Library (1,895 | 9.0%), Arts, Media & Entertainment (1,531 | 7.3%), and Computers, Engineering & Science (1,501 | 7.1%).
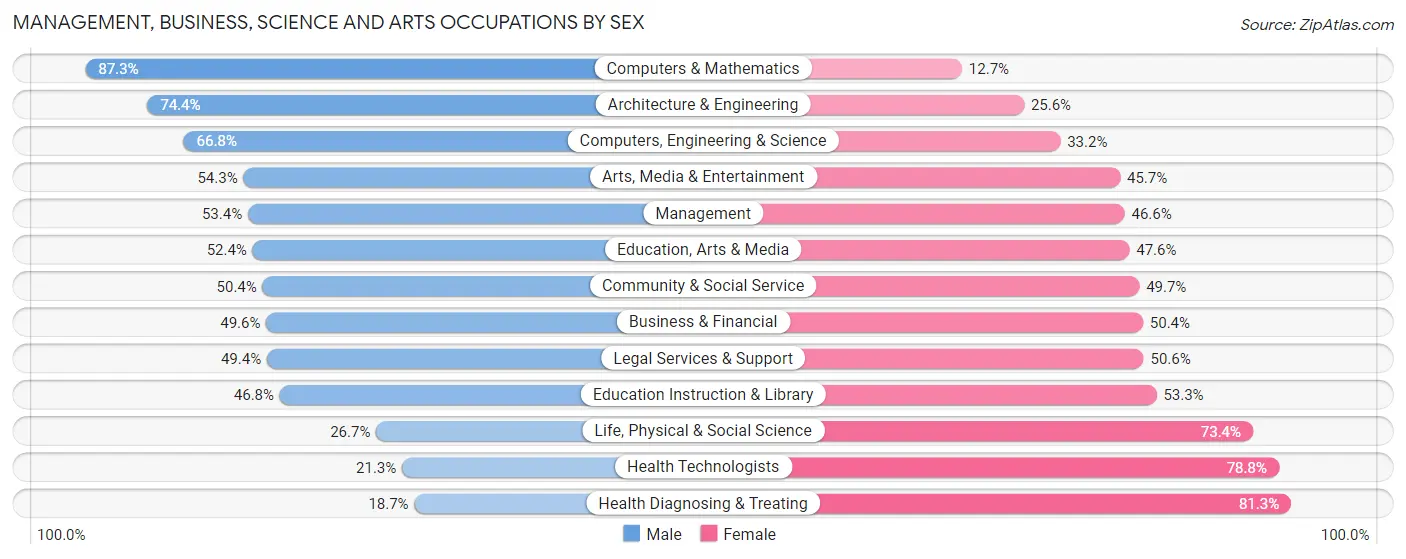
Management, Business, Science and Arts Occupations by Sex
Within the Management, Business, Science and Arts occupations in Altadena, the most male-oriented occupations are Computers & Mathematics (87.3%), Architecture & Engineering (74.4%), and Computers, Engineering & Science (66.8%), while the most female-oriented occupations are Health Diagnosing & Treating (81.3%), Health Technologists (78.7%), and Life, Physical & Social Science (73.4%).
| Occupation | Male | Female |
| Management | 1,776 (53.4%) | 1,550 (46.6%) |
| Business & Financial | 588 (49.6%) | 598 (50.4%) |
| Computers, Engineering & Science | 1,003 (66.8%) | 498 (33.2%) |
| Computers & Mathematics | 503 (87.3%) | 73 (12.7%) |
| Architecture & Engineering | 395 (74.4%) | 136 (25.6%) |
| Life, Physical & Social Science | 105 (26.7%) | 289 (73.4%) |
| Community & Social Service | 2,415 (50.3%) | 2,381 (49.6%) |
| Education, Arts & Media | 346 (52.4%) | 314 (47.6%) |
| Legal Services & Support | 351 (49.4%) | 359 (50.6%) |
| Education Instruction & Library | 886 (46.8%) | 1,009 (53.2%) |
| Arts, Media & Entertainment | 832 (54.3%) | 699 (45.7%) |
| Health Diagnosing & Treating | 269 (18.7%) | 1,171 (81.3%) |
| Health Technologists | 190 (21.2%) | 704 (78.7%) |
| Total (Category) | 6,051 (49.4%) | 6,198 (50.6%) |
| Total (Overall) | 10,491 (49.9%) | 10,516 (50.1%) |
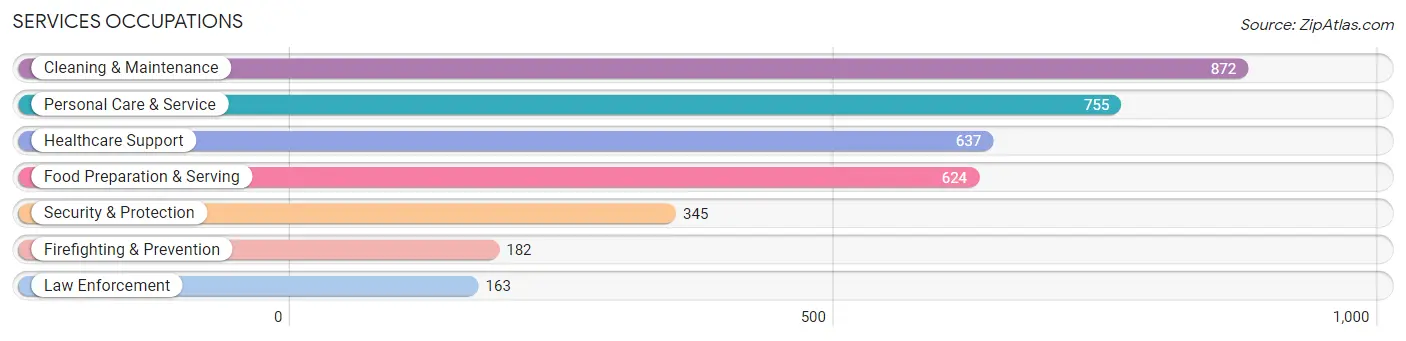
Services Occupations
The most common Services occupations in Altadena are Cleaning & Maintenance (872 | 4.2%), Personal Care & Service (755 | 3.6%), Healthcare Support (637 | 3.0%), Food Preparation & Serving (624 | 3.0%), and Security & Protection (345 | 1.6%).
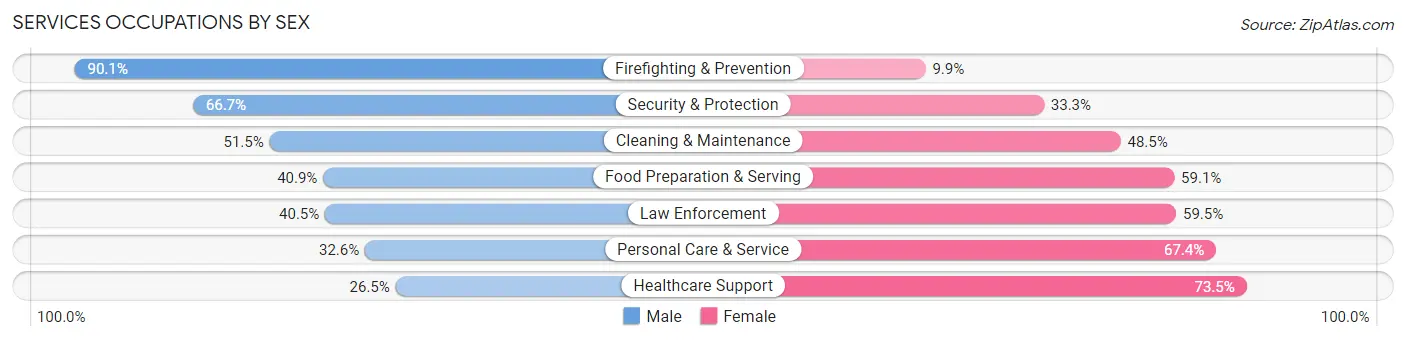
Services Occupations by Sex
Within the Services occupations in Altadena, the most male-oriented occupations are Firefighting & Prevention (90.1%), Security & Protection (66.7%), and Cleaning & Maintenance (51.5%), while the most female-oriented occupations are Healthcare Support (73.5%), Personal Care & Service (67.4%), and Law Enforcement (59.5%).
| Occupation | Male | Female |
| Healthcare Support | 169 (26.5%) | 468 (73.5%) |
| Security & Protection | 230 (66.7%) | 115 (33.3%) |
| Firefighting & Prevention | 164 (90.1%) | 18 (9.9%) |
| Law Enforcement | 66 (40.5%) | 97 (59.5%) |
| Food Preparation & Serving | 255 (40.9%) | 369 (59.1%) |
| Cleaning & Maintenance | 449 (51.5%) | 423 (48.5%) |
| Personal Care & Service | 246 (32.6%) | 509 (67.4%) |
| Total (Category) | 1,349 (41.7%) | 1,884 (58.3%) |
| Total (Overall) | 10,491 (49.9%) | 10,516 (50.1%) |
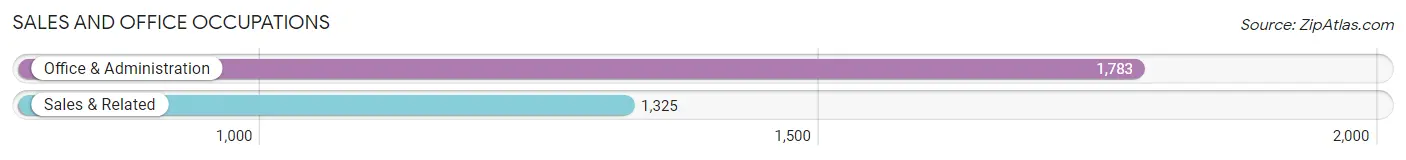
Sales and Office Occupations
The most common Sales and Office occupations in Altadena are Office & Administration (1,783 | 8.5%), and Sales & Related (1,325 | 6.3%).
Sales and Office Occupations by Sex

| Occupation | Male | Female |
| Sales & Related | 577 (43.5%) | 748 (56.5%) |
| Office & Administration | 343 (19.2%) | 1,440 (80.8%) |
| Total (Category) | 920 (29.6%) | 2,188 (70.4%) |
| Total (Overall) | 10,491 (49.9%) | 10,516 (50.1%) |
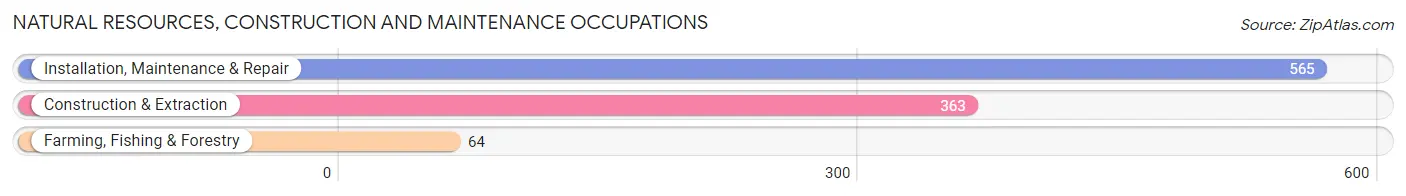
Natural Resources, Construction and Maintenance Occupations
The most common Natural Resources, Construction and Maintenance occupations in Altadena are Installation, Maintenance & Repair (565 | 2.7%), Construction & Extraction (363 | 1.7%), and Farming, Fishing & Forestry (64 | 0.3%).
Natural Resources, Construction and Maintenance Occupations by Sex
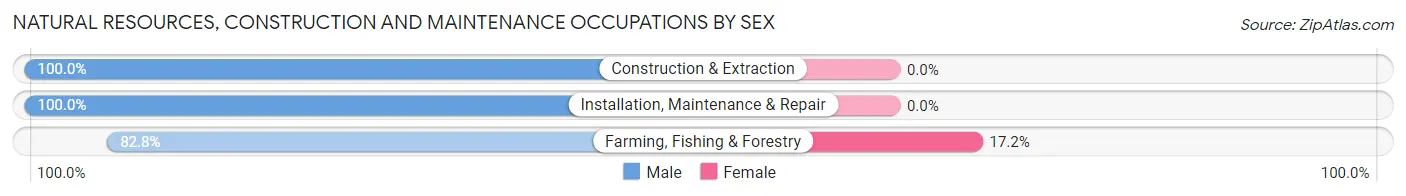
| Occupation | Male | Female |
| Farming, Fishing & Forestry | 53 (82.8%) | 11 (17.2%) |
| Construction & Extraction | 363 (100.0%) | 0 (0.0%) |
| Installation, Maintenance & Repair | 565 (100.0%) | 0 (0.0%) |
| Total (Category) | 981 (98.9%) | 11 (1.1%) |
| Total (Overall) | 10,491 (49.9%) | 10,516 (50.1%) |
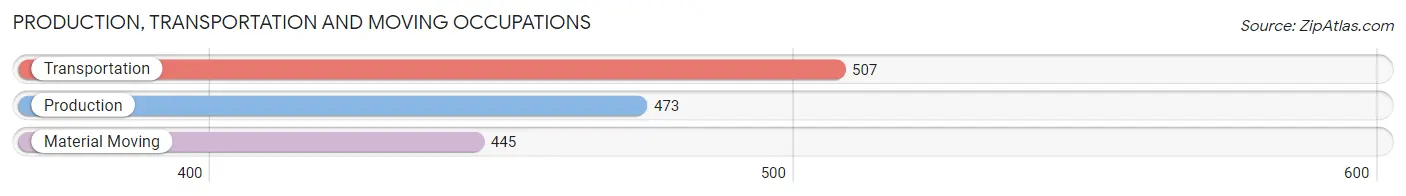
Production, Transportation and Moving Occupations
The most common Production, Transportation and Moving occupations in Altadena are Transportation (507 | 2.4%), Production (473 | 2.2%), and Material Moving (445 | 2.1%).
Production, Transportation and Moving Occupations by Sex
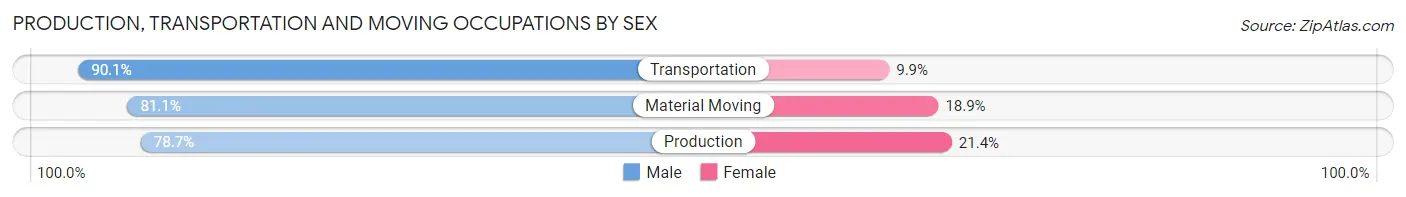
| Occupation | Male | Female |
| Production | 372 (78.6%) | 101 (21.3%) |
| Transportation | 457 (90.1%) | 50 (9.9%) |
| Material Moving | 361 (81.1%) | 84 (18.9%) |
| Total (Category) | 1,190 (83.5%) | 235 (16.5%) |
| Total (Overall) | 10,491 (49.9%) | 10,516 (50.1%) |
Employment Industries by Sex in Altadena
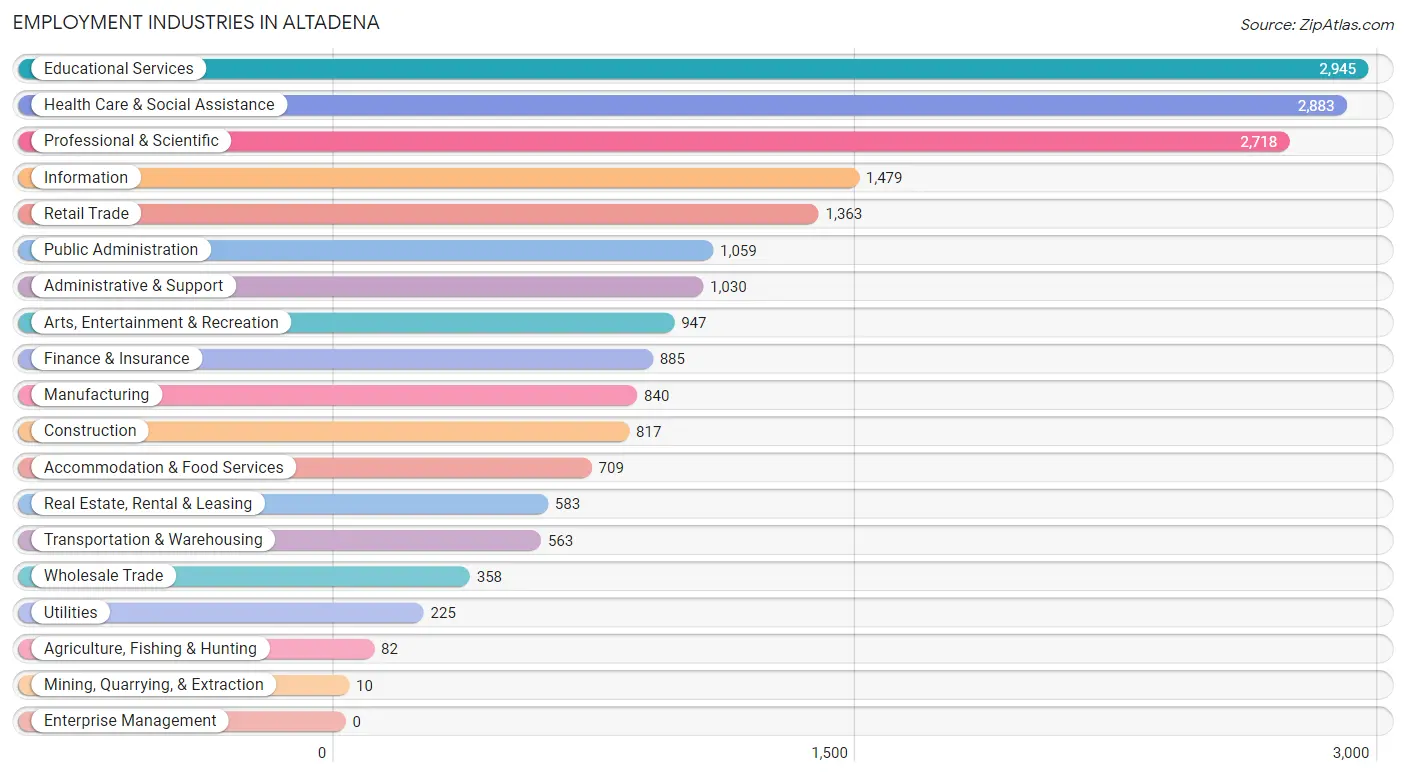
Employment Industries in Altadena
The major employment industries in Altadena include Educational Services (2,945 | 14.0%), Health Care & Social Assistance (2,883 | 13.7%), Professional & Scientific (2,718 | 12.9%), Information (1,479 | 7.0%), and Retail Trade (1,363 | 6.5%).
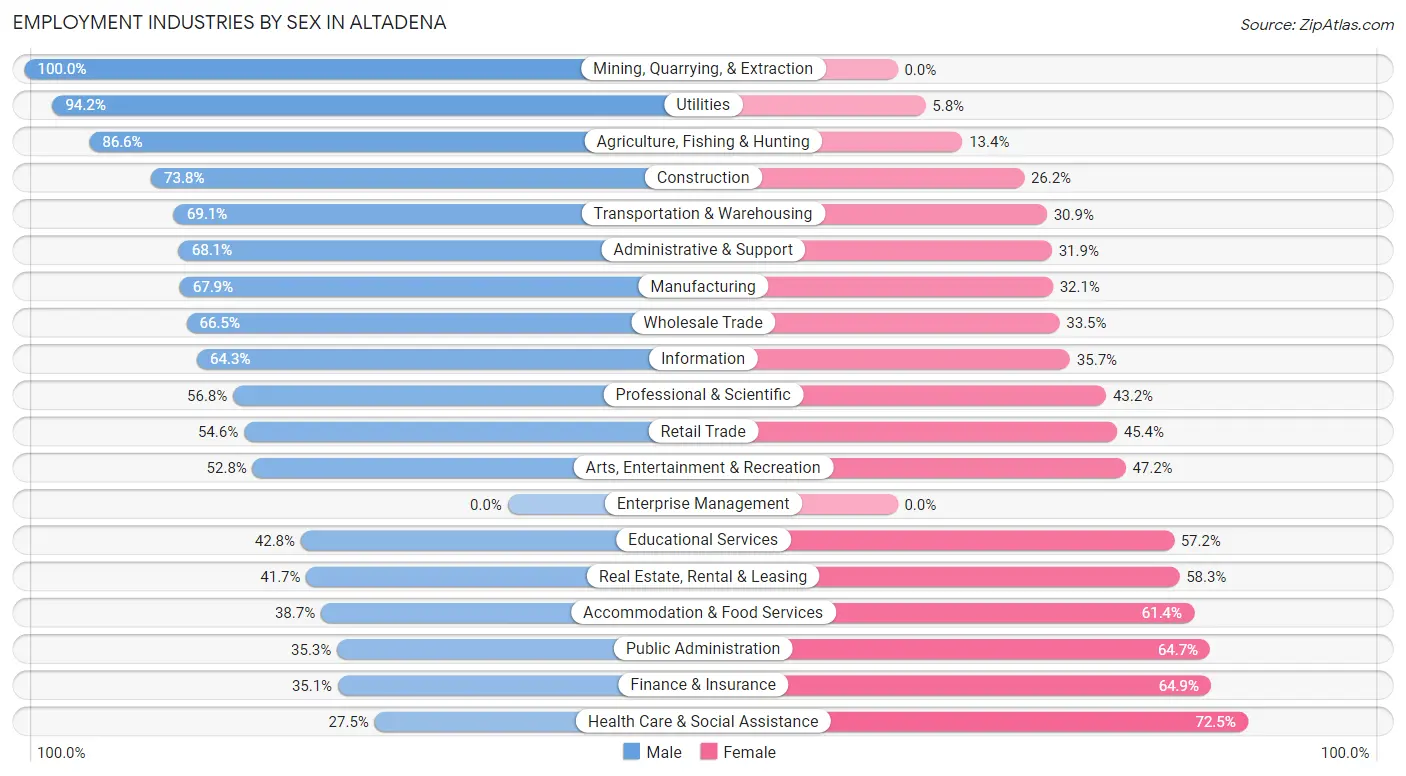
Employment Industries by Sex in Altadena
The Altadena industries that see more men than women are Mining, Quarrying, & Extraction (100.0%), Utilities (94.2%), and Agriculture, Fishing & Hunting (86.6%), whereas the industries that tend to have a higher number of women are Health Care & Social Assistance (72.5%), Finance & Insurance (64.9%), and Public Administration (64.7%).
| Industry | Male | Female |
| Agriculture, Fishing & Hunting | 71 (86.6%) | 11 (13.4%) |
| Mining, Quarrying, & Extraction | 10 (100.0%) | 0 (0.0%) |
| Construction | 603 (73.8%) | 214 (26.2%) |
| Manufacturing | 570 (67.9%) | 270 (32.1%) |
| Wholesale Trade | 238 (66.5%) | 120 (33.5%) |
| Retail Trade | 744 (54.6%) | 619 (45.4%) |
| Transportation & Warehousing | 389 (69.1%) | 174 (30.9%) |
| Utilities | 212 (94.2%) | 13 (5.8%) |
| Information | 951 (64.3%) | 528 (35.7%) |
| Finance & Insurance | 311 (35.1%) | 574 (64.9%) |
| Real Estate, Rental & Leasing | 243 (41.7%) | 340 (58.3%) |
| Professional & Scientific | 1,545 (56.8%) | 1,173 (43.2%) |
| Enterprise Management | 0 (0.0%) | 0 (0.0%) |
| Administrative & Support | 701 (68.1%) | 329 (31.9%) |
| Educational Services | 1,261 (42.8%) | 1,684 (57.2%) |
| Health Care & Social Assistance | 794 (27.5%) | 2,089 (72.5%) |
| Arts, Entertainment & Recreation | 500 (52.8%) | 447 (47.2%) |
| Accommodation & Food Services | 274 (38.7%) | 435 (61.4%) |
| Public Administration | 374 (35.3%) | 685 (64.7%) |
| Total | 10,491 (49.9%) | 10,516 (50.1%) |
Education in Altadena
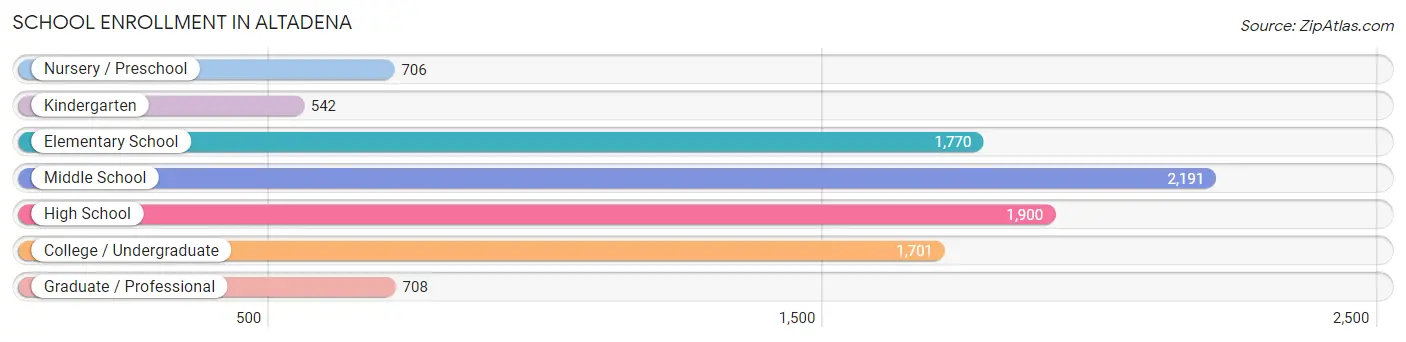
School Enrollment in Altadena
The most common levels of schooling among the 9,518 students in Altadena are middle school (2,191 | 23.0%), high school (1,900 | 20.0%), and elementary school (1,770 | 18.6%).
| School Level | # Students | % Students |
| Nursery / Preschool | 706 | 7.4% |
| Kindergarten | 542 | 5.7% |
| Elementary School | 1,770 | 18.6% |
| Middle School | 2,191 | 23.0% |
| High School | 1,900 | 20.0% |
| College / Undergraduate | 1,701 | 17.9% |
| Graduate / Professional | 708 | 7.4% |
| Total | 9,518 | 100.0% |
School Enrollment by Age by Funding Source in Altadena
Out of a total of 9,518 students who are enrolled in schools in Altadena, 2,789 (29.3%) attend a private institution, while the remaining 6,729 (70.7%) are enrolled in public schools. The age group of 3 to 4 year olds has the highest likelihood of being enrolled in private schools, with 362 (63.1% in the age bracket) enrolled. Conversely, the age group of 20 to 24 year olds has the lowest likelihood of being enrolled in a private school, with 648 (87.6% in the age bracket) attending a public institution.
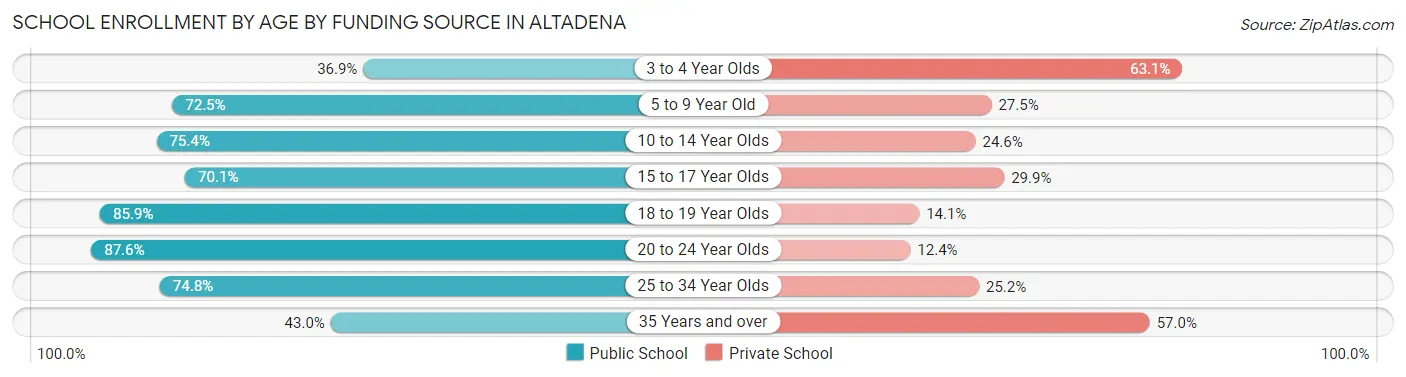
| Age Bracket | Public School | Private School |
| 3 to 4 Year Olds | 212 (36.9%) | 362 (63.1%) |
| 5 to 9 Year Old | 1,669 (72.5%) | 634 (27.5%) |
| 10 to 14 Year Olds | 2,066 (75.4%) | 673 (24.6%) |
| 15 to 17 Year Olds | 881 (70.1%) | 376 (29.9%) |
| 18 to 19 Year Olds | 501 (85.9%) | 82 (14.1%) |
| 20 to 24 Year Olds | 648 (87.6%) | 92 (12.4%) |
| 25 to 34 Year Olds | 439 (74.8%) | 148 (25.2%) |
| 35 Years and over | 316 (43.0%) | 419 (57.0%) |
| Total | 6,729 (70.7%) | 2,789 (29.3%) |
Educational Attainment by Field of Study in Altadena
Business (2,210 | 12.3%), social sciences (2,051 | 11.5%), visual & performing arts (2,021 | 11.3%), communications (1,303 | 7.3%), and science & technology (1,213 | 6.8%) are the most common fields of study among 17,896 individuals in Altadena who have obtained a bachelor's degree or higher.
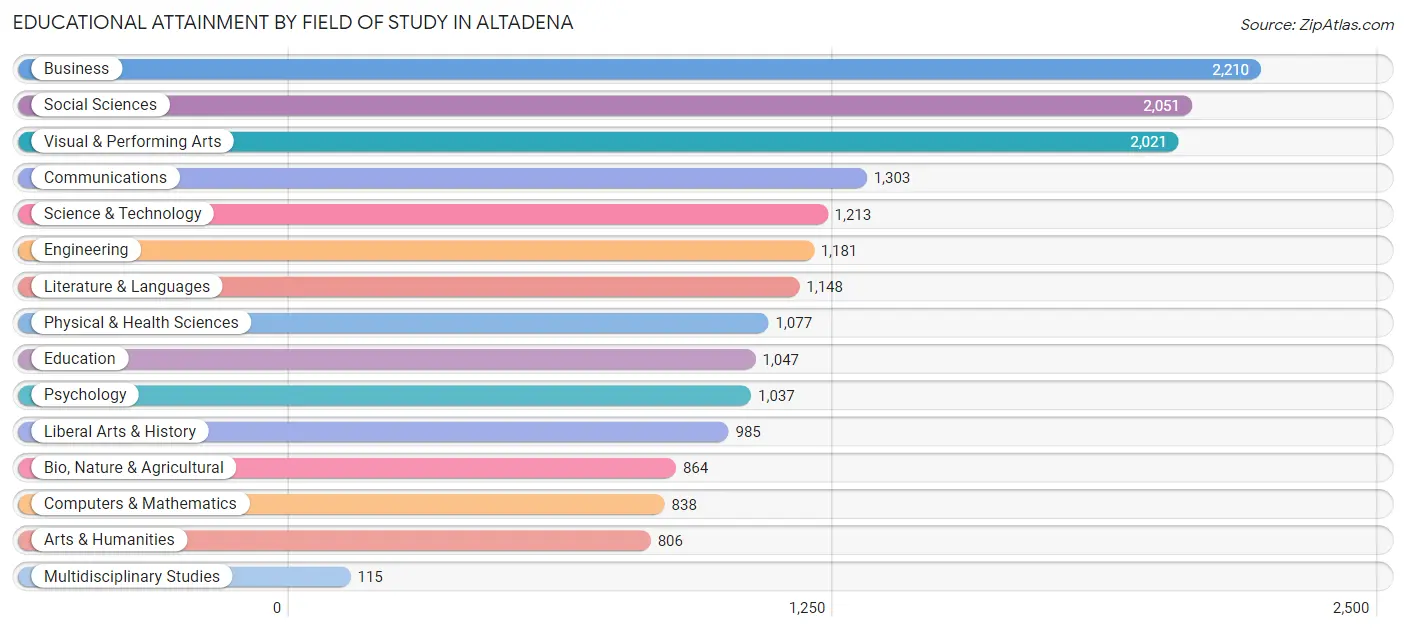
| Field of Study | # Graduates | % Graduates |
| Computers & Mathematics | 838 | 4.7% |
| Bio, Nature & Agricultural | 864 | 4.8% |
| Physical & Health Sciences | 1,077 | 6.0% |
| Psychology | 1,037 | 5.8% |
| Social Sciences | 2,051 | 11.5% |
| Engineering | 1,181 | 6.6% |
| Multidisciplinary Studies | 115 | 0.6% |
| Science & Technology | 1,213 | 6.8% |
| Business | 2,210 | 12.3% |
| Education | 1,047 | 5.9% |
| Literature & Languages | 1,148 | 6.4% |
| Liberal Arts & History | 985 | 5.5% |
| Visual & Performing Arts | 2,021 | 11.3% |
| Communications | 1,303 | 7.3% |
| Arts & Humanities | 806 | 4.5% |
| Total | 17,896 | 100.0% |
Transportation & Commute in Altadena
Vehicle Availability by Sex in Altadena
The most prevalent vehicle ownership categories in Altadena are males with 2 vehicles (4,554, accounting for 44.1%) and females with 2 vehicles (4,169, making up 44.4%).
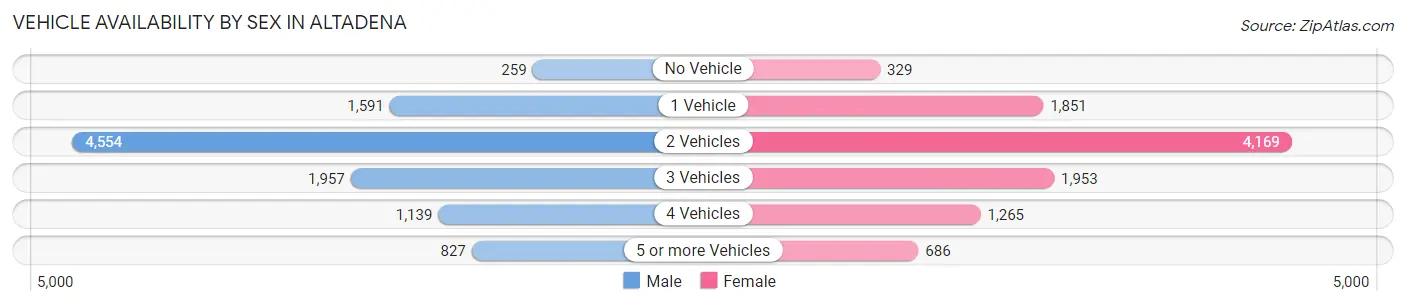
| Vehicles Available | Male | Female |
| No Vehicle | 259 (2.5%) | 329 (3.2%) |
| 1 Vehicle | 1,591 (15.4%) | 1,851 (18.0%) |
| 2 Vehicles | 4,554 (44.1%) | 4,169 (40.7%) |
| 3 Vehicles | 1,957 (19.0%) | 1,953 (19.1%) |
| 4 Vehicles | 1,139 (11.0%) | 1,265 (12.3%) |
| 5 or more Vehicles | 827 (8.0%) | 686 (6.7%) |
| Total | 10,327 (100.0%) | 10,253 (100.0%) |
Commute Time in Altadena
The most frequently occuring commute durations in Altadena are 15 to 19 minutes (2,681 commuters, 16.3%), 20 to 24 minutes (2,428 commuters, 14.8%), and 10 to 14 minutes (2,313 commuters, 14.1%).
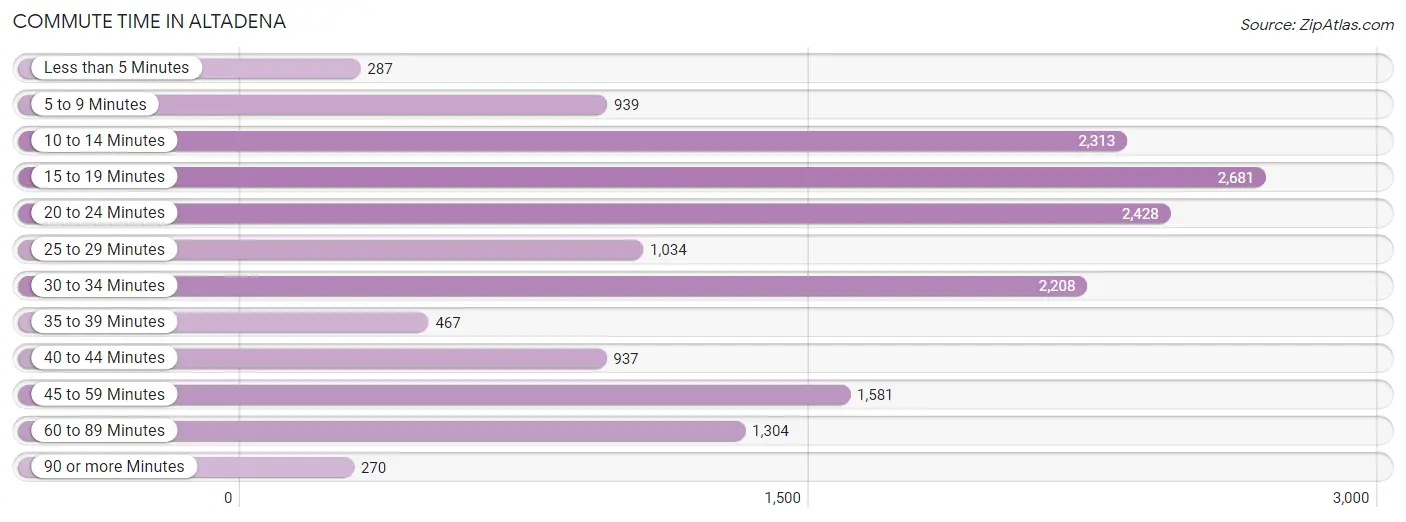
| Commute Time | # Commuters | % Commuters |
| Less than 5 Minutes | 287 | 1.7% |
| 5 to 9 Minutes | 939 | 5.7% |
| 10 to 14 Minutes | 2,313 | 14.1% |
| 15 to 19 Minutes | 2,681 | 16.3% |
| 20 to 24 Minutes | 2,428 | 14.8% |
| 25 to 29 Minutes | 1,034 | 6.3% |
| 30 to 34 Minutes | 2,208 | 13.4% |
| 35 to 39 Minutes | 467 | 2.8% |
| 40 to 44 Minutes | 937 | 5.7% |
| 45 to 59 Minutes | 1,581 | 9.6% |
| 60 to 89 Minutes | 1,304 | 7.9% |
| 90 or more Minutes | 270 | 1.6% |
Commute Time by Sex in Altadena
The most common commute times in Altadena are 15 to 19 minutes (1,325 commuters, 16.0%) for males and 15 to 19 minutes (1,356 commuters, 16.6%) for females.
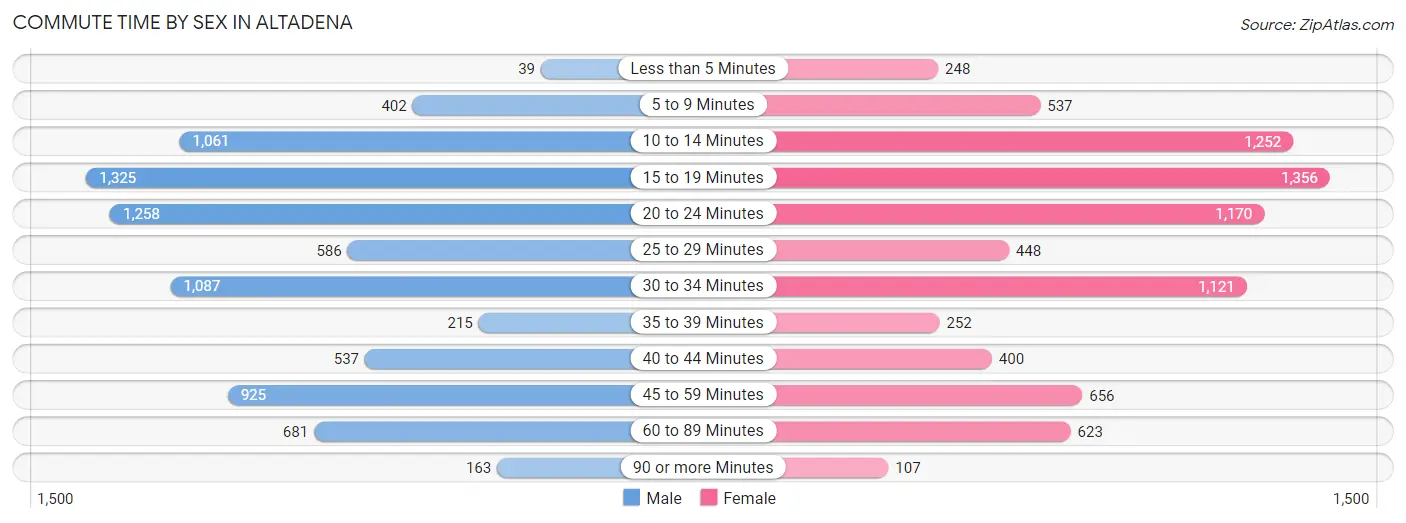
| Commute Time | Male | Female |
| Less than 5 Minutes | 39 (0.5%) | 248 (3.0%) |
| 5 to 9 Minutes | 402 (4.9%) | 537 (6.6%) |
| 10 to 14 Minutes | 1,061 (12.8%) | 1,252 (15.3%) |
| 15 to 19 Minutes | 1,325 (16.0%) | 1,356 (16.6%) |
| 20 to 24 Minutes | 1,258 (15.2%) | 1,170 (14.3%) |
| 25 to 29 Minutes | 586 (7.1%) | 448 (5.5%) |
| 30 to 34 Minutes | 1,087 (13.1%) | 1,121 (13.7%) |
| 35 to 39 Minutes | 215 (2.6%) | 252 (3.1%) |
| 40 to 44 Minutes | 537 (6.5%) | 400 (4.9%) |
| 45 to 59 Minutes | 925 (11.2%) | 656 (8.0%) |
| 60 to 89 Minutes | 681 (8.2%) | 623 (7.6%) |
| 90 or more Minutes | 163 (2.0%) | 107 (1.3%) |
Time of Departure to Work by Sex in Altadena
The most frequent times of departure to work in Altadena are 8:00 AM to 8:29 AM (1,668, 20.2%) for males and 8:00 AM to 8:29 AM (1,487, 18.2%) for females.
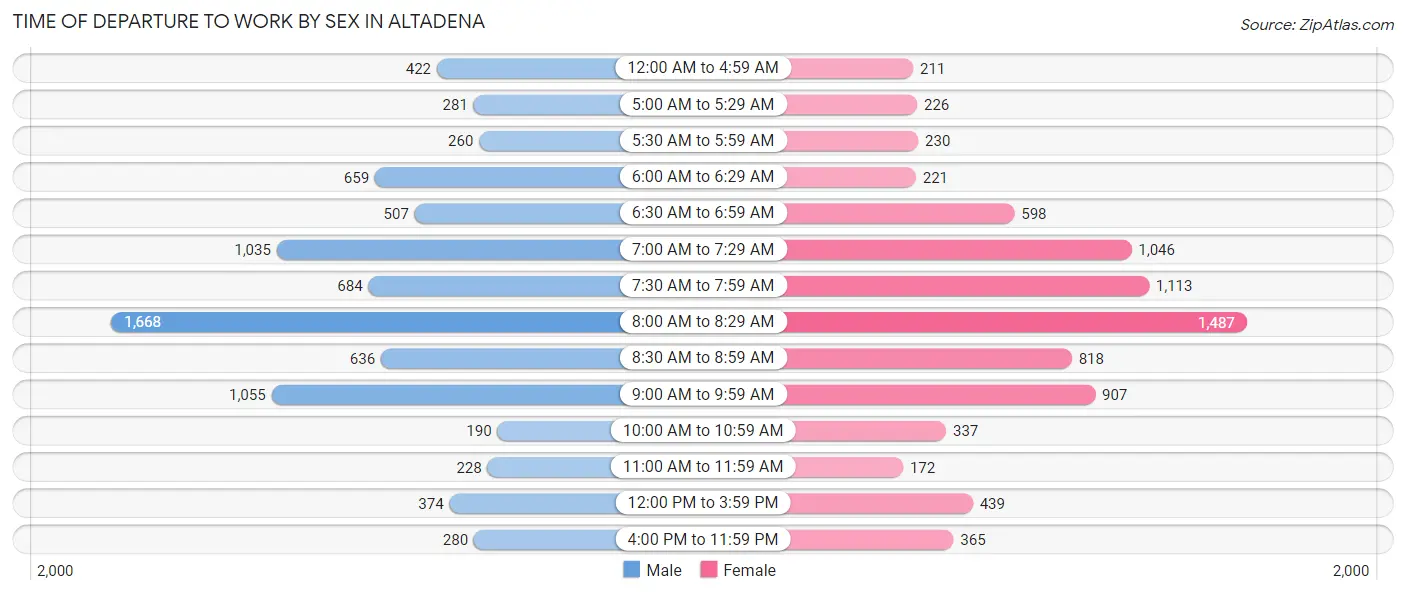
| Time of Departure | Male | Female |
| 12:00 AM to 4:59 AM | 422 (5.1%) | 211 (2.6%) |
| 5:00 AM to 5:29 AM | 281 (3.4%) | 226 (2.8%) |
| 5:30 AM to 5:59 AM | 260 (3.1%) | 230 (2.8%) |
| 6:00 AM to 6:29 AM | 659 (8.0%) | 221 (2.7%) |
| 6:30 AM to 6:59 AM | 507 (6.1%) | 598 (7.3%) |
| 7:00 AM to 7:29 AM | 1,035 (12.5%) | 1,046 (12.8%) |
| 7:30 AM to 7:59 AM | 684 (8.3%) | 1,113 (13.6%) |
| 8:00 AM to 8:29 AM | 1,668 (20.2%) | 1,487 (18.2%) |
| 8:30 AM to 8:59 AM | 636 (7.7%) | 818 (10.0%) |
| 9:00 AM to 9:59 AM | 1,055 (12.7%) | 907 (11.1%) |
| 10:00 AM to 10:59 AM | 190 (2.3%) | 337 (4.1%) |
| 11:00 AM to 11:59 AM | 228 (2.8%) | 172 (2.1%) |
| 12:00 PM to 3:59 PM | 374 (4.5%) | 439 (5.4%) |
| 4:00 PM to 11:59 PM | 280 (3.4%) | 365 (4.5%) |
| Total | 8,279 (100.0%) | 8,170 (100.0%) |
Housing Occupancy in Altadena
Occupancy by Ownership in Altadena
Of the total 14,768 dwellings in Altadena, owner-occupied units account for 11,176 (75.7%), while renter-occupied units make up 3,592 (24.3%).
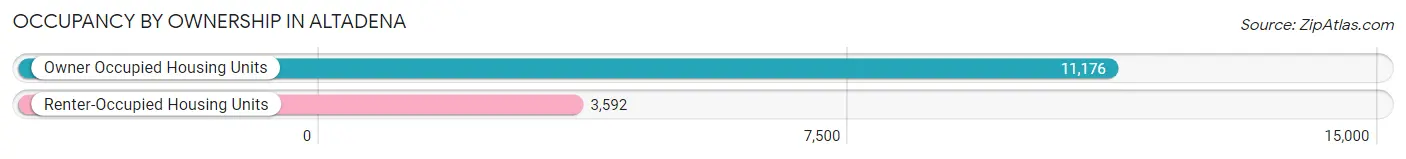
| Occupancy | # Housing Units | % Housing Units |
| Owner Occupied Housing Units | 11,176 | 75.7% |
| Renter-Occupied Housing Units | 3,592 | 24.3% |
| Total Occupied Housing Units | 14,768 | 100.0% |
Occupancy by Household Size in Altadena
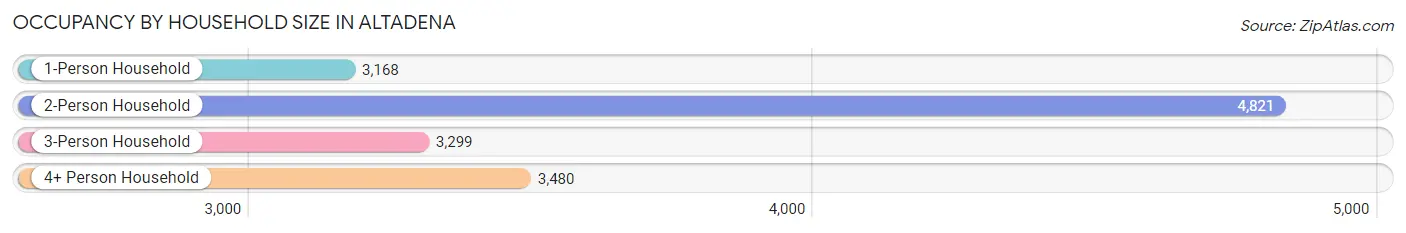
| Household Size | # Housing Units | % Housing Units |
| 1-Person Household | 3,168 | 21.4% |
| 2-Person Household | 4,821 | 32.6% |
| 3-Person Household | 3,299 | 22.3% |
| 4+ Person Household | 3,480 | 23.6% |
| Total Housing Units | 14,768 | 100.0% |
Occupancy by Ownership by Household Size in Altadena
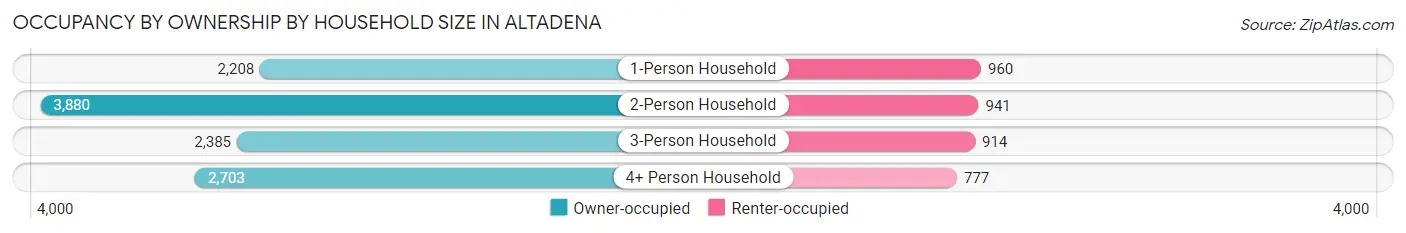
| Household Size | Owner-occupied | Renter-occupied |
| 1-Person Household | 2,208 (69.7%) | 960 (30.3%) |
| 2-Person Household | 3,880 (80.5%) | 941 (19.5%) |
| 3-Person Household | 2,385 (72.3%) | 914 (27.7%) |
| 4+ Person Household | 2,703 (77.7%) | 777 (22.3%) |
| Total Housing Units | 11,176 (75.7%) | 3,592 (24.3%) |
Occupancy by Educational Attainment in Altadena
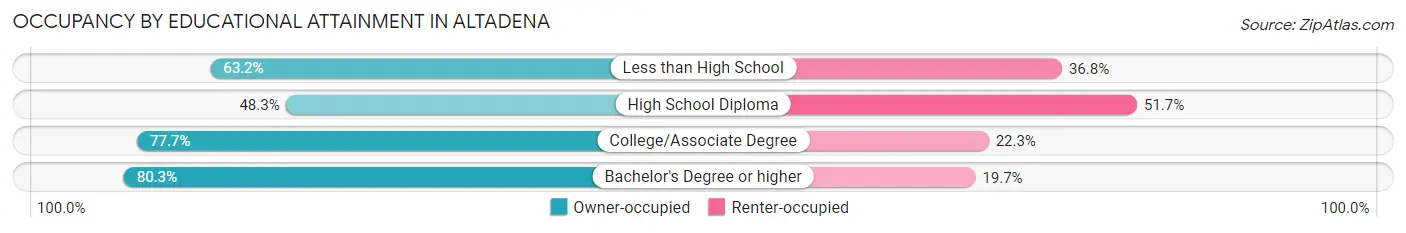
| Household Size | Owner-occupied | Renter-occupied |
| Less than High School | 547 (63.2%) | 319 (36.8%) |
| High School Diploma | 674 (48.3%) | 722 (51.7%) |
| College/Associate Degree | 2,668 (77.7%) | 766 (22.3%) |
| Bachelor's Degree or higher | 7,287 (80.3%) | 1,785 (19.7%) |
Occupancy by Age of Householder in Altadena
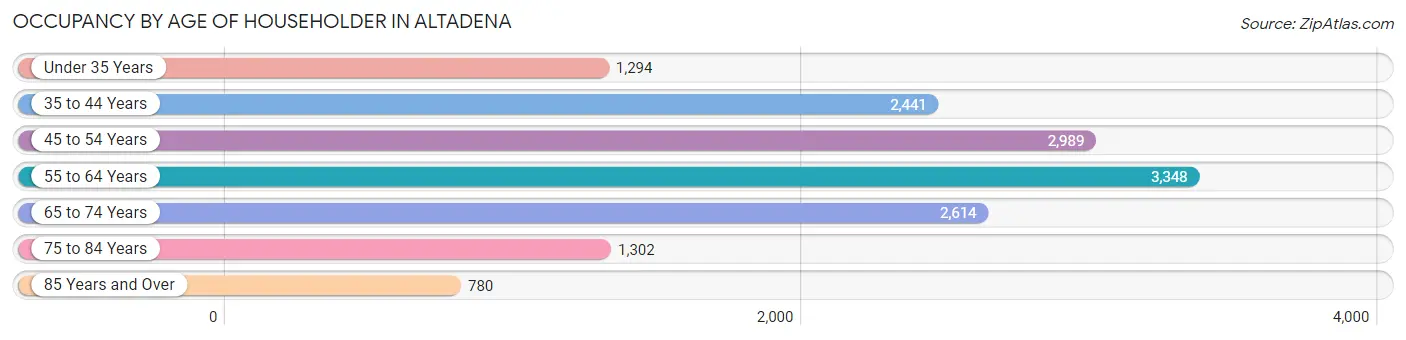
| Age Bracket | # Households | % Households |
| Under 35 Years | 1,294 | 8.8% |
| 35 to 44 Years | 2,441 | 16.5% |
| 45 to 54 Years | 2,989 | 20.2% |
| 55 to 64 Years | 3,348 | 22.7% |
| 65 to 74 Years | 2,614 | 17.7% |
| 75 to 84 Years | 1,302 | 8.8% |
| 85 Years and Over | 780 | 5.3% |
| Total | 14,768 | 100.0% |
Housing Finances in Altadena
Median Income by Occupancy in Altadena
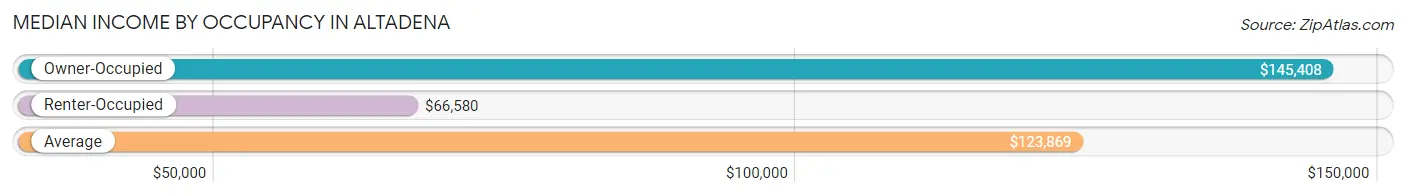
| Occupancy Type | # Households | Median Income |
| Owner-Occupied | 11,176 (75.7%) | $145,408 |
| Renter-Occupied | 3,592 (24.3%) | $66,580 |
| Average | 14,768 (100.0%) | $123,869 |
Occupancy by Householder Income Bracket in Altadena
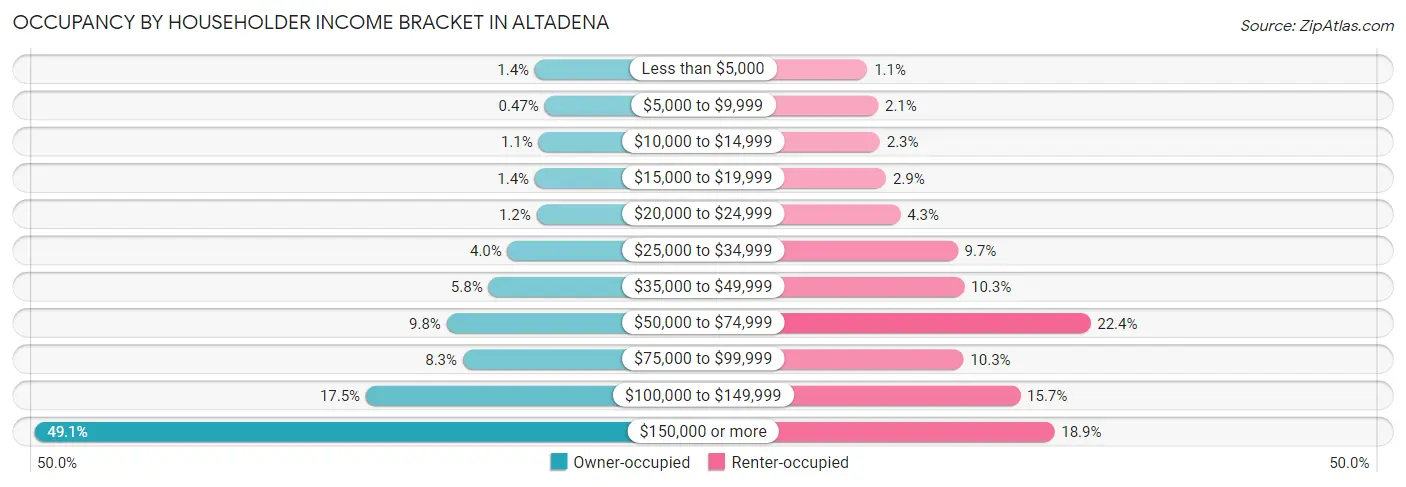
| Income Bracket | Owner-occupied | Renter-occupied |
| Less than $5,000 | 156 (1.4%) | 40 (1.1%) |
| $5,000 to $9,999 | 52 (0.5%) | 77 (2.1%) |
| $10,000 to $14,999 | 117 (1.1%) | 83 (2.3%) |
| $15,000 to $19,999 | 157 (1.4%) | 104 (2.9%) |
| $20,000 to $24,999 | 139 (1.2%) | 153 (4.3%) |
| $25,000 to $34,999 | 447 (4.0%) | 349 (9.7%) |
| $35,000 to $49,999 | 651 (5.8%) | 371 (10.3%) |
| $50,000 to $74,999 | 1,095 (9.8%) | 803 (22.4%) |
| $75,000 to $99,999 | 923 (8.3%) | 369 (10.3%) |
| $100,000 to $149,999 | 1,955 (17.5%) | 563 (15.7%) |
| $150,000 or more | 5,484 (49.1%) | 680 (18.9%) |
| Total | 11,176 (100.0%) | 3,592 (100.0%) |
Monthly Housing Cost Tiers in Altadena
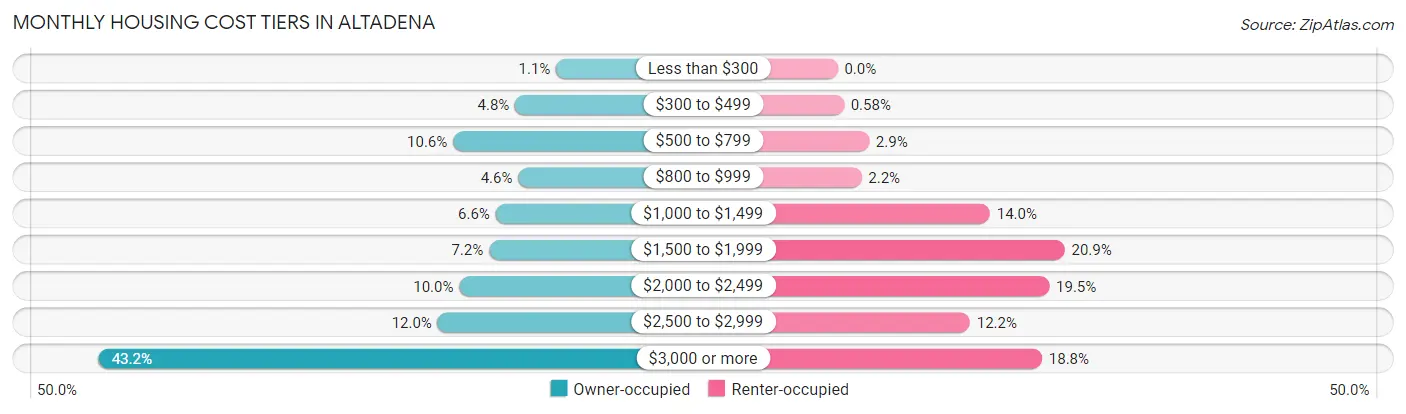
| Monthly Cost | Owner-occupied | Renter-occupied |
| Less than $300 | 119 (1.1%) | 0 (0.0%) |
| $300 to $499 | 541 (4.8%) | 21 (0.6%) |
| $500 to $799 | 1,179 (10.5%) | 104 (2.9%) |
| $800 to $999 | 509 (4.5%) | 79 (2.2%) |
| $1,000 to $1,499 | 741 (6.6%) | 504 (14.0%) |
| $1,500 to $1,999 | 809 (7.2%) | 751 (20.9%) |
| $2,000 to $2,499 | 1,115 (10.0%) | 700 (19.5%) |
| $2,500 to $2,999 | 1,338 (12.0%) | 438 (12.2%) |
| $3,000 or more | 4,825 (43.2%) | 676 (18.8%) |
| Total | 11,176 (100.0%) | 3,592 (100.0%) |
Physical Housing Characteristics in Altadena
Housing Structures in Altadena
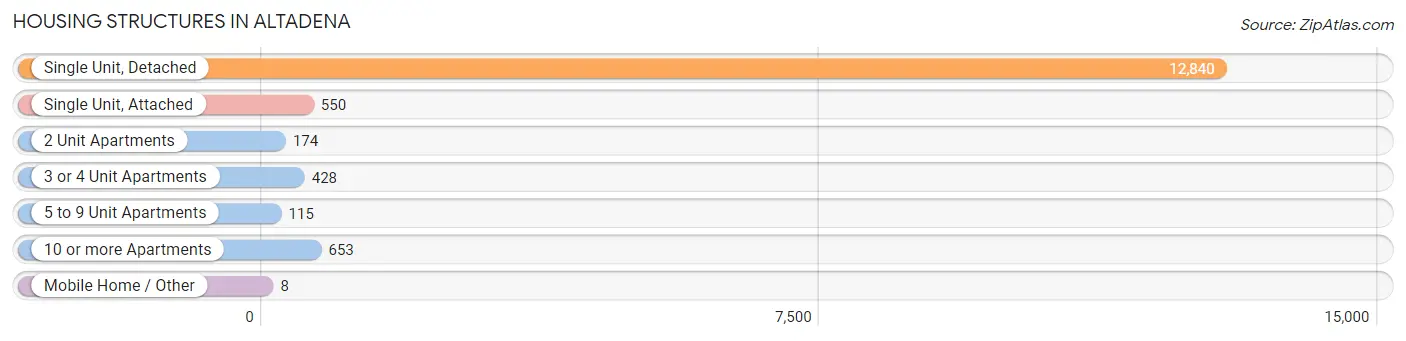
| Structure Type | # Housing Units | % Housing Units |
| Single Unit, Detached | 12,840 | 86.9% |
| Single Unit, Attached | 550 | 3.7% |
| 2 Unit Apartments | 174 | 1.2% |
| 3 or 4 Unit Apartments | 428 | 2.9% |
| 5 to 9 Unit Apartments | 115 | 0.8% |
| 10 or more Apartments | 653 | 4.4% |
| Mobile Home / Other | 8 | 0.1% |
| Total | 14,768 | 100.0% |
Housing Structures by Occupancy in Altadena
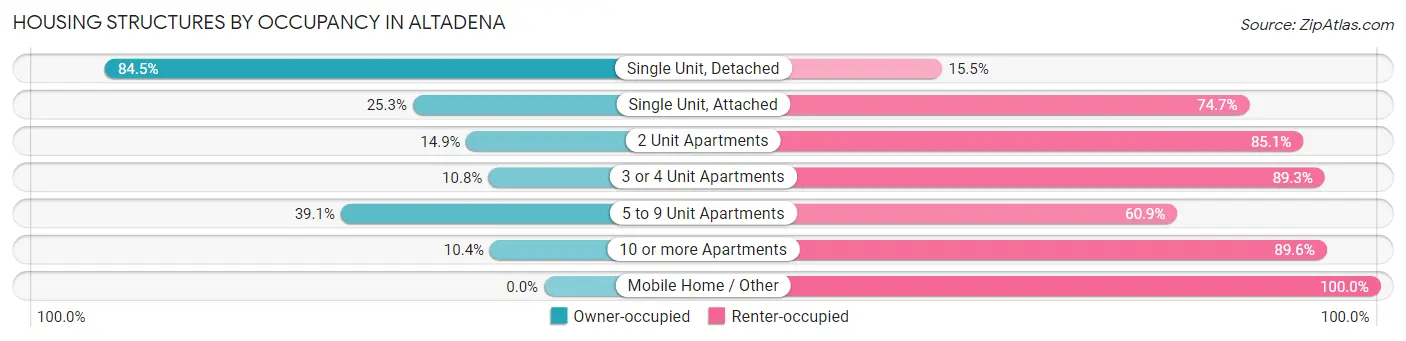
| Structure Type | Owner-occupied | Renter-occupied |
| Single Unit, Detached | 10,852 (84.5%) | 1,988 (15.5%) |
| Single Unit, Attached | 139 (25.3%) | 411 (74.7%) |
| 2 Unit Apartments | 26 (14.9%) | 148 (85.1%) |
| 3 or 4 Unit Apartments | 46 (10.7%) | 382 (89.2%) |
| 5 to 9 Unit Apartments | 45 (39.1%) | 70 (60.9%) |
| 10 or more Apartments | 68 (10.4%) | 585 (89.6%) |
| Mobile Home / Other | 0 (0.0%) | 8 (100.0%) |
| Total | 11,176 (75.7%) | 3,592 (24.3%) |
Housing Structures by Number of Rooms in Altadena
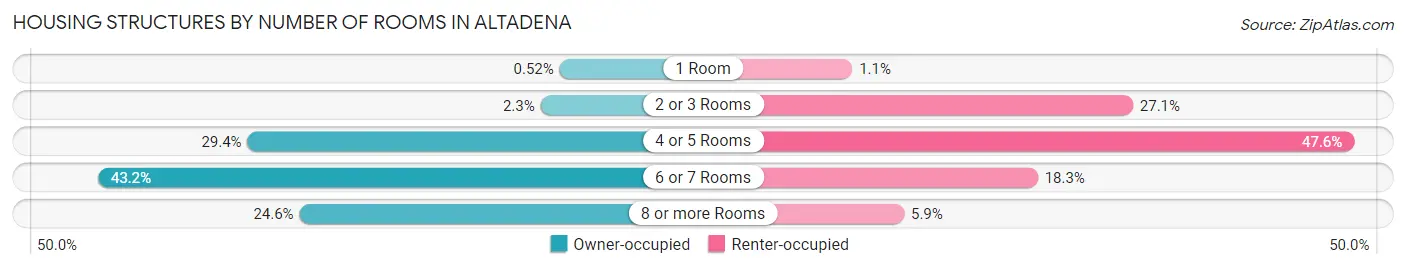
| Number of Rooms | Owner-occupied | Renter-occupied |
| 1 Room | 58 (0.5%) | 41 (1.1%) |
| 2 or 3 Rooms | 255 (2.3%) | 973 (27.1%) |
| 4 or 5 Rooms | 3,285 (29.4%) | 1,708 (47.5%) |
| 6 or 7 Rooms | 4,831 (43.2%) | 657 (18.3%) |
| 8 or more Rooms | 2,747 (24.6%) | 213 (5.9%) |
| Total | 11,176 (100.0%) | 3,592 (100.0%) |
Housing Structure by Heating Type in Altadena
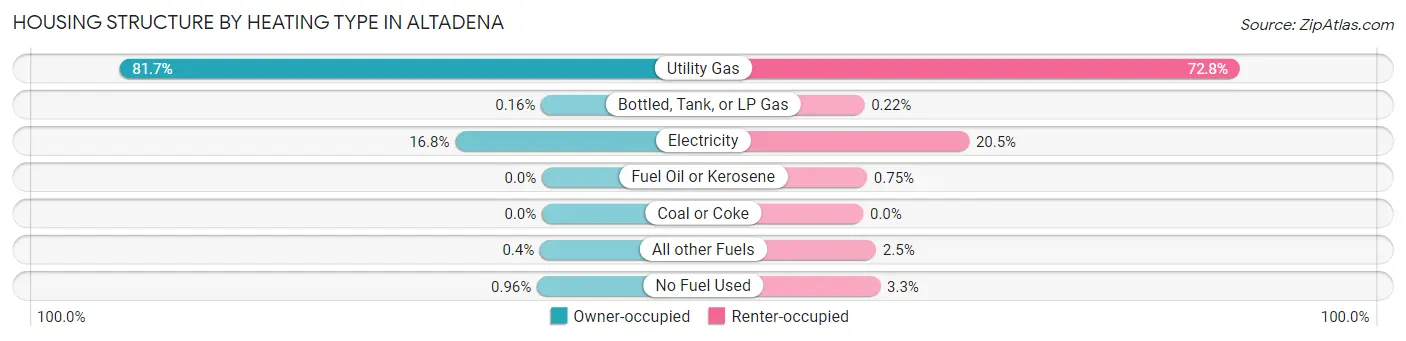
| Heating Type | Owner-occupied | Renter-occupied |
| Utility Gas | 9,130 (81.7%) | 2,615 (72.8%) |
| Bottled, Tank, or LP Gas | 18 (0.2%) | 8 (0.2%) |
| Electricity | 1,876 (16.8%) | 735 (20.5%) |
| Fuel Oil or Kerosene | 0 (0.0%) | 27 (0.7%) |
| Coal or Coke | 0 (0.0%) | 0 (0.0%) |
| All other Fuels | 45 (0.4%) | 89 (2.5%) |
| No Fuel Used | 107 (1.0%) | 118 (3.3%) |
| Total | 11,176 (100.0%) | 3,592 (100.0%) |
Household Vehicle Usage in Altadena
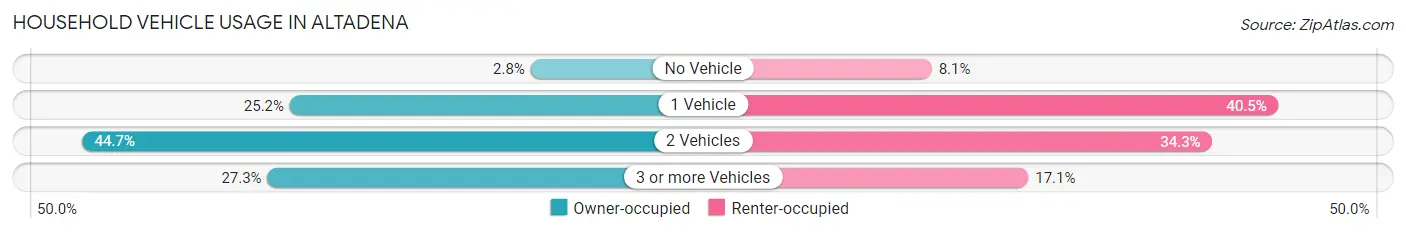
| Vehicles per Household | Owner-occupied | Renter-occupied |
| No Vehicle | 308 (2.8%) | 291 (8.1%) |
| 1 Vehicle | 2,821 (25.2%) | 1,454 (40.5%) |
| 2 Vehicles | 4,993 (44.7%) | 1,232 (34.3%) |
| 3 or more Vehicles | 3,054 (27.3%) | 615 (17.1%) |
| Total | 11,176 (100.0%) | 3,592 (100.0%) |
Real Estate & Mortgages in Altadena
Real Estate and Mortgage Overview in Altadena
| Characteristic | Without Mortgage | With Mortgage |
| Housing Units | 2,974 | 8,202 |
| Median Property Value | $954,500 | $1,005,800 |
| Median Household Income | $112,527 | $4,411 |
| Monthly Housing Costs | $740 | $4,799 |
| Real Estate Taxes | $3,817 | $35 |
Property Value by Mortgage Status in Altadena
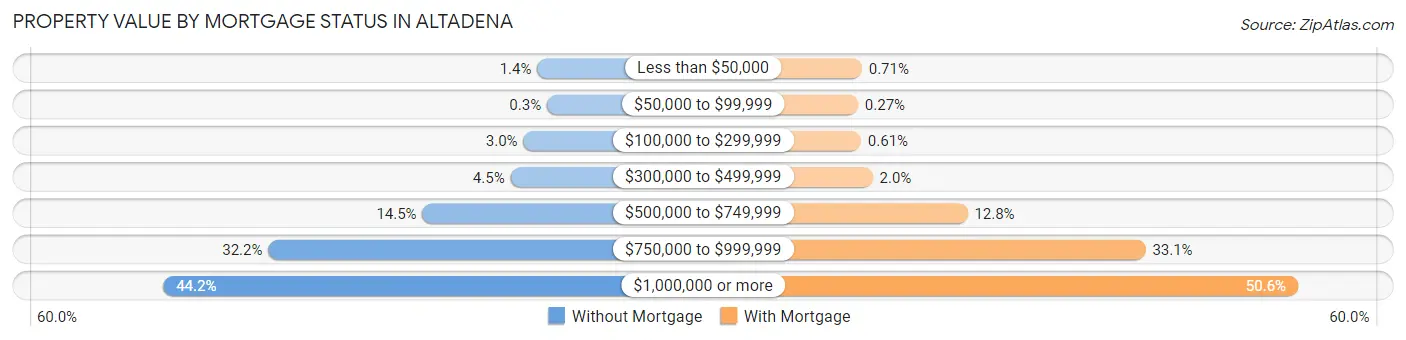
| Property Value | Without Mortgage | With Mortgage |
| Less than $50,000 | 42 (1.4%) | 58 (0.7%) |
| $50,000 to $99,999 | 9 (0.3%) | 22 (0.3%) |
| $100,000 to $299,999 | 89 (3.0%) | 50 (0.6%) |
| $300,000 to $499,999 | 133 (4.5%) | 160 (1.9%) |
| $500,000 to $749,999 | 432 (14.5%) | 1,049 (12.8%) |
| $750,000 to $999,999 | 956 (32.2%) | 2,717 (33.1%) |
| $1,000,000 or more | 1,313 (44.2%) | 4,146 (50.5%) |
| Total | 2,974 (100.0%) | 8,202 (100.0%) |
Household Income by Mortgage Status in Altadena
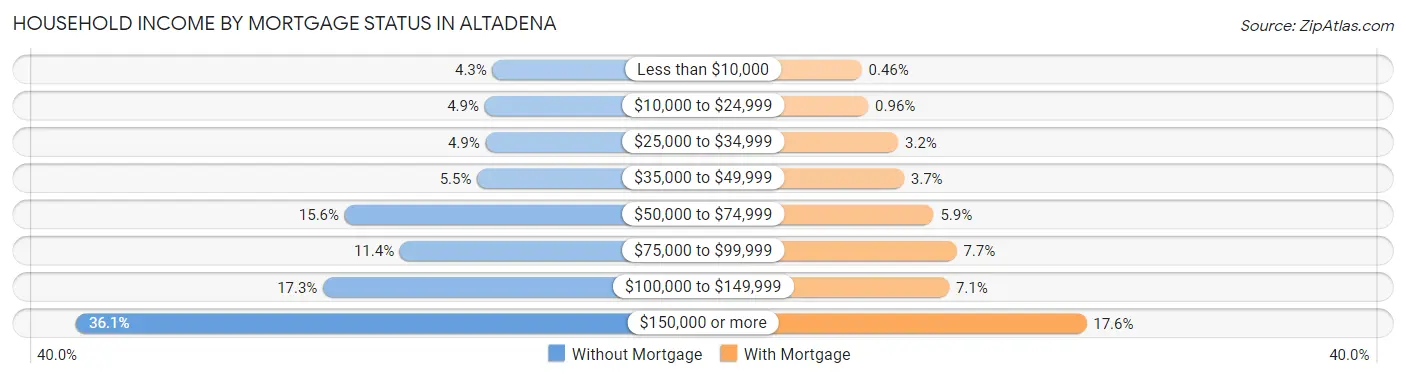
| Household Income | Without Mortgage | With Mortgage |
| Less than $10,000 | 129 (4.3%) | 38 (0.5%) |
| $10,000 to $24,999 | 147 (4.9%) | 79 (1.0%) |
| $25,000 to $34,999 | 145 (4.9%) | 266 (3.2%) |
| $35,000 to $49,999 | 164 (5.5%) | 302 (3.7%) |
| $50,000 to $74,999 | 464 (15.6%) | 487 (5.9%) |
| $75,000 to $99,999 | 339 (11.4%) | 631 (7.7%) |
| $100,000 to $149,999 | 513 (17.2%) | 584 (7.1%) |
| $150,000 or more | 1,073 (36.1%) | 1,442 (17.6%) |
| Total | 2,974 (100.0%) | 8,202 (100.0%) |
Property Value to Household Income Ratio in Altadena
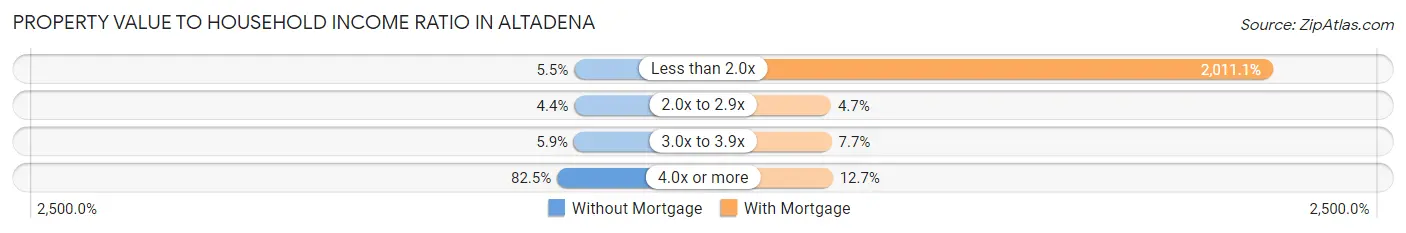
| Value-to-Income Ratio | Without Mortgage | With Mortgage |
| Less than 2.0x | 162 (5.4%) | 164,947 (2,011.1%) |
| 2.0x to 2.9x | 132 (4.4%) | 384 (4.7%) |
| 3.0x to 3.9x | 175 (5.9%) | 629 (7.7%) |
| 4.0x or more | 2,454 (82.5%) | 1,039 (12.7%) |
| Total | 2,974 (100.0%) | 8,202 (100.0%) |
Real Estate Taxes by Mortgage Status in Altadena
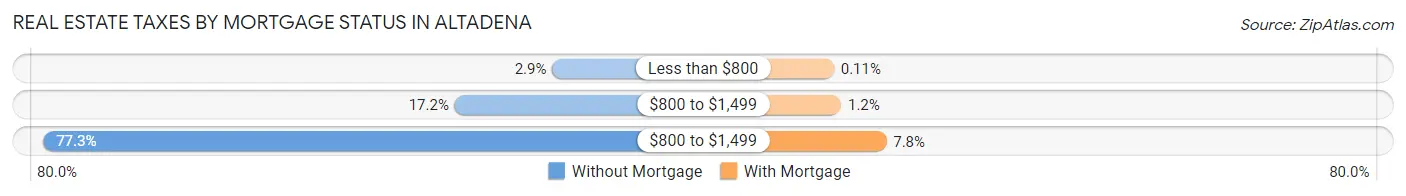
| Property Taxes | Without Mortgage | With Mortgage |
| Less than $800 | 86 (2.9%) | 9 (0.1%) |
| $800 to $1,499 | 510 (17.2%) | 96 (1.2%) |
| $800 to $1,499 | 2,298 (77.3%) | 638 (7.8%) |
| Total | 2,974 (100.0%) | 8,202 (100.0%) |
Health & Disability in Altadena
Health Insurance Coverage by Age in Altadena
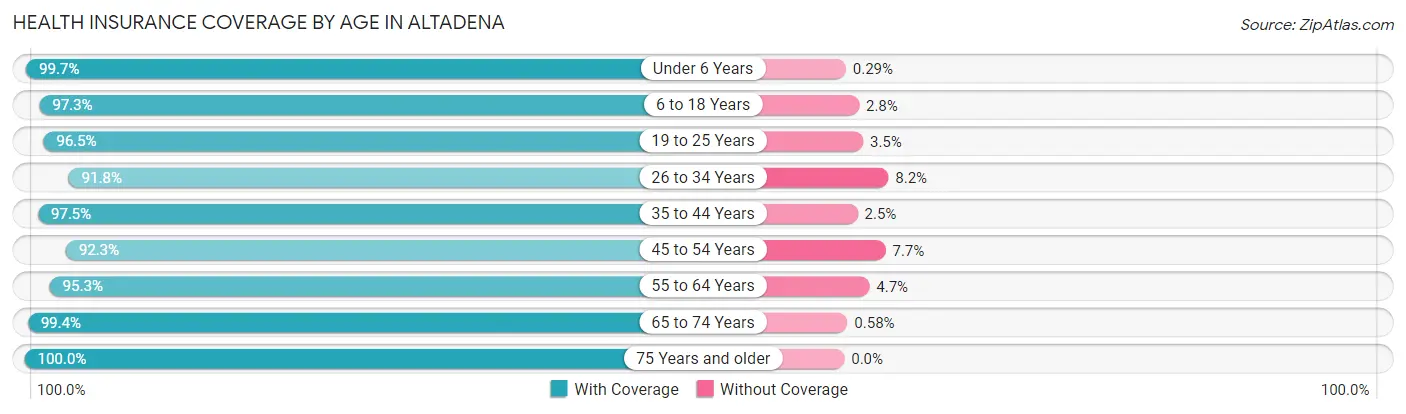
| Age Bracket | With Coverage | Without Coverage |
| Under 6 Years | 2,798 (99.7%) | 8 (0.3%) |
| 6 to 18 Years | 6,047 (97.3%) | 171 (2.8%) |
| 19 to 25 Years | 2,482 (96.5%) | 90 (3.5%) |
| 26 to 34 Years | 4,104 (91.8%) | 367 (8.2%) |
| 35 to 44 Years | 5,591 (97.5%) | 142 (2.5%) |
| 45 to 54 Years | 5,715 (92.3%) | 476 (7.7%) |
| 55 to 64 Years | 5,805 (95.3%) | 285 (4.7%) |
| 65 to 74 Years | 4,421 (99.4%) | 26 (0.6%) |
| 75 Years and older | 3,957 (100.0%) | 0 (0.0%) |
| Total | 40,920 (96.3%) | 1,565 (3.7%) |
Health Insurance Coverage by Citizenship Status in Altadena
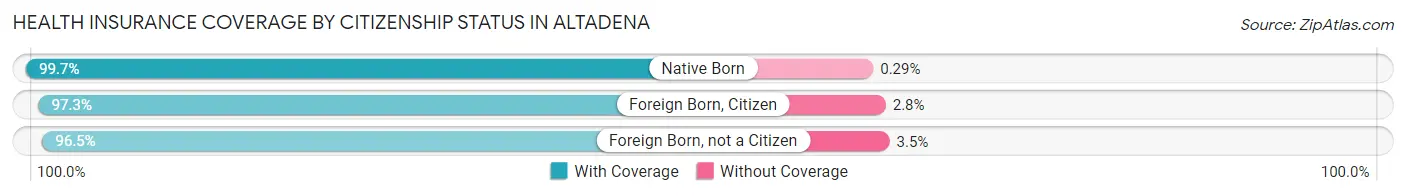
| Citizenship Status | With Coverage | Without Coverage |
| Native Born | 2,798 (99.7%) | 8 (0.3%) |
| Foreign Born, Citizen | 6,047 (97.3%) | 171 (2.8%) |
| Foreign Born, not a Citizen | 2,482 (96.5%) | 90 (3.5%) |
Health Insurance Coverage by Household Income in Altadena
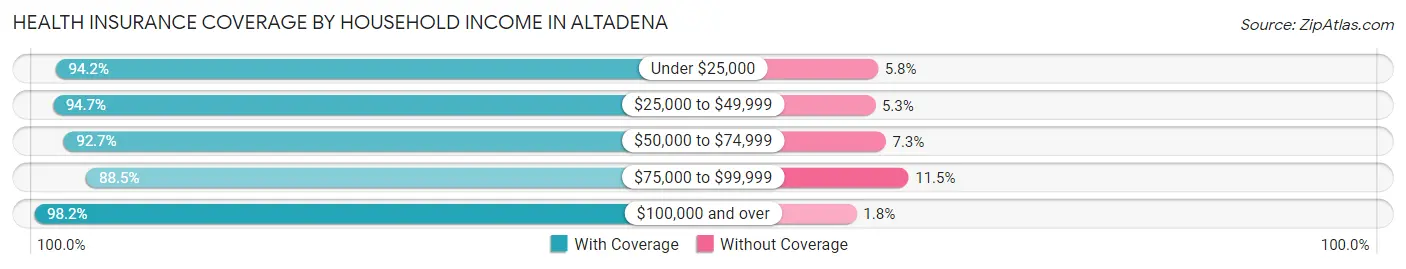
| Household Income | With Coverage | Without Coverage |
| Under $25,000 | 1,851 (94.2%) | 114 (5.8%) |
| $25,000 to $49,999 | 3,719 (94.7%) | 207 (5.3%) |
| $50,000 to $74,999 | 4,446 (92.7%) | 348 (7.3%) |
| $75,000 to $99,999 | 3,001 (88.5%) | 391 (11.5%) |
| $100,000 and over | 27,328 (98.2%) | 502 (1.8%) |
Public vs Private Health Insurance Coverage by Age in Altadena
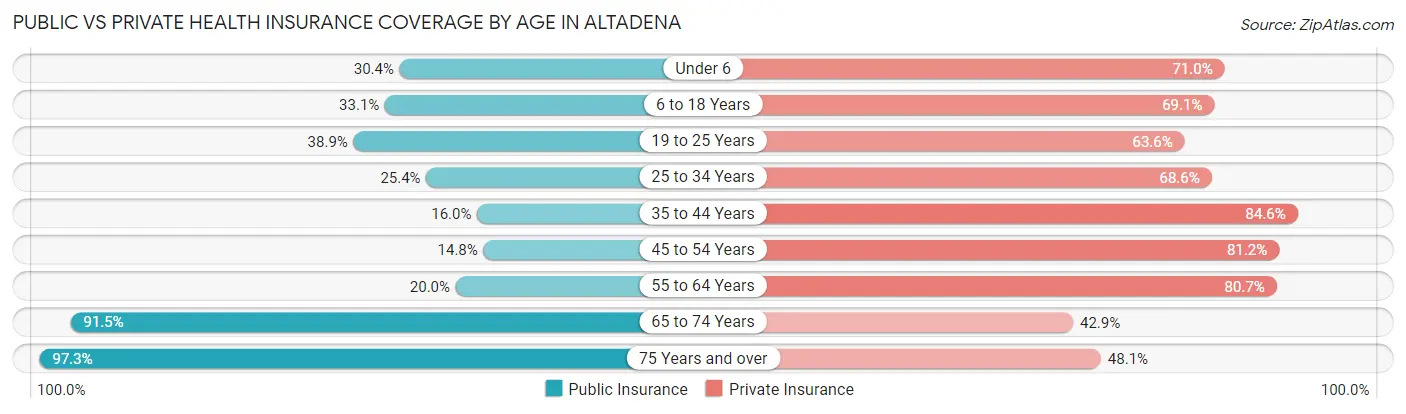
| Age Bracket | Public Insurance | Private Insurance |
| Under 6 | 852 (30.4%) | 1,993 (71.0%) |
| 6 to 18 Years | 2,057 (33.1%) | 4,298 (69.1%) |
| 19 to 25 Years | 1,001 (38.9%) | 1,636 (63.6%) |
| 25 to 34 Years | 1,136 (25.4%) | 3,068 (68.6%) |
| 35 to 44 Years | 916 (16.0%) | 4,850 (84.6%) |
| 45 to 54 Years | 916 (14.8%) | 5,025 (81.2%) |
| 55 to 64 Years | 1,215 (20.0%) | 4,915 (80.7%) |
| 65 to 74 Years | 4,069 (91.5%) | 1,909 (42.9%) |
| 75 Years and over | 3,849 (97.3%) | 1,903 (48.1%) |
| Total | 16,011 (37.7%) | 29,597 (69.7%) |
Disability Status by Sex by Age in Altadena
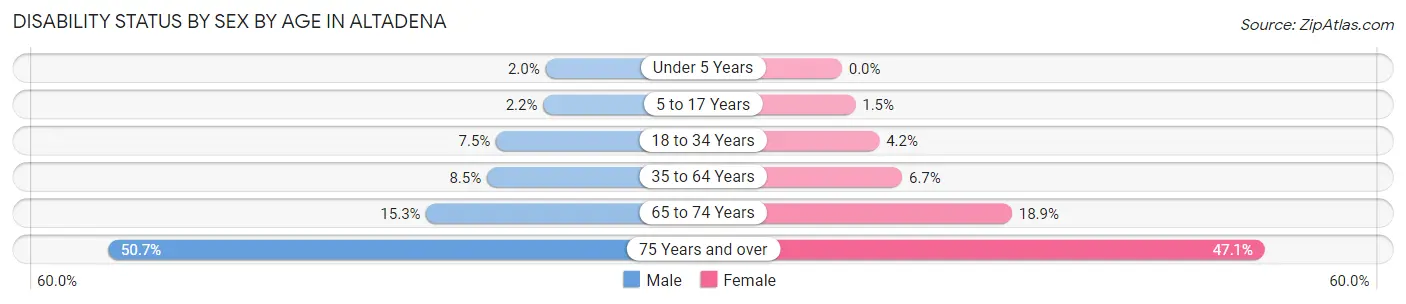
| Age Bracket | Male | Female |
| Under 5 Years | 22 (2.0%) | 0 (0.0%) |
| 5 to 17 Years | 67 (2.2%) | 50 (1.5%) |
| 18 to 34 Years | 290 (7.5%) | 147 (4.2%) |
| 35 to 64 Years | 727 (8.5%) | 635 (6.7%) |
| 65 to 74 Years | 289 (15.2%) | 483 (18.9%) |
| 75 Years and over | 841 (50.7%) | 1,083 (47.1%) |
Disability Class by Sex by Age in Altadena
Disability Class: Hearing Difficulty
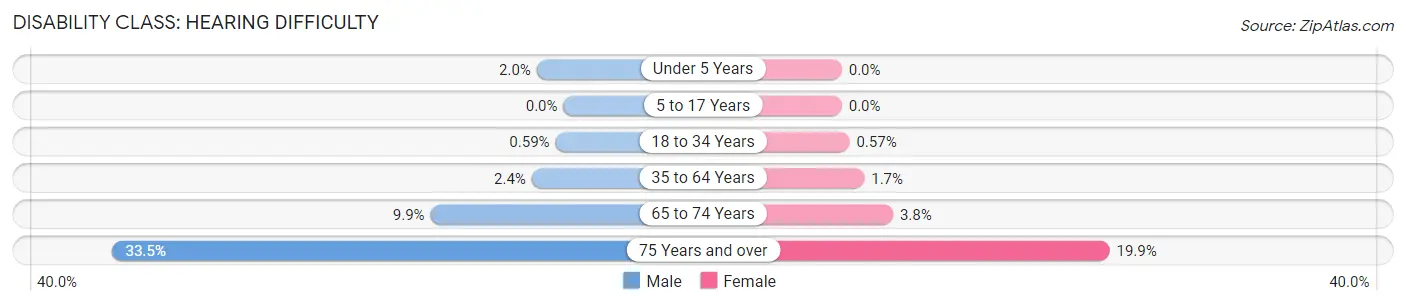
| Age Bracket | Male | Female |
| Under 5 Years | 22 (2.0%) | 0 (0.0%) |
| 5 to 17 Years | 0 (0.0%) | 0 (0.0%) |
| 18 to 34 Years | 23 (0.6%) | 20 (0.6%) |
| 35 to 64 Years | 201 (2.4%) | 158 (1.7%) |
| 65 to 74 Years | 187 (9.9%) | 97 (3.8%) |
| 75 Years and over | 555 (33.5%) | 457 (19.9%) |
Disability Class: Vision Difficulty
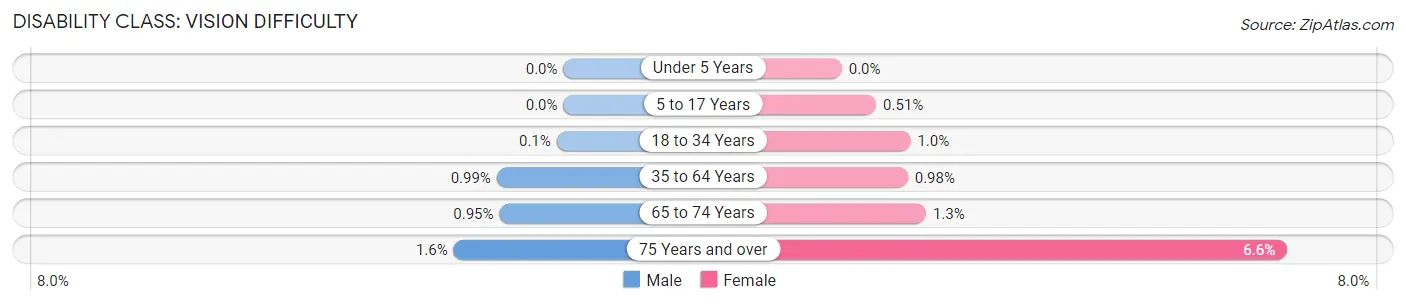
| Age Bracket | Male | Female |
| Under 5 Years | 0 (0.0%) | 0 (0.0%) |
| 5 to 17 Years | 0 (0.0%) | 17 (0.5%) |
| 18 to 34 Years | 4 (0.1%) | 36 (1.0%) |
| 35 to 64 Years | 85 (1.0%) | 93 (1.0%) |
| 65 to 74 Years | 18 (0.9%) | 32 (1.3%) |
| 75 Years and over | 27 (1.6%) | 152 (6.6%) |
Disability Class: Cognitive Difficulty
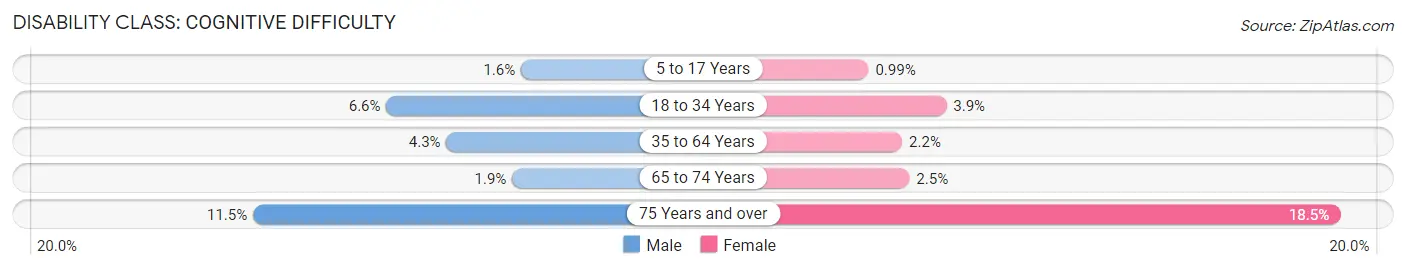
| Age Bracket | Male | Female |
| 5 to 17 Years | 47 (1.6%) | 33 (1.0%) |
| 18 to 34 Years | 255 (6.6%) | 137 (3.9%) |
| 35 to 64 Years | 371 (4.3%) | 212 (2.2%) |
| 65 to 74 Years | 36 (1.9%) | 64 (2.5%) |
| 75 Years and over | 191 (11.5%) | 426 (18.5%) |
Disability Class: Ambulatory Difficulty
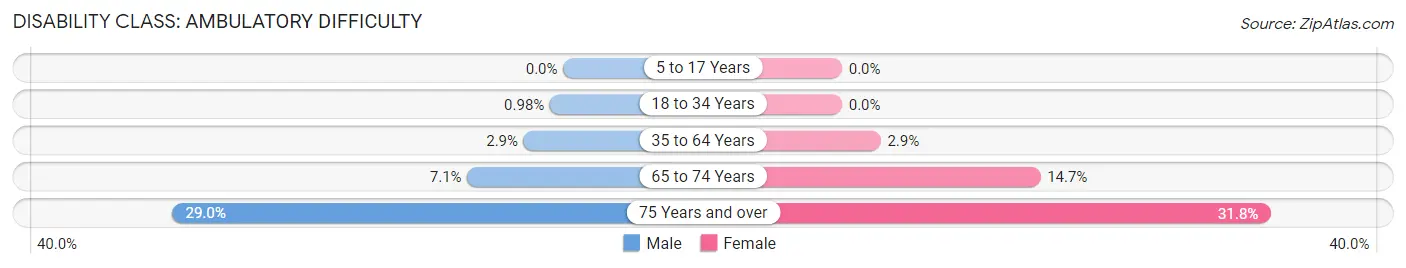
| Age Bracket | Male | Female |
| 5 to 17 Years | 0 (0.0%) | 0 (0.0%) |
| 18 to 34 Years | 38 (1.0%) | 0 (0.0%) |
| 35 to 64 Years | 251 (2.9%) | 272 (2.9%) |
| 65 to 74 Years | 135 (7.1%) | 376 (14.7%) |
| 75 Years and over | 481 (29.0%) | 731 (31.8%) |
Disability Class: Self-Care Difficulty
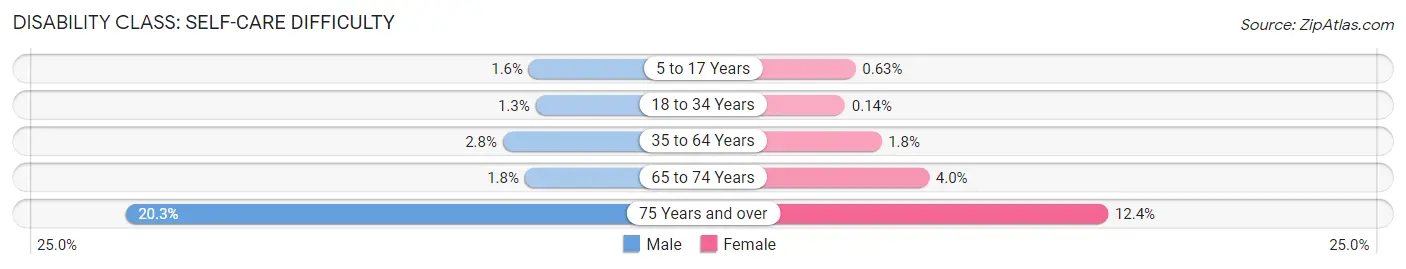
| Age Bracket | Male | Female |
| 5 to 17 Years | 48 (1.6%) | 21 (0.6%) |
| 18 to 34 Years | 50 (1.3%) | 5 (0.1%) |
| 35 to 64 Years | 240 (2.8%) | 173 (1.8%) |
| 65 to 74 Years | 34 (1.8%) | 103 (4.0%) |
| 75 Years and over | 337 (20.3%) | 284 (12.3%) |
Technology Access in Altadena
Computing Device Access in Altadena
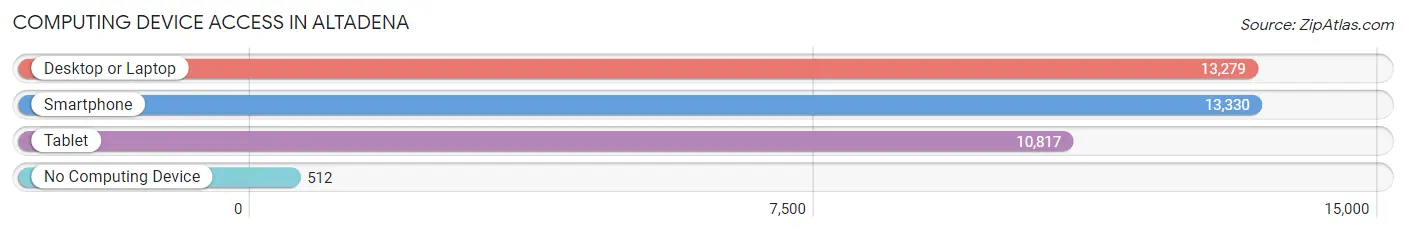
| Device Type | # Households | % Households |
| Desktop or Laptop | 13,279 | 89.9% |
| Smartphone | 13,330 | 90.3% |
| Tablet | 10,817 | 73.3% |
| No Computing Device | 512 | 3.5% |
| Total | 14,768 | 100.0% |
Internet Access in Altadena
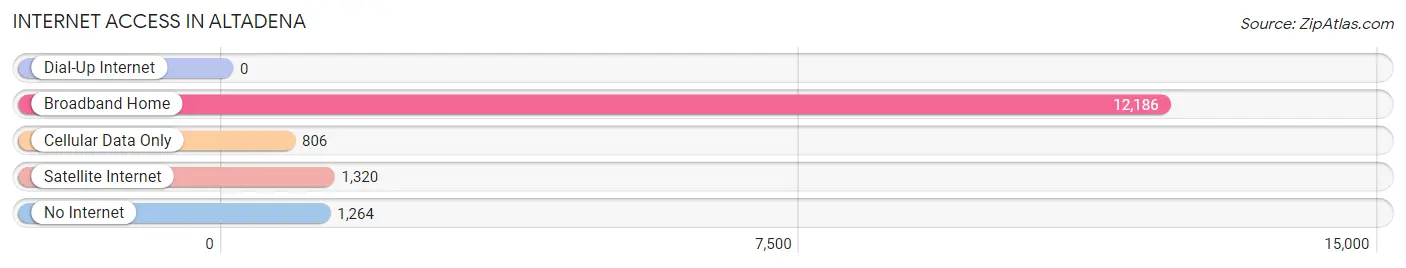
| Internet Type | # Households | % Households |
| Dial-Up Internet | 0 | 0.0% |
| Broadband Home | 12,186 | 82.5% |
| Cellular Data Only | 806 | 5.5% |
| Satellite Internet | 1,320 | 8.9% |
| No Internet | 1,264 | 8.6% |
| Total | 14,768 | 100.0% |
Altadena Summary
Altadena is a census-designated place (CDP) in Los Angeles County, California, United States, approximately 14 miles (23 km) northeast of Downtown Los Angeles. The population was 42,777 at the 2010 census, up from 42,610 at the 2000 census.
History
Altadena was founded in 1887 by John and Fred Woodbury, two brothers who purchased the land from the Rancho San Pasqual Mexican land grant. The brothers named the area after the city of Pasadena, which was founded in 1886. The area was originally part of the Rancho San Pasqual, which was granted to the Lugo family in 1819. The Lugo family sold the land to the Woodburys in 1887.
The Woodburys developed the area as a residential community, and it quickly became a popular destination for wealthy Angelenos. The area was known for its large estates and grand homes, and it was home to many prominent figures, including railroad magnate Henry Huntington and silent film star Mary Pickford.
Geography
Altadena is located at 34°11′39″N 118°7′54″W (34.194167, -118.131667). According to the United States Census Bureau, the CDP has a total area of 8.7 square miles (22.6 km2), all of it land.
Altadena is bordered by Pasadena on the west, South Pasadena on the south, the Angeles National Forest on the north and east, and unincorporated areas of Los Angeles County known as Altadena on the northeast and east.
Economy
Altadena's economy is largely based on the service industry, with many residents employed in retail, hospitality, and healthcare. The area is also home to a number of small businesses, including restaurants, cafes, and boutiques.
The median household income in Altadena is $63,945, and the median family income is $76,845. The unemployment rate is 4.2%, which is lower than the national average of 5.2%.
Demographics
As of the 2010 census, there were 42,777 people, 16,945 households, and 10,845 families residing in the CDP. The population density was 4,912.3 people per square mile (1,902.2/km2). There were 17,890 housing units at an average density of 2,056.2 per square mile (793.3/km2). The racial makeup of the CDP was 57.2% White (44.2% Non-Hispanic White), 11.2% African American, 0.7% Native American, 16.2% Asian, 0.2% Pacific Islander, 11.3% from other races, and 3.4% from two or more races. Hispanic or Latino of any race were 28.2% of the population.
The median age was 37.2 years. For every 100 females, there were 94.2 males. For every 100 females age 18 and over, there were 91.2 males.
Altadena is a diverse community, with a mix of races, ethnicities, and incomes. The area is home to a large number of immigrants, with nearly one-third of the population foreign-born. The largest ethnic groups are Mexican (25.3%), Filipino (7.2%), Chinese (6.2%), and Korean (4.2%).
Common Questions
What is Per Capita Income in Altadena?
Per Capita income in Altadena is $61,334.
What is the Median Family Income in Altadena?
Median Family Income in Altadena is $140,072.
What is the Median Household income in Altadena?
Median Household Income in Altadena is $123,869.
What is Income or Wage Gap in Altadena?
Income or Wage Gap in Altadena is 24.4%.
Women in Altadena earn 75.6 cents for every dollar earned by a man.
What is Family Income Deficit in Altadena?
Family Income Deficit in Altadena is $8,591.
Families that are below poverty line in Altadena earn $8,591 less on average than the poverty threshold level.
What is Inequality or Gini Index in Altadena?
Inequality or Gini Index in Altadena is 0.47.
What is the Total Population of Altadena?
Total Population of Altadena is 42,719.
What is the Total Male Population of Altadena?
Total Male Population of Altadena is 20,251.
What is the Total Female Population of Altadena?
Total Female Population of Altadena is 22,468.
What is the Ratio of Males per 100 Females in Altadena?
There are 90.13 Males per 100 Females in Altadena.
What is the Ratio of Females per 100 Males in Altadena?
There are 110.95 Females per 100 Males in Altadena.
What is the Median Population Age in Altadena?
Median Population Age in Altadena is 43.8 Years.
What is the Average Family Size in Altadena
Average Family Size in Altadena is 3.3 People.
What is the Average Household Size in Altadena
Average Household Size in Altadena is 2.8 People.
How Large is the Labor Force in Altadena?
There are 22,552 People in the Labor Forcein in Altadena.
What is the Percentage of People in the Labor Force in Altadena?
64.6% of People are in the Labor Force in Altadena.
What is the Unemployment Rate in Altadena?
Unemployment Rate in Altadena is 6.7%.