Laguna Niguel, CA Map & Demographics
Laguna Niguel Map
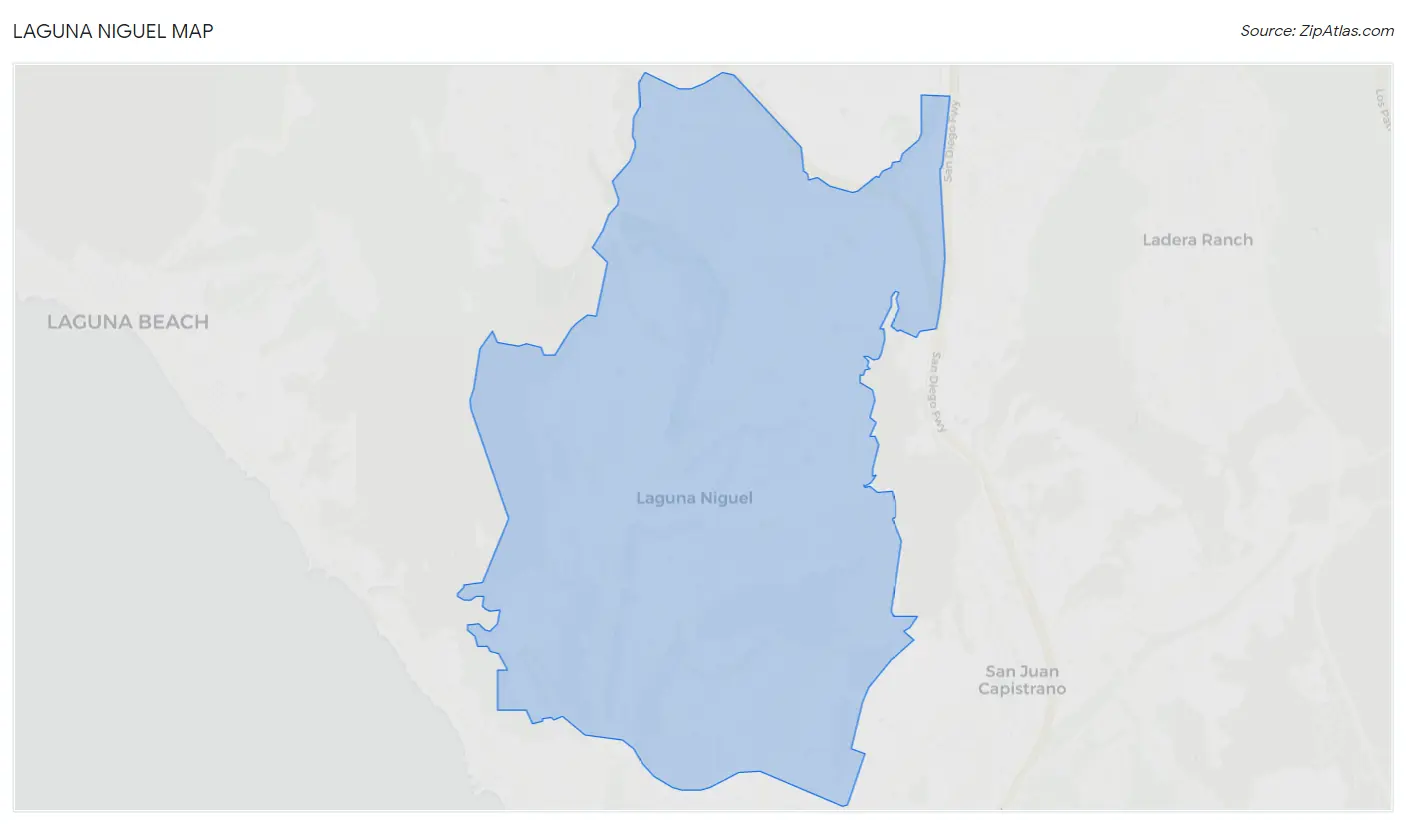
Laguna Niguel Overview
$74,600
PER CAPITA INCOME
$162,215
AVG FAMILY INCOME
$135,822
AVG HOUSEHOLD INCOME
45.5%
WAGE / INCOME GAP [ % ]
54.5¢/ $1
WAGE / INCOME GAP [ $ ]
0.47
INEQUALITY / GINI INDEX
64,259
TOTAL POPULATION
31,080
MALE POPULATION
33,179
FEMALE POPULATION
93.67
MALES / 100 FEMALES
106.75
FEMALES / 100 MALES
47.2
MEDIAN AGE
3.0
AVG FAMILY SIZE
2.5
AVG HOUSEHOLD SIZE
36,329
LABOR FORCE [ PEOPLE ]
66.2%
PERCENT IN LABOR FORCE
5.5%
UNEMPLOYMENT RATE
Laguna Niguel Zip Codes
Laguna Niguel Area Codes
Income in Laguna Niguel
Income Overview in Laguna Niguel
Per Capita Income in Laguna Niguel is $74,600, while median incomes of families and households are $162,215 and $135,822 respectively.
| Characteristic | Number | Measure |
| Per Capita Income | 64,259 | $74,600 |
| Median Family Income | 17,790 | $162,215 |
| Mean Family Income | 17,790 | $218,055 |
| Median Household Income | 25,239 | $135,822 |
| Mean Household Income | 25,239 | $186,617 |
| Income Deficit | 17,790 | $0 |
| Wage / Income Gap (%) | 64,259 | 45.53% |
| Wage / Income Gap ($) | 64,259 | 54.47¢ per $1 |
| Gini / Inequality Index | 64,259 | 0.47 |
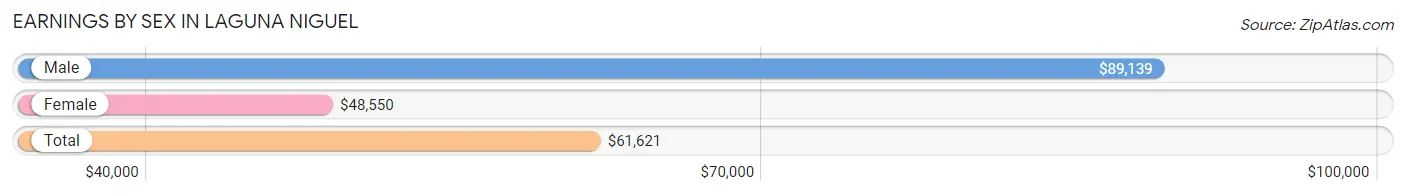
Earnings by Sex in Laguna Niguel
Average Earnings in Laguna Niguel are $61,621, $89,139 for men and $48,550 for women, a difference of 45.5%.
| Sex | Number | Average Earnings |
| Male | 18,989 (51.3%) | $89,139 |
| Female | 18,022 (48.7%) | $48,550 |
| Total | 37,011 (100.0%) | $61,621 |
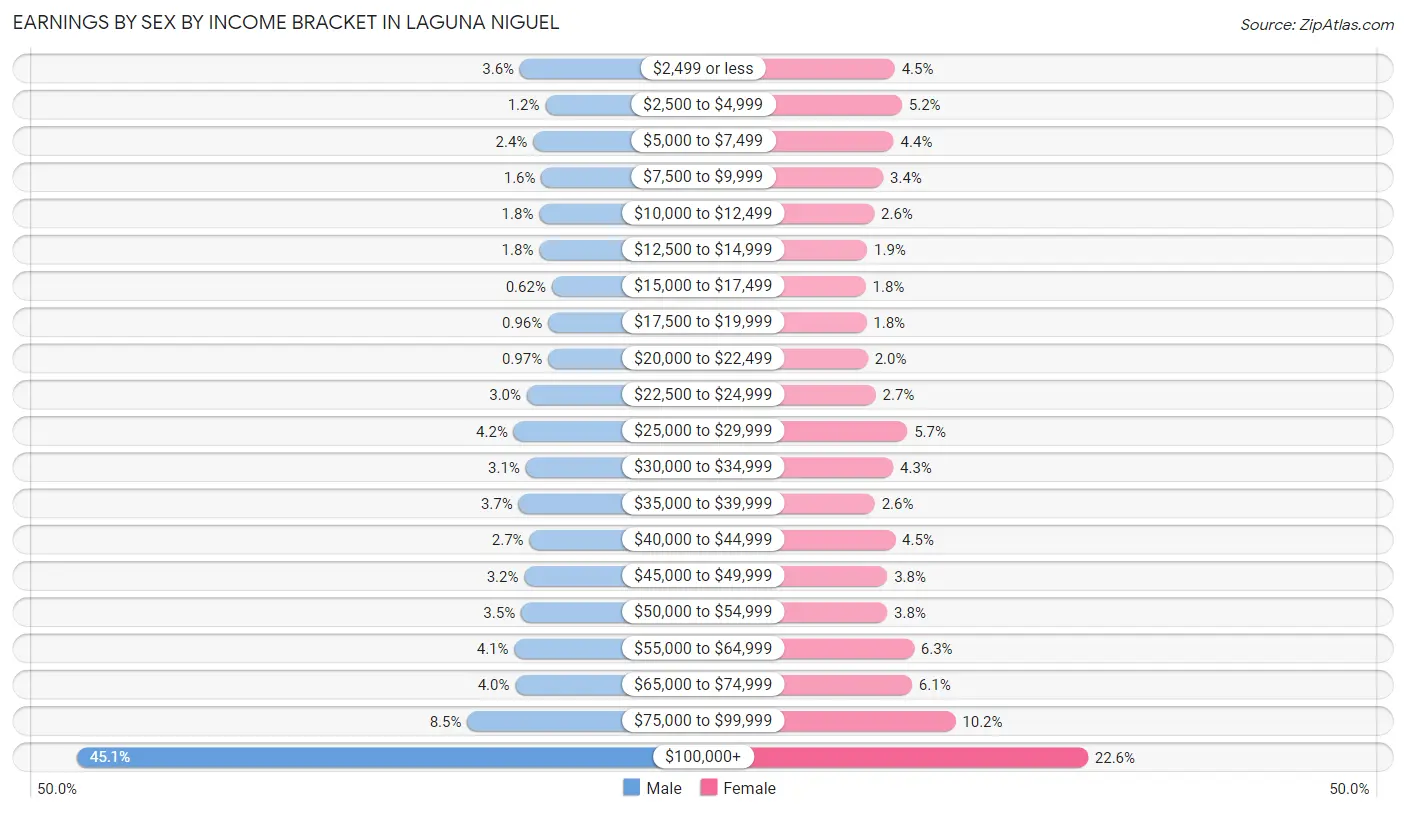
Earnings by Sex by Income Bracket in Laguna Niguel
The most common earnings brackets in Laguna Niguel are $100,000+ for men (8,564 | 45.1%) and $100,000+ for women (4,069 | 22.6%).
| Income | Male | Female |
| $2,499 or less | 683 (3.6%) | 809 (4.5%) |
| $2,500 to $4,999 | 231 (1.2%) | 930 (5.2%) |
| $5,000 to $7,499 | 448 (2.4%) | 792 (4.4%) |
| $7,500 to $9,999 | 302 (1.6%) | 612 (3.4%) |
| $10,000 to $12,499 | 340 (1.8%) | 461 (2.6%) |
| $12,500 to $14,999 | 339 (1.8%) | 342 (1.9%) |
| $15,000 to $17,499 | 117 (0.6%) | 318 (1.8%) |
| $17,500 to $19,999 | 183 (1.0%) | 329 (1.8%) |
| $20,000 to $22,499 | 185 (1.0%) | 354 (2.0%) |
| $22,500 to $24,999 | 561 (2.9%) | 486 (2.7%) |
| $25,000 to $29,999 | 794 (4.2%) | 1,020 (5.7%) |
| $30,000 to $34,999 | 581 (3.1%) | 783 (4.3%) |
| $35,000 to $39,999 | 709 (3.7%) | 472 (2.6%) |
| $40,000 to $44,999 | 514 (2.7%) | 816 (4.5%) |
| $45,000 to $49,999 | 605 (3.2%) | 683 (3.8%) |
| $50,000 to $54,999 | 665 (3.5%) | 682 (3.8%) |
| $55,000 to $64,999 | 783 (4.1%) | 1,132 (6.3%) |
| $65,000 to $74,999 | 766 (4.0%) | 1,100 (6.1%) |
| $75,000 to $99,999 | 1,619 (8.5%) | 1,832 (10.2%) |
| $100,000+ | 8,564 (45.1%) | 4,069 (22.6%) |
| Total | 18,989 (100.0%) | 18,022 (100.0%) |
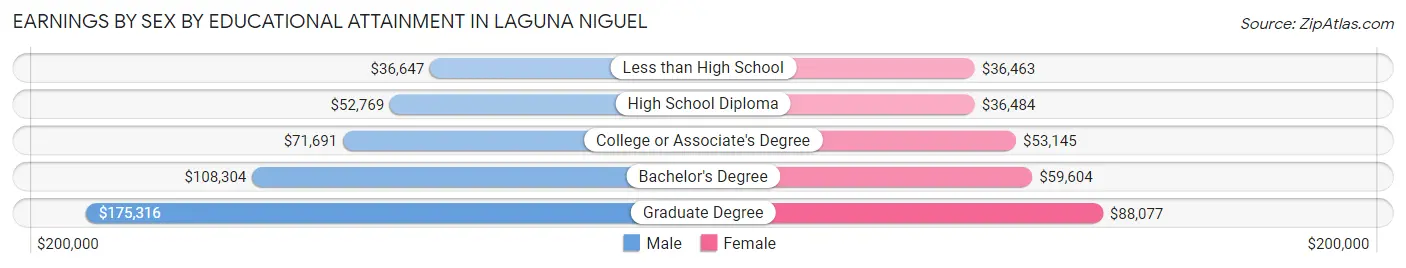
Earnings by Sex by Educational Attainment in Laguna Niguel
Average earnings in Laguna Niguel are $100,934 for men and $56,733 for women, a difference of 43.8%. Men with an educational attainment of graduate degree enjoy the highest average annual earnings of $175,316, while those with less than high school education earn the least with $36,647. Women with an educational attainment of graduate degree earn the most with the average annual earnings of $88,077, while those with less than high school education have the smallest earnings of $36,463.
| Educational Attainment | Male Income | Female Income |
| Less than High School | $36,647 | $36,463 |
| High School Diploma | $52,769 | $36,484 |
| College or Associate's Degree | $71,691 | $53,145 |
| Bachelor's Degree | $108,304 | $59,604 |
| Graduate Degree | $175,316 | $88,077 |
| Total | $100,934 | $56,733 |
Family Income in Laguna Niguel
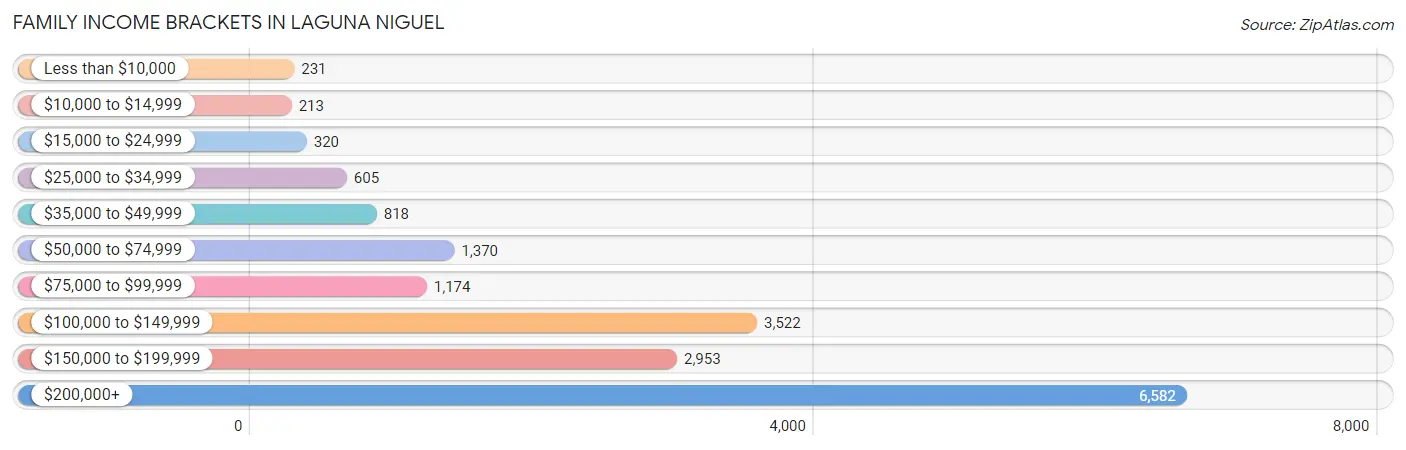
Family Income Brackets in Laguna Niguel
According to the Laguna Niguel family income data, there are 6,582 families falling into the $200,000+ income range, which is the most common income bracket and makes up 37.0% of all families. Conversely, the $10,000 to $14,999 income bracket is the least frequent group with only 213 families (1.2%) belonging to this category.
| Income Bracket | # Families | % Families |
| Less than $10,000 | 231 | 1.3% |
| $10,000 to $14,999 | 213 | 1.2% |
| $15,000 to $24,999 | 320 | 1.8% |
| $25,000 to $34,999 | 605 | 3.4% |
| $35,000 to $49,999 | 818 | 4.6% |
| $50,000 to $74,999 | 1,370 | 7.7% |
| $75,000 to $99,999 | 1,174 | 6.6% |
| $100,000 to $149,999 | 3,522 | 19.8% |
| $150,000 to $199,999 | 2,953 | 16.6% |
| $200,000+ | 6,582 | 37.0% |
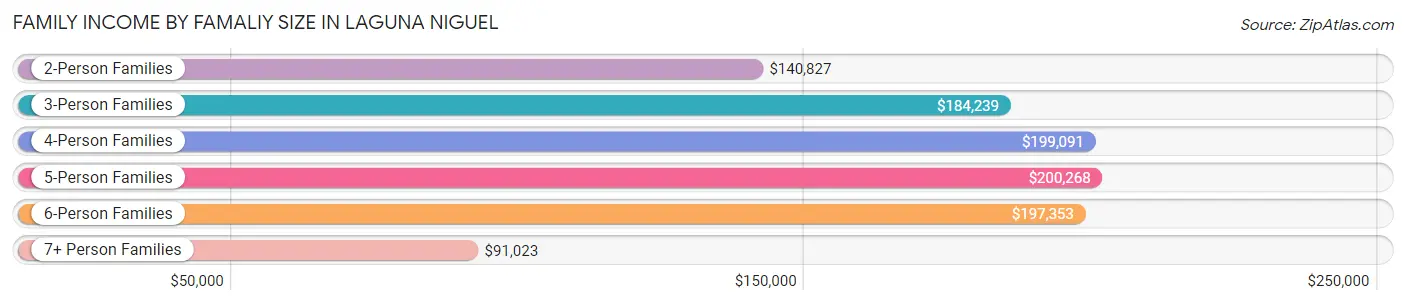
Family Income by Famaliy Size in Laguna Niguel
5-person families (1,089 | 6.1%) account for the highest median family income in Laguna Niguel with $200,268 per family, while 2-person families (9,194 | 51.7%) have the highest median income of $70,414 per family member.
| Income Bracket | # Families | Median Income |
| 2-Person Families | 9,194 (51.7%) | $140,827 |
| 3-Person Families | 4,083 (23.0%) | $184,239 |
| 4-Person Families | 2,974 (16.7%) | $199,091 |
| 5-Person Families | 1,089 (6.1%) | $200,268 |
| 6-Person Families | 234 (1.3%) | $197,353 |
| 7+ Person Families | 216 (1.2%) | $91,023 |
| Total | 17,790 (100.0%) | $162,215 |
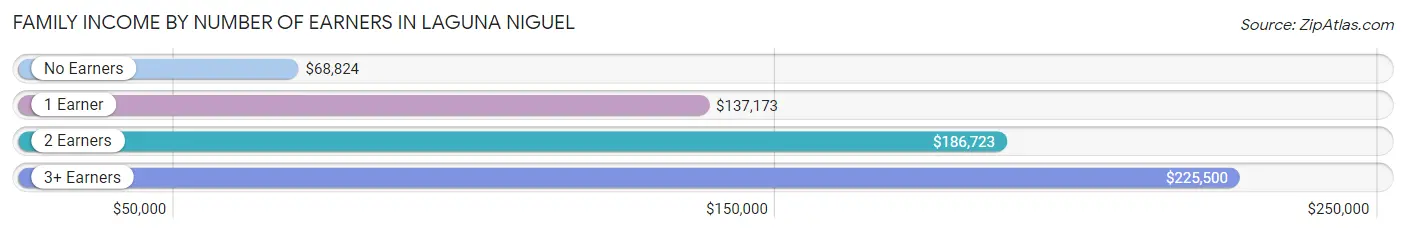
Family Income by Number of Earners in Laguna Niguel
The median family income in Laguna Niguel is $162,215, with families comprising 3+ earners (2,280) having the highest median family income of $225,500, while families with no earners (2,370) have the lowest median family income of $68,824, accounting for 12.8% and 13.3% of families, respectively.
| Number of Earners | # Families | Median Income |
| No Earners | 2,370 (13.3%) | $68,824 |
| 1 Earner | 5,801 (32.6%) | $137,173 |
| 2 Earners | 7,339 (41.2%) | $186,723 |
| 3+ Earners | 2,280 (12.8%) | $225,500 |
| Total | 17,790 (100.0%) | $162,215 |
Household Income in Laguna Niguel
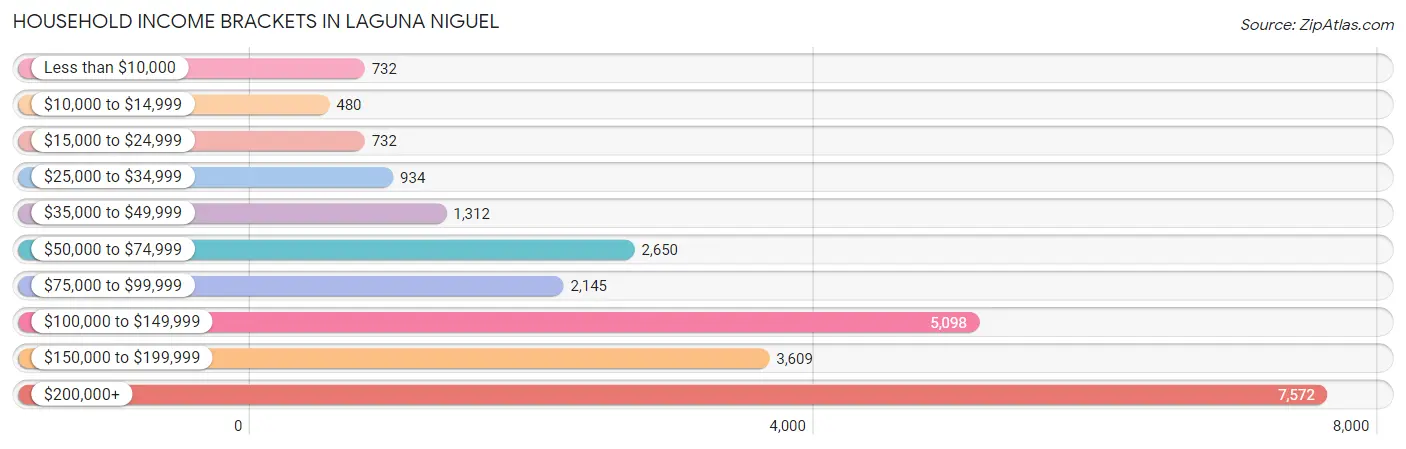
Household Income Brackets in Laguna Niguel
With 7,572 households falling in the category, the $200,000+ income range is the most frequent in Laguna Niguel, accounting for 30.0% of all households. In contrast, only 480 households (1.9%) fall into the $10,000 to $14,999 income bracket, making it the least populous group.
| Income Bracket | # Households | % Households |
| Less than $10,000 | 732 | 2.9% |
| $10,000 to $14,999 | 480 | 1.9% |
| $15,000 to $24,999 | 732 | 2.9% |
| $25,000 to $34,999 | 934 | 3.7% |
| $35,000 to $49,999 | 1,312 | 5.2% |
| $50,000 to $74,999 | 2,650 | 10.5% |
| $75,000 to $99,999 | 2,145 | 8.5% |
| $100,000 to $149,999 | 5,098 | 20.2% |
| $150,000 to $199,999 | 3,609 | 14.3% |
| $200,000+ | 7,572 | 30.0% |
Household Income by Householder Age in Laguna Niguel
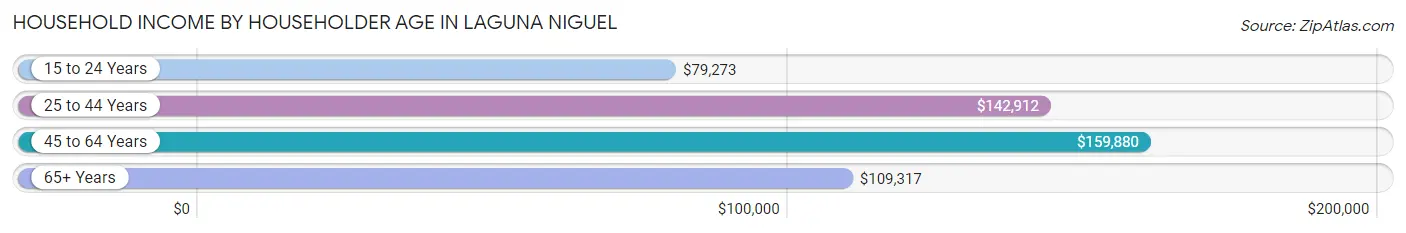
The median household income in Laguna Niguel is $135,822, with the highest median household income of $159,880 found in the 45 to 64 years age bracket for the primary householder. A total of 11,313 households (44.8%) fall into this category. Meanwhile, the 15 to 24 years age bracket for the primary householder has the lowest median household income of $79,273, with 619 households (2.5%) in this group.
| Income Bracket | # Households | Median Income |
| 15 to 24 Years | 619 (2.5%) | $79,273 |
| 25 to 44 Years | 5,698 (22.6%) | $142,912 |
| 45 to 64 Years | 11,313 (44.8%) | $159,880 |
| 65+ Years | 7,609 (30.1%) | $109,317 |
| Total | 25,239 (100.0%) | $135,822 |
Poverty in Laguna Niguel
Income Below Poverty by Sex and Age in Laguna Niguel
With 6.7% poverty level for males and 8.1% for females among the residents of Laguna Niguel, 15 year old males and 12 to 14 year old females are the most vulnerable to poverty, with 41 males (15.7%) and 202 females (19.5%) in their respective age groups living below the poverty level.
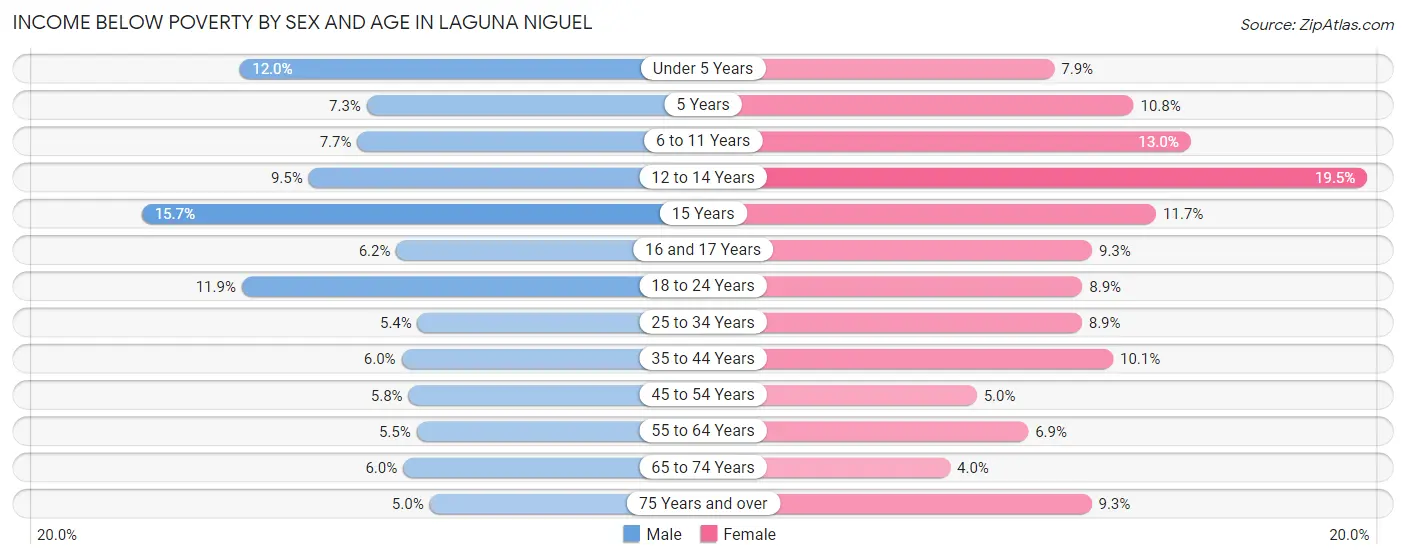
| Age Bracket | Male | Female |
| Under 5 Years | 133 (12.0%) | 93 (7.9%) |
| 5 Years | 26 (7.3%) | 13 (10.8%) |
| 6 to 11 Years | 153 (7.6%) | 229 (13.0%) |
| 12 to 14 Years | 106 (9.5%) | 202 (19.5%) |
| 15 Years | 41 (15.7%) | 30 (11.7%) |
| 16 and 17 Years | 62 (6.2%) | 50 (9.3%) |
| 18 to 24 Years | 281 (11.9%) | 283 (8.9%) |
| 25 to 34 Years | 207 (5.4%) | 303 (8.9%) |
| 35 to 44 Years | 197 (6.0%) | 380 (10.1%) |
| 45 to 54 Years | 239 (5.8%) | 230 (5.0%) |
| 55 to 64 Years | 285 (5.4%) | 449 (6.9%) |
| 65 to 74 Years | 238 (5.9%) | 165 (4.0%) |
| 75 Years and over | 115 (5.0%) | 239 (9.3%) |
| Total | 2,083 (6.7%) | 2,666 (8.1%) |
Income Above Poverty by Sex and Age in Laguna Niguel
According to the poverty statistics in Laguna Niguel, males aged 75 years and over and females aged 65 to 74 years are the age groups that are most secure financially, with 95.0% of males and 96.0% of females in these age groups living above the poverty line.
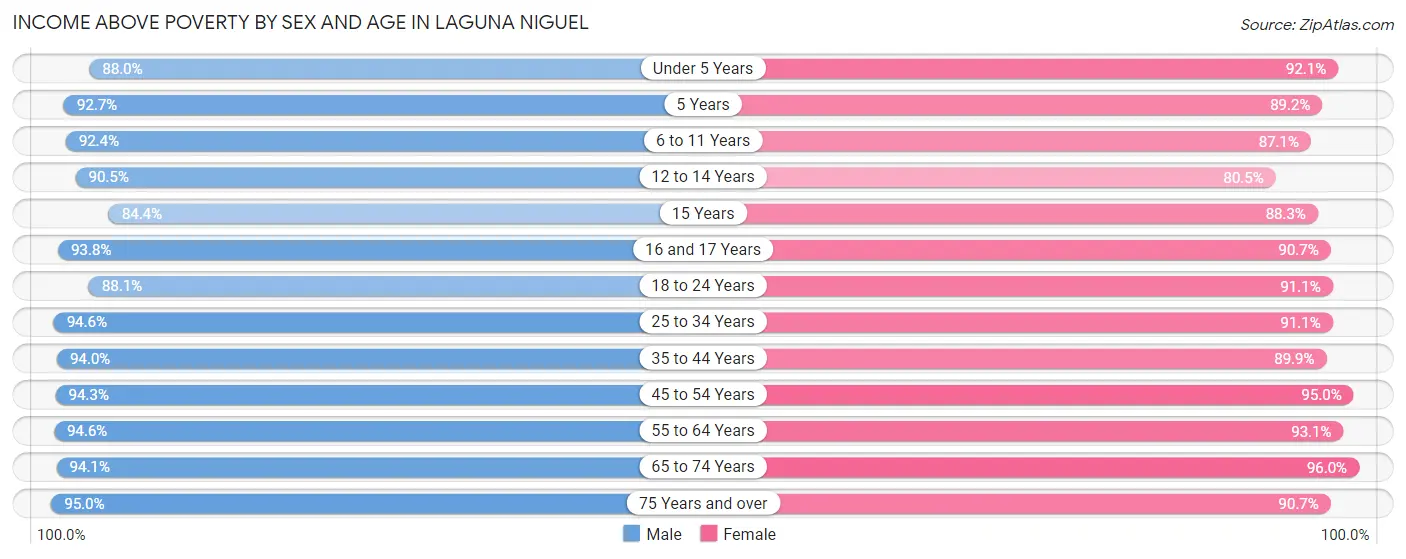
| Age Bracket | Male | Female |
| Under 5 Years | 973 (88.0%) | 1,085 (92.1%) |
| 5 Years | 330 (92.7%) | 107 (89.2%) |
| 6 to 11 Years | 1,846 (92.3%) | 1,540 (87.1%) |
| 12 to 14 Years | 1,015 (90.5%) | 834 (80.5%) |
| 15 Years | 221 (84.4%) | 227 (88.3%) |
| 16 and 17 Years | 938 (93.8%) | 488 (90.7%) |
| 18 to 24 Years | 2,072 (88.1%) | 2,885 (91.1%) |
| 25 to 34 Years | 3,617 (94.6%) | 3,098 (91.1%) |
| 35 to 44 Years | 3,083 (94.0%) | 3,395 (89.9%) |
| 45 to 54 Years | 3,918 (94.3%) | 4,363 (95.0%) |
| 55 to 64 Years | 4,949 (94.6%) | 6,040 (93.1%) |
| 65 to 74 Years | 3,763 (94.1%) | 3,936 (96.0%) |
| 75 Years and over | 2,199 (95.0%) | 2,340 (90.7%) |
| Total | 28,924 (93.3%) | 30,338 (91.9%) |
Income Below Poverty Among Married-Couple Families in Laguna Niguel
The poverty statistics for married-couple families in Laguna Niguel show that 3.4% or 493 of the total 14,449 families live below the poverty line. Families with 5 or more children have the highest poverty rate of 100.0%, comprising of 33 families. On the other hand, families with no children have the lowest poverty rate of 2.0%, which includes 189 families.
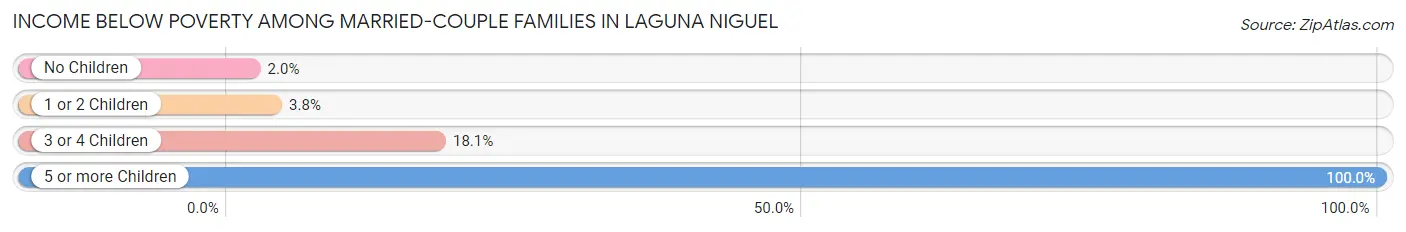
| Children | Above Poverty | Below Poverty |
| No Children | 9,404 (98.0%) | 189 (2.0%) |
| 1 or 2 Children | 4,059 (96.2%) | 162 (3.8%) |
| 3 or 4 Children | 493 (81.9%) | 109 (18.1%) |
| 5 or more Children | 0 (0.0%) | 33 (100.0%) |
| Total | 13,956 (96.6%) | 493 (3.4%) |
Income Below Poverty Among Single-Parent Households in Laguna Niguel
According to the poverty data in Laguna Niguel, 3.8% or 31 single-father households and 8.6% or 218 single-mother households are living below the poverty line. Among single-father households, those with 1 or 2 children have the highest poverty rate, with 17 households (4.0%) experiencing poverty. Likewise, among single-mother households, those with 3 or 4 children have the highest poverty rate, with 29 households (30.5%) falling below the poverty line.
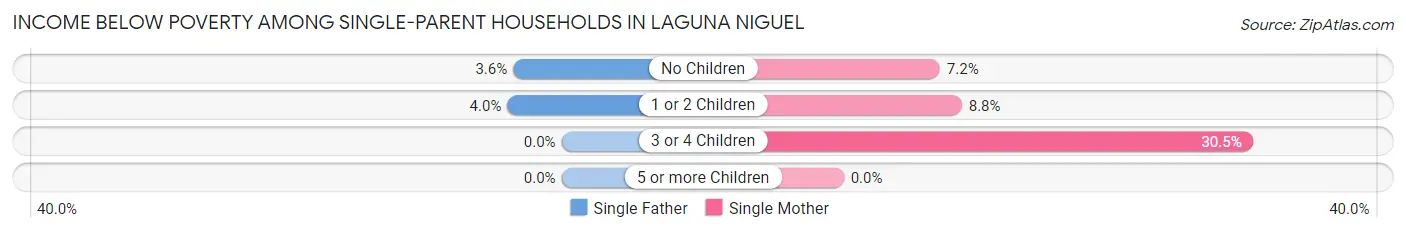
| Children | Single Father | Single Mother |
| No Children | 14 (3.6%) | 112 (7.2%) |
| 1 or 2 Children | 17 (4.0%) | 77 (8.8%) |
| 3 or 4 Children | 0 (0.0%) | 29 (30.5%) |
| 5 or more Children | 0 (0.0%) | 0 (0.0%) |
| Total | 31 (3.8%) | 218 (8.6%) |
Income Below Poverty Among Married-Couple vs Single-Parent Households in Laguna Niguel
The poverty data for Laguna Niguel shows that 493 of the married-couple family households (3.4%) and 249 of the single-parent households (7.4%) are living below the poverty level. Within the married-couple family households, those with 5 or more children have the highest poverty rate, with 33 households (100.0%) falling below the poverty line. Among the single-parent households, those with 3 or 4 children have the highest poverty rate, with 29 household (30.5%) living below poverty.
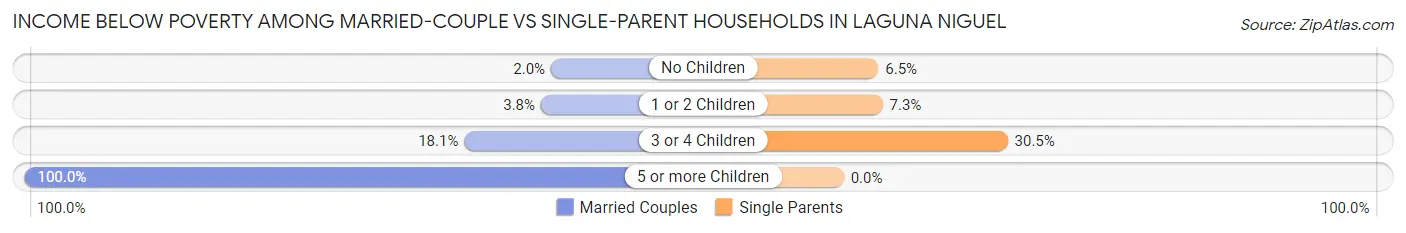
| Children | Married-Couple Families | Single-Parent Households |
| No Children | 189 (2.0%) | 126 (6.5%) |
| 1 or 2 Children | 162 (3.8%) | 94 (7.2%) |
| 3 or 4 Children | 109 (18.1%) | 29 (30.5%) |
| 5 or more Children | 33 (100.0%) | 0 (0.0%) |
| Total | 493 (3.4%) | 249 (7.4%) |
Race in Laguna Niguel
The most populous races in Laguna Niguel are White / Caucasian (44,679 | 69.5%), Hispanic or Latino (10,346 | 16.1%), and Asian (7,225 | 11.2%).
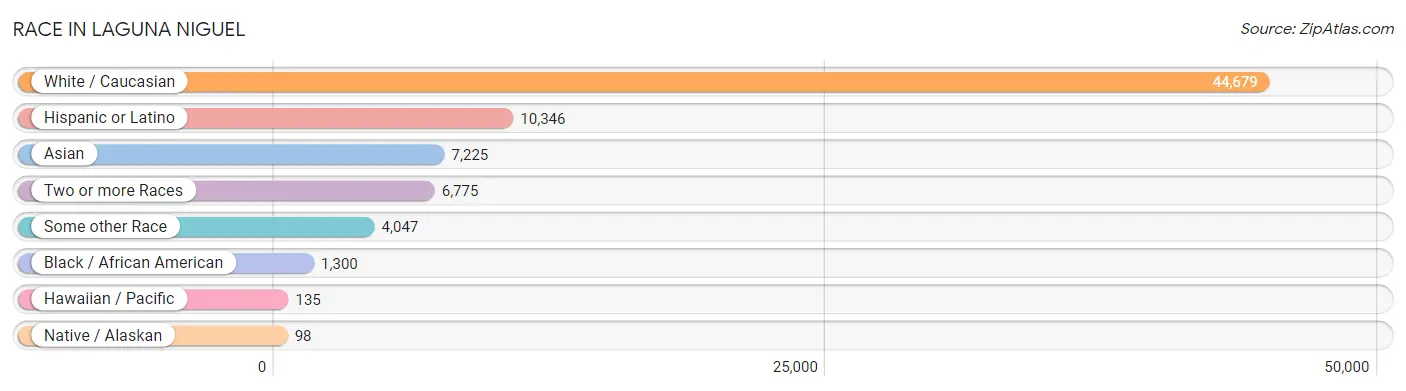
| Race | # Population | % Population |
| Asian | 7,225 | 11.2% |
| Black / African American | 1,300 | 2.0% |
| Hawaiian / Pacific | 135 | 0.2% |
| Hispanic or Latino | 10,346 | 16.1% |
| Native / Alaskan | 98 | 0.2% |
| White / Caucasian | 44,679 | 69.5% |
| Two or more Races | 6,775 | 10.5% |
| Some other Race | 4,047 | 6.3% |
| Total | 64,259 | 100.0% |
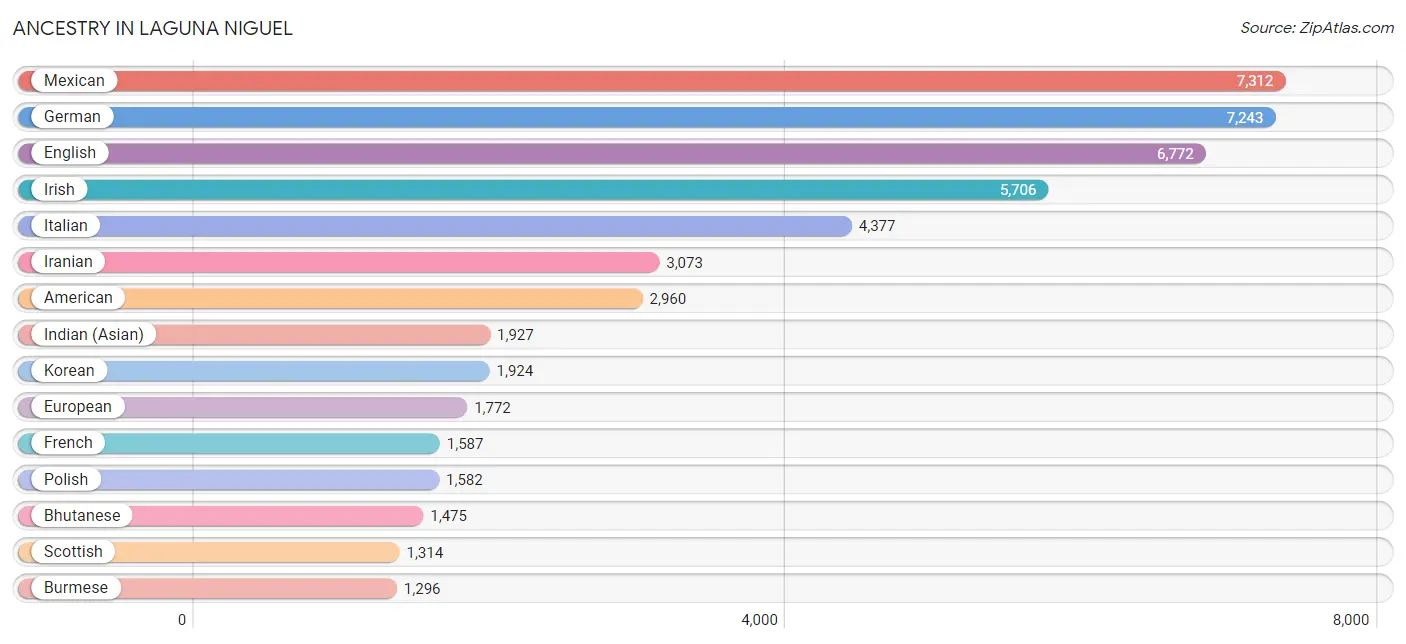
Ancestry in Laguna Niguel
The most populous ancestries reported in Laguna Niguel are Mexican (7,312 | 11.4%), German (7,243 | 11.3%), English (6,772 | 10.5%), Irish (5,706 | 8.9%), and Italian (4,377 | 6.8%), together accounting for 48.9% of all Laguna Niguel residents.
| Ancestry | # Population | % Population |
| Afghan | 267 | 0.4% |
| African | 38 | 0.1% |
| Alsatian | 11 | 0.0% |
| American | 2,960 | 4.6% |
| Arab | 603 | 0.9% |
| Argentinean | 194 | 0.3% |
| Armenian | 588 | 0.9% |
| Assyrian / Chaldean / Syriac | 25 | 0.0% |
| Australian | 92 | 0.1% |
| Austrian | 317 | 0.5% |
| Basque | 47 | 0.1% |
| Belgian | 37 | 0.1% |
| Bhutanese | 1,475 | 2.3% |
| Blackfeet | 10 | 0.0% |
| Bolivian | 58 | 0.1% |
| Brazilian | 131 | 0.2% |
| British | 729 | 1.1% |
| Bulgarian | 43 | 0.1% |
| Burmese | 1,296 | 2.0% |
| Cajun | 11 | 0.0% |
| Canadian | 263 | 0.4% |
| Cape Verdean | 11 | 0.0% |
| Celtic | 8 | 0.0% |
| Central American | 677 | 1.1% |
| Central American Indian | 8 | 0.0% |
| Cherokee | 145 | 0.2% |
| Chippewa | 9 | 0.0% |
| Choctaw | 24 | 0.0% |
| Colombian | 152 | 0.2% |
| Costa Rican | 95 | 0.2% |
| Creek | 1 | 0.0% |
| Croatian | 112 | 0.2% |
| Cuban | 212 | 0.3% |
| Czech | 334 | 0.5% |
| Czechoslovakian | 111 | 0.2% |
| Danish | 513 | 0.8% |
| Dominican | 10 | 0.0% |
| Dutch | 750 | 1.2% |
| Eastern European | 415 | 0.6% |
| Ecuadorian | 142 | 0.2% |
| Egyptian | 154 | 0.2% |
| English | 6,772 | 10.5% |
| Estonian | 21 | 0.0% |
| European | 1,772 | 2.8% |
| Filipino | 286 | 0.4% |
| Finnish | 65 | 0.1% |
| French | 1,587 | 2.5% |
| French Canadian | 117 | 0.2% |
| German | 7,243 | 11.3% |
| Greek | 356 | 0.5% |
| Guamanian / Chamorro | 60 | 0.1% |
| Guatemalan | 54 | 0.1% |
| Haitian | 12 | 0.0% |
| Honduran | 15 | 0.0% |
| Hungarian | 413 | 0.6% |
| Icelander | 16 | 0.0% |
| Indian (Asian) | 1,927 | 3.0% |
| Iranian | 3,073 | 4.8% |
| Irish | 5,706 | 8.9% |
| Iroquois | 99 | 0.2% |
| Israeli | 110 | 0.2% |
| Italian | 4,377 | 6.8% |
| Jamaican | 38 | 0.1% |
| Jordanian | 12 | 0.0% |
| Kenyan | 98 | 0.2% |
| Korean | 1,924 | 3.0% |
| Laotian | 56 | 0.1% |
| Latvian | 22 | 0.0% |
| Lebanese | 138 | 0.2% |
| Lithuanian | 129 | 0.2% |
| Macedonian | 20 | 0.0% |
| Malaysian | 49 | 0.1% |
| Maltese | 10 | 0.0% |
| Mexican | 7,312 | 11.4% |
| Mexican American Indian | 122 | 0.2% |
| Mongolian | 35 | 0.1% |
| Native Hawaiian | 225 | 0.4% |
| New Zealander | 88 | 0.1% |
| Nicaraguan | 79 | 0.1% |
| Nigerian | 14 | 0.0% |
| Northern European | 232 | 0.4% |
| Norwegian | 1,016 | 1.6% |
| Pakistani | 152 | 0.2% |
| Palestinian | 21 | 0.0% |
| Panamanian | 68 | 0.1% |
| Pennsylvania German | 19 | 0.0% |
| Peruvian | 336 | 0.5% |
| Polish | 1,582 | 2.5% |
| Portuguese | 173 | 0.3% |
| Potawatomi | 11 | 0.0% |
| Puerto Rican | 439 | 0.7% |
| Romanian | 191 | 0.3% |
| Russian | 1,129 | 1.8% |
| Salvadoran | 366 | 0.6% |
| Samoan | 101 | 0.2% |
| Scandinavian | 235 | 0.4% |
| Scotch-Irish | 570 | 0.9% |
| Scottish | 1,314 | 2.0% |
| Serbian | 112 | 0.2% |
| Sioux | 18 | 0.0% |
| Slavic | 156 | 0.2% |
| Slovak | 109 | 0.2% |
| Slovene | 58 | 0.1% |
| South African | 19 | 0.0% |
| South American | 1,013 | 1.6% |
| Spaniard | 390 | 0.6% |
| Spanish | 123 | 0.2% |
| Sri Lankan | 1,081 | 1.7% |
| Subsaharan African | 180 | 0.3% |
| Swedish | 943 | 1.5% |
| Swiss | 135 | 0.2% |
| Syrian | 122 | 0.2% |
| Thai | 800 | 1.2% |
| Trinidadian and Tobagonian | 20 | 0.0% |
| Turkish | 277 | 0.4% |
| Ukrainian | 279 | 0.4% |
| Venezuelan | 131 | 0.2% |
| Welsh | 399 | 0.6% |
| Yaqui | 63 | 0.1% |
| Yugoslavian | 14 | 0.0% | View All 120 Rows |
Immigrants in Laguna Niguel
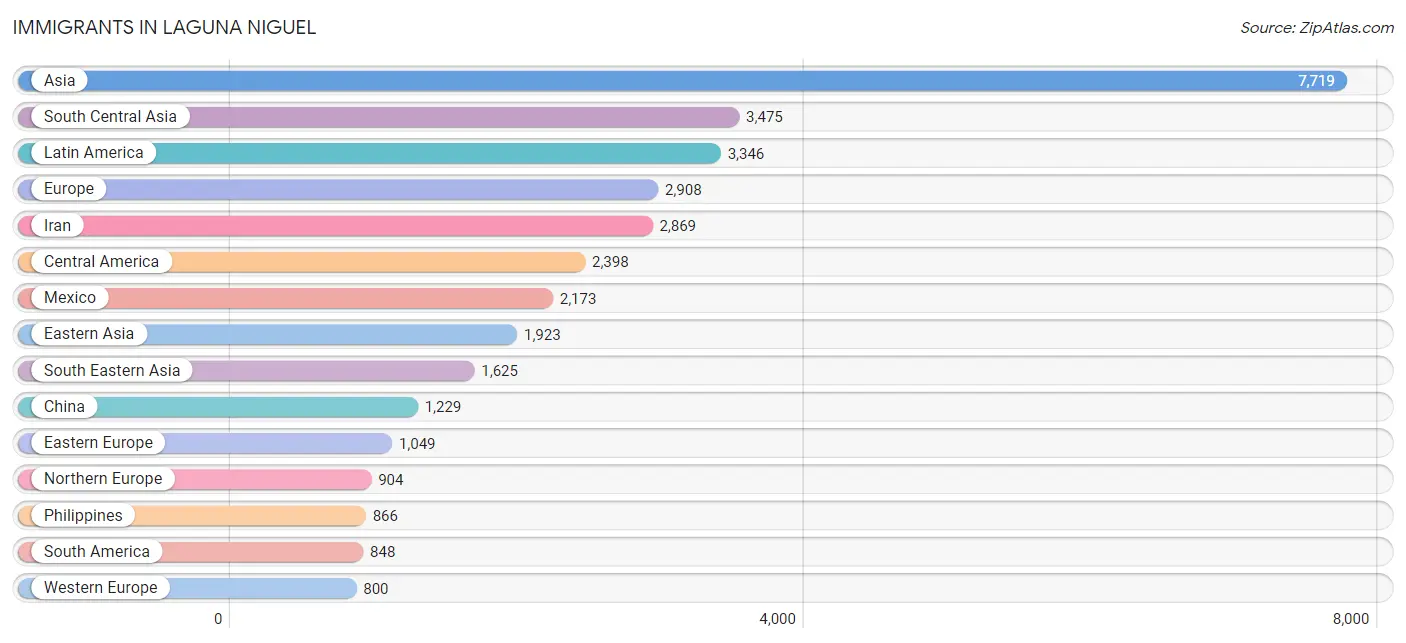
The most numerous immigrant groups reported in Laguna Niguel came from Asia (7,719 | 12.0%), South Central Asia (3,475 | 5.4%), Latin America (3,346 | 5.2%), Europe (2,908 | 4.5%), and Iran (2,869 | 4.5%), together accounting for 31.6% of all Laguna Niguel residents.
| Immigration Origin | # Population | % Population |
| Afghanistan | 209 | 0.3% |
| Africa | 427 | 0.7% |
| Argentina | 189 | 0.3% |
| Armenia | 76 | 0.1% |
| Asia | 7,719 | 12.0% |
| Australia | 81 | 0.1% |
| Austria | 15 | 0.0% |
| Belarus | 57 | 0.1% |
| Belgium | 37 | 0.1% |
| Belize | 25 | 0.0% |
| Bolivia | 26 | 0.0% |
| Brazil | 66 | 0.1% |
| Bulgaria | 131 | 0.2% |
| Canada | 401 | 0.6% |
| Caribbean | 100 | 0.2% |
| Central America | 2,398 | 3.7% |
| Chile | 10 | 0.0% |
| China | 1,229 | 1.9% |
| Colombia | 153 | 0.2% |
| Costa Rica | 48 | 0.1% |
| Croatia | 23 | 0.0% |
| Cuba | 34 | 0.1% |
| Czechoslovakia | 60 | 0.1% |
| Denmark | 7 | 0.0% |
| Dominican Republic | 46 | 0.1% |
| Eastern Africa | 77 | 0.1% |
| Eastern Asia | 1,923 | 3.0% |
| Eastern Europe | 1,049 | 1.6% |
| Ecuador | 65 | 0.1% |
| Egypt | 201 | 0.3% |
| El Salvador | 78 | 0.1% |
| England | 67 | 0.1% |
| Europe | 2,908 | 4.5% |
| France | 61 | 0.1% |
| Germany | 622 | 1.0% |
| Greece | 7 | 0.0% |
| Guatemala | 33 | 0.1% |
| Hong Kong | 29 | 0.1% |
| Hungary | 53 | 0.1% |
| India | 386 | 0.6% |
| Indonesia | 32 | 0.1% |
| Iran | 2,869 | 4.5% |
| Ireland | 85 | 0.1% |
| Israel | 134 | 0.2% |
| Italy | 125 | 0.2% |
| Japan | 140 | 0.2% |
| Jordan | 34 | 0.1% |
| Kenya | 77 | 0.1% |
| Korea | 554 | 0.9% |
| Latin America | 3,346 | 5.2% |
| Lebanon | 96 | 0.2% |
| Malaysia | 46 | 0.1% |
| Mexico | 2,173 | 3.4% |
| Moldova | 37 | 0.1% |
| Netherlands | 65 | 0.1% |
| Nicaragua | 29 | 0.1% |
| Northern Africa | 201 | 0.3% |
| Northern Europe | 904 | 1.4% |
| Norway | 8 | 0.0% |
| Oceania | 183 | 0.3% |
| Panama | 12 | 0.0% |
| Peru | 302 | 0.5% |
| Philippines | 866 | 1.3% |
| Poland | 121 | 0.2% |
| Portugal | 11 | 0.0% |
| Romania | 118 | 0.2% |
| Russia | 159 | 0.3% |
| Saudi Arabia | 29 | 0.1% |
| Scotland | 31 | 0.1% |
| Serbia | 73 | 0.1% |
| South Africa | 149 | 0.2% |
| South America | 848 | 1.3% |
| South Central Asia | 3,475 | 5.4% |
| South Eastern Asia | 1,625 | 2.5% |
| Southern Europe | 155 | 0.2% |
| Spain | 12 | 0.0% |
| Sri Lanka | 11 | 0.0% |
| Sweden | 44 | 0.1% |
| Syria | 152 | 0.2% |
| Taiwan | 416 | 0.6% |
| Thailand | 14 | 0.0% |
| Trinidad and Tobago | 20 | 0.0% |
| Turkey | 114 | 0.2% |
| Ukraine | 161 | 0.3% |
| Venezuela | 30 | 0.1% |
| Vietnam | 667 | 1.0% |
| Western Asia | 662 | 1.0% |
| Western Europe | 800 | 1.2% | View All 88 Rows |
Sex and Age in Laguna Niguel
Sex and Age in Laguna Niguel
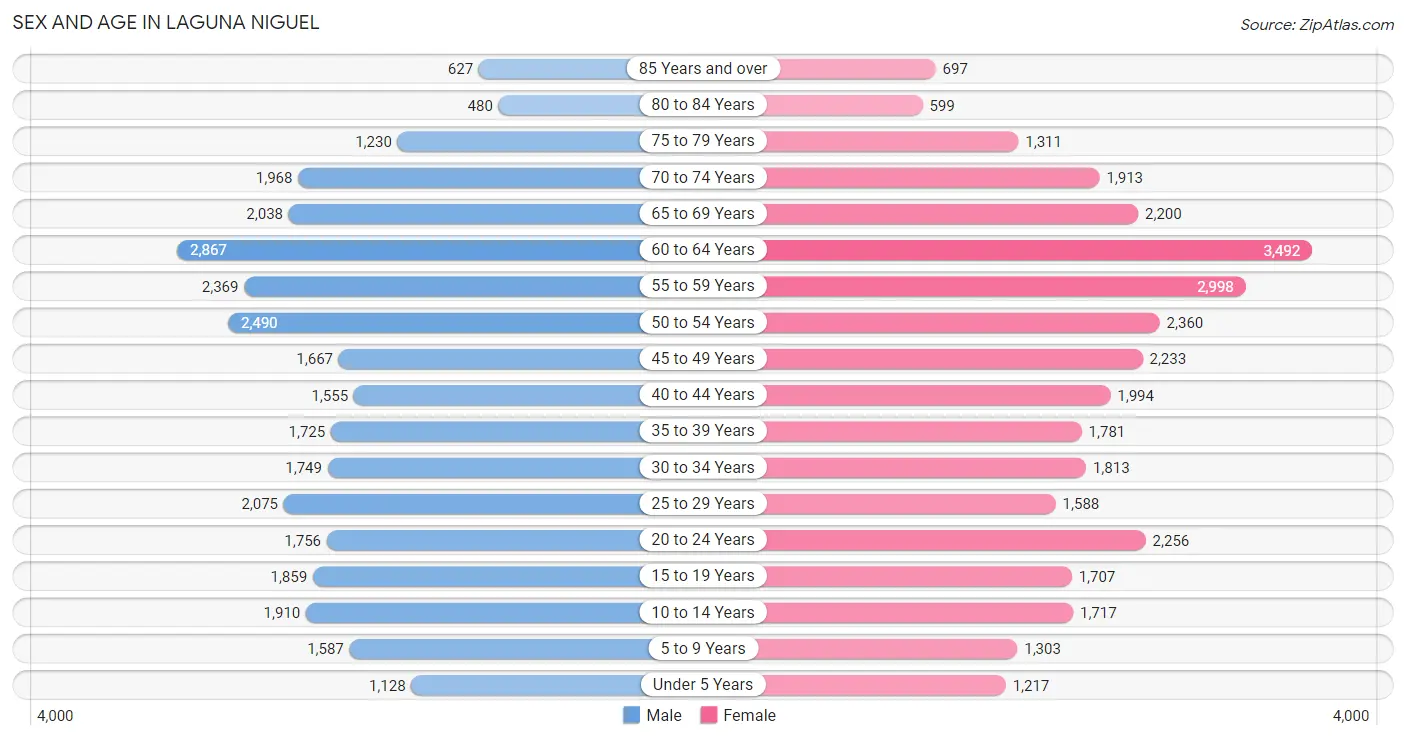
The most populous age groups in Laguna Niguel are 60 to 64 Years (2,867 | 9.2%) for men and 60 to 64 Years (3,492 | 10.5%) for women.
| Age Bracket | Male | Female |
| Under 5 Years | 1,128 (3.6%) | 1,217 (3.7%) |
| 5 to 9 Years | 1,587 (5.1%) | 1,303 (3.9%) |
| 10 to 14 Years | 1,910 (6.1%) | 1,717 (5.2%) |
| 15 to 19 Years | 1,859 (6.0%) | 1,707 (5.1%) |
| 20 to 24 Years | 1,756 (5.7%) | 2,256 (6.8%) |
| 25 to 29 Years | 2,075 (6.7%) | 1,588 (4.8%) |
| 30 to 34 Years | 1,749 (5.6%) | 1,813 (5.5%) |
| 35 to 39 Years | 1,725 (5.6%) | 1,781 (5.4%) |
| 40 to 44 Years | 1,555 (5.0%) | 1,994 (6.0%) |
| 45 to 49 Years | 1,667 (5.4%) | 2,233 (6.7%) |
| 50 to 54 Years | 2,490 (8.0%) | 2,360 (7.1%) |
| 55 to 59 Years | 2,369 (7.6%) | 2,998 (9.0%) |
| 60 to 64 Years | 2,867 (9.2%) | 3,492 (10.5%) |
| 65 to 69 Years | 2,038 (6.6%) | 2,200 (6.6%) |
| 70 to 74 Years | 1,968 (6.3%) | 1,913 (5.8%) |
| 75 to 79 Years | 1,230 (4.0%) | 1,311 (4.0%) |
| 80 to 84 Years | 480 (1.5%) | 599 (1.8%) |
| 85 Years and over | 627 (2.0%) | 697 (2.1%) |
| Total | 31,080 (100.0%) | 33,179 (100.0%) |
Families and Households in Laguna Niguel
Median Family Size in Laguna Niguel
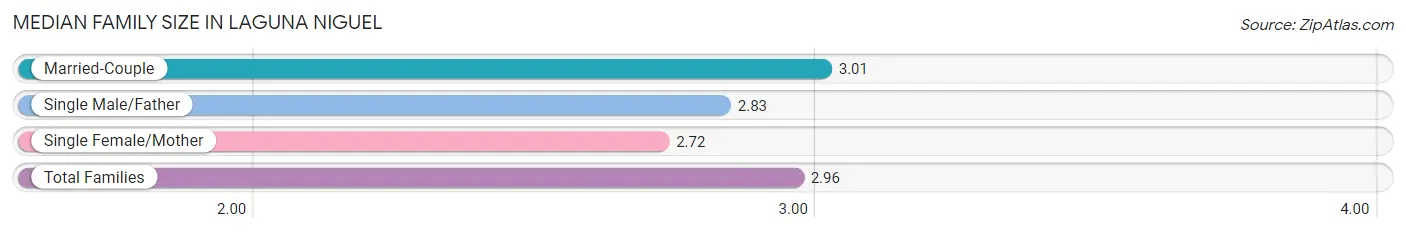
The median family size in Laguna Niguel is 2.96 persons per family, with married-couple families (14,449 | 81.2%) accounting for the largest median family size of 3.01 persons per family. On the other hand, single female/mother families (2,532 | 14.2%) represent the smallest median family size with 2.72 persons per family.
| Family Type | # Families | Family Size |
| Married-Couple | 14,449 (81.2%) | 3.01 |
| Single Male/Father | 809 (4.5%) | 2.83 |
| Single Female/Mother | 2,532 (14.2%) | 2.72 |
| Total Families | 17,790 (100.0%) | 2.96 |
Median Household Size in Laguna Niguel
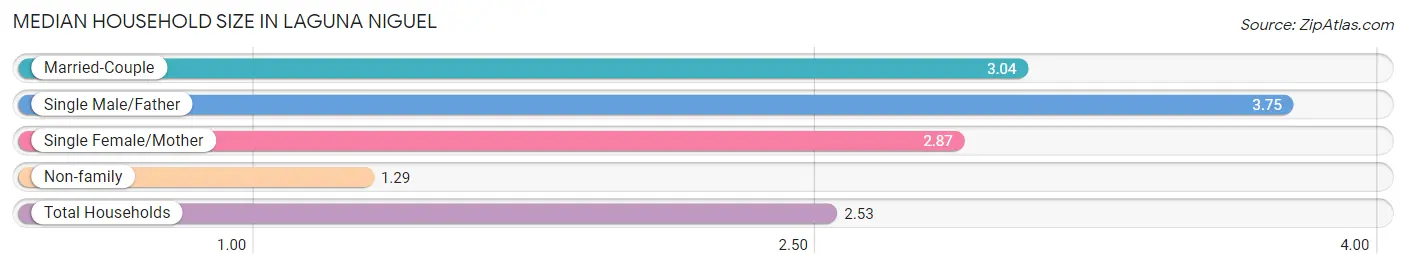
The median household size in Laguna Niguel is 2.53 persons per household, with single male/father households (809 | 3.2%) accounting for the largest median household size of 3.75 persons per household. non-family households (7,449 | 29.5%) represent the smallest median household size with 1.29 persons per household.
| Household Type | # Households | Household Size |
| Married-Couple | 14,449 (57.3%) | 3.04 |
| Single Male/Father | 809 (3.2%) | 3.75 |
| Single Female/Mother | 2,532 (10.0%) | 2.87 |
| Non-family | 7,449 (29.5%) | 1.29 |
| Total Households | 25,239 (100.0%) | 2.53 |
Household Size by Marriage Status in Laguna Niguel
Out of a total of 25,239 households in Laguna Niguel, 17,790 (70.5%) are family households, while 7,449 (29.5%) are nonfamily households. The most numerous type of family households are 2-person households, comprising 8,770, and the most common type of nonfamily households are 1-person households, comprising 5,787.
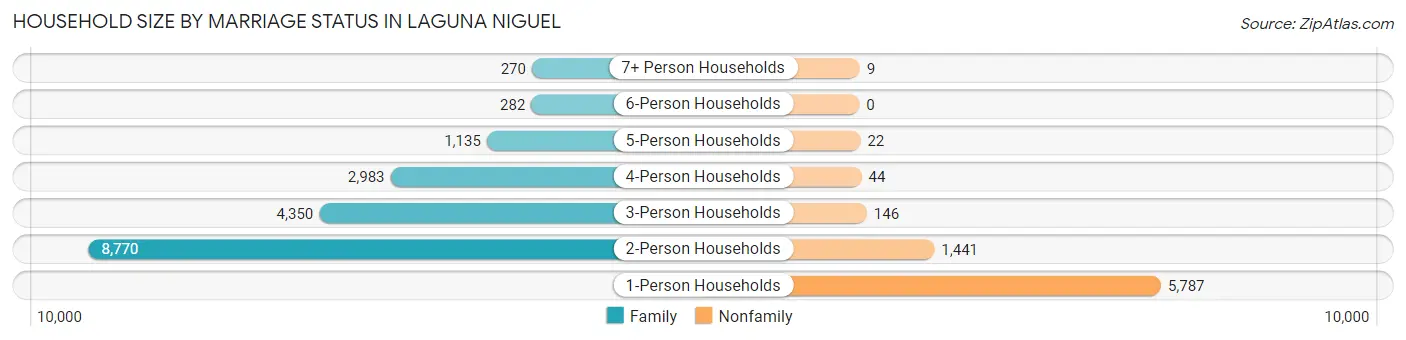
| Household Size | Family Households | Nonfamily Households |
| 1-Person Households | - | 5,787 (22.9%) |
| 2-Person Households | 8,770 (34.7%) | 1,441 (5.7%) |
| 3-Person Households | 4,350 (17.2%) | 146 (0.6%) |
| 4-Person Households | 2,983 (11.8%) | 44 (0.2%) |
| 5-Person Households | 1,135 (4.5%) | 22 (0.1%) |
| 6-Person Households | 282 (1.1%) | 0 (0.0%) |
| 7+ Person Households | 270 (1.1%) | 9 (0.0%) |
| Total | 17,790 (70.5%) | 7,449 (29.5%) |
Female Fertility in Laguna Niguel
Fertility by Age in Laguna Niguel
Average fertility rate in Laguna Niguel is 43.0 births per 1,000 women. Women in the age bracket of 20 to 34 years have the highest fertility rate with 51.0 births per 1,000 women. Women in the age bracket of 35 to 50 years acount for 51.1% of all women with births.
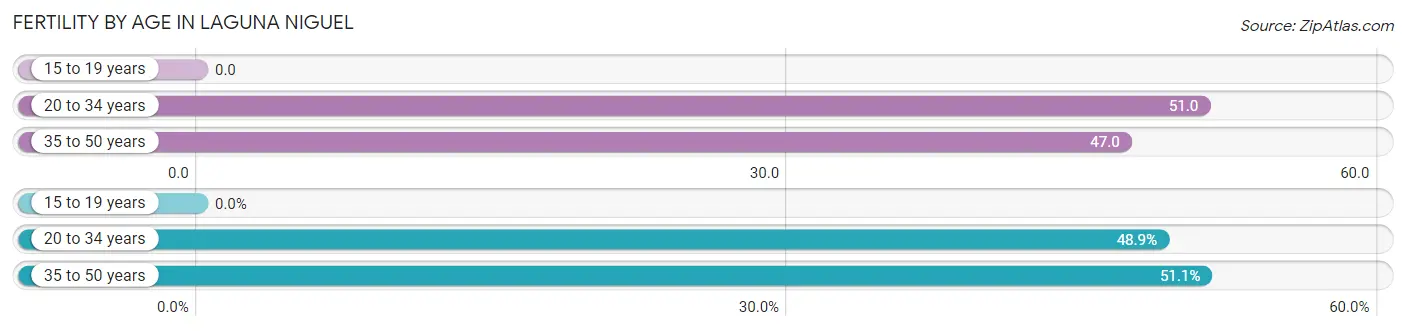
| Age Bracket | Women with Births | Births / 1,000 Women |
| 15 to 19 years | 0 (0.0%) | 0.0 |
| 20 to 34 years | 289 (48.9%) | 51.0 |
| 35 to 50 years | 302 (51.1%) | 47.0 |
| Total | 591 (100.0%) | 43.0 |
Fertility by Age by Marriage Status in Laguna Niguel
72.6% of women with births (591) in Laguna Niguel are married. The highest percentage of unmarried women with births falls into 20 to 34 years age bracket with 37.7% of them unmarried at the time of birth, while the lowest percentage of unmarried women with births belong to 35 to 50 years age bracket with 17.5% of them unmarried.
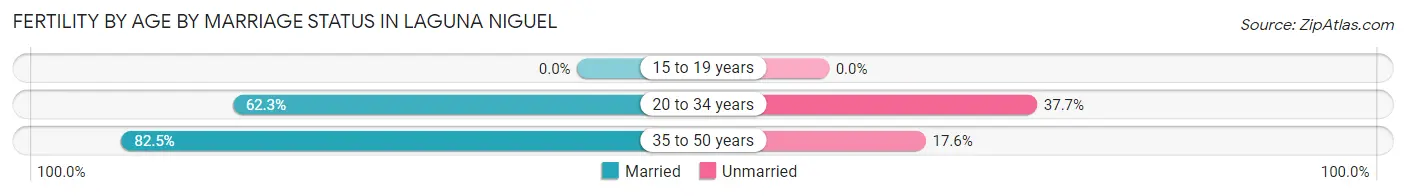
| Age Bracket | Married | Unmarried |
| 15 to 19 years | 0 (0.0%) | 0 (0.0%) |
| 20 to 34 years | 180 (62.3%) | 109 (37.7%) |
| 35 to 50 years | 249 (82.5%) | 53 (17.5%) |
| Total | 429 (72.6%) | 162 (27.4%) |
Fertility by Education in Laguna Niguel
Average fertility rate in Laguna Niguel is 43.0 births per 1,000 women. Women with the education attainment of graduate degree have the highest fertility rate of 87.0 births per 1,000 women, while women with the education attainment of less than high school have the lowest fertility at 20.0 births per 1,000 women. Women with the education attainment of graduate degree represent 35.2% of all women with births.
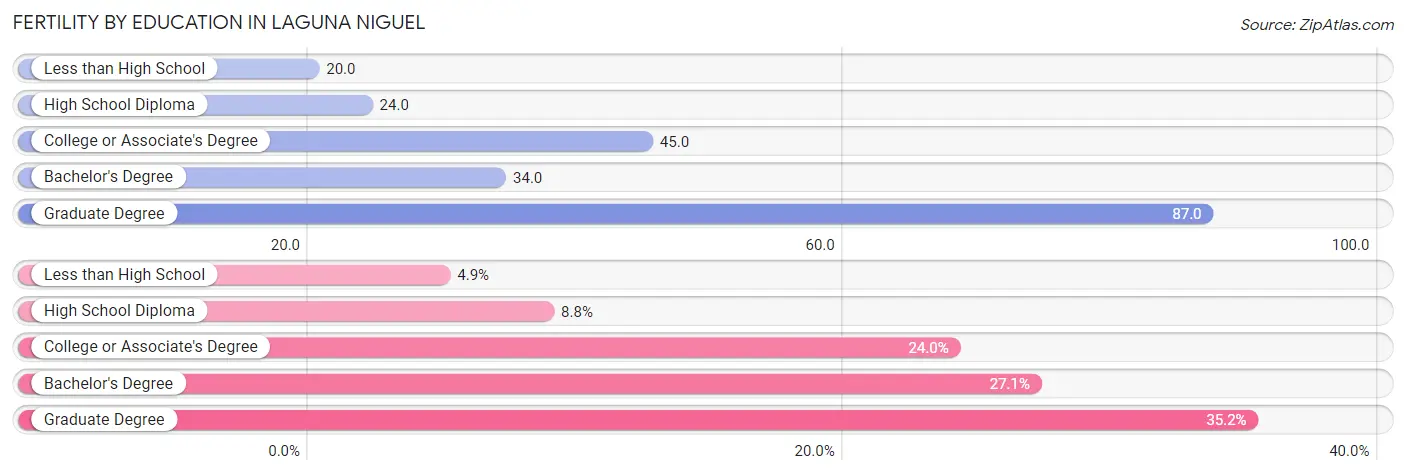
| Educational Attainment | Women with Births | Births / 1,000 Women |
| Less than High School | 29 (4.9%) | 20.0 |
| High School Diploma | 52 (8.8%) | 24.0 |
| College or Associate's Degree | 142 (24.0%) | 45.0 |
| Bachelor's Degree | 160 (27.1%) | 34.0 |
| Graduate Degree | 208 (35.2%) | 87.0 |
| Total | 591 (100.0%) | 43.0 |
Fertility by Education by Marriage Status in Laguna Niguel
27.4% of women with births in Laguna Niguel are unmarried. Women with the educational attainment of high school diploma are most likely to be married with 100.0% of them married at childbirth, while women with the educational attainment of less than high school are least likely to be married with 100.0% of them unmarried at childbirth.
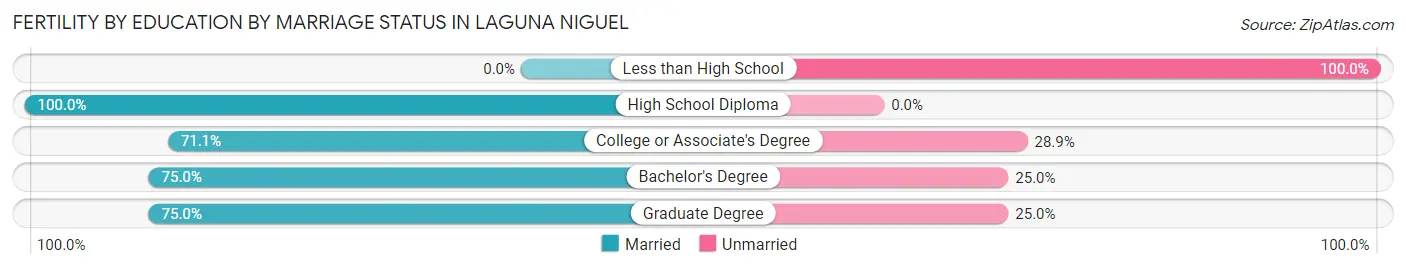
| Educational Attainment | Married | Unmarried |
| Less than High School | 0 (0.0%) | 29 (100.0%) |
| High School Diploma | 52 (100.0%) | 0 (0.0%) |
| College or Associate's Degree | 101 (71.1%) | 41 (28.9%) |
| Bachelor's Degree | 120 (75.0%) | 40 (25.0%) |
| Graduate Degree | 156 (75.0%) | 52 (25.0%) |
| Total | 429 (72.6%) | 162 (27.4%) |
Employment Characteristics in Laguna Niguel
Employment by Class of Employer in Laguna Niguel
Among the 33,910 employed individuals in Laguna Niguel, private company employees (22,984 | 67.8%), self-employed (not incorporated) (3,425 | 10.1%), and self-employed (incorporated) (2,424 | 7.1%) make up the most common classes of employment.
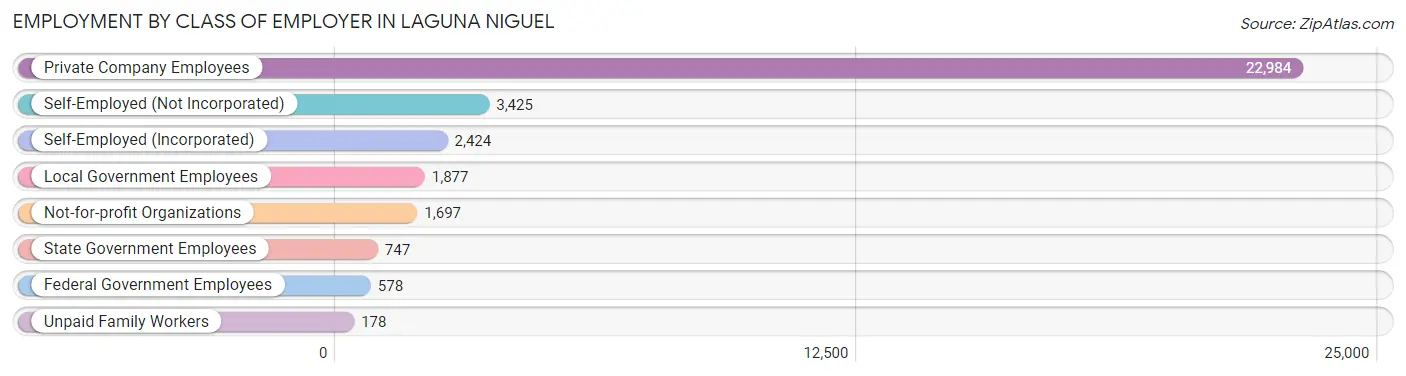
| Employer Class | # Employees | % Employees |
| Private Company Employees | 22,984 | 67.8% |
| Self-Employed (Incorporated) | 2,424 | 7.1% |
| Self-Employed (Not Incorporated) | 3,425 | 10.1% |
| Not-for-profit Organizations | 1,697 | 5.0% |
| Local Government Employees | 1,877 | 5.5% |
| State Government Employees | 747 | 2.2% |
| Federal Government Employees | 578 | 1.7% |
| Unpaid Family Workers | 178 | 0.5% |
| Total | 33,910 | 100.0% |
Employment Status by Age in Laguna Niguel
According to the labor force statistics for Laguna Niguel, out of the total population over 16 years of age (54,878), 66.2% or 36,329 individuals are in the labor force, with 5.5% or 1,998 of them unemployed. The age group with the highest labor force participation rate is 25 to 29 years, with 91.8% or 3,363 individuals in the labor force. Within the labor force, the 60 to 64 years age range has the highest percentage of unemployed individuals, with 11.0% or 464 of them being unemployed.
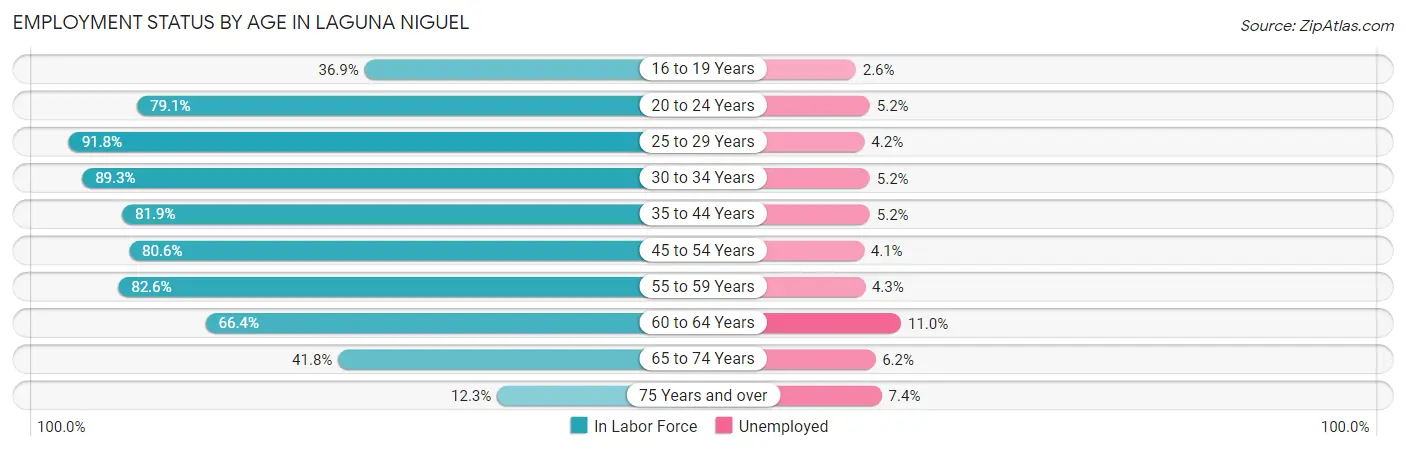
| Age Bracket | In Labor Force | Unemployed |
| 16 to 19 Years | 1,124 (36.9%) | 29 (2.6%) |
| 20 to 24 Years | 3,173 (79.1%) | 165 (5.2%) |
| 25 to 29 Years | 3,363 (91.8%) | 141 (4.2%) |
| 30 to 34 Years | 3,181 (89.3%) | 165 (5.2%) |
| 35 to 44 Years | 5,778 (81.9%) | 300 (5.2%) |
| 45 to 54 Years | 7,052 (80.6%) | 289 (4.1%) |
| 55 to 59 Years | 4,433 (82.6%) | 191 (4.3%) |
| 60 to 64 Years | 4,222 (66.4%) | 464 (11.0%) |
| 65 to 74 Years | 3,394 (41.8%) | 210 (6.2%) |
| 75 Years and over | 608 (12.3%) | 45 (7.4%) |
| Total | 36,329 (66.2%) | 1,998 (5.5%) |
Employment Status by Educational Attainment in Laguna Niguel
According to labor force statistics for Laguna Niguel, 80.6% of individuals (28,013) out of the total population between 25 and 64 years of age (34,756) are in the labor force, with 5.5% or 1,541 of them being unemployed. The group with the highest labor force participation rate are those with the educational attainment of bachelor's degree or higher, with 83.9% or 17,164 individuals in the labor force. Within the labor force, individuals with high school diploma education have the highest percentage of unemployment, with 9.0% or 311 of them being unemployed.
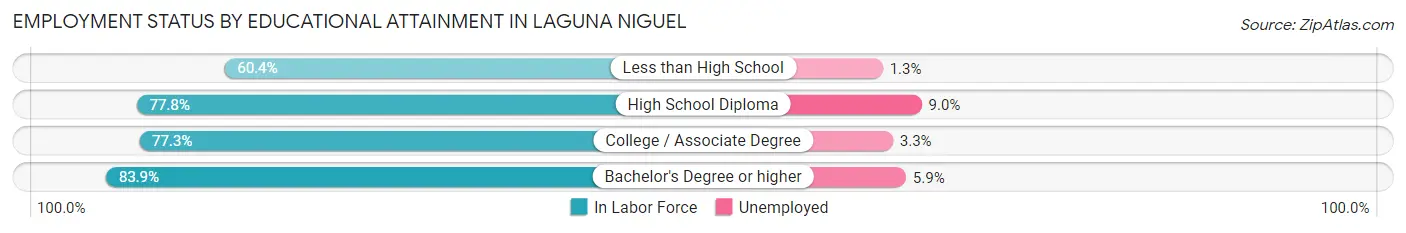
| Educational Attainment | In Labor Force | Unemployed |
| Less than High School | 766 (60.4%) | 16 (1.3%) |
| High School Diploma | 3,454 (77.8%) | 400 (9.0%) |
| College / Associate Degree | 6,639 (77.3%) | 283 (3.3%) |
| Bachelor's Degree or higher | 17,164 (83.9%) | 1,207 (5.9%) |
| Total | 28,013 (80.6%) | 1,912 (5.5%) |
Employment Occupations by Sex in Laguna Niguel
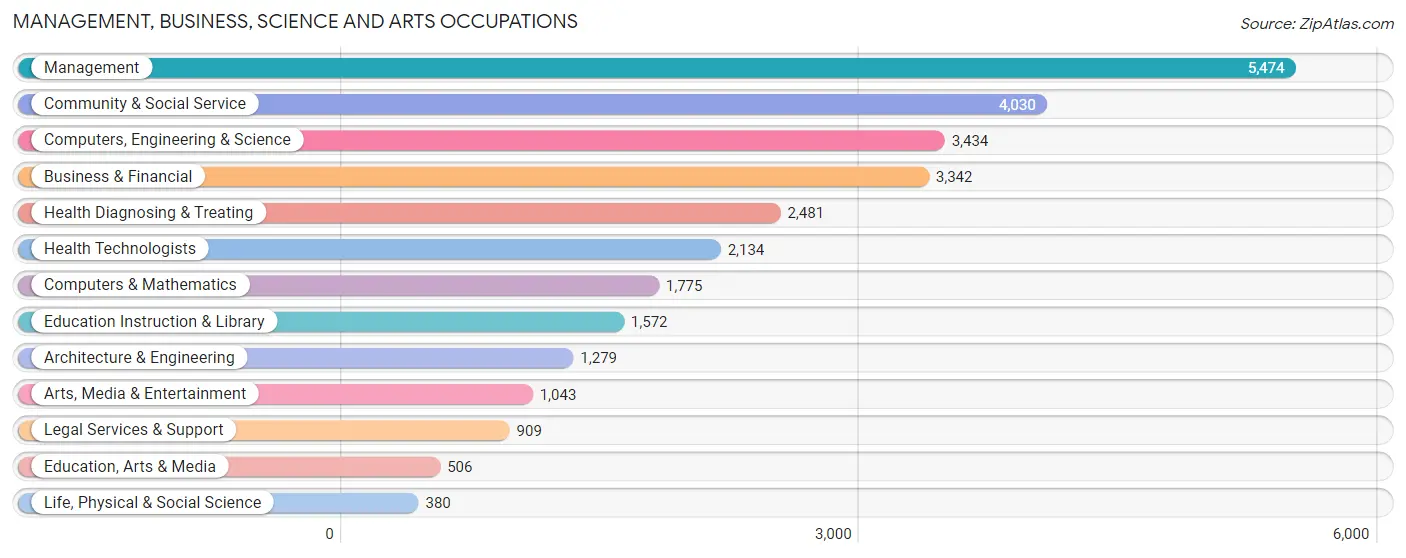
Management, Business, Science and Arts Occupations
The most common Management, Business, Science and Arts occupations in Laguna Niguel are Management (5,474 | 16.0%), Community & Social Service (4,030 | 11.8%), Computers, Engineering & Science (3,434 | 10.0%), Business & Financial (3,342 | 9.8%), and Health Diagnosing & Treating (2,481 | 7.2%).
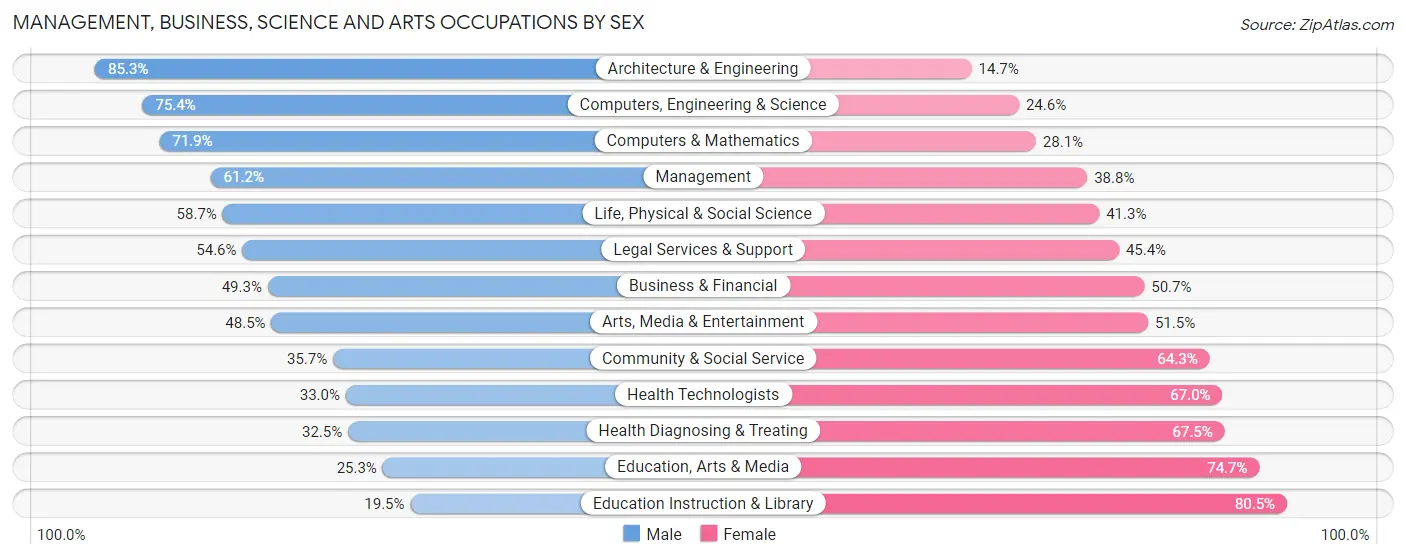
Management, Business, Science and Arts Occupations by Sex
Within the Management, Business, Science and Arts occupations in Laguna Niguel, the most male-oriented occupations are Architecture & Engineering (85.3%), Computers, Engineering & Science (75.4%), and Computers & Mathematics (71.9%), while the most female-oriented occupations are Education Instruction & Library (80.5%), Education, Arts & Media (74.7%), and Health Diagnosing & Treating (67.5%).
| Occupation | Male | Female |
| Management | 3,349 (61.2%) | 2,125 (38.8%) |
| Business & Financial | 1,647 (49.3%) | 1,695 (50.7%) |
| Computers, Engineering & Science | 2,590 (75.4%) | 844 (24.6%) |
| Computers & Mathematics | 1,276 (71.9%) | 499 (28.1%) |
| Architecture & Engineering | 1,091 (85.3%) | 188 (14.7%) |
| Life, Physical & Social Science | 223 (58.7%) | 157 (41.3%) |
| Community & Social Service | 1,437 (35.7%) | 2,593 (64.3%) |
| Education, Arts & Media | 128 (25.3%) | 378 (74.7%) |
| Legal Services & Support | 496 (54.6%) | 413 (45.4%) |
| Education Instruction & Library | 307 (19.5%) | 1,265 (80.5%) |
| Arts, Media & Entertainment | 506 (48.5%) | 537 (51.5%) |
| Health Diagnosing & Treating | 807 (32.5%) | 1,674 (67.5%) |
| Health Technologists | 704 (33.0%) | 1,430 (67.0%) |
| Total (Category) | 9,830 (52.4%) | 8,931 (47.6%) |
| Total (Overall) | 17,681 (51.7%) | 16,537 (48.3%) |
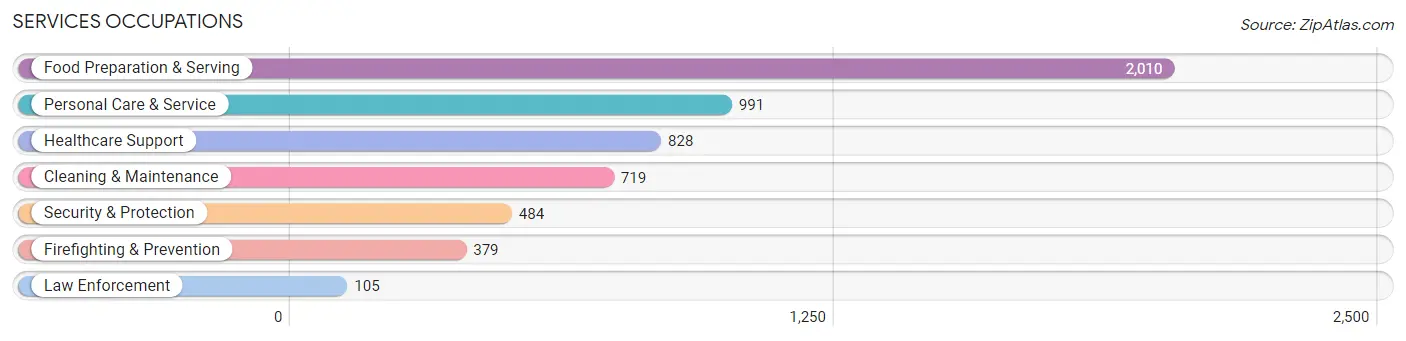
Services Occupations
The most common Services occupations in Laguna Niguel are Food Preparation & Serving (2,010 | 5.9%), Personal Care & Service (991 | 2.9%), Healthcare Support (828 | 2.4%), Cleaning & Maintenance (719 | 2.1%), and Security & Protection (484 | 1.4%).
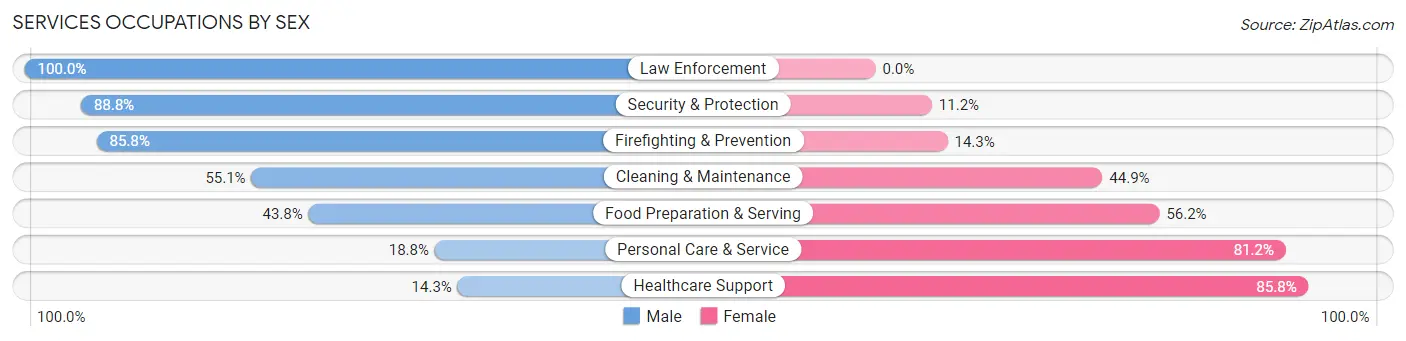
Services Occupations by Sex
Within the Services occupations in Laguna Niguel, the most male-oriented occupations are Law Enforcement (100.0%), Security & Protection (88.8%), and Firefighting & Prevention (85.8%), while the most female-oriented occupations are Healthcare Support (85.8%), Personal Care & Service (81.2%), and Food Preparation & Serving (56.2%).
| Occupation | Male | Female |
| Healthcare Support | 118 (14.2%) | 710 (85.8%) |
| Security & Protection | 430 (88.8%) | 54 (11.2%) |
| Firefighting & Prevention | 325 (85.8%) | 54 (14.2%) |
| Law Enforcement | 105 (100.0%) | 0 (0.0%) |
| Food Preparation & Serving | 880 (43.8%) | 1,130 (56.2%) |
| Cleaning & Maintenance | 396 (55.1%) | 323 (44.9%) |
| Personal Care & Service | 186 (18.8%) | 805 (81.2%) |
| Total (Category) | 2,010 (39.9%) | 3,022 (60.1%) |
| Total (Overall) | 17,681 (51.7%) | 16,537 (48.3%) |
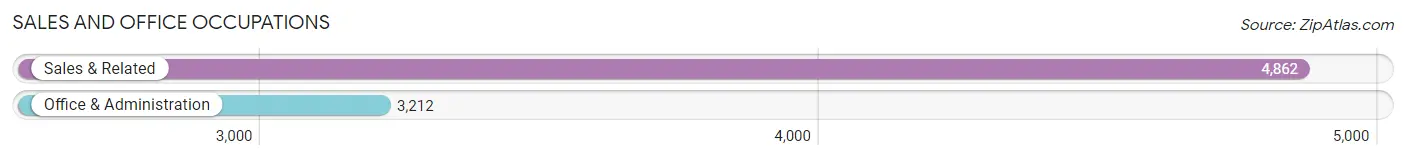
Sales and Office Occupations
The most common Sales and Office occupations in Laguna Niguel are Sales & Related (4,862 | 14.2%), and Office & Administration (3,212 | 9.4%).
Sales and Office Occupations by Sex
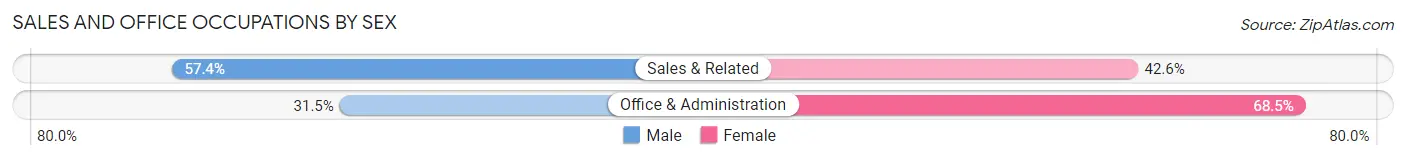
| Occupation | Male | Female |
| Sales & Related | 2,790 (57.4%) | 2,072 (42.6%) |
| Office & Administration | 1,013 (31.5%) | 2,199 (68.5%) |
| Total (Category) | 3,803 (47.1%) | 4,271 (52.9%) |
| Total (Overall) | 17,681 (51.7%) | 16,537 (48.3%) |
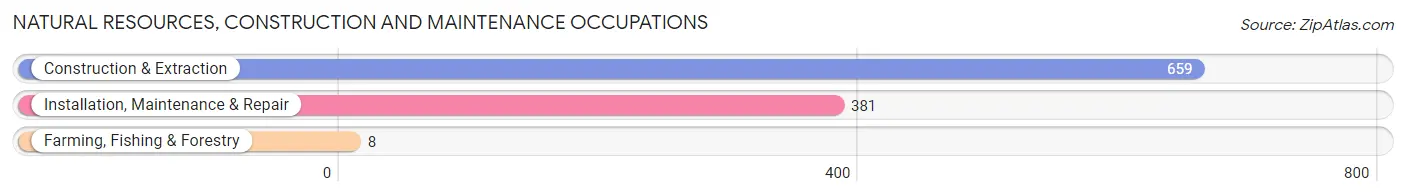
Natural Resources, Construction and Maintenance Occupations
The most common Natural Resources, Construction and Maintenance occupations in Laguna Niguel are Construction & Extraction (659 | 1.9%), Installation, Maintenance & Repair (381 | 1.1%), and Farming, Fishing & Forestry (8 | 0.0%).
Natural Resources, Construction and Maintenance Occupations by Sex
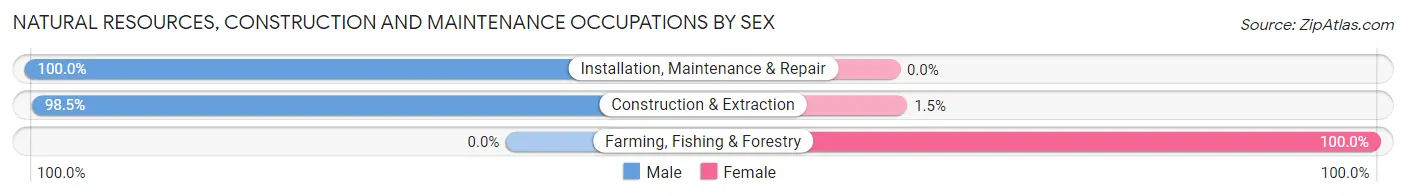
| Occupation | Male | Female |
| Farming, Fishing & Forestry | 0 (0.0%) | 8 (100.0%) |
| Construction & Extraction | 649 (98.5%) | 10 (1.5%) |
| Installation, Maintenance & Repair | 381 (100.0%) | 0 (0.0%) |
| Total (Category) | 1,030 (98.3%) | 18 (1.7%) |
| Total (Overall) | 17,681 (51.7%) | 16,537 (48.3%) |
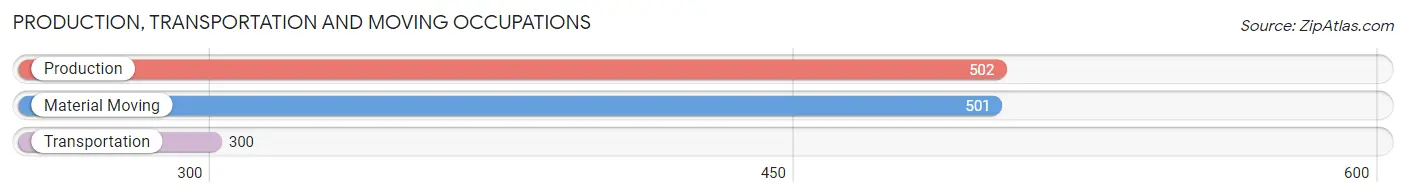
Production, Transportation and Moving Occupations
The most common Production, Transportation and Moving occupations in Laguna Niguel are Production (502 | 1.5%), Material Moving (501 | 1.5%), and Transportation (300 | 0.9%).
Production, Transportation and Moving Occupations by Sex
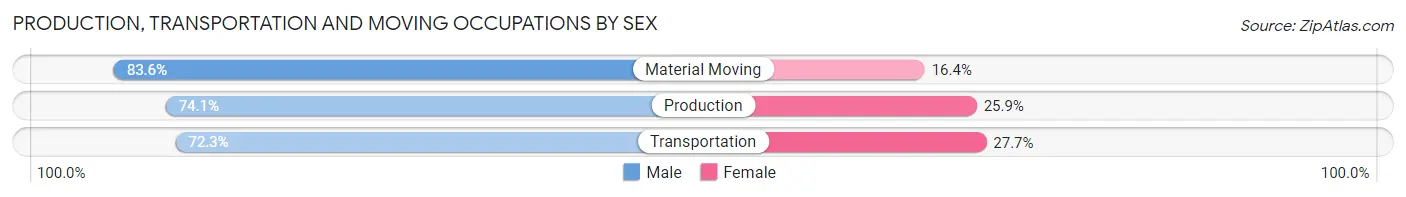
| Occupation | Male | Female |
| Production | 372 (74.1%) | 130 (25.9%) |
| Transportation | 217 (72.3%) | 83 (27.7%) |
| Material Moving | 419 (83.6%) | 82 (16.4%) |
| Total (Category) | 1,008 (77.4%) | 295 (22.6%) |
| Total (Overall) | 17,681 (51.7%) | 16,537 (48.3%) |
Employment Industries by Sex in Laguna Niguel
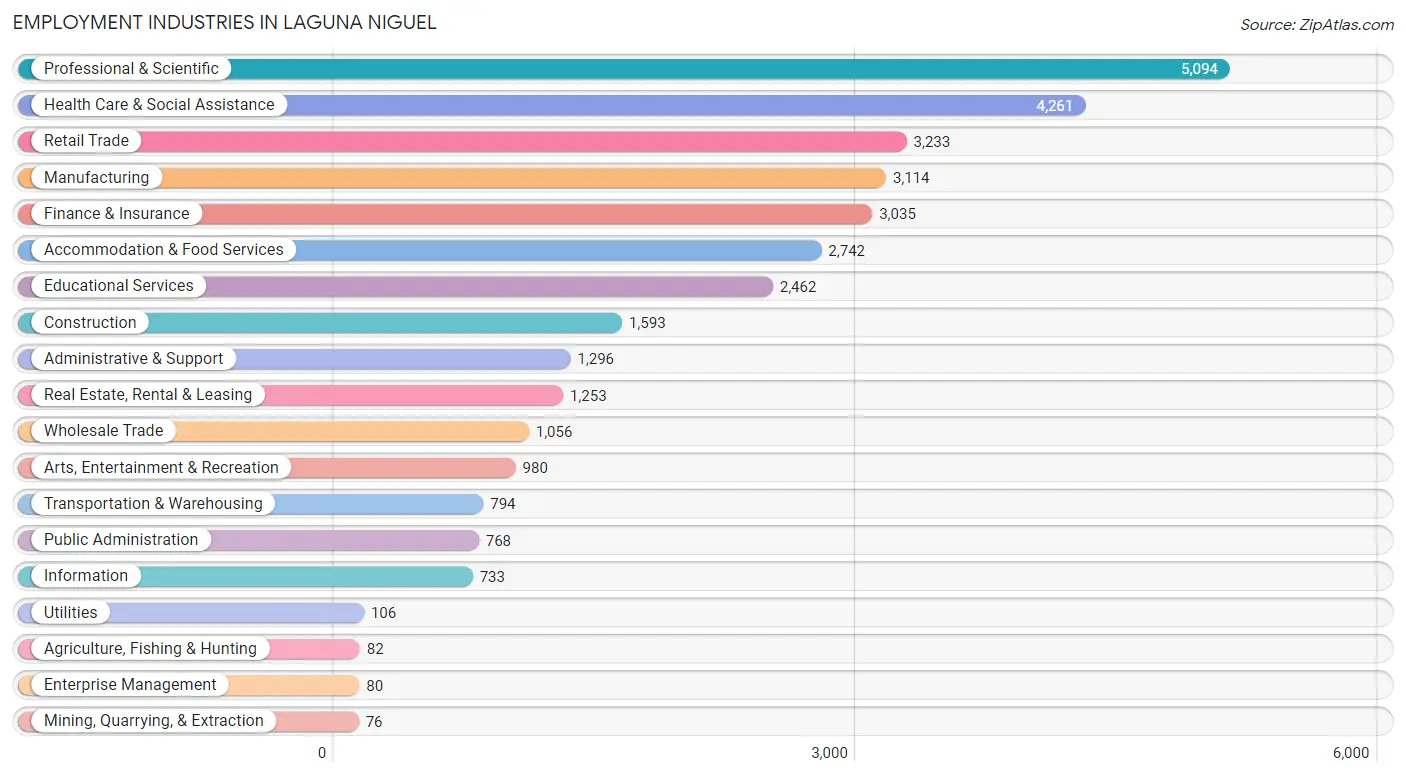
Employment Industries in Laguna Niguel
The major employment industries in Laguna Niguel include Professional & Scientific (5,094 | 14.9%), Health Care & Social Assistance (4,261 | 12.4%), Retail Trade (3,233 | 9.5%), Manufacturing (3,114 | 9.1%), and Finance & Insurance (3,035 | 8.9%).
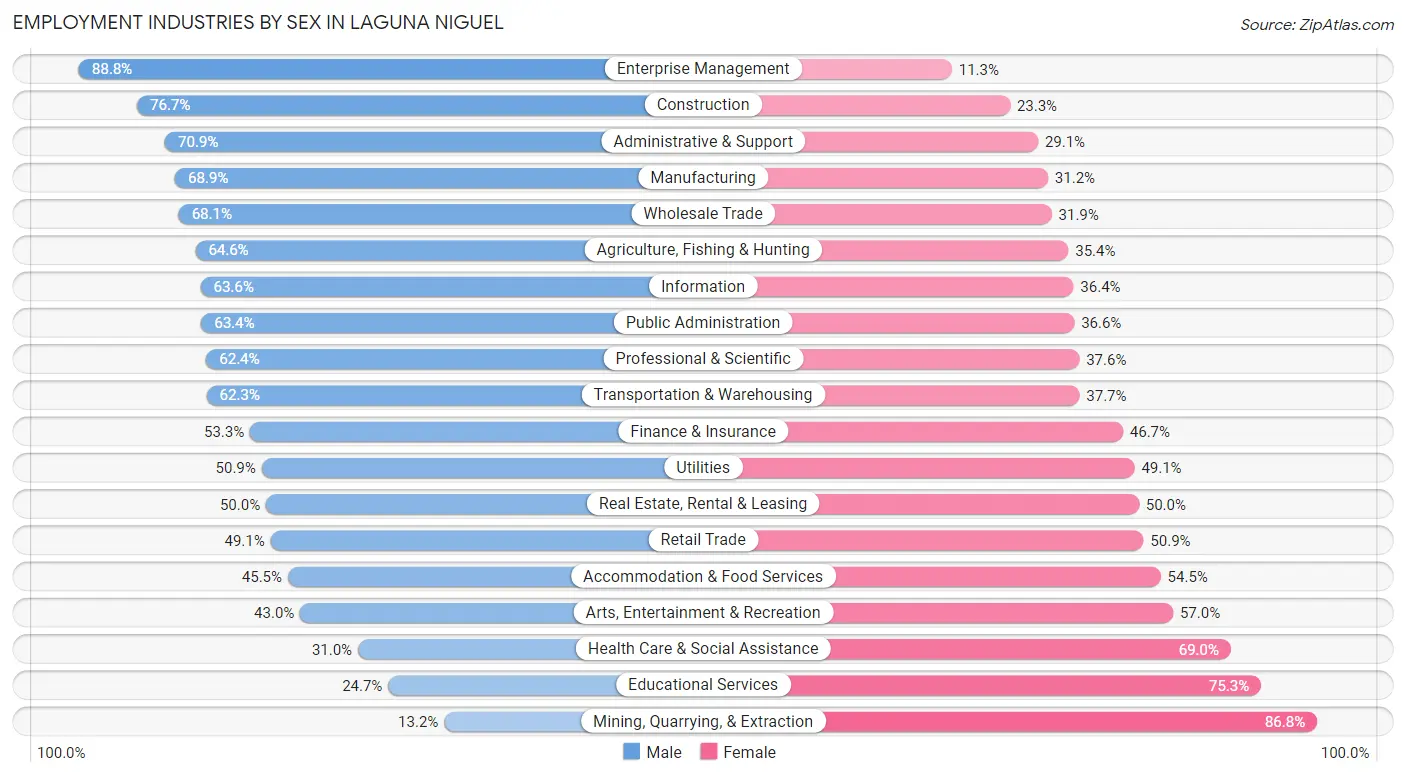
Employment Industries by Sex in Laguna Niguel
The Laguna Niguel industries that see more men than women are Enterprise Management (88.7%), Construction (76.7%), and Administrative & Support (70.9%), whereas the industries that tend to have a higher number of women are Mining, Quarrying, & Extraction (86.8%), Educational Services (75.3%), and Health Care & Social Assistance (69.0%).
| Industry | Male | Female |
| Agriculture, Fishing & Hunting | 53 (64.6%) | 29 (35.4%) |
| Mining, Quarrying, & Extraction | 10 (13.2%) | 66 (86.8%) |
| Construction | 1,222 (76.7%) | 371 (23.3%) |
| Manufacturing | 2,144 (68.9%) | 970 (31.1%) |
| Wholesale Trade | 719 (68.1%) | 337 (31.9%) |
| Retail Trade | 1,587 (49.1%) | 1,646 (50.9%) |
| Transportation & Warehousing | 495 (62.3%) | 299 (37.7%) |
| Utilities | 54 (50.9%) | 52 (49.1%) |
| Information | 466 (63.6%) | 267 (36.4%) |
| Finance & Insurance | 1,619 (53.3%) | 1,416 (46.7%) |
| Real Estate, Rental & Leasing | 627 (50.0%) | 626 (50.0%) |
| Professional & Scientific | 3,177 (62.4%) | 1,917 (37.6%) |
| Enterprise Management | 71 (88.7%) | 9 (11.3%) |
| Administrative & Support | 919 (70.9%) | 377 (29.1%) |
| Educational Services | 609 (24.7%) | 1,853 (75.3%) |
| Health Care & Social Assistance | 1,321 (31.0%) | 2,940 (69.0%) |
| Arts, Entertainment & Recreation | 421 (43.0%) | 559 (57.0%) |
| Accommodation & Food Services | 1,248 (45.5%) | 1,494 (54.5%) |
| Public Administration | 487 (63.4%) | 281 (36.6%) |
| Total | 17,681 (51.7%) | 16,537 (48.3%) |
Education in Laguna Niguel
School Enrollment in Laguna Niguel
The most common levels of schooling among the 14,048 students in Laguna Niguel are college / undergraduate (3,462 | 24.6%), high school (2,968 | 21.1%), and middle school (2,847 | 20.3%).
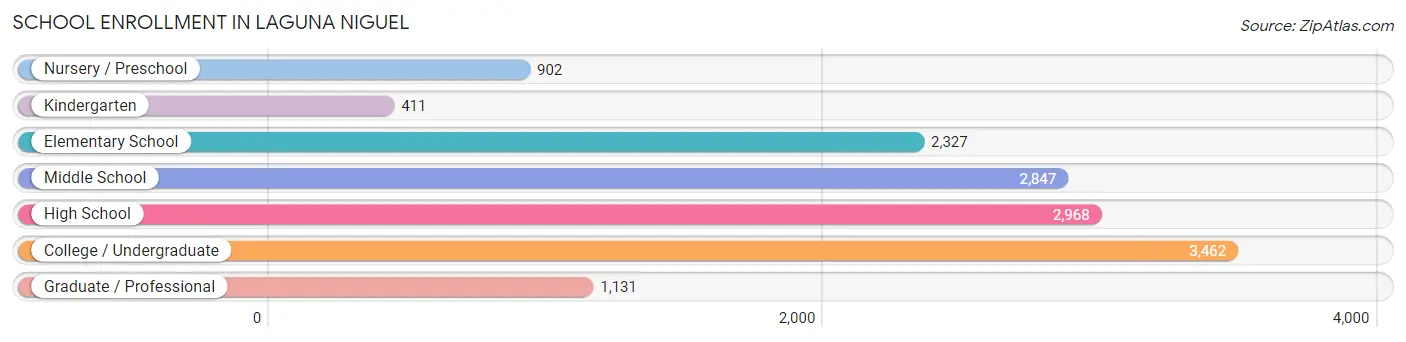
| School Level | # Students | % Students |
| Nursery / Preschool | 902 | 6.4% |
| Kindergarten | 411 | 2.9% |
| Elementary School | 2,327 | 16.6% |
| Middle School | 2,847 | 20.3% |
| High School | 2,968 | 21.1% |
| College / Undergraduate | 3,462 | 24.6% |
| Graduate / Professional | 1,131 | 8.1% |
| Total | 14,048 | 100.0% |
School Enrollment by Age by Funding Source in Laguna Niguel
Out of a total of 14,048 students who are enrolled in schools in Laguna Niguel, 3,231 (23.0%) attend a private institution, while the remaining 10,817 (77.0%) are enrolled in public schools. The age group of 3 to 4 year olds has the highest likelihood of being enrolled in private schools, with 489 (75.3% in the age bracket) enrolled. Conversely, the age group of 18 to 19 year olds has the lowest likelihood of being enrolled in a private school, with 1,138 (90.5% in the age bracket) attending a public institution.
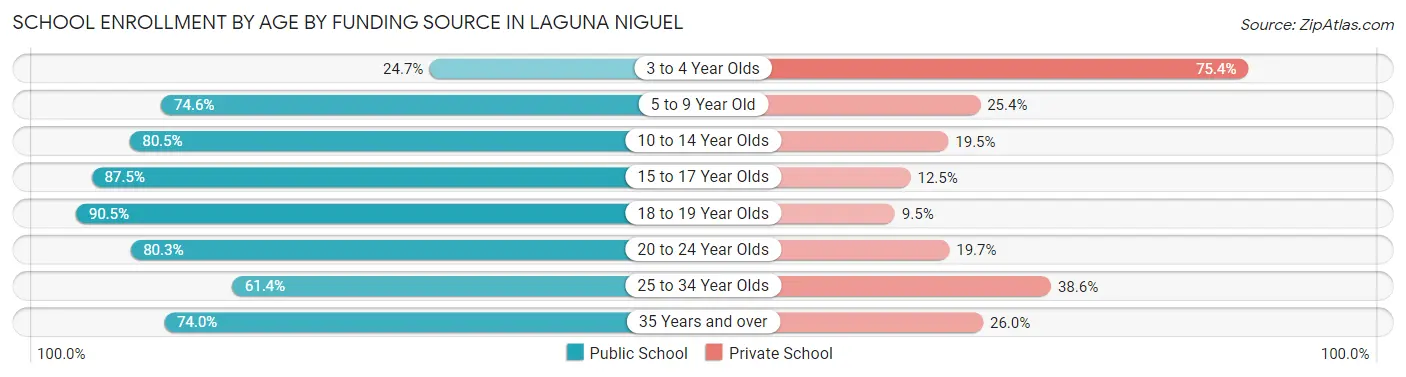
| Age Bracket | Public School | Private School |
| 3 to 4 Year Olds | 160 (24.6%) | 489 (75.3%) |
| 5 to 9 Year Old | 2,031 (74.6%) | 693 (25.4%) |
| 10 to 14 Year Olds | 2,890 (80.5%) | 700 (19.5%) |
| 15 to 17 Year Olds | 1,763 (87.5%) | 251 (12.5%) |
| 18 to 19 Year Olds | 1,138 (90.5%) | 120 (9.5%) |
| 20 to 24 Year Olds | 1,510 (80.3%) | 370 (19.7%) |
| 25 to 34 Year Olds | 496 (61.4%) | 312 (38.6%) |
| 35 Years and over | 833 (74.0%) | 292 (26.0%) |
| Total | 10,817 (77.0%) | 3,231 (23.0%) |
Educational Attainment by Field of Study in Laguna Niguel
Business (6,080 | 21.0%), engineering (3,217 | 11.1%), social sciences (2,654 | 9.2%), science & technology (2,475 | 8.6%), and communications (1,892 | 6.6%) are the most common fields of study among 28,894 individuals in Laguna Niguel who have obtained a bachelor's degree or higher.
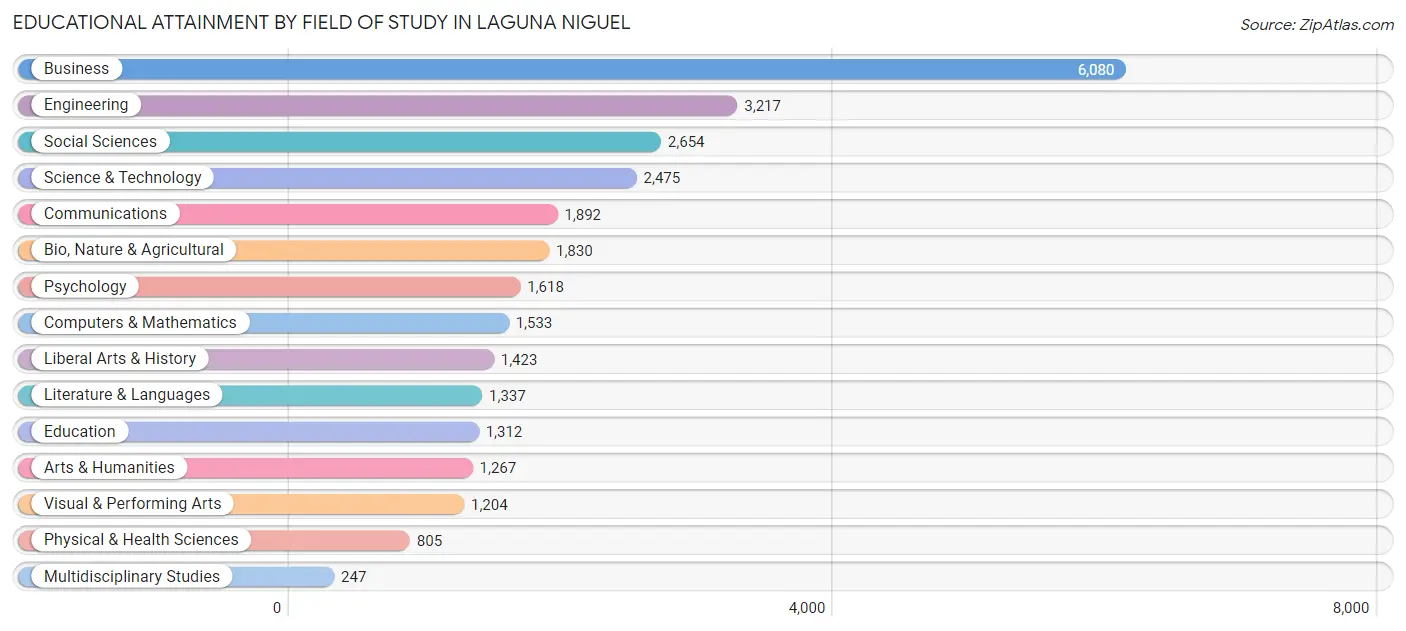
| Field of Study | # Graduates | % Graduates |
| Computers & Mathematics | 1,533 | 5.3% |
| Bio, Nature & Agricultural | 1,830 | 6.3% |
| Physical & Health Sciences | 805 | 2.8% |
| Psychology | 1,618 | 5.6% |
| Social Sciences | 2,654 | 9.2% |
| Engineering | 3,217 | 11.1% |
| Multidisciplinary Studies | 247 | 0.9% |
| Science & Technology | 2,475 | 8.6% |
| Business | 6,080 | 21.0% |
| Education | 1,312 | 4.5% |
| Literature & Languages | 1,337 | 4.6% |
| Liberal Arts & History | 1,423 | 4.9% |
| Visual & Performing Arts | 1,204 | 4.2% |
| Communications | 1,892 | 6.6% |
| Arts & Humanities | 1,267 | 4.4% |
| Total | 28,894 | 100.0% |
Transportation & Commute in Laguna Niguel
Vehicle Availability by Sex in Laguna Niguel
The most prevalent vehicle ownership categories in Laguna Niguel are males with 2 vehicles (7,789, accounting for 44.1%) and females with 2 vehicles (7,093, making up 48.2%).
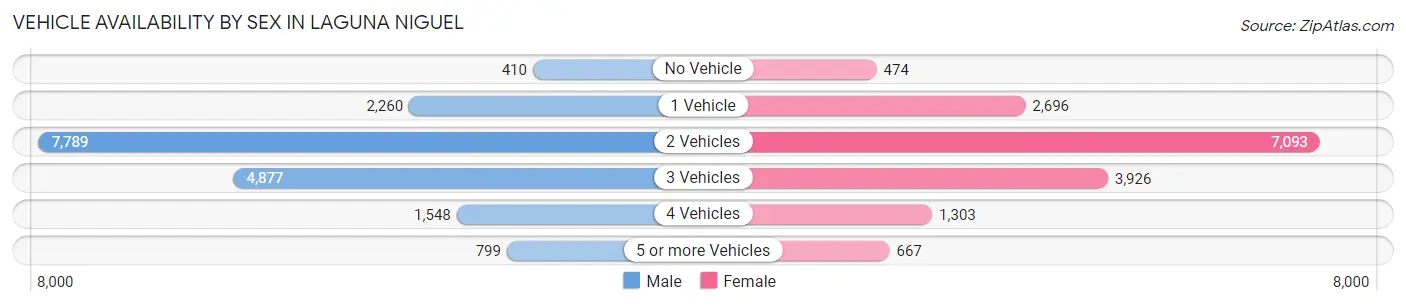
| Vehicles Available | Male | Female |
| No Vehicle | 410 (2.3%) | 474 (2.9%) |
| 1 Vehicle | 2,260 (12.8%) | 2,696 (16.7%) |
| 2 Vehicles | 7,789 (44.1%) | 7,093 (43.9%) |
| 3 Vehicles | 4,877 (27.6%) | 3,926 (24.3%) |
| 4 Vehicles | 1,548 (8.7%) | 1,303 (8.1%) |
| 5 or more Vehicles | 799 (4.5%) | 667 (4.1%) |
| Total | 17,683 (100.0%) | 16,159 (100.0%) |
Commute Time in Laguna Niguel
The most frequently occuring commute durations in Laguna Niguel are 15 to 19 minutes (5,056 commuters, 18.8%), 30 to 34 minutes (4,836 commuters, 18.0%), and 20 to 24 minutes (3,887 commuters, 14.4%).
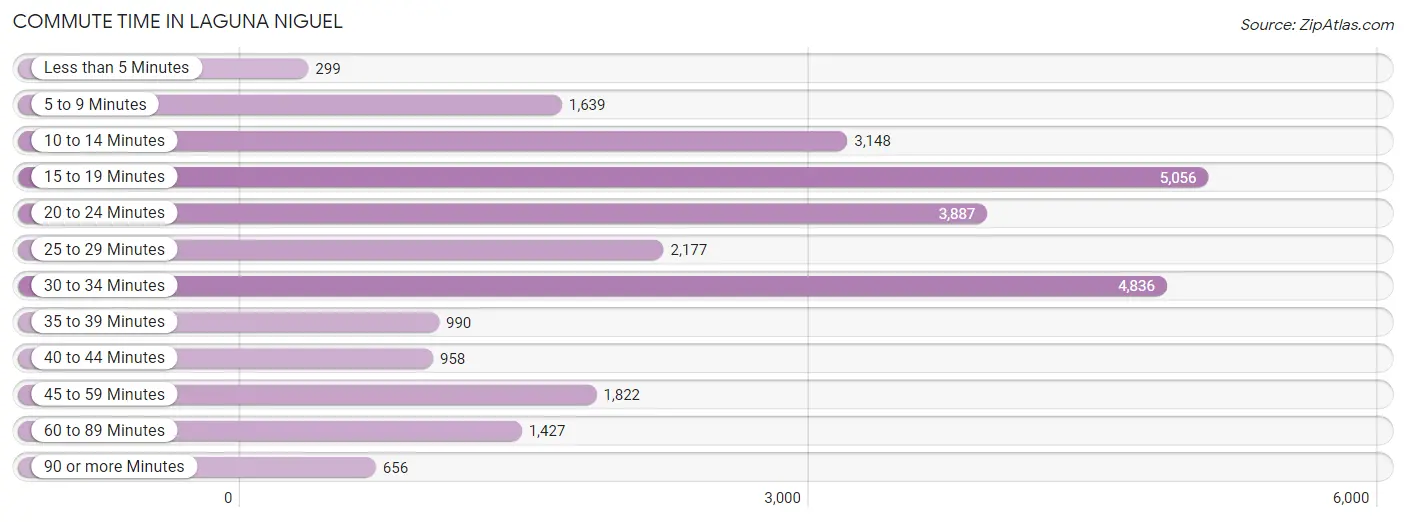
| Commute Time | # Commuters | % Commuters |
| Less than 5 Minutes | 299 | 1.1% |
| 5 to 9 Minutes | 1,639 | 6.1% |
| 10 to 14 Minutes | 3,148 | 11.7% |
| 15 to 19 Minutes | 5,056 | 18.8% |
| 20 to 24 Minutes | 3,887 | 14.4% |
| 25 to 29 Minutes | 2,177 | 8.1% |
| 30 to 34 Minutes | 4,836 | 18.0% |
| 35 to 39 Minutes | 990 | 3.7% |
| 40 to 44 Minutes | 958 | 3.6% |
| 45 to 59 Minutes | 1,822 | 6.8% |
| 60 to 89 Minutes | 1,427 | 5.3% |
| 90 or more Minutes | 656 | 2.4% |
Commute Time by Sex in Laguna Niguel
The most common commute times in Laguna Niguel are 30 to 34 minutes (2,991 commuters, 21.2%) for males and 15 to 19 minutes (2,705 commuters, 21.1%) for females.
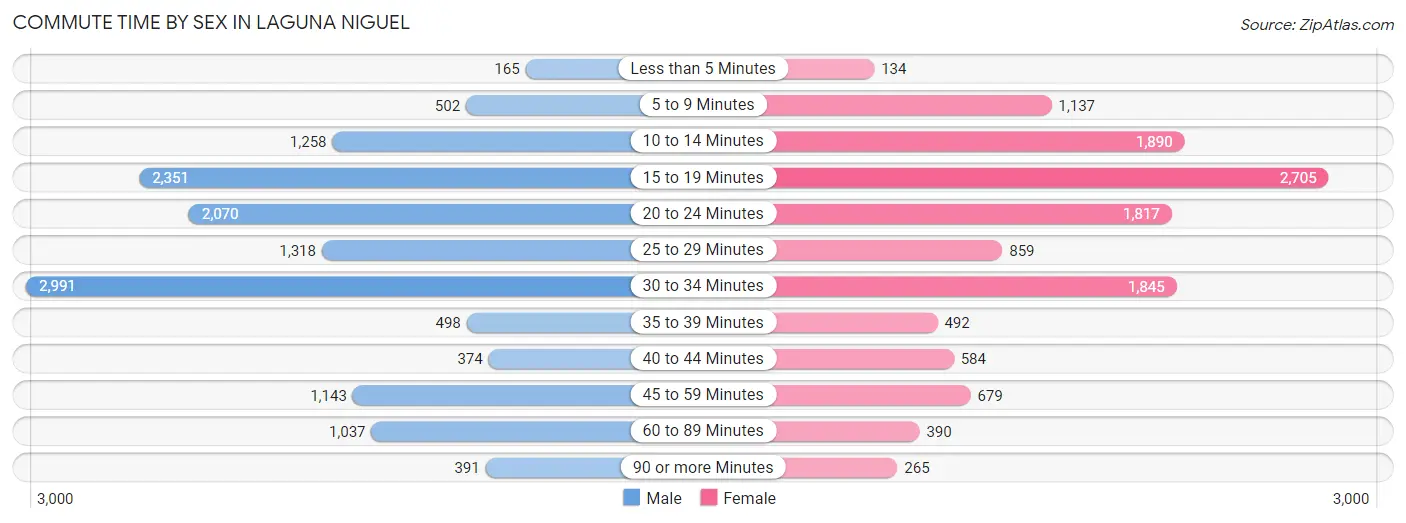
| Commute Time | Male | Female |
| Less than 5 Minutes | 165 (1.2%) | 134 (1.1%) |
| 5 to 9 Minutes | 502 (3.6%) | 1,137 (8.9%) |
| 10 to 14 Minutes | 1,258 (8.9%) | 1,890 (14.8%) |
| 15 to 19 Minutes | 2,351 (16.7%) | 2,705 (21.1%) |
| 20 to 24 Minutes | 2,070 (14.7%) | 1,817 (14.2%) |
| 25 to 29 Minutes | 1,318 (9.3%) | 859 (6.7%) |
| 30 to 34 Minutes | 2,991 (21.2%) | 1,845 (14.4%) |
| 35 to 39 Minutes | 498 (3.5%) | 492 (3.8%) |
| 40 to 44 Minutes | 374 (2.6%) | 584 (4.6%) |
| 45 to 59 Minutes | 1,143 (8.1%) | 679 (5.3%) |
| 60 to 89 Minutes | 1,037 (7.4%) | 390 (3.0%) |
| 90 or more Minutes | 391 (2.8%) | 265 (2.1%) |
Time of Departure to Work by Sex in Laguna Niguel
The most frequent times of departure to work in Laguna Niguel are 8:00 AM to 8:29 AM (2,386, 16.9%) for males and 7:00 AM to 7:29 AM (2,050, 16.0%) for females.
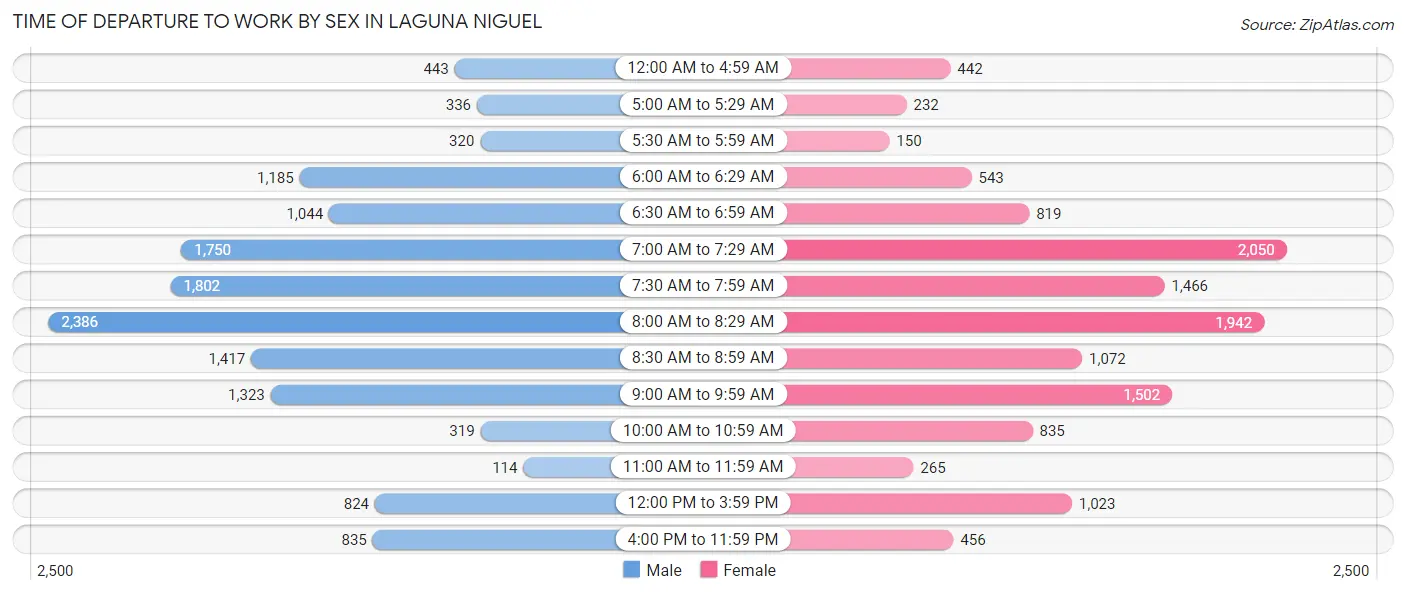
| Time of Departure | Male | Female |
| 12:00 AM to 4:59 AM | 443 (3.1%) | 442 (3.5%) |
| 5:00 AM to 5:29 AM | 336 (2.4%) | 232 (1.8%) |
| 5:30 AM to 5:59 AM | 320 (2.3%) | 150 (1.2%) |
| 6:00 AM to 6:29 AM | 1,185 (8.4%) | 543 (4.2%) |
| 6:30 AM to 6:59 AM | 1,044 (7.4%) | 819 (6.4%) |
| 7:00 AM to 7:29 AM | 1,750 (12.4%) | 2,050 (16.0%) |
| 7:30 AM to 7:59 AM | 1,802 (12.8%) | 1,466 (11.5%) |
| 8:00 AM to 8:29 AM | 2,386 (16.9%) | 1,942 (15.2%) |
| 8:30 AM to 8:59 AM | 1,417 (10.1%) | 1,072 (8.4%) |
| 9:00 AM to 9:59 AM | 1,323 (9.4%) | 1,502 (11.7%) |
| 10:00 AM to 10:59 AM | 319 (2.3%) | 835 (6.5%) |
| 11:00 AM to 11:59 AM | 114 (0.8%) | 265 (2.1%) |
| 12:00 PM to 3:59 PM | 824 (5.8%) | 1,023 (8.0%) |
| 4:00 PM to 11:59 PM | 835 (5.9%) | 456 (3.6%) |
| Total | 14,098 (100.0%) | 12,797 (100.0%) |
Housing Occupancy in Laguna Niguel
Occupancy by Ownership in Laguna Niguel
Of the total 25,239 dwellings in Laguna Niguel, owner-occupied units account for 16,669 (66.0%), while renter-occupied units make up 8,570 (34.0%).
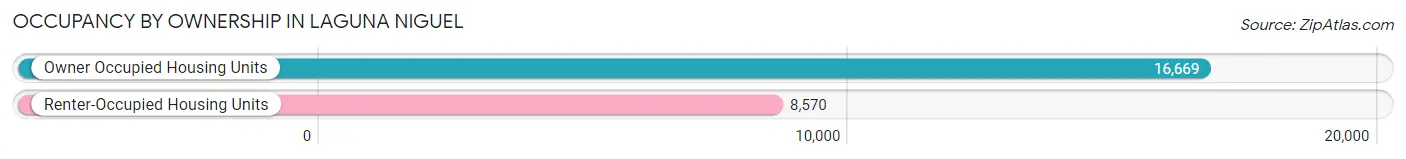
| Occupancy | # Housing Units | % Housing Units |
| Owner Occupied Housing Units | 16,669 | 66.0% |
| Renter-Occupied Housing Units | 8,570 | 34.0% |
| Total Occupied Housing Units | 25,239 | 100.0% |
Occupancy by Household Size in Laguna Niguel
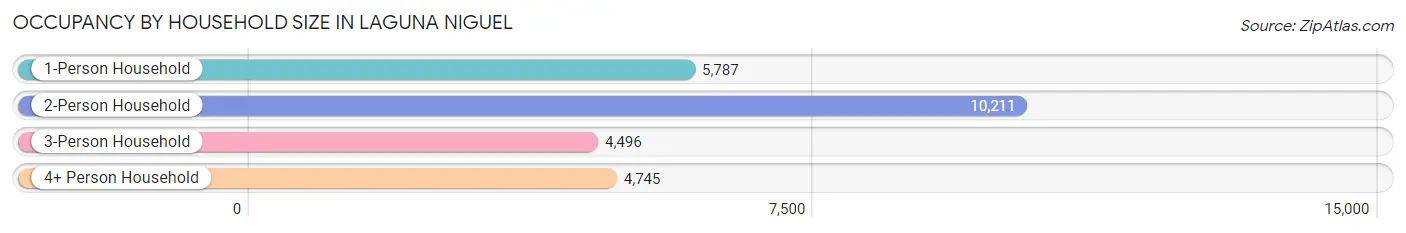
| Household Size | # Housing Units | % Housing Units |
| 1-Person Household | 5,787 | 22.9% |
| 2-Person Household | 10,211 | 40.5% |
| 3-Person Household | 4,496 | 17.8% |
| 4+ Person Household | 4,745 | 18.8% |
| Total Housing Units | 25,239 | 100.0% |
Occupancy by Ownership by Household Size in Laguna Niguel
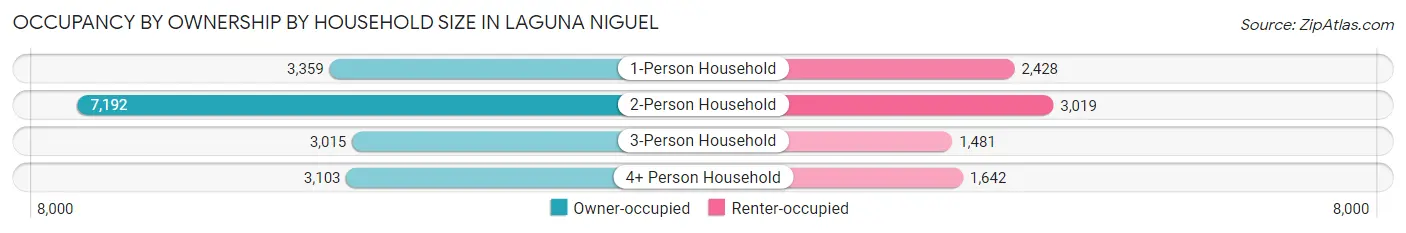
| Household Size | Owner-occupied | Renter-occupied |
| 1-Person Household | 3,359 (58.0%) | 2,428 (42.0%) |
| 2-Person Household | 7,192 (70.4%) | 3,019 (29.6%) |
| 3-Person Household | 3,015 (67.1%) | 1,481 (32.9%) |
| 4+ Person Household | 3,103 (65.4%) | 1,642 (34.6%) |
| Total Housing Units | 16,669 (66.0%) | 8,570 (34.0%) |
Occupancy by Educational Attainment in Laguna Niguel
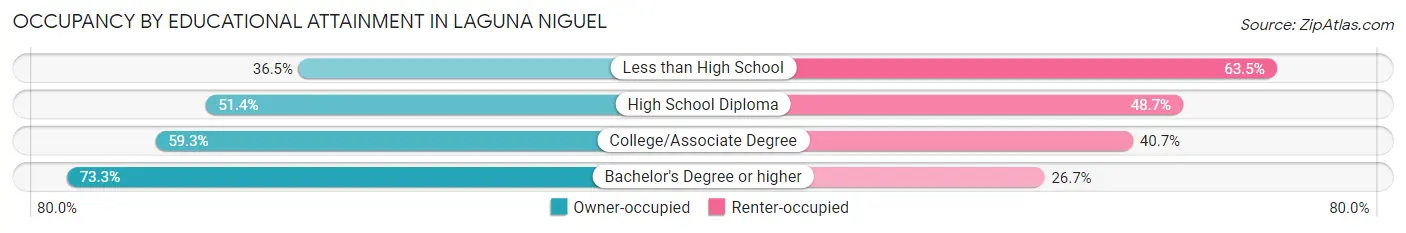
| Household Size | Owner-occupied | Renter-occupied |
| Less than High School | 315 (36.5%) | 548 (63.5%) |
| High School Diploma | 1,273 (51.3%) | 1,206 (48.6%) |
| College/Associate Degree | 4,109 (59.3%) | 2,822 (40.7%) |
| Bachelor's Degree or higher | 10,972 (73.3%) | 3,994 (26.7%) |
Occupancy by Age of Householder in Laguna Niguel
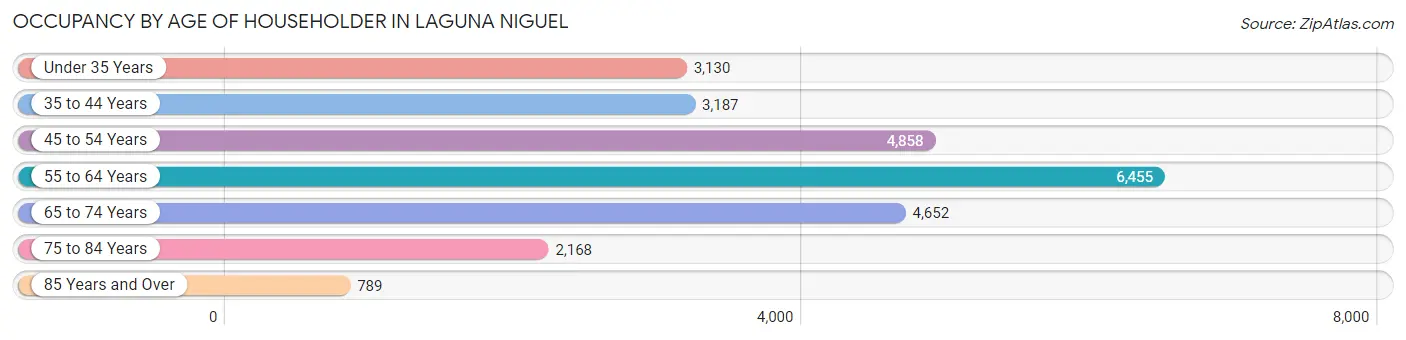
| Age Bracket | # Households | % Households |
| Under 35 Years | 3,130 | 12.4% |
| 35 to 44 Years | 3,187 | 12.6% |
| 45 to 54 Years | 4,858 | 19.3% |
| 55 to 64 Years | 6,455 | 25.6% |
| 65 to 74 Years | 4,652 | 18.4% |
| 75 to 84 Years | 2,168 | 8.6% |
| 85 Years and Over | 789 | 3.1% |
| Total | 25,239 | 100.0% |
Housing Finances in Laguna Niguel
Median Income by Occupancy in Laguna Niguel
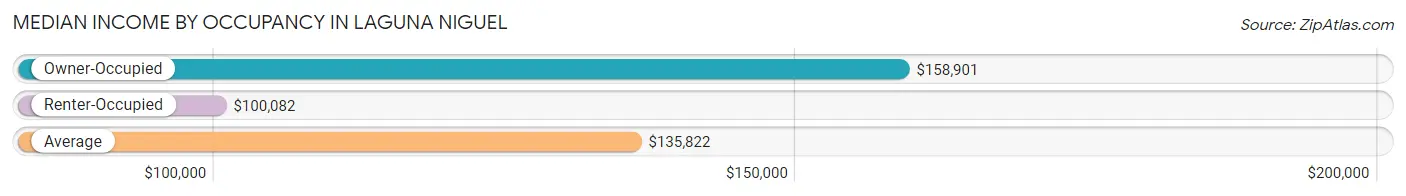
| Occupancy Type | # Households | Median Income |
| Owner-Occupied | 16,669 (66.0%) | $158,901 |
| Renter-Occupied | 8,570 (34.0%) | $100,082 |
| Average | 25,239 (100.0%) | $135,822 |
Occupancy by Householder Income Bracket in Laguna Niguel
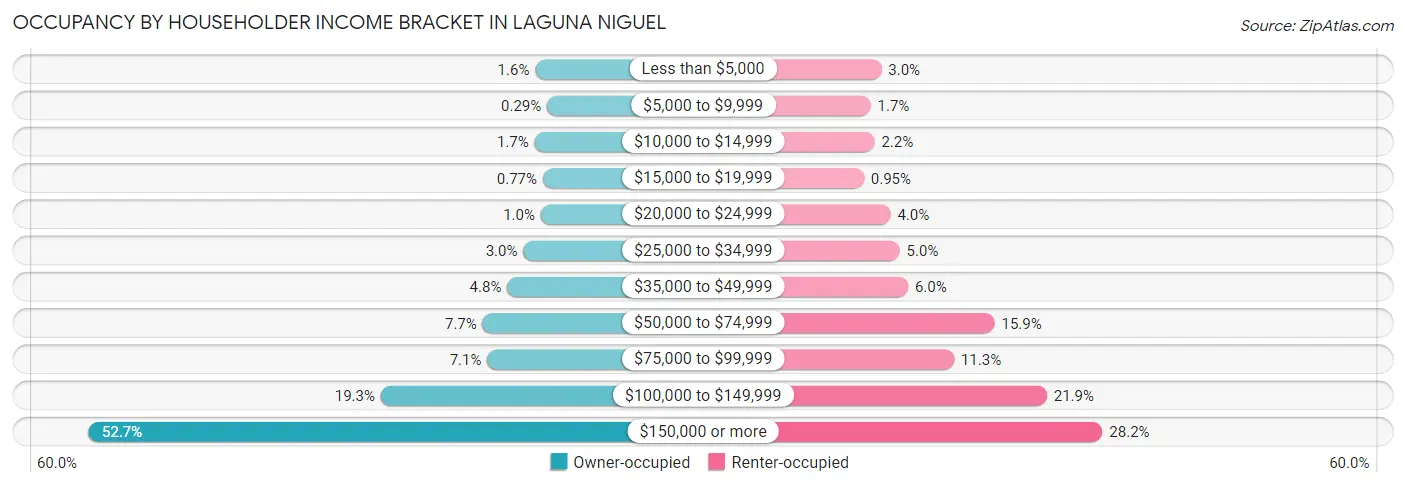
| Income Bracket | Owner-occupied | Renter-occupied |
| Less than $5,000 | 274 (1.6%) | 253 (2.9%) |
| $5,000 to $9,999 | 49 (0.3%) | 147 (1.7%) |
| $10,000 to $14,999 | 285 (1.7%) | 185 (2.2%) |
| $15,000 to $19,999 | 129 (0.8%) | 81 (0.9%) |
| $20,000 to $24,999 | 169 (1.0%) | 342 (4.0%) |
| $25,000 to $34,999 | 501 (3.0%) | 432 (5.0%) |
| $35,000 to $49,999 | 806 (4.8%) | 513 (6.0%) |
| $50,000 to $74,999 | 1,277 (7.7%) | 1,362 (15.9%) |
| $75,000 to $99,999 | 1,187 (7.1%) | 964 (11.3%) |
| $100,000 to $149,999 | 3,216 (19.3%) | 1,873 (21.9%) |
| $150,000 or more | 8,776 (52.6%) | 2,418 (28.2%) |
| Total | 16,669 (100.0%) | 8,570 (100.0%) |
Monthly Housing Cost Tiers in Laguna Niguel
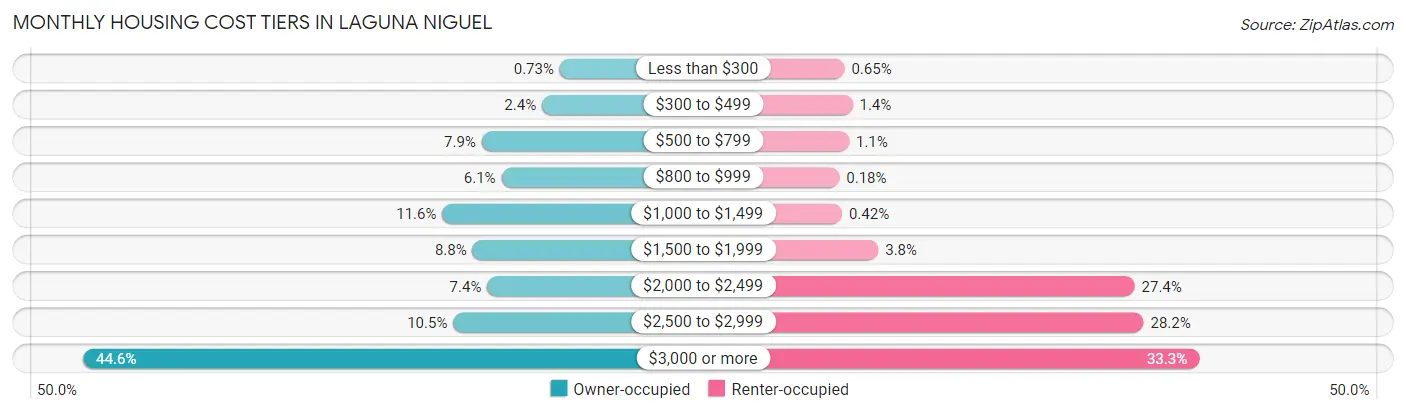
| Monthly Cost | Owner-occupied | Renter-occupied |
| Less than $300 | 122 (0.7%) | 56 (0.6%) |
| $300 to $499 | 395 (2.4%) | 119 (1.4%) |
| $500 to $799 | 1,320 (7.9%) | 92 (1.1%) |
| $800 to $999 | 1,017 (6.1%) | 15 (0.2%) |
| $1,000 to $1,499 | 1,926 (11.6%) | 36 (0.4%) |
| $1,500 to $1,999 | 1,460 (8.8%) | 322 (3.8%) |
| $2,000 to $2,499 | 1,235 (7.4%) | 2,345 (27.4%) |
| $2,500 to $2,999 | 1,757 (10.5%) | 2,415 (28.2%) |
| $3,000 or more | 7,437 (44.6%) | 2,852 (33.3%) |
| Total | 16,669 (100.0%) | 8,570 (100.0%) |
Physical Housing Characteristics in Laguna Niguel
Housing Structures in Laguna Niguel
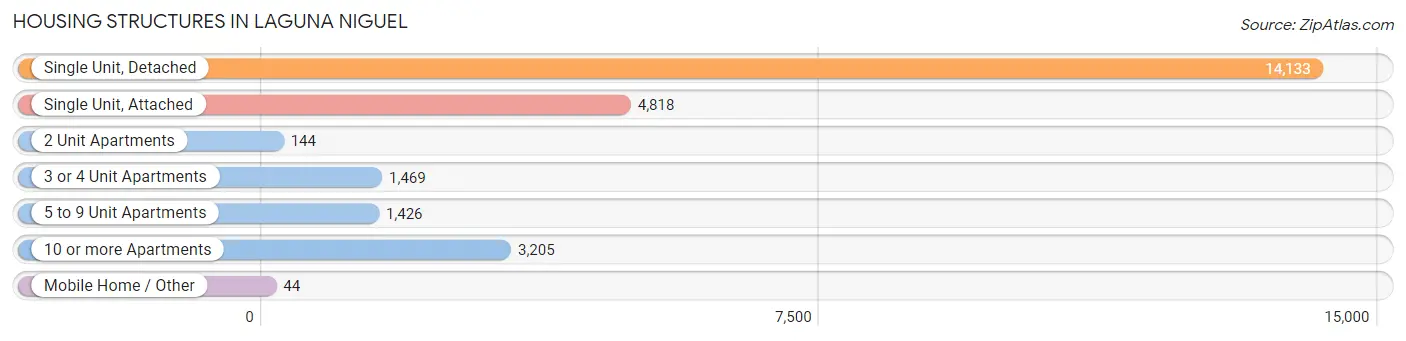
| Structure Type | # Housing Units | % Housing Units |
| Single Unit, Detached | 14,133 | 56.0% |
| Single Unit, Attached | 4,818 | 19.1% |
| 2 Unit Apartments | 144 | 0.6% |
| 3 or 4 Unit Apartments | 1,469 | 5.8% |
| 5 to 9 Unit Apartments | 1,426 | 5.7% |
| 10 or more Apartments | 3,205 | 12.7% |
| Mobile Home / Other | 44 | 0.2% |
| Total | 25,239 | 100.0% |
Housing Structures by Occupancy in Laguna Niguel
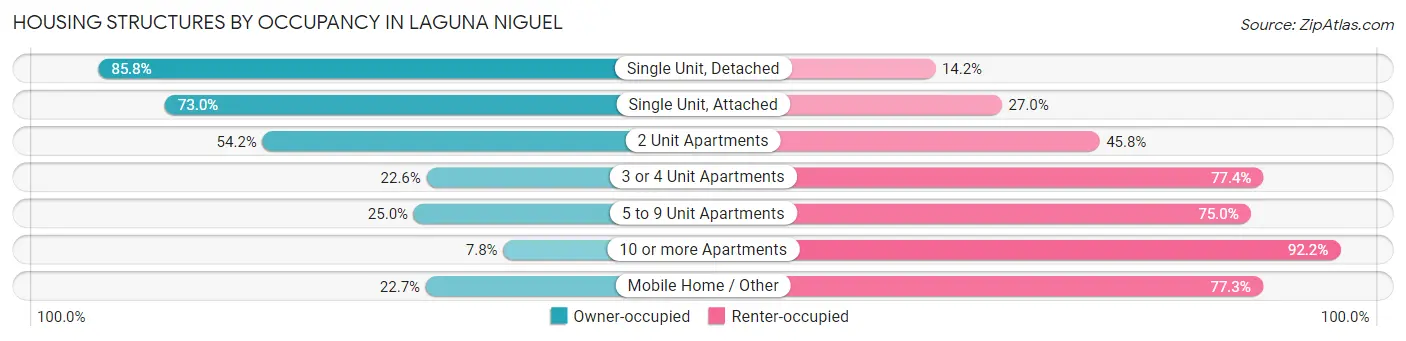
| Structure Type | Owner-occupied | Renter-occupied |
| Single Unit, Detached | 12,126 (85.8%) | 2,007 (14.2%) |
| Single Unit, Attached | 3,516 (73.0%) | 1,302 (27.0%) |
| 2 Unit Apartments | 78 (54.2%) | 66 (45.8%) |
| 3 or 4 Unit Apartments | 332 (22.6%) | 1,137 (77.4%) |
| 5 to 9 Unit Apartments | 357 (25.0%) | 1,069 (75.0%) |
| 10 or more Apartments | 250 (7.8%) | 2,955 (92.2%) |
| Mobile Home / Other | 10 (22.7%) | 34 (77.3%) |
| Total | 16,669 (66.0%) | 8,570 (34.0%) |
Housing Structures by Number of Rooms in Laguna Niguel
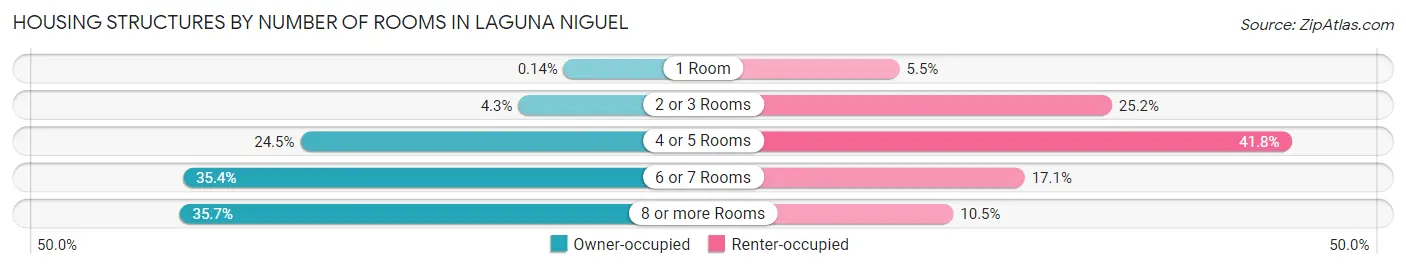
| Number of Rooms | Owner-occupied | Renter-occupied |
| 1 Room | 23 (0.1%) | 473 (5.5%) |
| 2 or 3 Rooms | 724 (4.3%) | 2,155 (25.2%) |
| 4 or 5 Rooms | 4,084 (24.5%) | 3,578 (41.7%) |
| 6 or 7 Rooms | 5,892 (35.3%) | 1,465 (17.1%) |
| 8 or more Rooms | 5,946 (35.7%) | 899 (10.5%) |
| Total | 16,669 (100.0%) | 8,570 (100.0%) |
Housing Structure by Heating Type in Laguna Niguel
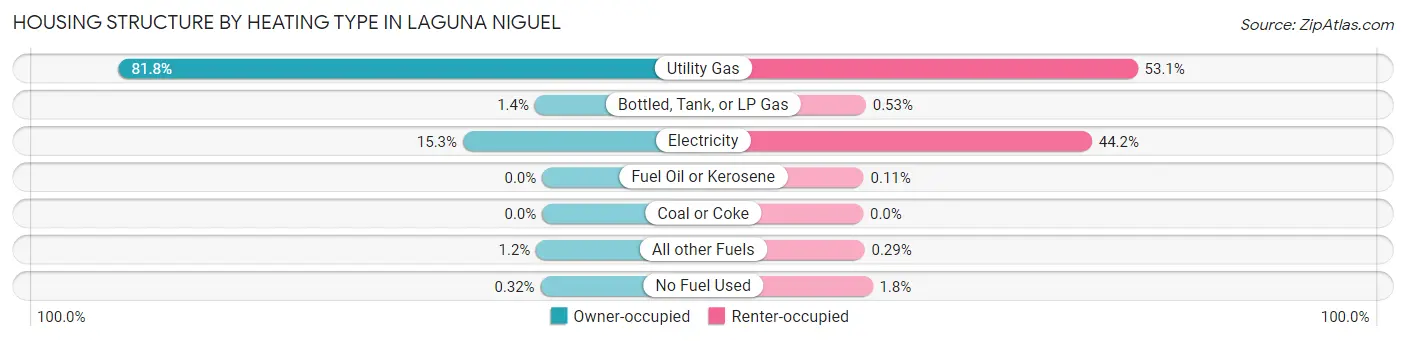
| Heating Type | Owner-occupied | Renter-occupied |
| Utility Gas | 13,638 (81.8%) | 4,547 (53.1%) |
| Bottled, Tank, or LP Gas | 235 (1.4%) | 45 (0.5%) |
| Electricity | 2,552 (15.3%) | 3,788 (44.2%) |
| Fuel Oil or Kerosene | 0 (0.0%) | 9 (0.1%) |
| Coal or Coke | 0 (0.0%) | 0 (0.0%) |
| All other Fuels | 191 (1.1%) | 25 (0.3%) |
| No Fuel Used | 53 (0.3%) | 156 (1.8%) |
| Total | 16,669 (100.0%) | 8,570 (100.0%) |
Household Vehicle Usage in Laguna Niguel
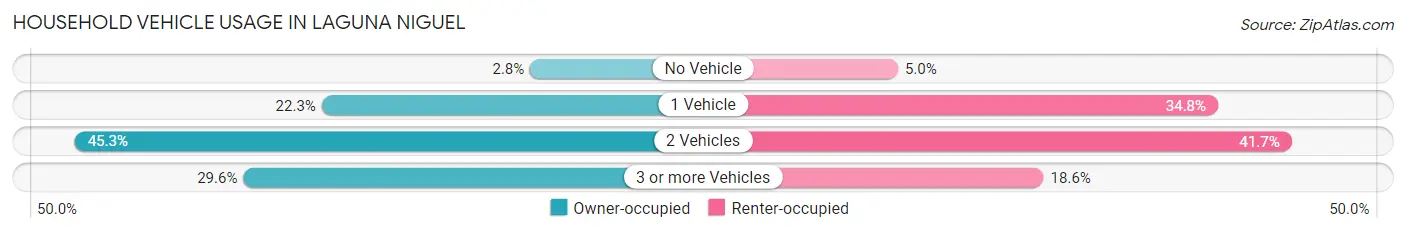
| Vehicles per Household | Owner-occupied | Renter-occupied |
| No Vehicle | 469 (2.8%) | 424 (5.0%) |
| 1 Vehicle | 3,712 (22.3%) | 2,983 (34.8%) |
| 2 Vehicles | 7,555 (45.3%) | 3,573 (41.7%) |
| 3 or more Vehicles | 4,933 (29.6%) | 1,590 (18.5%) |
| Total | 16,669 (100.0%) | 8,570 (100.0%) |
Real Estate & Mortgages in Laguna Niguel
Real Estate and Mortgage Overview in Laguna Niguel
| Characteristic | Without Mortgage | With Mortgage |
| Housing Units | 5,073 | 11,596 |
| Median Property Value | $1,008,100 | $1,069,600 |
| Median Household Income | $114,726 | $7,009 |
| Monthly Housing Costs | $980 | $7,250 |
| Real Estate Taxes | $5,558 | $53 |
Property Value by Mortgage Status in Laguna Niguel
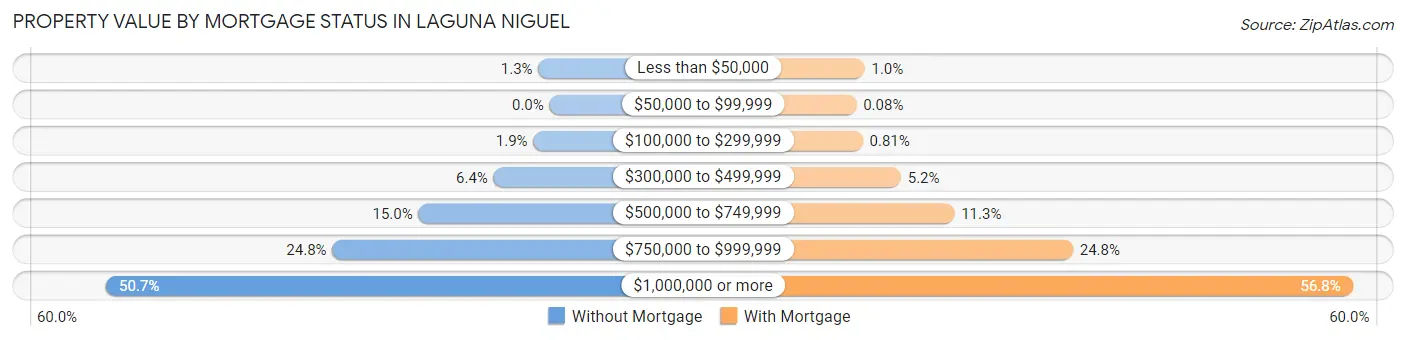
| Property Value | Without Mortgage | With Mortgage |
| Less than $50,000 | 65 (1.3%) | 119 (1.0%) |
| $50,000 to $99,999 | 0 (0.0%) | 9 (0.1%) |
| $100,000 to $299,999 | 94 (1.8%) | 94 (0.8%) |
| $300,000 to $499,999 | 324 (6.4%) | 600 (5.2%) |
| $500,000 to $749,999 | 760 (15.0%) | 1,308 (11.3%) |
| $750,000 to $999,999 | 1,259 (24.8%) | 2,879 (24.8%) |
| $1,000,000 or more | 2,571 (50.7%) | 6,587 (56.8%) |
| Total | 5,073 (100.0%) | 11,596 (100.0%) |
Household Income by Mortgage Status in Laguna Niguel
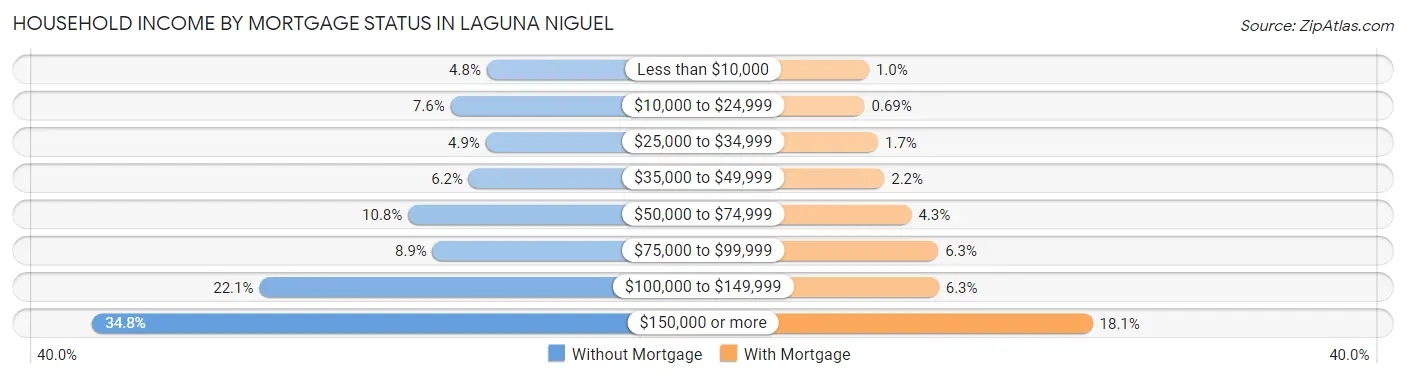
| Household Income | Without Mortgage | With Mortgage |
| Less than $10,000 | 243 (4.8%) | 118 (1.0%) |
| $10,000 to $24,999 | 383 (7.5%) | 80 (0.7%) |
| $25,000 to $34,999 | 247 (4.9%) | 200 (1.7%) |
| $35,000 to $49,999 | 312 (6.1%) | 254 (2.2%) |
| $50,000 to $74,999 | 547 (10.8%) | 494 (4.3%) |
| $75,000 to $99,999 | 452 (8.9%) | 730 (6.3%) |
| $100,000 to $149,999 | 1,122 (22.1%) | 735 (6.3%) |
| $150,000 or more | 1,767 (34.8%) | 2,094 (18.1%) |
| Total | 5,073 (100.0%) | 11,596 (100.0%) |
Property Value to Household Income Ratio in Laguna Niguel
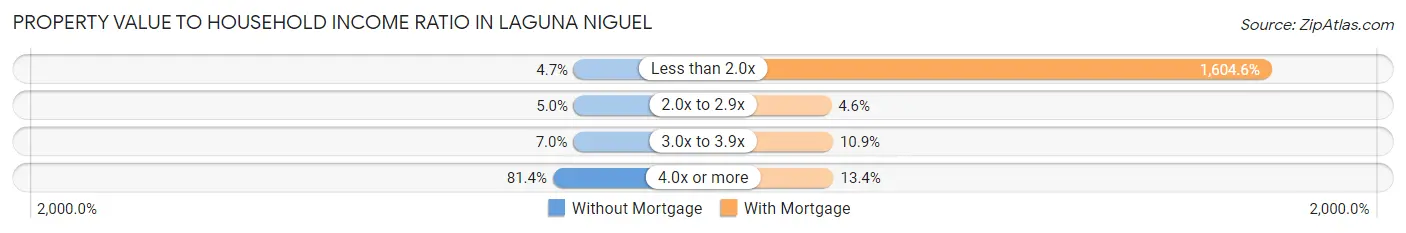
| Value-to-Income Ratio | Without Mortgage | With Mortgage |
| Less than 2.0x | 237 (4.7%) | 186,067 (1,604.6%) |
| 2.0x to 2.9x | 252 (5.0%) | 537 (4.6%) |
| 3.0x to 3.9x | 357 (7.0%) | 1,268 (10.9%) |
| 4.0x or more | 4,129 (81.4%) | 1,557 (13.4%) |
| Total | 5,073 (100.0%) | 11,596 (100.0%) |
Real Estate Taxes by Mortgage Status in Laguna Niguel
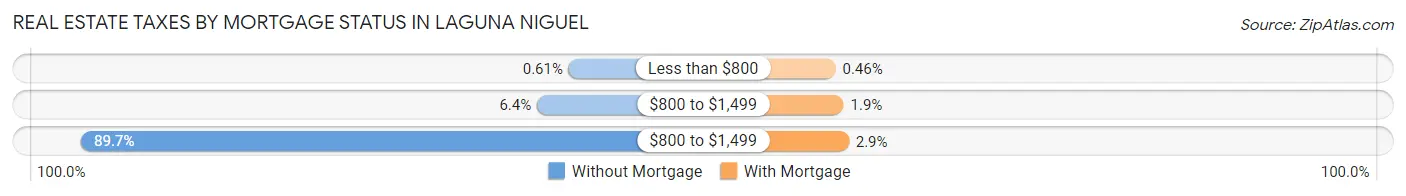
| Property Taxes | Without Mortgage | With Mortgage |
| Less than $800 | 31 (0.6%) | 53 (0.5%) |
| $800 to $1,499 | 325 (6.4%) | 224 (1.9%) |
| $800 to $1,499 | 4,549 (89.7%) | 333 (2.9%) |
| Total | 5,073 (100.0%) | 11,596 (100.0%) |
Health & Disability in Laguna Niguel
Health Insurance Coverage by Age in Laguna Niguel
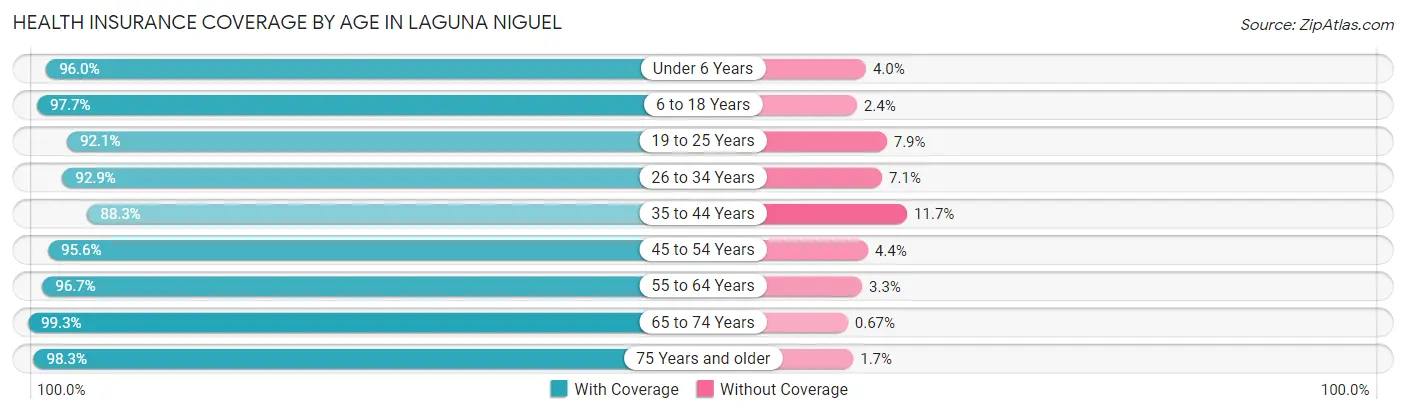
| Age Bracket | With Coverage | Without Coverage |
| Under 6 Years | 2,707 (96.0%) | 114 (4.0%) |
| 6 to 18 Years | 8,810 (97.7%) | 212 (2.4%) |
| 19 to 25 Years | 4,733 (92.1%) | 407 (7.9%) |
| 26 to 34 Years | 6,106 (92.9%) | 464 (7.1%) |
| 35 to 44 Years | 6,228 (88.3%) | 827 (11.7%) |
| 45 to 54 Years | 8,365 (95.6%) | 385 (4.4%) |
| 55 to 64 Years | 11,334 (96.7%) | 389 (3.3%) |
| 65 to 74 Years | 8,048 (99.3%) | 54 (0.7%) |
| 75 Years and older | 4,811 (98.3%) | 82 (1.7%) |
| Total | 61,142 (95.4%) | 2,934 (4.6%) |
Health Insurance Coverage by Citizenship Status in Laguna Niguel
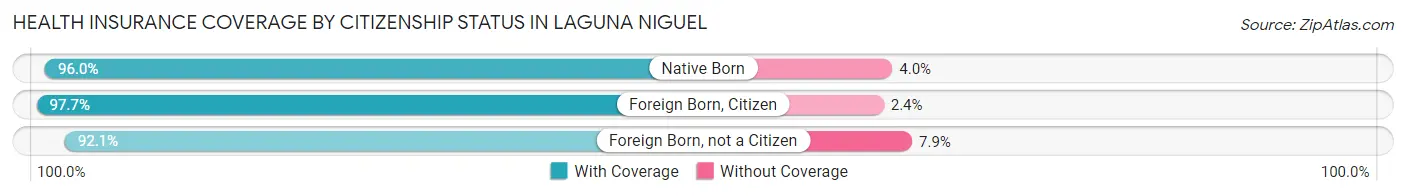
| Citizenship Status | With Coverage | Without Coverage |
| Native Born | 2,707 (96.0%) | 114 (4.0%) |
| Foreign Born, Citizen | 8,810 (97.7%) | 212 (2.4%) |
| Foreign Born, not a Citizen | 4,733 (92.1%) | 407 (7.9%) |
Health Insurance Coverage by Household Income in Laguna Niguel
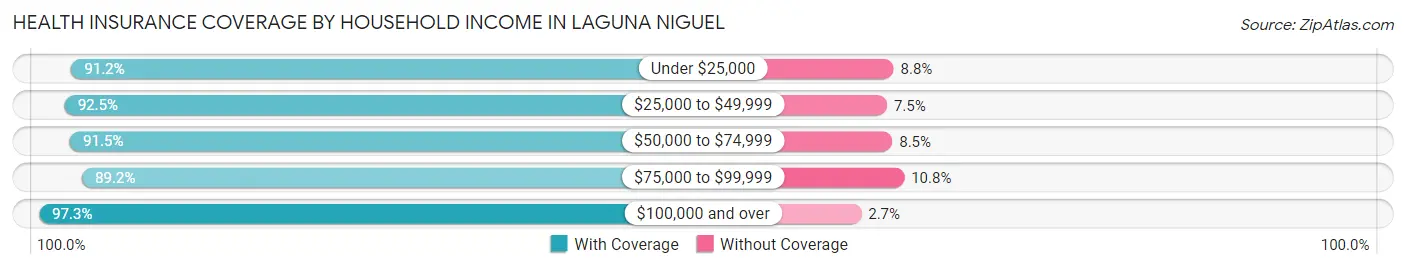
| Household Income | With Coverage | Without Coverage |
| Under $25,000 | 2,901 (91.2%) | 279 (8.8%) |
| $25,000 to $49,999 | 4,685 (92.5%) | 381 (7.5%) |
| $50,000 to $74,999 | 4,770 (91.5%) | 444 (8.5%) |
| $75,000 to $99,999 | 4,520 (89.2%) | 545 (10.8%) |
| $100,000 and over | 43,923 (97.3%) | 1,225 (2.7%) |
Public vs Private Health Insurance Coverage by Age in Laguna Niguel
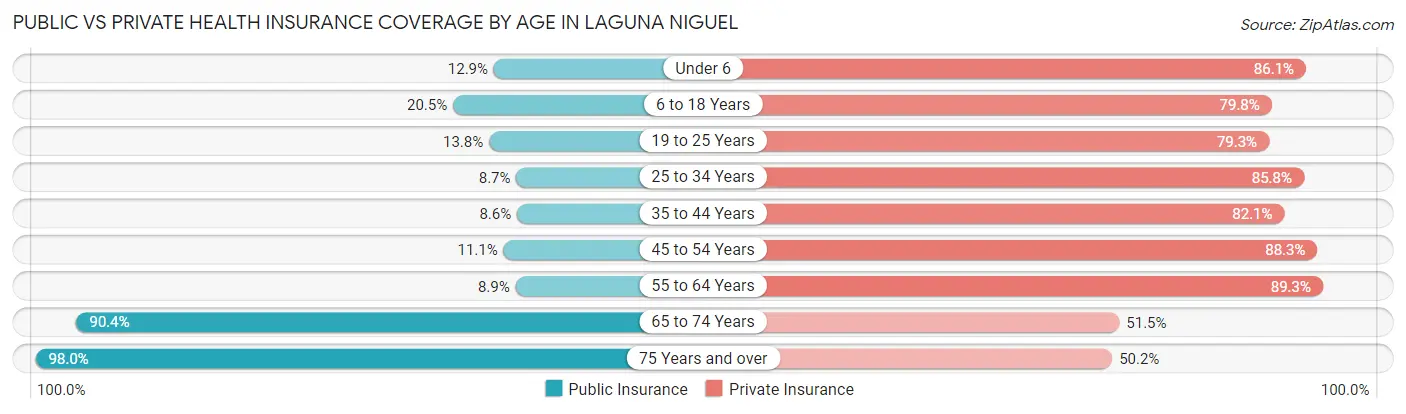
| Age Bracket | Public Insurance | Private Insurance |
| Under 6 | 364 (12.9%) | 2,430 (86.1%) |
| 6 to 18 Years | 1,847 (20.5%) | 7,197 (79.8%) |
| 19 to 25 Years | 709 (13.8%) | 4,075 (79.3%) |
| 25 to 34 Years | 573 (8.7%) | 5,634 (85.8%) |
| 35 to 44 Years | 607 (8.6%) | 5,795 (82.1%) |
| 45 to 54 Years | 971 (11.1%) | 7,722 (88.2%) |
| 55 to 64 Years | 1,040 (8.9%) | 10,465 (89.3%) |
| 65 to 74 Years | 7,324 (90.4%) | 4,174 (51.5%) |
| 75 Years and over | 4,794 (98.0%) | 2,456 (50.2%) |
| Total | 18,229 (28.4%) | 49,948 (77.9%) |
Disability Status by Sex by Age in Laguna Niguel
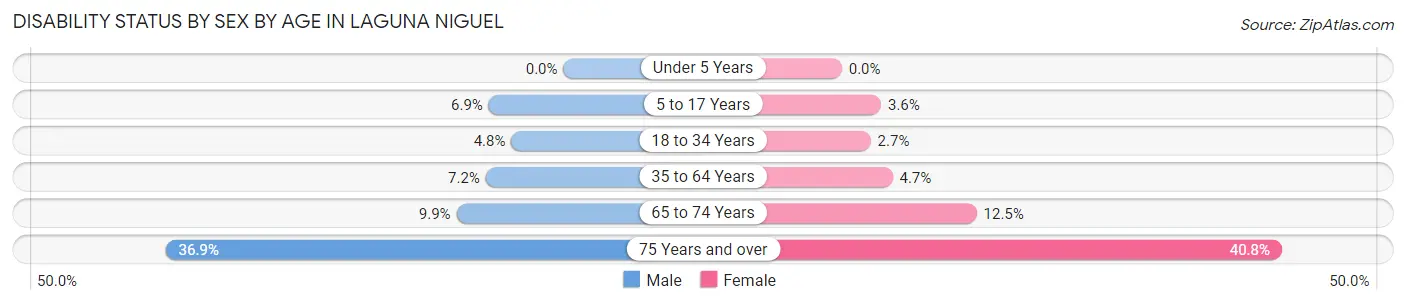
| Age Bracket | Male | Female |
| Under 5 Years | 0 (0.0%) | 0 (0.0%) |
| 5 to 17 Years | 330 (6.9%) | 139 (3.6%) |
| 18 to 34 Years | 293 (4.8%) | 176 (2.7%) |
| 35 to 64 Years | 914 (7.2%) | 700 (4.7%) |
| 65 to 74 Years | 397 (9.9%) | 513 (12.5%) |
| 75 Years and over | 854 (36.9%) | 1,053 (40.8%) |
Disability Class by Sex by Age in Laguna Niguel
Disability Class: Hearing Difficulty
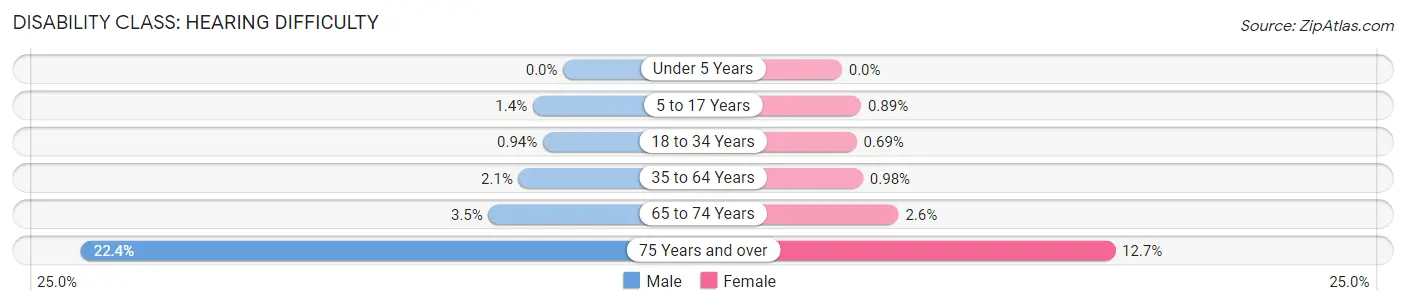
| Age Bracket | Male | Female |
| Under 5 Years | 0 (0.0%) | 0 (0.0%) |
| 5 to 17 Years | 67 (1.4%) | 34 (0.9%) |
| 18 to 34 Years | 57 (0.9%) | 45 (0.7%) |
| 35 to 64 Years | 262 (2.1%) | 145 (1.0%) |
| 65 to 74 Years | 139 (3.5%) | 108 (2.6%) |
| 75 Years and over | 518 (22.4%) | 327 (12.7%) |
Disability Class: Vision Difficulty
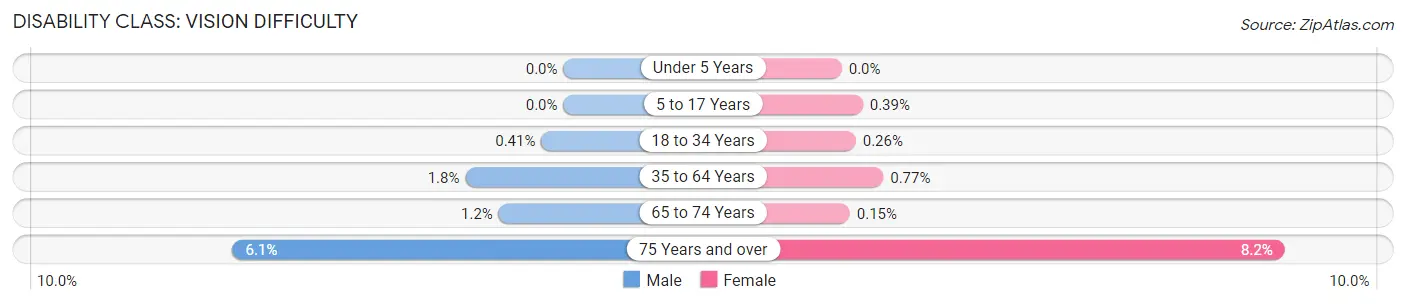
| Age Bracket | Male | Female |
| Under 5 Years | 0 (0.0%) | 0 (0.0%) |
| 5 to 17 Years | 0 (0.0%) | 15 (0.4%) |
| 18 to 34 Years | 25 (0.4%) | 17 (0.3%) |
| 35 to 64 Years | 231 (1.8%) | 115 (0.8%) |
| 65 to 74 Years | 48 (1.2%) | 6 (0.2%) |
| 75 Years and over | 142 (6.1%) | 212 (8.2%) |
Disability Class: Cognitive Difficulty
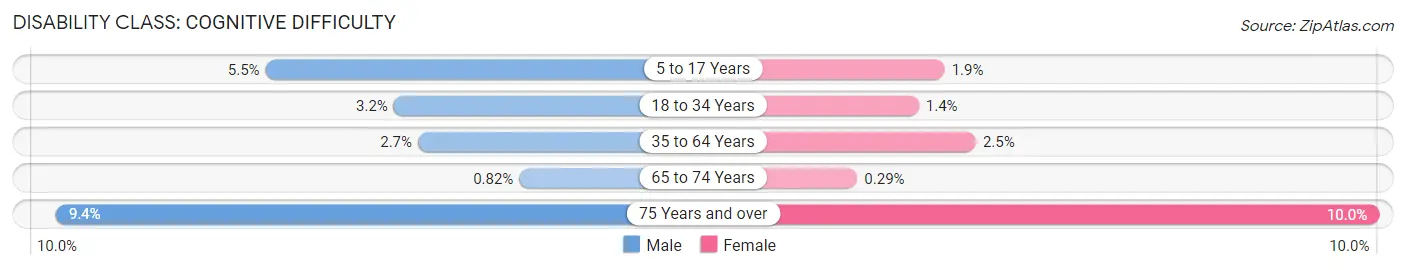
| Age Bracket | Male | Female |
| 5 to 17 Years | 263 (5.5%) | 73 (1.9%) |
| 18 to 34 Years | 191 (3.2%) | 94 (1.4%) |
| 35 to 64 Years | 342 (2.7%) | 370 (2.5%) |
| 65 to 74 Years | 33 (0.8%) | 12 (0.3%) |
| 75 Years and over | 218 (9.4%) | 257 (10.0%) |
Disability Class: Ambulatory Difficulty
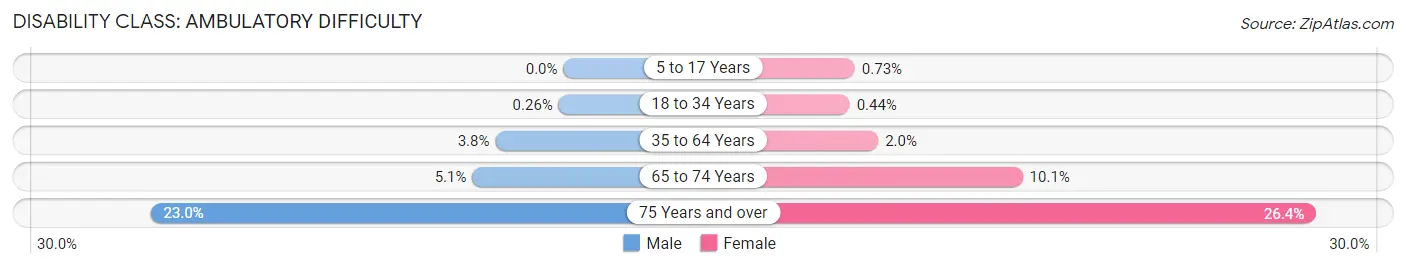
| Age Bracket | Male | Female |
| 5 to 17 Years | 0 (0.0%) | 28 (0.7%) |
| 18 to 34 Years | 16 (0.3%) | 29 (0.4%) |
| 35 to 64 Years | 480 (3.8%) | 301 (2.0%) |
| 65 to 74 Years | 203 (5.1%) | 413 (10.1%) |
| 75 Years and over | 532 (23.0%) | 681 (26.4%) |
Disability Class: Self-Care Difficulty
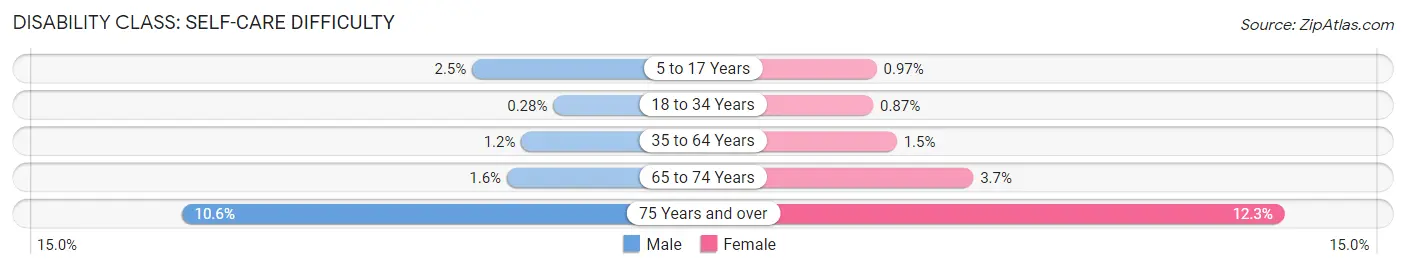
| Age Bracket | Male | Female |
| 5 to 17 Years | 121 (2.5%) | 37 (1.0%) |
| 18 to 34 Years | 17 (0.3%) | 57 (0.9%) |
| 35 to 64 Years | 148 (1.2%) | 228 (1.5%) |
| 65 to 74 Years | 63 (1.6%) | 150 (3.7%) |
| 75 Years and over | 246 (10.6%) | 318 (12.3%) |
Technology Access in Laguna Niguel
Computing Device Access in Laguna Niguel
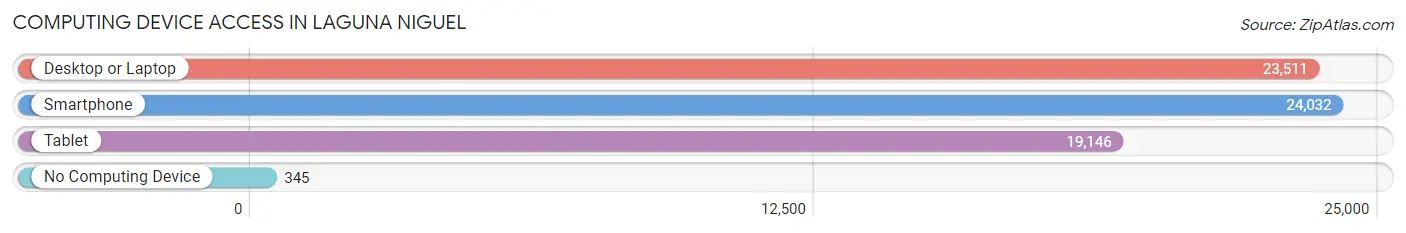
| Device Type | # Households | % Households |
| Desktop or Laptop | 23,511 | 93.1% |
| Smartphone | 24,032 | 95.2% |
| Tablet | 19,146 | 75.9% |
| No Computing Device | 345 | 1.4% |
| Total | 25,239 | 100.0% |
Internet Access in Laguna Niguel
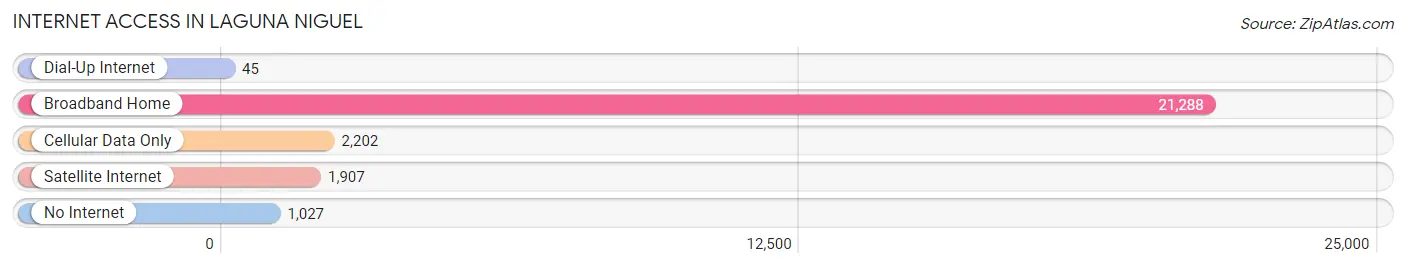
| Internet Type | # Households | % Households |
| Dial-Up Internet | 45 | 0.2% |
| Broadband Home | 21,288 | 84.4% |
| Cellular Data Only | 2,202 | 8.7% |
| Satellite Internet | 1,907 | 7.6% |
| No Internet | 1,027 | 4.1% |
| Total | 25,239 | 100.0% |
Laguna Niguel Summary
Laguna Niguel is a city located in Orange County, California. It is bordered by the cities of Aliso Viejo, Dana Point, Laguna Beach, Mission Viejo, San Juan Capistrano, and San Clemente. The city has a population of 65,723 as of the 2010 census, making it the second-largest city in Orange County by population.
History
The area that is now Laguna Niguel was originally inhabited by the Acjachemen Native American tribe. The area was part of the Rancho Niguel Mexican land grant, which was acquired by Juan Avila in 1842. In 1895, Lewis Moulton and Jean Pierre Daguerre purchased the Rancho Niguel and began developing the area. The Moulton Ranch was eventually subdivided in 1959, and the first homes in the area were built in 1960.
In 1989, the City of Laguna Niguel was incorporated, and the city has since grown to become one of the most affluent cities in Orange County.
Geography
Laguna Niguel is located in south Orange County, California. It is bordered by the cities of Aliso Viejo, Dana Point, Laguna Beach, Mission Viejo, San Juan Capistrano, and San Clemente. The city has a total area of 13.1 square miles, of which 12.9 square miles is land and 0.2 square miles is water.
The city is located in the San Joaquin Hills, which are part of the larger Santa Ana Mountains. The highest point in the city is Niguel Hill, which is 1,083 feet above sea level. The city is also home to several parks, including Aliso and Wood Canyons Wilderness Park, Laguna Niguel Regional Park, and Crown Valley Community Park.
Economy
Laguna Niguel is home to a variety of businesses, including technology, finance, retail, and healthcare. The city is home to several corporate headquarters, including Allergan, Broadcom, and Ingram Micro.
The city is also home to several shopping centers, including the Laguna Niguel Town Center, the Laguna Hills Mall, and the Kaleidoscope Courtyard.
Demographics
As of the 2010 census, Laguna Niguel had a population of 65,723. The racial makeup of the city was 75.3% White, 1.3% African American, 0.4% Native American, 13.2% Asian, 0.2% Pacific Islander, 5.2% from other races, and 4.4% from two or more races. Hispanic or Latino of any race were 17.2% of the population.
The median household income in the city was $93,845, and the median family income was $106,845. The per capita income for the city was $41,945. About 4.2% of families and 5.7% of the population were below the poverty line, including 6.2% of those under age 18 and 4.2% of those age 65 or over.
Common Questions
What is Per Capita Income in Laguna Niguel?
Per Capita income in Laguna Niguel is $74,600.
What is the Median Family Income in Laguna Niguel?
Median Family Income in Laguna Niguel is $162,215.
What is the Median Household income in Laguna Niguel?
Median Household Income in Laguna Niguel is $135,822.
What is Income or Wage Gap in Laguna Niguel?
Income or Wage Gap in Laguna Niguel is 45.5%.
Women in Laguna Niguel earn 54.5 cents for every dollar earned by a man.
What is Inequality or Gini Index in Laguna Niguel?
Inequality or Gini Index in Laguna Niguel is 0.47.
What is the Total Population of Laguna Niguel?
Total Population of Laguna Niguel is 64,259.
What is the Total Male Population of Laguna Niguel?
Total Male Population of Laguna Niguel is 31,080.
What is the Total Female Population of Laguna Niguel?
Total Female Population of Laguna Niguel is 33,179.
What is the Ratio of Males per 100 Females in Laguna Niguel?
There are 93.67 Males per 100 Females in Laguna Niguel.
What is the Ratio of Females per 100 Males in Laguna Niguel?
There are 106.75 Females per 100 Males in Laguna Niguel.
What is the Median Population Age in Laguna Niguel?
Median Population Age in Laguna Niguel is 47.2 Years.
What is the Average Family Size in Laguna Niguel
Average Family Size in Laguna Niguel is 3.0 People.
What is the Average Household Size in Laguna Niguel
Average Household Size in Laguna Niguel is 2.5 People.
How Large is the Labor Force in Laguna Niguel?
There are 36,329 People in the Labor Forcein in Laguna Niguel.
What is the Percentage of People in the Labor Force in Laguna Niguel?
66.2% of People are in the Labor Force in Laguna Niguel.
What is the Unemployment Rate in Laguna Niguel?
Unemployment Rate in Laguna Niguel is 5.5%.