Glendale, CA Map & Demographics
Glendale Map
Glendale Overview
$44,298
PER CAPITA INCOME
$93,823
AVG FAMILY INCOME
$81,219
AVG HOUSEHOLD INCOME
23.1%
WAGE / INCOME GAP [ % ]
76.9¢/ $1
WAGE / INCOME GAP [ $ ]
$11,869
FAMILY INCOME DEFICIT
0.50
INEQUALITY / GINI INDEX
194,512
TOTAL POPULATION
92,399
MALE POPULATION
102,113
FEMALE POPULATION
90.49
MALES / 100 FEMALES
110.51
FEMALES / 100 MALES
41.1
MEDIAN AGE
3.3
AVG FAMILY SIZE
2.6
AVG HOUSEHOLD SIZE
101,750
LABOR FORCE [ PEOPLE ]
62.2%
PERCENT IN LABOR FORCE
8.1%
UNEMPLOYMENT RATE
Income in Glendale
Income Overview in Glendale
Per Capita Income in Glendale is $44,298, while median incomes of families and households are $93,823 and $81,219 respectively.
| Characteristic | Number | Measure |
| Per Capita Income | 194,512 | $44,298 |
| Median Family Income | 47,868 | $93,823 |
| Mean Family Income | 47,868 | $130,279 |
| Median Household Income | 73,104 | $81,219 |
| Mean Household Income | 73,104 | $114,345 |
| Income Deficit | 47,868 | $11,869 |
| Wage / Income Gap (%) | 194,512 | 23.11% |
| Wage / Income Gap ($) | 194,512 | 76.89¢ per $1 |
| Gini / Inequality Index | 194,512 | 0.50 |
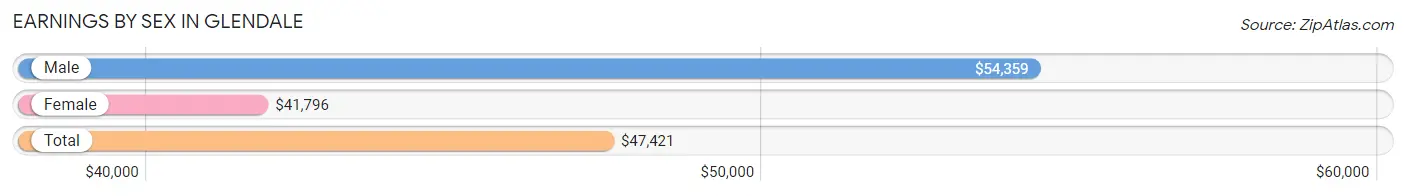
Earnings by Sex in Glendale
Average Earnings in Glendale are $47,421, $54,359 for men and $41,796 for women, a difference of 23.1%.
| Sex | Number | Average Earnings |
| Male | 53,910 (52.9%) | $54,359 |
| Female | 48,086 (47.1%) | $41,796 |
| Total | 101,996 (100.0%) | $47,421 |
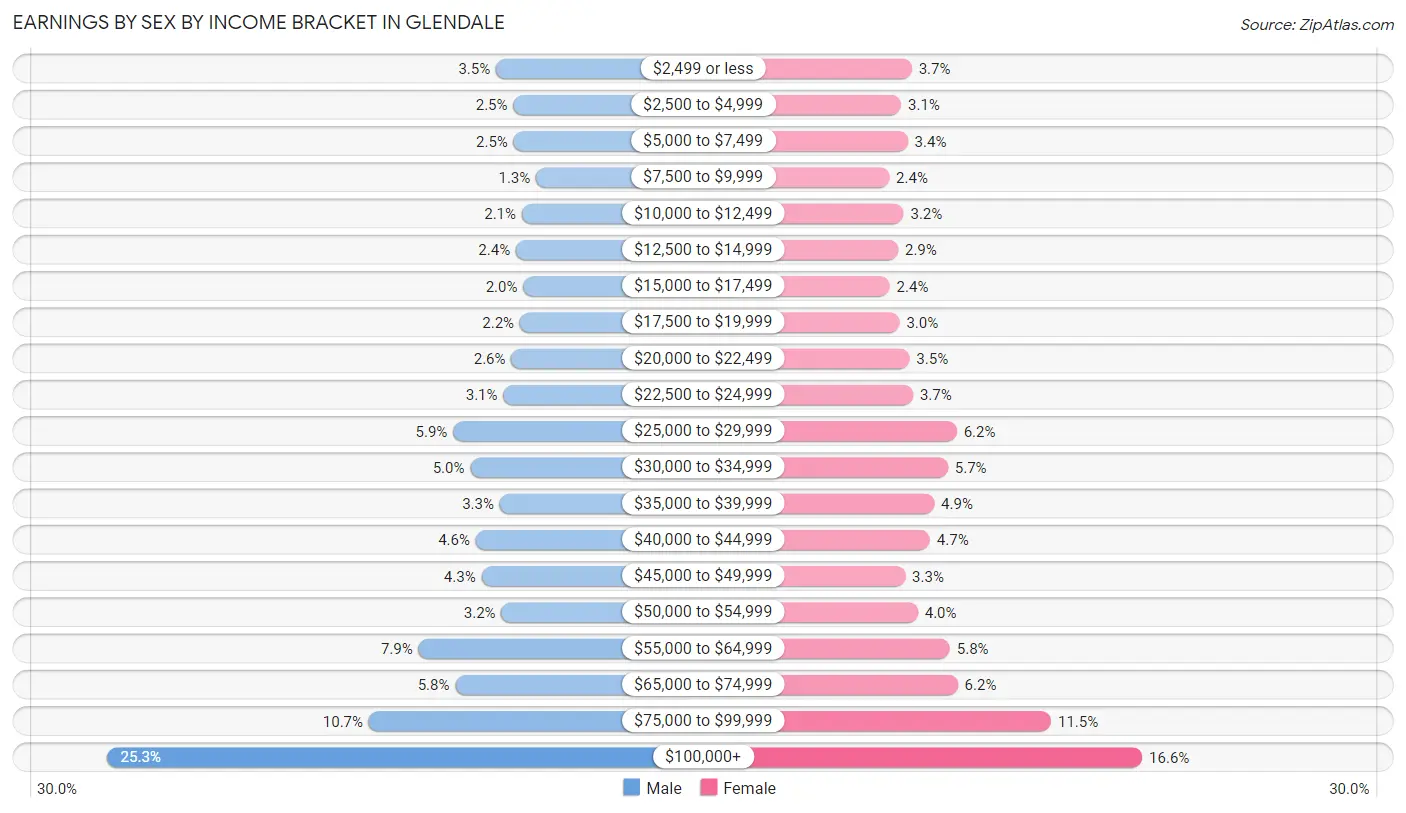
Earnings by Sex by Income Bracket in Glendale
The most common earnings brackets in Glendale are $100,000+ for men (13,653 | 25.3%) and $100,000+ for women (7,981 | 16.6%).
| Income | Male | Female |
| $2,499 or less | 1,888 (3.5%) | 1,753 (3.6%) |
| $2,500 to $4,999 | 1,365 (2.5%) | 1,469 (3.0%) |
| $5,000 to $7,499 | 1,352 (2.5%) | 1,646 (3.4%) |
| $7,500 to $9,999 | 672 (1.3%) | 1,144 (2.4%) |
| $10,000 to $12,499 | 1,103 (2.1%) | 1,533 (3.2%) |
| $12,500 to $14,999 | 1,283 (2.4%) | 1,384 (2.9%) |
| $15,000 to $17,499 | 1,064 (2.0%) | 1,161 (2.4%) |
| $17,500 to $19,999 | 1,163 (2.2%) | 1,422 (3.0%) |
| $20,000 to $22,499 | 1,423 (2.6%) | 1,694 (3.5%) |
| $22,500 to $24,999 | 1,664 (3.1%) | 1,790 (3.7%) |
| $25,000 to $29,999 | 3,186 (5.9%) | 2,971 (6.2%) |
| $30,000 to $34,999 | 2,669 (5.0%) | 2,733 (5.7%) |
| $35,000 to $39,999 | 1,771 (3.3%) | 2,363 (4.9%) |
| $40,000 to $44,999 | 2,502 (4.6%) | 2,244 (4.7%) |
| $45,000 to $49,999 | 2,331 (4.3%) | 1,579 (3.3%) |
| $50,000 to $54,999 | 1,725 (3.2%) | 1,918 (4.0%) |
| $55,000 to $64,999 | 4,235 (7.9%) | 2,783 (5.8%) |
| $65,000 to $74,999 | 3,122 (5.8%) | 2,998 (6.2%) |
| $75,000 to $99,999 | 5,739 (10.6%) | 5,520 (11.5%) |
| $100,000+ | 13,653 (25.3%) | 7,981 (16.6%) |
| Total | 53,910 (100.0%) | 48,086 (100.0%) |
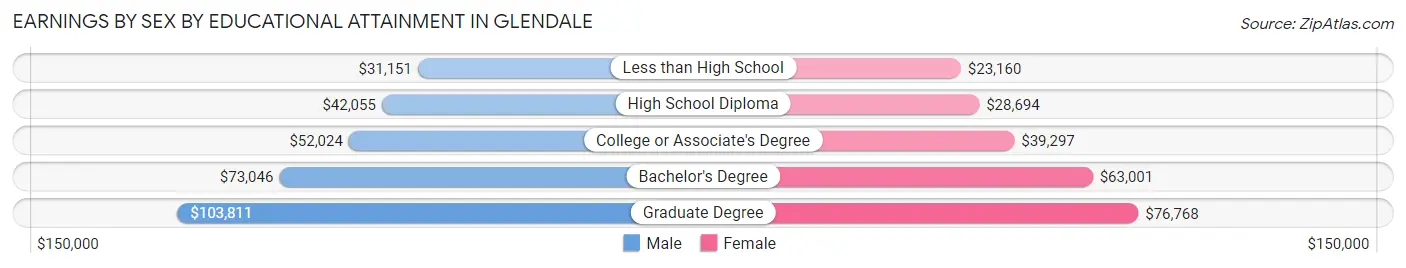
Earnings by Sex by Educational Attainment in Glendale
Average earnings in Glendale are $58,541 for men and $46,751 for women, a difference of 20.1%. Men with an educational attainment of graduate degree enjoy the highest average annual earnings of $103,811, while those with less than high school education earn the least with $31,151. Women with an educational attainment of graduate degree earn the most with the average annual earnings of $76,768, while those with less than high school education have the smallest earnings of $23,160.
| Educational Attainment | Male Income | Female Income |
| Less than High School | $31,151 | $23,160 |
| High School Diploma | $42,055 | $28,694 |
| College or Associate's Degree | $52,024 | $39,297 |
| Bachelor's Degree | $73,046 | $63,001 |
| Graduate Degree | $103,811 | $76,768 |
| Total | $58,541 | $46,751 |
Family Income in Glendale
Family Income Brackets in Glendale
According to the Glendale family income data, there are 9,143 families falling into the $200,000+ income range, which is the most common income bracket and makes up 19.1% of all families. Conversely, the $10,000 to $14,999 income bracket is the least frequent group with only 1,101 families (2.3%) belonging to this category.
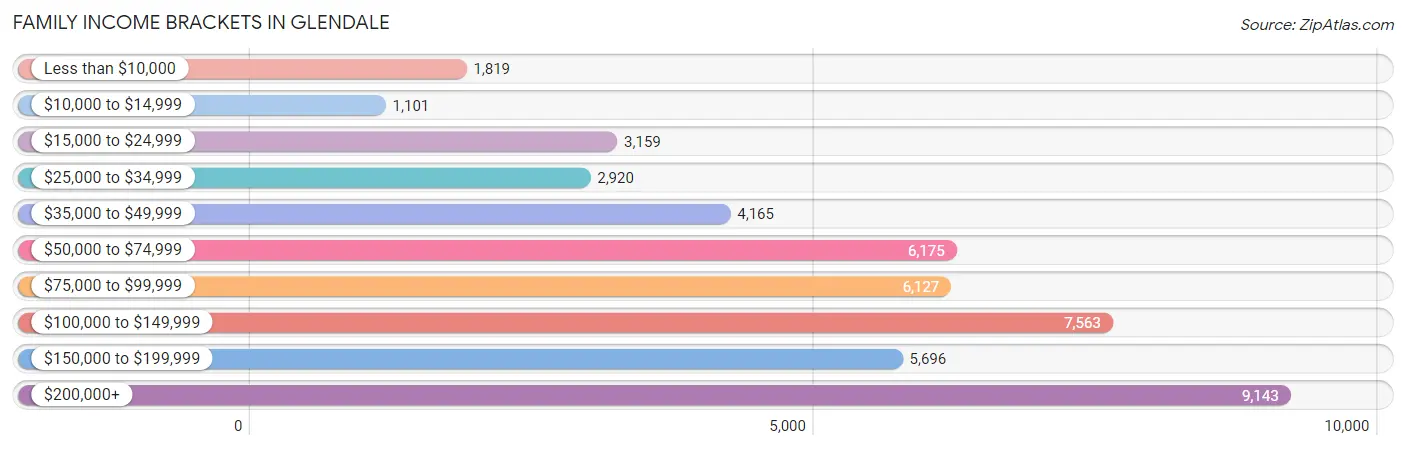
| Income Bracket | # Families | % Families |
| Less than $10,000 | 1,819 | 3.8% |
| $10,000 to $14,999 | 1,101 | 2.3% |
| $15,000 to $24,999 | 3,159 | 6.6% |
| $25,000 to $34,999 | 2,920 | 6.1% |
| $35,000 to $49,999 | 4,165 | 8.7% |
| $50,000 to $74,999 | 6,175 | 12.9% |
| $75,000 to $99,999 | 6,127 | 12.8% |
| $100,000 to $149,999 | 7,563 | 15.8% |
| $150,000 to $199,999 | 5,696 | 11.9% |
| $200,000+ | 9,143 | 19.1% |
Family Income by Famaliy Size in Glendale
6-person families (990 | 2.1%) account for the highest median family income in Glendale with $184,792 per family, while 2-person families (18,409 | 38.5%) have the highest median income of $37,488 per family member.
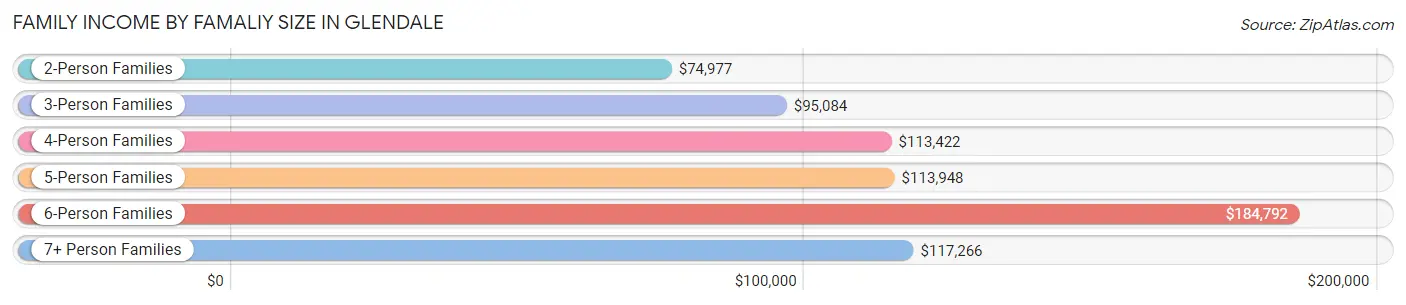
| Income Bracket | # Families | Median Income |
| 2-Person Families | 18,409 (38.5%) | $74,977 |
| 3-Person Families | 12,404 (25.9%) | $95,084 |
| 4-Person Families | 11,589 (24.2%) | $113,422 |
| 5-Person Families | 4,007 (8.4%) | $113,948 |
| 6-Person Families | 990 (2.1%) | $184,792 |
| 7+ Person Families | 469 (1.0%) | $117,266 |
| Total | 47,868 (100.0%) | $93,823 |
Family Income by Number of Earners in Glendale
The median family income in Glendale is $93,823, with families comprising 3+ earners (6,241) having the highest median family income of $150,045, while families with no earners (6,655) have the lowest median family income of $22,689, accounting for 13.0% and 13.9% of families, respectively.
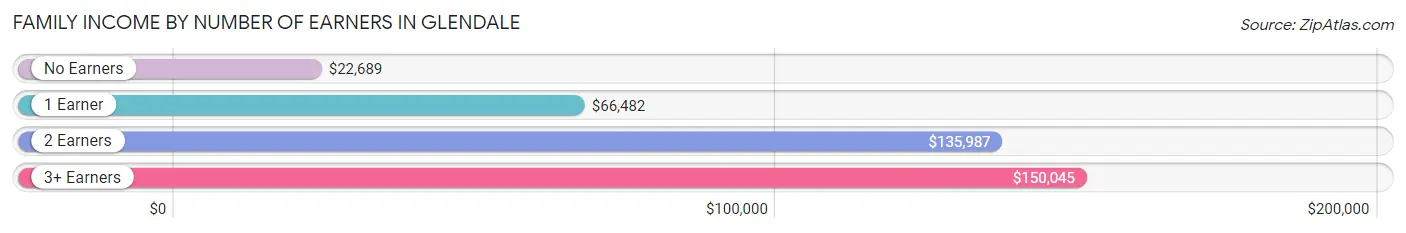
| Number of Earners | # Families | Median Income |
| No Earners | 6,655 (13.9%) | $22,689 |
| 1 Earner | 15,030 (31.4%) | $66,482 |
| 2 Earners | 19,942 (41.7%) | $135,987 |
| 3+ Earners | 6,241 (13.0%) | $150,045 |
| Total | 47,868 (100.0%) | $93,823 |
Household Income in Glendale
Household Income Brackets in Glendale
With 11,477 households falling in the category, the $100,000 to $149,999 income range is the most frequent in Glendale, accounting for 15.7% of all households. In contrast, only 3,875 households (5.3%) fall into the less than $10,000 income bracket, making it the least populous group.
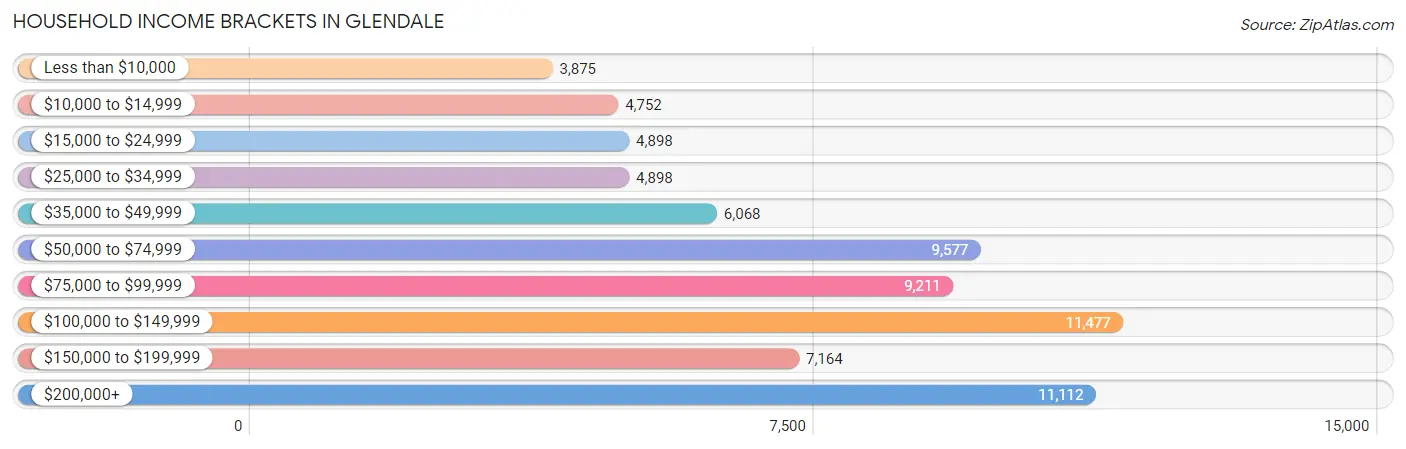
| Income Bracket | # Households | % Households |
| Less than $10,000 | 3,875 | 5.3% |
| $10,000 to $14,999 | 4,752 | 6.5% |
| $15,000 to $24,999 | 4,898 | 6.7% |
| $25,000 to $34,999 | 4,898 | 6.7% |
| $35,000 to $49,999 | 6,068 | 8.3% |
| $50,000 to $74,999 | 9,577 | 13.1% |
| $75,000 to $99,999 | 9,211 | 12.6% |
| $100,000 to $149,999 | 11,477 | 15.7% |
| $150,000 to $199,999 | 7,164 | 9.8% |
| $200,000+ | 11,112 | 15.2% |
Household Income by Householder Age in Glendale
The median household income in Glendale is $81,219, with the highest median household income of $97,988 found in the 25 to 44 years age bracket for the primary householder. A total of 25,053 households (34.3%) fall into this category. Meanwhile, the 65+ years age bracket for the primary householder has the lowest median household income of $43,229, with 19,318 households (26.4%) in this group.
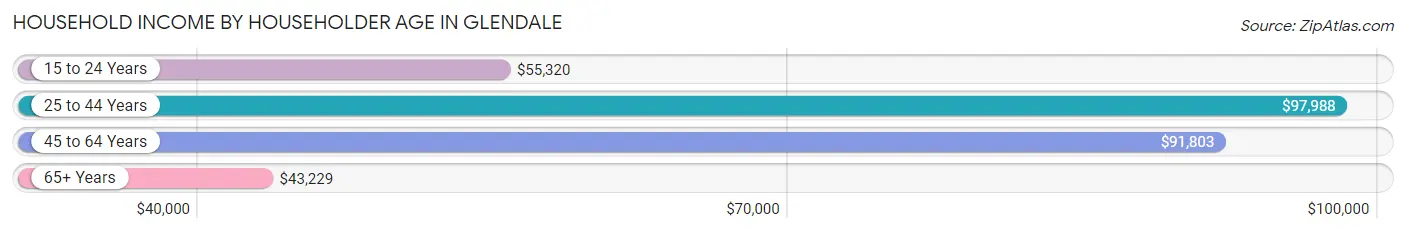
| Income Bracket | # Households | Median Income |
| 15 to 24 Years | 1,699 (2.3%) | $55,320 |
| 25 to 44 Years | 25,053 (34.3%) | $97,988 |
| 45 to 64 Years | 27,034 (37.0%) | $91,803 |
| 65+ Years | 19,318 (26.4%) | $43,229 |
| Total | 73,104 (100.0%) | $81,219 |
Poverty in Glendale
Income Below Poverty by Sex and Age in Glendale
With 12.2% poverty level for males and 14.4% for females among the residents of Glendale, 12 to 14 year old males and 75 year old and over females are the most vulnerable to poverty, with 566 males (18.4%) and 2,540 females (27.2%) in their respective age groups living below the poverty level.
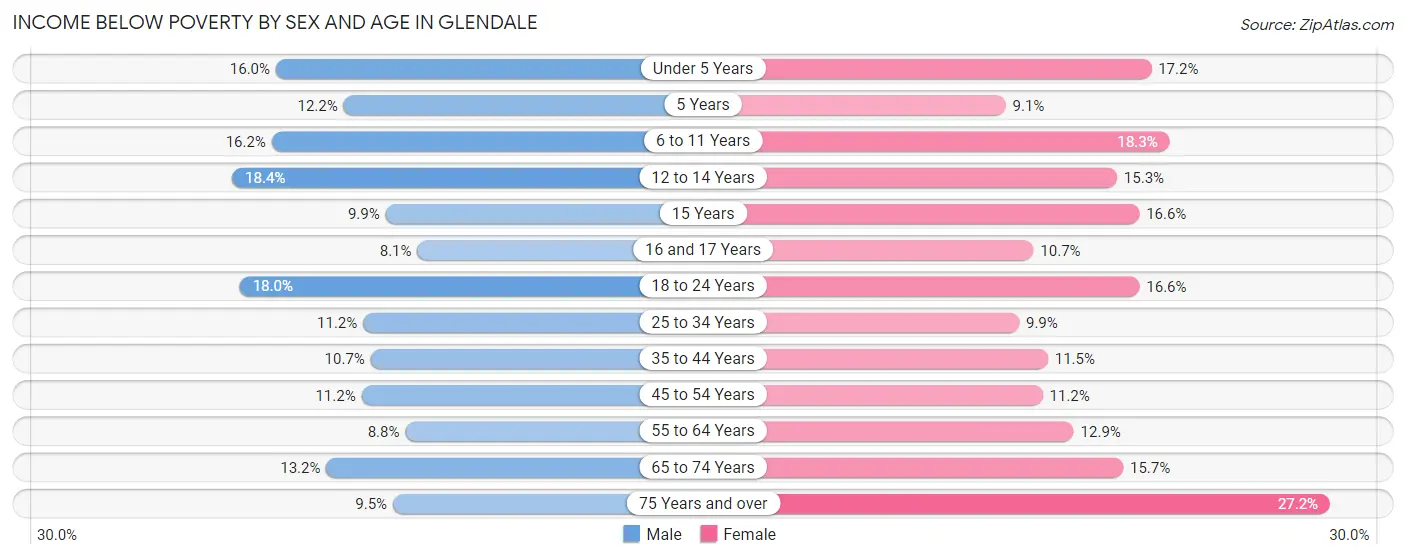
| Age Bracket | Male | Female |
| Under 5 Years | 762 (16.0%) | 804 (17.2%) |
| 5 Years | 94 (12.2%) | 87 (9.1%) |
| 6 to 11 Years | 867 (16.2%) | 1,104 (18.2%) |
| 12 to 14 Years | 566 (18.4%) | 446 (15.3%) |
| 15 Years | 90 (9.9%) | 224 (16.6%) |
| 16 and 17 Years | 163 (8.1%) | 225 (10.7%) |
| 18 to 24 Years | 1,394 (18.0%) | 1,203 (16.6%) |
| 25 to 34 Years | 1,699 (11.2%) | 1,542 (9.9%) |
| 35 to 44 Years | 1,351 (10.7%) | 1,514 (11.5%) |
| 45 to 54 Years | 1,427 (11.2%) | 1,544 (11.2%) |
| 55 to 64 Years | 1,063 (8.8%) | 1,685 (12.9%) |
| 65 to 74 Years | 1,076 (13.2%) | 1,712 (15.7%) |
| 75 Years and over | 610 (9.5%) | 2,540 (27.2%) |
| Total | 11,162 (12.2%) | 14,630 (14.4%) |
Income Above Poverty by Sex and Age in Glendale
According to the poverty statistics in Glendale, males aged 16 and 17 years and females aged 5 years are the age groups that are most secure financially, with 91.9% of males and 90.9% of females in these age groups living above the poverty line.
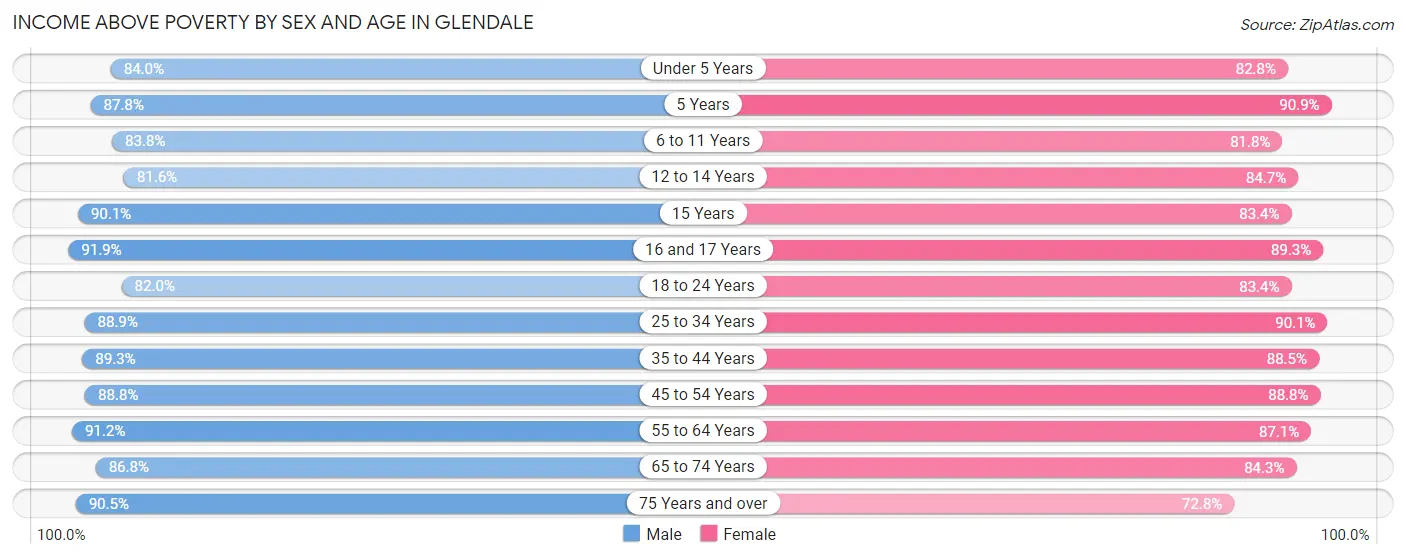
| Age Bracket | Male | Female |
| Under 5 Years | 3,998 (84.0%) | 3,863 (82.8%) |
| 5 Years | 674 (87.8%) | 867 (90.9%) |
| 6 to 11 Years | 4,471 (83.8%) | 4,946 (81.8%) |
| 12 to 14 Years | 2,504 (81.6%) | 2,466 (84.7%) |
| 15 Years | 819 (90.1%) | 1,129 (83.4%) |
| 16 and 17 Years | 1,841 (91.9%) | 1,884 (89.3%) |
| 18 to 24 Years | 6,340 (82.0%) | 6,058 (83.4%) |
| 25 to 34 Years | 13,540 (88.8%) | 14,074 (90.1%) |
| 35 to 44 Years | 11,245 (89.3%) | 11,687 (88.5%) |
| 45 to 54 Years | 11,272 (88.8%) | 12,271 (88.8%) |
| 55 to 64 Years | 11,020 (91.2%) | 11,364 (87.1%) |
| 65 to 74 Years | 7,074 (86.8%) | 9,221 (84.3%) |
| 75 Years and over | 5,817 (90.5%) | 6,804 (72.8%) |
| Total | 80,615 (87.8%) | 86,634 (85.6%) |
Income Below Poverty Among Married-Couple Families in Glendale
The poverty statistics for married-couple families in Glendale show that 8.3% or 2,883 of the total 34,764 families live below the poverty line. Families with 5 or more children have the highest poverty rate of 44.0%, comprising of 22 families. On the other hand, families with no children have the lowest poverty rate of 6.0%, which includes 1,182 families.
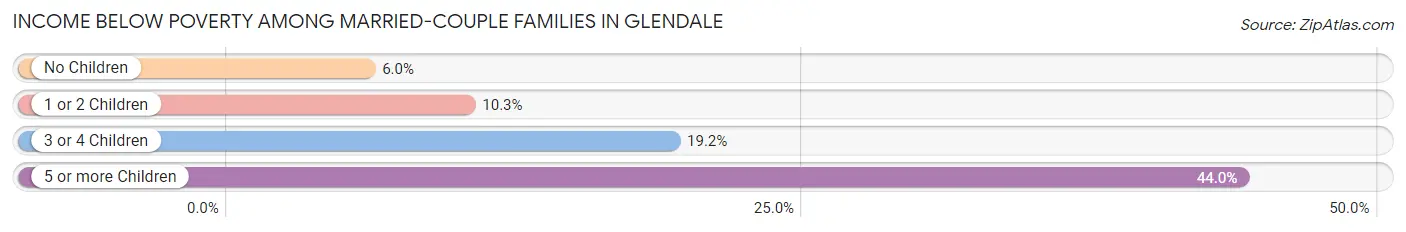
| Children | Above Poverty | Below Poverty |
| No Children | 18,631 (94.0%) | 1,182 (6.0%) |
| 1 or 2 Children | 11,954 (89.7%) | 1,377 (10.3%) |
| 3 or 4 Children | 1,268 (80.8%) | 302 (19.2%) |
| 5 or more Children | 28 (56.0%) | 22 (44.0%) |
| Total | 31,881 (91.7%) | 2,883 (8.3%) |
Income Below Poverty Among Single-Parent Households in Glendale
According to the poverty data in Glendale, 12.6% or 558 single-father households and 14.4% or 1,246 single-mother households are living below the poverty line. Among single-father households, those with 3 or 4 children have the highest poverty rate, with 89 households (50.3%) experiencing poverty. Likewise, among single-mother households, those with 3 or 4 children have the highest poverty rate, with 92 households (41.3%) falling below the poverty line.
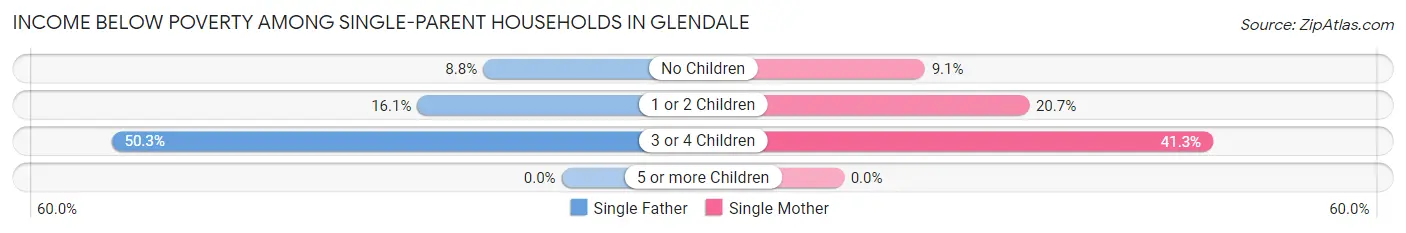
| Children | Single Father | Single Mother |
| No Children | 262 (8.8%) | 457 (9.1%) |
| 1 or 2 Children | 207 (16.1%) | 697 (20.7%) |
| 3 or 4 Children | 89 (50.3%) | 92 (41.3%) |
| 5 or more Children | 0 (0.0%) | 0 (0.0%) |
| Total | 558 (12.6%) | 1,246 (14.4%) |
Income Below Poverty Among Married-Couple vs Single-Parent Households in Glendale
The poverty data for Glendale shows that 2,883 of the married-couple family households (8.3%) and 1,804 of the single-parent households (13.8%) are living below the poverty level. Within the married-couple family households, those with 5 or more children have the highest poverty rate, with 22 households (44.0%) falling below the poverty line. Among the single-parent households, those with 3 or 4 children have the highest poverty rate, with 181 household (45.3%) living below poverty.
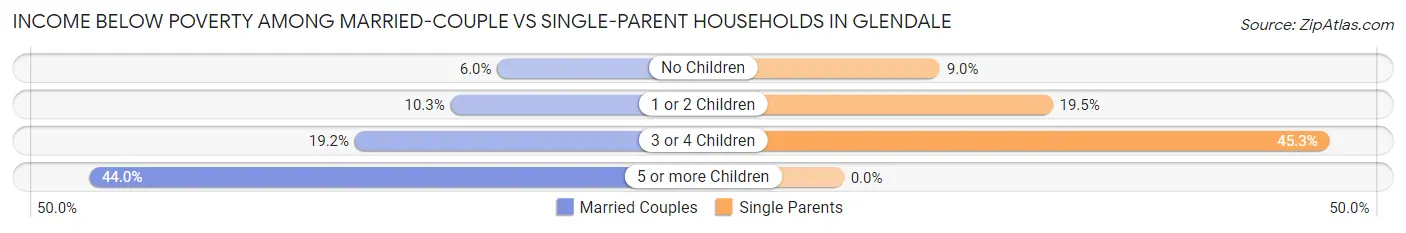
| Children | Married-Couple Families | Single-Parent Households |
| No Children | 1,182 (6.0%) | 719 (8.9%) |
| 1 or 2 Children | 1,377 (10.3%) | 904 (19.5%) |
| 3 or 4 Children | 302 (19.2%) | 181 (45.3%) |
| 5 or more Children | 22 (44.0%) | 0 (0.0%) |
| Total | 2,883 (8.3%) | 1,804 (13.8%) |
Race in Glendale
The most populous races in Glendale are White / Caucasian (133,401 | 68.6%), Hispanic or Latino (36,701 | 18.9%), and Asian (26,730 | 13.7%).
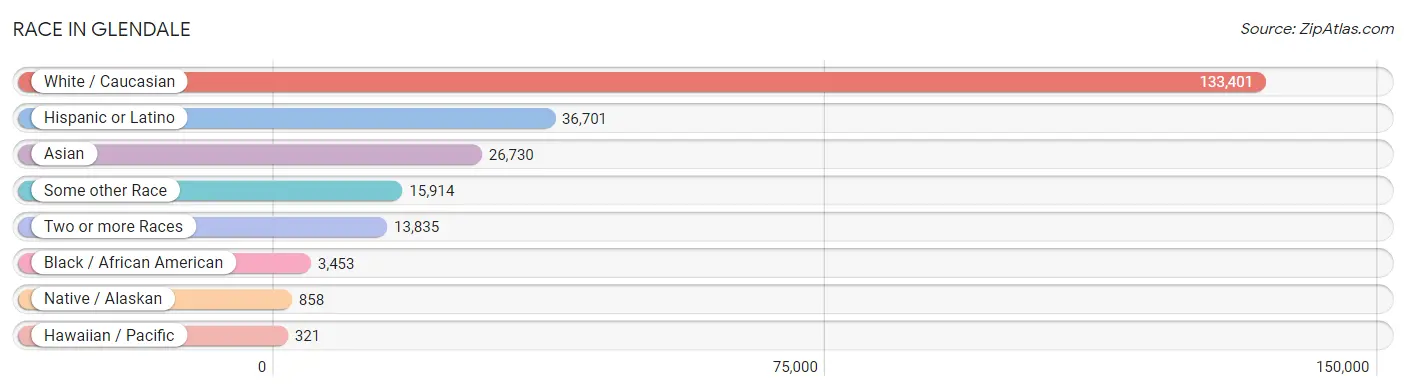
| Race | # Population | % Population |
| Asian | 26,730 | 13.7% |
| Black / African American | 3,453 | 1.8% |
| Hawaiian / Pacific | 321 | 0.2% |
| Hispanic or Latino | 36,701 | 18.9% |
| Native / Alaskan | 858 | 0.4% |
| White / Caucasian | 133,401 | 68.6% |
| Two or more Races | 13,835 | 7.1% |
| Some other Race | 15,914 | 8.2% |
| Total | 194,512 | 100.0% |
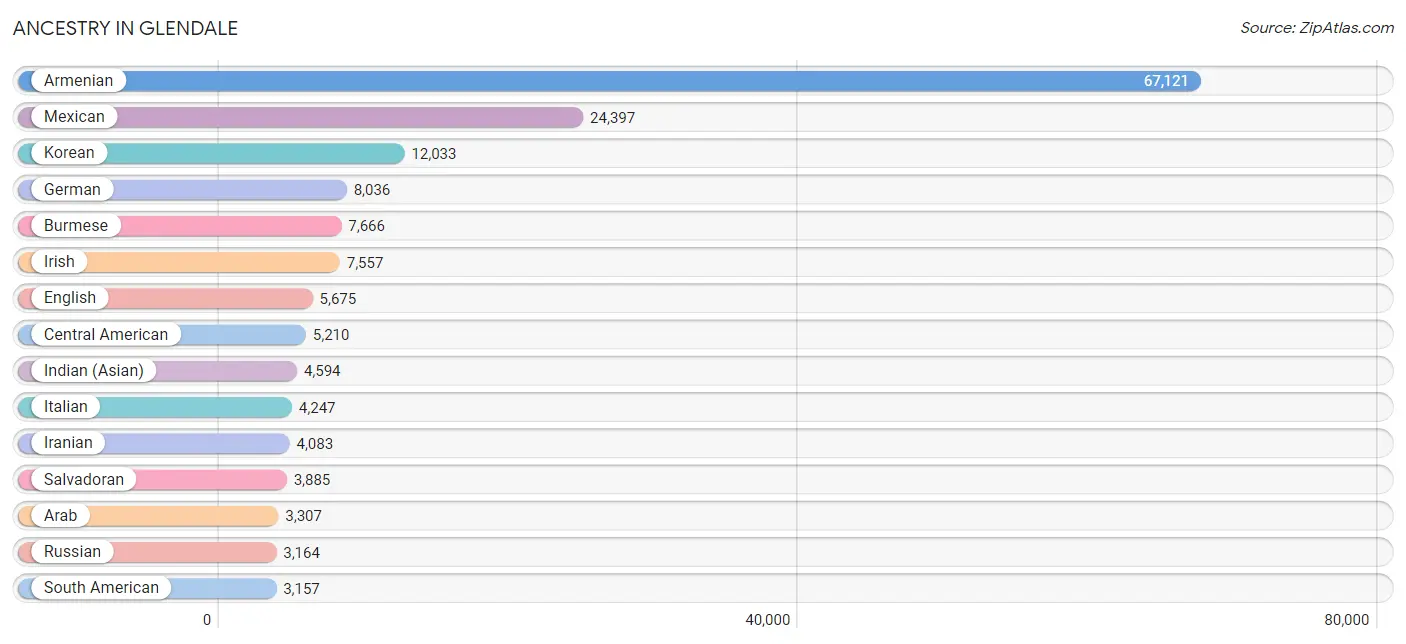
Ancestry in Glendale
The most populous ancestries reported in Glendale are Armenian (67,121 | 34.5%), Mexican (24,397 | 12.5%), Korean (12,033 | 6.2%), German (8,036 | 4.1%), and Burmese (7,666 | 3.9%), together accounting for 61.3% of all Glendale residents.
| Ancestry | # Population | % Population |
| Afghan | 264 | 0.1% |
| African | 210 | 0.1% |
| Albanian | 29 | 0.0% |
| American | 2,535 | 1.3% |
| Apache | 161 | 0.1% |
| Arab | 3,307 | 1.7% |
| Argentinean | 447 | 0.2% |
| Armenian | 67,121 | 34.5% |
| Assyrian / Chaldean / Syriac | 137 | 0.1% |
| Australian | 143 | 0.1% |
| Austrian | 392 | 0.2% |
| Bangladeshi | 23 | 0.0% |
| Basque | 119 | 0.1% |
| Belgian | 28 | 0.0% |
| Belizean | 64 | 0.0% |
| Bhutanese | 2,092 | 1.1% |
| Blackfeet | 83 | 0.0% |
| Bolivian | 31 | 0.0% |
| Brazilian | 243 | 0.1% |
| British | 730 | 0.4% |
| Bulgarian | 65 | 0.0% |
| Burmese | 7,666 | 3.9% |
| Canadian | 254 | 0.1% |
| Central American | 5,210 | 2.7% |
| Central American Indian | 160 | 0.1% |
| Cherokee | 46 | 0.0% |
| Chickasaw | 9 | 0.0% |
| Chilean | 79 | 0.0% |
| Choctaw | 10 | 0.0% |
| Colombian | 1,075 | 0.5% |
| Costa Rican | 191 | 0.1% |
| Creek | 29 | 0.0% |
| Croatian | 145 | 0.1% |
| Cuban | 852 | 0.4% |
| Czech | 426 | 0.2% |
| Czechoslovakian | 71 | 0.0% |
| Danish | 436 | 0.2% |
| Dominican | 139 | 0.1% |
| Dutch | 421 | 0.2% |
| Eastern European | 474 | 0.2% |
| Ecuadorian | 509 | 0.3% |
| Egyptian | 605 | 0.3% |
| English | 5,675 | 2.9% |
| Estonian | 17 | 0.0% |
| Ethiopian | 76 | 0.0% |
| European | 1,649 | 0.9% |
| Filipino | 335 | 0.2% |
| Finnish | 248 | 0.1% |
| French | 1,983 | 1.0% |
| French Canadian | 206 | 0.1% |
| German | 8,036 | 4.1% |
| Ghanaian | 6 | 0.0% |
| Greek | 560 | 0.3% |
| Guamanian / Chamorro | 5 | 0.0% |
| Guatemalan | 715 | 0.4% |
| Guyanese | 55 | 0.0% |
| Haitian | 23 | 0.0% |
| Honduran | 294 | 0.2% |
| Hungarian | 514 | 0.3% |
| Icelander | 37 | 0.0% |
| Indian (Asian) | 4,594 | 2.4% |
| Indonesian | 104 | 0.1% |
| Iranian | 4,083 | 2.1% |
| Iraqi | 408 | 0.2% |
| Irish | 7,557 | 3.9% |
| Israeli | 47 | 0.0% |
| Italian | 4,247 | 2.2% |
| Jamaican | 115 | 0.1% |
| Japanese | 39 | 0.0% |
| Jordanian | 117 | 0.1% |
| Kenyan | 20 | 0.0% |
| Korean | 12,033 | 6.2% |
| Laotian | 225 | 0.1% |
| Latvian | 45 | 0.0% |
| Lebanese | 813 | 0.4% |
| Lithuanian | 232 | 0.1% |
| Macedonian | 10 | 0.0% |
| Malaysian | 42 | 0.0% |
| Mexican | 24,397 | 12.5% |
| Mexican American Indian | 615 | 0.3% |
| Mongolian | 7 | 0.0% |
| Moroccan | 65 | 0.0% |
| Native Hawaiian | 152 | 0.1% |
| Navajo | 15 | 0.0% |
| Nicaraguan | 78 | 0.0% |
| Nigerian | 61 | 0.0% |
| Northern European | 153 | 0.1% |
| Norwegian | 789 | 0.4% |
| Pakistani | 409 | 0.2% |
| Palestinian | 91 | 0.1% |
| Panamanian | 20 | 0.0% |
| Pennsylvania German | 8 | 0.0% |
| Peruvian | 462 | 0.2% |
| Pima | 5 | 0.0% |
| Polish | 2,076 | 1.1% |
| Portuguese | 253 | 0.1% |
| Pueblo | 6 | 0.0% |
| Puerto Rican | 710 | 0.4% |
| Romanian | 222 | 0.1% |
| Russian | 3,164 | 1.6% |
| Salvadoran | 3,885 | 2.0% |
| Samoan | 277 | 0.1% |
| Scandinavian | 216 | 0.1% |
| Scotch-Irish | 541 | 0.3% |
| Scottish | 1,521 | 0.8% |
| Seminole | 42 | 0.0% |
| Senegalese | 8 | 0.0% |
| Serbian | 42 | 0.0% |
| Sioux | 48 | 0.0% |
| Slovak | 181 | 0.1% |
| Slovene | 61 | 0.0% |
| South African | 49 | 0.0% |
| South American | 3,157 | 1.6% |
| South American Indian | 44 | 0.0% |
| Spaniard | 1,063 | 0.5% |
| Spanish | 308 | 0.2% |
| Sri Lankan | 523 | 0.3% |
| Subsaharan African | 450 | 0.2% |
| Swedish | 827 | 0.4% |
| Swiss | 268 | 0.1% |
| Syrian | 639 | 0.3% |
| Thai | 2,270 | 1.2% |
| Tlingit-Haida | 4 | 0.0% |
| Trinidadian and Tobagonian | 28 | 0.0% |
| Turkish | 75 | 0.0% |
| Ukrainian | 776 | 0.4% |
| Uruguayan | 158 | 0.1% |
| Venezuelan | 348 | 0.2% |
| Welsh | 376 | 0.2% |
| West Indian | 27 | 0.0% |
| Yaqui | 32 | 0.0% |
| Yugoslavian | 44 | 0.0% | View All 132 Rows |
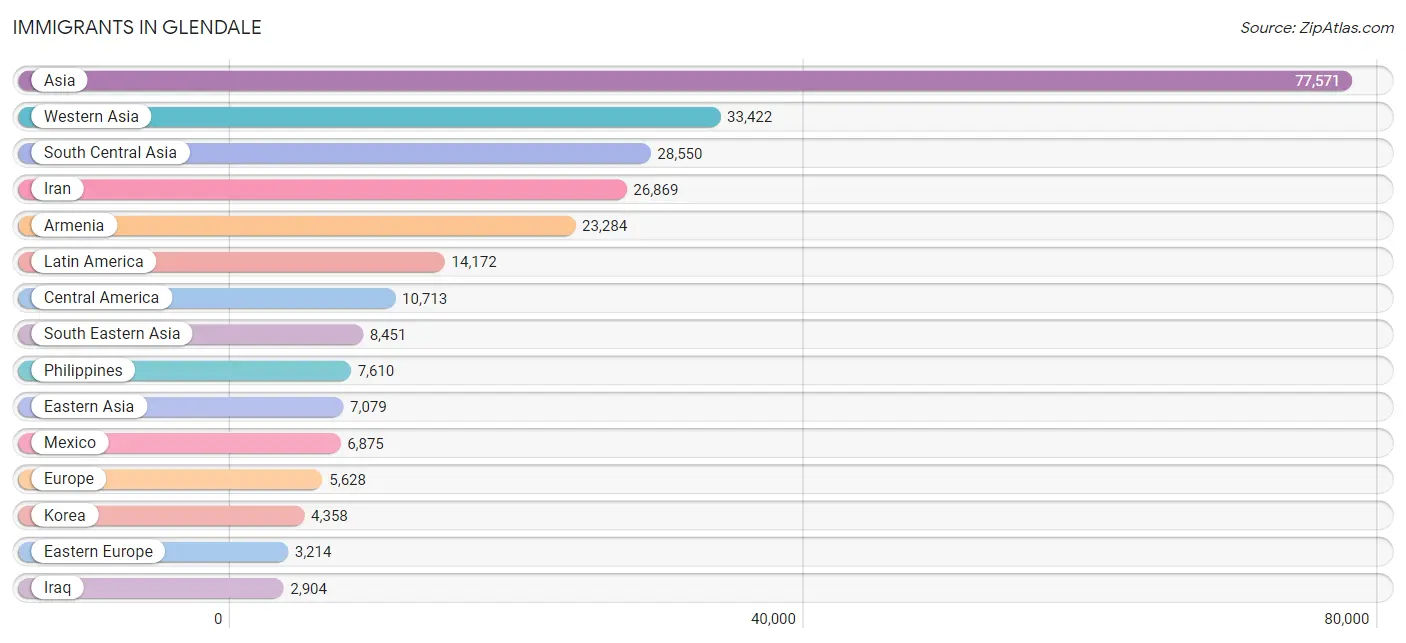
Immigrants in Glendale
The most numerous immigrant groups reported in Glendale came from Asia (77,571 | 39.9%), Western Asia (33,422 | 17.2%), South Central Asia (28,550 | 14.7%), Iran (26,869 | 13.8%), and Armenia (23,284 | 12.0%), together accounting for 97.5% of all Glendale residents.
| Immigration Origin | # Population | % Population |
| Afghanistan | 176 | 0.1% |
| Africa | 870 | 0.4% |
| Argentina | 413 | 0.2% |
| Armenia | 23,284 | 12.0% |
| Asia | 77,571 | 39.9% |
| Australia | 180 | 0.1% |
| Austria | 63 | 0.0% |
| Bangladesh | 192 | 0.1% |
| Belarus | 63 | 0.0% |
| Belgium | 35 | 0.0% |
| Bolivia | 26 | 0.0% |
| Brazil | 277 | 0.1% |
| Bulgaria | 197 | 0.1% |
| Cambodia | 2 | 0.0% |
| Canada | 810 | 0.4% |
| Caribbean | 755 | 0.4% |
| Central America | 10,713 | 5.5% |
| Chile | 50 | 0.0% |
| China | 2,068 | 1.1% |
| Colombia | 815 | 0.4% |
| Costa Rica | 50 | 0.0% |
| Croatia | 70 | 0.0% |
| Cuba | 539 | 0.3% |
| Czechoslovakia | 31 | 0.0% |
| Denmark | 57 | 0.0% |
| Dominican Republic | 67 | 0.0% |
| Eastern Africa | 80 | 0.0% |
| Eastern Asia | 7,079 | 3.6% |
| Eastern Europe | 3,214 | 1.7% |
| Ecuador | 196 | 0.1% |
| Egypt | 586 | 0.3% |
| El Salvador | 2,598 | 1.3% |
| England | 375 | 0.2% |
| Ethiopia | 76 | 0.0% |
| Europe | 5,628 | 2.9% |
| France | 210 | 0.1% |
| Germany | 296 | 0.2% |
| Greece | 211 | 0.1% |
| Guatemala | 833 | 0.4% |
| Guyana | 42 | 0.0% |
| Haiti | 3 | 0.0% |
| Honduras | 230 | 0.1% |
| Hong Kong | 215 | 0.1% |
| Hungary | 52 | 0.0% |
| India | 936 | 0.5% |
| Indonesia | 177 | 0.1% |
| Iran | 26,869 | 13.8% |
| Iraq | 2,904 | 1.5% |
| Ireland | 103 | 0.1% |
| Israel | 151 | 0.1% |
| Italy | 285 | 0.2% |
| Jamaica | 69 | 0.0% |
| Japan | 653 | 0.3% |
| Jordan | 144 | 0.1% |
| Kazakhstan | 140 | 0.1% |
| Korea | 4,358 | 2.2% |
| Kuwait | 100 | 0.1% |
| Laos | 10 | 0.0% |
| Latin America | 14,172 | 7.3% |
| Latvia | 12 | 0.0% |
| Lebanon | 2,456 | 1.3% |
| Lithuania | 9 | 0.0% |
| Malaysia | 20 | 0.0% |
| Mexico | 6,875 | 3.5% |
| Moldova | 64 | 0.0% |
| Morocco | 65 | 0.0% |
| Nepal | 14 | 0.0% |
| Netherlands | 53 | 0.0% |
| Nicaragua | 92 | 0.1% |
| Nigeria | 16 | 0.0% |
| North Macedonia | 11 | 0.0% |
| Northern Africa | 669 | 0.3% |
| Northern Europe | 991 | 0.5% |
| Norway | 5 | 0.0% |
| Oceania | 342 | 0.2% |
| Pakistan | 129 | 0.1% |
| Panama | 35 | 0.0% |
| Peru | 325 | 0.2% |
| Philippines | 7,610 | 3.9% |
| Poland | 204 | 0.1% |
| Portugal | 20 | 0.0% |
| Romania | 197 | 0.1% |
| Russia | 1,712 | 0.9% |
| Scotland | 18 | 0.0% |
| Serbia | 9 | 0.0% |
| Singapore | 12 | 0.0% |
| South Africa | 71 | 0.0% |
| South America | 2,704 | 1.4% |
| South Central Asia | 28,550 | 14.7% |
| South Eastern Asia | 8,451 | 4.3% |
| Southern Europe | 663 | 0.3% |
| Spain | 129 | 0.1% |
| Sri Lanka | 14 | 0.0% |
| Sudan | 18 | 0.0% |
| Sweden | 203 | 0.1% |
| Switzerland | 84 | 0.0% |
| Syria | 1,796 | 0.9% |
| Taiwan | 454 | 0.2% |
| Thailand | 305 | 0.2% |
| Trinidad and Tobago | 37 | 0.0% |
| Turkey | 292 | 0.2% |
| Ukraine | 185 | 0.1% |
| Uruguay | 158 | 0.1% |
| Uzbekistan | 80 | 0.0% |
| Venezuela | 402 | 0.2% |
| Vietnam | 295 | 0.2% |
| West Indies | 26 | 0.0% |
| Western Africa | 16 | 0.0% |
| Western Asia | 33,422 | 17.2% |
| Western Europe | 741 | 0.4% | View All 110 Rows |
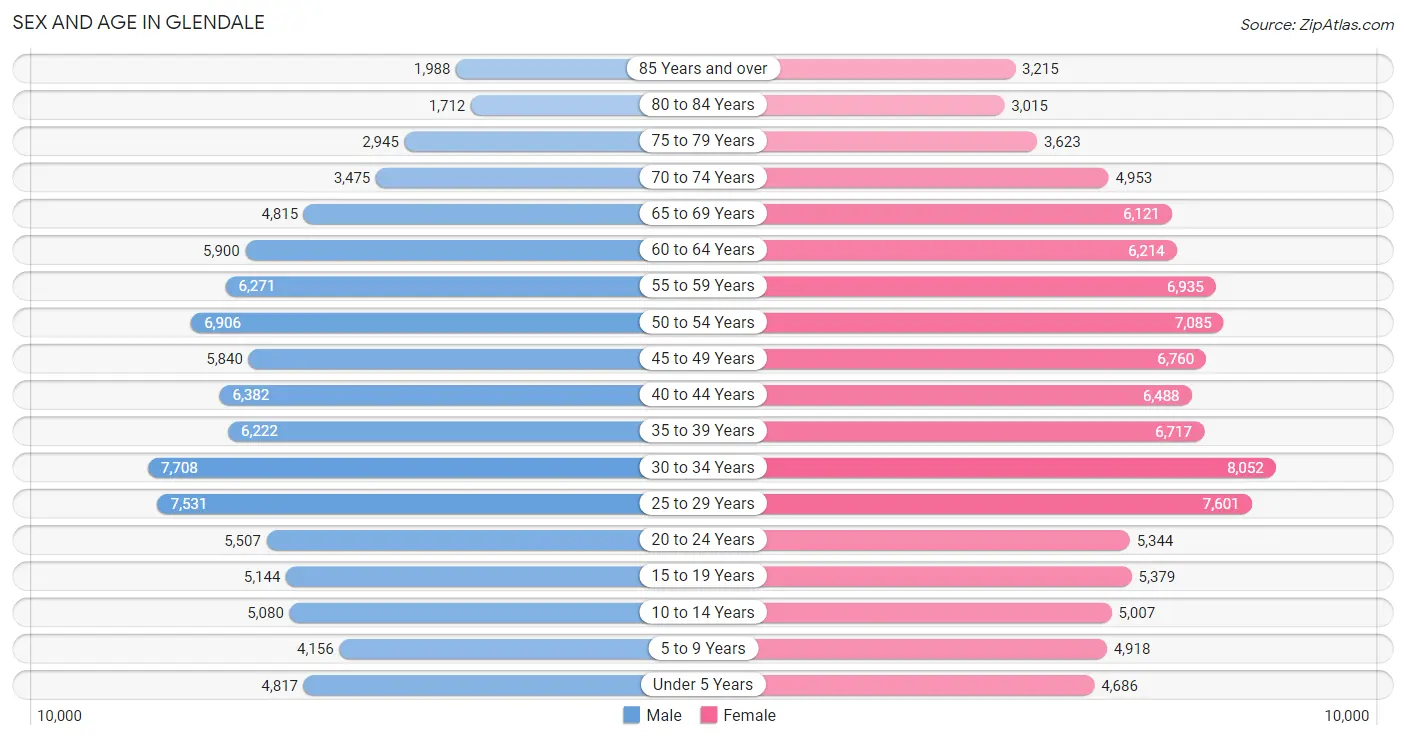
Sex and Age in Glendale
Sex and Age in Glendale
The most populous age groups in Glendale are 30 to 34 Years (7,708 | 8.3%) for men and 30 to 34 Years (8,052 | 7.9%) for women.
| Age Bracket | Male | Female |
| Under 5 Years | 4,817 (5.2%) | 4,686 (4.6%) |
| 5 to 9 Years | 4,156 (4.5%) | 4,918 (4.8%) |
| 10 to 14 Years | 5,080 (5.5%) | 5,007 (4.9%) |
| 15 to 19 Years | 5,144 (5.6%) | 5,379 (5.3%) |
| 20 to 24 Years | 5,507 (6.0%) | 5,344 (5.2%) |
| 25 to 29 Years | 7,531 (8.2%) | 7,601 (7.4%) |
| 30 to 34 Years | 7,708 (8.3%) | 8,052 (7.9%) |
| 35 to 39 Years | 6,222 (6.7%) | 6,717 (6.6%) |
| 40 to 44 Years | 6,382 (6.9%) | 6,488 (6.4%) |
| 45 to 49 Years | 5,840 (6.3%) | 6,760 (6.6%) |
| 50 to 54 Years | 6,906 (7.5%) | 7,085 (6.9%) |
| 55 to 59 Years | 6,271 (6.8%) | 6,935 (6.8%) |
| 60 to 64 Years | 5,900 (6.4%) | 6,214 (6.1%) |
| 65 to 69 Years | 4,815 (5.2%) | 6,121 (6.0%) |
| 70 to 74 Years | 3,475 (3.8%) | 4,953 (4.9%) |
| 75 to 79 Years | 2,945 (3.2%) | 3,623 (3.5%) |
| 80 to 84 Years | 1,712 (1.8%) | 3,015 (2.9%) |
| 85 Years and over | 1,988 (2.1%) | 3,215 (3.2%) |
| Total | 92,399 (100.0%) | 102,113 (100.0%) |
Families and Households in Glendale
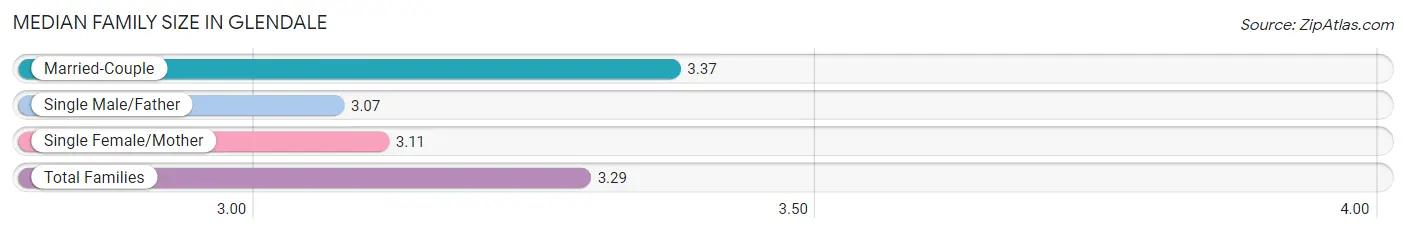
Median Family Size in Glendale
The median family size in Glendale is 3.29 persons per family, with married-couple families (34,764 | 72.6%) accounting for the largest median family size of 3.37 persons per family. On the other hand, single male/father families (4,447 | 9.3%) represent the smallest median family size with 3.07 persons per family.
| Family Type | # Families | Family Size |
| Married-Couple | 34,764 (72.6%) | 3.37 |
| Single Male/Father | 4,447 (9.3%) | 3.07 |
| Single Female/Mother | 8,657 (18.1%) | 3.11 |
| Total Families | 47,868 (100.0%) | 3.29 |
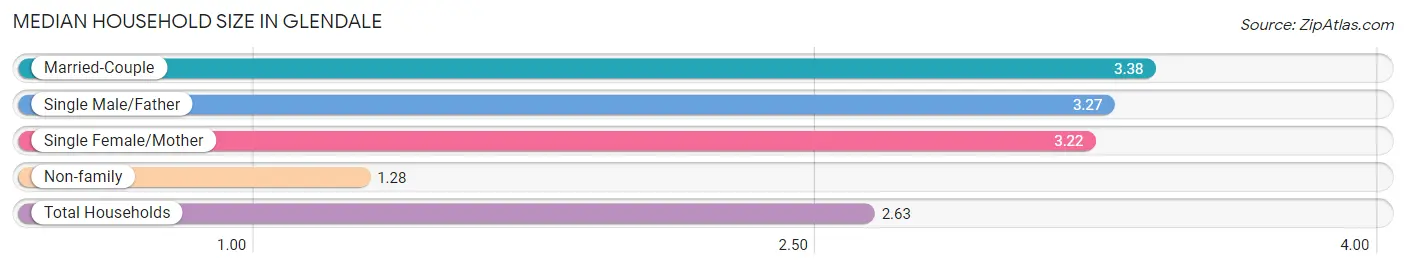
Median Household Size in Glendale
The median household size in Glendale is 2.63 persons per household, with married-couple households (34,764 | 47.5%) accounting for the largest median household size of 3.38 persons per household. non-family households (25,236 | 34.5%) represent the smallest median household size with 1.28 persons per household.
| Household Type | # Households | Household Size |
| Married-Couple | 34,764 (47.5%) | 3.38 |
| Single Male/Father | 4,447 (6.1%) | 3.27 |
| Single Female/Mother | 8,657 (11.8%) | 3.22 |
| Non-family | 25,236 (34.5%) | 1.28 |
| Total Households | 73,104 (100.0%) | 2.63 |
Household Size by Marriage Status in Glendale
Out of a total of 73,104 households in Glendale, 47,868 (65.5%) are family households, while 25,236 (34.5%) are nonfamily households. The most numerous type of family households are 2-person households, comprising 17,585, and the most common type of nonfamily households are 1-person households, comprising 19,987.
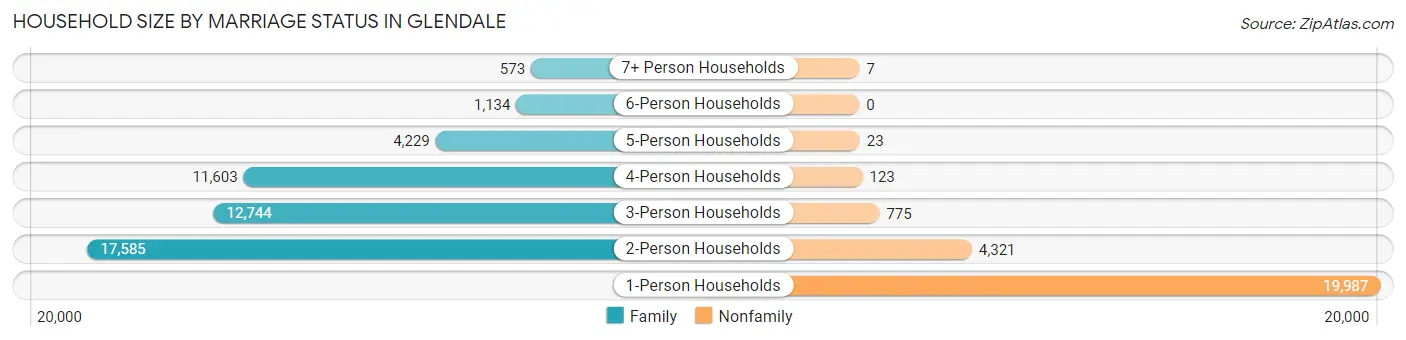
| Household Size | Family Households | Nonfamily Households |
| 1-Person Households | - | 19,987 (27.3%) |
| 2-Person Households | 17,585 (24.0%) | 4,321 (5.9%) |
| 3-Person Households | 12,744 (17.4%) | 775 (1.1%) |
| 4-Person Households | 11,603 (15.9%) | 123 (0.2%) |
| 5-Person Households | 4,229 (5.8%) | 23 (0.0%) |
| 6-Person Households | 1,134 (1.5%) | 0 (0.0%) |
| 7+ Person Households | 573 (0.8%) | 7 (0.0%) |
| Total | 47,868 (65.5%) | 25,236 (34.5%) |
Female Fertility in Glendale
Fertility by Age in Glendale
Average fertility rate in Glendale is 46.0 births per 1,000 women. Women in the age bracket of 35 to 50 years have the highest fertility rate with 51.0 births per 1,000 women. Women in the age bracket of 35 to 50 years acount for 50.2% of all women with births.
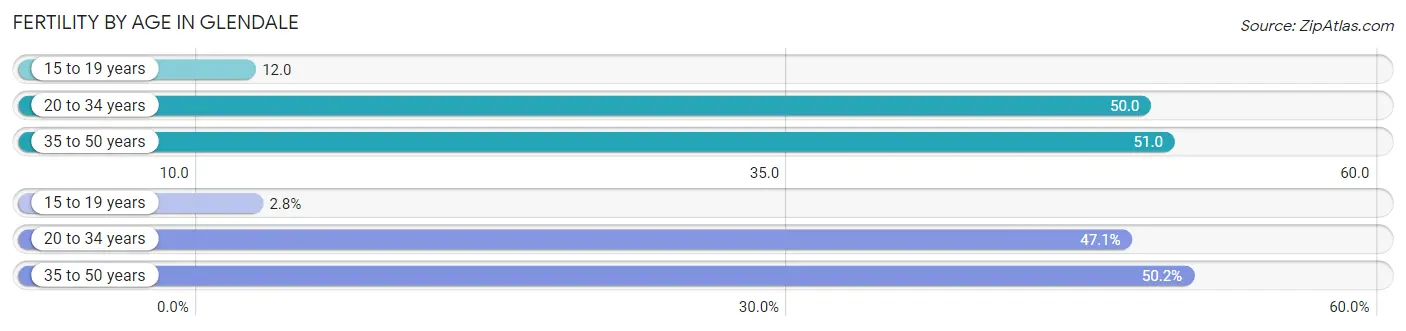
| Age Bracket | Women with Births | Births / 1,000 Women |
| 15 to 19 years | 62 (2.8%) | 12.0 |
| 20 to 34 years | 1,054 (47.0%) | 50.0 |
| 35 to 50 years | 1,124 (50.2%) | 51.0 |
| Total | 2,240 (100.0%) | 46.0 |
Fertility by Age by Marriage Status in Glendale
89.4% of women with births (2,240) in Glendale are married. The highest percentage of unmarried women with births falls into 15 to 19 years age bracket with 100.0% of them unmarried at the time of birth, while the lowest percentage of unmarried women with births belong to 35 to 50 years age bracket with 7.3% of them unmarried.
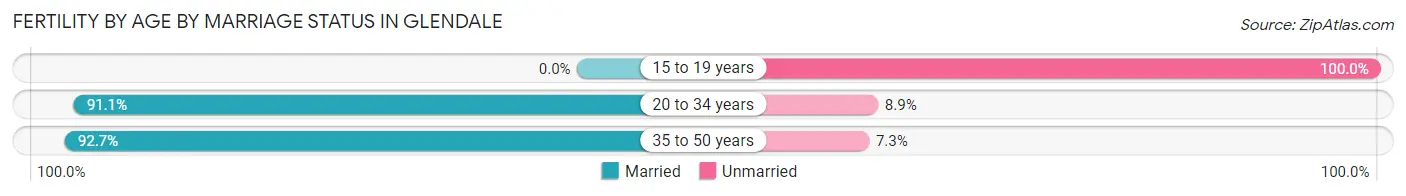
| Age Bracket | Married | Unmarried |
| 15 to 19 years | 0 (0.0%) | 62 (100.0%) |
| 20 to 34 years | 960 (91.1%) | 94 (8.9%) |
| 35 to 50 years | 1,042 (92.7%) | 82 (7.3%) |
| Total | 2,003 (89.4%) | 237 (10.6%) |
Fertility by Education in Glendale
Average fertility rate in Glendale is 46.0 births per 1,000 women. Women with the education attainment of bachelor's degree have the highest fertility rate of 63.0 births per 1,000 women, while women with the education attainment of less than high school have the lowest fertility at 12.0 births per 1,000 women. Women with the education attainment of bachelor's degree represent 42.7% of all women with births.
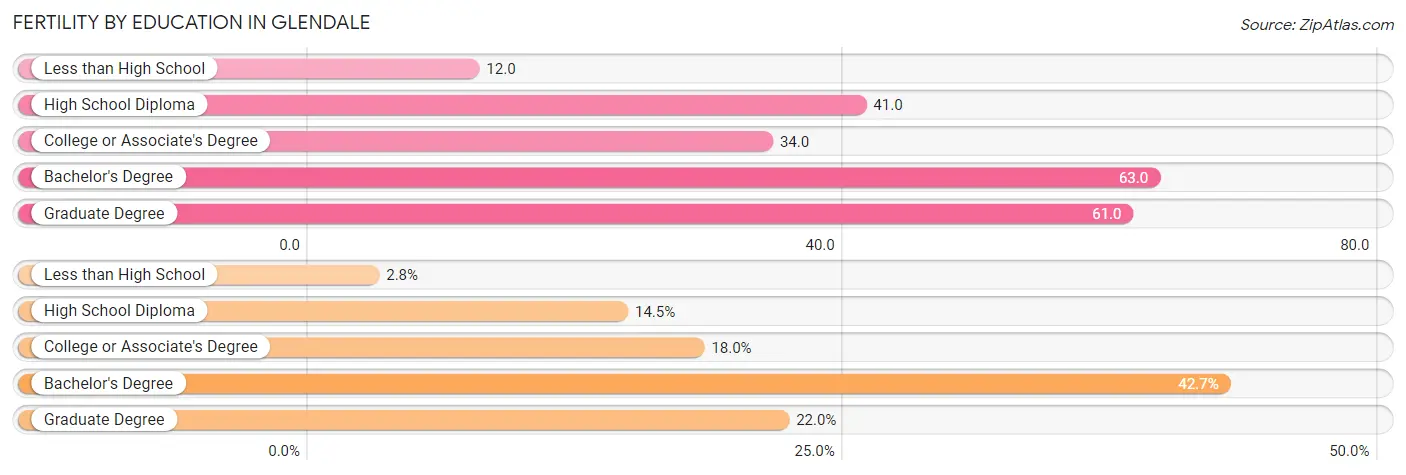
| Educational Attainment | Women with Births | Births / 1,000 Women |
| Less than High School | 63 (2.8%) | 12.0 |
| High School Diploma | 324 (14.5%) | 41.0 |
| College or Associate's Degree | 404 (18.0%) | 34.0 |
| Bachelor's Degree | 956 (42.7%) | 63.0 |
| Graduate Degree | 493 (22.0%) | 61.0 |
| Total | 2,240 (100.0%) | 46.0 |
Fertility by Education by Marriage Status in Glendale
10.6% of women with births in Glendale are unmarried. Women with the educational attainment of graduate degree are most likely to be married with 98.8% of them married at childbirth, while women with the educational attainment of less than high school are least likely to be married with 30.2% of them unmarried at childbirth.
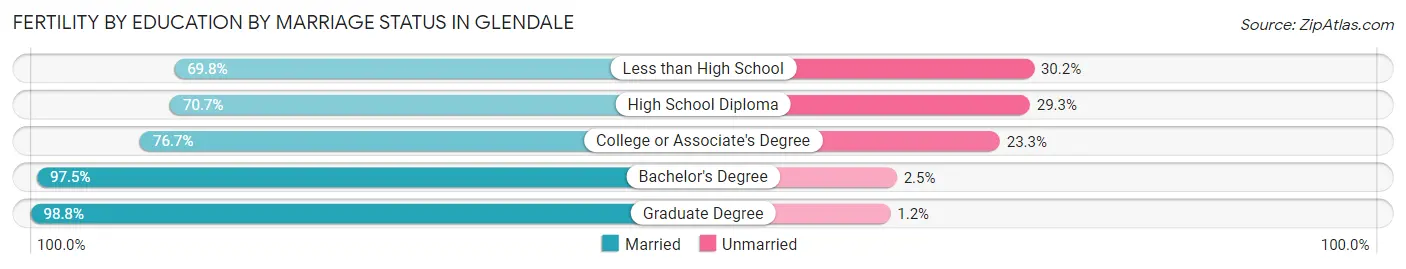
| Educational Attainment | Married | Unmarried |
| Less than High School | 44 (69.8%) | 19 (30.2%) |
| High School Diploma | 229 (70.7%) | 95 (29.3%) |
| College or Associate's Degree | 310 (76.7%) | 94 (23.3%) |
| Bachelor's Degree | 932 (97.5%) | 24 (2.5%) |
| Graduate Degree | 487 (98.8%) | 6 (1.2%) |
| Total | 2,003 (89.4%) | 237 (10.6%) |
Employment Characteristics in Glendale
Employment by Class of Employer in Glendale
Among the 91,416 employed individuals in Glendale, private company employees (60,239 | 65.9%), self-employed (not incorporated) (8,344 | 9.1%), and not-for-profit organizations (7,107 | 7.8%) make up the most common classes of employment.
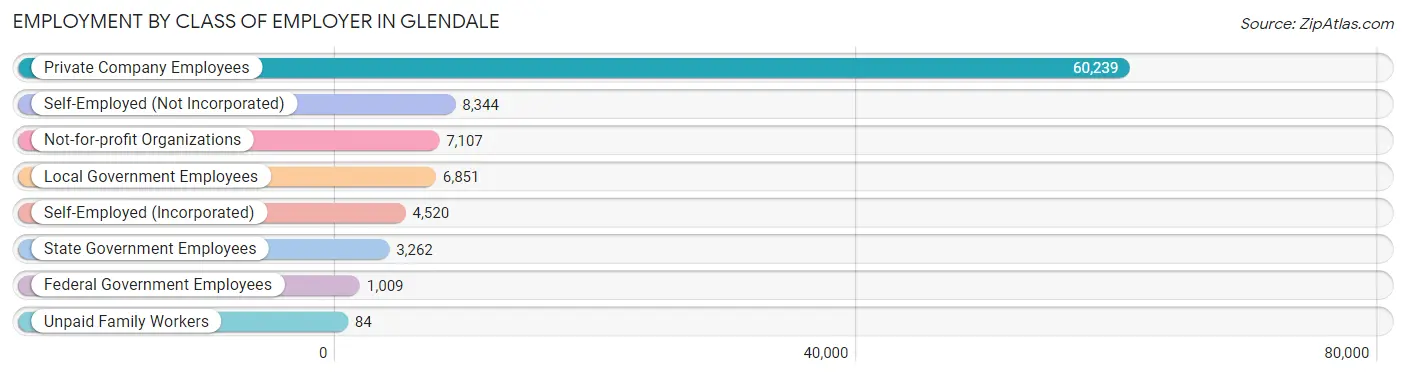
| Employer Class | # Employees | % Employees |
| Private Company Employees | 60,239 | 65.9% |
| Self-Employed (Incorporated) | 4,520 | 4.9% |
| Self-Employed (Not Incorporated) | 8,344 | 9.1% |
| Not-for-profit Organizations | 7,107 | 7.8% |
| Local Government Employees | 6,851 | 7.5% |
| State Government Employees | 3,262 | 3.6% |
| Federal Government Employees | 1,009 | 1.1% |
| Unpaid Family Workers | 84 | 0.1% |
| Total | 91,416 | 100.0% |
Employment Status by Age in Glendale
According to the labor force statistics for Glendale, out of the total population over 16 years of age (163,586), 62.2% or 101,750 individuals are in the labor force, with 8.1% or 8,242 of them unemployed. The age group with the highest labor force participation rate is 30 to 34 years, with 85.9% or 13,538 individuals in the labor force. Within the labor force, the 16 to 19 years age range has the highest percentage of unemployed individuals, with 37.1% or 800 of them being unemployed.
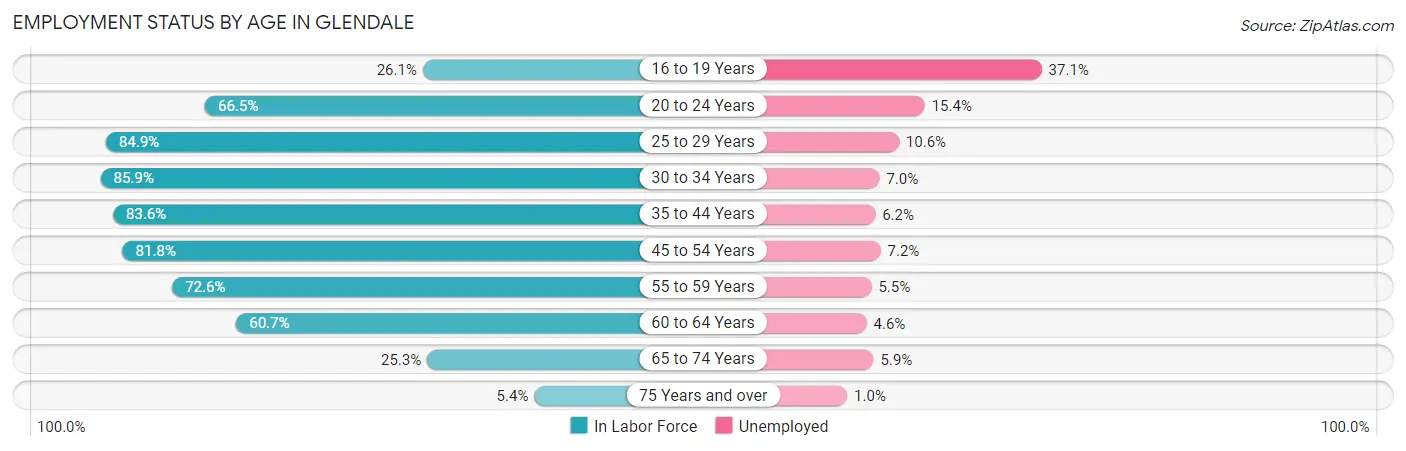
| Age Bracket | In Labor Force | Unemployed |
| 16 to 19 Years | 2,156 (26.1%) | 800 (37.1%) |
| 20 to 24 Years | 7,216 (66.5%) | 1,111 (15.4%) |
| 25 to 29 Years | 12,847 (84.9%) | 1,362 (10.6%) |
| 30 to 34 Years | 13,538 (85.9%) | 948 (7.0%) |
| 35 to 44 Years | 21,576 (83.6%) | 1,338 (6.2%) |
| 45 to 54 Years | 21,751 (81.8%) | 1,566 (7.2%) |
| 55 to 59 Years | 9,588 (72.6%) | 527 (5.5%) |
| 60 to 64 Years | 7,353 (60.7%) | 338 (4.6%) |
| 65 to 74 Years | 4,899 (25.3%) | 289 (5.9%) |
| 75 Years and over | 891 (5.4%) | 9 (1.0%) |
| Total | 101,750 (62.2%) | 8,242 (8.1%) |
Employment Status by Educational Attainment in Glendale
According to labor force statistics for Glendale, 79.8% of individuals (86,672) out of the total population between 25 and 64 years of age (108,612) are in the labor force, with 7.0% or 6,067 of them being unemployed. The group with the highest labor force participation rate are those with the educational attainment of bachelor's degree or higher, with 85.9% or 44,377 individuals in the labor force. Within the labor force, individuals with less than high school education have the highest percentage of unemployment, with 10.5% or 526 of them being unemployed.
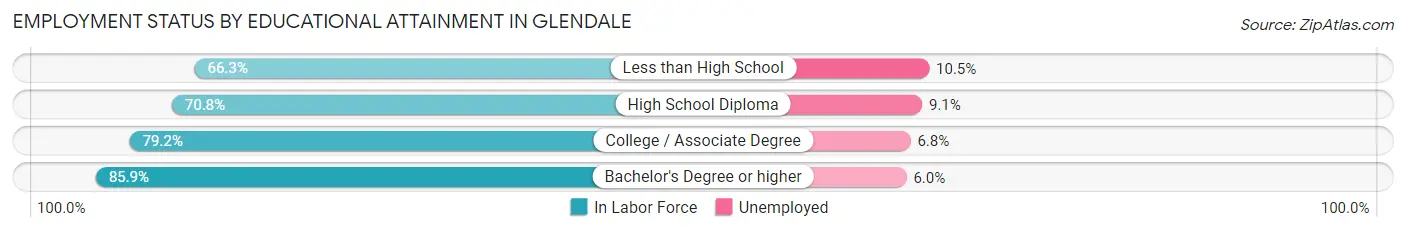
| Educational Attainment | In Labor Force | Unemployed |
| Less than High School | 5,014 (66.3%) | 794 (10.5%) |
| High School Diploma | 15,442 (70.8%) | 1,985 (9.1%) |
| College / Associate Degree | 21,842 (79.2%) | 1,875 (6.8%) |
| Bachelor's Degree or higher | 44,377 (85.9%) | 3,100 (6.0%) |
| Total | 86,672 (79.8%) | 7,603 (7.0%) |
Employment Occupations by Sex in Glendale
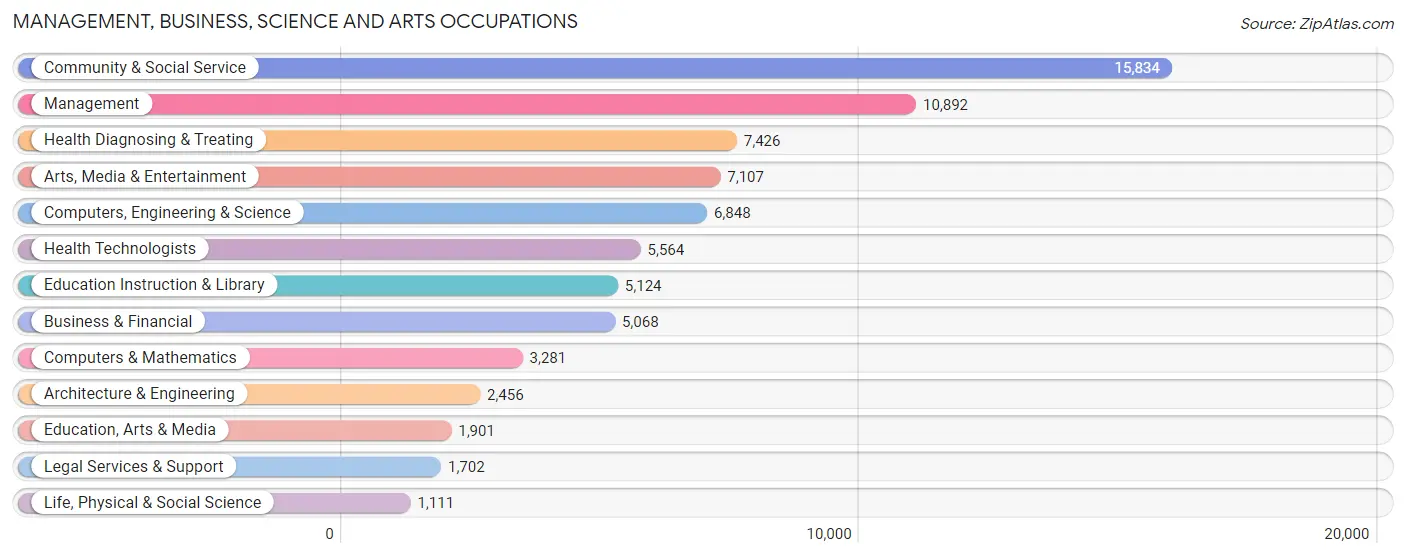
Management, Business, Science and Arts Occupations
The most common Management, Business, Science and Arts occupations in Glendale are Community & Social Service (15,834 | 16.9%), Management (10,892 | 11.7%), Health Diagnosing & Treating (7,426 | 7.9%), Arts, Media & Entertainment (7,107 | 7.6%), and Computers, Engineering & Science (6,848 | 7.3%).
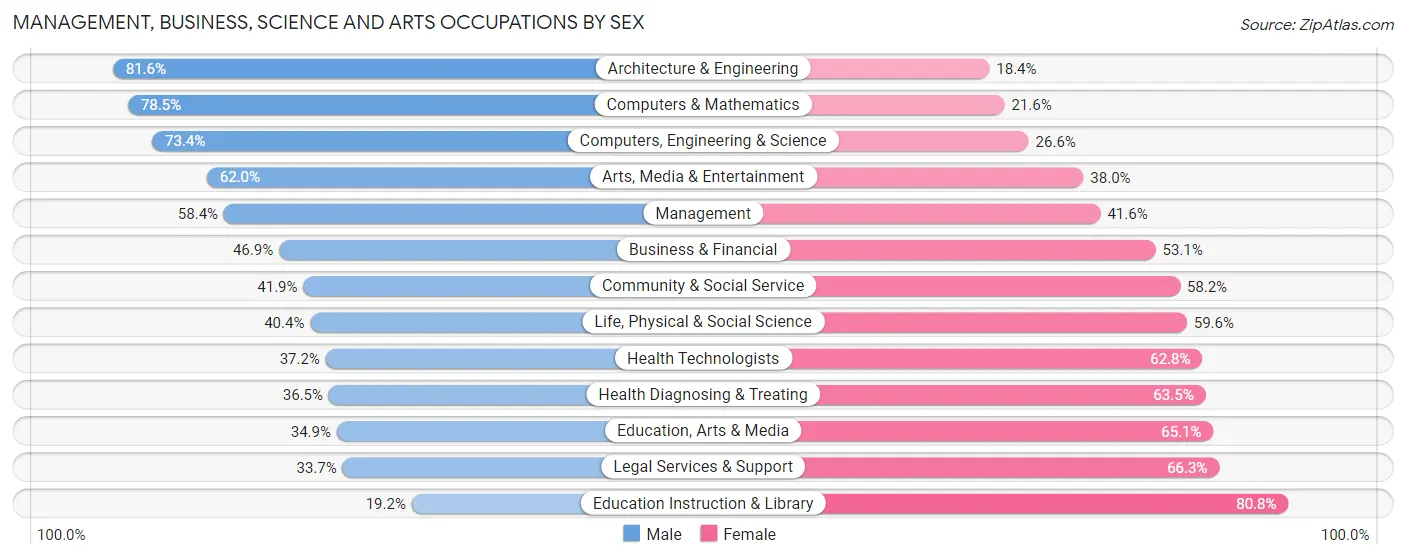
Management, Business, Science and Arts Occupations by Sex
Within the Management, Business, Science and Arts occupations in Glendale, the most male-oriented occupations are Architecture & Engineering (81.6%), Computers & Mathematics (78.4%), and Computers, Engineering & Science (73.4%), while the most female-oriented occupations are Education Instruction & Library (80.8%), Legal Services & Support (66.3%), and Education, Arts & Media (65.1%).
| Occupation | Male | Female |
| Management | 6,363 (58.4%) | 4,529 (41.6%) |
| Business & Financial | 2,379 (46.9%) | 2,689 (53.1%) |
| Computers, Engineering & Science | 5,027 (73.4%) | 1,821 (26.6%) |
| Computers & Mathematics | 2,574 (78.4%) | 707 (21.5%) |
| Architecture & Engineering | 2,004 (81.6%) | 452 (18.4%) |
| Life, Physical & Social Science | 449 (40.4%) | 662 (59.6%) |
| Community & Social Service | 6,627 (41.8%) | 9,207 (58.2%) |
| Education, Arts & Media | 663 (34.9%) | 1,238 (65.1%) |
| Legal Services & Support | 573 (33.7%) | 1,129 (66.3%) |
| Education Instruction & Library | 986 (19.2%) | 4,138 (80.8%) |
| Arts, Media & Entertainment | 4,405 (62.0%) | 2,702 (38.0%) |
| Health Diagnosing & Treating | 2,713 (36.5%) | 4,713 (63.5%) |
| Health Technologists | 2,069 (37.2%) | 3,495 (62.8%) |
| Total (Category) | 23,109 (50.2%) | 22,959 (49.8%) |
| Total (Overall) | 49,345 (52.8%) | 44,183 (47.2%) |
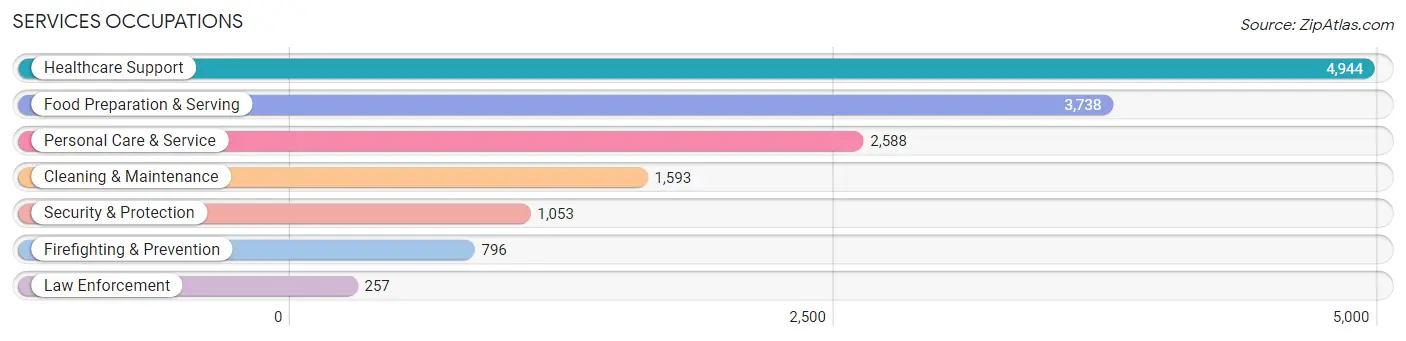
Services Occupations
The most common Services occupations in Glendale are Healthcare Support (4,944 | 5.3%), Food Preparation & Serving (3,738 | 4.0%), Personal Care & Service (2,588 | 2.8%), Cleaning & Maintenance (1,593 | 1.7%), and Security & Protection (1,053 | 1.1%).
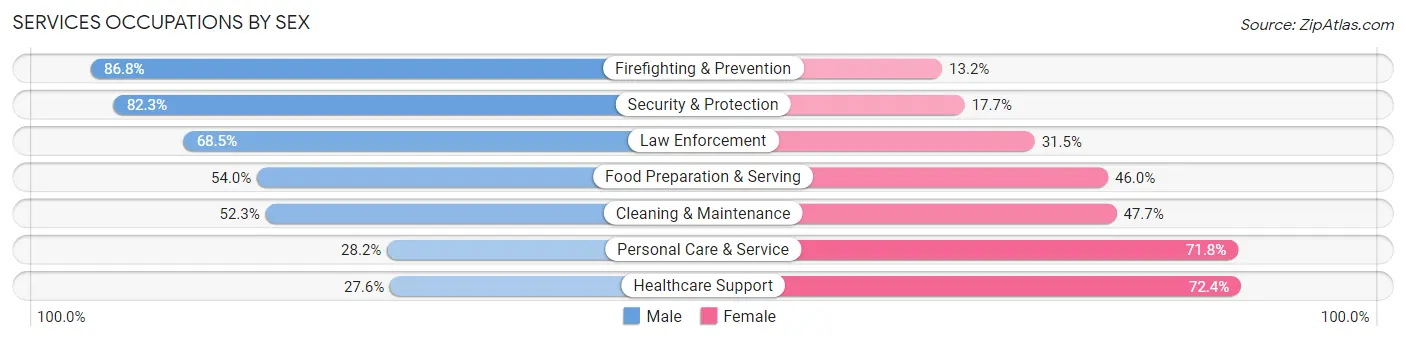
Services Occupations by Sex
Within the Services occupations in Glendale, the most male-oriented occupations are Firefighting & Prevention (86.8%), Security & Protection (82.3%), and Law Enforcement (68.5%), while the most female-oriented occupations are Healthcare Support (72.4%), Personal Care & Service (71.8%), and Cleaning & Maintenance (47.7%).
| Occupation | Male | Female |
| Healthcare Support | 1,366 (27.6%) | 3,578 (72.4%) |
| Security & Protection | 867 (82.3%) | 186 (17.7%) |
| Firefighting & Prevention | 691 (86.8%) | 105 (13.2%) |
| Law Enforcement | 176 (68.5%) | 81 (31.5%) |
| Food Preparation & Serving | 2,017 (54.0%) | 1,721 (46.0%) |
| Cleaning & Maintenance | 833 (52.3%) | 760 (47.7%) |
| Personal Care & Service | 730 (28.2%) | 1,858 (71.8%) |
| Total (Category) | 5,813 (41.8%) | 8,103 (58.2%) |
| Total (Overall) | 49,345 (52.8%) | 44,183 (47.2%) |
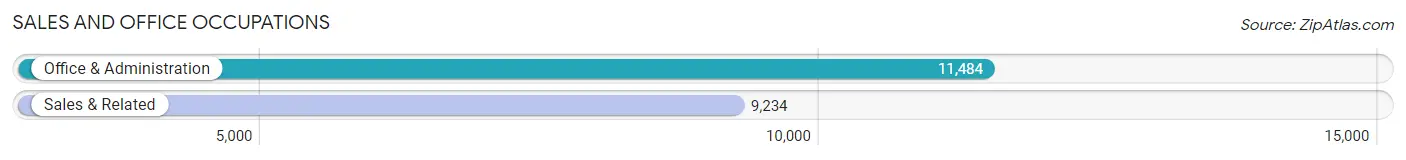
Sales and Office Occupations
The most common Sales and Office occupations in Glendale are Office & Administration (11,484 | 12.3%), and Sales & Related (9,234 | 9.9%).
Sales and Office Occupations by Sex
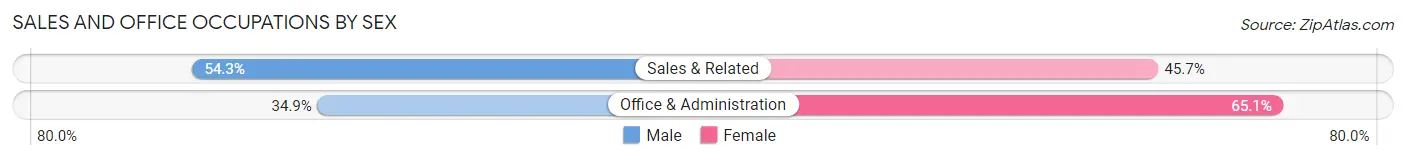
| Occupation | Male | Female |
| Sales & Related | 5,015 (54.3%) | 4,219 (45.7%) |
| Office & Administration | 4,010 (34.9%) | 7,474 (65.1%) |
| Total (Category) | 9,025 (43.6%) | 11,693 (56.4%) |
| Total (Overall) | 49,345 (52.8%) | 44,183 (47.2%) |
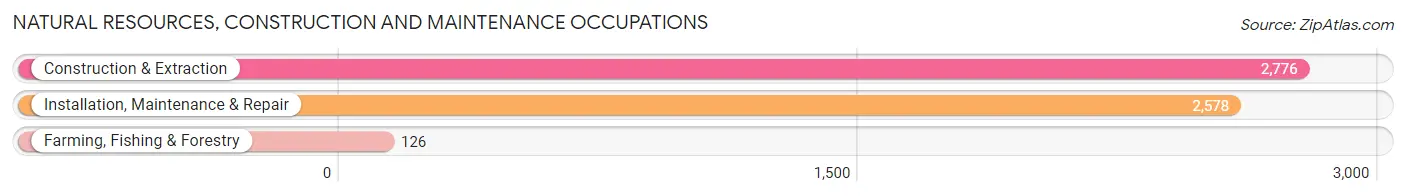
Natural Resources, Construction and Maintenance Occupations
The most common Natural Resources, Construction and Maintenance occupations in Glendale are Construction & Extraction (2,776 | 3.0%), Installation, Maintenance & Repair (2,578 | 2.8%), and Farming, Fishing & Forestry (126 | 0.1%).
Natural Resources, Construction and Maintenance Occupations by Sex
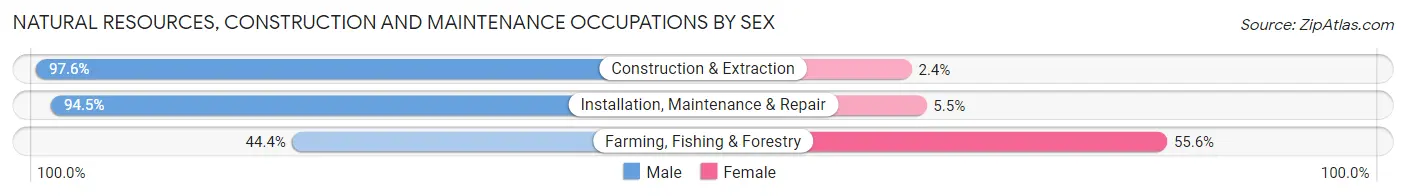
| Occupation | Male | Female |
| Farming, Fishing & Forestry | 56 (44.4%) | 70 (55.6%) |
| Construction & Extraction | 2,709 (97.6%) | 67 (2.4%) |
| Installation, Maintenance & Repair | 2,436 (94.5%) | 142 (5.5%) |
| Total (Category) | 5,201 (94.9%) | 279 (5.1%) |
| Total (Overall) | 49,345 (52.8%) | 44,183 (47.2%) |
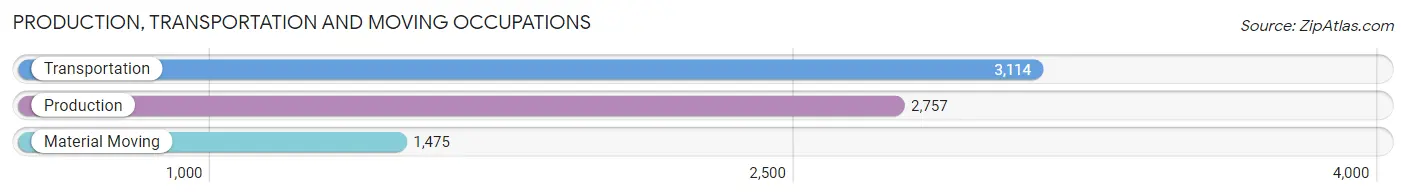
Production, Transportation and Moving Occupations
The most common Production, Transportation and Moving occupations in Glendale are Transportation (3,114 | 3.3%), Production (2,757 | 2.9%), and Material Moving (1,475 | 1.6%).
Production, Transportation and Moving Occupations by Sex
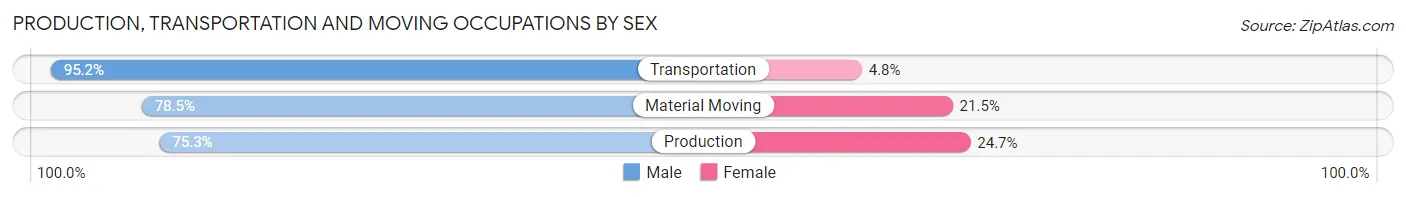
| Occupation | Male | Female |
| Production | 2,075 (75.3%) | 682 (24.7%) |
| Transportation | 2,964 (95.2%) | 150 (4.8%) |
| Material Moving | 1,158 (78.5%) | 317 (21.5%) |
| Total (Category) | 6,197 (84.4%) | 1,149 (15.6%) |
| Total (Overall) | 49,345 (52.8%) | 44,183 (47.2%) |
Employment Industries by Sex in Glendale
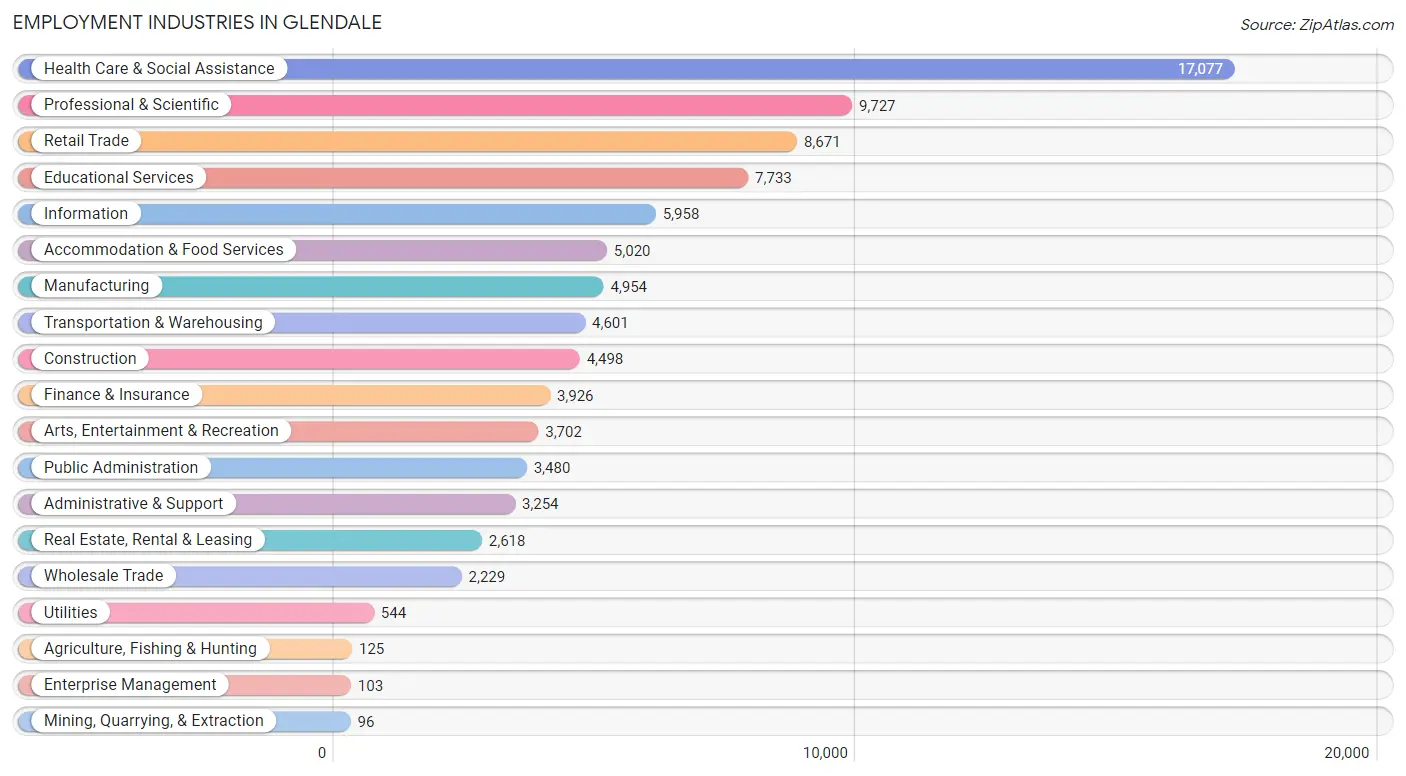
Employment Industries in Glendale
The major employment industries in Glendale include Health Care & Social Assistance (17,077 | 18.3%), Professional & Scientific (9,727 | 10.4%), Retail Trade (8,671 | 9.3%), Educational Services (7,733 | 8.3%), and Information (5,958 | 6.4%).
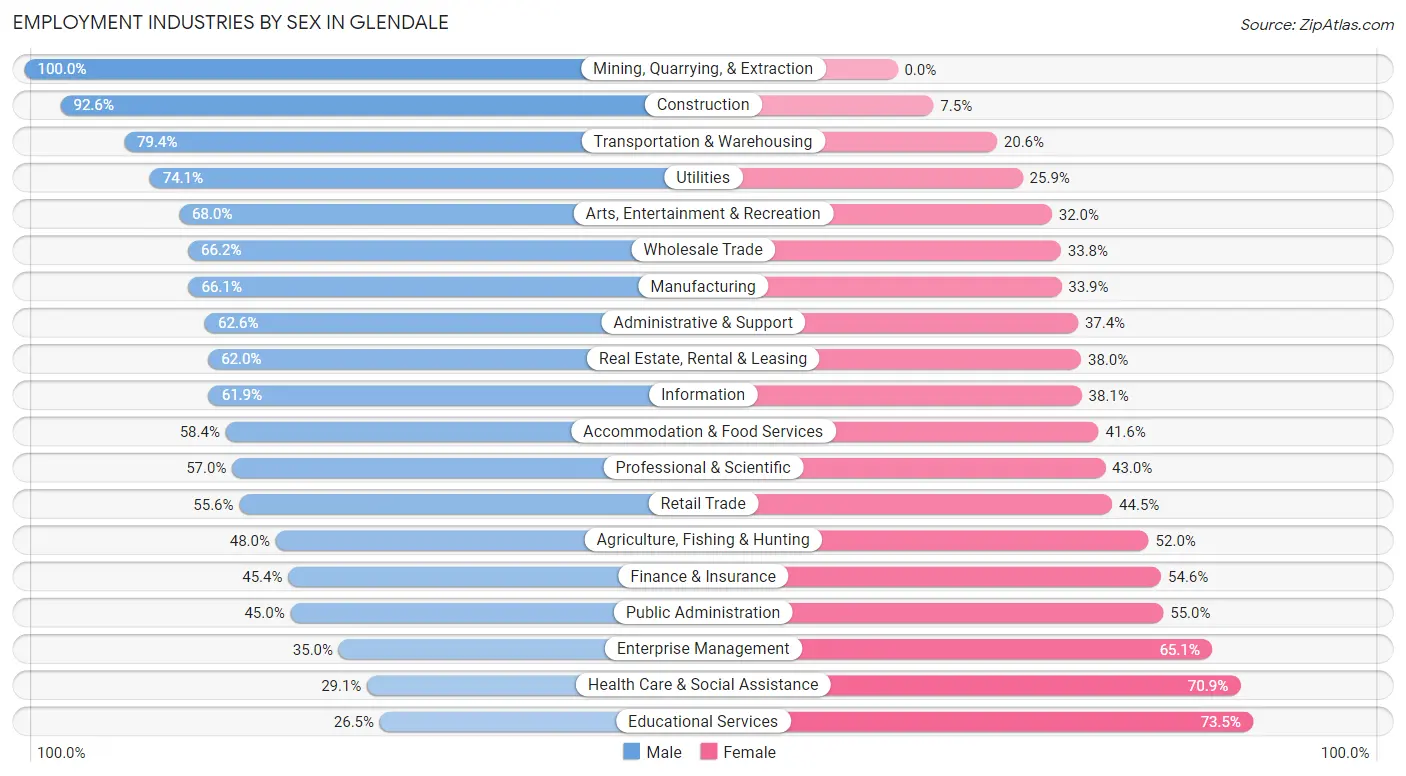
Employment Industries by Sex in Glendale
The Glendale industries that see more men than women are Mining, Quarrying, & Extraction (100.0%), Construction (92.5%), and Transportation & Warehousing (79.4%), whereas the industries that tend to have a higher number of women are Educational Services (73.5%), Health Care & Social Assistance (70.9%), and Enterprise Management (65.0%).
| Industry | Male | Female |
| Agriculture, Fishing & Hunting | 60 (48.0%) | 65 (52.0%) |
| Mining, Quarrying, & Extraction | 96 (100.0%) | 0 (0.0%) |
| Construction | 4,163 (92.5%) | 335 (7.4%) |
| Manufacturing | 3,273 (66.1%) | 1,681 (33.9%) |
| Wholesale Trade | 1,475 (66.2%) | 754 (33.8%) |
| Retail Trade | 4,817 (55.5%) | 3,854 (44.5%) |
| Transportation & Warehousing | 3,654 (79.4%) | 947 (20.6%) |
| Utilities | 403 (74.1%) | 141 (25.9%) |
| Information | 3,686 (61.9%) | 2,272 (38.1%) |
| Finance & Insurance | 1,783 (45.4%) | 2,143 (54.6%) |
| Real Estate, Rental & Leasing | 1,623 (62.0%) | 995 (38.0%) |
| Professional & Scientific | 5,546 (57.0%) | 4,181 (43.0%) |
| Enterprise Management | 36 (34.9%) | 67 (65.0%) |
| Administrative & Support | 2,038 (62.6%) | 1,216 (37.4%) |
| Educational Services | 2,046 (26.5%) | 5,687 (73.5%) |
| Health Care & Social Assistance | 4,967 (29.1%) | 12,110 (70.9%) |
| Arts, Entertainment & Recreation | 2,519 (68.0%) | 1,183 (32.0%) |
| Accommodation & Food Services | 2,930 (58.4%) | 2,090 (41.6%) |
| Public Administration | 1,565 (45.0%) | 1,915 (55.0%) |
| Total | 49,345 (52.8%) | 44,183 (47.2%) |
Education in Glendale
School Enrollment in Glendale
The most common levels of schooling among the 45,075 students in Glendale are college / undergraduate (12,118 | 26.9%), high school (9,589 | 21.3%), and elementary school (7,422 | 16.5%).
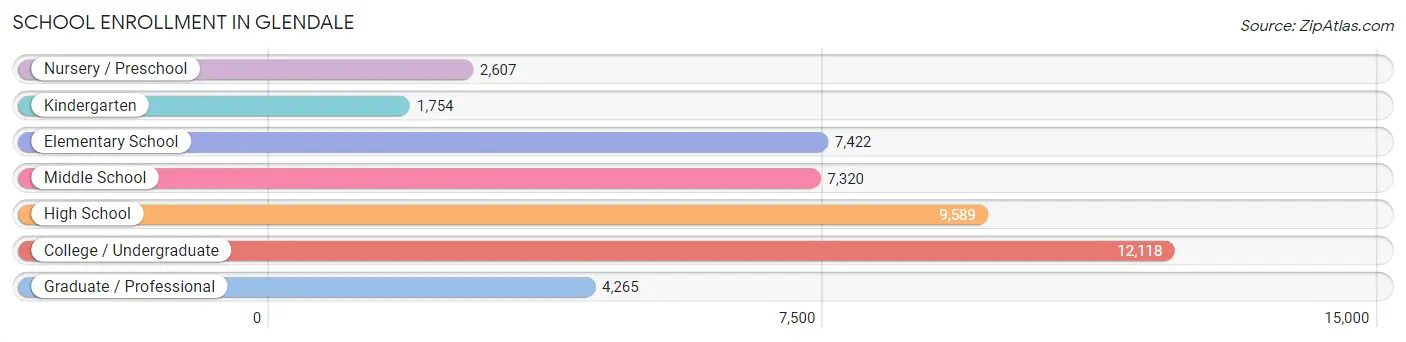
| School Level | # Students | % Students |
| Nursery / Preschool | 2,607 | 5.8% |
| Kindergarten | 1,754 | 3.9% |
| Elementary School | 7,422 | 16.5% |
| Middle School | 7,320 | 16.2% |
| High School | 9,589 | 21.3% |
| College / Undergraduate | 12,118 | 26.9% |
| Graduate / Professional | 4,265 | 9.5% |
| Total | 45,075 | 100.0% |
School Enrollment by Age by Funding Source in Glendale
Out of a total of 45,075 students who are enrolled in schools in Glendale, 9,601 (21.3%) attend a private institution, while the remaining 35,474 (78.7%) are enrolled in public schools. The age group of 3 to 4 year olds has the highest likelihood of being enrolled in private schools, with 1,176 (52.4% in the age bracket) enrolled. Conversely, the age group of 15 to 17 year olds has the lowest likelihood of being enrolled in a private school, with 5,882 (92.9% in the age bracket) attending a public institution.
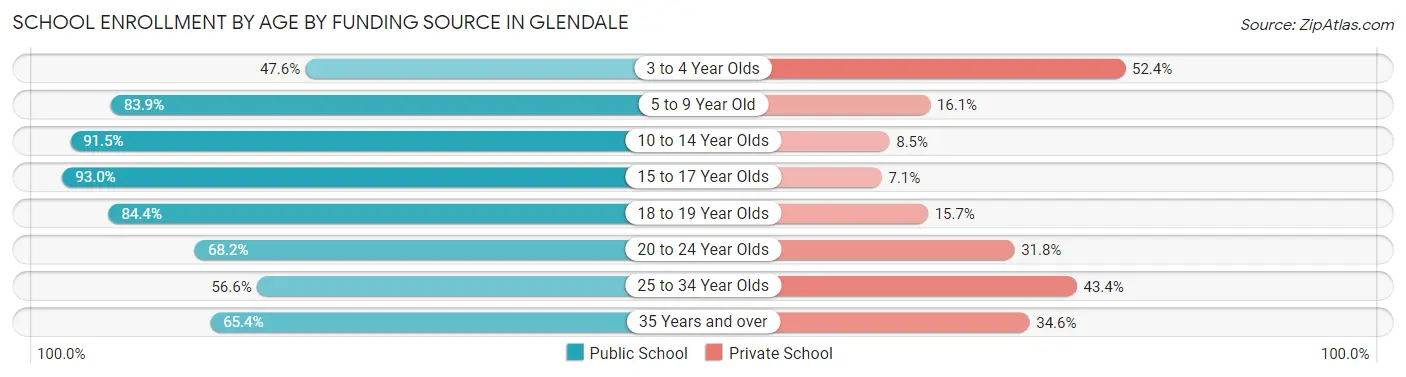
| Age Bracket | Public School | Private School |
| 3 to 4 Year Olds | 1,068 (47.6%) | 1,176 (52.4%) |
| 5 to 9 Year Old | 7,325 (83.9%) | 1,403 (16.1%) |
| 10 to 14 Year Olds | 9,170 (91.5%) | 852 (8.5%) |
| 15 to 17 Year Olds | 5,882 (92.9%) | 446 (7.0%) |
| 18 to 19 Year Olds | 2,975 (84.4%) | 552 (15.7%) |
| 20 to 24 Year Olds | 4,114 (68.2%) | 1,915 (31.8%) |
| 25 to 34 Year Olds | 2,693 (56.6%) | 2,063 (43.4%) |
| 35 Years and over | 2,251 (65.4%) | 1,190 (34.6%) |
| Total | 35,474 (78.7%) | 9,601 (21.3%) |
Educational Attainment by Field of Study in Glendale
Business (12,267 | 18.2%), visual & performing arts (7,176 | 10.7%), science & technology (6,552 | 9.8%), social sciences (6,245 | 9.3%), and engineering (6,206 | 9.2%) are the most common fields of study among 67,225 individuals in Glendale who have obtained a bachelor's degree or higher.
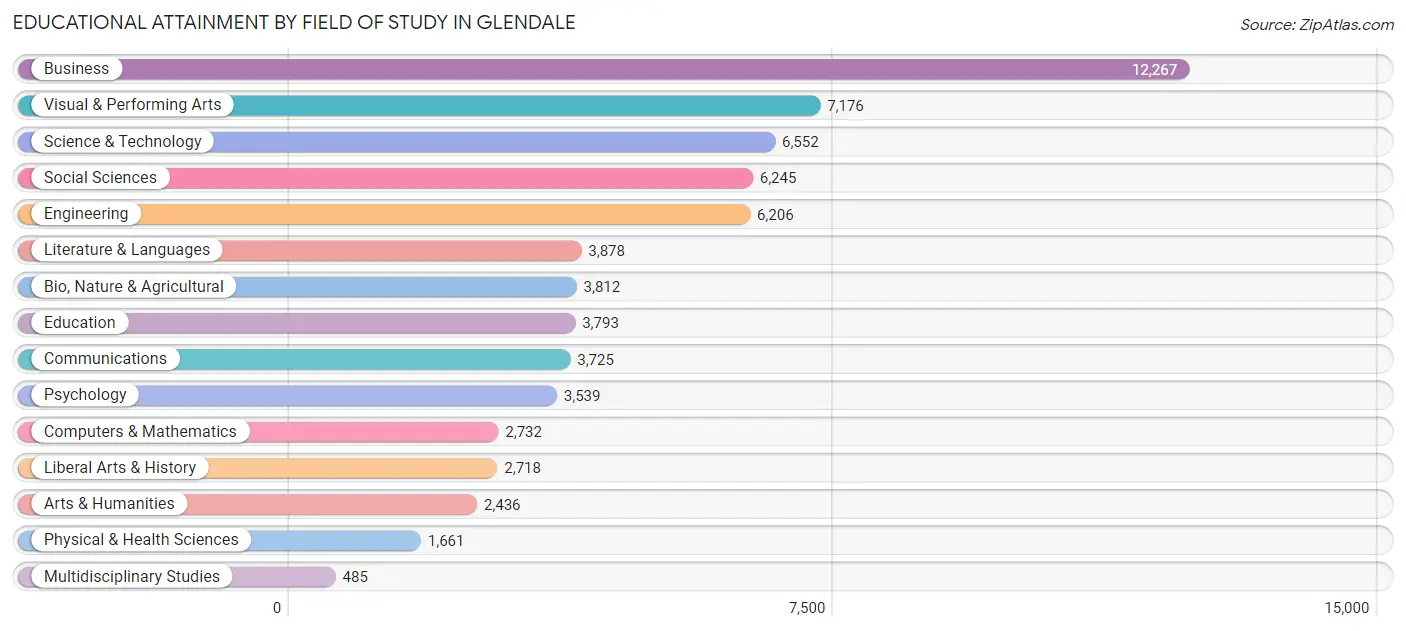
| Field of Study | # Graduates | % Graduates |
| Computers & Mathematics | 2,732 | 4.1% |
| Bio, Nature & Agricultural | 3,812 | 5.7% |
| Physical & Health Sciences | 1,661 | 2.5% |
| Psychology | 3,539 | 5.3% |
| Social Sciences | 6,245 | 9.3% |
| Engineering | 6,206 | 9.2% |
| Multidisciplinary Studies | 485 | 0.7% |
| Science & Technology | 6,552 | 9.8% |
| Business | 12,267 | 18.2% |
| Education | 3,793 | 5.6% |
| Literature & Languages | 3,878 | 5.8% |
| Liberal Arts & History | 2,718 | 4.0% |
| Visual & Performing Arts | 7,176 | 10.7% |
| Communications | 3,725 | 5.5% |
| Arts & Humanities | 2,436 | 3.6% |
| Total | 67,225 | 100.0% |
Transportation & Commute in Glendale
Vehicle Availability by Sex in Glendale
The most prevalent vehicle ownership categories in Glendale are males with 2 vehicles (21,522, accounting for 44.6%) and females with 2 vehicles (17,913, making up 50.1%).
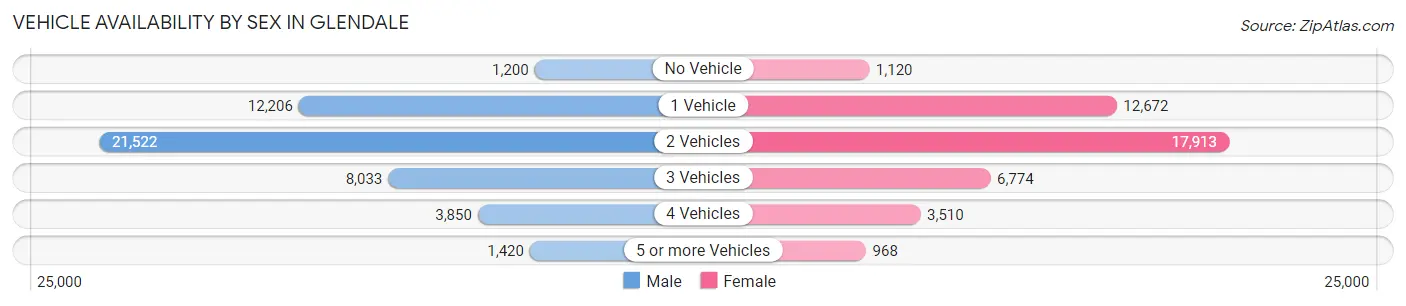
| Vehicles Available | Male | Female |
| No Vehicle | 1,200 (2.5%) | 1,120 (2.6%) |
| 1 Vehicle | 12,206 (25.3%) | 12,672 (29.5%) |
| 2 Vehicles | 21,522 (44.6%) | 17,913 (41.7%) |
| 3 Vehicles | 8,033 (16.7%) | 6,774 (15.8%) |
| 4 Vehicles | 3,850 (8.0%) | 3,510 (8.2%) |
| 5 or more Vehicles | 1,420 (2.9%) | 968 (2.2%) |
| Total | 48,231 (100.0%) | 42,957 (100.0%) |
Commute Time in Glendale
The most frequently occuring commute durations in Glendale are 30 to 34 minutes (13,714 commuters, 17.9%), 15 to 19 minutes (13,397 commuters, 17.5%), and 20 to 24 minutes (10,659 commuters, 13.9%).
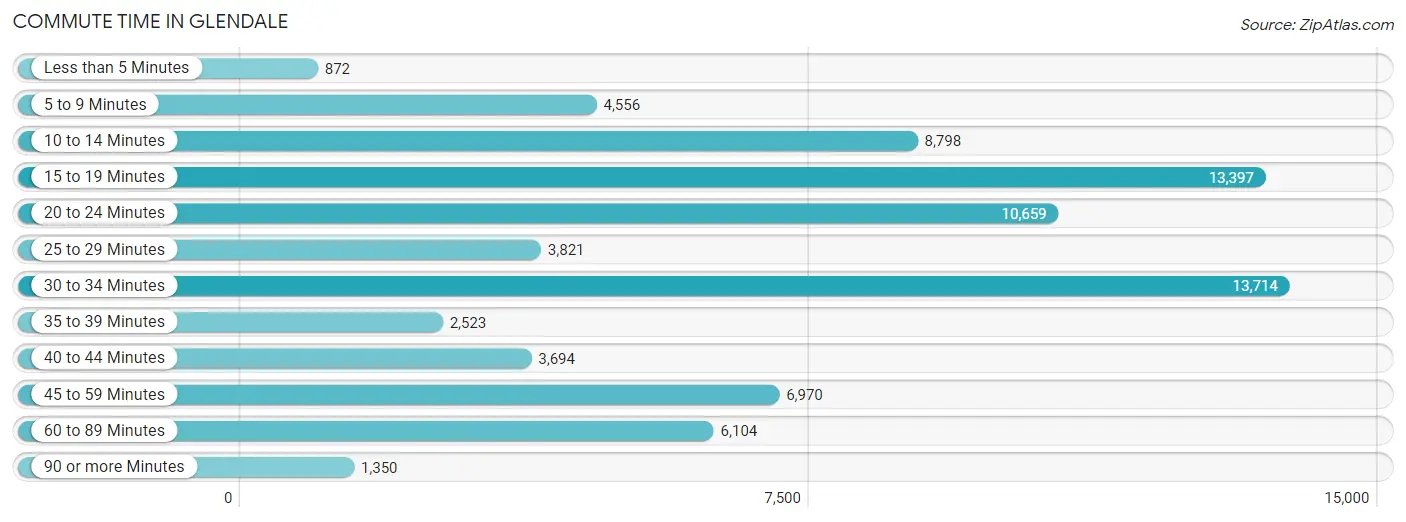
| Commute Time | # Commuters | % Commuters |
| Less than 5 Minutes | 872 | 1.1% |
| 5 to 9 Minutes | 4,556 | 6.0% |
| 10 to 14 Minutes | 8,798 | 11.5% |
| 15 to 19 Minutes | 13,397 | 17.5% |
| 20 to 24 Minutes | 10,659 | 13.9% |
| 25 to 29 Minutes | 3,821 | 5.0% |
| 30 to 34 Minutes | 13,714 | 17.9% |
| 35 to 39 Minutes | 2,523 | 3.3% |
| 40 to 44 Minutes | 3,694 | 4.8% |
| 45 to 59 Minutes | 6,970 | 9.1% |
| 60 to 89 Minutes | 6,104 | 8.0% |
| 90 or more Minutes | 1,350 | 1.8% |
Commute Time by Sex in Glendale
The most common commute times in Glendale are 30 to 34 minutes (7,950 commuters, 19.1%) for males and 15 to 19 minutes (6,332 commuters, 18.1%) for females.
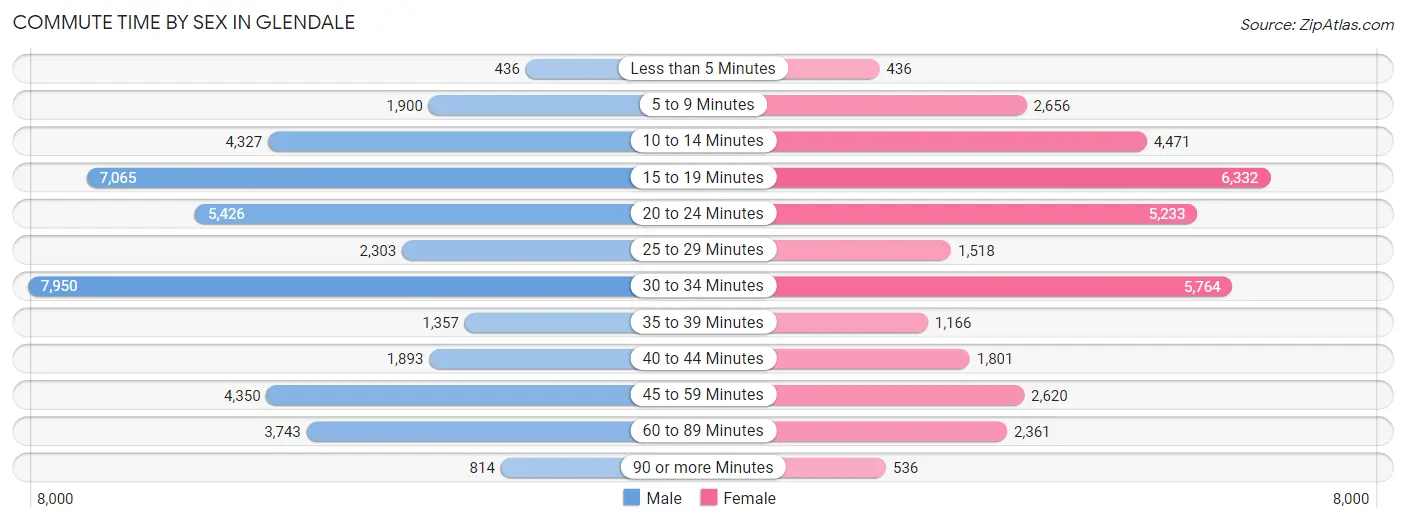
| Commute Time | Male | Female |
| Less than 5 Minutes | 436 (1.1%) | 436 (1.3%) |
| 5 to 9 Minutes | 1,900 (4.6%) | 2,656 (7.6%) |
| 10 to 14 Minutes | 4,327 (10.4%) | 4,471 (12.8%) |
| 15 to 19 Minutes | 7,065 (17.0%) | 6,332 (18.1%) |
| 20 to 24 Minutes | 5,426 (13.1%) | 5,233 (15.0%) |
| 25 to 29 Minutes | 2,303 (5.5%) | 1,518 (4.3%) |
| 30 to 34 Minutes | 7,950 (19.1%) | 5,764 (16.5%) |
| 35 to 39 Minutes | 1,357 (3.3%) | 1,166 (3.3%) |
| 40 to 44 Minutes | 1,893 (4.5%) | 1,801 (5.2%) |
| 45 to 59 Minutes | 4,350 (10.5%) | 2,620 (7.5%) |
| 60 to 89 Minutes | 3,743 (9.0%) | 2,361 (6.8%) |
| 90 or more Minutes | 814 (2.0%) | 536 (1.5%) |
Time of Departure to Work by Sex in Glendale
The most frequent times of departure to work in Glendale are 8:00 AM to 8:29 AM (8,372, 20.1%) for males and 8:00 AM to 8:29 AM (6,001, 17.2%) for females.
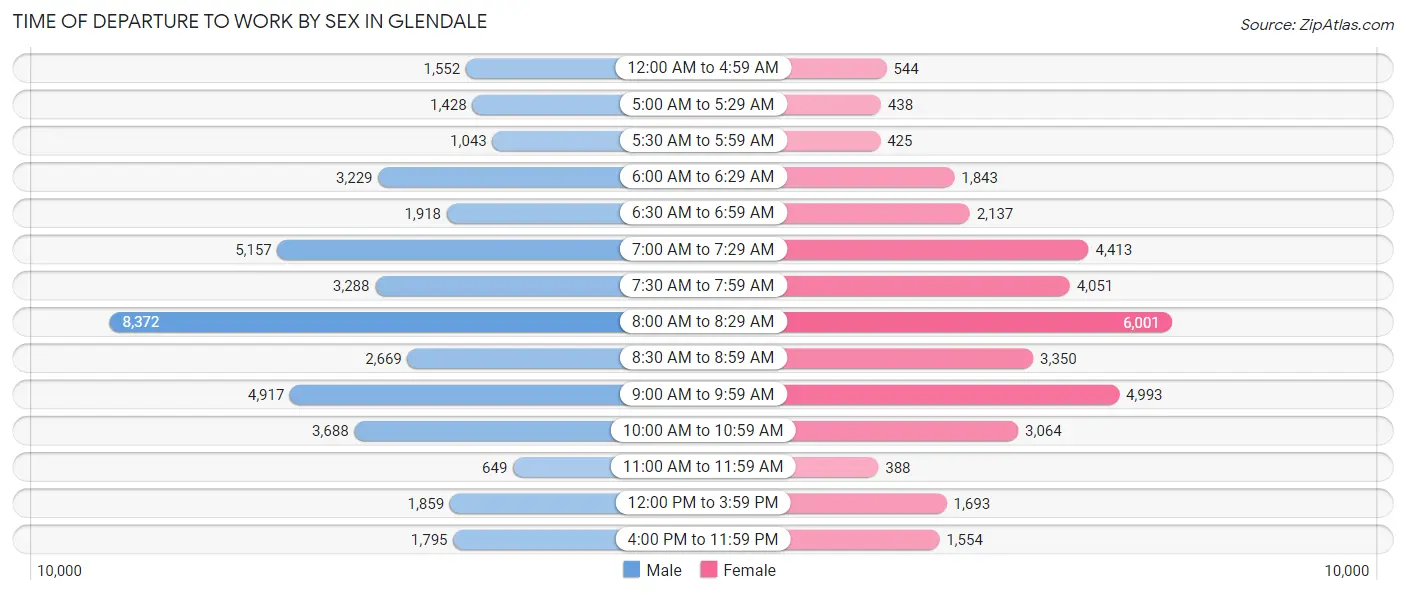
| Time of Departure | Male | Female |
| 12:00 AM to 4:59 AM | 1,552 (3.7%) | 544 (1.6%) |
| 5:00 AM to 5:29 AM | 1,428 (3.4%) | 438 (1.3%) |
| 5:30 AM to 5:59 AM | 1,043 (2.5%) | 425 (1.2%) |
| 6:00 AM to 6:29 AM | 3,229 (7.8%) | 1,843 (5.3%) |
| 6:30 AM to 6:59 AM | 1,918 (4.6%) | 2,137 (6.1%) |
| 7:00 AM to 7:29 AM | 5,157 (12.4%) | 4,413 (12.7%) |
| 7:30 AM to 7:59 AM | 3,288 (7.9%) | 4,051 (11.6%) |
| 8:00 AM to 8:29 AM | 8,372 (20.1%) | 6,001 (17.2%) |
| 8:30 AM to 8:59 AM | 2,669 (6.4%) | 3,350 (9.6%) |
| 9:00 AM to 9:59 AM | 4,917 (11.8%) | 4,993 (14.3%) |
| 10:00 AM to 10:59 AM | 3,688 (8.9%) | 3,064 (8.8%) |
| 11:00 AM to 11:59 AM | 649 (1.6%) | 388 (1.1%) |
| 12:00 PM to 3:59 PM | 1,859 (4.5%) | 1,693 (4.9%) |
| 4:00 PM to 11:59 PM | 1,795 (4.3%) | 1,554 (4.4%) |
| Total | 41,564 (100.0%) | 34,894 (100.0%) |
Housing Occupancy in Glendale
Occupancy by Ownership in Glendale
Of the total 73,104 dwellings in Glendale, owner-occupied units account for 25,015 (34.2%), while renter-occupied units make up 48,089 (65.8%).
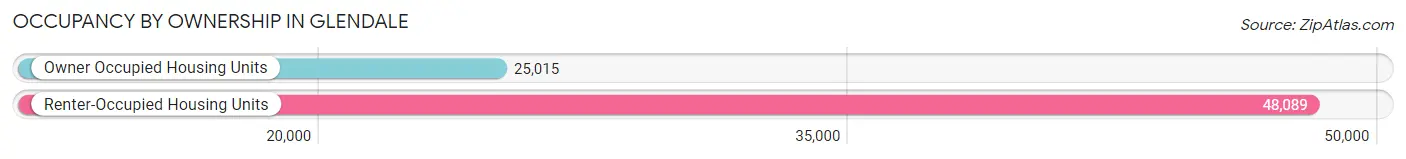
| Occupancy | # Housing Units | % Housing Units |
| Owner Occupied Housing Units | 25,015 | 34.2% |
| Renter-Occupied Housing Units | 48,089 | 65.8% |
| Total Occupied Housing Units | 73,104 | 100.0% |
Occupancy by Household Size in Glendale
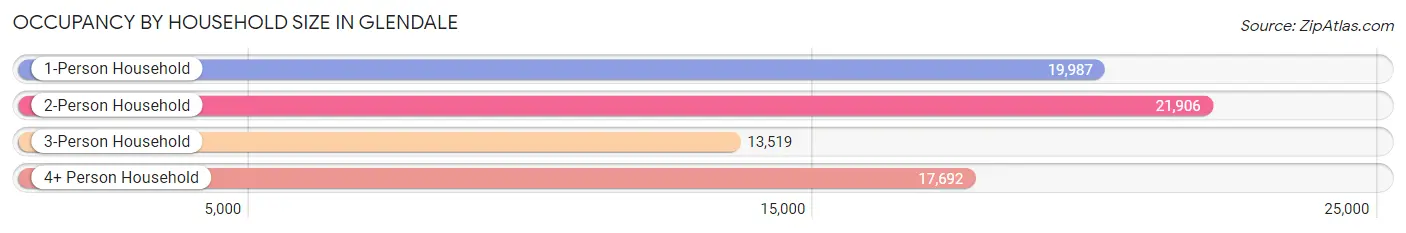
| Household Size | # Housing Units | % Housing Units |
| 1-Person Household | 19,987 | 27.3% |
| 2-Person Household | 21,906 | 30.0% |
| 3-Person Household | 13,519 | 18.5% |
| 4+ Person Household | 17,692 | 24.2% |
| Total Housing Units | 73,104 | 100.0% |
Occupancy by Ownership by Household Size in Glendale
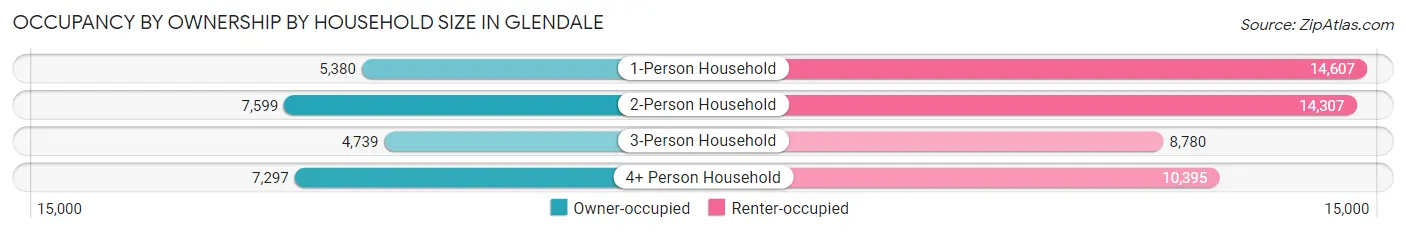
| Household Size | Owner-occupied | Renter-occupied |
| 1-Person Household | 5,380 (26.9%) | 14,607 (73.1%) |
| 2-Person Household | 7,599 (34.7%) | 14,307 (65.3%) |
| 3-Person Household | 4,739 (35.0%) | 8,780 (64.9%) |
| 4+ Person Household | 7,297 (41.2%) | 10,395 (58.8%) |
| Total Housing Units | 25,015 (34.2%) | 48,089 (65.8%) |
Occupancy by Educational Attainment in Glendale
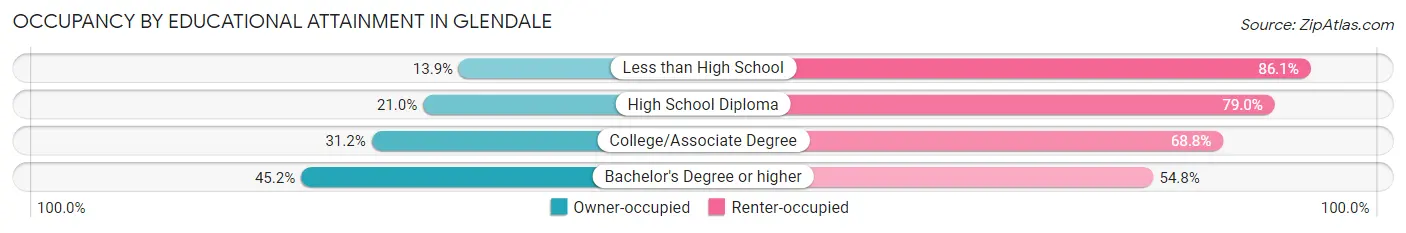
| Household Size | Owner-occupied | Renter-occupied |
| Less than High School | 991 (13.9%) | 6,142 (86.1%) |
| High School Diploma | 2,816 (21.0%) | 10,592 (79.0%) |
| College/Associate Degree | 5,696 (31.2%) | 12,548 (68.8%) |
| Bachelor's Degree or higher | 15,512 (45.2%) | 18,807 (54.8%) |
Occupancy by Age of Householder in Glendale
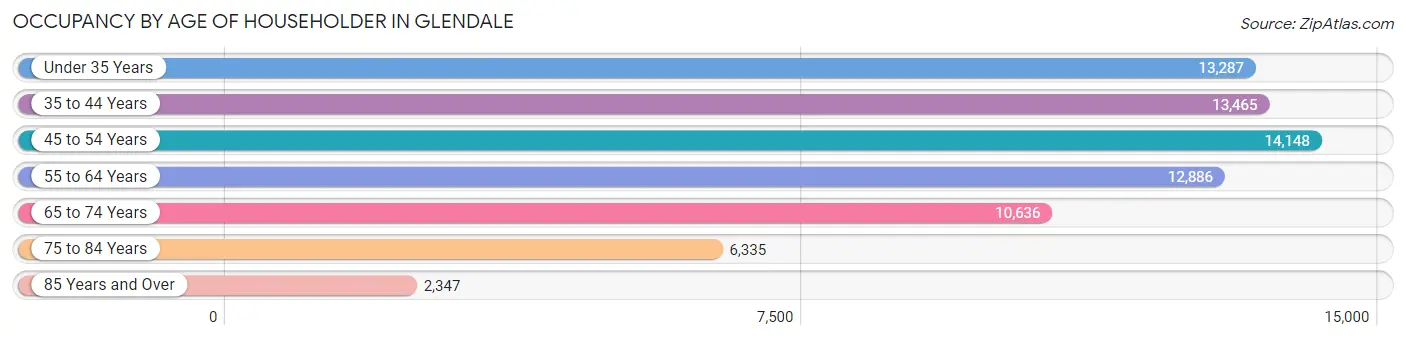
| Age Bracket | # Households | % Households |
| Under 35 Years | 13,287 | 18.2% |
| 35 to 44 Years | 13,465 | 18.4% |
| 45 to 54 Years | 14,148 | 19.4% |
| 55 to 64 Years | 12,886 | 17.6% |
| 65 to 74 Years | 10,636 | 14.5% |
| 75 to 84 Years | 6,335 | 8.7% |
| 85 Years and Over | 2,347 | 3.2% |
| Total | 73,104 | 100.0% |
Housing Finances in Glendale
Median Income by Occupancy in Glendale
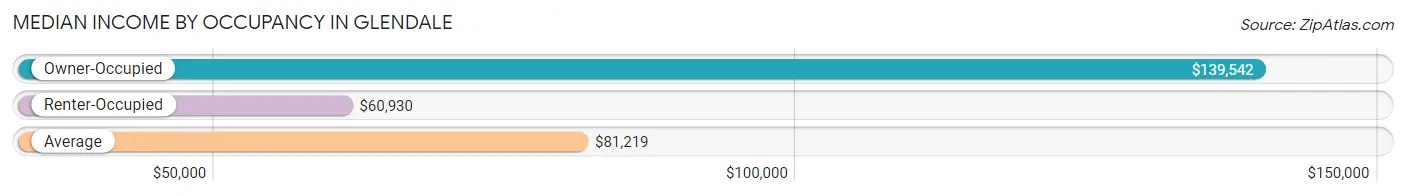
| Occupancy Type | # Households | Median Income |
| Owner-Occupied | 25,015 (34.2%) | $139,542 |
| Renter-Occupied | 48,089 (65.8%) | $60,930 |
| Average | 73,104 (100.0%) | $81,219 |
Occupancy by Householder Income Bracket in Glendale
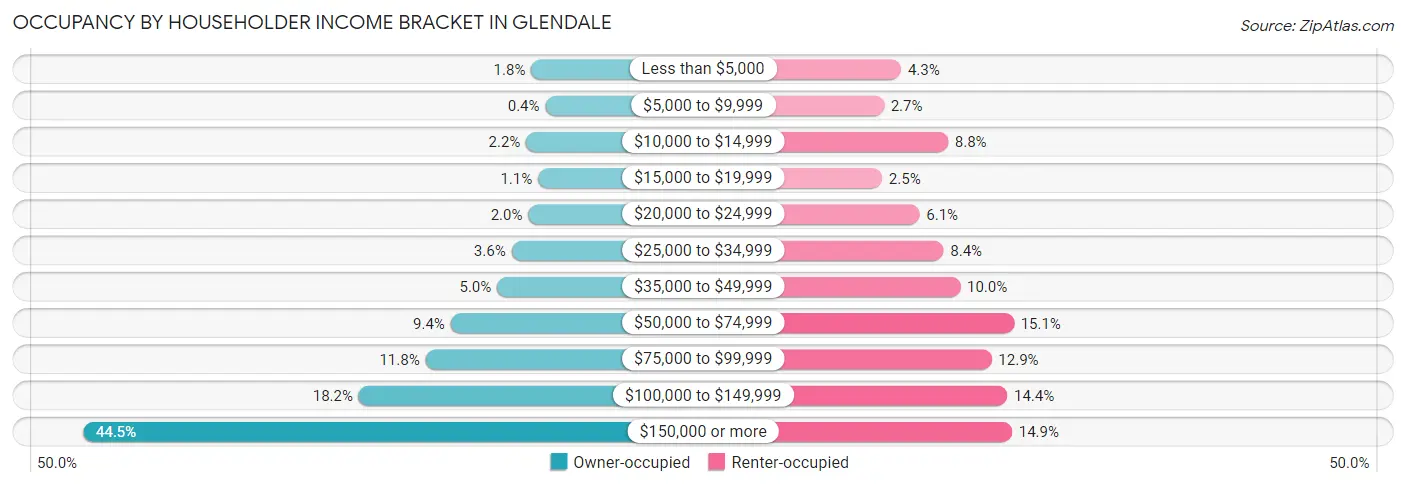
| Income Bracket | Owner-occupied | Renter-occupied |
| Less than $5,000 | 437 (1.8%) | 2,080 (4.3%) |
| $5,000 to $9,999 | 101 (0.4%) | 1,290 (2.7%) |
| $10,000 to $14,999 | 559 (2.2%) | 4,227 (8.8%) |
| $15,000 to $19,999 | 275 (1.1%) | 1,208 (2.5%) |
| $20,000 to $24,999 | 509 (2.0%) | 2,923 (6.1%) |
| $25,000 to $34,999 | 908 (3.6%) | 4,022 (8.4%) |
| $35,000 to $49,999 | 1,251 (5.0%) | 4,783 (10.0%) |
| $50,000 to $74,999 | 2,357 (9.4%) | 7,240 (15.1%) |
| $75,000 to $99,999 | 2,956 (11.8%) | 6,222 (12.9%) |
| $100,000 to $149,999 | 4,544 (18.2%) | 6,939 (14.4%) |
| $150,000 or more | 11,118 (44.5%) | 7,155 (14.9%) |
| Total | 25,015 (100.0%) | 48,089 (100.0%) |
Monthly Housing Cost Tiers in Glendale
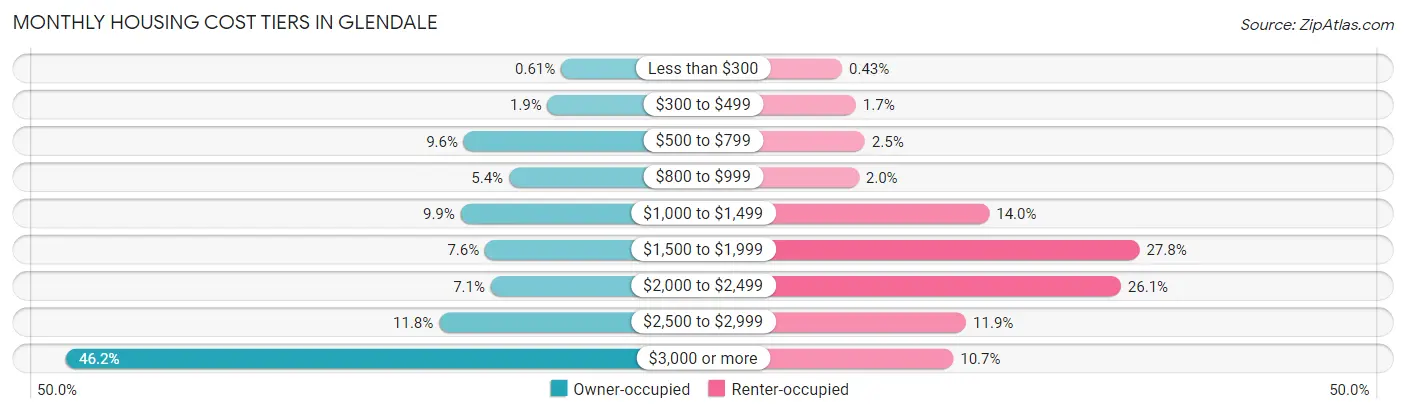
| Monthly Cost | Owner-occupied | Renter-occupied |
| Less than $300 | 152 (0.6%) | 209 (0.4%) |
| $300 to $499 | 466 (1.9%) | 816 (1.7%) |
| $500 to $799 | 2,393 (9.6%) | 1,219 (2.5%) |
| $800 to $999 | 1,354 (5.4%) | 947 (2.0%) |
| $1,000 to $1,499 | 2,466 (9.9%) | 6,723 (14.0%) |
| $1,500 to $1,999 | 1,903 (7.6%) | 13,372 (27.8%) |
| $2,000 to $2,499 | 1,770 (7.1%) | 12,552 (26.1%) |
| $2,500 to $2,999 | 2,961 (11.8%) | 5,699 (11.8%) |
| $3,000 or more | 11,550 (46.2%) | 5,131 (10.7%) |
| Total | 25,015 (100.0%) | 48,089 (100.0%) |
Physical Housing Characteristics in Glendale
Housing Structures in Glendale
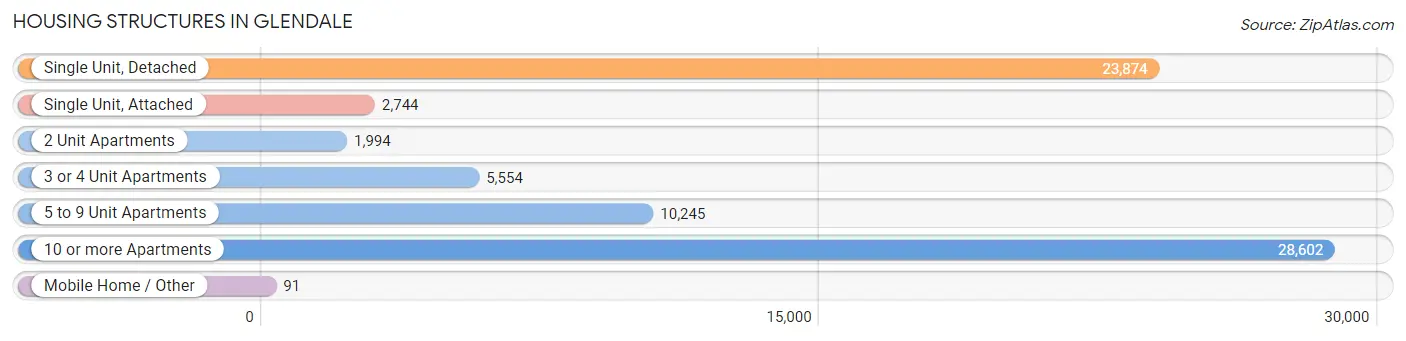
| Structure Type | # Housing Units | % Housing Units |
| Single Unit, Detached | 23,874 | 32.7% |
| Single Unit, Attached | 2,744 | 3.7% |
| 2 Unit Apartments | 1,994 | 2.7% |
| 3 or 4 Unit Apartments | 5,554 | 7.6% |
| 5 to 9 Unit Apartments | 10,245 | 14.0% |
| 10 or more Apartments | 28,602 | 39.1% |
| Mobile Home / Other | 91 | 0.1% |
| Total | 73,104 | 100.0% |
Housing Structures by Occupancy in Glendale
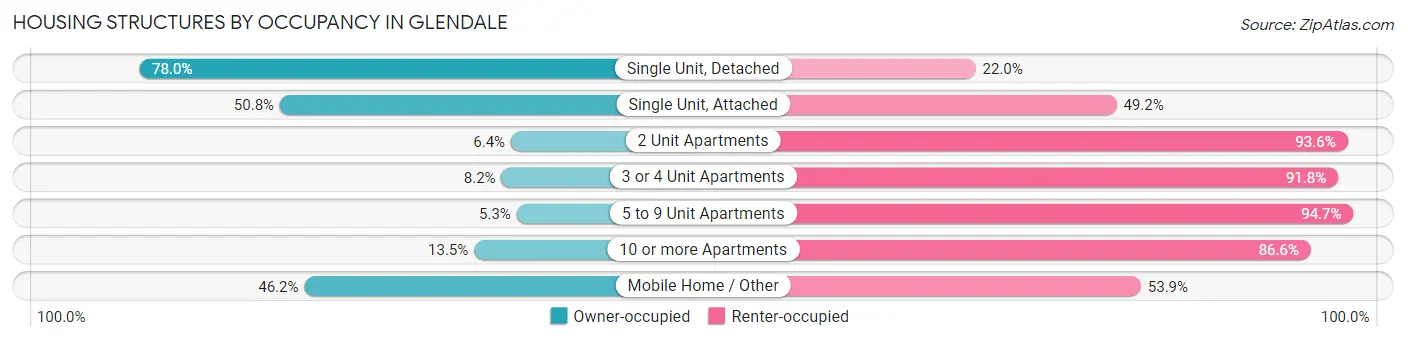
| Structure Type | Owner-occupied | Renter-occupied |
| Single Unit, Detached | 18,611 (78.0%) | 5,263 (22.0%) |
| Single Unit, Attached | 1,395 (50.8%) | 1,349 (49.2%) |
| 2 Unit Apartments | 127 (6.4%) | 1,867 (93.6%) |
| 3 or 4 Unit Apartments | 455 (8.2%) | 5,099 (91.8%) |
| 5 to 9 Unit Apartments | 539 (5.3%) | 9,706 (94.7%) |
| 10 or more Apartments | 3,846 (13.5%) | 24,756 (86.6%) |
| Mobile Home / Other | 42 (46.2%) | 49 (53.8%) |
| Total | 25,015 (34.2%) | 48,089 (65.8%) |
Housing Structures by Number of Rooms in Glendale
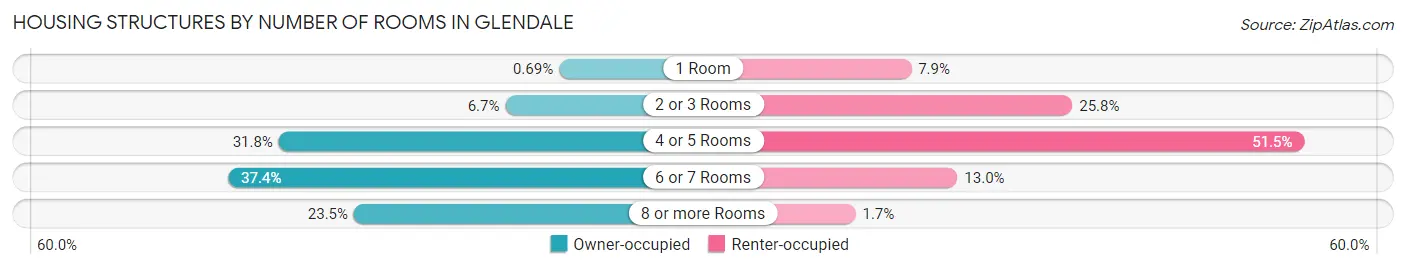
| Number of Rooms | Owner-occupied | Renter-occupied |
| 1 Room | 172 (0.7%) | 3,804 (7.9%) |
| 2 or 3 Rooms | 1,663 (6.7%) | 12,401 (25.8%) |
| 4 or 5 Rooms | 7,954 (31.8%) | 24,781 (51.5%) |
| 6 or 7 Rooms | 9,357 (37.4%) | 6,271 (13.0%) |
| 8 or more Rooms | 5,869 (23.5%) | 832 (1.7%) |
| Total | 25,015 (100.0%) | 48,089 (100.0%) |
Housing Structure by Heating Type in Glendale
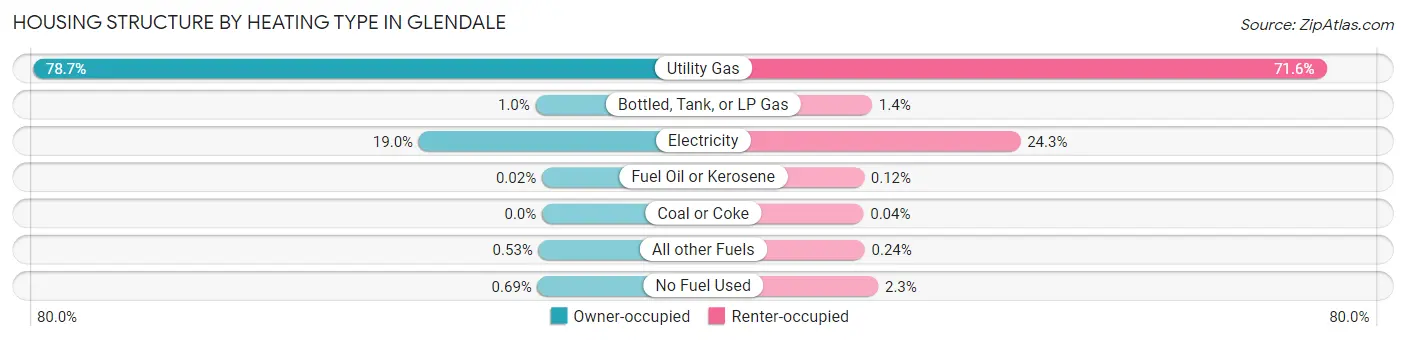
| Heating Type | Owner-occupied | Renter-occupied |
| Utility Gas | 19,694 (78.7%) | 34,434 (71.6%) |
| Bottled, Tank, or LP Gas | 250 (1.0%) | 661 (1.4%) |
| Electricity | 4,762 (19.0%) | 11,688 (24.3%) |
| Fuel Oil or Kerosene | 5 (0.0%) | 56 (0.1%) |
| Coal or Coke | 0 (0.0%) | 17 (0.0%) |
| All other Fuels | 132 (0.5%) | 117 (0.2%) |
| No Fuel Used | 172 (0.7%) | 1,116 (2.3%) |
| Total | 25,015 (100.0%) | 48,089 (100.0%) |
Household Vehicle Usage in Glendale
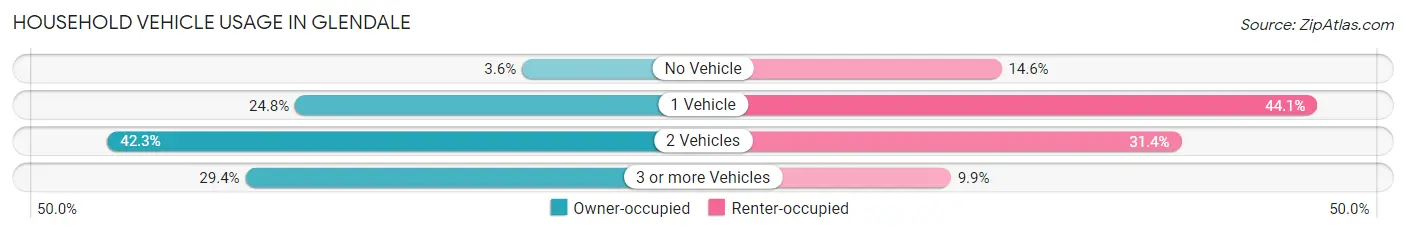
| Vehicles per Household | Owner-occupied | Renter-occupied |
| No Vehicle | 894 (3.6%) | 7,026 (14.6%) |
| 1 Vehicle | 6,192 (24.7%) | 21,209 (44.1%) |
| 2 Vehicles | 10,577 (42.3%) | 15,103 (31.4%) |
| 3 or more Vehicles | 7,352 (29.4%) | 4,751 (9.9%) |
| Total | 25,015 (100.0%) | 48,089 (100.0%) |
Real Estate & Mortgages in Glendale
Real Estate and Mortgage Overview in Glendale
| Characteristic | Without Mortgage | With Mortgage |
| Housing Units | 7,011 | 18,004 |
| Median Property Value | $939,400 | $1,012,200 |
| Median Household Income | $92,924 | $9,082 |
| Monthly Housing Costs | $910 | $11,491 |
| Real Estate Taxes | $4,398 | $255 |
Property Value by Mortgage Status in Glendale
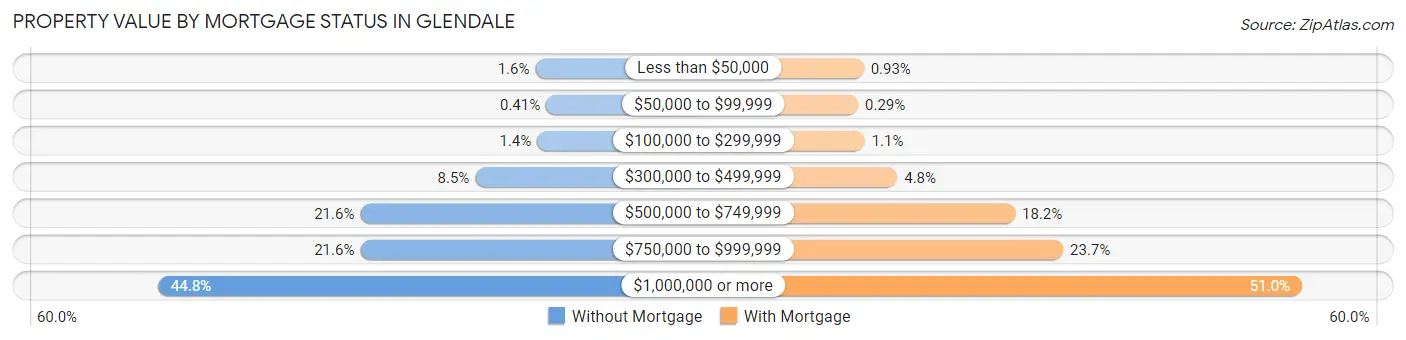
| Property Value | Without Mortgage | With Mortgage |
| Less than $50,000 | 114 (1.6%) | 167 (0.9%) |
| $50,000 to $99,999 | 29 (0.4%) | 53 (0.3%) |
| $100,000 to $299,999 | 100 (1.4%) | 189 (1.1%) |
| $300,000 to $499,999 | 596 (8.5%) | 858 (4.8%) |
| $500,000 to $749,999 | 1,517 (21.6%) | 3,282 (18.2%) |
| $750,000 to $999,999 | 1,517 (21.6%) | 4,271 (23.7%) |
| $1,000,000 or more | 3,138 (44.8%) | 9,184 (51.0%) |
| Total | 7,011 (100.0%) | 18,004 (100.0%) |
Household Income by Mortgage Status in Glendale
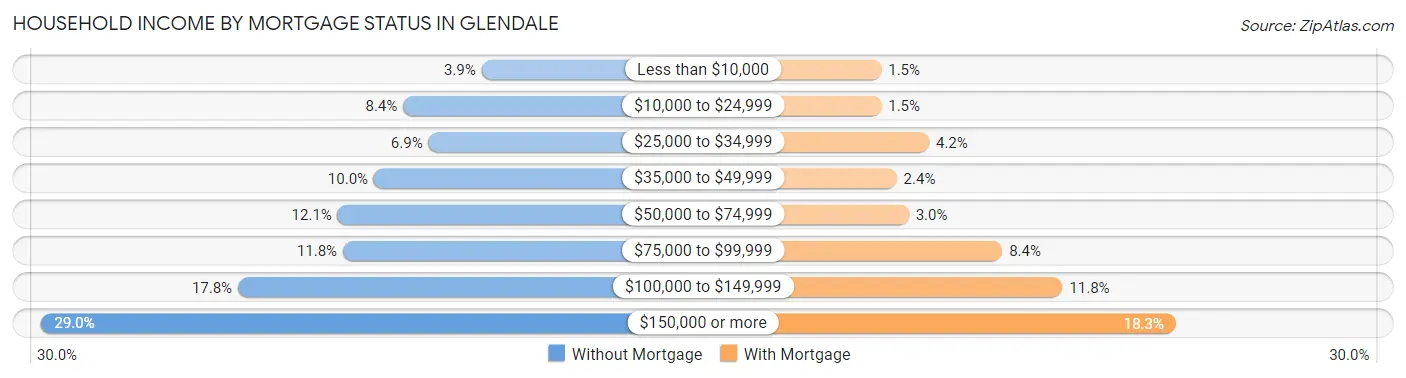
| Household Income | Without Mortgage | With Mortgage |
| Less than $10,000 | 273 (3.9%) | 264 (1.5%) |
| $10,000 to $24,999 | 587 (8.4%) | 265 (1.5%) |
| $25,000 to $34,999 | 485 (6.9%) | 756 (4.2%) |
| $35,000 to $49,999 | 704 (10.0%) | 423 (2.4%) |
| $50,000 to $74,999 | 849 (12.1%) | 547 (3.0%) |
| $75,000 to $99,999 | 828 (11.8%) | 1,508 (8.4%) |
| $100,000 to $149,999 | 1,249 (17.8%) | 2,128 (11.8%) |
| $150,000 or more | 2,036 (29.0%) | 3,295 (18.3%) |
| Total | 7,011 (100.0%) | 18,004 (100.0%) |
Property Value to Household Income Ratio in Glendale
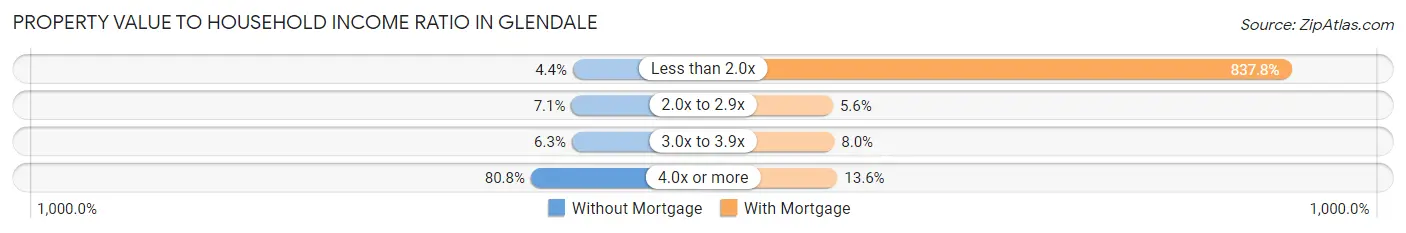
| Value-to-Income Ratio | Without Mortgage | With Mortgage |
| Less than 2.0x | 305 (4.3%) | 150,844 (837.8%) |
| 2.0x to 2.9x | 499 (7.1%) | 1,008 (5.6%) |
| 3.0x to 3.9x | 444 (6.3%) | 1,448 (8.0%) |
| 4.0x or more | 5,662 (80.8%) | 2,448 (13.6%) |
| Total | 7,011 (100.0%) | 18,004 (100.0%) |
Real Estate Taxes by Mortgage Status in Glendale
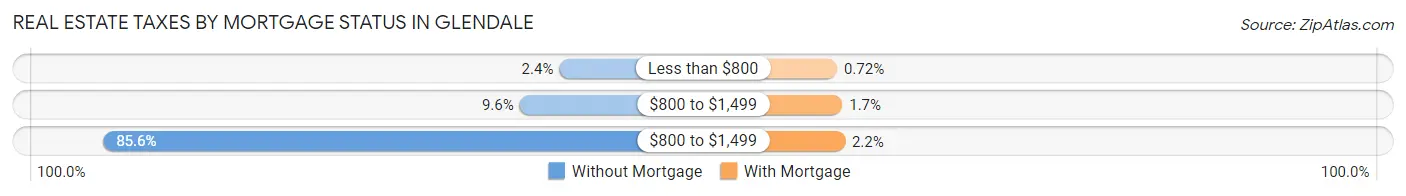
| Property Taxes | Without Mortgage | With Mortgage |
| Less than $800 | 165 (2.4%) | 130 (0.7%) |
| $800 to $1,499 | 673 (9.6%) | 304 (1.7%) |
| $800 to $1,499 | 6,004 (85.6%) | 390 (2.2%) |
| Total | 7,011 (100.0%) | 18,004 (100.0%) |
Health & Disability in Glendale
Health Insurance Coverage by Age in Glendale
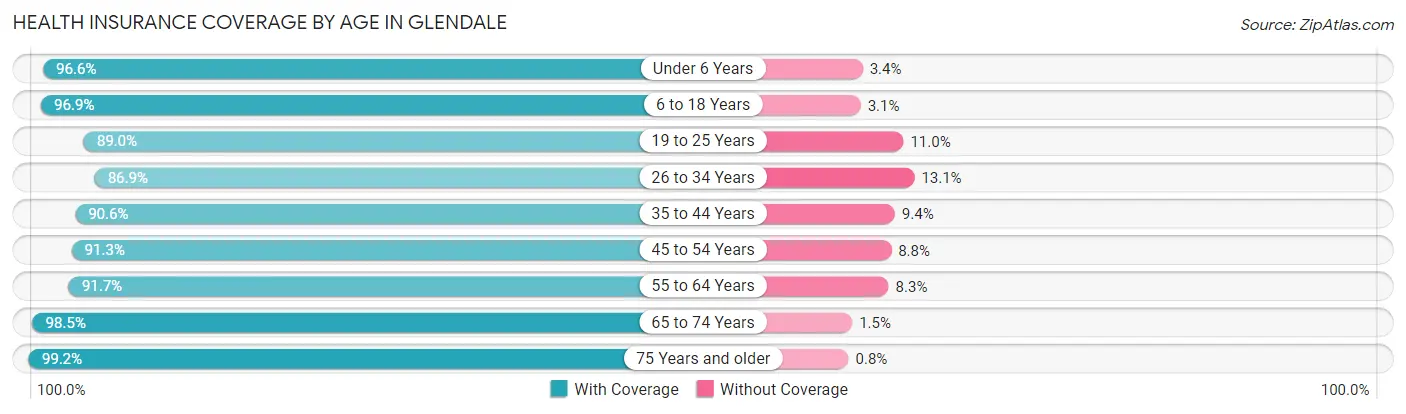
| Age Bracket | With Coverage | Without Coverage |
| Under 6 Years | 10,839 (96.6%) | 386 (3.4%) |
| 6 to 18 Years | 25,568 (96.9%) | 811 (3.1%) |
| 19 to 25 Years | 13,680 (89.0%) | 1,698 (11.0%) |
| 26 to 34 Years | 24,242 (86.9%) | 3,649 (13.1%) |
| 35 to 44 Years | 23,362 (90.6%) | 2,435 (9.4%) |
| 45 to 54 Years | 24,193 (91.2%) | 2,321 (8.7%) |
| 55 to 64 Years | 23,053 (91.7%) | 2,079 (8.3%) |
| 65 to 74 Years | 18,801 (98.5%) | 282 (1.5%) |
| 75 Years and older | 15,645 (99.2%) | 126 (0.8%) |
| Total | 179,383 (92.9%) | 13,787 (7.1%) |
Health Insurance Coverage by Citizenship Status in Glendale
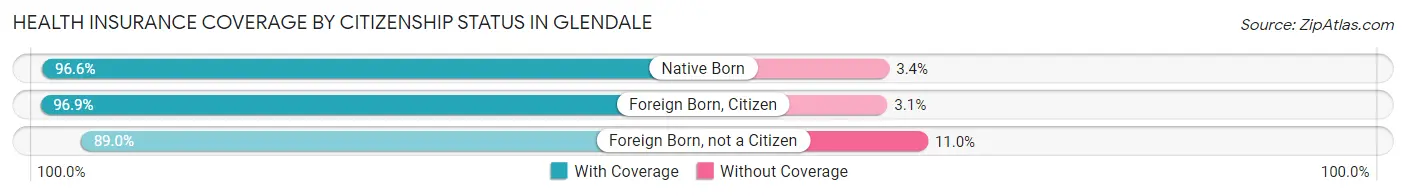
| Citizenship Status | With Coverage | Without Coverage |
| Native Born | 10,839 (96.6%) | 386 (3.4%) |
| Foreign Born, Citizen | 25,568 (96.9%) | 811 (3.1%) |
| Foreign Born, not a Citizen | 13,680 (89.0%) | 1,698 (11.0%) |
Health Insurance Coverage by Household Income in Glendale
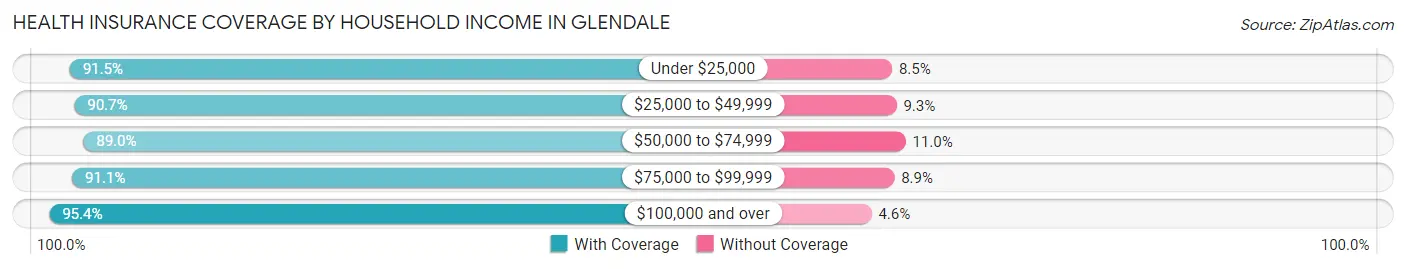
| Household Income | With Coverage | Without Coverage |
| Under $25,000 | 23,046 (91.5%) | 2,130 (8.5%) |
| $25,000 to $49,999 | 23,816 (90.7%) | 2,444 (9.3%) |
| $50,000 to $74,999 | 22,036 (89.0%) | 2,726 (11.0%) |
| $75,000 to $99,999 | 22,672 (91.1%) | 2,212 (8.9%) |
| $100,000 and over | 86,992 (95.4%) | 4,211 (4.6%) |
Public vs Private Health Insurance Coverage by Age in Glendale
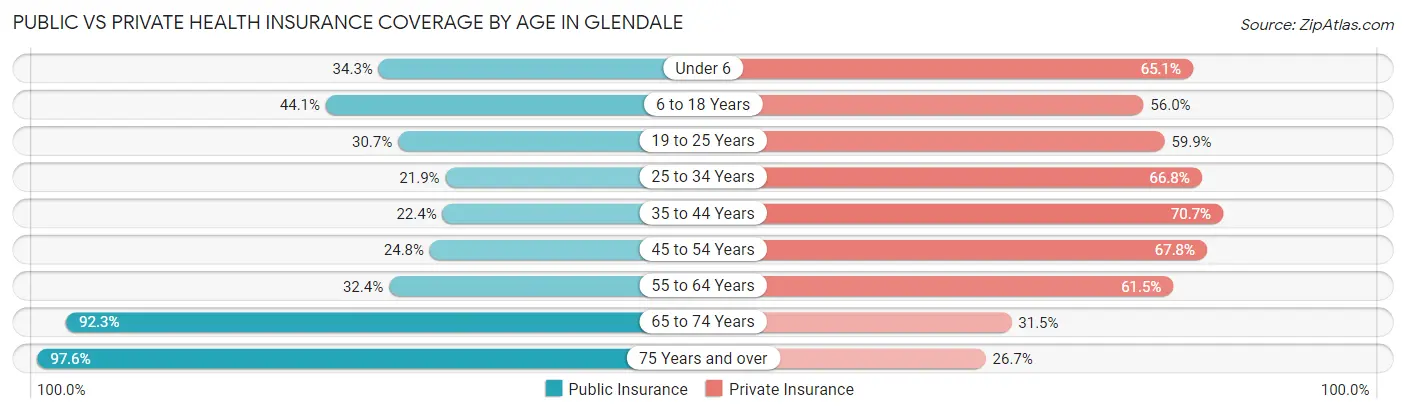
| Age Bracket | Public Insurance | Private Insurance |
| Under 6 | 3,848 (34.3%) | 7,312 (65.1%) |
| 6 to 18 Years | 11,628 (44.1%) | 14,766 (56.0%) |
| 19 to 25 Years | 4,719 (30.7%) | 9,210 (59.9%) |
| 25 to 34 Years | 6,106 (21.9%) | 18,625 (66.8%) |
| 35 to 44 Years | 5,786 (22.4%) | 18,248 (70.7%) |
| 45 to 54 Years | 6,570 (24.8%) | 17,964 (67.7%) |
| 55 to 64 Years | 8,132 (32.4%) | 15,458 (61.5%) |
| 65 to 74 Years | 17,614 (92.3%) | 6,005 (31.5%) |
| 75 Years and over | 15,398 (97.6%) | 4,211 (26.7%) |
| Total | 79,801 (41.3%) | 111,799 (57.9%) |
Disability Status by Sex by Age in Glendale
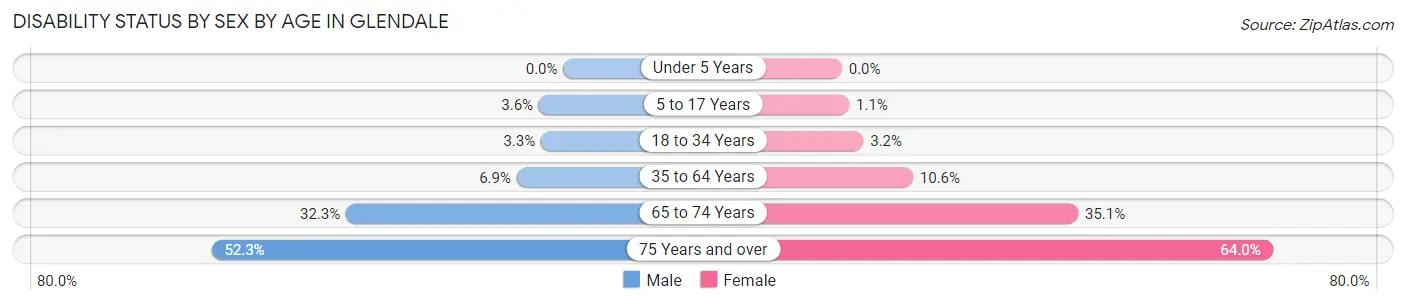
| Age Bracket | Male | Female |
| Under 5 Years | 0 (0.0%) | 0 (0.0%) |
| 5 to 17 Years | 441 (3.6%) | 144 (1.1%) |
| 18 to 34 Years | 760 (3.3%) | 729 (3.2%) |
| 35 to 64 Years | 2,583 (6.9%) | 4,227 (10.5%) |
| 65 to 74 Years | 2,630 (32.3%) | 3,835 (35.1%) |
| 75 Years and over | 3,358 (52.2%) | 5,977 (64.0%) |
Disability Class by Sex by Age in Glendale
Disability Class: Hearing Difficulty
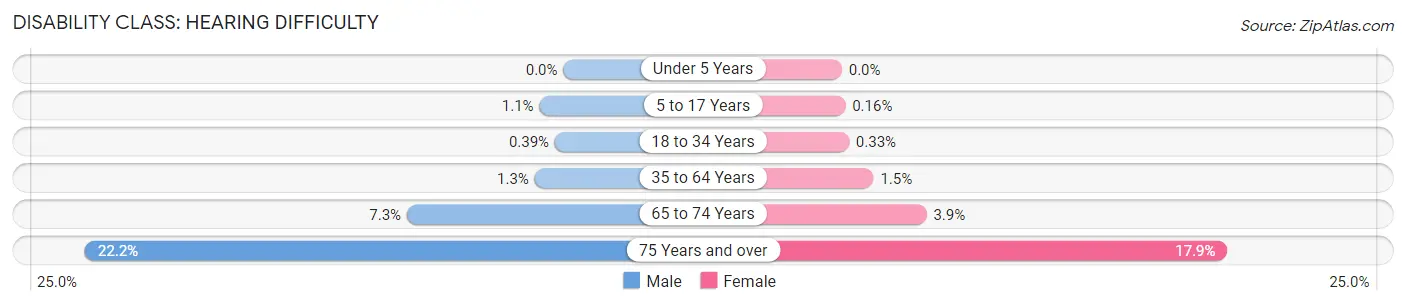
| Age Bracket | Male | Female |
| Under 5 Years | 0 (0.0%) | 0 (0.0%) |
| 5 to 17 Years | 135 (1.1%) | 22 (0.2%) |
| 18 to 34 Years | 90 (0.4%) | 75 (0.3%) |
| 35 to 64 Years | 496 (1.3%) | 587 (1.5%) |
| 65 to 74 Years | 592 (7.3%) | 430 (3.9%) |
| 75 Years and over | 1,427 (22.2%) | 1,672 (17.9%) |
Disability Class: Vision Difficulty
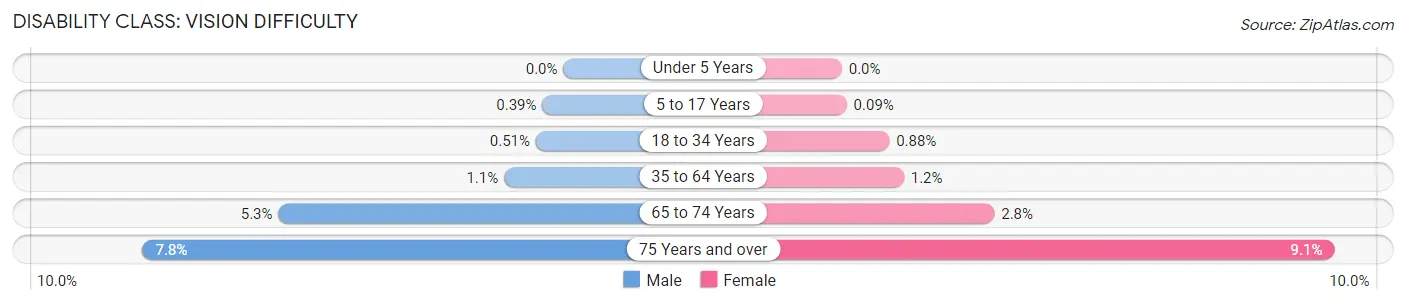
| Age Bracket | Male | Female |
| Under 5 Years | 0 (0.0%) | 0 (0.0%) |
| 5 to 17 Years | 47 (0.4%) | 12 (0.1%) |
| 18 to 34 Years | 117 (0.5%) | 201 (0.9%) |
| 35 to 64 Years | 412 (1.1%) | 459 (1.1%) |
| 65 to 74 Years | 431 (5.3%) | 309 (2.8%) |
| 75 Years and over | 502 (7.8%) | 854 (9.1%) |
Disability Class: Cognitive Difficulty
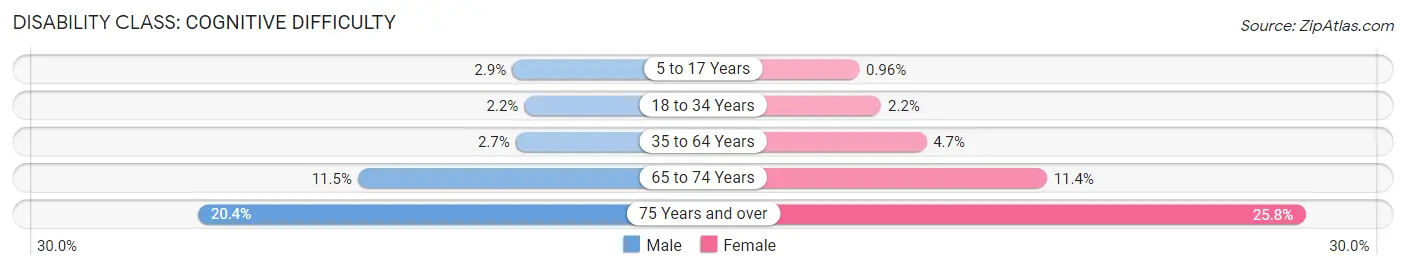
| Age Bracket | Male | Female |
| 5 to 17 Years | 347 (2.9%) | 128 (1.0%) |
| 18 to 34 Years | 501 (2.2%) | 501 (2.2%) |
| 35 to 64 Years | 996 (2.7%) | 1,884 (4.7%) |
| 65 to 74 Years | 933 (11.5%) | 1,247 (11.4%) |
| 75 Years and over | 1,308 (20.3%) | 2,410 (25.8%) |
Disability Class: Ambulatory Difficulty
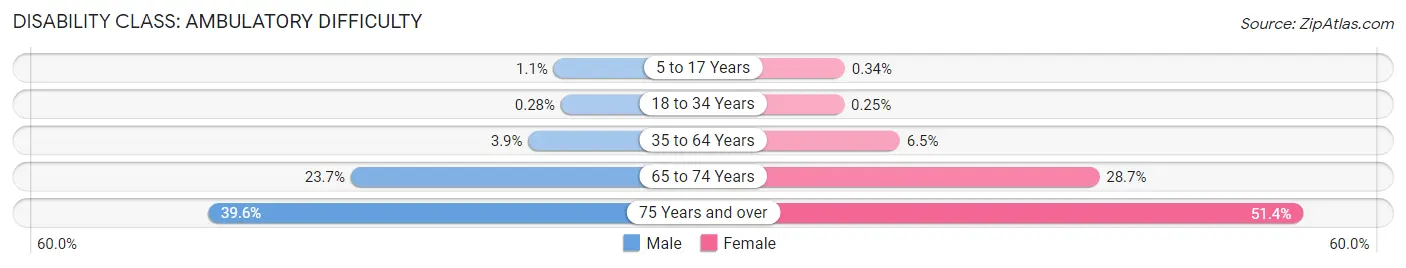
| Age Bracket | Male | Female |
| 5 to 17 Years | 131 (1.1%) | 45 (0.3%) |
| 18 to 34 Years | 64 (0.3%) | 58 (0.3%) |
| 35 to 64 Years | 1,456 (3.9%) | 2,588 (6.5%) |
| 65 to 74 Years | 1,929 (23.7%) | 3,136 (28.7%) |
| 75 Years and over | 2,544 (39.6%) | 4,800 (51.4%) |
Disability Class: Self-Care Difficulty
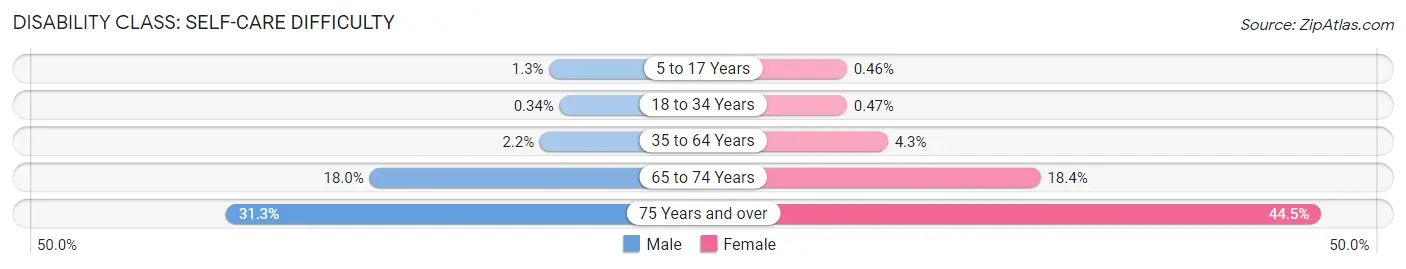
| Age Bracket | Male | Female |
| 5 to 17 Years | 157 (1.3%) | 61 (0.5%) |
| 18 to 34 Years | 78 (0.3%) | 108 (0.5%) |
| 35 to 64 Years | 809 (2.2%) | 1,705 (4.3%) |
| 65 to 74 Years | 1,466 (18.0%) | 2,016 (18.4%) |
| 75 Years and over | 2,013 (31.3%) | 4,156 (44.5%) |
Technology Access in Glendale
Computing Device Access in Glendale
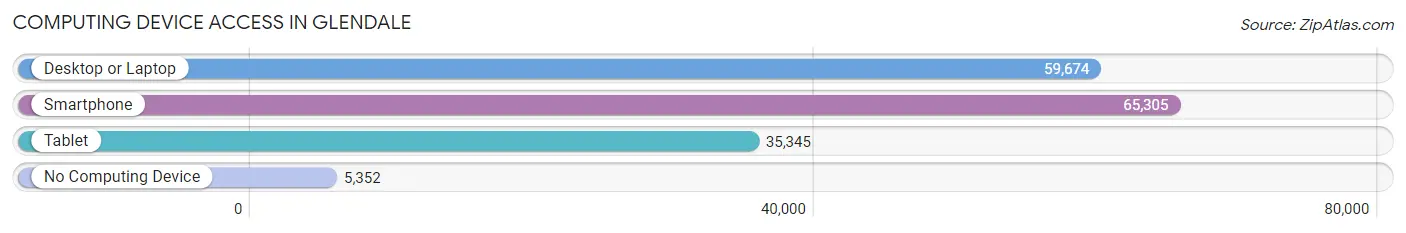
| Device Type | # Households | % Households |
| Desktop or Laptop | 59,674 | 81.6% |
| Smartphone | 65,305 | 89.3% |
| Tablet | 35,345 | 48.3% |
| No Computing Device | 5,352 | 7.3% |
| Total | 73,104 | 100.0% |
Internet Access in Glendale
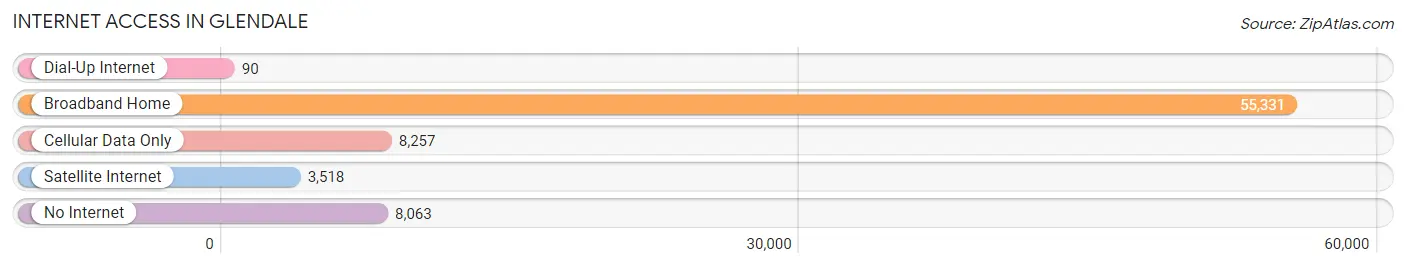
| Internet Type | # Households | % Households |
| Dial-Up Internet | 90 | 0.1% |
| Broadband Home | 55,331 | 75.7% |
| Cellular Data Only | 8,257 | 11.3% |
| Satellite Internet | 3,518 | 4.8% |
| No Internet | 8,063 | 11.0% |
| Total | 73,104 | 100.0% |
Glendale Summary
Glendale, California is a city located in Los Angeles County, California. It is situated in the San Fernando Valley, just north of the city of Los Angeles. Glendale is the third largest city in Los Angeles County, with a population of over 200,000 people.
Geography
Glendale is located in the San Fernando Valley, just north of the city of Los Angeles. It is bordered by the cities of Burbank, La Cañada Flintridge, La Crescenta, and Sunland-Tujunga. The city is situated in the foothills of the San Gabriel Mountains, and is home to the Verdugo Mountains, which are part of the Transverse Ranges. The city is divided into several distinct neighborhoods, including the Downtown area, the Glendale Galleria, and the Grand Central Business District.
History
Glendale was founded in 1884 by William and George Whiting, who purchased the land from the Rancho San Rafael. The city was originally named "Glendale" after the Whiting's hometown of Glendale, Ohio. The city was incorporated in 1906, and quickly grew to become a popular destination for tourists and residents alike. The city was home to the first movie studio in the United States, the Nestor Film Company, which was founded in 1911.
Economy
Glendale is home to a diverse economy, with a variety of industries represented. The city is home to several major corporations, including Nestle USA, DreamWorks Animation, and the Walt Disney Company. Glendale is also home to a number of smaller businesses, including restaurants, retail stores, and professional services. The city is also home to the Glendale Galleria, one of the largest shopping malls in the United States.
Demographics
As of the 2010 census, Glendale had a population of 191,719 people. The racial makeup of the city was 57.2% White, 5.2% African American, 0.7% Native American, 25.3% Asian, 0.2% Pacific Islander, 8.7% from other races, and 2.7% from two or more races. The median household income was $53,842, and the median family income was $63,824.
Glendale is home to a large Armenian population, with over 30,000 Armenians living in the city. The city is also home to a large Latino population, with over 40,000 Latinos living in the city. Glendale is also home to a large Korean population, with over 10,000 Koreans living in the city.
Conclusion
Glendale, California is a vibrant city located in Los Angeles County. It is home to a diverse population, with a variety of ethnicities and backgrounds represented. The city is home to a number of major corporations, as well as a variety of smaller businesses. Glendale is also home to a large Armenian, Latino, and Korean population. The city is a popular destination for tourists and residents alike, and is home to the Glendale Galleria, one of the largest shopping malls in the United States.
Common Questions
What is Per Capita Income in Glendale?
Per Capita income in Glendale is $44,298.
What is the Median Family Income in Glendale?
Median Family Income in Glendale is $93,823.
What is the Median Household income in Glendale?
Median Household Income in Glendale is $81,219.
What is Income or Wage Gap in Glendale?
Income or Wage Gap in Glendale is 23.1%.
Women in Glendale earn 76.9 cents for every dollar earned by a man.
What is Family Income Deficit in Glendale?
Family Income Deficit in Glendale is $11,869.
Families that are below poverty line in Glendale earn $11,869 less on average than the poverty threshold level.
What is Inequality or Gini Index in Glendale?
Inequality or Gini Index in Glendale is 0.50.
What is the Total Population of Glendale?
Total Population of Glendale is 194,512.
What is the Total Male Population of Glendale?
Total Male Population of Glendale is 92,399.
What is the Total Female Population of Glendale?
Total Female Population of Glendale is 102,113.
What is the Ratio of Males per 100 Females in Glendale?
There are 90.49 Males per 100 Females in Glendale.
What is the Ratio of Females per 100 Males in Glendale?
There are 110.51 Females per 100 Males in Glendale.
What is the Median Population Age in Glendale?
Median Population Age in Glendale is 41.1 Years.
What is the Average Family Size in Glendale
Average Family Size in Glendale is 3.3 People.
What is the Average Household Size in Glendale
Average Household Size in Glendale is 2.6 People.
How Large is the Labor Force in Glendale?
There are 101,750 People in the Labor Forcein in Glendale.
What is the Percentage of People in the Labor Force in Glendale?
62.2% of People are in the Labor Force in Glendale.
What is the Unemployment Rate in Glendale?
Unemployment Rate in Glendale is 8.1%.