Clearlake Oaks, CA Map & Demographics
Clearlake Oaks Map
Clearlake Oaks Overview
$40,587
PER CAPITA INCOME
$65,227
AVG FAMILY INCOME
$43,024
AVG HOUSEHOLD INCOME
8.1%
WAGE / INCOME GAP [ % ]
91.9¢/ $1
WAGE / INCOME GAP [ $ ]
0.55
INEQUALITY / GINI INDEX
2,074
TOTAL POPULATION
1,071
MALE POPULATION
1,003
FEMALE POPULATION
106.78
MALES / 100 FEMALES
93.65
FEMALES / 100 MALES
57.6
MEDIAN AGE
2.5
AVG FAMILY SIZE
1.9
AVG HOUSEHOLD SIZE
736
LABOR FORCE [ PEOPLE ]
40.2%
PERCENT IN LABOR FORCE
16.8%
UNEMPLOYMENT RATE
Clearlake Oaks Zip Codes
Clearlake Oaks Area Codes
Income in Clearlake Oaks
Income Overview in Clearlake Oaks
Per Capita Income in Clearlake Oaks is $40,587, while median incomes of families and households are $65,227 and $43,024 respectively.
| Characteristic | Number | Measure |
| Per Capita Income | 2,074 | $40,587 |
| Median Family Income | 552 | $65,227 |
| Mean Family Income | 552 | $111,406 |
| Median Household Income | 1,083 | $43,024 |
| Mean Household Income | 1,083 | $77,011 |
| Income Deficit | 552 | $0 |
| Wage / Income Gap (%) | 2,074 | 8.09% |
| Wage / Income Gap ($) | 2,074 | 91.91¢ per $1 |
| Gini / Inequality Index | 2,074 | 0.55 |
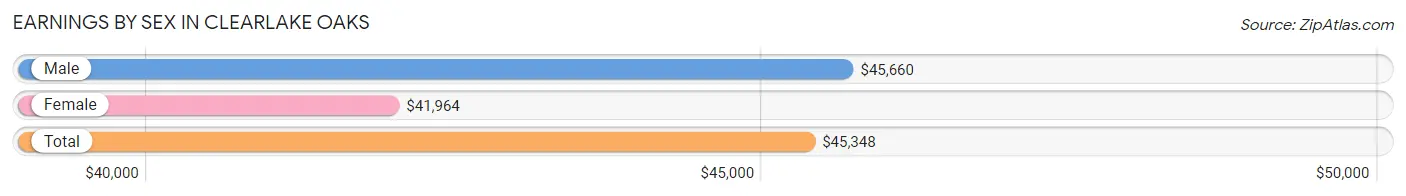
Earnings by Sex in Clearlake Oaks
Average Earnings in Clearlake Oaks are $45,348, $45,660 for men and $41,964 for women, a difference of 8.1%.
| Sex | Number | Average Earnings |
| Male | 398 (57.4%) | $45,660 |
| Female | 296 (42.6%) | $41,964 |
| Total | 694 (100.0%) | $45,348 |
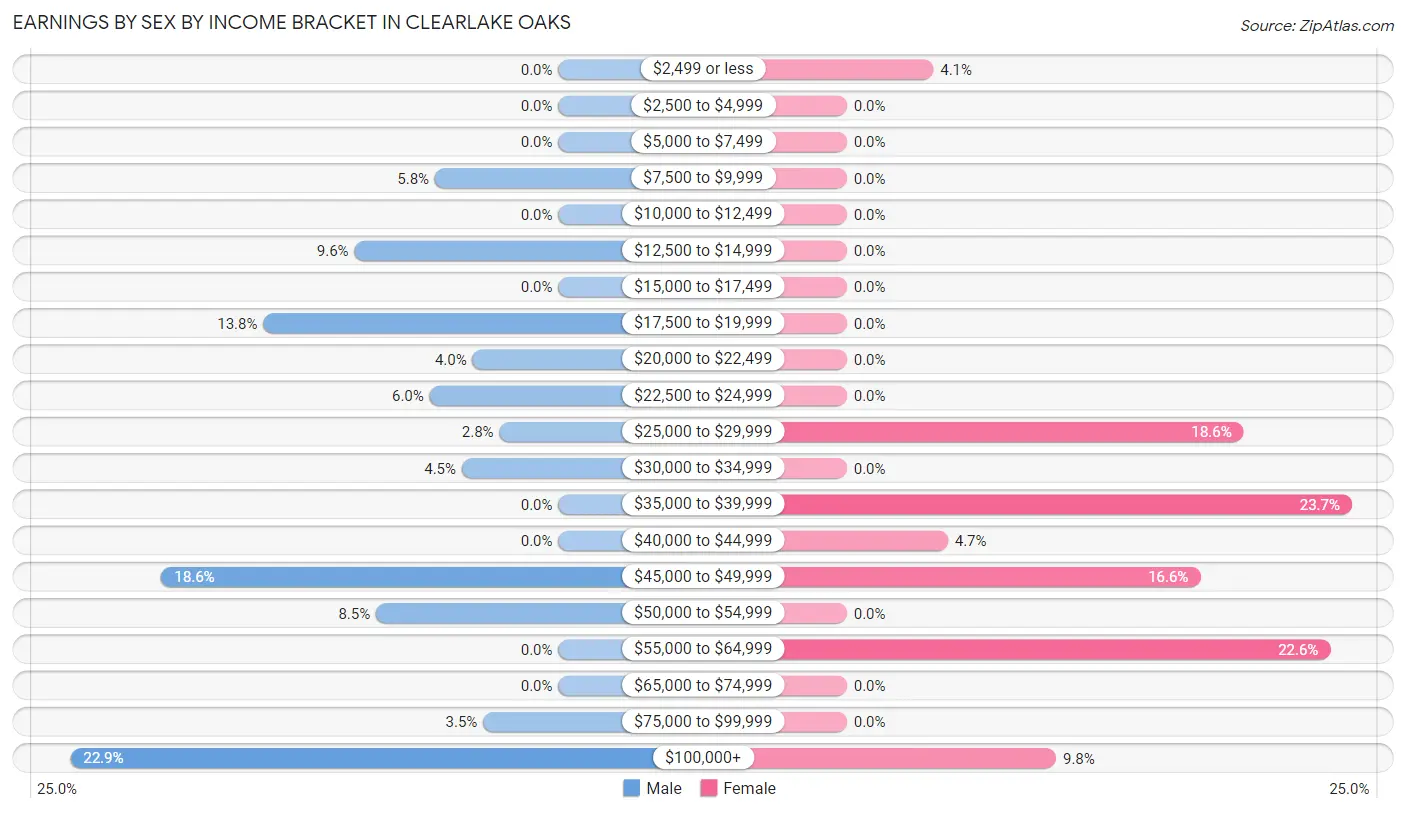
Earnings by Sex by Income Bracket in Clearlake Oaks
The most common earnings brackets in Clearlake Oaks are $100,000+ for men (91 | 22.9%) and $35,000 to $39,999 for women (70 | 23.6%).
| Income | Male | Female |
| $2,499 or less | 0 (0.0%) | 12 (4.1%) |
| $2,500 to $4,999 | 0 (0.0%) | 0 (0.0%) |
| $5,000 to $7,499 | 0 (0.0%) | 0 (0.0%) |
| $7,500 to $9,999 | 23 (5.8%) | 0 (0.0%) |
| $10,000 to $12,499 | 0 (0.0%) | 0 (0.0%) |
| $12,500 to $14,999 | 38 (9.6%) | 0 (0.0%) |
| $15,000 to $17,499 | 0 (0.0%) | 0 (0.0%) |
| $17,500 to $19,999 | 55 (13.8%) | 0 (0.0%) |
| $20,000 to $22,499 | 16 (4.0%) | 0 (0.0%) |
| $22,500 to $24,999 | 24 (6.0%) | 0 (0.0%) |
| $25,000 to $29,999 | 11 (2.8%) | 55 (18.6%) |
| $30,000 to $34,999 | 18 (4.5%) | 0 (0.0%) |
| $35,000 to $39,999 | 0 (0.0%) | 70 (23.6%) |
| $40,000 to $44,999 | 0 (0.0%) | 14 (4.7%) |
| $45,000 to $49,999 | 74 (18.6%) | 49 (16.6%) |
| $50,000 to $54,999 | 34 (8.5%) | 0 (0.0%) |
| $55,000 to $64,999 | 0 (0.0%) | 67 (22.6%) |
| $65,000 to $74,999 | 0 (0.0%) | 0 (0.0%) |
| $75,000 to $99,999 | 14 (3.5%) | 0 (0.0%) |
| $100,000+ | 91 (22.9%) | 29 (9.8%) |
| Total | 398 (100.0%) | 296 (100.0%) |
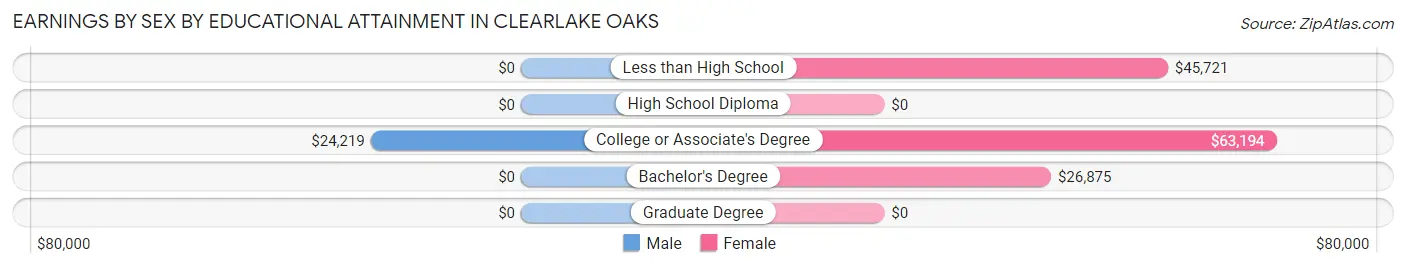
Earnings by Sex by Educational Attainment in Clearlake Oaks
Average earnings in Clearlake Oaks are $45,660 for men and $41,964 for women, a difference of 8.1%. Men with an educational attainment of college or associate's degree enjoy the highest average annual earnings of $24,219, while those with college or associate's degree education earn the least with $24,219. Women with an educational attainment of college or associate's degree earn the most with the average annual earnings of $63,194, while those with bachelor's degree education have the smallest earnings of $26,875.
| Educational Attainment | Male Income | Female Income |
| Less than High School | - | - |
| High School Diploma | - | - |
| College or Associate's Degree | $24,219 | $63,194 |
| Bachelor's Degree | - | - |
| Graduate Degree | - | - |
| Total | $45,660 | $41,964 |
Family Income in Clearlake Oaks
Family Income Brackets in Clearlake Oaks
According to the Clearlake Oaks family income data, there are 105 families falling into the $200,000+ income range, which is the most common income bracket and makes up 19.0% of all families.
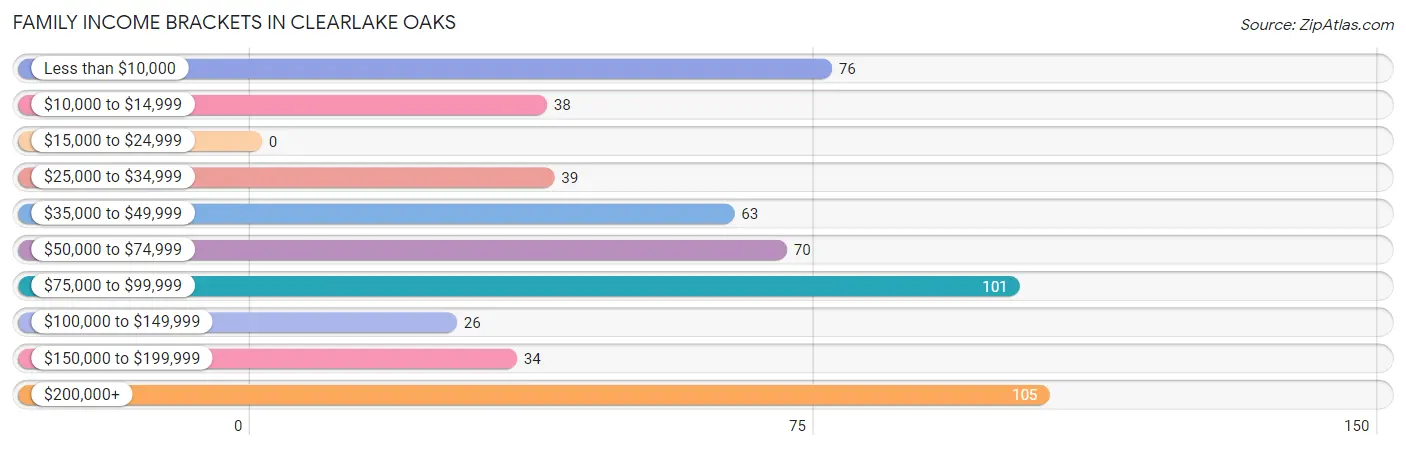
| Income Bracket | # Families | % Families |
| Less than $10,000 | 76 | 13.8% |
| $10,000 to $14,999 | 38 | 6.9% |
| $15,000 to $24,999 | 0 | 0.0% |
| $25,000 to $34,999 | 39 | 7.1% |
| $35,000 to $49,999 | 63 | 11.4% |
| $50,000 to $74,999 | 70 | 12.7% |
| $75,000 to $99,999 | 101 | 18.3% |
| $100,000 to $149,999 | 26 | 4.7% |
| $150,000 to $199,999 | 34 | 6.2% |
| $200,000+ | 105 | 19.0% |
Family Income by Famaliy Size in Clearlake Oaks
2-person families (360 | 65.2%) account for the highest median family income in Clearlake Oaks with $95,870 per family, while 2-person families (360 | 65.2%) have the highest median income of $47,935 per family member.
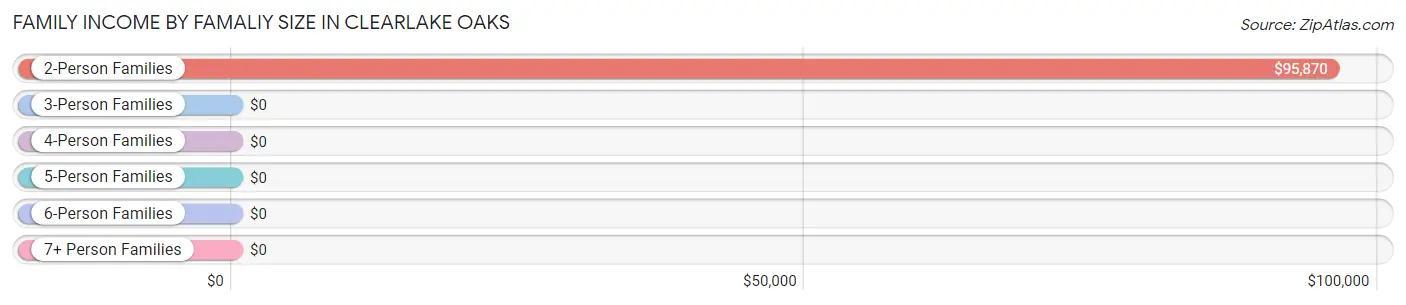
| Income Bracket | # Families | Median Income |
| 2-Person Families | 360 (65.2%) | $95,870 |
| 3-Person Families | 126 (22.8%) | $0 |
| 4-Person Families | 66 (12.0%) | $0 |
| 5-Person Families | 0 (0.0%) | $0 |
| 6-Person Families | 0 (0.0%) | $0 |
| 7+ Person Families | 0 (0.0%) | $0 |
| Total | 552 (100.0%) | $65,227 |
Family Income by Number of Earners in Clearlake Oaks
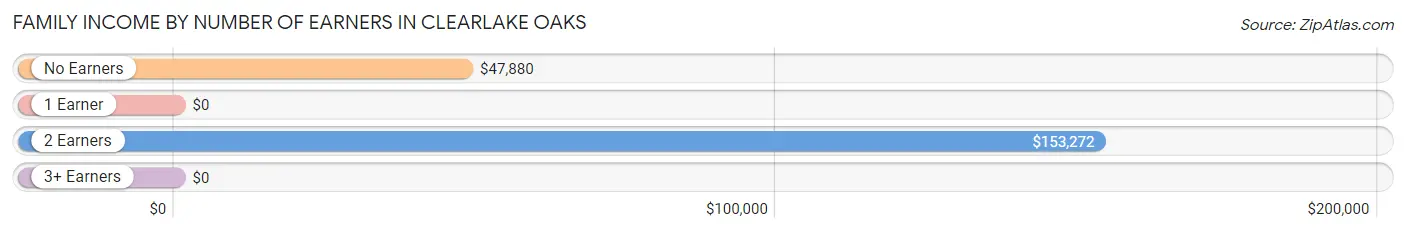
| Number of Earners | # Families | Median Income |
| No Earners | 221 (40.0%) | $47,880 |
| 1 Earner | 154 (27.9%) | $0 |
| 2 Earners | 177 (32.1%) | $153,272 |
| 3+ Earners | 0 (0.0%) | $0 |
| Total | 552 (100.0%) | $65,227 |
Household Income in Clearlake Oaks
Household Income Brackets in Clearlake Oaks
With 166 households falling in the category, the $25,000 to $34,999 income range is the most frequent in Clearlake Oaks, accounting for 15.3% of all households. In contrast, only 34 households (3.1%) fall into the $150,000 to $199,999 income bracket, making it the least populous group.
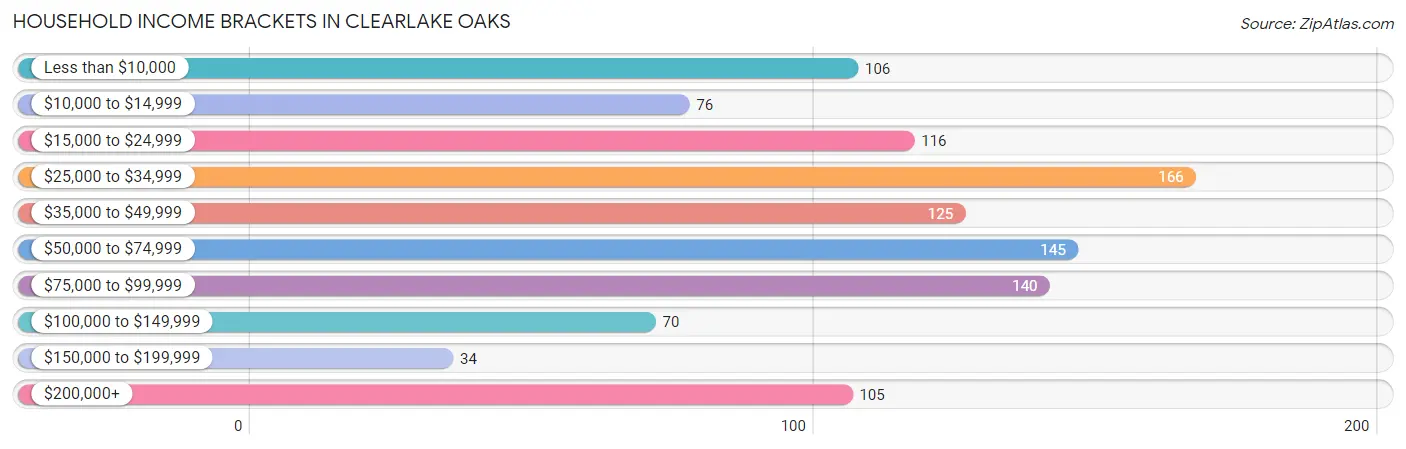
| Income Bracket | # Households | % Households |
| Less than $10,000 | 106 | 9.8% |
| $10,000 to $14,999 | 76 | 7.0% |
| $15,000 to $24,999 | 116 | 10.7% |
| $25,000 to $34,999 | 166 | 15.3% |
| $35,000 to $49,999 | 125 | 11.5% |
| $50,000 to $74,999 | 145 | 13.4% |
| $75,000 to $99,999 | 140 | 12.9% |
| $100,000 to $149,999 | 70 | 6.5% |
| $150,000 to $199,999 | 34 | 3.1% |
| $200,000+ | 105 | 9.7% |
Household Income by Householder Age in Clearlake Oaks
The median household income in Clearlake Oaks is $43,024, with the highest median household income of $90,500 found in the 45 to 64 years age bracket for the primary householder. A total of 356 households (32.9%) fall into this category. Meanwhile, the 15 to 24 years age bracket for the primary householder has the lowest median household income of $0, with 28 households (2.6%) in this group.
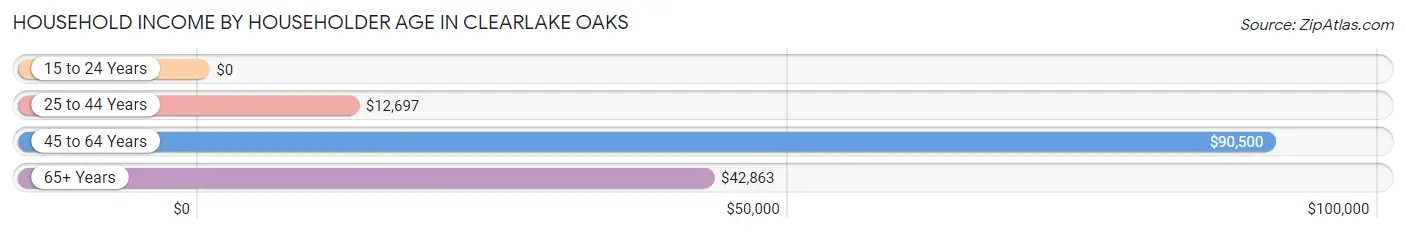
| Income Bracket | # Households | Median Income |
| 15 to 24 Years | 28 (2.6%) | $0 |
| 25 to 44 Years | 138 (12.7%) | $12,697 |
| 45 to 64 Years | 356 (32.9%) | $90,500 |
| 65+ Years | 561 (51.8%) | $42,863 |
| Total | 1,083 (100.0%) | $43,024 |
Poverty in Clearlake Oaks
Income Below Poverty by Sex and Age in Clearlake Oaks
With 14.8% poverty level for males and 27.3% for females among the residents of Clearlake Oaks, 6 to 11 year old males and under 5 year old females are the most vulnerable to poverty, with 70 males (100.0%) and 11 females (100.0%) in their respective age groups living below the poverty level.
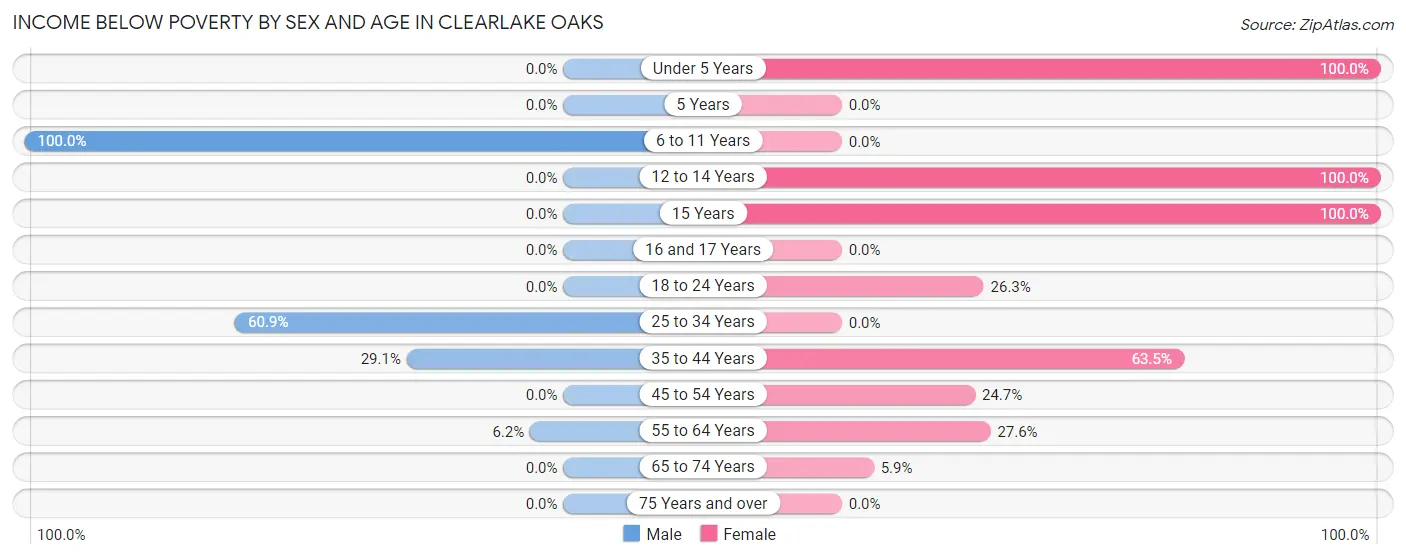
| Age Bracket | Male | Female |
| Under 5 Years | 0 (0.0%) | 11 (100.0%) |
| 5 Years | 0 (0.0%) | 0 (0.0%) |
| 6 to 11 Years | 70 (100.0%) | 0 (0.0%) |
| 12 to 14 Years | 0 (0.0%) | 48 (100.0%) |
| 15 Years | 0 (0.0%) | 40 (100.0%) |
| 16 and 17 Years | 0 (0.0%) | 0 (0.0%) |
| 18 to 24 Years | 0 (0.0%) | 10 (26.3%) |
| 25 to 34 Years | 53 (60.9%) | 0 (0.0%) |
| 35 to 44 Years | 25 (29.1%) | 66 (63.5%) |
| 45 to 54 Years | 0 (0.0%) | 45 (24.7%) |
| 55 to 64 Years | 11 (6.2%) | 40 (27.6%) |
| 65 to 74 Years | 0 (0.0%) | 14 (5.9%) |
| 75 Years and over | 0 (0.0%) | 0 (0.0%) |
| Total | 159 (14.8%) | 274 (27.3%) |
Income Above Poverty by Sex and Age in Clearlake Oaks
According to the poverty statistics in Clearlake Oaks, males aged under 5 years and females aged 6 to 11 years are the age groups that are most secure financially, with 100.0% of males and 100.0% of females in these age groups living above the poverty line.
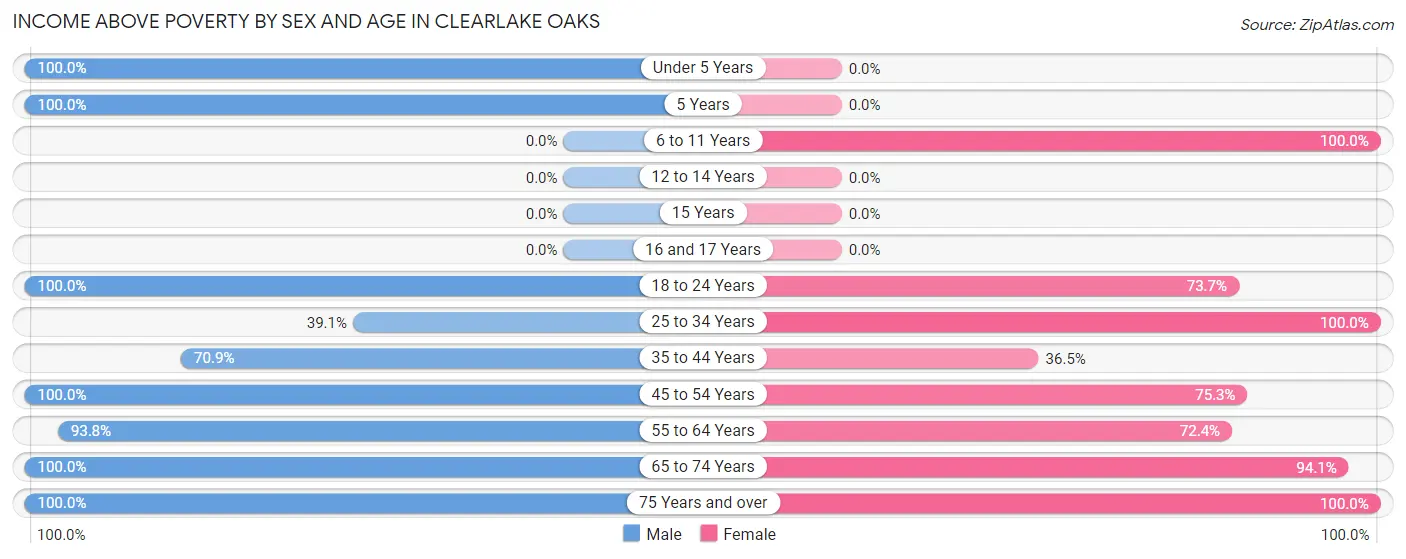
| Age Bracket | Male | Female |
| Under 5 Years | 40 (100.0%) | 0 (0.0%) |
| 5 Years | 18 (100.0%) | 0 (0.0%) |
| 6 to 11 Years | 0 (0.0%) | 15 (100.0%) |
| 12 to 14 Years | 0 (0.0%) | 0 (0.0%) |
| 15 Years | 0 (0.0%) | 0 (0.0%) |
| 16 and 17 Years | 0 (0.0%) | 0 (0.0%) |
| 18 to 24 Years | 68 (100.0%) | 28 (73.7%) |
| 25 to 34 Years | 34 (39.1%) | 9 (100.0%) |
| 35 to 44 Years | 61 (70.9%) | 38 (36.5%) |
| 45 to 54 Years | 156 (100.0%) | 137 (75.3%) |
| 55 to 64 Years | 167 (93.8%) | 105 (72.4%) |
| 65 to 74 Years | 187 (100.0%) | 222 (94.1%) |
| 75 Years and over | 181 (100.0%) | 175 (100.0%) |
| Total | 912 (85.2%) | 729 (72.7%) |
Income Below Poverty Among Married-Couple Families in Clearlake Oaks
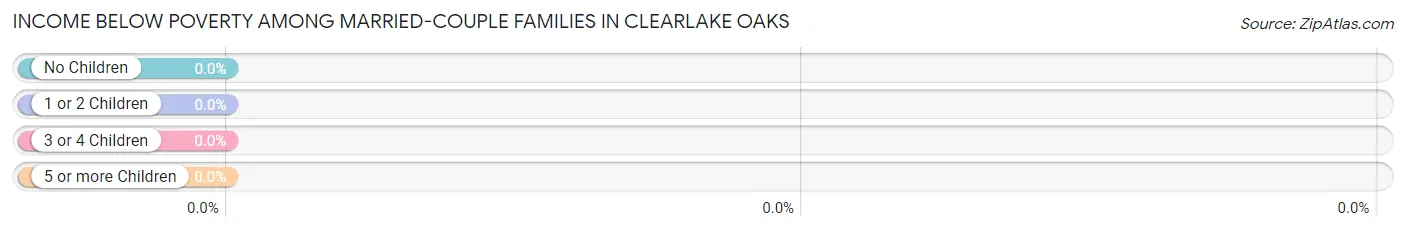
| Children | Above Poverty | Below Poverty |
| No Children | 299 (100.0%) | 0 (0.0%) |
| 1 or 2 Children | 18 (100.0%) | 0 (0.0%) |
| 3 or 4 Children | 0 (0.0%) | 0 (0.0%) |
| 5 or more Children | 0 (0.0%) | 0 (0.0%) |
| Total | 317 (100.0%) | 0 (0.0%) |
Income Below Poverty Among Single-Parent Households in Clearlake Oaks
According to the poverty data in Clearlake Oaks, 32.8% or 38 single-father households and 63.9% or 76 single-mother households are living below the poverty line. Among single-father households, those with no children have the highest poverty rate, with 38 households (40.0%) experiencing poverty. Likewise, among single-mother households, those with 3 or 4 children have the highest poverty rate, with 66 households (100.0%) falling below the poverty line.
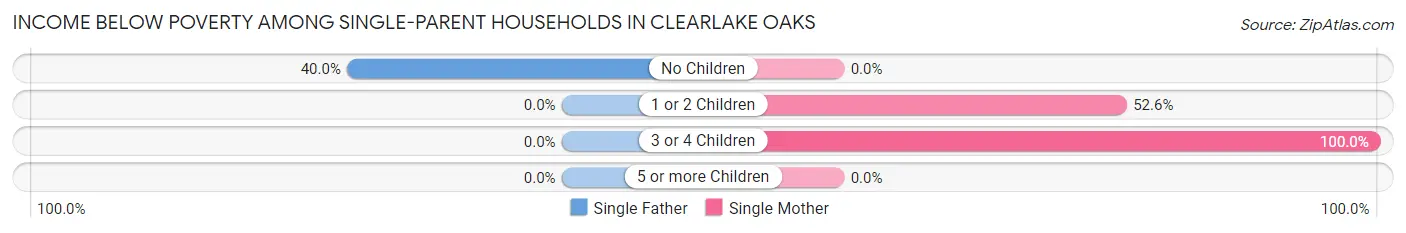
| Children | Single Father | Single Mother |
| No Children | 38 (40.0%) | 0 (0.0%) |
| 1 or 2 Children | 0 (0.0%) | 10 (52.6%) |
| 3 or 4 Children | 0 (0.0%) | 66 (100.0%) |
| 5 or more Children | 0 (0.0%) | 0 (0.0%) |
| Total | 38 (32.8%) | 76 (63.9%) |
Income Below Poverty Among Married-Couple vs Single-Parent Households in Clearlake Oaks
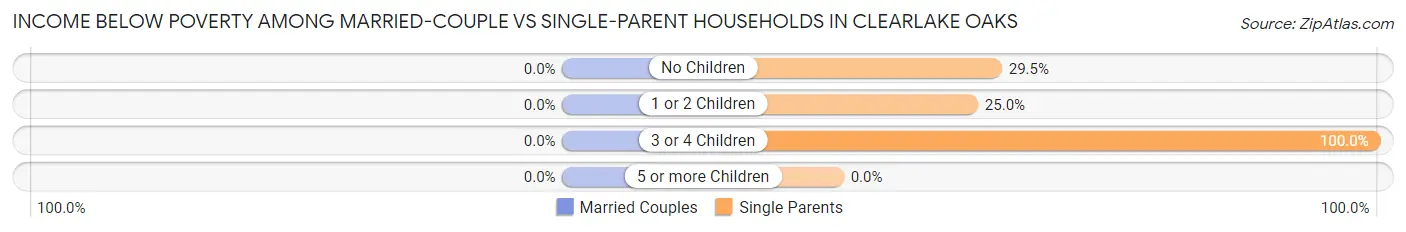
| Children | Married-Couple Families | Single-Parent Households |
| No Children | 0 (0.0%) | 38 (29.5%) |
| 1 or 2 Children | 0 (0.0%) | 10 (25.0%) |
| 3 or 4 Children | 0 (0.0%) | 66 (100.0%) |
| 5 or more Children | 0 (0.0%) | 0 (0.0%) |
| Total | 0 (0.0%) | 114 (48.5%) |
Race in Clearlake Oaks
The most populous races in Clearlake Oaks are White / Caucasian (1,614 | 77.8%), Hispanic or Latino (199 | 9.6%), and Two or more Races (154 | 7.4%).
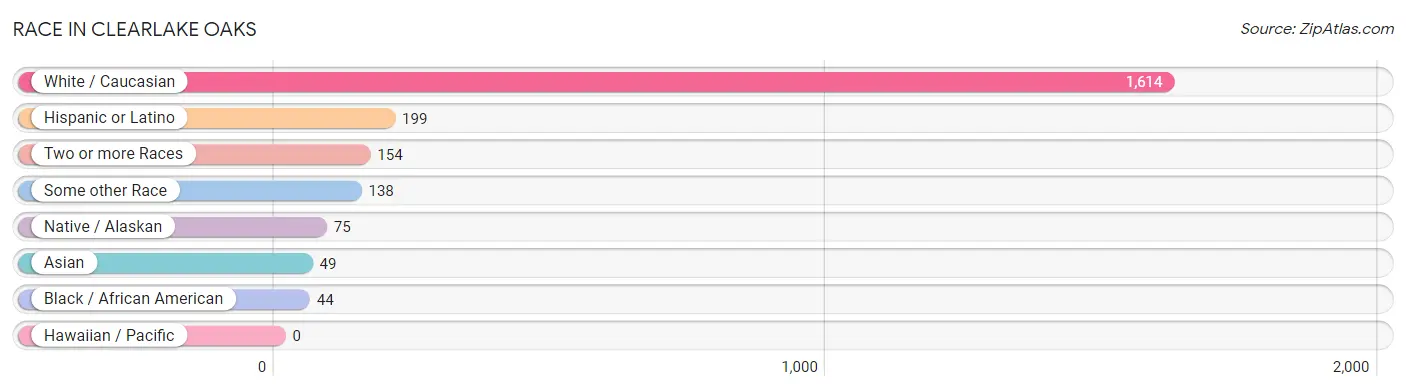
| Race | # Population | % Population |
| Asian | 49 | 2.4% |
| Black / African American | 44 | 2.1% |
| Hawaiian / Pacific | 0 | 0.0% |
| Hispanic or Latino | 199 | 9.6% |
| Native / Alaskan | 75 | 3.6% |
| White / Caucasian | 1,614 | 77.8% |
| Two or more Races | 154 | 7.4% |
| Some other Race | 138 | 6.7% |
| Total | 2,074 | 100.0% |
Ancestry in Clearlake Oaks
The most populous ancestries reported in Clearlake Oaks are German (371 | 17.9%), Irish (255 | 12.3%), Mexican (158 | 7.6%), Armenian (117 | 5.6%), and Scottish (111 | 5.3%), together accounting for 48.8% of all Clearlake Oaks residents.
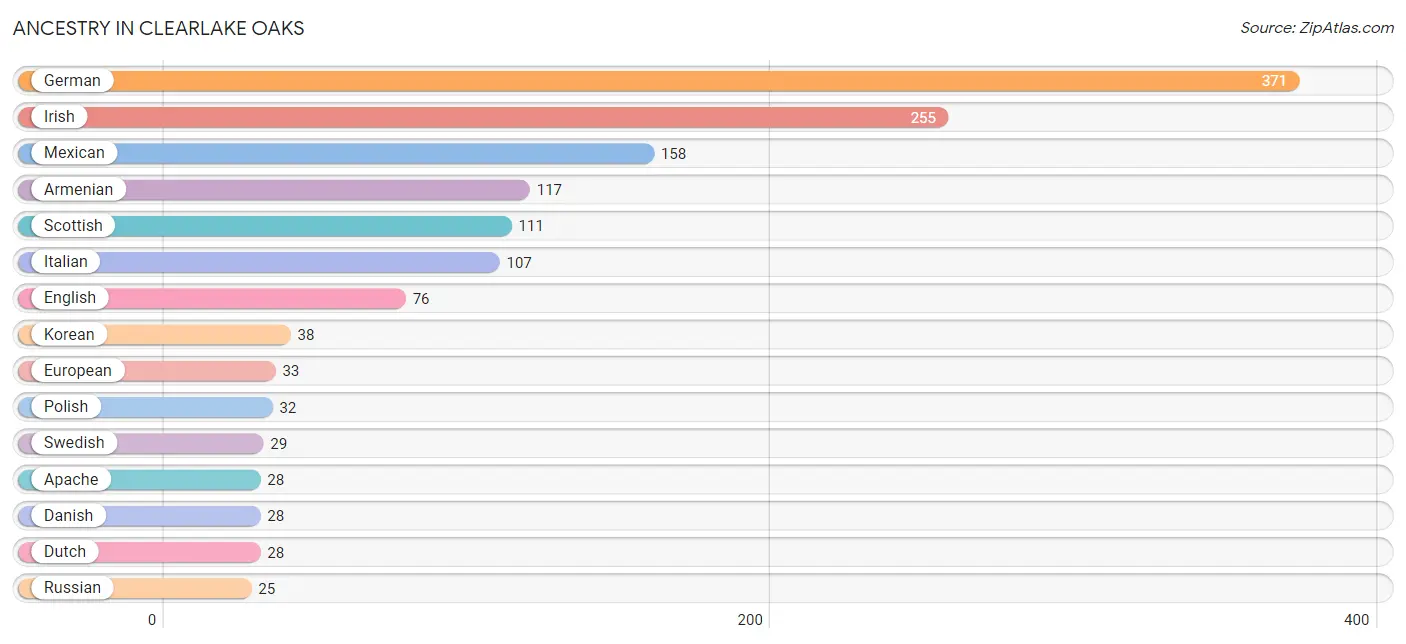
| Ancestry | # Population | % Population |
| American | 10 | 0.5% |
| Apache | 28 | 1.3% |
| Armenian | 117 | 5.6% |
| Danish | 28 | 1.3% |
| Dutch | 28 | 1.3% |
| English | 76 | 3.7% |
| European | 33 | 1.6% |
| French | 10 | 0.5% |
| German | 371 | 17.9% |
| Hungarian | 4 | 0.2% |
| Irish | 255 | 12.3% |
| Italian | 107 | 5.2% |
| Korean | 38 | 1.8% |
| Mexican | 158 | 7.6% |
| Mexican American Indian | 7 | 0.3% |
| Native Hawaiian | 14 | 0.7% |
| Norwegian | 24 | 1.2% |
| Polish | 32 | 1.5% |
| Portuguese | 6 | 0.3% |
| Russian | 25 | 1.2% |
| Scottish | 111 | 5.3% |
| Sri Lankan | 11 | 0.5% |
| Swedish | 29 | 1.4% | View All 23 Rows |
Immigrants in Clearlake Oaks
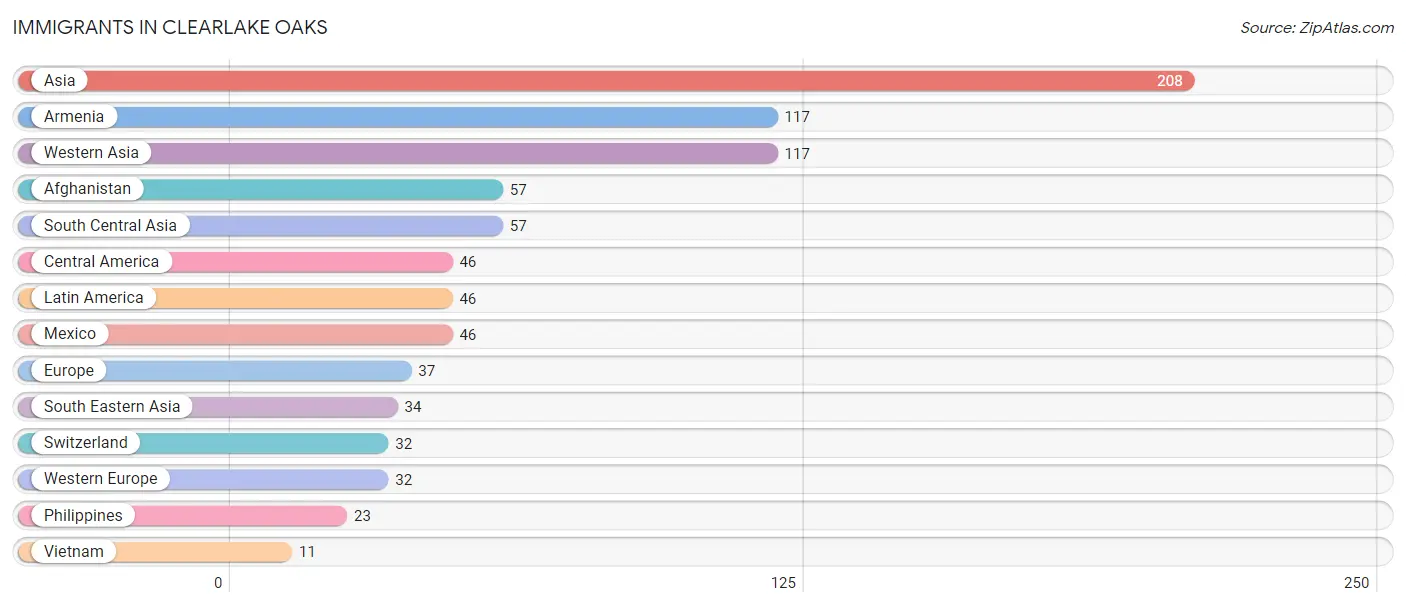
The most numerous immigrant groups reported in Clearlake Oaks came from Asia (208 | 10.0%), Armenia (117 | 5.6%), Western Asia (117 | 5.6%), Afghanistan (57 | 2.8%), and South Central Asia (57 | 2.8%), together accounting for 26.8% of all Clearlake Oaks residents.
| Immigration Origin | # Population | % Population |
| Afghanistan | 57 | 2.8% |
| Armenia | 117 | 5.6% |
| Asia | 208 | 10.0% |
| Central America | 46 | 2.2% |
| Europe | 37 | 1.8% |
| Latin America | 46 | 2.2% |
| Mexico | 46 | 2.2% |
| Philippines | 23 | 1.1% |
| South Central Asia | 57 | 2.8% |
| South Eastern Asia | 34 | 1.6% |
| Switzerland | 32 | 1.5% |
| Vietnam | 11 | 0.5% |
| Western Asia | 117 | 5.6% |
| Western Europe | 32 | 1.5% | View All 14 Rows |
Sex and Age in Clearlake Oaks
Sex and Age in Clearlake Oaks
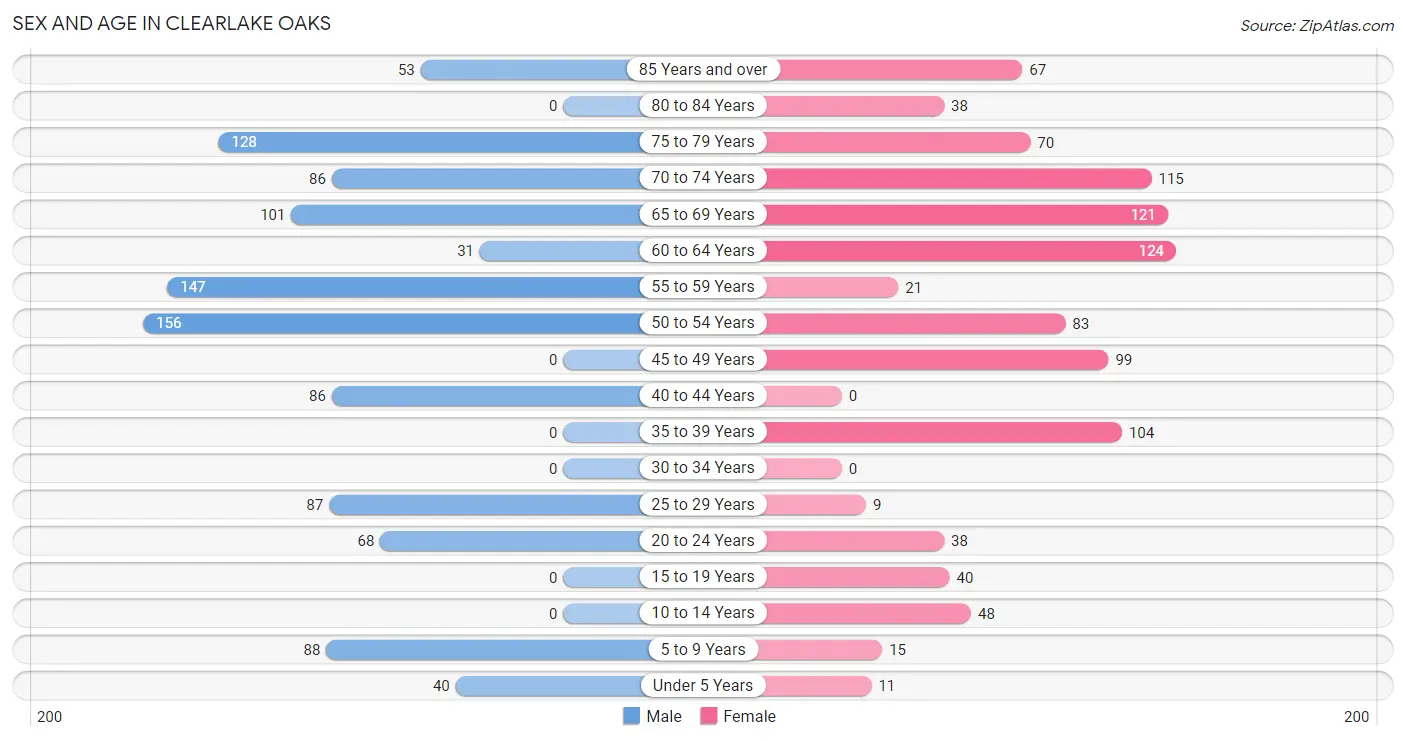
The most populous age groups in Clearlake Oaks are 50 to 54 Years (156 | 14.6%) for men and 60 to 64 Years (124 | 12.4%) for women.
| Age Bracket | Male | Female |
| Under 5 Years | 40 (3.7%) | 11 (1.1%) |
| 5 to 9 Years | 88 (8.2%) | 15 (1.5%) |
| 10 to 14 Years | 0 (0.0%) | 48 (4.8%) |
| 15 to 19 Years | 0 (0.0%) | 40 (4.0%) |
| 20 to 24 Years | 68 (6.4%) | 38 (3.8%) |
| 25 to 29 Years | 87 (8.1%) | 9 (0.9%) |
| 30 to 34 Years | 0 (0.0%) | 0 (0.0%) |
| 35 to 39 Years | 0 (0.0%) | 104 (10.4%) |
| 40 to 44 Years | 86 (8.0%) | 0 (0.0%) |
| 45 to 49 Years | 0 (0.0%) | 99 (9.9%) |
| 50 to 54 Years | 156 (14.6%) | 83 (8.3%) |
| 55 to 59 Years | 147 (13.7%) | 21 (2.1%) |
| 60 to 64 Years | 31 (2.9%) | 124 (12.4%) |
| 65 to 69 Years | 101 (9.4%) | 121 (12.1%) |
| 70 to 74 Years | 86 (8.0%) | 115 (11.5%) |
| 75 to 79 Years | 128 (11.9%) | 70 (7.0%) |
| 80 to 84 Years | 0 (0.0%) | 38 (3.8%) |
| 85 Years and over | 53 (5.0%) | 67 (6.7%) |
| Total | 1,071 (100.0%) | 1,003 (100.0%) |
Families and Households in Clearlake Oaks
Median Family Size in Clearlake Oaks
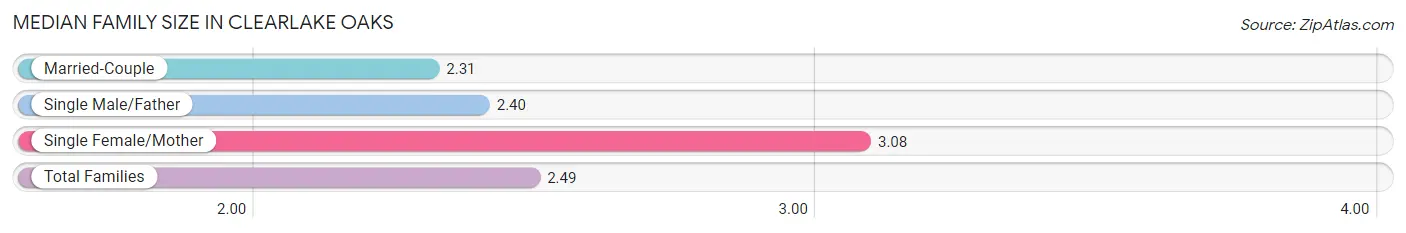
The median family size in Clearlake Oaks is 2.49 persons per family, with single female/mother families (119 | 21.6%) accounting for the largest median family size of 3.08 persons per family. On the other hand, married-couple families (317 | 57.4%) represent the smallest median family size with 2.31 persons per family.
| Family Type | # Families | Family Size |
| Married-Couple | 317 (57.4%) | 2.31 |
| Single Male/Father | 116 (21.0%) | 2.40 |
| Single Female/Mother | 119 (21.6%) | 3.08 |
| Total Families | 552 (100.0%) | 2.49 |
Median Household Size in Clearlake Oaks
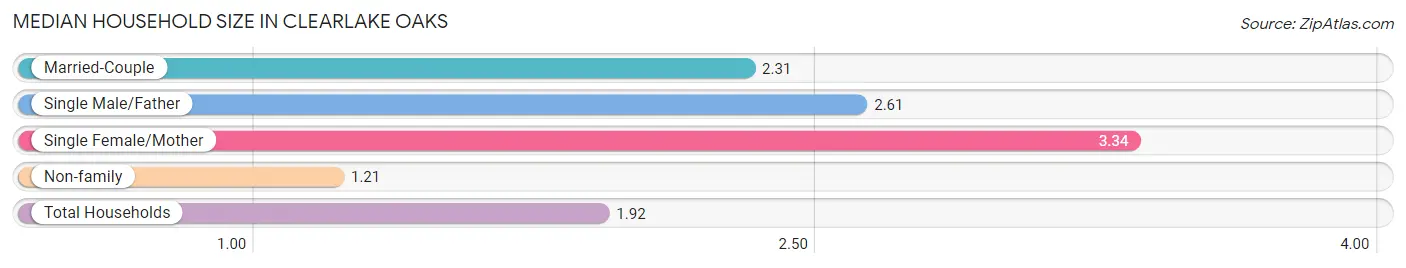
The median household size in Clearlake Oaks is 1.92 persons per household, with single female/mother households (119 | 11.0%) accounting for the largest median household size of 3.34 persons per household. non-family households (531 | 49.0%) represent the smallest median household size with 1.21 persons per household.
| Household Type | # Households | Household Size |
| Married-Couple | 317 (29.3%) | 2.31 |
| Single Male/Father | 116 (10.7%) | 2.61 |
| Single Female/Mother | 119 (11.0%) | 3.34 |
| Non-family | 531 (49.0%) | 1.21 |
| Total Households | 1,083 (100.0%) | 1.92 |
Household Size by Marriage Status in Clearlake Oaks
Out of a total of 1,083 households in Clearlake Oaks, 552 (51.0%) are family households, while 531 (49.0%) are nonfamily households. The most numerous type of family households are 2-person households, comprising 350, and the most common type of nonfamily households are 1-person households, comprising 464.
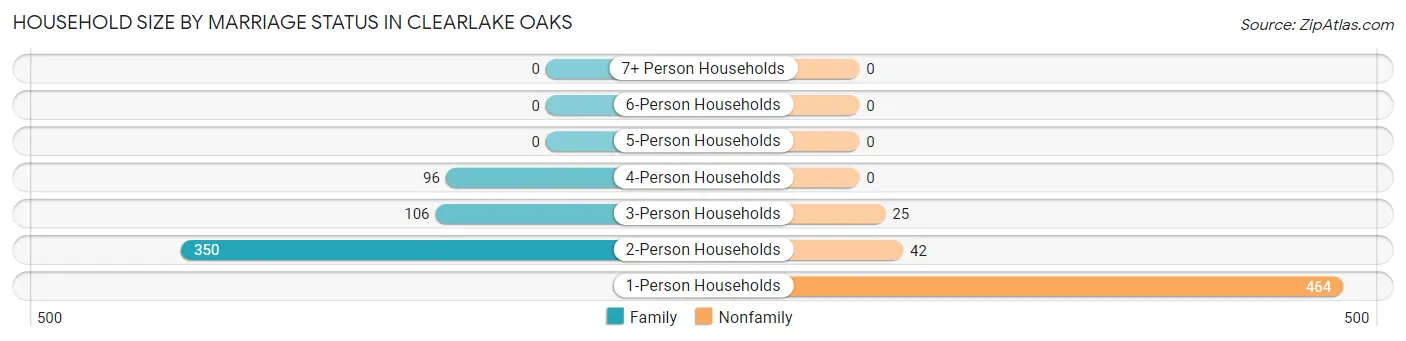
| Household Size | Family Households | Nonfamily Households |
| 1-Person Households | - | 464 (42.8%) |
| 2-Person Households | 350 (32.3%) | 42 (3.9%) |
| 3-Person Households | 106 (9.8%) | 25 (2.3%) |
| 4-Person Households | 96 (8.9%) | 0 (0.0%) |
| 5-Person Households | 0 (0.0%) | 0 (0.0%) |
| 6-Person Households | 0 (0.0%) | 0 (0.0%) |
| 7+ Person Households | 0 (0.0%) | 0 (0.0%) |
| Total | 552 (51.0%) | 531 (49.0%) |
Female Fertility in Clearlake Oaks
Fertility by Age in Clearlake Oaks
Average fertility rate in Clearlake Oaks is 131.0 births per 1,000 women. Women in the age bracket of 20 to 34 years have the highest fertility rate with 809.0 births per 1,000 women. Women in the age bracket of 20 to 34 years acount for 100.0% of all women with births.
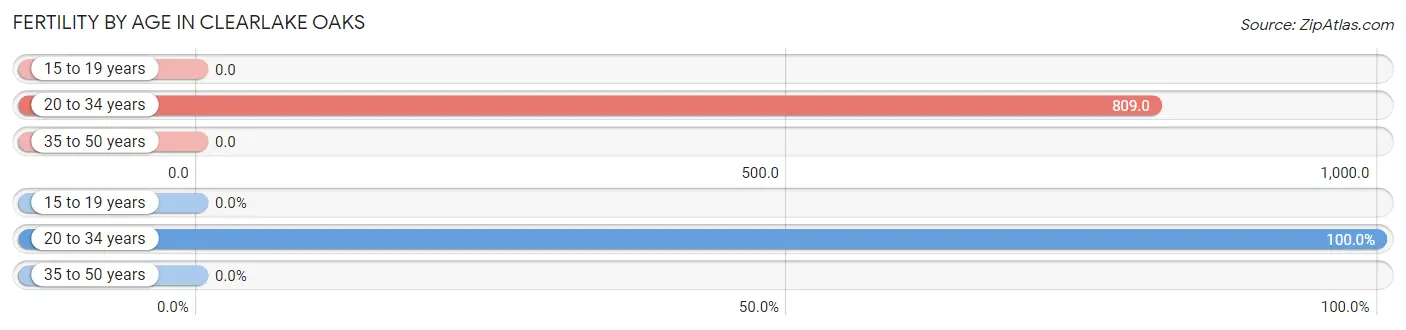
| Age Bracket | Women with Births | Births / 1,000 Women |
| 15 to 19 years | 0 (0.0%) | 0.0 |
| 20 to 34 years | 38 (100.0%) | 809.0 |
| 35 to 50 years | 0 (0.0%) | 0.0 |
| Total | 38 (100.0%) | 131.0 |
Fertility by Age by Marriage Status in Clearlake Oaks
73.7% of women with births (38) in Clearlake Oaks are married. The highest percentage of unmarried women with births falls into 20 to 34 years age bracket with 26.3% of them unmarried at the time of birth, while the lowest percentage of unmarried women with births belong to 20 to 34 years age bracket with 26.3% of them unmarried.
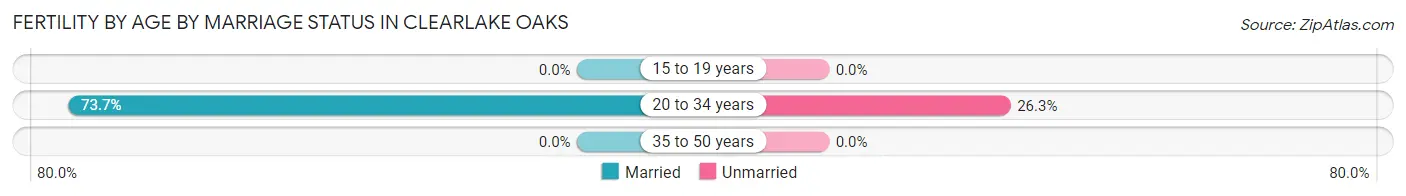
| Age Bracket | Married | Unmarried |
| 15 to 19 years | 0 (0.0%) | 0 (0.0%) |
| 20 to 34 years | 28 (73.7%) | 10 (26.3%) |
| 35 to 50 years | 0 (0.0%) | 0 (0.0%) |
| Total | 28 (73.7%) | 10 (26.3%) |
Fertility by Education in Clearlake Oaks
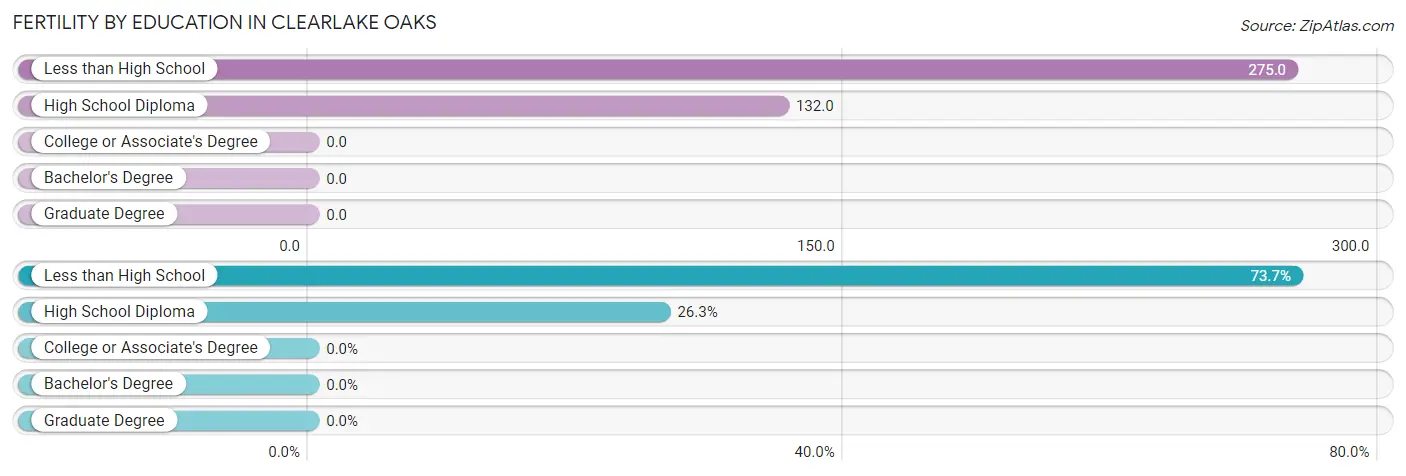
| Educational Attainment | Women with Births | Births / 1,000 Women |
| Less than High School | 28 (73.7%) | 275.0 |
| High School Diploma | 10 (26.3%) | 132.0 |
| College or Associate's Degree | 0 (0.0%) | 0.0 |
| Bachelor's Degree | 0 (0.0%) | 0.0 |
| Graduate Degree | 0 (0.0%) | 0.0 |
| Total | 38 (100.0%) | 131.0 |
Fertility by Education by Marriage Status in Clearlake Oaks
26.3% of women with births in Clearlake Oaks are unmarried. Women with the educational attainment of less than high school are most likely to be married with 100.0% of them married at childbirth, while women with the educational attainment of high school diploma are least likely to be married with 100.0% of them unmarried at childbirth.
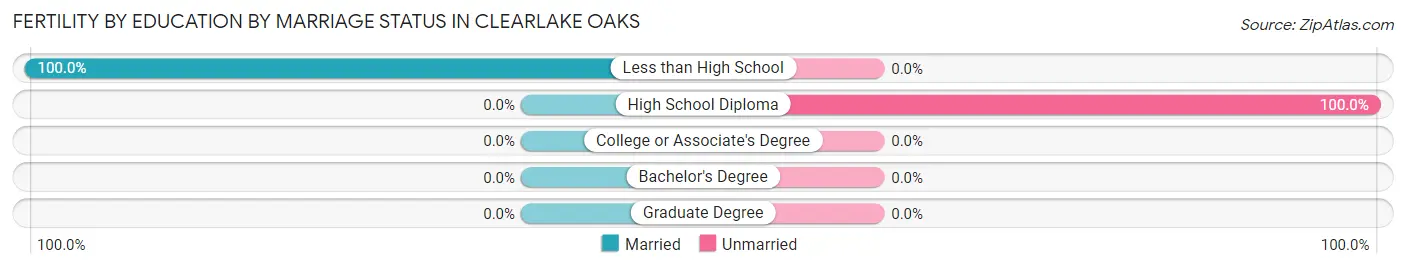
| Educational Attainment | Married | Unmarried |
| Less than High School | 28 (100.0%) | 0 (0.0%) |
| High School Diploma | 0 (0.0%) | 10 (100.0%) |
| College or Associate's Degree | 0 (0.0%) | 0 (0.0%) |
| Bachelor's Degree | 0 (0.0%) | 0 (0.0%) |
| Graduate Degree | 0 (0.0%) | 0 (0.0%) |
| Total | 28 (73.7%) | 10 (26.3%) |
Employment Characteristics in Clearlake Oaks
Employment by Class of Employer in Clearlake Oaks
Among the 597 employed individuals in Clearlake Oaks, private company employees (309 | 51.8%), local government employees (148 | 24.8%), and state government employees (57 | 9.6%) make up the most common classes of employment.
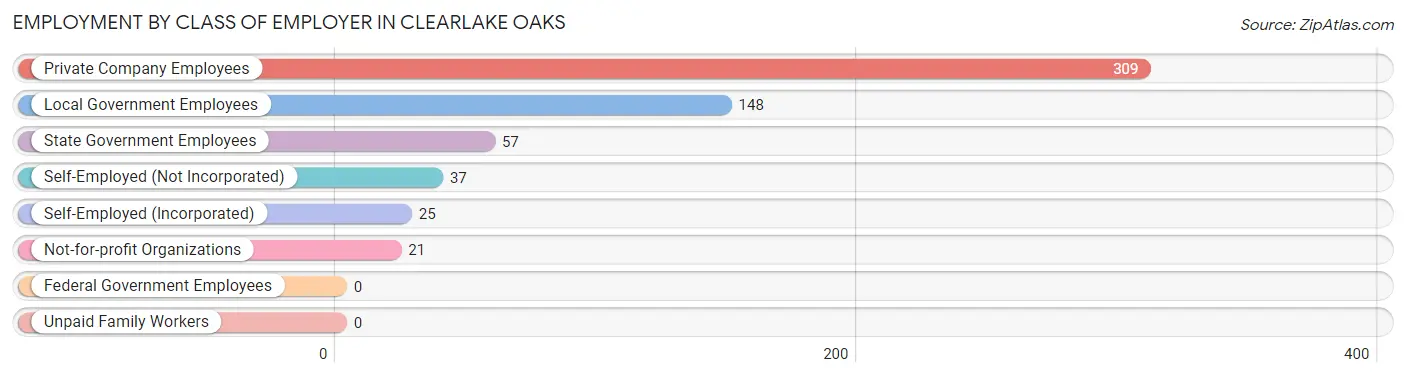
| Employer Class | # Employees | % Employees |
| Private Company Employees | 309 | 51.8% |
| Self-Employed (Incorporated) | 25 | 4.2% |
| Self-Employed (Not Incorporated) | 37 | 6.2% |
| Not-for-profit Organizations | 21 | 3.5% |
| Local Government Employees | 148 | 24.8% |
| State Government Employees | 57 | 9.6% |
| Federal Government Employees | 0 | 0.0% |
| Unpaid Family Workers | 0 | 0.0% |
| Total | 597 | 100.0% |
Employment Status by Age in Clearlake Oaks
According to the labor force statistics for Clearlake Oaks, out of the total population over 16 years of age (1,832), 40.2% or 736 individuals are in the labor force, with 16.8% or 124 of them unemployed. The age group with the highest labor force participation rate is 45 to 54 years, with 86.7% or 293 individuals in the labor force. Within the labor force, the 35 to 44 years age range has the highest percentage of unemployed individuals, with 51.4% or 38 of them being unemployed.
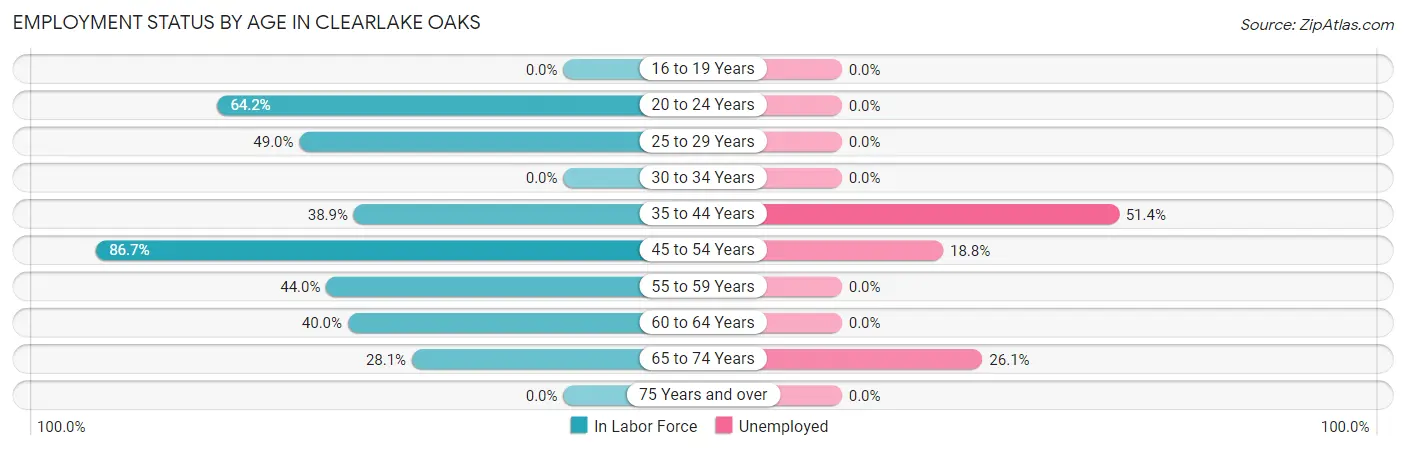
| Age Bracket | In Labor Force | Unemployed |
| 16 to 19 Years | 0 (0.0%) | 0 (0.0%) |
| 20 to 24 Years | 68 (64.2%) | 0 (0.0%) |
| 25 to 29 Years | 47 (49.0%) | 0 (0.0%) |
| 30 to 34 Years | 0 (0.0%) | 0 (0.0%) |
| 35 to 44 Years | 74 (38.9%) | 38 (51.4%) |
| 45 to 54 Years | 293 (86.7%) | 55 (18.8%) |
| 55 to 59 Years | 74 (44.0%) | 0 (0.0%) |
| 60 to 64 Years | 62 (40.0%) | 0 (0.0%) |
| 65 to 74 Years | 119 (28.1%) | 31 (26.1%) |
| 75 Years and over | 0 (0.0%) | 0 (0.0%) |
| Total | 736 (40.2%) | 124 (16.8%) |
Employment Status by Educational Attainment in Clearlake Oaks
According to labor force statistics for Clearlake Oaks, 58.1% of individuals (550) out of the total population between 25 and 64 years of age (947) are in the labor force, with 16.9% or 93 of them being unemployed. The group with the highest labor force participation rate are those with the educational attainment of bachelor's degree or higher, with 75.0% or 111 individuals in the labor force. Within the labor force, individuals with college / associate degree education have the highest percentage of unemployment, with 36.0% or 62 of them being unemployed.
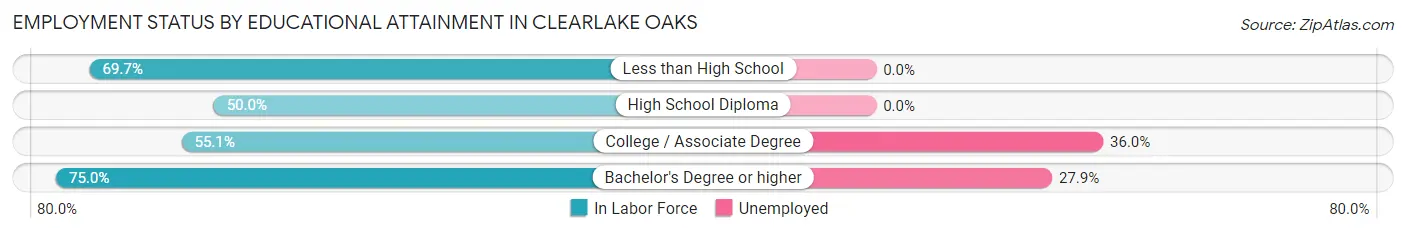
| Educational Attainment | In Labor Force | Unemployed |
| Less than High School | 83 (69.7%) | 0 (0.0%) |
| High School Diploma | 184 (50.0%) | 0 (0.0%) |
| College / Associate Degree | 172 (55.1%) | 112 (36.0%) |
| Bachelor's Degree or higher | 111 (75.0%) | 41 (27.9%) |
| Total | 550 (58.1%) | 160 (16.9%) |
Employment Occupations by Sex in Clearlake Oaks
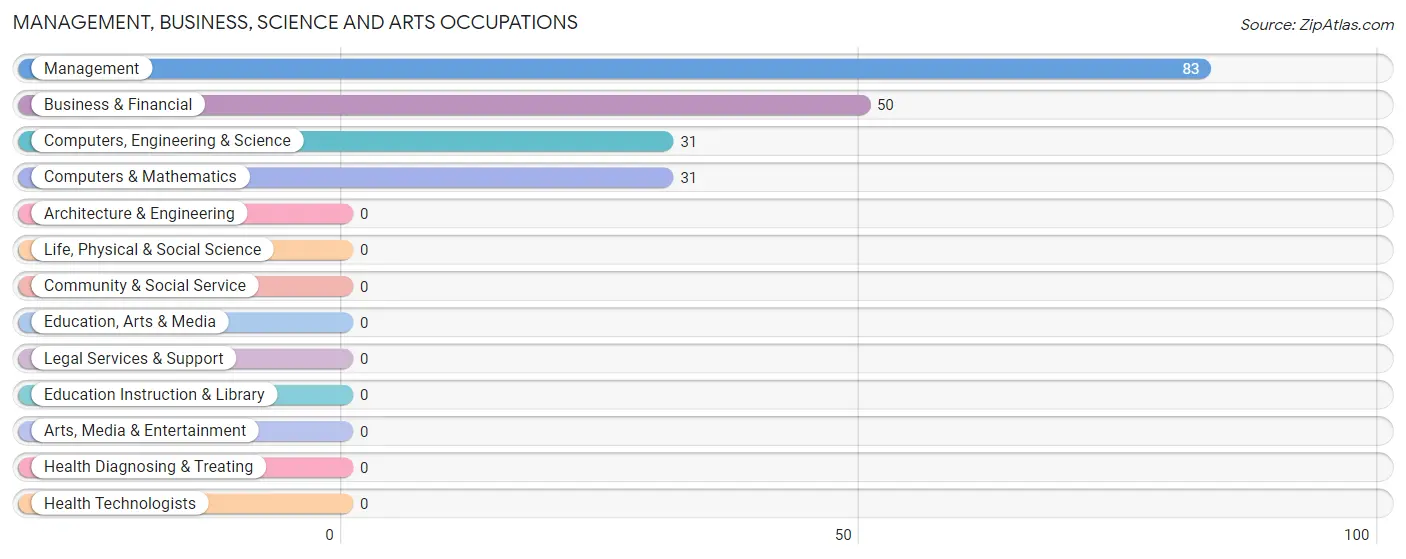
Management, Business, Science and Arts Occupations
The most common Management, Business, Science and Arts occupations in Clearlake Oaks are Management (83 | 13.5%), Business & Financial (50 | 8.2%), Computers, Engineering & Science (31 | 5.1%), and Computers & Mathematics (31 | 5.1%).
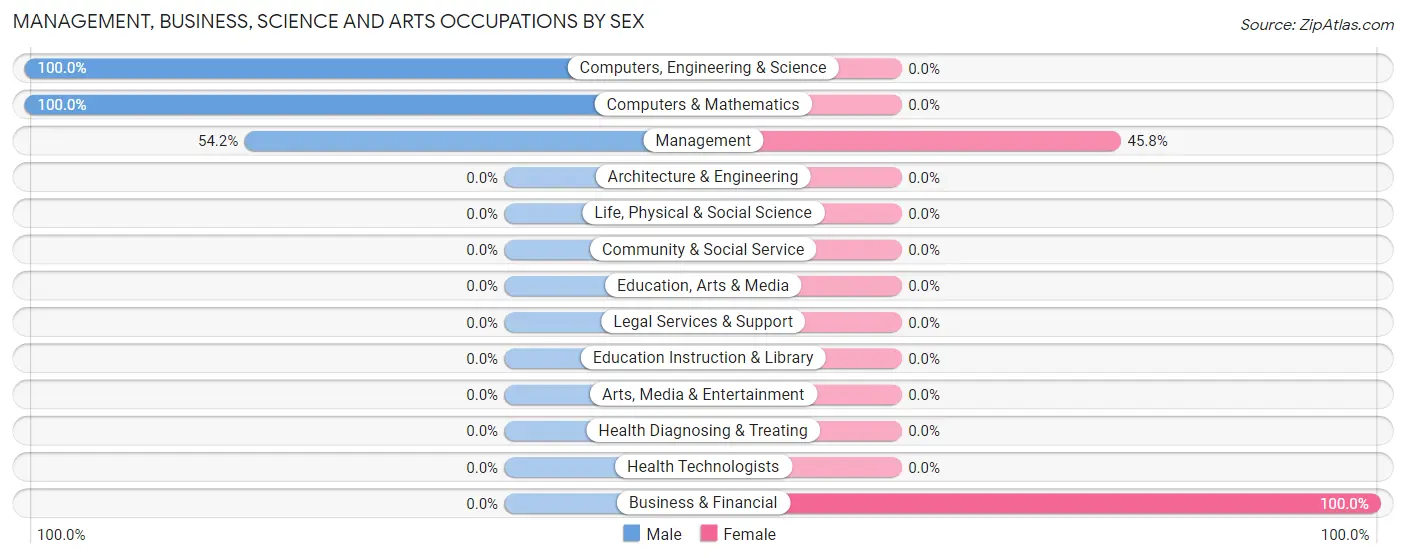
Management, Business, Science and Arts Occupations by Sex
Within the Management, Business, Science and Arts occupations in Clearlake Oaks, the most male-oriented occupations are Computers, Engineering & Science (100.0%), Computers & Mathematics (100.0%), and Management (54.2%), while the most female-oriented occupations are Business & Financial (100.0%), and Management (45.8%).
| Occupation | Male | Female |
| Management | 45 (54.2%) | 38 (45.8%) |
| Business & Financial | 0 (0.0%) | 50 (100.0%) |
| Computers, Engineering & Science | 31 (100.0%) | 0 (0.0%) |
| Computers & Mathematics | 31 (100.0%) | 0 (0.0%) |
| Architecture & Engineering | 0 (0.0%) | 0 (0.0%) |
| Life, Physical & Social Science | 0 (0.0%) | 0 (0.0%) |
| Community & Social Service | 0 (0.0%) | 0 (0.0%) |
| Education, Arts & Media | 0 (0.0%) | 0 (0.0%) |
| Legal Services & Support | 0 (0.0%) | 0 (0.0%) |
| Education Instruction & Library | 0 (0.0%) | 0 (0.0%) |
| Arts, Media & Entertainment | 0 (0.0%) | 0 (0.0%) |
| Health Diagnosing & Treating | 0 (0.0%) | 0 (0.0%) |
| Health Technologists | 0 (0.0%) | 0 (0.0%) |
| Total (Category) | 76 (46.3%) | 88 (53.7%) |
| Total (Overall) | 360 (58.7%) | 253 (41.3%) |
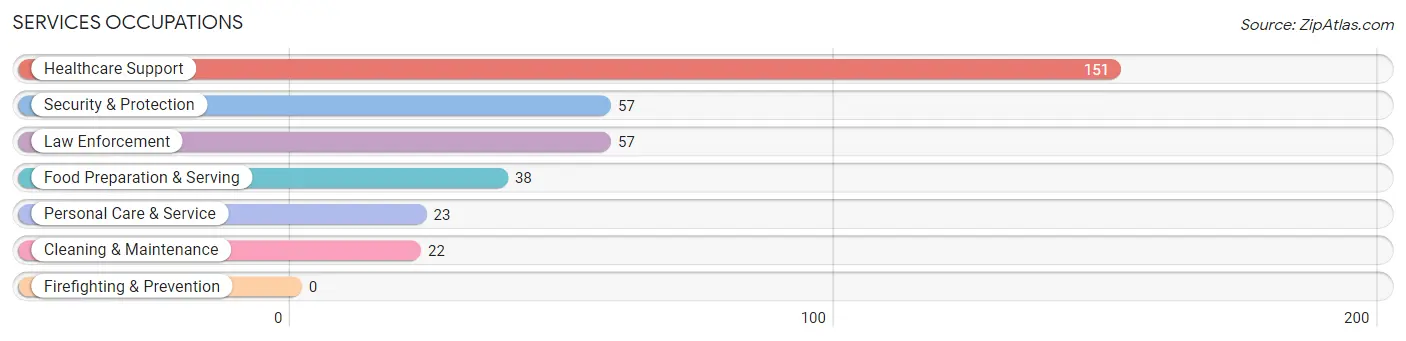
Services Occupations
The most common Services occupations in Clearlake Oaks are Healthcare Support (151 | 24.6%), Security & Protection (57 | 9.3%), Law Enforcement (57 | 9.3%), Food Preparation & Serving (38 | 6.2%), and Personal Care & Service (23 | 3.7%).
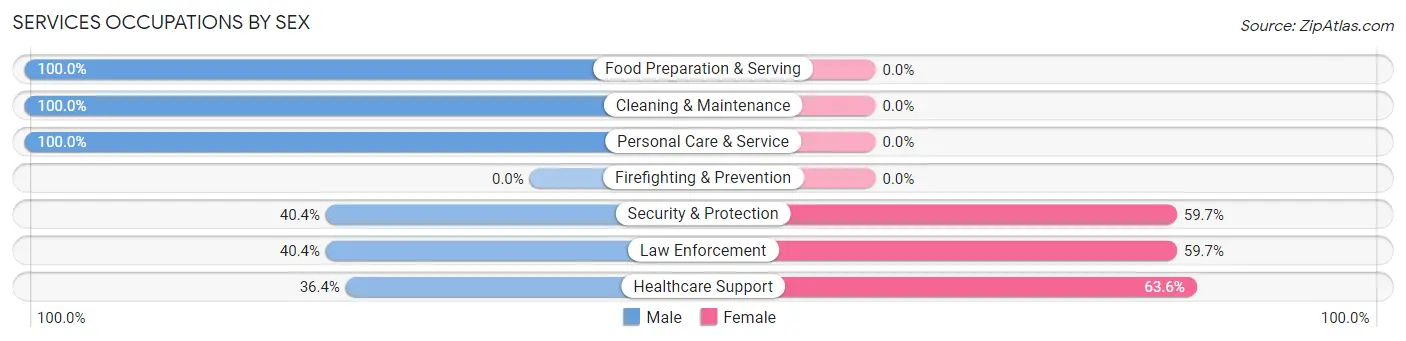
Services Occupations by Sex
Within the Services occupations in Clearlake Oaks, the most male-oriented occupations are Food Preparation & Serving (100.0%), Cleaning & Maintenance (100.0%), and Personal Care & Service (100.0%), while the most female-oriented occupations are Healthcare Support (63.6%), Security & Protection (59.7%), and Law Enforcement (59.7%).
| Occupation | Male | Female |
| Healthcare Support | 55 (36.4%) | 96 (63.6%) |
| Security & Protection | 23 (40.4%) | 34 (59.7%) |
| Firefighting & Prevention | 0 (0.0%) | 0 (0.0%) |
| Law Enforcement | 23 (40.4%) | 34 (59.7%) |
| Food Preparation & Serving | 38 (100.0%) | 0 (0.0%) |
| Cleaning & Maintenance | 22 (100.0%) | 0 (0.0%) |
| Personal Care & Service | 23 (100.0%) | 0 (0.0%) |
| Total (Category) | 161 (55.3%) | 130 (44.7%) |
| Total (Overall) | 360 (58.7%) | 253 (41.3%) |
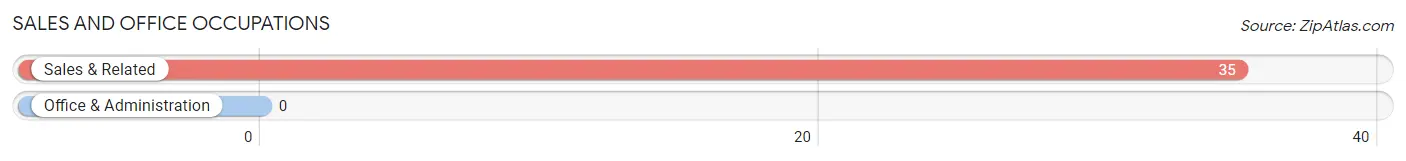
Sales and Office Occupations
The most common Sales and Office occupations in Clearlake Oaks are , and Sales & Related (35 | 5.7%).
Sales and Office Occupations by Sex
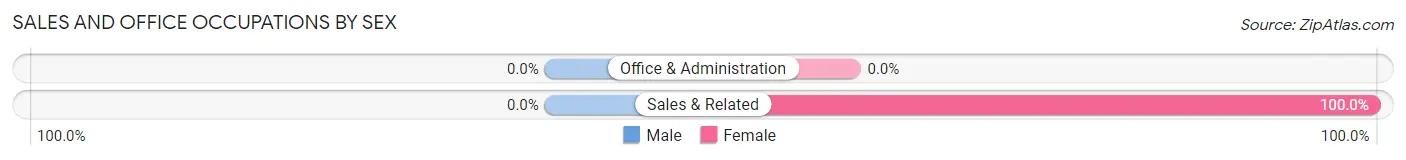
| Occupation | Male | Female |
| Sales & Related | 0 (0.0%) | 35 (100.0%) |
| Office & Administration | 0 (0.0%) | 0 (0.0%) |
| Total (Category) | 0 (0.0%) | 35 (100.0%) |
| Total (Overall) | 360 (58.7%) | 253 (41.3%) |
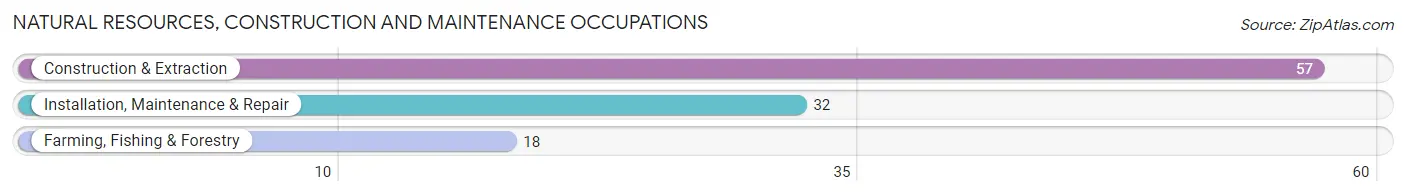
Natural Resources, Construction and Maintenance Occupations
The most common Natural Resources, Construction and Maintenance occupations in Clearlake Oaks are Construction & Extraction (57 | 9.3%), Installation, Maintenance & Repair (32 | 5.2%), and Farming, Fishing & Forestry (18 | 2.9%).
Natural Resources, Construction and Maintenance Occupations by Sex
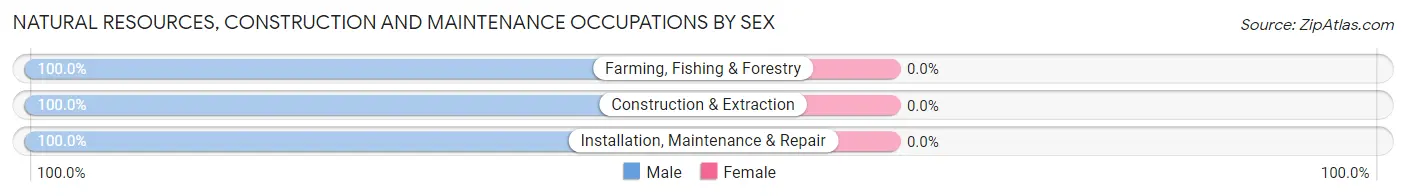
| Occupation | Male | Female |
| Farming, Fishing & Forestry | 18 (100.0%) | 0 (0.0%) |
| Construction & Extraction | 57 (100.0%) | 0 (0.0%) |
| Installation, Maintenance & Repair | 32 (100.0%) | 0 (0.0%) |
| Total (Category) | 107 (100.0%) | 0 (0.0%) |
| Total (Overall) | 360 (58.7%) | 253 (41.3%) |
Production, Transportation and Moving Occupations
The most common Production, Transportation and Moving occupations in Clearlake Oaks are , and Material Moving (16 | 2.6%).
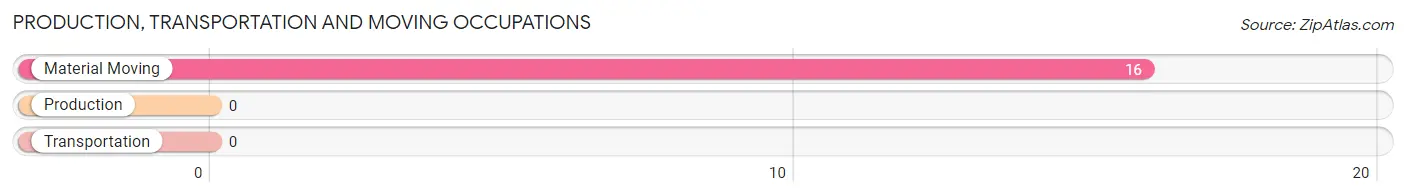
Production, Transportation and Moving Occupations by Sex
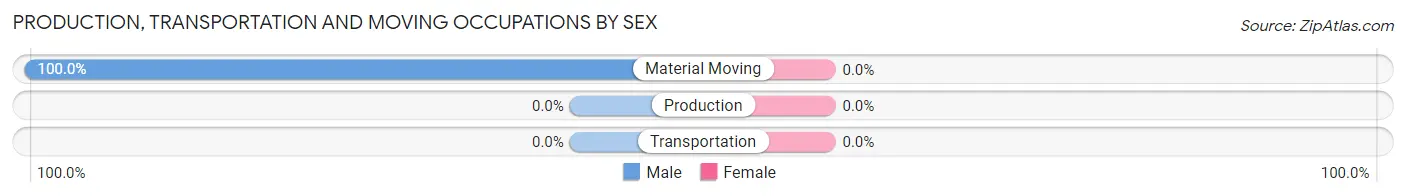
| Occupation | Male | Female |
| Production | 0 (0.0%) | 0 (0.0%) |
| Transportation | 0 (0.0%) | 0 (0.0%) |
| Material Moving | 16 (100.0%) | 0 (0.0%) |
| Total (Category) | 16 (100.0%) | 0 (0.0%) |
| Total (Overall) | 360 (58.7%) | 253 (41.3%) |
Employment Industries by Sex in Clearlake Oaks
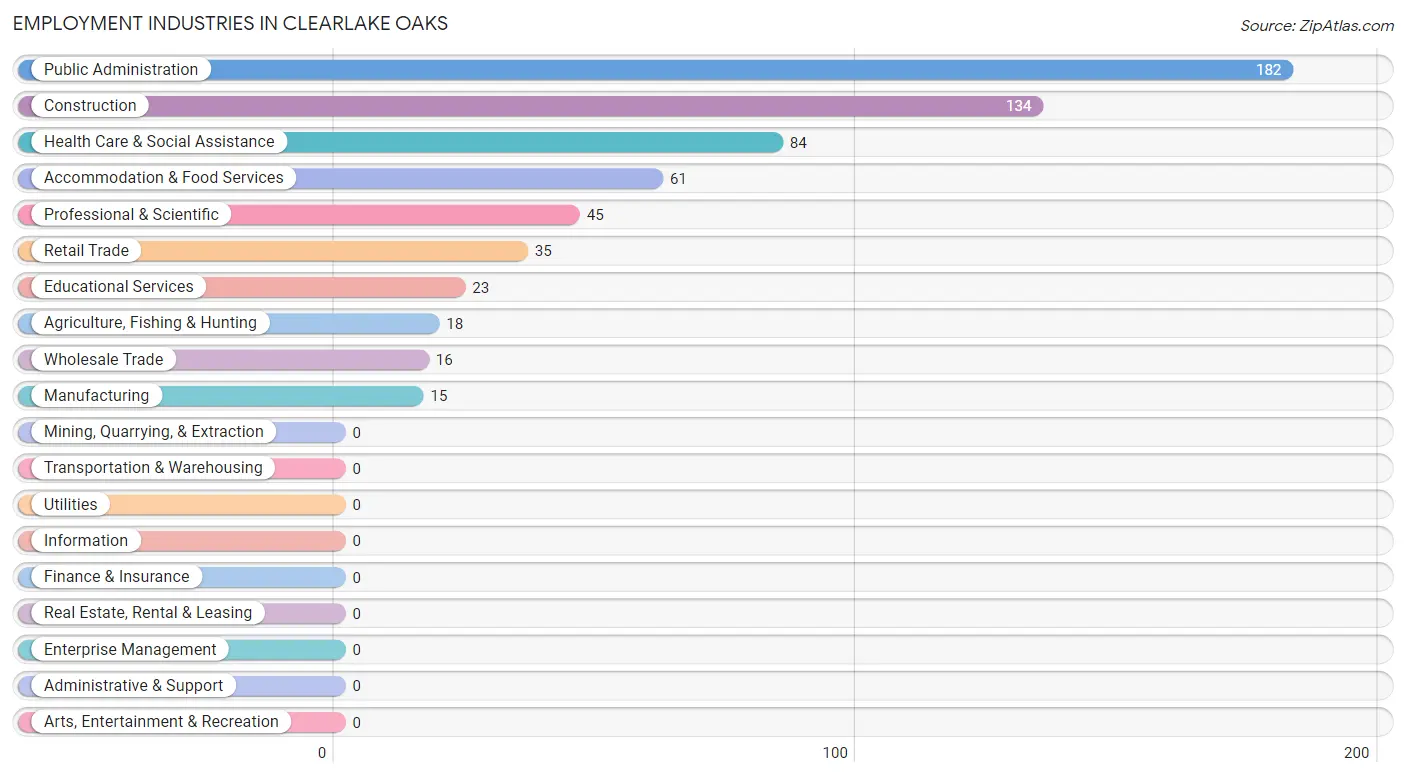
Employment Industries in Clearlake Oaks
The major employment industries in Clearlake Oaks include Public Administration (182 | 29.7%), Construction (134 | 21.9%), Health Care & Social Assistance (84 | 13.7%), Accommodation & Food Services (61 | 10.0%), and Professional & Scientific (45 | 7.3%).
Employment Industries by Sex in Clearlake Oaks
The Clearlake Oaks industries that see more men than women are Agriculture, Fishing & Hunting (100.0%), Construction (100.0%), and Wholesale Trade (100.0%), whereas the industries that tend to have a higher number of women are Manufacturing (100.0%), Retail Trade (100.0%), and Educational Services (100.0%).
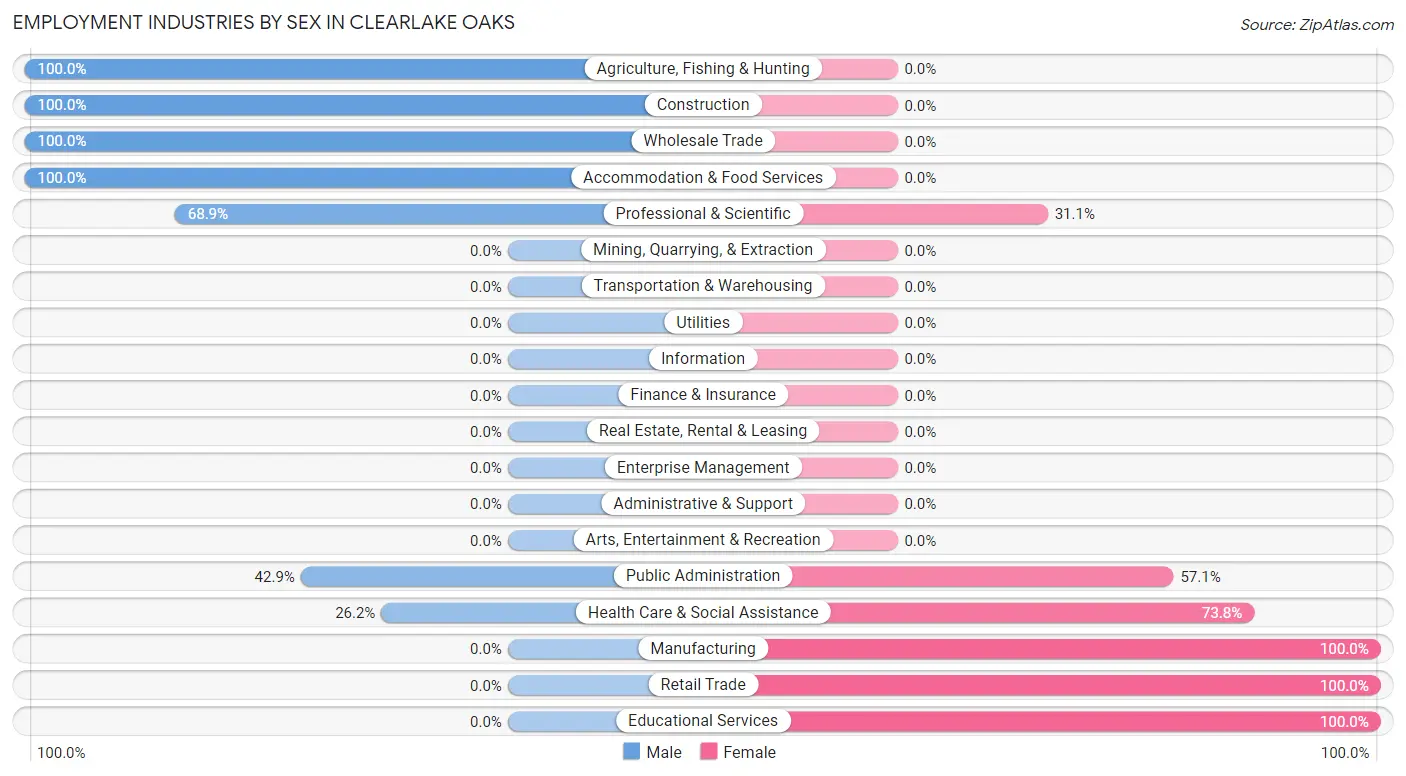
| Industry | Male | Female |
| Agriculture, Fishing & Hunting | 18 (100.0%) | 0 (0.0%) |
| Mining, Quarrying, & Extraction | 0 (0.0%) | 0 (0.0%) |
| Construction | 134 (100.0%) | 0 (0.0%) |
| Manufacturing | 0 (0.0%) | 15 (100.0%) |
| Wholesale Trade | 16 (100.0%) | 0 (0.0%) |
| Retail Trade | 0 (0.0%) | 35 (100.0%) |
| Transportation & Warehousing | 0 (0.0%) | 0 (0.0%) |
| Utilities | 0 (0.0%) | 0 (0.0%) |
| Information | 0 (0.0%) | 0 (0.0%) |
| Finance & Insurance | 0 (0.0%) | 0 (0.0%) |
| Real Estate, Rental & Leasing | 0 (0.0%) | 0 (0.0%) |
| Professional & Scientific | 31 (68.9%) | 14 (31.1%) |
| Enterprise Management | 0 (0.0%) | 0 (0.0%) |
| Administrative & Support | 0 (0.0%) | 0 (0.0%) |
| Educational Services | 0 (0.0%) | 23 (100.0%) |
| Health Care & Social Assistance | 22 (26.2%) | 62 (73.8%) |
| Arts, Entertainment & Recreation | 0 (0.0%) | 0 (0.0%) |
| Accommodation & Food Services | 61 (100.0%) | 0 (0.0%) |
| Public Administration | 78 (42.9%) | 104 (57.1%) |
| Total | 360 (58.7%) | 253 (41.3%) |
Education in Clearlake Oaks
School Enrollment in Clearlake Oaks
The most common levels of schooling among the 222 students in Clearlake Oaks are kindergarten (70 | 31.5%), middle school (48 | 21.6%), and high school (40 | 18.0%).
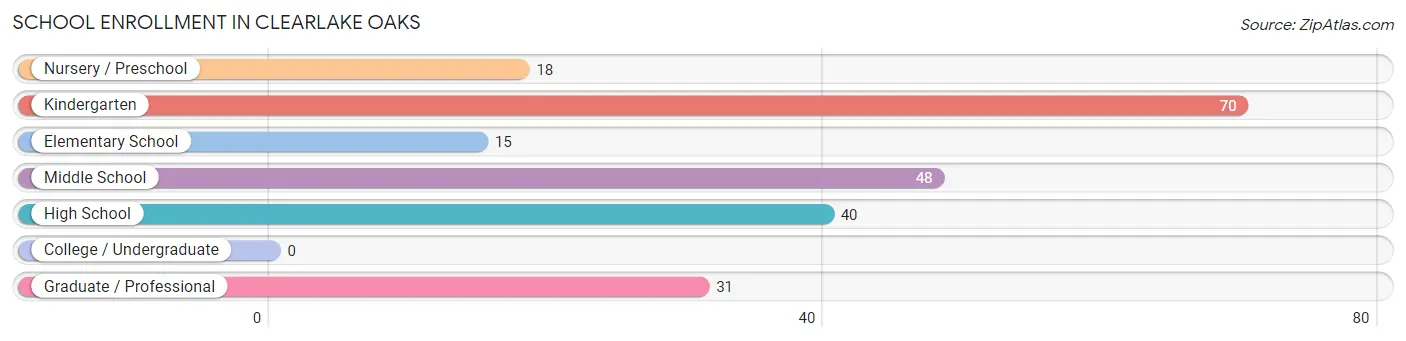
| School Level | # Students | % Students |
| Nursery / Preschool | 18 | 8.1% |
| Kindergarten | 70 | 31.5% |
| Elementary School | 15 | 6.8% |
| Middle School | 48 | 21.6% |
| High School | 40 | 18.0% |
| College / Undergraduate | 0 | 0.0% |
| Graduate / Professional | 31 | 14.0% |
| Total | 222 | 100.0% |
School Enrollment by Age by Funding Source in Clearlake Oaks
Out of a total of 222 students who are enrolled in schools in Clearlake Oaks, 31 (14.0%) attend a private institution, while the remaining 191 (86.0%) are enrolled in public schools. The age group of 35 years and over has the highest likelihood of being enrolled in private schools, with 31 (100.0% in the age bracket) enrolled. Conversely, the age group of 5 to 9 year old has the lowest likelihood of being enrolled in a private school, with 103 (100.0% in the age bracket) attending a public institution.
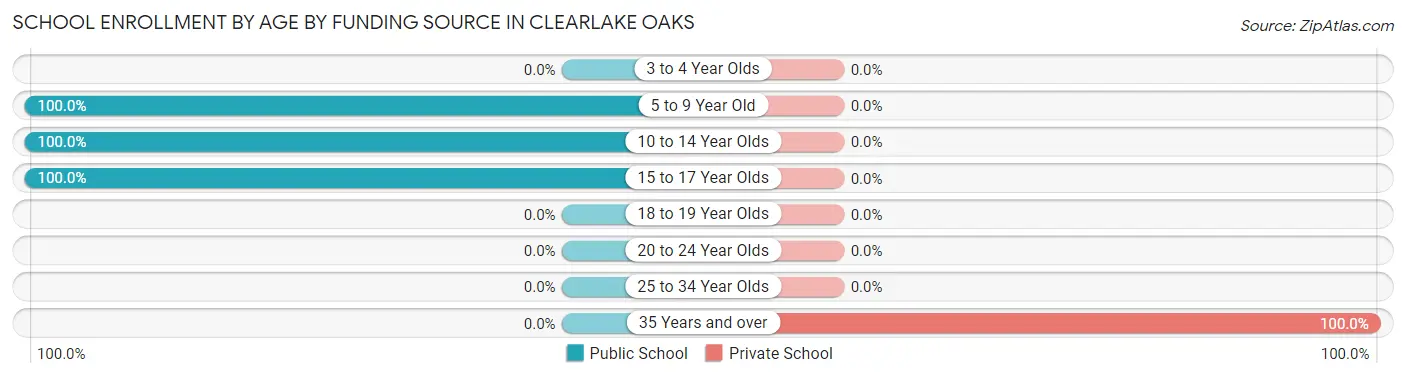
| Age Bracket | Public School | Private School |
| 3 to 4 Year Olds | 0 (0.0%) | 0 (0.0%) |
| 5 to 9 Year Old | 103 (100.0%) | 0 (0.0%) |
| 10 to 14 Year Olds | 48 (100.0%) | 0 (0.0%) |
| 15 to 17 Year Olds | 40 (100.0%) | 0 (0.0%) |
| 18 to 19 Year Olds | 0 (0.0%) | 0 (0.0%) |
| 20 to 24 Year Olds | 0 (0.0%) | 0 (0.0%) |
| 25 to 34 Year Olds | 0 (0.0%) | 0 (0.0%) |
| 35 Years and over | 0 (0.0%) | 31 (100.0%) |
| Total | 191 (86.0%) | 31 (14.0%) |
Educational Attainment by Field of Study in Clearlake Oaks
Bio, nature & agricultural (78 | 23.2%), education (62 | 18.4%), psychology (42 | 12.5%), science & technology (35 | 10.4%), and arts & humanities (31 | 9.2%) are the most common fields of study among 336 individuals in Clearlake Oaks who have obtained a bachelor's degree or higher.
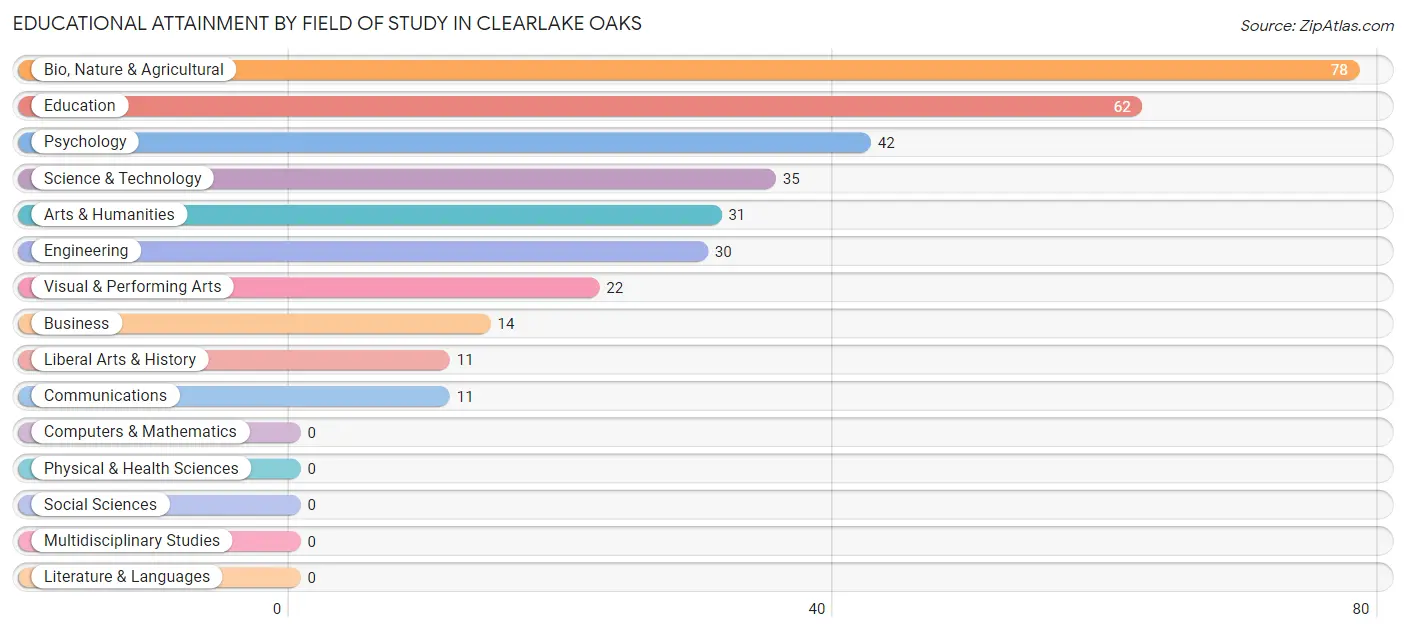
| Field of Study | # Graduates | % Graduates |
| Computers & Mathematics | 0 | 0.0% |
| Bio, Nature & Agricultural | 78 | 23.2% |
| Physical & Health Sciences | 0 | 0.0% |
| Psychology | 42 | 12.5% |
| Social Sciences | 0 | 0.0% |
| Engineering | 30 | 8.9% |
| Multidisciplinary Studies | 0 | 0.0% |
| Science & Technology | 35 | 10.4% |
| Business | 14 | 4.2% |
| Education | 62 | 18.4% |
| Literature & Languages | 0 | 0.0% |
| Liberal Arts & History | 11 | 3.3% |
| Visual & Performing Arts | 22 | 6.6% |
| Communications | 11 | 3.3% |
| Arts & Humanities | 31 | 9.2% |
| Total | 336 | 100.0% |
Transportation & Commute in Clearlake Oaks
Vehicle Availability by Sex in Clearlake Oaks
The most prevalent vehicle ownership categories in Clearlake Oaks are males with 2 vehicles (182, accounting for 52.9%) and females with 2 vehicles (152, making up 71.9%).
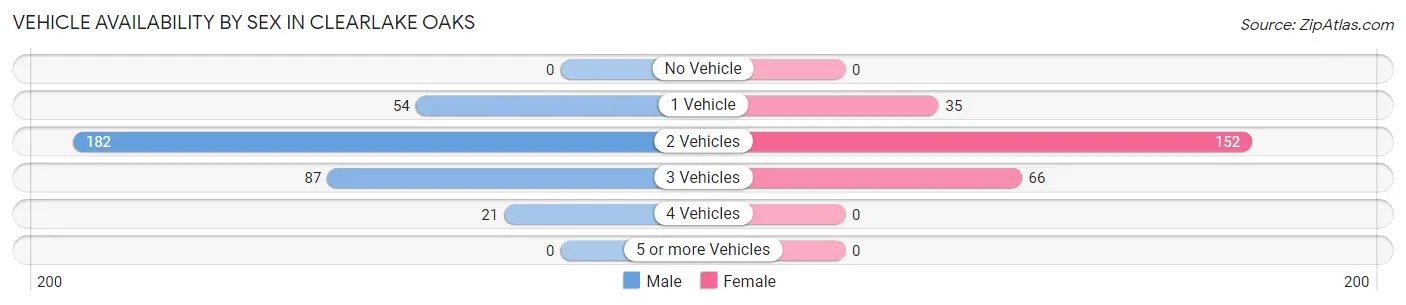
| Vehicles Available | Male | Female |
| No Vehicle | 0 (0.0%) | 0 (0.0%) |
| 1 Vehicle | 54 (15.7%) | 35 (13.8%) |
| 2 Vehicles | 182 (52.9%) | 152 (60.1%) |
| 3 Vehicles | 87 (25.3%) | 66 (26.1%) |
| 4 Vehicles | 21 (6.1%) | 0 (0.0%) |
| 5 or more Vehicles | 0 (0.0%) | 0 (0.0%) |
| Total | 344 (100.0%) | 253 (100.0%) |
Commute Time in Clearlake Oaks
The most frequently occuring commute durations in Clearlake Oaks are 10 to 14 minutes (162 commuters, 29.6%), 45 to 59 minutes (91 commuters, 16.6%), and less than 5 minutes (86 commuters, 15.7%).
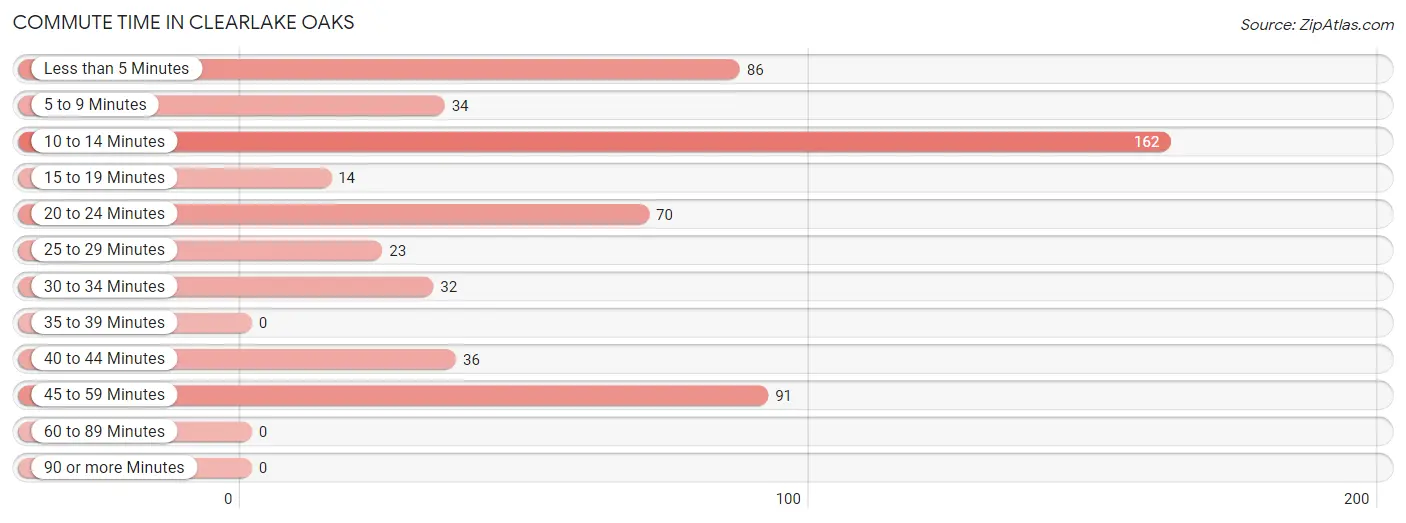
| Commute Time | # Commuters | % Commuters |
| Less than 5 Minutes | 86 | 15.7% |
| 5 to 9 Minutes | 34 | 6.2% |
| 10 to 14 Minutes | 162 | 29.6% |
| 15 to 19 Minutes | 14 | 2.5% |
| 20 to 24 Minutes | 70 | 12.8% |
| 25 to 29 Minutes | 23 | 4.2% |
| 30 to 34 Minutes | 32 | 5.8% |
| 35 to 39 Minutes | 0 | 0.0% |
| 40 to 44 Minutes | 36 | 6.6% |
| 45 to 59 Minutes | 91 | 16.6% |
| 60 to 89 Minutes | 0 | 0.0% |
| 90 or more Minutes | 0 | 0.0% |
Commute Time by Sex in Clearlake Oaks
The most common commute times in Clearlake Oaks are 10 to 14 minutes (101 commuters, 32.6%) for males and 10 to 14 minutes (61 commuters, 25.6%) for females.
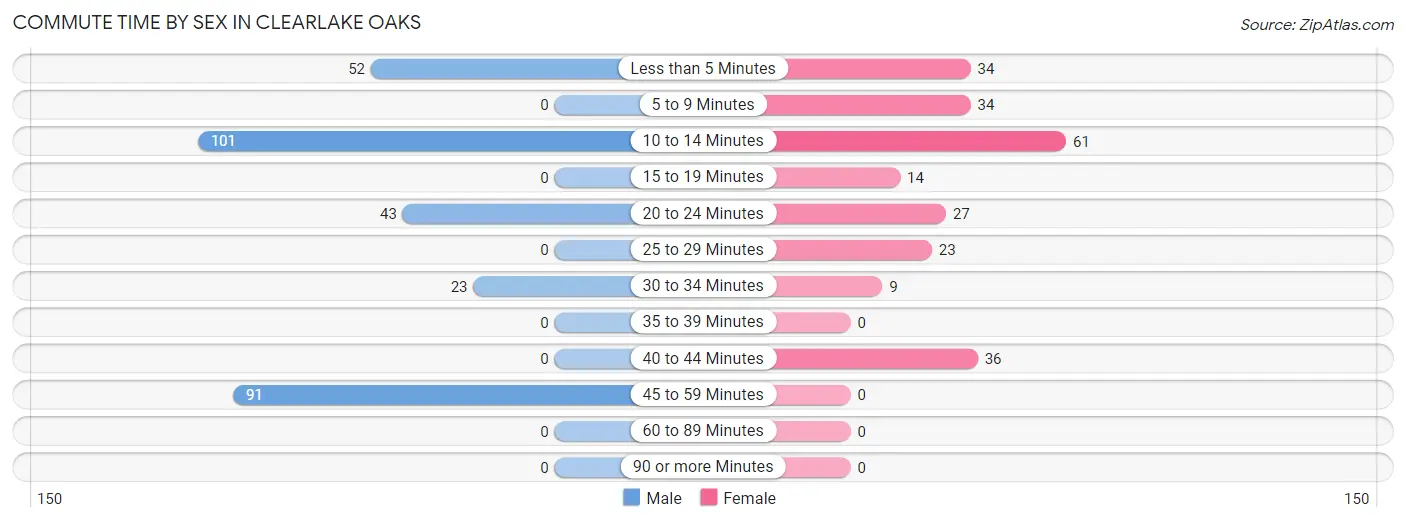
| Commute Time | Male | Female |
| Less than 5 Minutes | 52 (16.8%) | 34 (14.3%) |
| 5 to 9 Minutes | 0 (0.0%) | 34 (14.3%) |
| 10 to 14 Minutes | 101 (32.6%) | 61 (25.6%) |
| 15 to 19 Minutes | 0 (0.0%) | 14 (5.9%) |
| 20 to 24 Minutes | 43 (13.9%) | 27 (11.3%) |
| 25 to 29 Minutes | 0 (0.0%) | 23 (9.7%) |
| 30 to 34 Minutes | 23 (7.4%) | 9 (3.8%) |
| 35 to 39 Minutes | 0 (0.0%) | 0 (0.0%) |
| 40 to 44 Minutes | 0 (0.0%) | 36 (15.1%) |
| 45 to 59 Minutes | 91 (29.3%) | 0 (0.0%) |
| 60 to 89 Minutes | 0 (0.0%) | 0 (0.0%) |
| 90 or more Minutes | 0 (0.0%) | 0 (0.0%) |
Time of Departure to Work by Sex in Clearlake Oaks
The most frequent times of departure to work in Clearlake Oaks are 4:00 PM to 11:59 PM (124, 40.0%) for males and 6:00 AM to 6:29 AM (89, 37.4%) for females.
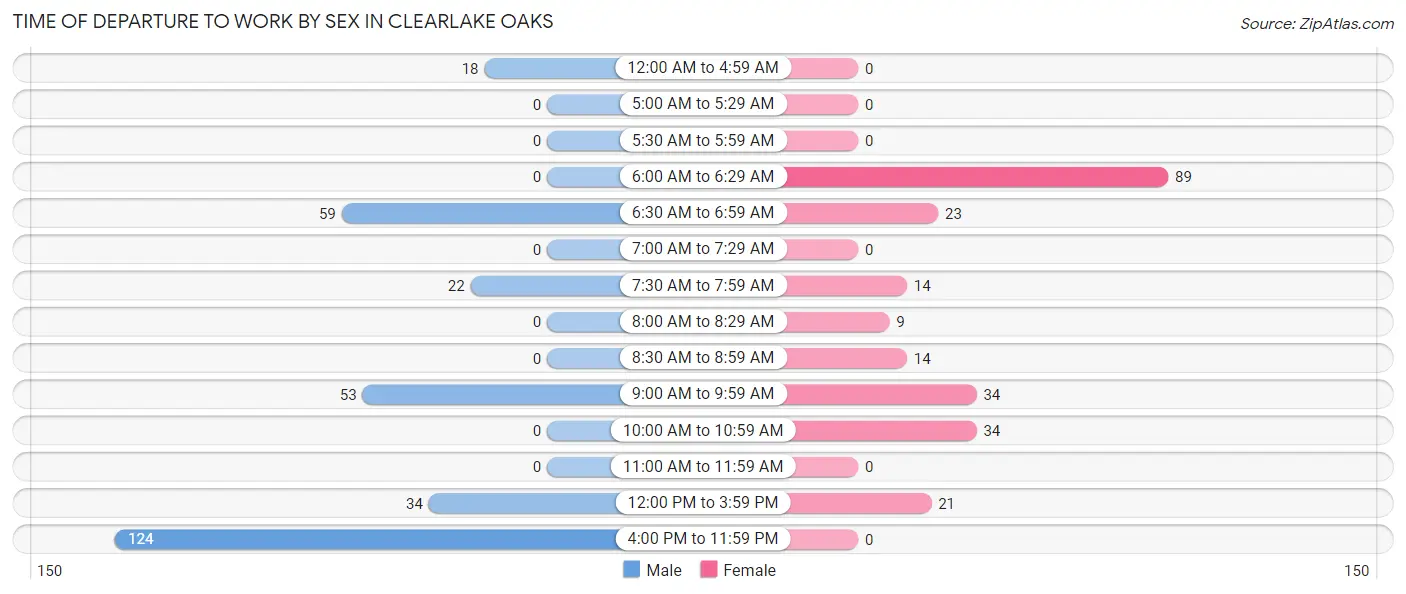
| Time of Departure | Male | Female |
| 12:00 AM to 4:59 AM | 18 (5.8%) | 0 (0.0%) |
| 5:00 AM to 5:29 AM | 0 (0.0%) | 0 (0.0%) |
| 5:30 AM to 5:59 AM | 0 (0.0%) | 0 (0.0%) |
| 6:00 AM to 6:29 AM | 0 (0.0%) | 89 (37.4%) |
| 6:30 AM to 6:59 AM | 59 (19.0%) | 23 (9.7%) |
| 7:00 AM to 7:29 AM | 0 (0.0%) | 0 (0.0%) |
| 7:30 AM to 7:59 AM | 22 (7.1%) | 14 (5.9%) |
| 8:00 AM to 8:29 AM | 0 (0.0%) | 9 (3.8%) |
| 8:30 AM to 8:59 AM | 0 (0.0%) | 14 (5.9%) |
| 9:00 AM to 9:59 AM | 53 (17.1%) | 34 (14.3%) |
| 10:00 AM to 10:59 AM | 0 (0.0%) | 34 (14.3%) |
| 11:00 AM to 11:59 AM | 0 (0.0%) | 0 (0.0%) |
| 12:00 PM to 3:59 PM | 34 (11.0%) | 21 (8.8%) |
| 4:00 PM to 11:59 PM | 124 (40.0%) | 0 (0.0%) |
| Total | 310 (100.0%) | 238 (100.0%) |
Housing Occupancy in Clearlake Oaks
Occupancy by Ownership in Clearlake Oaks
Of the total 1,083 dwellings in Clearlake Oaks, owner-occupied units account for 708 (65.4%), while renter-occupied units make up 375 (34.6%).
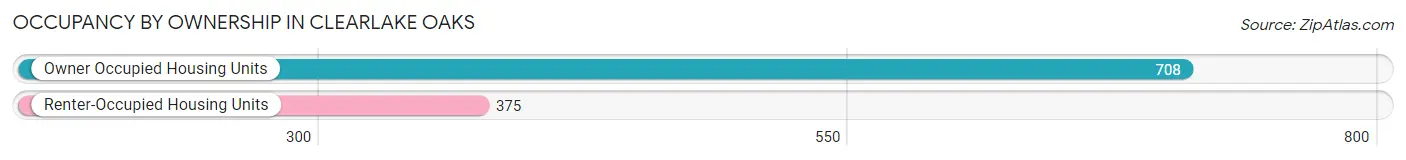
| Occupancy | # Housing Units | % Housing Units |
| Owner Occupied Housing Units | 708 | 65.4% |
| Renter-Occupied Housing Units | 375 | 34.6% |
| Total Occupied Housing Units | 1,083 | 100.0% |
Occupancy by Household Size in Clearlake Oaks
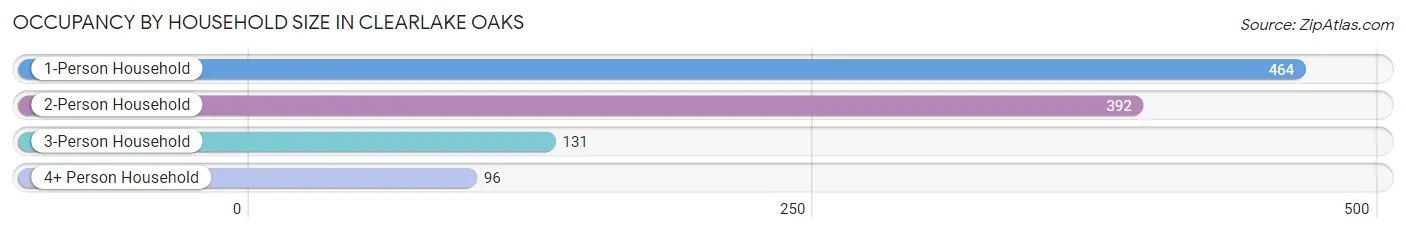
| Household Size | # Housing Units | % Housing Units |
| 1-Person Household | 464 | 42.8% |
| 2-Person Household | 392 | 36.2% |
| 3-Person Household | 131 | 12.1% |
| 4+ Person Household | 96 | 8.9% |
| Total Housing Units | 1,083 | 100.0% |
Occupancy by Ownership by Household Size in Clearlake Oaks
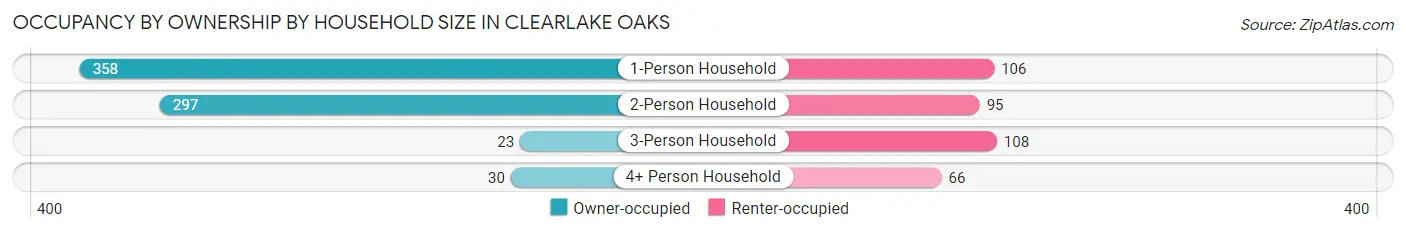
| Household Size | Owner-occupied | Renter-occupied |
| 1-Person Household | 358 (77.2%) | 106 (22.8%) |
| 2-Person Household | 297 (75.8%) | 95 (24.2%) |
| 3-Person Household | 23 (17.6%) | 108 (82.4%) |
| 4+ Person Household | 30 (31.2%) | 66 (68.8%) |
| Total Housing Units | 708 (65.4%) | 375 (34.6%) |
Occupancy by Educational Attainment in Clearlake Oaks
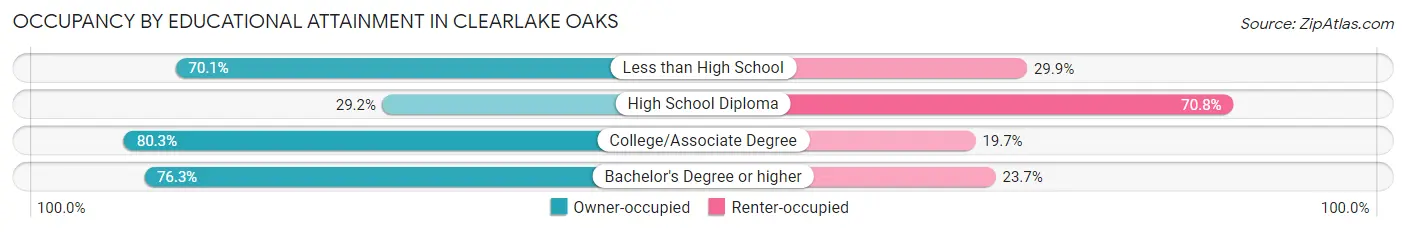
| Household Size | Owner-occupied | Renter-occupied |
| Less than High School | 68 (70.1%) | 29 (29.9%) |
| High School Diploma | 82 (29.2%) | 199 (70.8%) |
| College/Associate Degree | 400 (80.3%) | 98 (19.7%) |
| Bachelor's Degree or higher | 158 (76.3%) | 49 (23.7%) |
Occupancy by Age of Householder in Clearlake Oaks
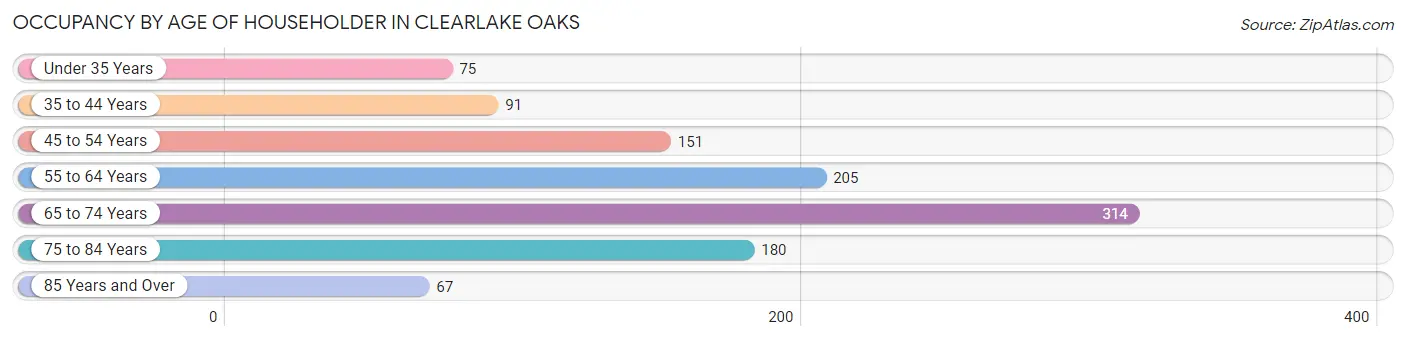
| Age Bracket | # Households | % Households |
| Under 35 Years | 75 | 6.9% |
| 35 to 44 Years | 91 | 8.4% |
| 45 to 54 Years | 151 | 13.9% |
| 55 to 64 Years | 205 | 18.9% |
| 65 to 74 Years | 314 | 29.0% |
| 75 to 84 Years | 180 | 16.6% |
| 85 Years and Over | 67 | 6.2% |
| Total | 1,083 | 100.0% |
Housing Finances in Clearlake Oaks
Median Income by Occupancy in Clearlake Oaks
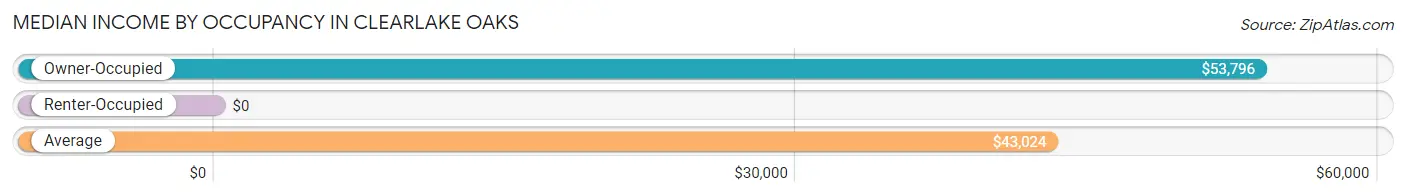
| Occupancy Type | # Households | Median Income |
| Owner-Occupied | 708 (65.4%) | $53,796 |
| Renter-Occupied | 375 (34.6%) | $0 |
| Average | 1,083 (100.0%) | $43,024 |
Occupancy by Householder Income Bracket in Clearlake Oaks
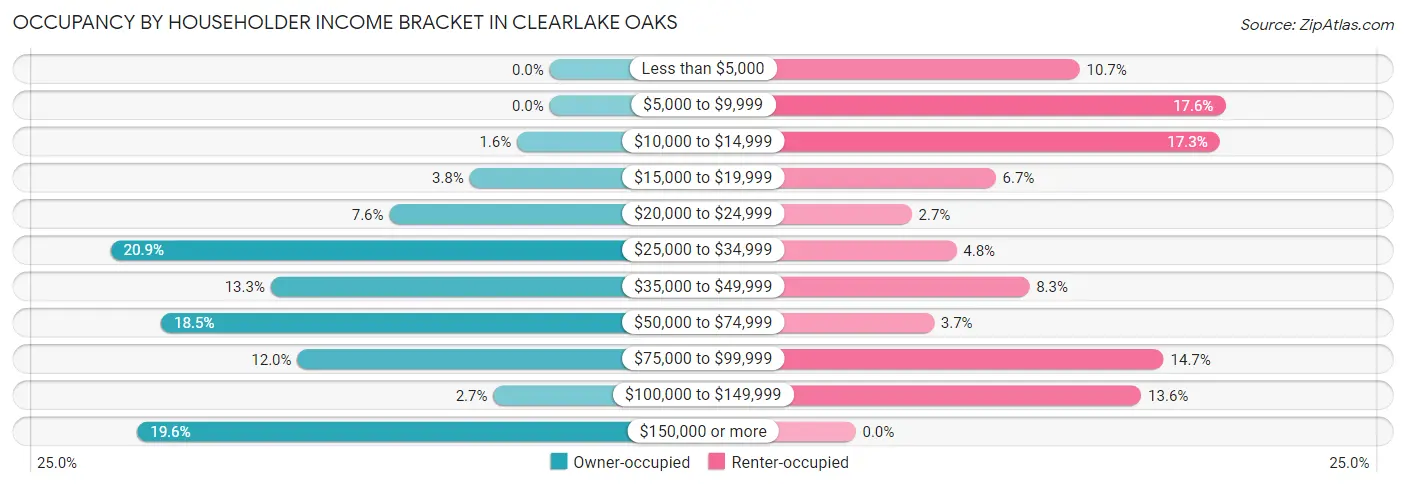
| Income Bracket | Owner-occupied | Renter-occupied |
| Less than $5,000 | 0 (0.0%) | 40 (10.7%) |
| $5,000 to $9,999 | 0 (0.0%) | 66 (17.6%) |
| $10,000 to $14,999 | 11 (1.5%) | 65 (17.3%) |
| $15,000 to $19,999 | 27 (3.8%) | 25 (6.7%) |
| $20,000 to $24,999 | 54 (7.6%) | 10 (2.7%) |
| $25,000 to $34,999 | 148 (20.9%) | 18 (4.8%) |
| $35,000 to $49,999 | 94 (13.3%) | 31 (8.3%) |
| $50,000 to $74,999 | 131 (18.5%) | 14 (3.7%) |
| $75,000 to $99,999 | 85 (12.0%) | 55 (14.7%) |
| $100,000 to $149,999 | 19 (2.7%) | 51 (13.6%) |
| $150,000 or more | 139 (19.6%) | 0 (0.0%) |
| Total | 708 (100.0%) | 375 (100.0%) |
Monthly Housing Cost Tiers in Clearlake Oaks
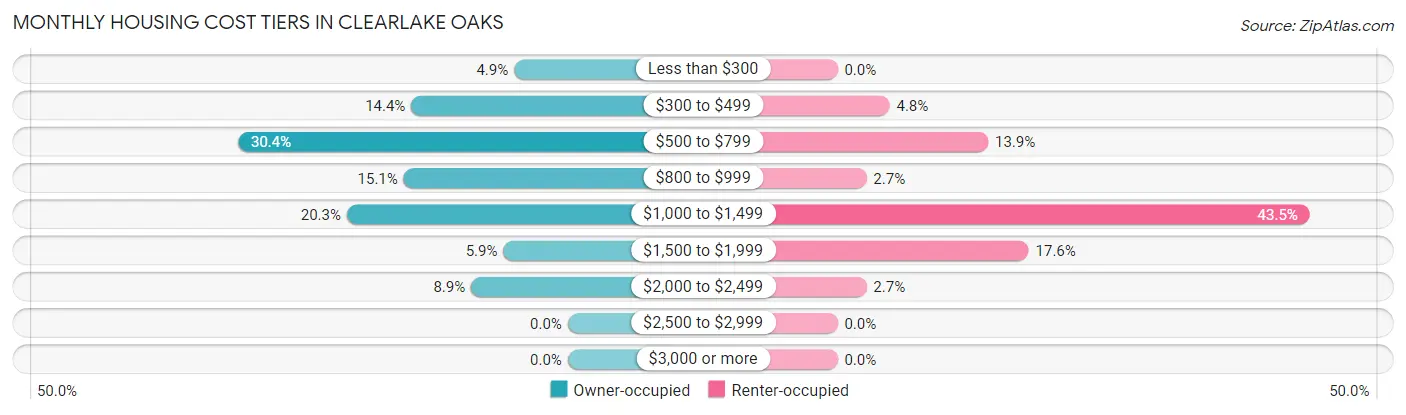
| Monthly Cost | Owner-occupied | Renter-occupied |
| Less than $300 | 35 (4.9%) | 0 (0.0%) |
| $300 to $499 | 102 (14.4%) | 18 (4.8%) |
| $500 to $799 | 215 (30.4%) | 52 (13.9%) |
| $800 to $999 | 107 (15.1%) | 10 (2.7%) |
| $1,000 to $1,499 | 144 (20.3%) | 163 (43.5%) |
| $1,500 to $1,999 | 42 (5.9%) | 66 (17.6%) |
| $2,000 to $2,499 | 63 (8.9%) | 10 (2.7%) |
| $2,500 to $2,999 | 0 (0.0%) | 0 (0.0%) |
| $3,000 or more | 0 (0.0%) | 0 (0.0%) |
| Total | 708 (100.0%) | 375 (100.0%) |
Physical Housing Characteristics in Clearlake Oaks
Housing Structures in Clearlake Oaks
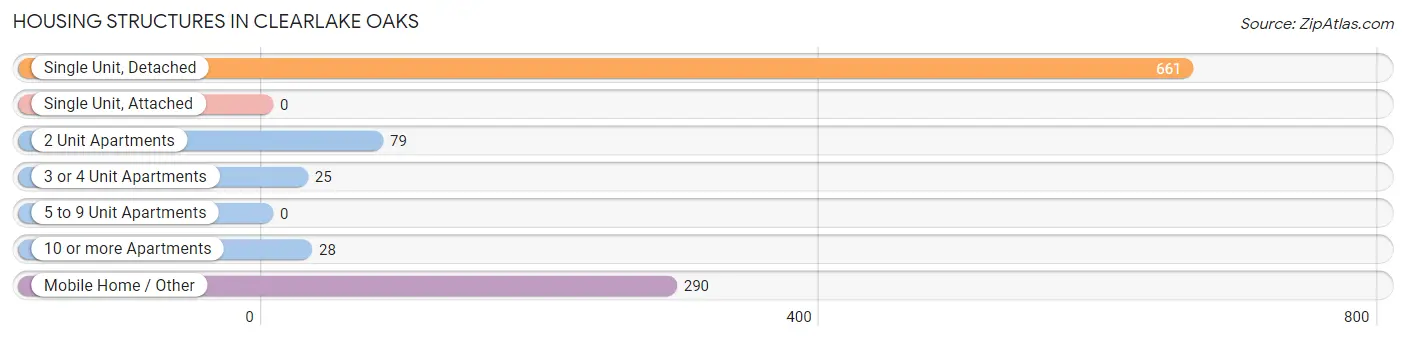
| Structure Type | # Housing Units | % Housing Units |
| Single Unit, Detached | 661 | 61.0% |
| Single Unit, Attached | 0 | 0.0% |
| 2 Unit Apartments | 79 | 7.3% |
| 3 or 4 Unit Apartments | 25 | 2.3% |
| 5 to 9 Unit Apartments | 0 | 0.0% |
| 10 or more Apartments | 28 | 2.6% |
| Mobile Home / Other | 290 | 26.8% |
| Total | 1,083 | 100.0% |
Housing Structures by Occupancy in Clearlake Oaks
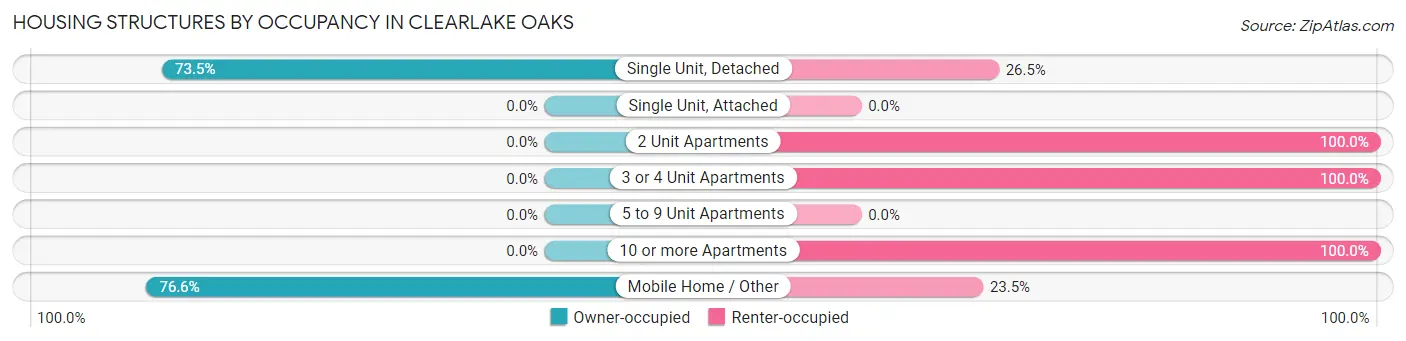
| Structure Type | Owner-occupied | Renter-occupied |
| Single Unit, Detached | 486 (73.5%) | 175 (26.5%) |
| Single Unit, Attached | 0 (0.0%) | 0 (0.0%) |
| 2 Unit Apartments | 0 (0.0%) | 79 (100.0%) |
| 3 or 4 Unit Apartments | 0 (0.0%) | 25 (100.0%) |
| 5 to 9 Unit Apartments | 0 (0.0%) | 0 (0.0%) |
| 10 or more Apartments | 0 (0.0%) | 28 (100.0%) |
| Mobile Home / Other | 222 (76.5%) | 68 (23.4%) |
| Total | 708 (65.4%) | 375 (34.6%) |
Housing Structures by Number of Rooms in Clearlake Oaks
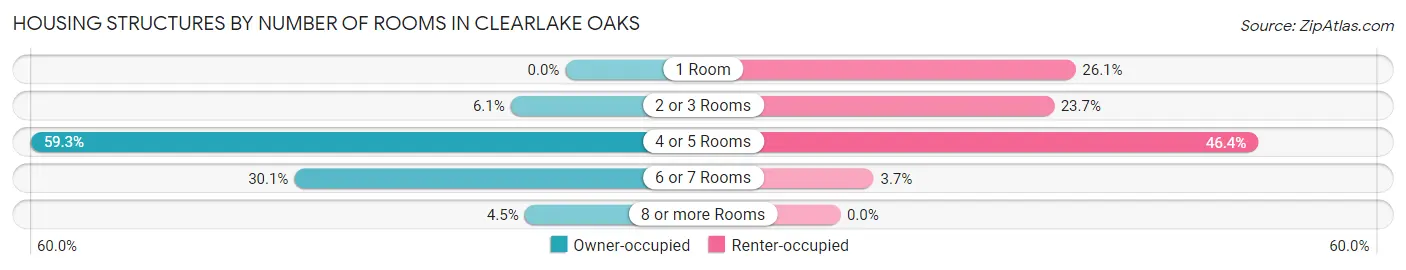
| Number of Rooms | Owner-occupied | Renter-occupied |
| 1 Room | 0 (0.0%) | 98 (26.1%) |
| 2 or 3 Rooms | 43 (6.1%) | 89 (23.7%) |
| 4 or 5 Rooms | 420 (59.3%) | 174 (46.4%) |
| 6 or 7 Rooms | 213 (30.1%) | 14 (3.7%) |
| 8 or more Rooms | 32 (4.5%) | 0 (0.0%) |
| Total | 708 (100.0%) | 375 (100.0%) |
Housing Structure by Heating Type in Clearlake Oaks
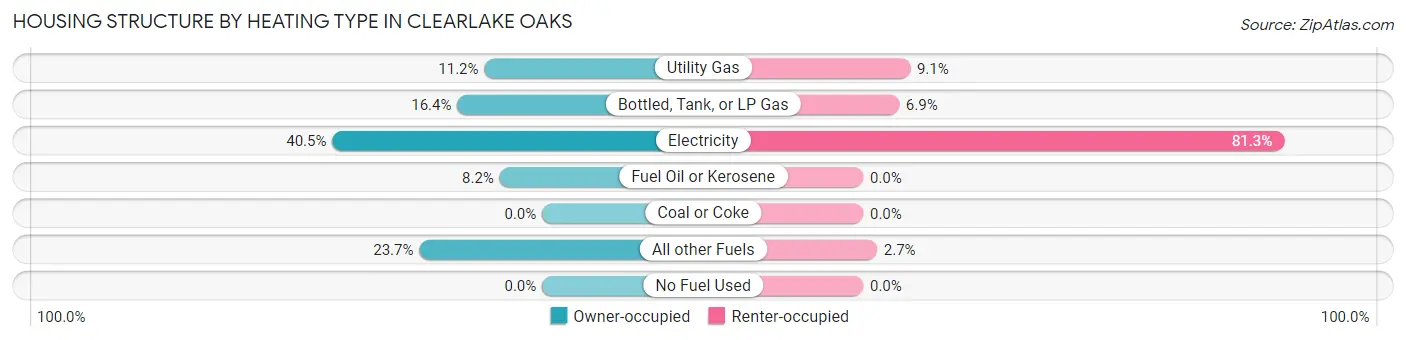
| Heating Type | Owner-occupied | Renter-occupied |
| Utility Gas | 79 (11.2%) | 34 (9.1%) |
| Bottled, Tank, or LP Gas | 116 (16.4%) | 26 (6.9%) |
| Electricity | 287 (40.5%) | 305 (81.3%) |
| Fuel Oil or Kerosene | 58 (8.2%) | 0 (0.0%) |
| Coal or Coke | 0 (0.0%) | 0 (0.0%) |
| All other Fuels | 168 (23.7%) | 10 (2.7%) |
| No Fuel Used | 0 (0.0%) | 0 (0.0%) |
| Total | 708 (100.0%) | 375 (100.0%) |
Household Vehicle Usage in Clearlake Oaks
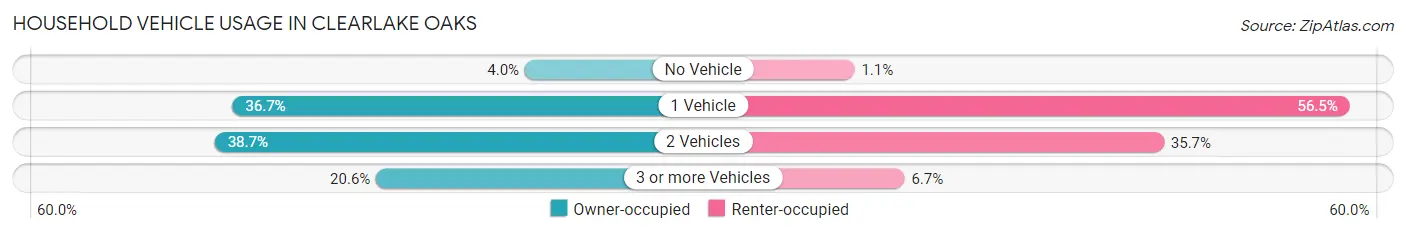
| Vehicles per Household | Owner-occupied | Renter-occupied |
| No Vehicle | 28 (4.0%) | 4 (1.1%) |
| 1 Vehicle | 260 (36.7%) | 212 (56.5%) |
| 2 Vehicles | 274 (38.7%) | 134 (35.7%) |
| 3 or more Vehicles | 146 (20.6%) | 25 (6.7%) |
| Total | 708 (100.0%) | 375 (100.0%) |
Real Estate & Mortgages in Clearlake Oaks
Real Estate and Mortgage Overview in Clearlake Oaks
| Characteristic | Without Mortgage | With Mortgage |
| Housing Units | 360 | 348 |
| Median Property Value | $226,000 | $181,000 |
| Median Household Income | $59,306 | $22 |
| Monthly Housing Costs | $607 | $0 |
| Real Estate Taxes | $1,634 | $0 |
Property Value by Mortgage Status in Clearlake Oaks
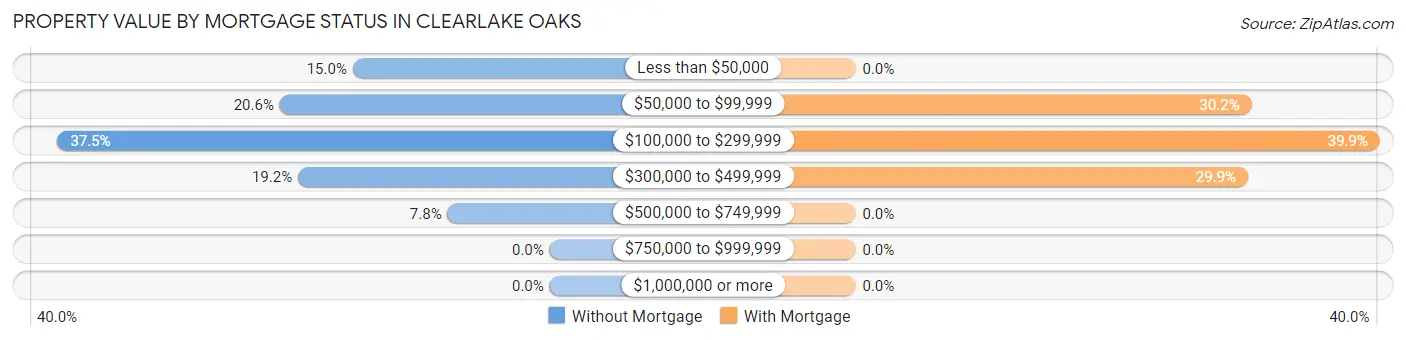
| Property Value | Without Mortgage | With Mortgage |
| Less than $50,000 | 54 (15.0%) | 0 (0.0%) |
| $50,000 to $99,999 | 74 (20.6%) | 105 (30.2%) |
| $100,000 to $299,999 | 135 (37.5%) | 139 (39.9%) |
| $300,000 to $499,999 | 69 (19.2%) | 104 (29.9%) |
| $500,000 to $749,999 | 28 (7.8%) | 0 (0.0%) |
| $750,000 to $999,999 | 0 (0.0%) | 0 (0.0%) |
| $1,000,000 or more | 0 (0.0%) | 0 (0.0%) |
| Total | 360 (100.0%) | 348 (100.0%) |
Household Income by Mortgage Status in Clearlake Oaks
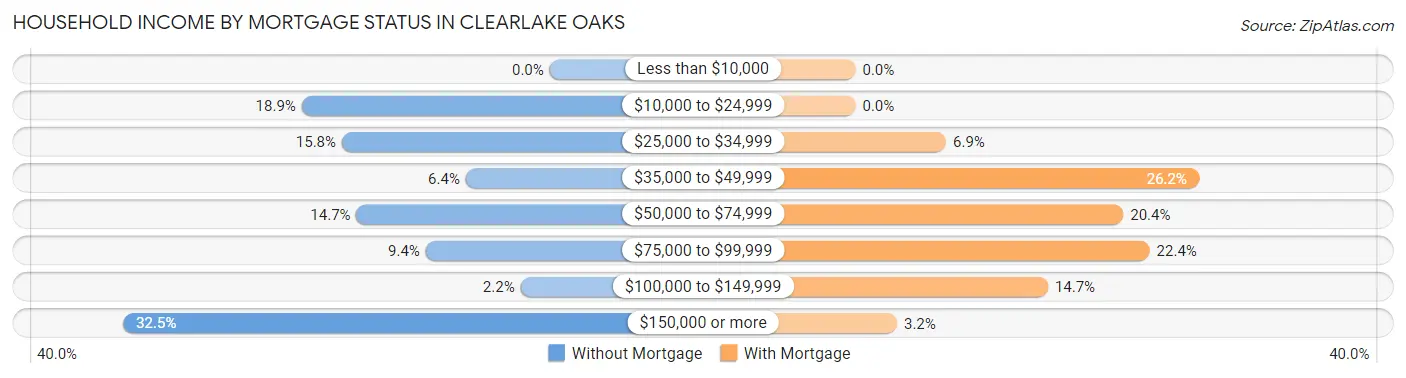
| Household Income | Without Mortgage | With Mortgage |
| Less than $10,000 | 0 (0.0%) | 0 (0.0%) |
| $10,000 to $24,999 | 68 (18.9%) | 0 (0.0%) |
| $25,000 to $34,999 | 57 (15.8%) | 24 (6.9%) |
| $35,000 to $49,999 | 23 (6.4%) | 91 (26.2%) |
| $50,000 to $74,999 | 53 (14.7%) | 71 (20.4%) |
| $75,000 to $99,999 | 34 (9.4%) | 78 (22.4%) |
| $100,000 to $149,999 | 8 (2.2%) | 51 (14.7%) |
| $150,000 or more | 117 (32.5%) | 11 (3.2%) |
| Total | 360 (100.0%) | 348 (100.0%) |
Property Value to Household Income Ratio in Clearlake Oaks
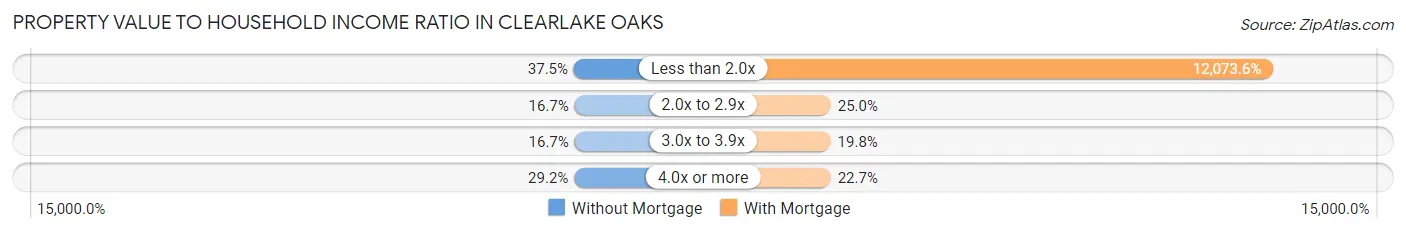
| Value-to-Income Ratio | Without Mortgage | With Mortgage |
| Less than 2.0x | 135 (37.5%) | 42,016 (12,073.6%) |
| 2.0x to 2.9x | 60 (16.7%) | 87 (25.0%) |
| 3.0x to 3.9x | 60 (16.7%) | 69 (19.8%) |
| 4.0x or more | 105 (29.2%) | 79 (22.7%) |
| Total | 360 (100.0%) | 348 (100.0%) |
Real Estate Taxes by Mortgage Status in Clearlake Oaks
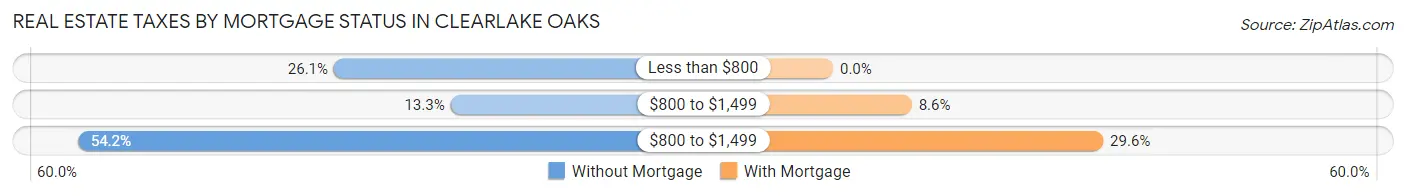
| Property Taxes | Without Mortgage | With Mortgage |
| Less than $800 | 94 (26.1%) | 0 (0.0%) |
| $800 to $1,499 | 48 (13.3%) | 30 (8.6%) |
| $800 to $1,499 | 195 (54.2%) | 103 (29.6%) |
| Total | 360 (100.0%) | 348 (100.0%) |
Health & Disability in Clearlake Oaks
Health Insurance Coverage by Age in Clearlake Oaks
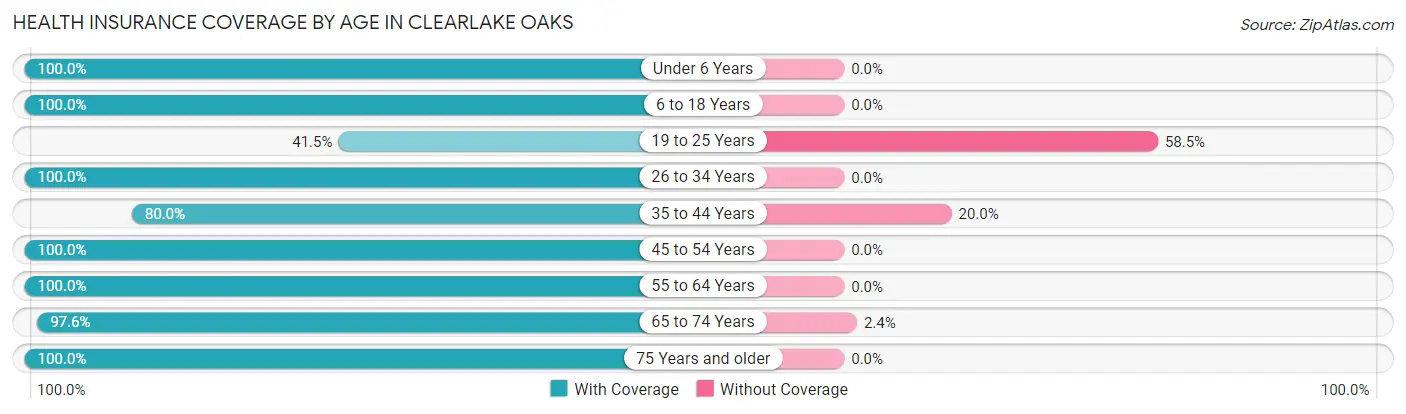
| Age Bracket | With Coverage | Without Coverage |
| Under 6 Years | 69 (100.0%) | 0 (0.0%) |
| 6 to 18 Years | 173 (100.0%) | 0 (0.0%) |
| 19 to 25 Years | 44 (41.5%) | 62 (58.5%) |
| 26 to 34 Years | 96 (100.0%) | 0 (0.0%) |
| 35 to 44 Years | 152 (80.0%) | 38 (20.0%) |
| 45 to 54 Years | 338 (100.0%) | 0 (0.0%) |
| 55 to 64 Years | 323 (100.0%) | 0 (0.0%) |
| 65 to 74 Years | 413 (97.6%) | 10 (2.4%) |
| 75 Years and older | 356 (100.0%) | 0 (0.0%) |
| Total | 1,964 (94.7%) | 110 (5.3%) |
Health Insurance Coverage by Citizenship Status in Clearlake Oaks
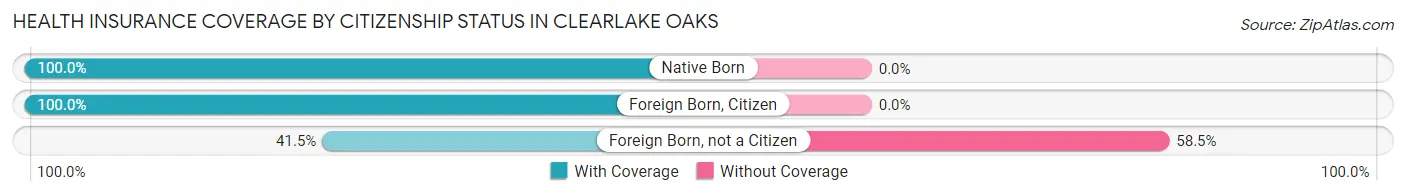
| Citizenship Status | With Coverage | Without Coverage |
| Native Born | 69 (100.0%) | 0 (0.0%) |
| Foreign Born, Citizen | 173 (100.0%) | 0 (0.0%) |
| Foreign Born, not a Citizen | 44 (41.5%) | 62 (58.5%) |
Health Insurance Coverage by Household Income in Clearlake Oaks
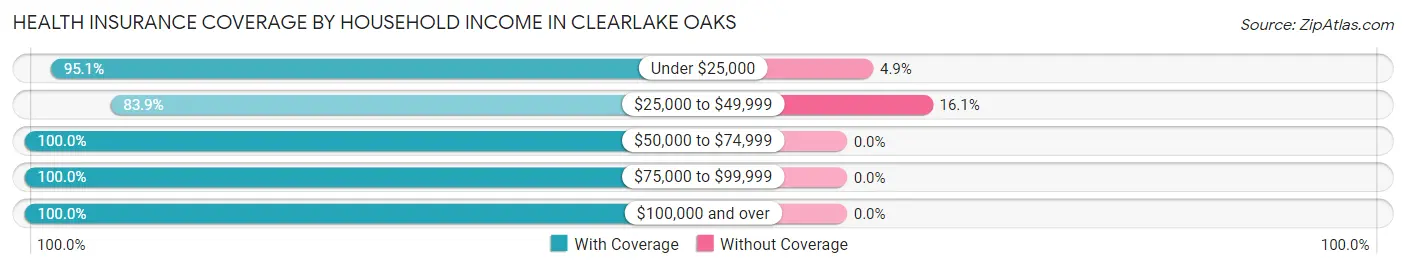
| Household Income | With Coverage | Without Coverage |
| Under $25,000 | 502 (95.1%) | 26 (4.9%) |
| $25,000 to $49,999 | 439 (83.9%) | 84 (16.1%) |
| $50,000 to $74,999 | 267 (100.0%) | 0 (0.0%) |
| $75,000 to $99,999 | 282 (100.0%) | 0 (0.0%) |
| $100,000 and over | 474 (100.0%) | 0 (0.0%) |
Public vs Private Health Insurance Coverage by Age in Clearlake Oaks
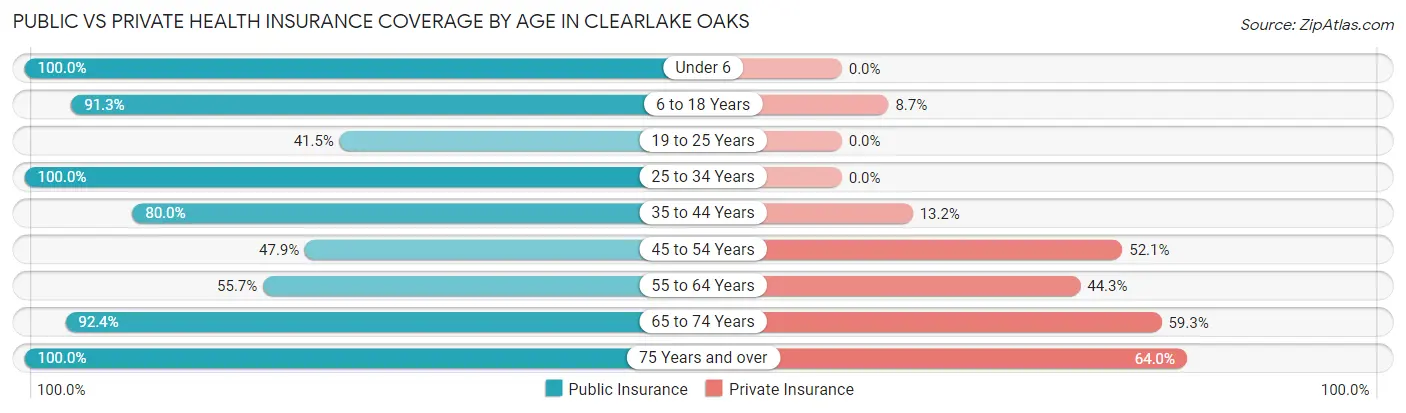
| Age Bracket | Public Insurance | Private Insurance |
| Under 6 | 69 (100.0%) | 0 (0.0%) |
| 6 to 18 Years | 158 (91.3%) | 15 (8.7%) |
| 19 to 25 Years | 44 (41.5%) | 0 (0.0%) |
| 25 to 34 Years | 96 (100.0%) | 0 (0.0%) |
| 35 to 44 Years | 152 (80.0%) | 25 (13.2%) |
| 45 to 54 Years | 162 (47.9%) | 176 (52.1%) |
| 55 to 64 Years | 180 (55.7%) | 143 (44.3%) |
| 65 to 74 Years | 391 (92.4%) | 251 (59.3%) |
| 75 Years and over | 356 (100.0%) | 228 (64.0%) |
| Total | 1,608 (77.5%) | 838 (40.4%) |
Disability Status by Sex by Age in Clearlake Oaks
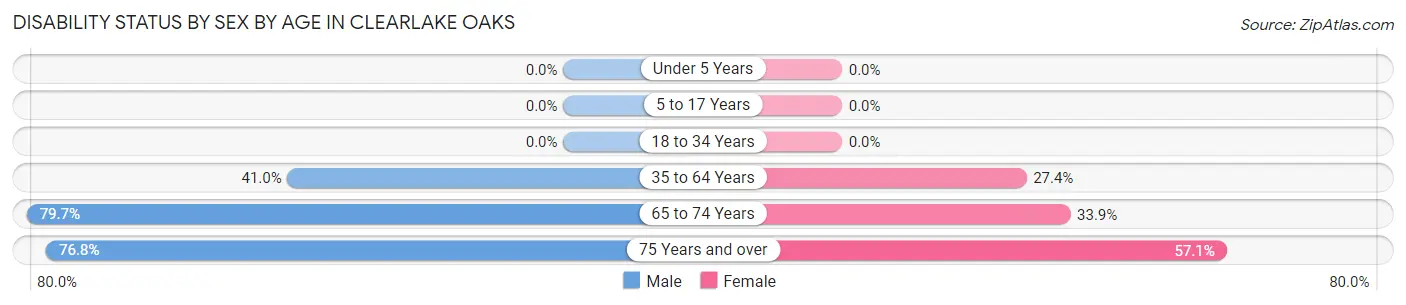
| Age Bracket | Male | Female |
| Under 5 Years | 0 (0.0%) | 0 (0.0%) |
| 5 to 17 Years | 0 (0.0%) | 0 (0.0%) |
| 18 to 34 Years | 0 (0.0%) | 0 (0.0%) |
| 35 to 64 Years | 172 (40.9%) | 118 (27.4%) |
| 65 to 74 Years | 149 (79.7%) | 80 (33.9%) |
| 75 Years and over | 139 (76.8%) | 100 (57.1%) |
Disability Class by Sex by Age in Clearlake Oaks
Disability Class: Hearing Difficulty
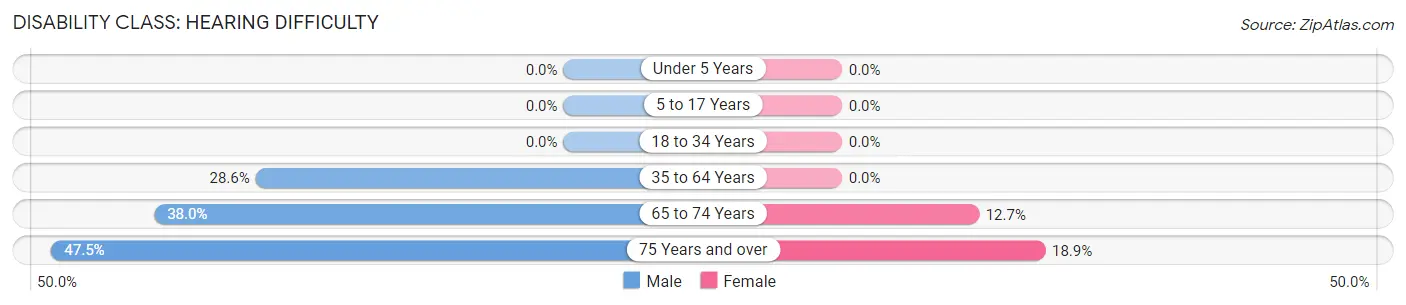
| Age Bracket | Male | Female |
| Under 5 Years | 0 (0.0%) | 0 (0.0%) |
| 5 to 17 Years | 0 (0.0%) | 0 (0.0%) |
| 18 to 34 Years | 0 (0.0%) | 0 (0.0%) |
| 35 to 64 Years | 120 (28.6%) | 0 (0.0%) |
| 65 to 74 Years | 71 (38.0%) | 30 (12.7%) |
| 75 Years and over | 86 (47.5%) | 33 (18.9%) |
Disability Class: Vision Difficulty
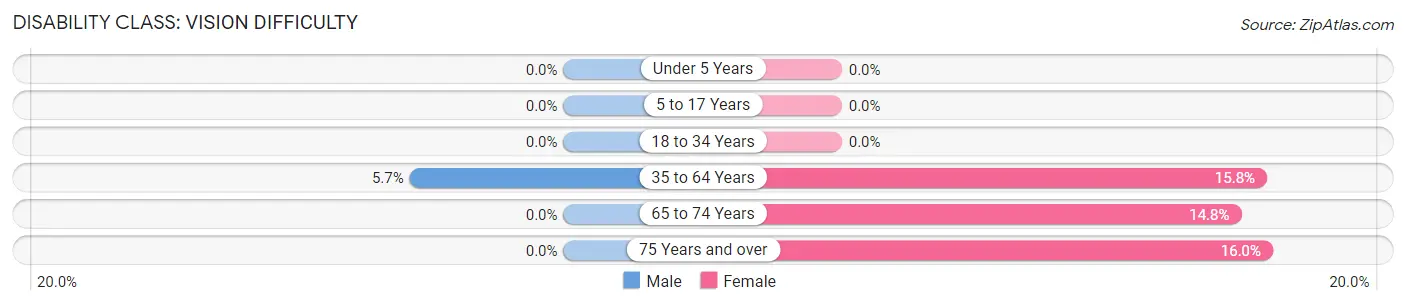
| Age Bracket | Male | Female |
| Under 5 Years | 0 (0.0%) | 0 (0.0%) |
| 5 to 17 Years | 0 (0.0%) | 0 (0.0%) |
| 18 to 34 Years | 0 (0.0%) | 0 (0.0%) |
| 35 to 64 Years | 24 (5.7%) | 68 (15.8%) |
| 65 to 74 Years | 0 (0.0%) | 35 (14.8%) |
| 75 Years and over | 0 (0.0%) | 28 (16.0%) |
Disability Class: Cognitive Difficulty
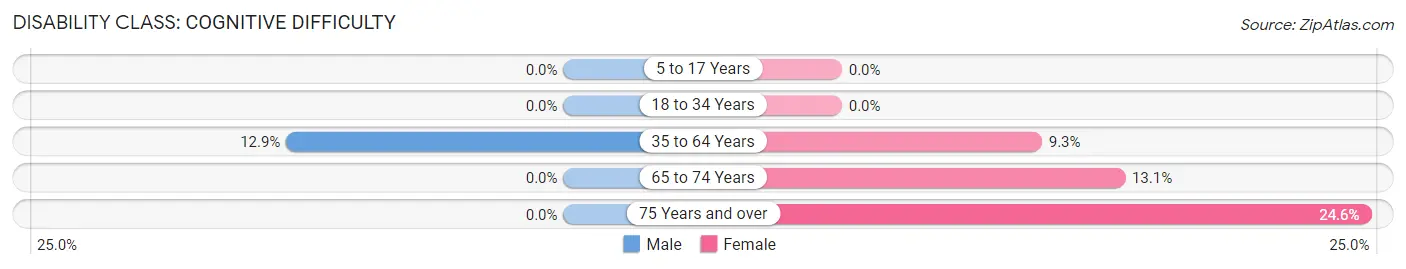
| Age Bracket | Male | Female |
| 5 to 17 Years | 0 (0.0%) | 0 (0.0%) |
| 18 to 34 Years | 0 (0.0%) | 0 (0.0%) |
| 35 to 64 Years | 54 (12.9%) | 40 (9.3%) |
| 65 to 74 Years | 0 (0.0%) | 31 (13.1%) |
| 75 Years and over | 0 (0.0%) | 43 (24.6%) |
Disability Class: Ambulatory Difficulty
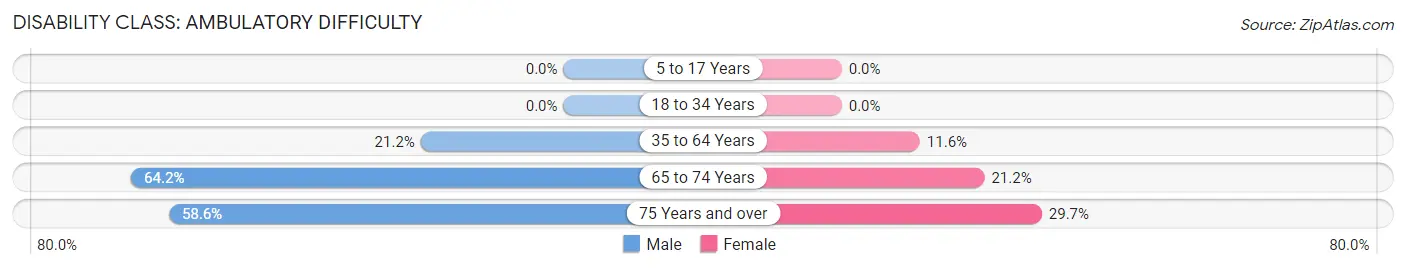
| Age Bracket | Male | Female |
| 5 to 17 Years | 0 (0.0%) | 0 (0.0%) |
| 18 to 34 Years | 0 (0.0%) | 0 (0.0%) |
| 35 to 64 Years | 89 (21.2%) | 50 (11.6%) |
| 65 to 74 Years | 120 (64.2%) | 50 (21.2%) |
| 75 Years and over | 106 (58.6%) | 52 (29.7%) |
Disability Class: Self-Care Difficulty
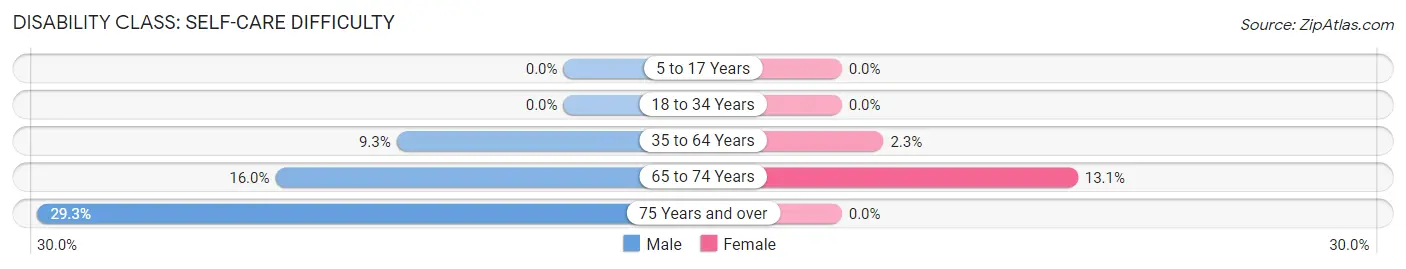
| Age Bracket | Male | Female |
| 5 to 17 Years | 0 (0.0%) | 0 (0.0%) |
| 18 to 34 Years | 0 (0.0%) | 0 (0.0%) |
| 35 to 64 Years | 39 (9.3%) | 10 (2.3%) |
| 65 to 74 Years | 30 (16.0%) | 31 (13.1%) |
| 75 Years and over | 53 (29.3%) | 0 (0.0%) |
Technology Access in Clearlake Oaks
Computing Device Access in Clearlake Oaks
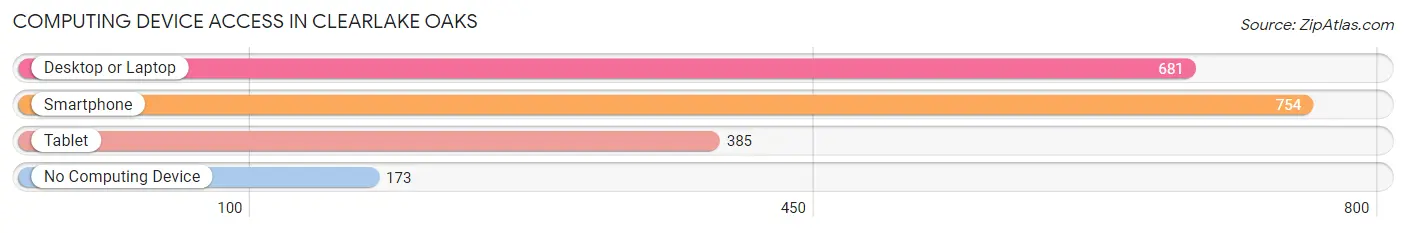
| Device Type | # Households | % Households |
| Desktop or Laptop | 681 | 62.9% |
| Smartphone | 754 | 69.6% |
| Tablet | 385 | 35.5% |
| No Computing Device | 173 | 16.0% |
| Total | 1,083 | 100.0% |
Internet Access in Clearlake Oaks
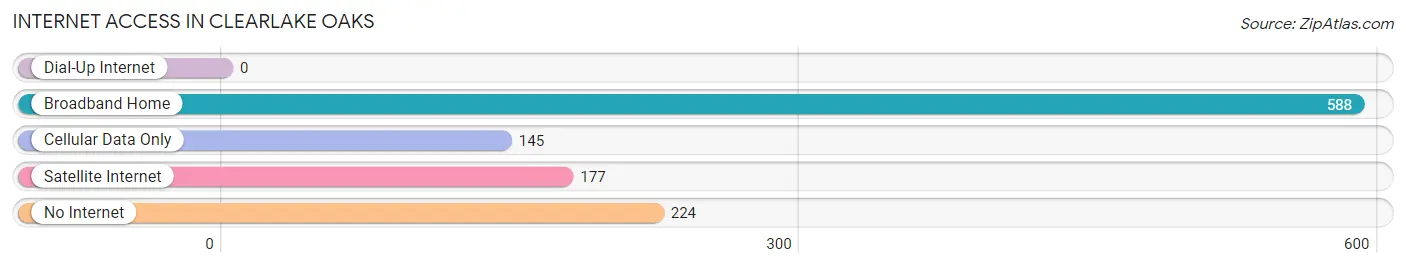
| Internet Type | # Households | % Households |
| Dial-Up Internet | 0 | 0.0% |
| Broadband Home | 588 | 54.3% |
| Cellular Data Only | 145 | 13.4% |
| Satellite Internet | 177 | 16.3% |
| No Internet | 224 | 20.7% |
| Total | 1,083 | 100.0% |
Clearlake Oaks Summary
Lake County, California is located in the northern part of the state, and is home to the city of Clearlake Oaks. Clearlake Oaks is a small city located on the shores of Clear Lake, the largest natural freshwater lake in California. The city has a population of approximately 2,000 people and is located in the Clear Lake Valley, which is surrounded by mountains and hills.
History
Clearlake Oaks was first settled in the late 1800s by settlers from the Midwest. The area was originally known as “Oaksville” and was a small farming community. In the early 1900s, the area began to grow as the lumber industry began to expand in the area. The lumber industry was a major contributor to the economy of the area and helped to create jobs and bring in new people.
In the 1950s, the area began to experience a population boom as people moved to the area to take advantage of the booming lumber industry. The population of Clearlake Oaks grew to over 5,000 people by the 1960s.
In the 1970s, the area began to experience a decline in the lumber industry and the population began to decline as well. The population of Clearlake Oaks dropped to just over 2,000 people by the year 2000.
Geography
Clearlake Oaks is located in the Clear Lake Valley, which is surrounded by mountains and hills. The city is located on the shores of Clear Lake, the largest natural freshwater lake in California. The lake is fed by several creeks and streams, including Cache Creek, which flows through the city.
The city is located in a temperate climate, with hot summers and mild winters. The average temperature in the summer is around 80 degrees Fahrenheit, and the average temperature in the winter is around 50 degrees Fahrenheit.
Economy
The economy of Clearlake Oaks is largely based on tourism and recreation. The city is home to several resorts and hotels, as well as a number of restaurants and bars. The city is also home to several marinas, which provide access to the lake for fishing, boating, and other recreational activities.
The city is also home to several businesses, including a lumber mill, a winery, and a number of small businesses. The city is also home to a number of government offices, including the Lake County Sheriff’s Office and the Lake County Courthouse.
Demographics
As of the 2010 census, the population of Clearlake Oaks was 2,037. The population is largely white, with a small percentage of African Americans, Hispanics, and Asians. The median age of the population is 44.7 years, and the median household income is $41,945.
The city is home to a number of churches, including the Clearlake Oaks Community Church, the Clearlake Oaks Baptist Church, and the Clearlake Oaks United Methodist Church. The city is also home to a number of schools, including Clearlake Oaks Elementary School, Clearlake Oaks Middle School, and Clearlake Oaks High School.
Conclusion
Clearlake Oaks is a small city located on the shores of Clear Lake, the largest natural freshwater lake in California. The city has a population of approximately 2,000 people and is located in the Clear Lake Valley, which is surrounded by mountains and hills. The economy of Clearlake Oaks is largely based on tourism and recreation, and the population is largely white, with a small percentage of African Americans, Hispanics, and Asians. The city is home to a number of churches, schools, businesses, and government offices.
Common Questions
What is Per Capita Income in Clearlake Oaks?
Per Capita income in Clearlake Oaks is $40,587.
What is the Median Family Income in Clearlake Oaks?
Median Family Income in Clearlake Oaks is $65,227.
What is the Median Household income in Clearlake Oaks?
Median Household Income in Clearlake Oaks is $43,024.
What is Income or Wage Gap in Clearlake Oaks?
Income or Wage Gap in Clearlake Oaks is 8.1%.
Women in Clearlake Oaks earn 91.9 cents for every dollar earned by a man.
What is Inequality or Gini Index in Clearlake Oaks?
Inequality or Gini Index in Clearlake Oaks is 0.55.
What is the Total Population of Clearlake Oaks?
Total Population of Clearlake Oaks is 2,074.
What is the Total Male Population of Clearlake Oaks?
Total Male Population of Clearlake Oaks is 1,071.
What is the Total Female Population of Clearlake Oaks?
Total Female Population of Clearlake Oaks is 1,003.
What is the Ratio of Males per 100 Females in Clearlake Oaks?
There are 106.78 Males per 100 Females in Clearlake Oaks.
What is the Ratio of Females per 100 Males in Clearlake Oaks?
There are 93.65 Females per 100 Males in Clearlake Oaks.
What is the Median Population Age in Clearlake Oaks?
Median Population Age in Clearlake Oaks is 57.6 Years.
What is the Average Family Size in Clearlake Oaks
Average Family Size in Clearlake Oaks is 2.5 People.
What is the Average Household Size in Clearlake Oaks
Average Household Size in Clearlake Oaks is 1.9 People.
How Large is the Labor Force in Clearlake Oaks?
There are 736 People in the Labor Forcein in Clearlake Oaks.
What is the Percentage of People in the Labor Force in Clearlake Oaks?
40.2% of People are in the Labor Force in Clearlake Oaks.
What is the Unemployment Rate in Clearlake Oaks?
Unemployment Rate in Clearlake Oaks is 16.8%.