Hutto, TX Map & Demographics
Hutto Map
Hutto Overview
$38,974
PER CAPITA INCOME
$108,281
AVG FAMILY INCOME
$105,743
AVG HOUSEHOLD INCOME
29.6%
WAGE / INCOME GAP [ % ]
70.4¢/ $1
WAGE / INCOME GAP [ $ ]
0.32
INEQUALITY / GINI INDEX
29,498
TOTAL POPULATION
15,008
MALE POPULATION
14,490
FEMALE POPULATION
103.57
MALES / 100 FEMALES
96.55
FEMALES / 100 MALES
35.2
MEDIAN AGE
3.2
AVG FAMILY SIZE
3.0
AVG HOUSEHOLD SIZE
17,525
LABOR FORCE [ PEOPLE ]
77.3%
PERCENT IN LABOR FORCE
6.1%
UNEMPLOYMENT RATE
Hutto Zip Codes
Hutto Area Codes
Income in Hutto
Income Overview in Hutto
Per Capita Income in Hutto is $38,974, while median incomes of families and households are $108,281 and $105,743 respectively.
| Characteristic | Number | Measure |
| Per Capita Income | 29,498 | $38,974 |
| Median Family Income | 7,702 | $108,281 |
| Mean Family Income | 7,702 | $121,760 |
| Median Household Income | 9,875 | $105,743 |
| Mean Household Income | 9,875 | $117,238 |
| Income Deficit | 7,702 | $0 |
| Wage / Income Gap (%) | 29,498 | 29.58% |
| Wage / Income Gap ($) | 29,498 | 70.42¢ per $1 |
| Gini / Inequality Index | 29,498 | 0.32 |
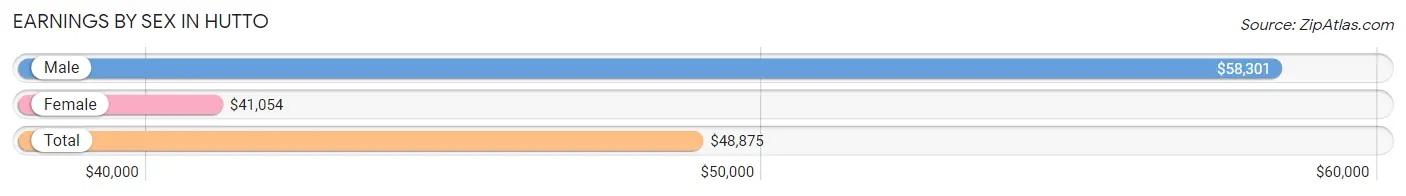
Earnings by Sex in Hutto
Average Earnings in Hutto are $48,875, $58,301 for men and $41,054 for women, a difference of 29.6%.
| Sex | Number | Average Earnings |
| Male | 9,582 (53.4%) | $58,301 |
| Female | 8,357 (46.6%) | $41,054 |
| Total | 17,939 (100.0%) | $48,875 |
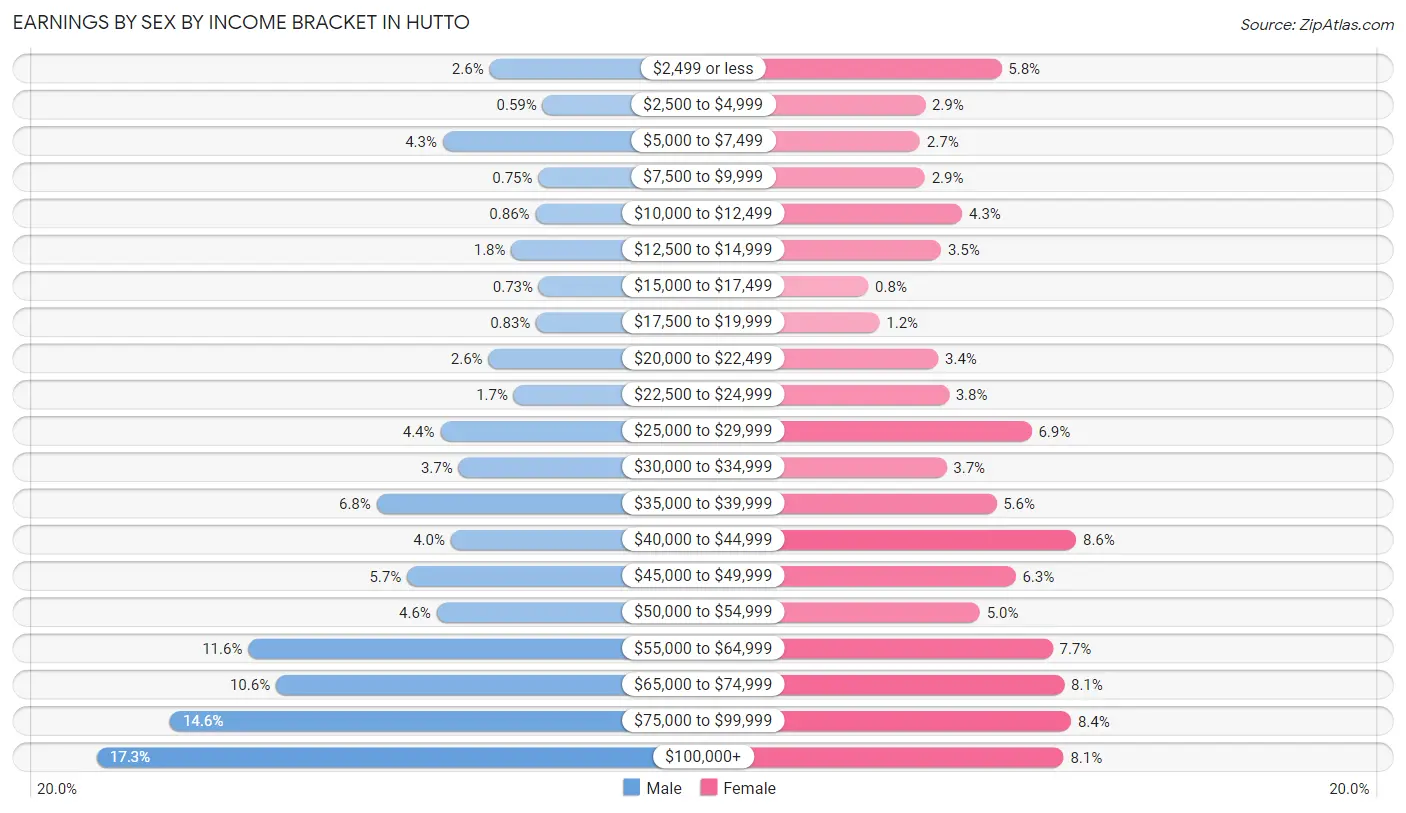
Earnings by Sex by Income Bracket in Hutto
The most common earnings brackets in Hutto are $100,000+ for men (1,657 | 17.3%) and $40,000 to $44,999 for women (718 | 8.6%).
| Income | Male | Female |
| $2,499 or less | 247 (2.6%) | 484 (5.8%) |
| $2,500 to $4,999 | 57 (0.6%) | 245 (2.9%) |
| $5,000 to $7,499 | 415 (4.3%) | 229 (2.7%) |
| $7,500 to $9,999 | 72 (0.7%) | 244 (2.9%) |
| $10,000 to $12,499 | 82 (0.9%) | 361 (4.3%) |
| $12,500 to $14,999 | 169 (1.8%) | 295 (3.5%) |
| $15,000 to $17,499 | 70 (0.7%) | 67 (0.8%) |
| $17,500 to $19,999 | 80 (0.8%) | 102 (1.2%) |
| $20,000 to $22,499 | 251 (2.6%) | 286 (3.4%) |
| $22,500 to $24,999 | 160 (1.7%) | 319 (3.8%) |
| $25,000 to $29,999 | 424 (4.4%) | 578 (6.9%) |
| $30,000 to $34,999 | 358 (3.7%) | 312 (3.7%) |
| $35,000 to $39,999 | 653 (6.8%) | 468 (5.6%) |
| $40,000 to $44,999 | 386 (4.0%) | 718 (8.6%) |
| $45,000 to $49,999 | 543 (5.7%) | 528 (6.3%) |
| $50,000 to $54,999 | 437 (4.6%) | 416 (5.0%) |
| $55,000 to $64,999 | 1,113 (11.6%) | 644 (7.7%) |
| $65,000 to $74,999 | 1,014 (10.6%) | 680 (8.1%) |
| $75,000 to $99,999 | 1,394 (14.5%) | 702 (8.4%) |
| $100,000+ | 1,657 (17.3%) | 679 (8.1%) |
| Total | 9,582 (100.0%) | 8,357 (100.0%) |
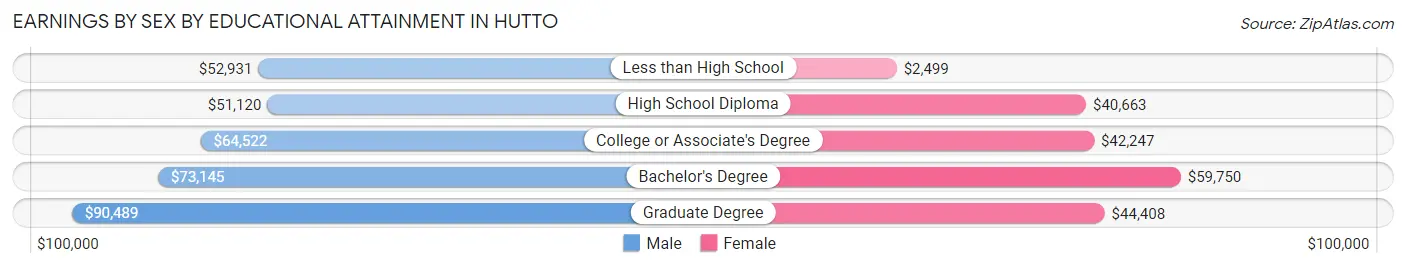
Earnings by Sex by Educational Attainment in Hutto
Average earnings in Hutto are $63,155 for men and $45,363 for women, a difference of 28.2%. Men with an educational attainment of graduate degree enjoy the highest average annual earnings of $90,489, while those with high school diploma education earn the least with $51,120. Women with an educational attainment of bachelor's degree earn the most with the average annual earnings of $59,750, while those with less than high school education have the smallest earnings of $2,499.
| Educational Attainment | Male Income | Female Income |
| Less than High School | $52,931 | $2,499 |
| High School Diploma | $51,120 | $40,663 |
| College or Associate's Degree | $64,522 | $42,247 |
| Bachelor's Degree | $73,145 | $59,750 |
| Graduate Degree | $90,489 | $44,408 |
| Total | $63,155 | $45,363 |
Family Income in Hutto
Family Income Brackets in Hutto
According to the Hutto family income data, there are 2,634 families falling into the $100,000 to $149,999 income range, which is the most common income bracket and makes up 34.2% of all families. Conversely, the $10,000 to $14,999 income bracket is the least frequent group with only 46 families (0.6%) belonging to this category.
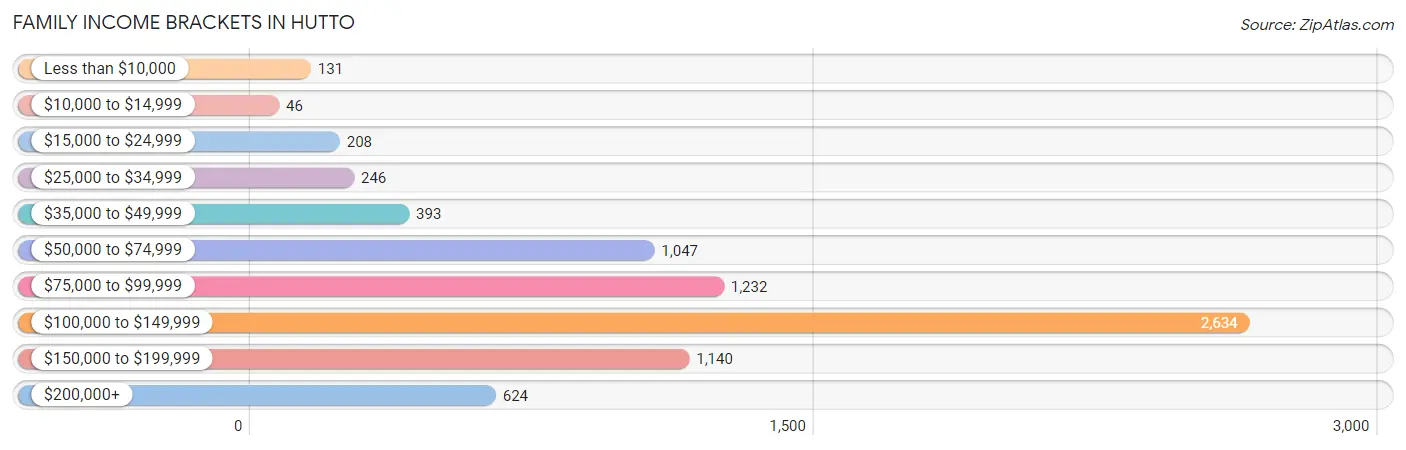
| Income Bracket | # Families | % Families |
| Less than $10,000 | 131 | 1.7% |
| $10,000 to $14,999 | 46 | 0.6% |
| $15,000 to $24,999 | 208 | 2.7% |
| $25,000 to $34,999 | 246 | 3.2% |
| $35,000 to $49,999 | 393 | 5.1% |
| $50,000 to $74,999 | 1,047 | 13.6% |
| $75,000 to $99,999 | 1,232 | 16.0% |
| $100,000 to $149,999 | 2,634 | 34.2% |
| $150,000 to $199,999 | 1,140 | 14.8% |
| $200,000+ | 624 | 8.1% |
Family Income by Famaliy Size in Hutto
6-person families (375 | 4.9%) account for the highest median family income in Hutto with $175,241 per family, while 2-person families (2,525 | 32.8%) have the highest median income of $53,553 per family member.
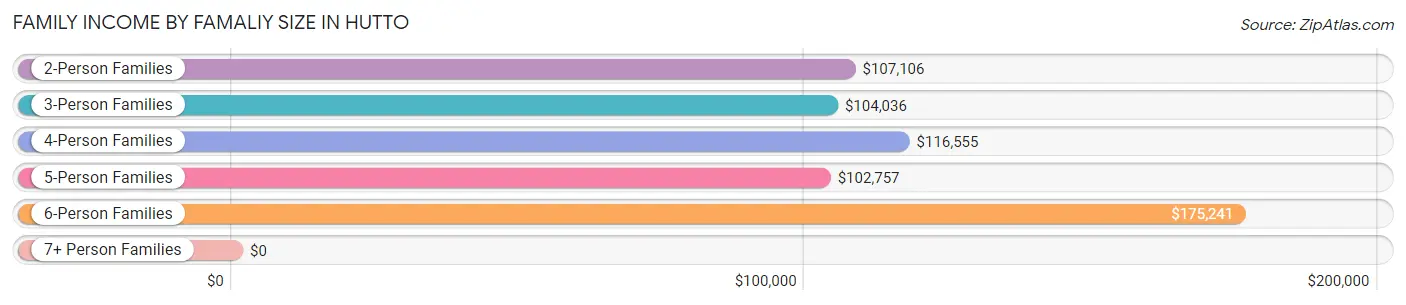
| Income Bracket | # Families | Median Income |
| 2-Person Families | 2,525 (32.8%) | $107,106 |
| 3-Person Families | 2,552 (33.1%) | $104,036 |
| 4-Person Families | 1,369 (17.8%) | $116,555 |
| 5-Person Families | 763 (9.9%) | $102,757 |
| 6-Person Families | 375 (4.9%) | $175,241 |
| 7+ Person Families | 118 (1.5%) | $0 |
| Total | 7,702 (100.0%) | $108,281 |
Family Income by Number of Earners in Hutto
The median family income in Hutto is $108,281, with families comprising 3+ earners (816) having the highest median family income of $126,747, while families with no earners (273) have the lowest median family income of $57,902, accounting for 10.6% and 3.5% of families, respectively.
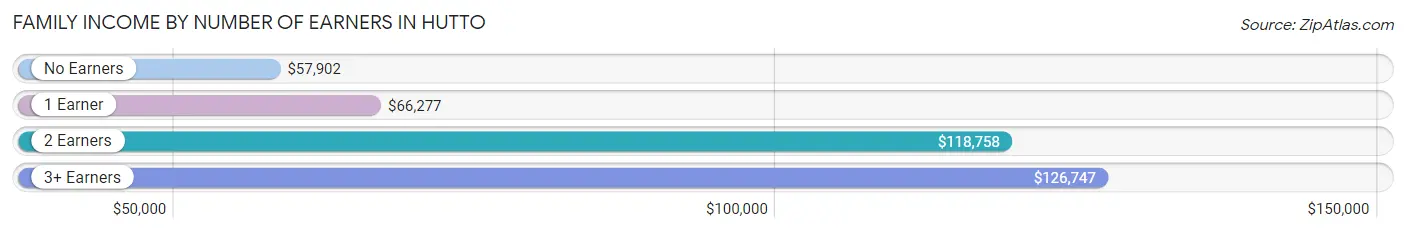
| Number of Earners | # Families | Median Income |
| No Earners | 273 (3.5%) | $57,902 |
| 1 Earner | 1,674 (21.7%) | $66,277 |
| 2 Earners | 4,939 (64.1%) | $118,758 |
| 3+ Earners | 816 (10.6%) | $126,747 |
| Total | 7,702 (100.0%) | $108,281 |
Household Income in Hutto
Household Income Brackets in Hutto
With 3,506 households falling in the category, the $100,000 to $149,999 income range is the most frequent in Hutto, accounting for 35.5% of all households. In contrast, only 59 households (0.6%) fall into the $10,000 to $14,999 income bracket, making it the least populous group.
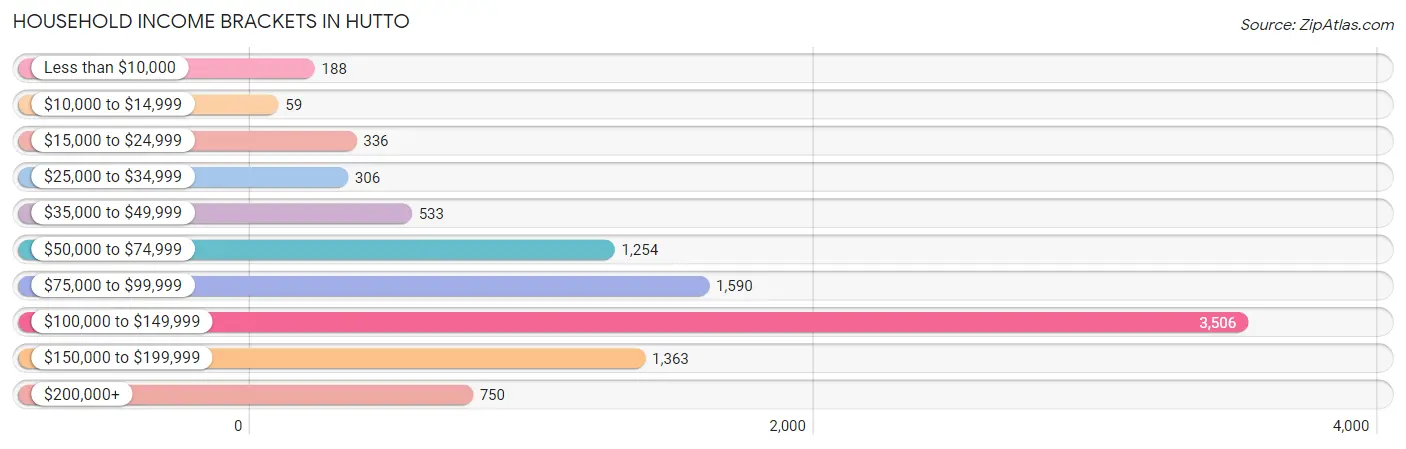
| Income Bracket | # Households | % Households |
| Less than $10,000 | 188 | 1.9% |
| $10,000 to $14,999 | 59 | 0.6% |
| $15,000 to $24,999 | 336 | 3.4% |
| $25,000 to $34,999 | 306 | 3.1% |
| $35,000 to $49,999 | 533 | 5.4% |
| $50,000 to $74,999 | 1,254 | 12.7% |
| $75,000 to $99,999 | 1,590 | 16.1% |
| $100,000 to $149,999 | 3,506 | 35.5% |
| $150,000 to $199,999 | 1,363 | 13.8% |
| $200,000+ | 750 | 7.6% |
Household Income by Householder Age in Hutto
The median household income in Hutto is $105,743, with the highest median household income of $115,188 found in the 25 to 44 years age bracket for the primary householder. A total of 5,094 households (51.6%) fall into this category. Meanwhile, the 65+ years age bracket for the primary householder has the lowest median household income of $56,063, with 977 households (9.9%) in this group.
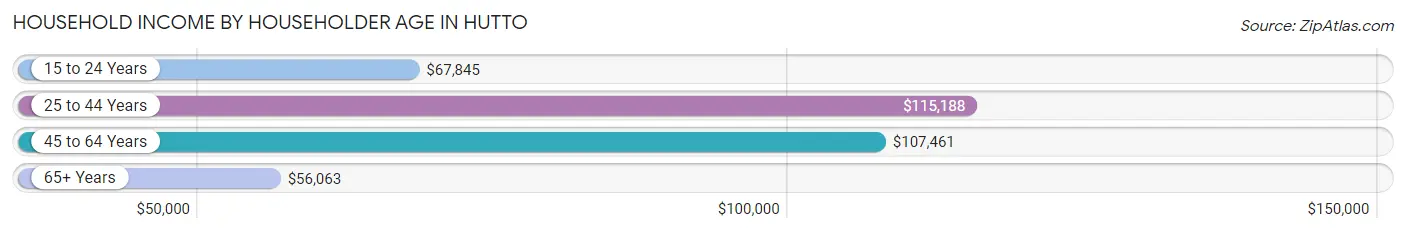
| Income Bracket | # Households | Median Income |
| 15 to 24 Years | 185 (1.9%) | $67,845 |
| 25 to 44 Years | 5,094 (51.6%) | $115,188 |
| 45 to 64 Years | 3,619 (36.6%) | $107,461 |
| 65+ Years | 977 (9.9%) | $56,063 |
| Total | 9,875 (100.0%) | $105,743 |
Poverty in Hutto
Income Below Poverty by Sex and Age in Hutto
With 8.0% poverty level for males and 7.6% for females among the residents of Hutto, 15 year old males and 5 year old females are the most vulnerable to poverty, with 106 males (33.9%) and 23 females (17.4%) in their respective age groups living below the poverty level.
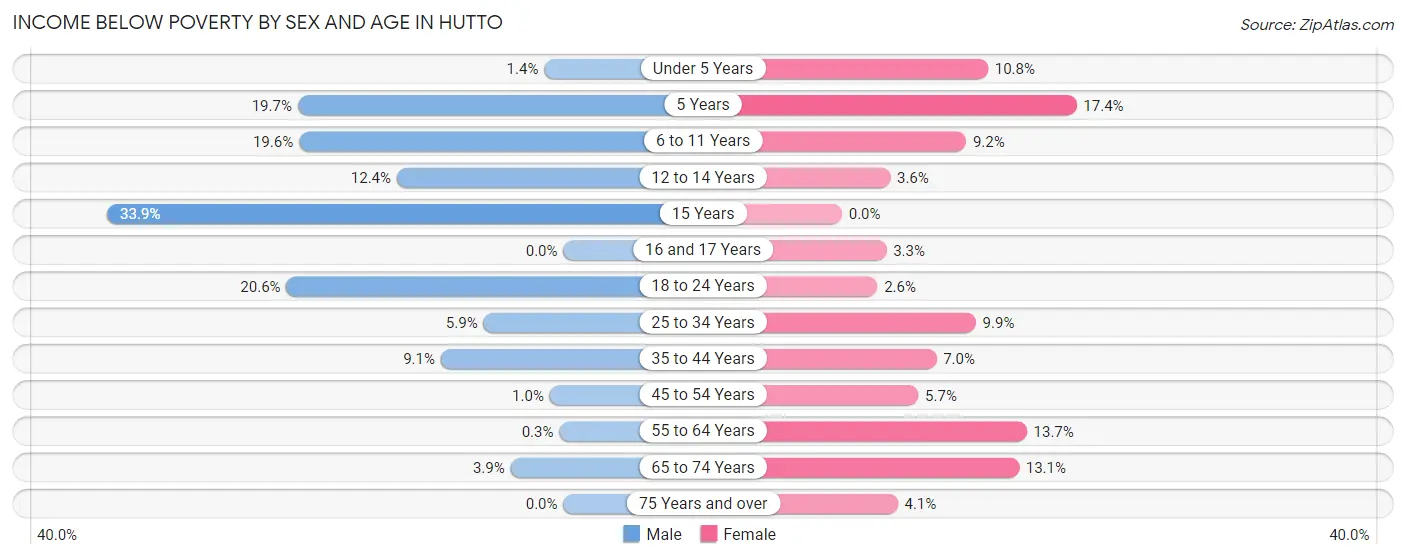
| Age Bracket | Male | Female |
| Under 5 Years | 20 (1.4%) | 76 (10.8%) |
| 5 Years | 56 (19.7%) | 23 (17.4%) |
| 6 to 11 Years | 263 (19.6%) | 102 (9.2%) |
| 12 to 14 Years | 56 (12.4%) | 26 (3.6%) |
| 15 Years | 106 (33.9%) | 0 (0.0%) |
| 16 and 17 Years | 0 (0.0%) | 17 (3.3%) |
| 18 to 24 Years | 206 (20.6%) | 37 (2.6%) |
| 25 to 34 Years | 128 (5.9%) | 233 (9.9%) |
| 35 to 44 Years | 310 (9.1%) | 212 (7.0%) |
| 45 to 54 Years | 21 (1.0%) | 122 (5.7%) |
| 55 to 64 Years | 4 (0.3%) | 139 (13.7%) |
| 65 to 74 Years | 22 (3.9%) | 90 (13.1%) |
| 75 Years and over | 0 (0.0%) | 17 (4.1%) |
| Total | 1,192 (8.0%) | 1,094 (7.6%) |
Income Above Poverty by Sex and Age in Hutto
According to the poverty statistics in Hutto, males aged 16 and 17 years and females aged 15 years are the age groups that are most secure financially, with 100.0% of males and 100.0% of females in these age groups living above the poverty line.
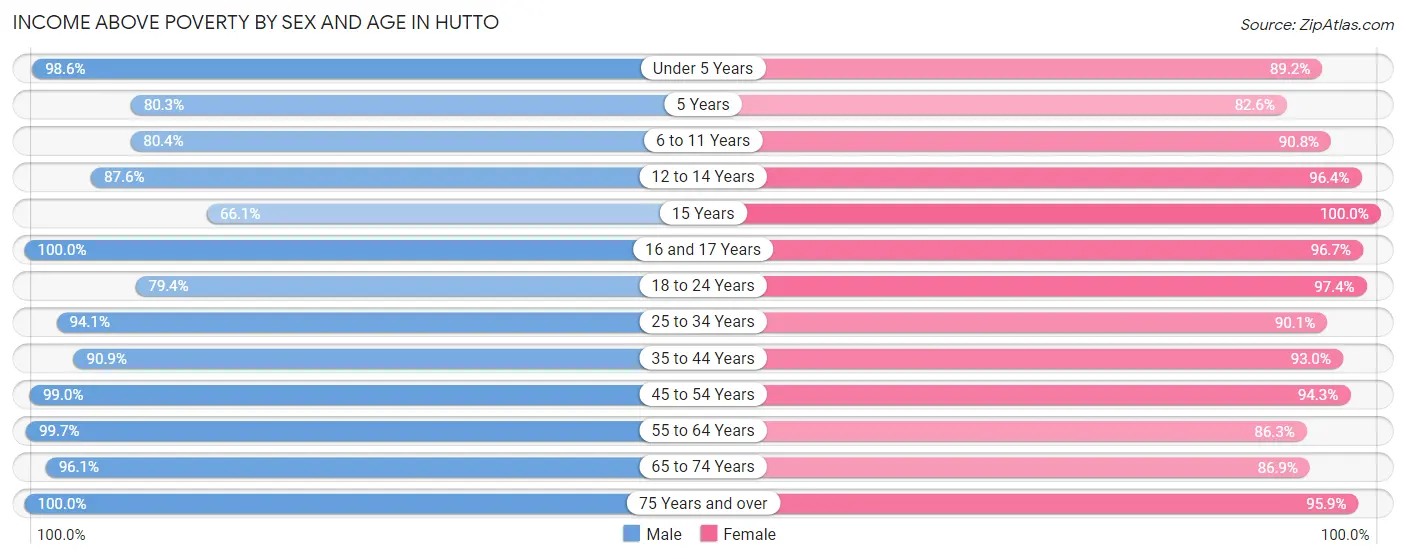
| Age Bracket | Male | Female |
| Under 5 Years | 1,390 (98.6%) | 625 (89.2%) |
| 5 Years | 228 (80.3%) | 109 (82.6%) |
| 6 to 11 Years | 1,077 (80.4%) | 1,004 (90.8%) |
| 12 to 14 Years | 397 (87.6%) | 701 (96.4%) |
| 15 Years | 207 (66.1%) | 193 (100.0%) |
| 16 and 17 Years | 419 (100.0%) | 498 (96.7%) |
| 18 to 24 Years | 796 (79.4%) | 1,371 (97.4%) |
| 25 to 34 Years | 2,030 (94.1%) | 2,110 (90.1%) |
| 35 to 44 Years | 3,097 (90.9%) | 2,813 (93.0%) |
| 45 to 54 Years | 2,065 (99.0%) | 2,029 (94.3%) |
| 55 to 64 Years | 1,311 (99.7%) | 874 (86.3%) |
| 65 to 74 Years | 539 (96.1%) | 595 (86.9%) |
| 75 Years and over | 173 (100.0%) | 394 (95.9%) |
| Total | 13,729 (92.0%) | 13,316 (92.4%) |
Income Below Poverty Among Married-Couple Families in Hutto
The poverty statistics for married-couple families in Hutto show that 2.8% or 170 of the total 5,986 families live below the poverty line. Families with 3 or 4 children have the highest poverty rate of 15.9%, comprising of 129 families. On the other hand, families with 5 or more children have the lowest poverty rate of 0.0%, which includes 0 families.
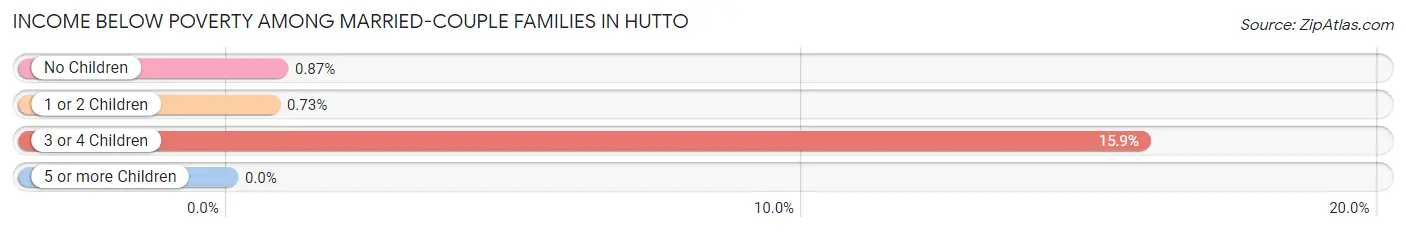
| Children | Above Poverty | Below Poverty |
| No Children | 2,399 (99.1%) | 21 (0.9%) |
| 1 or 2 Children | 2,707 (99.3%) | 20 (0.7%) |
| 3 or 4 Children | 683 (84.1%) | 129 (15.9%) |
| 5 or more Children | 27 (100.0%) | 0 (0.0%) |
| Total | 5,816 (97.2%) | 170 (2.8%) |
Income Below Poverty Among Single-Parent Households in Hutto
According to the poverty data in Hutto, 11.0% or 90 single-father households and 16.5% or 148 single-mother households are living below the poverty line. Among single-father households, those with 1 or 2 children have the highest poverty rate, with 90 households (12.6%) experiencing poverty. Likewise, among single-mother households, those with 3 or 4 children have the highest poverty rate, with 24 households (66.7%) falling below the poverty line.
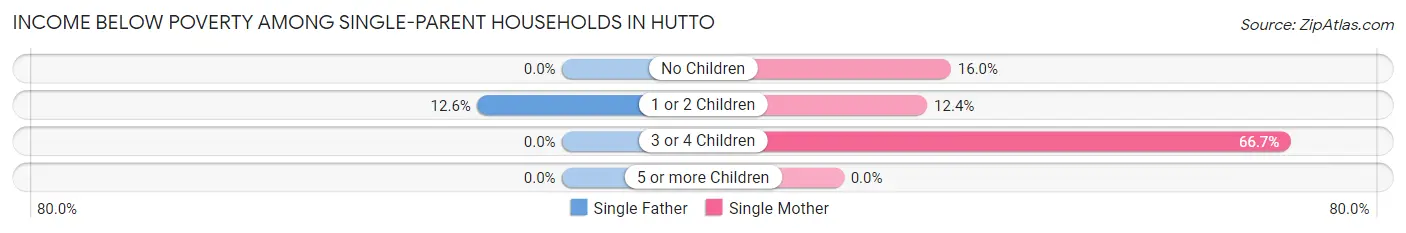
| Children | Single Father | Single Mother |
| No Children | 0 (0.0%) | 76 (16.0%) |
| 1 or 2 Children | 90 (12.6%) | 48 (12.4%) |
| 3 or 4 Children | 0 (0.0%) | 24 (66.7%) |
| 5 or more Children | 0 (0.0%) | 0 (0.0%) |
| Total | 90 (11.0%) | 148 (16.5%) |
Income Below Poverty Among Married-Couple vs Single-Parent Households in Hutto
The poverty data for Hutto shows that 170 of the married-couple family households (2.8%) and 238 of the single-parent households (13.9%) are living below the poverty level. Within the married-couple family households, those with 3 or 4 children have the highest poverty rate, with 129 households (15.9%) falling below the poverty line. Among the single-parent households, those with 3 or 4 children have the highest poverty rate, with 24 household (66.7%) living below poverty.
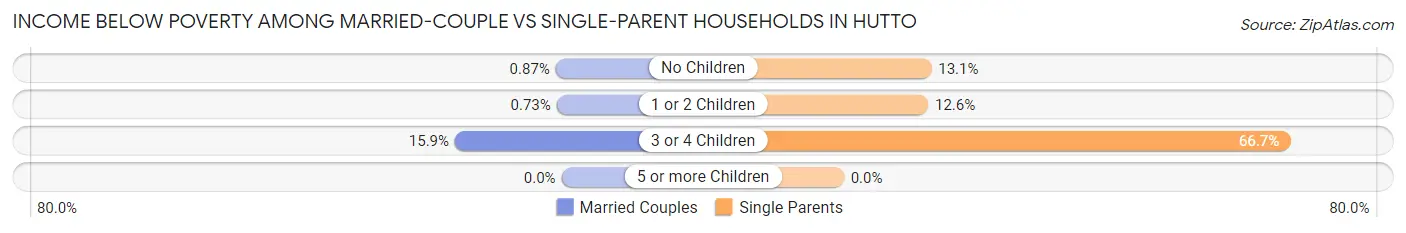
| Children | Married-Couple Families | Single-Parent Households |
| No Children | 21 (0.9%) | 76 (13.1%) |
| 1 or 2 Children | 20 (0.7%) | 138 (12.6%) |
| 3 or 4 Children | 129 (15.9%) | 24 (66.7%) |
| 5 or more Children | 0 (0.0%) | 0 (0.0%) |
| Total | 170 (2.8%) | 238 (13.9%) |
Race in Hutto
The most populous races in Hutto are White / Caucasian (19,131 | 64.9%), Hispanic or Latino (10,516 | 35.6%), and Two or more Races (4,884 | 16.6%).
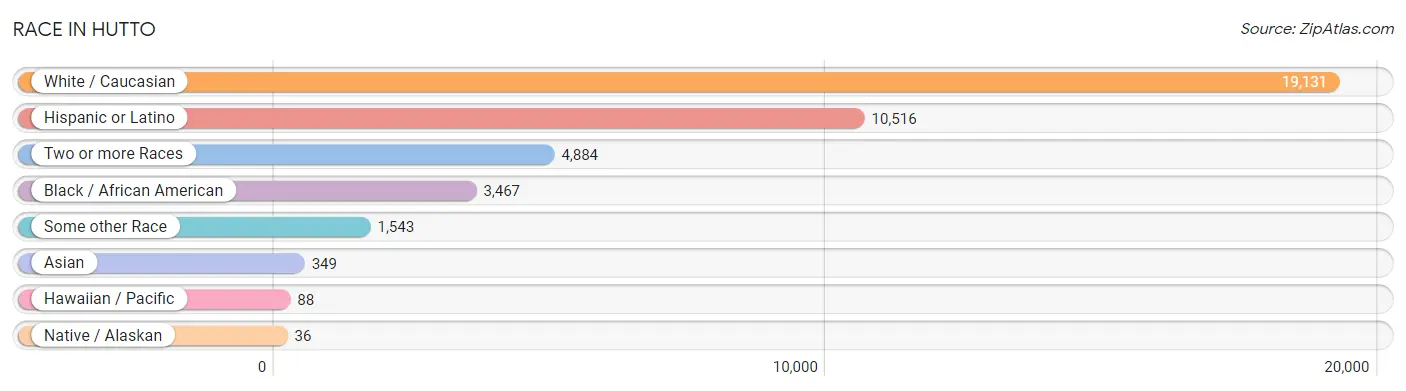
| Race | # Population | % Population |
| Asian | 349 | 1.2% |
| Black / African American | 3,467 | 11.7% |
| Hawaiian / Pacific | 88 | 0.3% |
| Hispanic or Latino | 10,516 | 35.6% |
| Native / Alaskan | 36 | 0.1% |
| White / Caucasian | 19,131 | 64.9% |
| Two or more Races | 4,884 | 16.6% |
| Some other Race | 1,543 | 5.2% |
| Total | 29,498 | 100.0% |
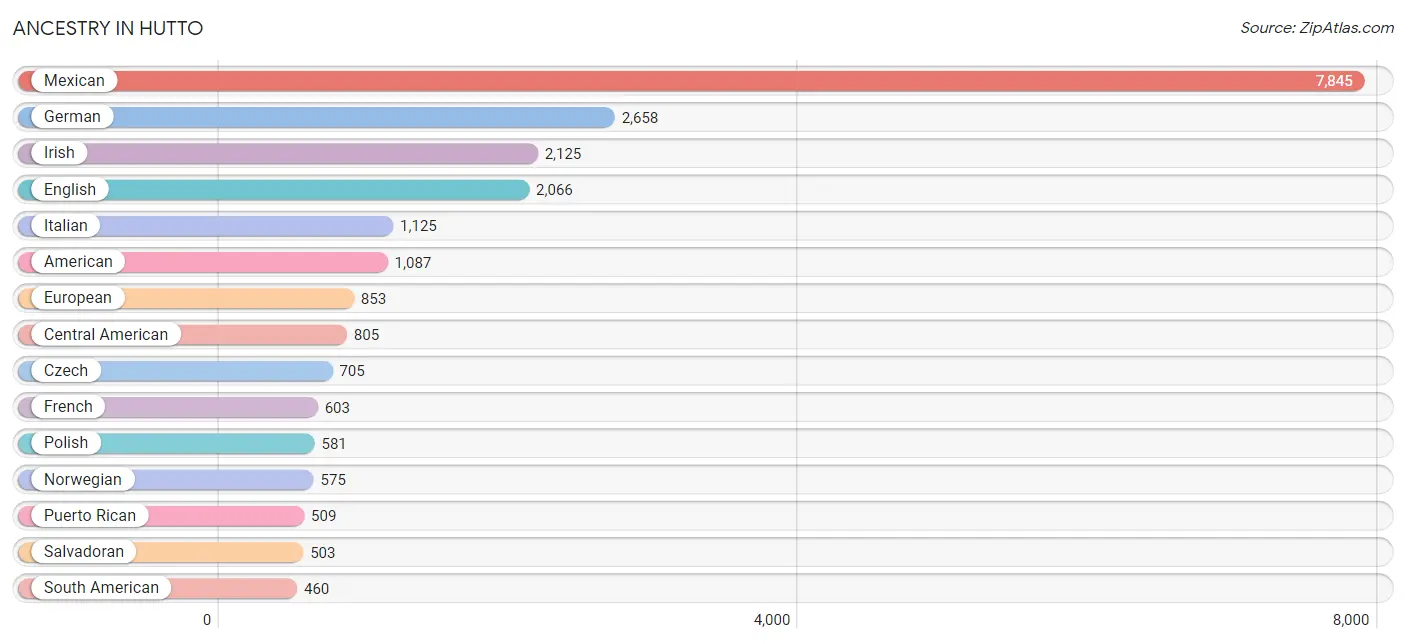
Ancestry in Hutto
The most populous ancestries reported in Hutto are Mexican (7,845 | 26.6%), German (2,658 | 9.0%), Irish (2,125 | 7.2%), English (2,066 | 7.0%), and Italian (1,125 | 3.8%), together accounting for 53.6% of all Hutto residents.
| Ancestry | # Population | % Population |
| African | 419 | 1.4% |
| American | 1,087 | 3.7% |
| Armenian | 170 | 0.6% |
| Bhutanese | 183 | 0.6% |
| Brazilian | 15 | 0.1% |
| British | 114 | 0.4% |
| Central American | 805 | 2.7% |
| Cherokee | 106 | 0.4% |
| Choctaw | 93 | 0.3% |
| Colombian | 267 | 0.9% |
| Creek | 12 | 0.0% |
| Cuban | 180 | 0.6% |
| Czech | 705 | 2.4% |
| Czechoslovakian | 49 | 0.2% |
| Danish | 150 | 0.5% |
| Dominican | 12 | 0.0% |
| Dutch | 156 | 0.5% |
| Eastern European | 79 | 0.3% |
| Ecuadorian | 158 | 0.5% |
| English | 2,066 | 7.0% |
| European | 853 | 2.9% |
| French | 603 | 2.0% |
| French Canadian | 33 | 0.1% |
| German | 2,658 | 9.0% |
| Guamanian / Chamorro | 170 | 0.6% |
| Guatemalan | 245 | 0.8% |
| Guyanese | 62 | 0.2% |
| Honduran | 38 | 0.1% |
| Hungarian | 14 | 0.1% |
| Indian (Asian) | 41 | 0.1% |
| Iranian | 79 | 0.3% |
| Irish | 2,125 | 7.2% |
| Italian | 1,125 | 3.8% |
| Jamaican | 61 | 0.2% |
| Japanese | 12 | 0.0% |
| Korean | 84 | 0.3% |
| Mexican | 7,845 | 26.6% |
| Mongolian | 101 | 0.3% |
| Native Hawaiian | 163 | 0.5% |
| Nicaraguan | 19 | 0.1% |
| Northern European | 95 | 0.3% |
| Norwegian | 575 | 1.9% |
| Peruvian | 35 | 0.1% |
| Polish | 581 | 2.0% |
| Portuguese | 22 | 0.1% |
| Puerto Rican | 509 | 1.7% |
| Romanian | 86 | 0.3% |
| Russian | 263 | 0.9% |
| Salvadoran | 503 | 1.7% |
| Scandinavian | 258 | 0.9% |
| Scotch-Irish | 162 | 0.5% |
| Scottish | 317 | 1.1% |
| Serbian | 62 | 0.2% |
| South American | 460 | 1.6% |
| Spaniard | 401 | 1.4% |
| Spanish | 178 | 0.6% |
| Sri Lankan | 72 | 0.2% |
| Subsaharan African | 419 | 1.4% |
| Swedish | 167 | 0.6% |
| Swiss | 77 | 0.3% |
| Thai | 18 | 0.1% |
| Ukrainian | 14 | 0.1% |
| Welsh | 41 | 0.1% |
| West Indian | 149 | 0.5% | View All 64 Rows |
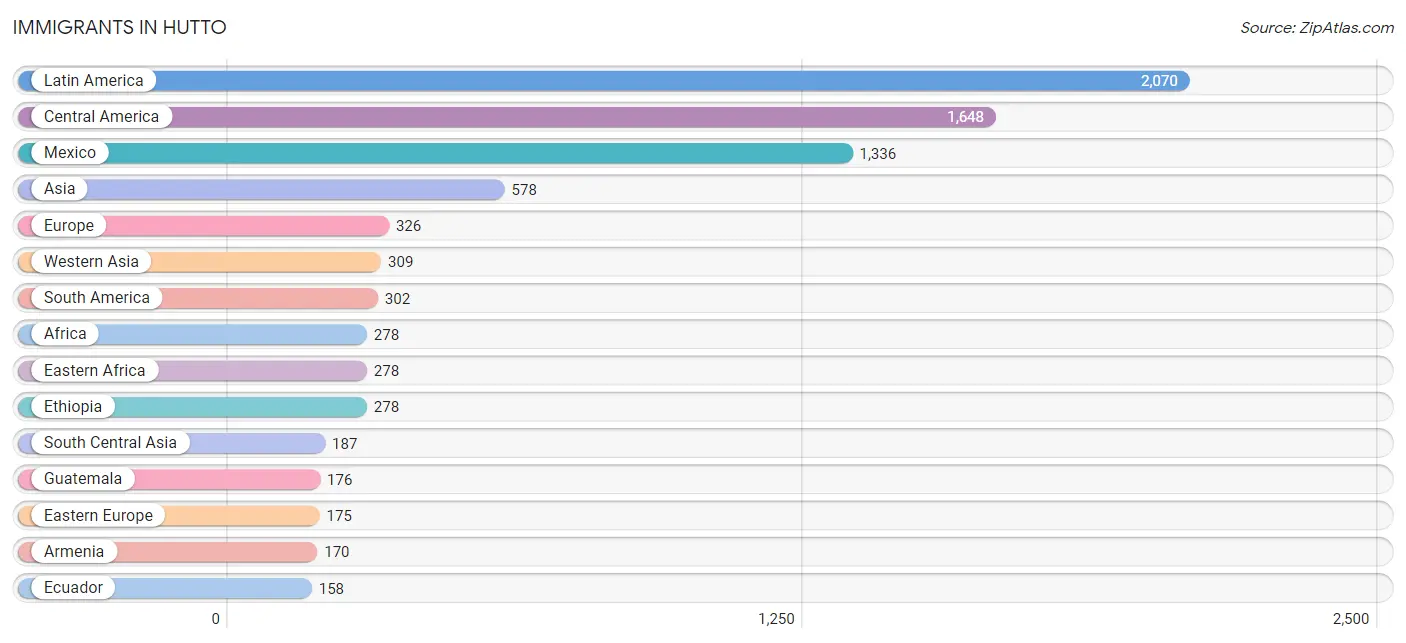
Immigrants in Hutto
The most numerous immigrant groups reported in Hutto came from Latin America (2,070 | 7.0%), Central America (1,648 | 5.6%), Mexico (1,336 | 4.5%), Asia (578 | 2.0%), and Europe (326 | 1.1%), together accounting for 20.2% of all Hutto residents.
| Immigration Origin | # Population | % Population |
| Africa | 278 | 0.9% |
| Armenia | 170 | 0.6% |
| Asia | 578 | 2.0% |
| Belize | 39 | 0.1% |
| Brazil | 15 | 0.1% |
| Caribbean | 120 | 0.4% |
| Central America | 1,648 | 5.6% |
| Colombia | 83 | 0.3% |
| Cuba | 90 | 0.3% |
| Eastern Africa | 278 | 0.9% |
| Eastern Europe | 175 | 0.6% |
| Ecuador | 158 | 0.5% |
| El Salvador | 40 | 0.1% |
| England | 34 | 0.1% |
| Ethiopia | 278 | 0.9% |
| Europe | 326 | 1.1% |
| Guatemala | 176 | 0.6% |
| Guyana | 28 | 0.1% |
| Honduras | 38 | 0.1% |
| India | 10 | 0.0% |
| Iran | 79 | 0.3% |
| Iraq | 139 | 0.5% |
| Jamaica | 30 | 0.1% |
| Latin America | 2,070 | 7.0% |
| Malaysia | 56 | 0.2% |
| Mexico | 1,336 | 4.5% |
| Moldova | 73 | 0.3% |
| Nepal | 55 | 0.2% |
| Netherlands | 61 | 0.2% |
| Nicaragua | 19 | 0.1% |
| Northern Europe | 34 | 0.1% |
| Pakistan | 43 | 0.2% |
| Peru | 18 | 0.1% |
| Russia | 102 | 0.4% |
| South America | 302 | 1.0% |
| South Central Asia | 187 | 0.6% |
| South Eastern Asia | 82 | 0.3% |
| Southern Europe | 56 | 0.2% |
| Spain | 56 | 0.2% |
| Vietnam | 26 | 0.1% |
| Western Asia | 309 | 1.1% |
| Western Europe | 61 | 0.2% | View All 42 Rows |
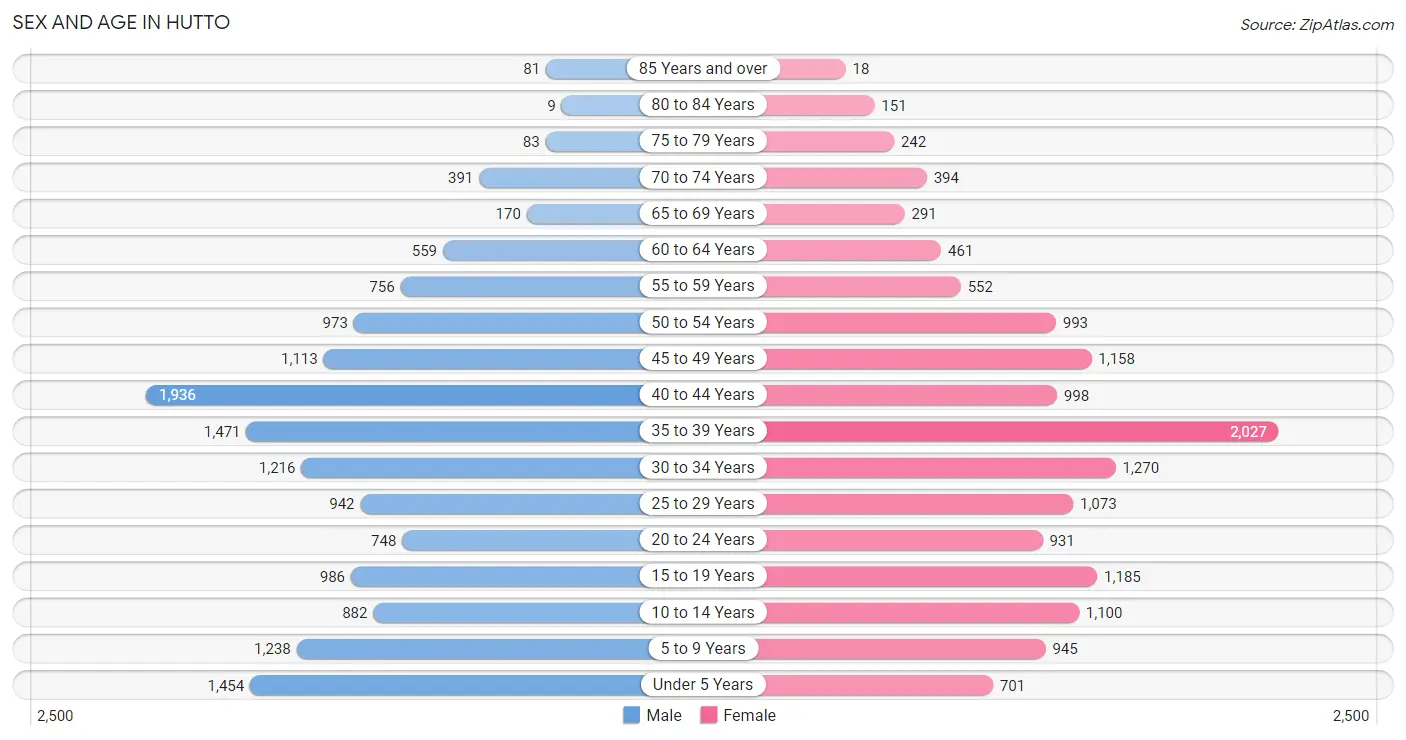
Sex and Age in Hutto
Sex and Age in Hutto
The most populous age groups in Hutto are 40 to 44 Years (1,936 | 12.9%) for men and 35 to 39 Years (2,027 | 14.0%) for women.
| Age Bracket | Male | Female |
| Under 5 Years | 1,454 (9.7%) | 701 (4.8%) |
| 5 to 9 Years | 1,238 (8.3%) | 945 (6.5%) |
| 10 to 14 Years | 882 (5.9%) | 1,100 (7.6%) |
| 15 to 19 Years | 986 (6.6%) | 1,185 (8.2%) |
| 20 to 24 Years | 748 (5.0%) | 931 (6.4%) |
| 25 to 29 Years | 942 (6.3%) | 1,073 (7.4%) |
| 30 to 34 Years | 1,216 (8.1%) | 1,270 (8.8%) |
| 35 to 39 Years | 1,471 (9.8%) | 2,027 (14.0%) |
| 40 to 44 Years | 1,936 (12.9%) | 998 (6.9%) |
| 45 to 49 Years | 1,113 (7.4%) | 1,158 (8.0%) |
| 50 to 54 Years | 973 (6.5%) | 993 (6.9%) |
| 55 to 59 Years | 756 (5.0%) | 552 (3.8%) |
| 60 to 64 Years | 559 (3.7%) | 461 (3.2%) |
| 65 to 69 Years | 170 (1.1%) | 291 (2.0%) |
| 70 to 74 Years | 391 (2.6%) | 394 (2.7%) |
| 75 to 79 Years | 83 (0.5%) | 242 (1.7%) |
| 80 to 84 Years | 9 (0.1%) | 151 (1.0%) |
| 85 Years and over | 81 (0.5%) | 18 (0.1%) |
| Total | 15,008 (100.0%) | 14,490 (100.0%) |
Families and Households in Hutto
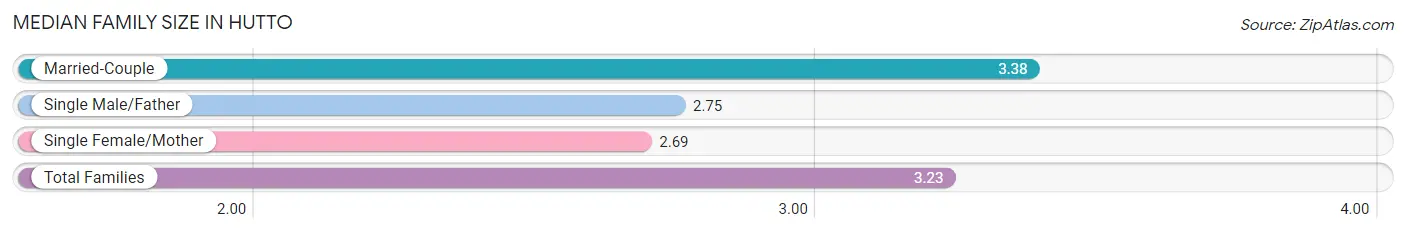
Median Family Size in Hutto
The median family size in Hutto is 3.23 persons per family, with married-couple families (5,986 | 77.7%) accounting for the largest median family size of 3.38 persons per family. On the other hand, single female/mother families (898 | 11.7%) represent the smallest median family size with 2.69 persons per family.
| Family Type | # Families | Family Size |
| Married-Couple | 5,986 (77.7%) | 3.38 |
| Single Male/Father | 818 (10.6%) | 2.75 |
| Single Female/Mother | 898 (11.7%) | 2.69 |
| Total Families | 7,702 (100.0%) | 3.23 |
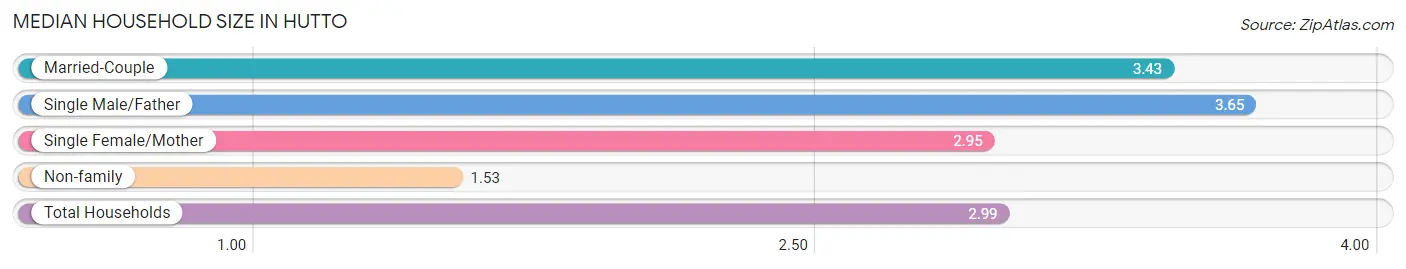
Median Household Size in Hutto
The median household size in Hutto is 2.99 persons per household, with single male/father households (818 | 8.3%) accounting for the largest median household size of 3.65 persons per household. non-family households (2,173 | 22.0%) represent the smallest median household size with 1.53 persons per household.
| Household Type | # Households | Household Size |
| Married-Couple | 5,986 (60.6%) | 3.43 |
| Single Male/Father | 818 (8.3%) | 3.65 |
| Single Female/Mother | 898 (9.1%) | 2.95 |
| Non-family | 2,173 (22.0%) | 1.53 |
| Total Households | 9,875 (100.0%) | 2.99 |
Household Size by Marriage Status in Hutto
Out of a total of 9,875 households in Hutto, 7,702 (78.0%) are family households, while 2,173 (22.0%) are nonfamily households. The most numerous type of family households are 3-person households, comprising 2,676, and the most common type of nonfamily households are 1-person households, comprising 1,419.
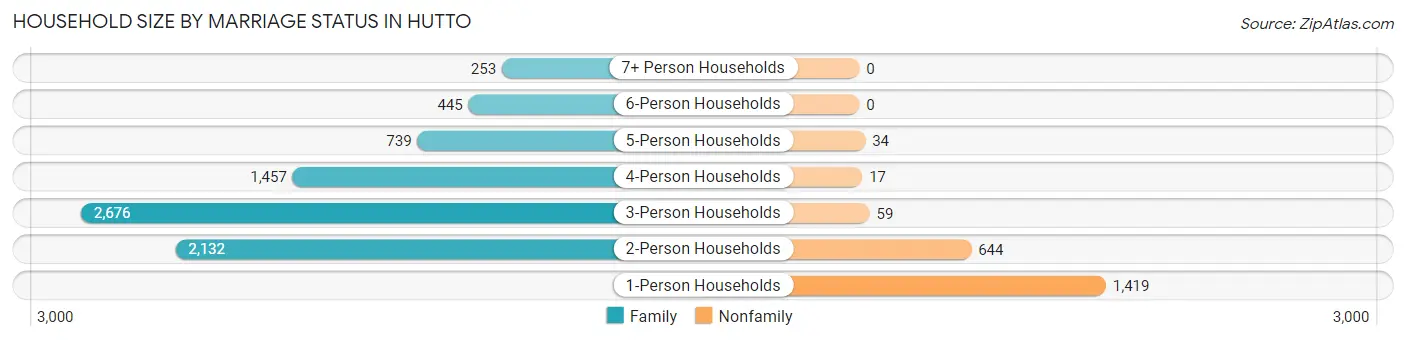
| Household Size | Family Households | Nonfamily Households |
| 1-Person Households | - | 1,419 (14.4%) |
| 2-Person Households | 2,132 (21.6%) | 644 (6.5%) |
| 3-Person Households | 2,676 (27.1%) | 59 (0.6%) |
| 4-Person Households | 1,457 (14.7%) | 17 (0.2%) |
| 5-Person Households | 739 (7.5%) | 34 (0.3%) |
| 6-Person Households | 445 (4.5%) | 0 (0.0%) |
| 7+ Person Households | 253 (2.6%) | 0 (0.0%) |
| Total | 7,702 (78.0%) | 2,173 (22.0%) |
Female Fertility in Hutto
Fertility by Age in Hutto
Average fertility rate in Hutto is 99.0 births per 1,000 women. Women in the age bracket of 20 to 34 years have the highest fertility rate with 202.0 births per 1,000 women. Women in the age bracket of 20 to 34 years acount for 73.5% of all women with births.
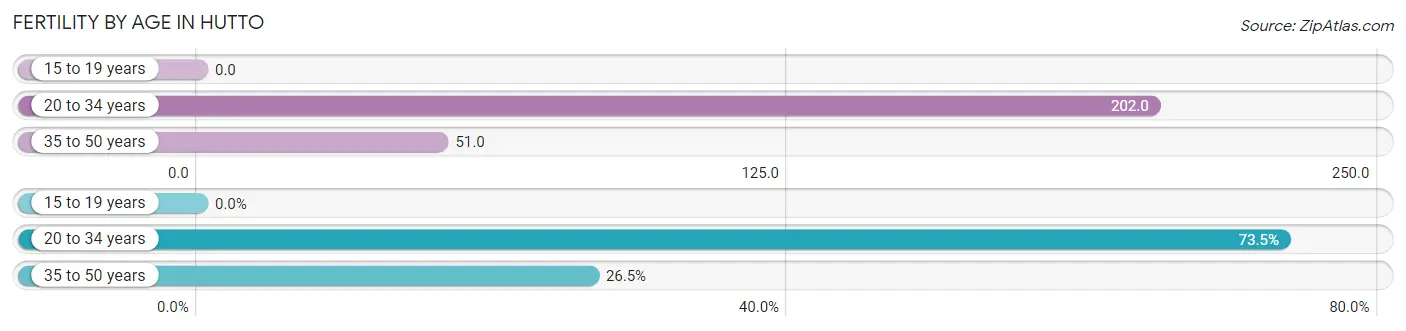
| Age Bracket | Women with Births | Births / 1,000 Women |
| 15 to 19 years | 0 (0.0%) | 0.0 |
| 20 to 34 years | 662 (73.5%) | 202.0 |
| 35 to 50 years | 239 (26.5%) | 51.0 |
| Total | 901 (100.0%) | 99.0 |
Fertility by Age by Marriage Status in Hutto
90.1% of women with births (901) in Hutto are married. The highest percentage of unmarried women with births falls into 35 to 50 years age bracket with 26.8% of them unmarried at the time of birth, while the lowest percentage of unmarried women with births belong to 20 to 34 years age bracket with 3.8% of them unmarried.
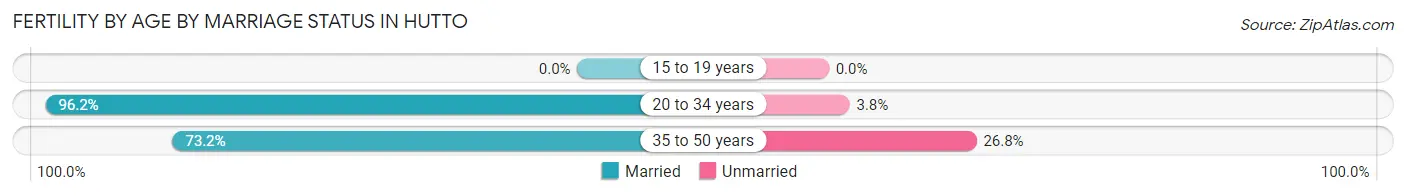
| Age Bracket | Married | Unmarried |
| 15 to 19 years | 0 (0.0%) | 0 (0.0%) |
| 20 to 34 years | 637 (96.2%) | 25 (3.8%) |
| 35 to 50 years | 175 (73.2%) | 64 (26.8%) |
| Total | 812 (90.1%) | 89 (9.9%) |
Fertility by Education in Hutto
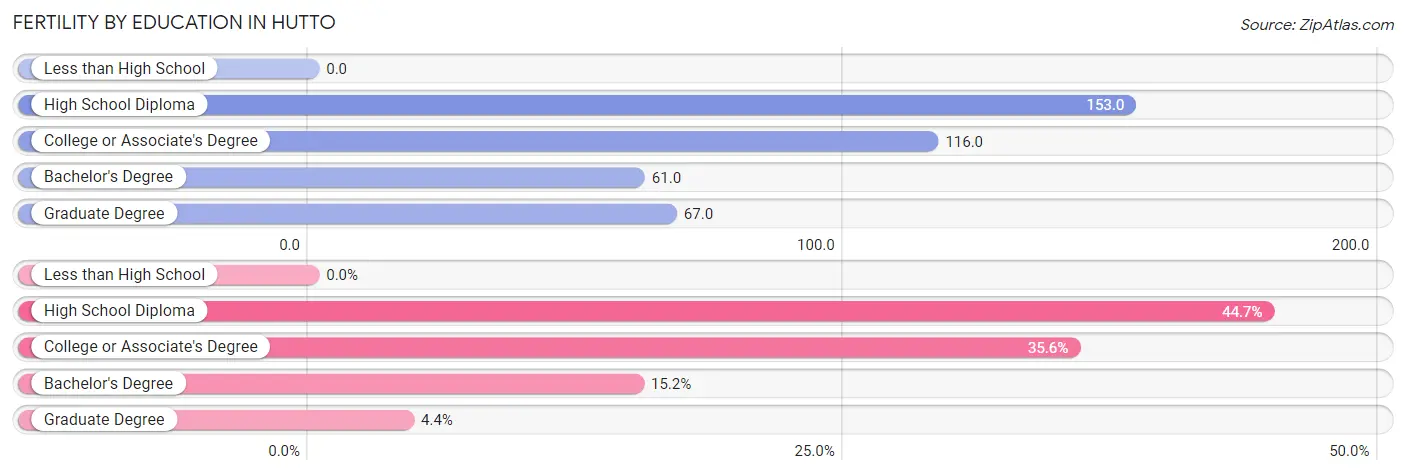
| Educational Attainment | Women with Births | Births / 1,000 Women |
| Less than High School | 0 (0.0%) | 0.0 |
| High School Diploma | 403 (44.7%) | 153.0 |
| College or Associate's Degree | 321 (35.6%) | 116.0 |
| Bachelor's Degree | 137 (15.2%) | 61.0 |
| Graduate Degree | 40 (4.4%) | 67.0 |
| Total | 901 (100.0%) | 99.0 |
Fertility by Education by Marriage Status in Hutto
9.9% of women with births in Hutto are unmarried. Women with the educational attainment of high school diploma are most likely to be married with 100.0% of them married at childbirth, while women with the educational attainment of college or associate's degree are least likely to be married with 27.7% of them unmarried at childbirth.
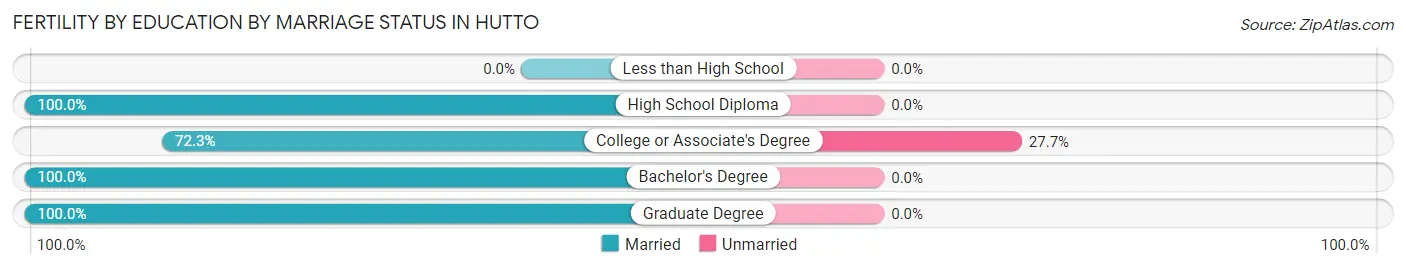
| Educational Attainment | Married | Unmarried |
| Less than High School | 0 (0.0%) | 0 (0.0%) |
| High School Diploma | 403 (100.0%) | 0 (0.0%) |
| College or Associate's Degree | 232 (72.3%) | 89 (27.7%) |
| Bachelor's Degree | 137 (100.0%) | 0 (0.0%) |
| Graduate Degree | 40 (100.0%) | 0 (0.0%) |
| Total | 812 (90.1%) | 89 (9.9%) |
Employment Characteristics in Hutto
Employment by Class of Employer in Hutto
Among the 16,046 employed individuals in Hutto, private company employees (11,414 | 71.1%), local government employees (1,201 | 7.5%), and state government employees (1,167 | 7.3%) make up the most common classes of employment.
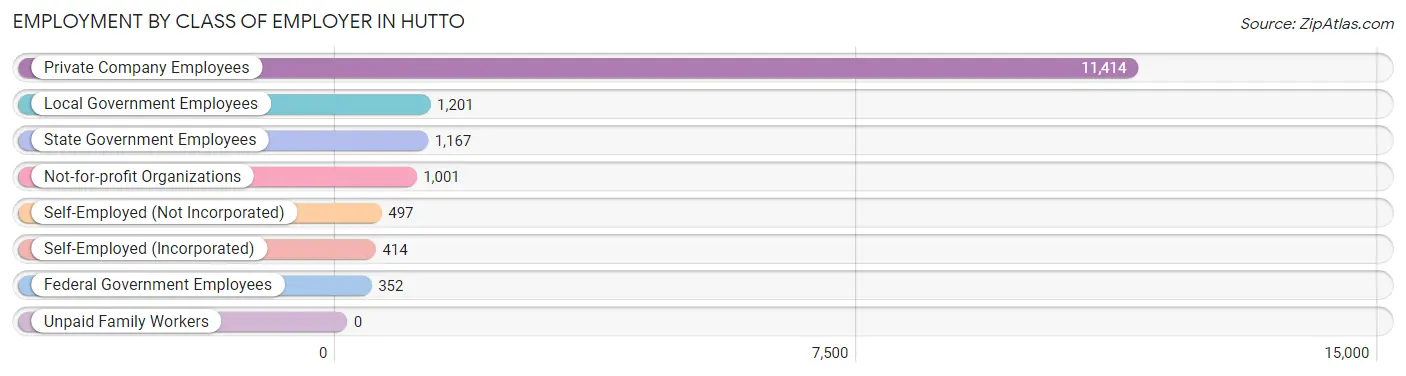
| Employer Class | # Employees | % Employees |
| Private Company Employees | 11,414 | 71.1% |
| Self-Employed (Incorporated) | 414 | 2.6% |
| Self-Employed (Not Incorporated) | 497 | 3.1% |
| Not-for-profit Organizations | 1,001 | 6.2% |
| Local Government Employees | 1,201 | 7.5% |
| State Government Employees | 1,167 | 7.3% |
| Federal Government Employees | 352 | 2.2% |
| Unpaid Family Workers | 0 | 0.0% |
| Total | 16,046 | 100.0% |
Employment Status by Age in Hutto
According to the labor force statistics for Hutto, out of the total population over 16 years of age (22,672), 77.3% or 17,525 individuals are in the labor force, with 6.1% or 1,069 of them unemployed. The age group with the highest labor force participation rate is 35 to 44 years, with 91.6% or 5,892 individuals in the labor force. Within the labor force, the 55 to 59 years age range has the highest percentage of unemployed individuals, with 19.0% or 198 of them being unemployed.
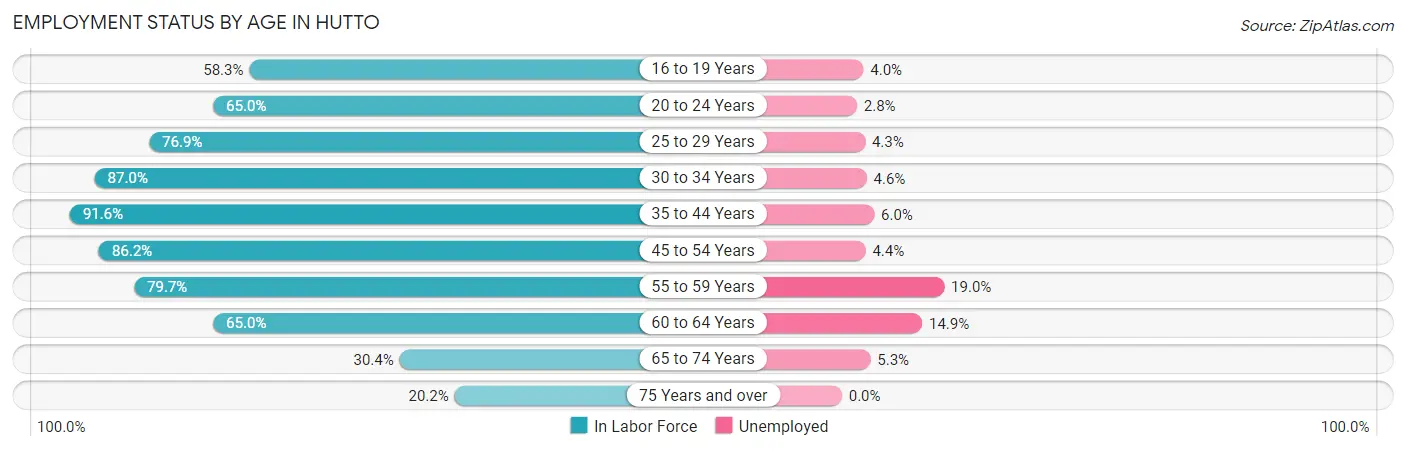
| Age Bracket | In Labor Force | Unemployed |
| 16 to 19 Years | 971 (58.3%) | 39 (4.0%) |
| 20 to 24 Years | 1,091 (65.0%) | 31 (2.8%) |
| 25 to 29 Years | 1,550 (76.9%) | 67 (4.3%) |
| 30 to 34 Years | 2,163 (87.0%) | 99 (4.6%) |
| 35 to 44 Years | 5,892 (91.6%) | 354 (6.0%) |
| 45 to 54 Years | 3,652 (86.2%) | 161 (4.4%) |
| 55 to 59 Years | 1,042 (79.7%) | 198 (19.0%) |
| 60 to 64 Years | 663 (65.0%) | 99 (14.9%) |
| 65 to 74 Years | 379 (30.4%) | 20 (5.3%) |
| 75 Years and over | 118 (20.2%) | 0 (0.0%) |
| Total | 17,525 (77.3%) | 1,069 (6.1%) |
Employment Status by Educational Attainment in Hutto
According to labor force statistics for Hutto, 85.5% of individuals (14,961) out of the total population between 25 and 64 years of age (17,498) are in the labor force, with 6.6% or 987 of them being unemployed. The group with the highest labor force participation rate are those with the educational attainment of bachelor's degree or higher, with 94.5% or 5,614 individuals in the labor force. Within the labor force, individuals with less than high school education have the highest percentage of unemployment, with 26.9% or 204 of them being unemployed.
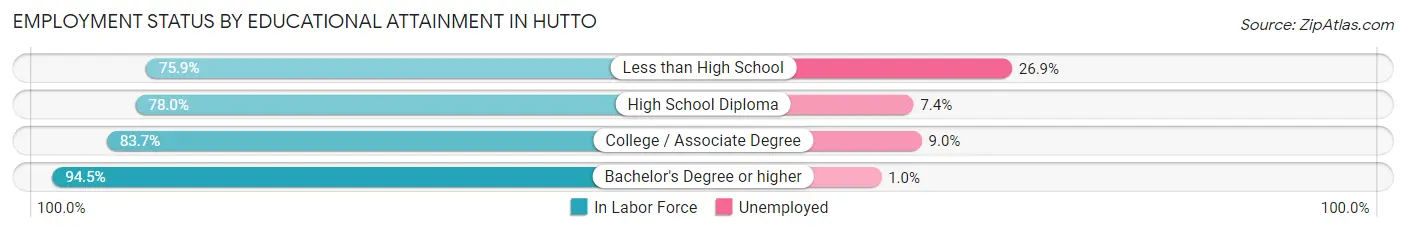
| Educational Attainment | In Labor Force | Unemployed |
| Less than High School | 757 (75.9%) | 268 (26.9%) |
| High School Diploma | 3,450 (78.0%) | 327 (7.4%) |
| College / Associate Degree | 5,137 (83.7%) | 552 (9.0%) |
| Bachelor's Degree or higher | 5,614 (94.5%) | 59 (1.0%) |
| Total | 14,961 (85.5%) | 1,155 (6.6%) |
Employment Occupations by Sex in Hutto
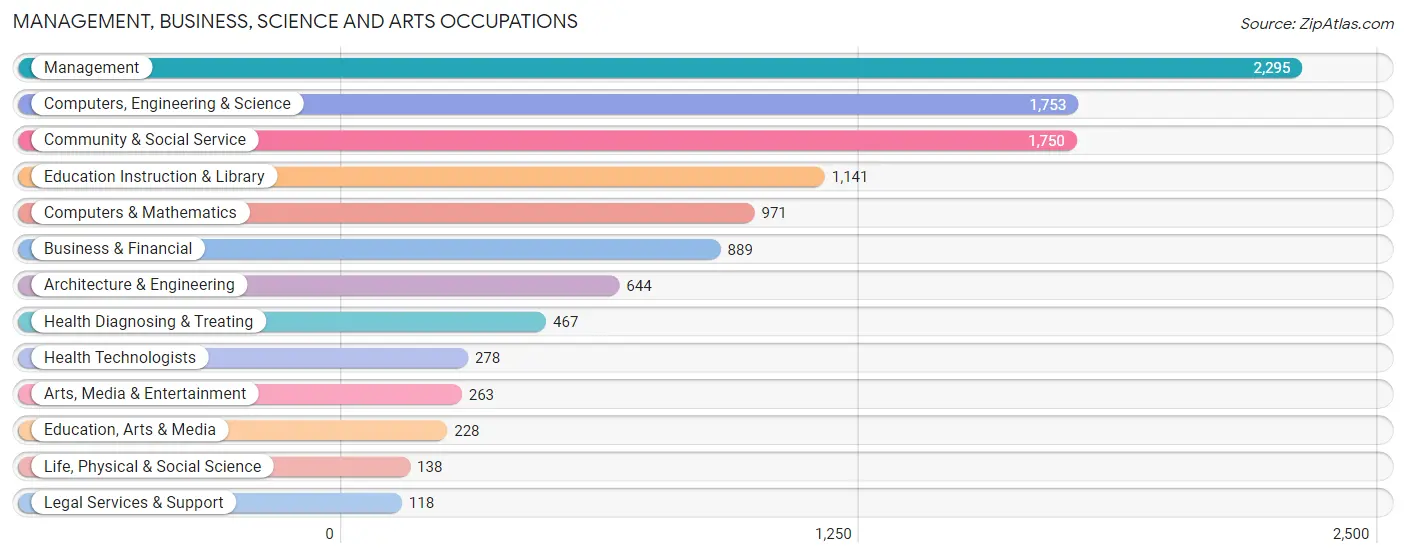
Management, Business, Science and Arts Occupations
The most common Management, Business, Science and Arts occupations in Hutto are Management (2,295 | 14.0%), Computers, Engineering & Science (1,753 | 10.7%), Community & Social Service (1,750 | 10.7%), Education Instruction & Library (1,141 | 7.0%), and Computers & Mathematics (971 | 5.9%).
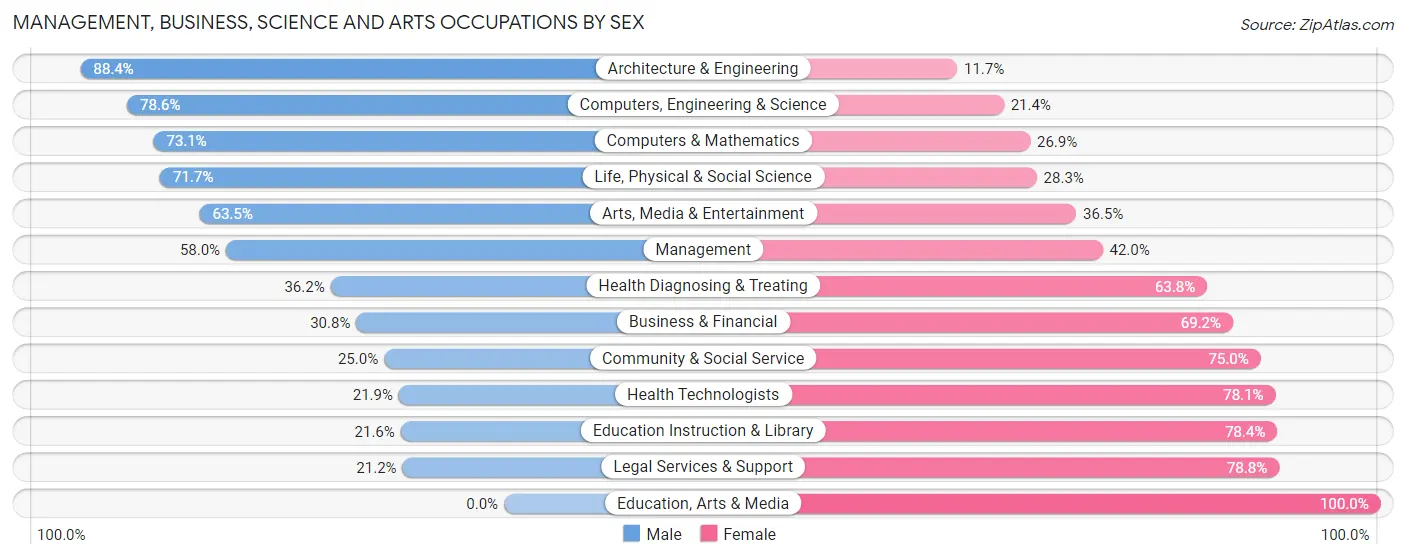
Management, Business, Science and Arts Occupations by Sex
Within the Management, Business, Science and Arts occupations in Hutto, the most male-oriented occupations are Architecture & Engineering (88.3%), Computers, Engineering & Science (78.6%), and Computers & Mathematics (73.1%), while the most female-oriented occupations are Education, Arts & Media (100.0%), Legal Services & Support (78.8%), and Education Instruction & Library (78.4%).
| Occupation | Male | Female |
| Management | 1,331 (58.0%) | 964 (42.0%) |
| Business & Financial | 274 (30.8%) | 615 (69.2%) |
| Computers, Engineering & Science | 1,378 (78.6%) | 375 (21.4%) |
| Computers & Mathematics | 710 (73.1%) | 261 (26.9%) |
| Architecture & Engineering | 569 (88.3%) | 75 (11.7%) |
| Life, Physical & Social Science | 99 (71.7%) | 39 (28.3%) |
| Community & Social Service | 438 (25.0%) | 1,312 (75.0%) |
| Education, Arts & Media | 0 (0.0%) | 228 (100.0%) |
| Legal Services & Support | 25 (21.2%) | 93 (78.8%) |
| Education Instruction & Library | 246 (21.6%) | 895 (78.4%) |
| Arts, Media & Entertainment | 167 (63.5%) | 96 (36.5%) |
| Health Diagnosing & Treating | 169 (36.2%) | 298 (63.8%) |
| Health Technologists | 61 (21.9%) | 217 (78.1%) |
| Total (Category) | 3,590 (50.2%) | 3,564 (49.8%) |
| Total (Overall) | 8,667 (53.0%) | 7,684 (47.0%) |
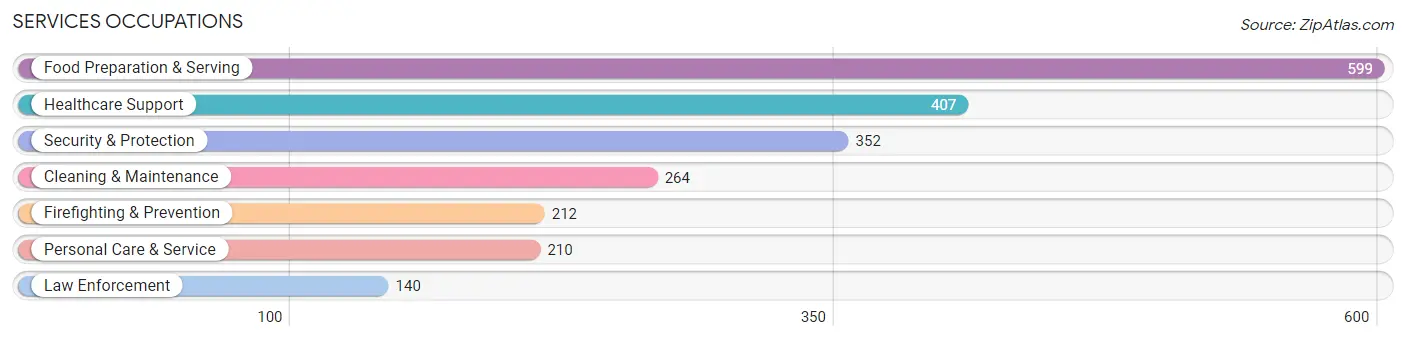
Services Occupations
The most common Services occupations in Hutto are Food Preparation & Serving (599 | 3.7%), Healthcare Support (407 | 2.5%), Security & Protection (352 | 2.1%), Cleaning & Maintenance (264 | 1.6%), and Firefighting & Prevention (212 | 1.3%).
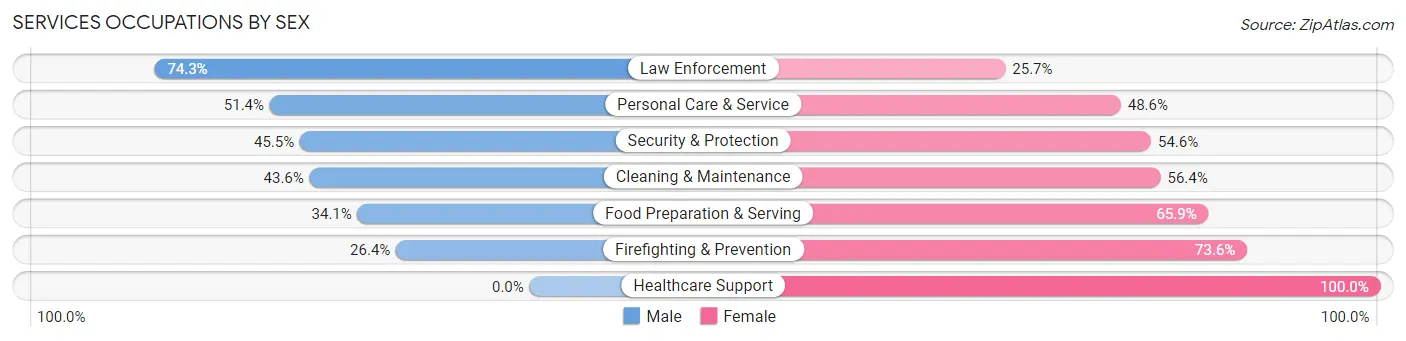
Services Occupations by Sex
Within the Services occupations in Hutto, the most male-oriented occupations are Law Enforcement (74.3%), Personal Care & Service (51.4%), and Security & Protection (45.5%), while the most female-oriented occupations are Healthcare Support (100.0%), Firefighting & Prevention (73.6%), and Food Preparation & Serving (65.9%).
| Occupation | Male | Female |
| Healthcare Support | 0 (0.0%) | 407 (100.0%) |
| Security & Protection | 160 (45.5%) | 192 (54.5%) |
| Firefighting & Prevention | 56 (26.4%) | 156 (73.6%) |
| Law Enforcement | 104 (74.3%) | 36 (25.7%) |
| Food Preparation & Serving | 204 (34.1%) | 395 (65.9%) |
| Cleaning & Maintenance | 115 (43.6%) | 149 (56.4%) |
| Personal Care & Service | 108 (51.4%) | 102 (48.6%) |
| Total (Category) | 587 (32.0%) | 1,245 (68.0%) |
| Total (Overall) | 8,667 (53.0%) | 7,684 (47.0%) |
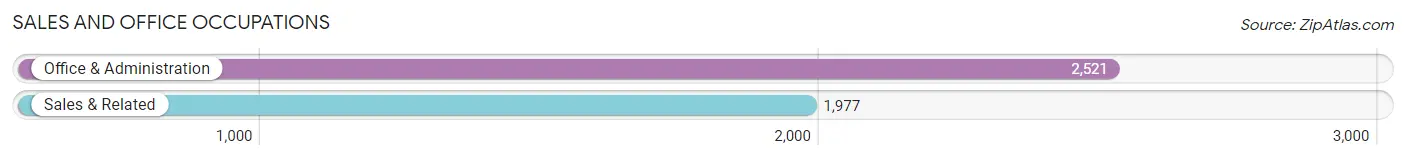
Sales and Office Occupations
The most common Sales and Office occupations in Hutto are Office & Administration (2,521 | 15.4%), and Sales & Related (1,977 | 12.1%).
Sales and Office Occupations by Sex
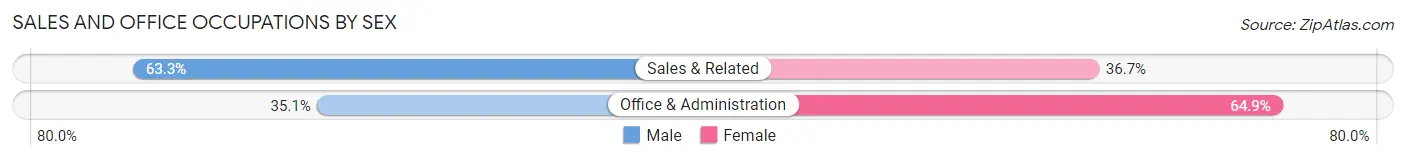
| Occupation | Male | Female |
| Sales & Related | 1,252 (63.3%) | 725 (36.7%) |
| Office & Administration | 884 (35.1%) | 1,637 (64.9%) |
| Total (Category) | 2,136 (47.5%) | 2,362 (52.5%) |
| Total (Overall) | 8,667 (53.0%) | 7,684 (47.0%) |
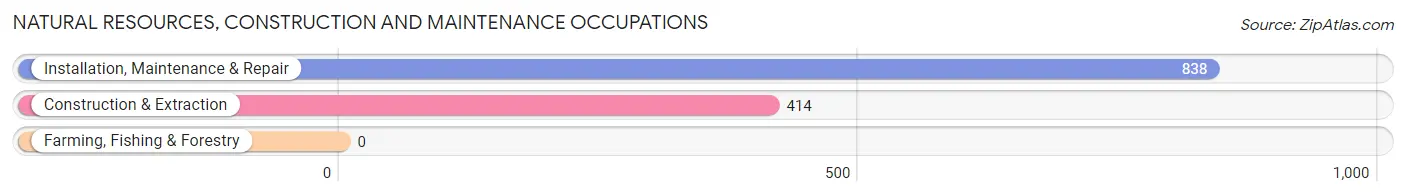
Natural Resources, Construction and Maintenance Occupations
The most common Natural Resources, Construction and Maintenance occupations in Hutto are Installation, Maintenance & Repair (838 | 5.1%), and Construction & Extraction (414 | 2.5%).
Natural Resources, Construction and Maintenance Occupations by Sex
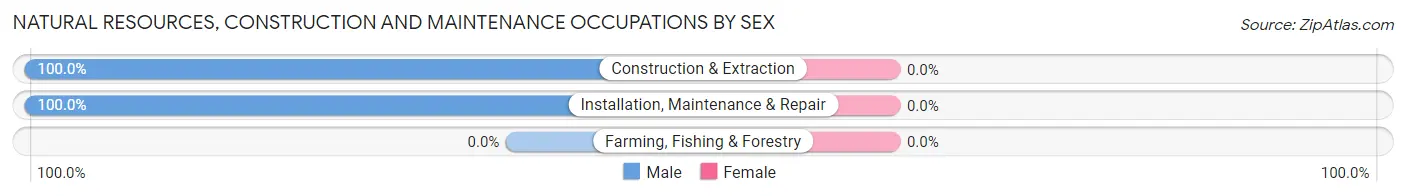
| Occupation | Male | Female |
| Farming, Fishing & Forestry | 0 (0.0%) | 0 (0.0%) |
| Construction & Extraction | 414 (100.0%) | 0 (0.0%) |
| Installation, Maintenance & Repair | 838 (100.0%) | 0 (0.0%) |
| Total (Category) | 1,252 (100.0%) | 0 (0.0%) |
| Total (Overall) | 8,667 (53.0%) | 7,684 (47.0%) |
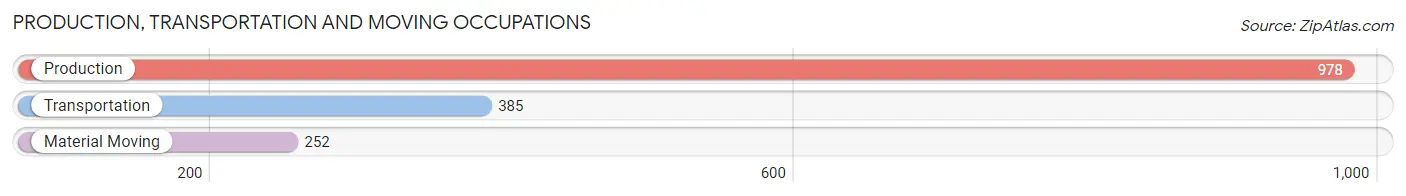
Production, Transportation and Moving Occupations
The most common Production, Transportation and Moving occupations in Hutto are Production (978 | 6.0%), Transportation (385 | 2.4%), and Material Moving (252 | 1.5%).
Production, Transportation and Moving Occupations by Sex
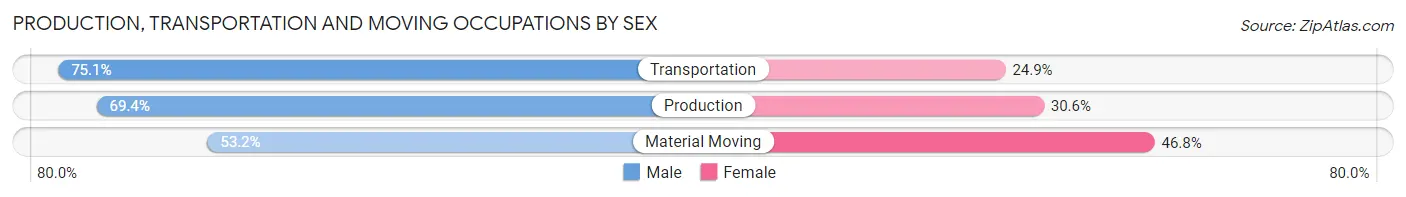
| Occupation | Male | Female |
| Production | 679 (69.4%) | 299 (30.6%) |
| Transportation | 289 (75.1%) | 96 (24.9%) |
| Material Moving | 134 (53.2%) | 118 (46.8%) |
| Total (Category) | 1,102 (68.2%) | 513 (31.8%) |
| Total (Overall) | 8,667 (53.0%) | 7,684 (47.0%) |
Employment Industries by Sex in Hutto
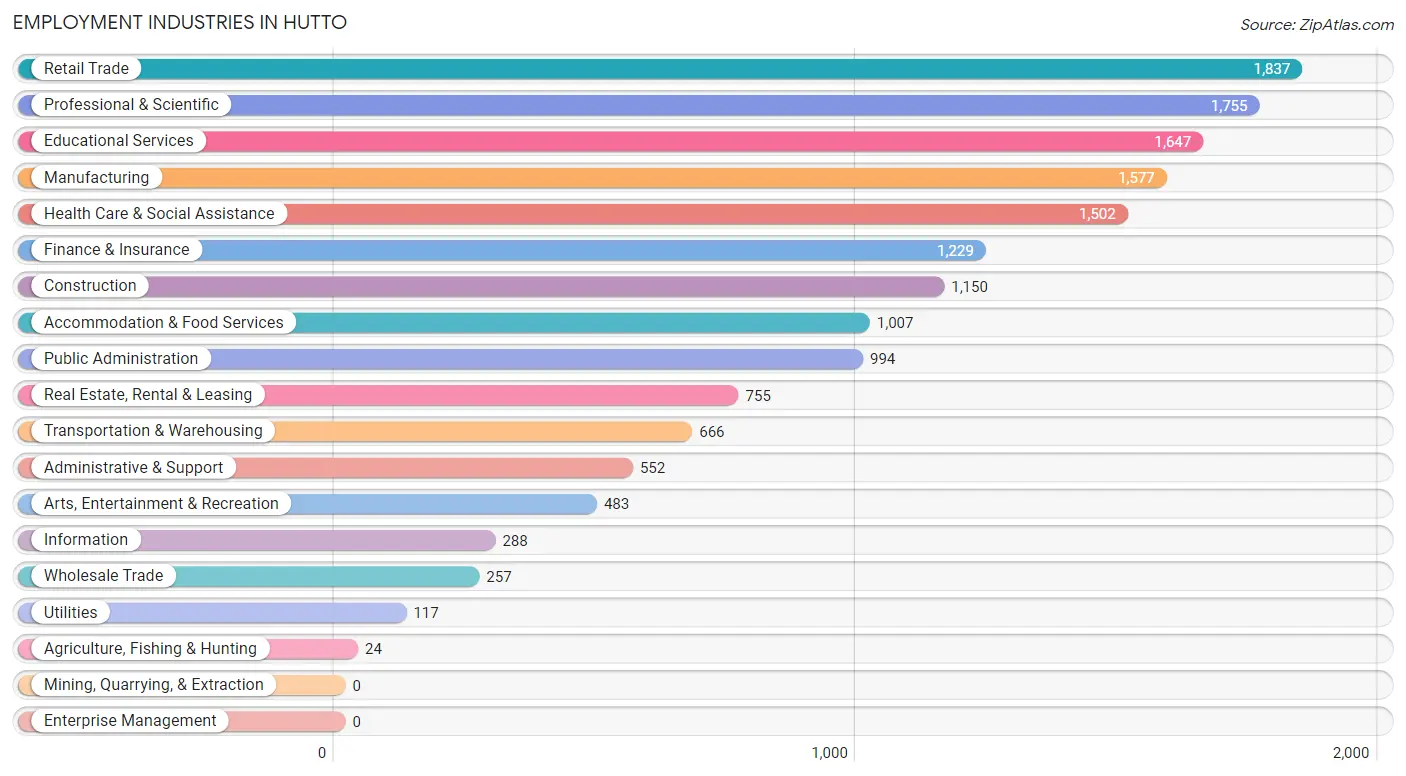
Employment Industries in Hutto
The major employment industries in Hutto include Retail Trade (1,837 | 11.2%), Professional & Scientific (1,755 | 10.7%), Educational Services (1,647 | 10.1%), Manufacturing (1,577 | 9.6%), and Health Care & Social Assistance (1,502 | 9.2%).
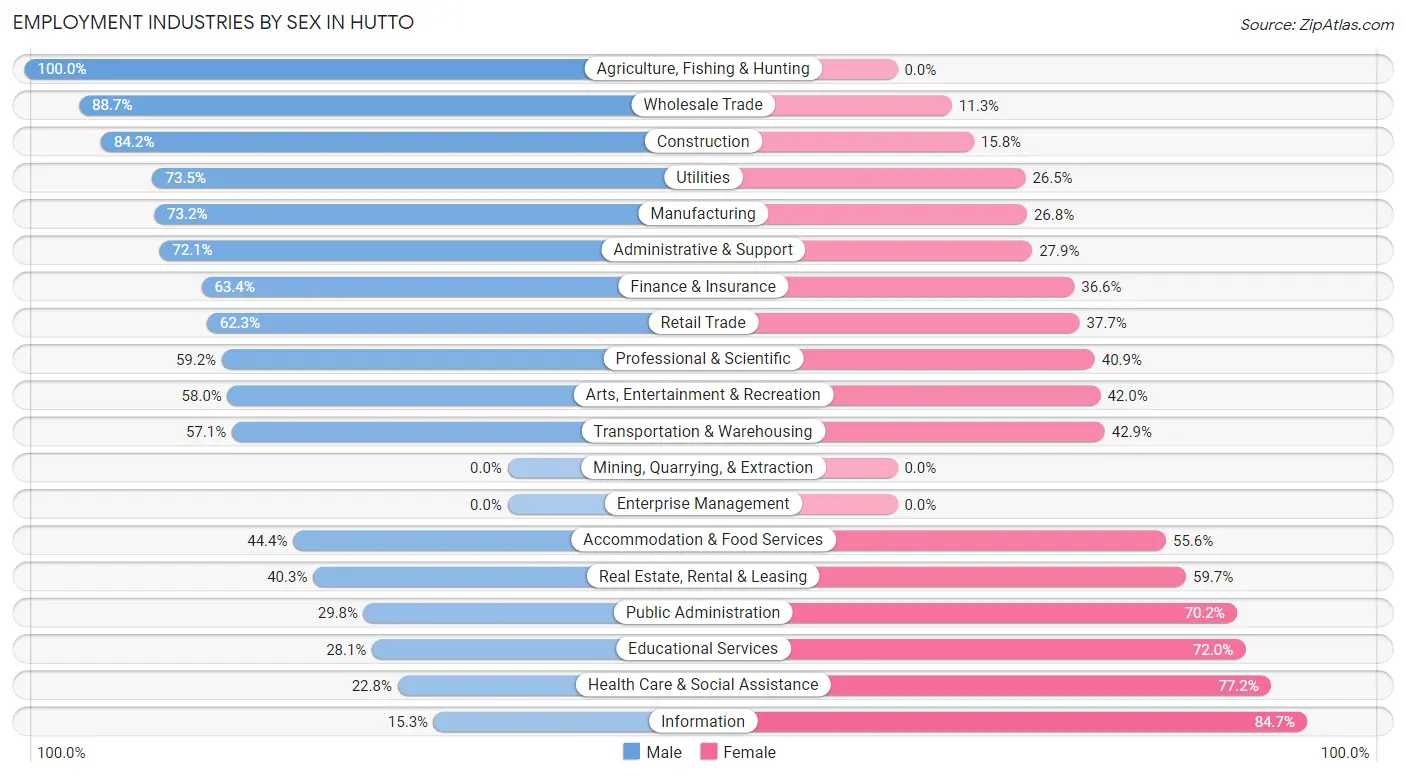
Employment Industries by Sex in Hutto
The Hutto industries that see more men than women are Agriculture, Fishing & Hunting (100.0%), Wholesale Trade (88.7%), and Construction (84.2%), whereas the industries that tend to have a higher number of women are Information (84.7%), Health Care & Social Assistance (77.2%), and Educational Services (72.0%).
| Industry | Male | Female |
| Agriculture, Fishing & Hunting | 24 (100.0%) | 0 (0.0%) |
| Mining, Quarrying, & Extraction | 0 (0.0%) | 0 (0.0%) |
| Construction | 968 (84.2%) | 182 (15.8%) |
| Manufacturing | 1,154 (73.2%) | 423 (26.8%) |
| Wholesale Trade | 228 (88.7%) | 29 (11.3%) |
| Retail Trade | 1,144 (62.3%) | 693 (37.7%) |
| Transportation & Warehousing | 380 (57.1%) | 286 (42.9%) |
| Utilities | 86 (73.5%) | 31 (26.5%) |
| Information | 44 (15.3%) | 244 (84.7%) |
| Finance & Insurance | 779 (63.4%) | 450 (36.6%) |
| Real Estate, Rental & Leasing | 304 (40.3%) | 451 (59.7%) |
| Professional & Scientific | 1,038 (59.2%) | 717 (40.8%) |
| Enterprise Management | 0 (0.0%) | 0 (0.0%) |
| Administrative & Support | 398 (72.1%) | 154 (27.9%) |
| Educational Services | 462 (28.1%) | 1,185 (72.0%) |
| Health Care & Social Assistance | 342 (22.8%) | 1,160 (77.2%) |
| Arts, Entertainment & Recreation | 280 (58.0%) | 203 (42.0%) |
| Accommodation & Food Services | 447 (44.4%) | 560 (55.6%) |
| Public Administration | 296 (29.8%) | 698 (70.2%) |
| Total | 8,667 (53.0%) | 7,684 (47.0%) |
Education in Hutto
School Enrollment in Hutto
The most common levels of schooling among the 8,369 students in Hutto are college / undergraduate (2,124 | 25.4%), elementary school (1,740 | 20.8%), and high school (1,618 | 19.3%).
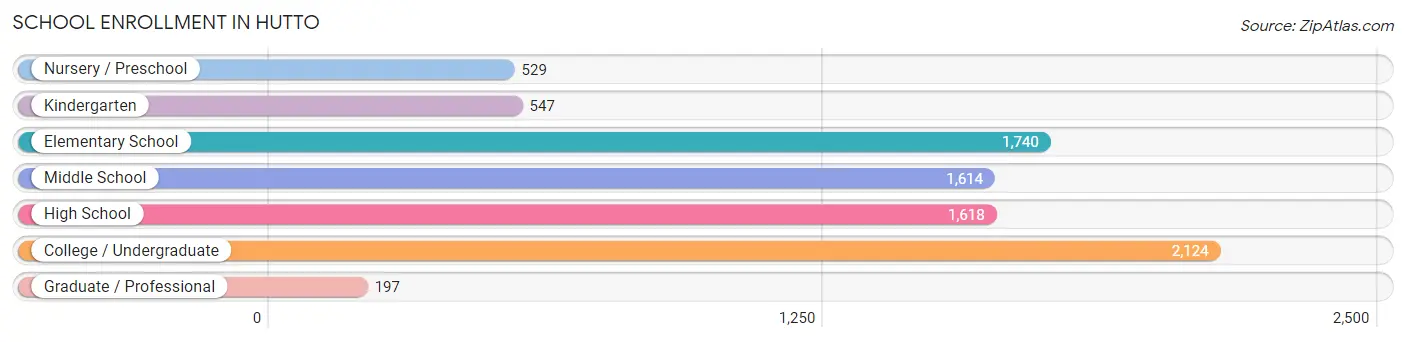
| School Level | # Students | % Students |
| Nursery / Preschool | 529 | 6.3% |
| Kindergarten | 547 | 6.5% |
| Elementary School | 1,740 | 20.8% |
| Middle School | 1,614 | 19.3% |
| High School | 1,618 | 19.3% |
| College / Undergraduate | 2,124 | 25.4% |
| Graduate / Professional | 197 | 2.4% |
| Total | 8,369 | 100.0% |
School Enrollment by Age by Funding Source in Hutto
Out of a total of 8,369 students who are enrolled in schools in Hutto, 1,448 (17.3%) attend a private institution, while the remaining 6,921 (82.7%) are enrolled in public schools. The age group of 3 to 4 year olds has the highest likelihood of being enrolled in private schools, with 228 (55.5% in the age bracket) enrolled. Conversely, the age group of 18 to 19 year olds has the lowest likelihood of being enrolled in a private school, with 485 (100.0% in the age bracket) attending a public institution.
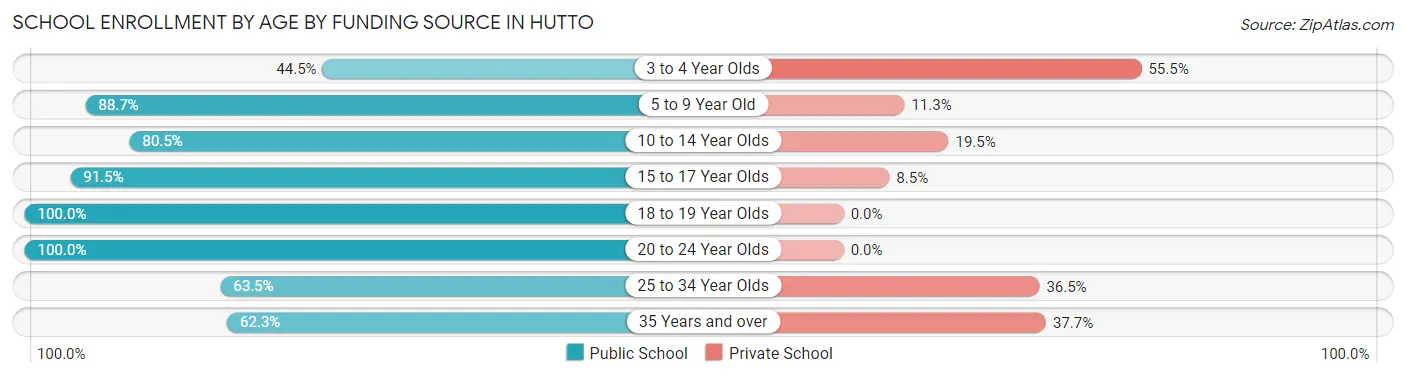
| Age Bracket | Public School | Private School |
| 3 to 4 Year Olds | 183 (44.5%) | 228 (55.5%) |
| 5 to 9 Year Old | 1,894 (88.7%) | 242 (11.3%) |
| 10 to 14 Year Olds | 1,595 (80.5%) | 387 (19.5%) |
| 15 to 17 Year Olds | 1,224 (91.5%) | 114 (8.5%) |
| 18 to 19 Year Olds | 485 (100.0%) | 0 (0.0%) |
| 20 to 24 Year Olds | 727 (100.0%) | 0 (0.0%) |
| 25 to 34 Year Olds | 432 (63.5%) | 248 (36.5%) |
| 35 Years and over | 380 (62.3%) | 230 (37.7%) |
| Total | 6,921 (82.7%) | 1,448 (17.3%) |
Educational Attainment by Field of Study in Hutto
Business (1,370 | 21.2%), engineering (1,084 | 16.8%), arts & humanities (572 | 8.8%), science & technology (539 | 8.3%), and computers & mathematics (533 | 8.2%) are the most common fields of study among 6,466 individuals in Hutto who have obtained a bachelor's degree or higher.
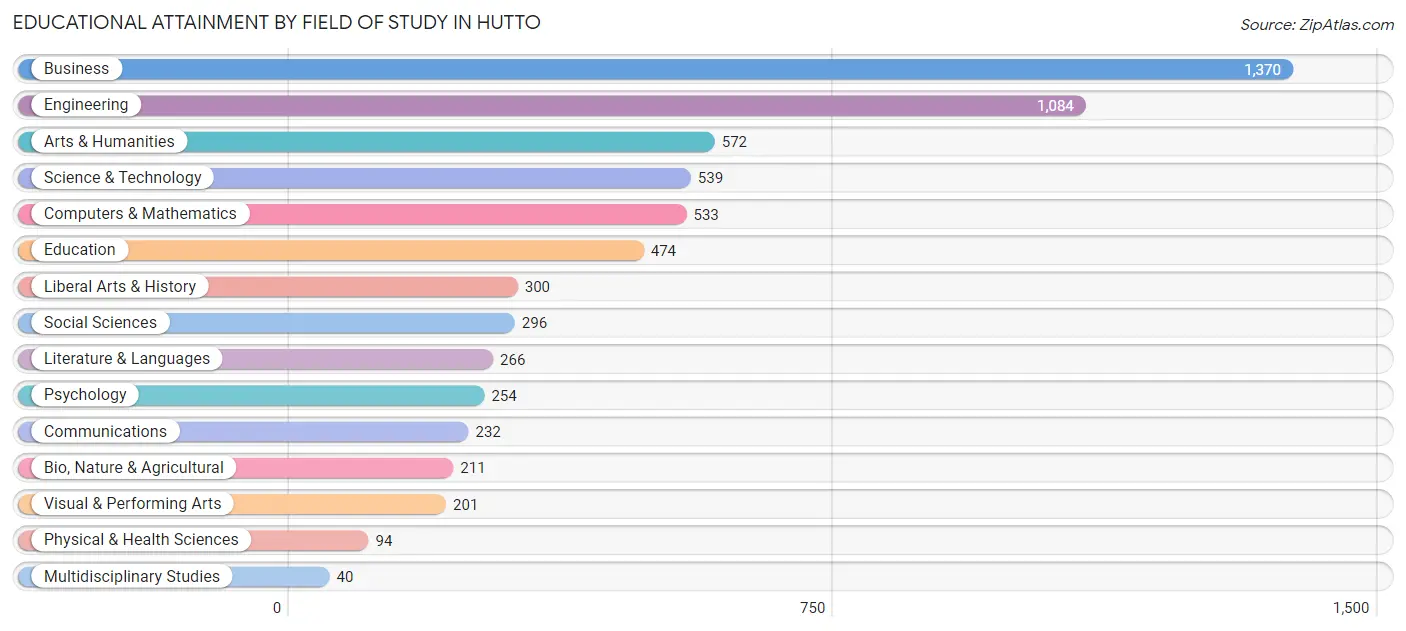
| Field of Study | # Graduates | % Graduates |
| Computers & Mathematics | 533 | 8.2% |
| Bio, Nature & Agricultural | 211 | 3.3% |
| Physical & Health Sciences | 94 | 1.5% |
| Psychology | 254 | 3.9% |
| Social Sciences | 296 | 4.6% |
| Engineering | 1,084 | 16.8% |
| Multidisciplinary Studies | 40 | 0.6% |
| Science & Technology | 539 | 8.3% |
| Business | 1,370 | 21.2% |
| Education | 474 | 7.3% |
| Literature & Languages | 266 | 4.1% |
| Liberal Arts & History | 300 | 4.6% |
| Visual & Performing Arts | 201 | 3.1% |
| Communications | 232 | 3.6% |
| Arts & Humanities | 572 | 8.8% |
| Total | 6,466 | 100.0% |
Transportation & Commute in Hutto
Vehicle Availability by Sex in Hutto
The most prevalent vehicle ownership categories in Hutto are males with 2 vehicles (4,130, accounting for 47.9%) and females with 2 vehicles (3,889, making up 55.6%).
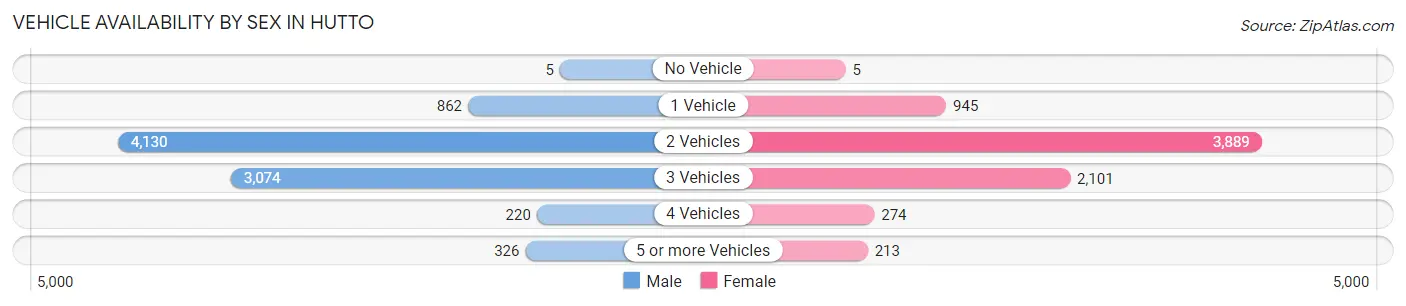
| Vehicles Available | Male | Female |
| No Vehicle | 5 (0.1%) | 5 (0.1%) |
| 1 Vehicle | 862 (10.0%) | 945 (12.7%) |
| 2 Vehicles | 4,130 (47.9%) | 3,889 (52.4%) |
| 3 Vehicles | 3,074 (35.7%) | 2,101 (28.3%) |
| 4 Vehicles | 220 (2.5%) | 274 (3.7%) |
| 5 or more Vehicles | 326 (3.8%) | 213 (2.9%) |
| Total | 8,617 (100.0%) | 7,427 (100.0%) |
Commute Time in Hutto
The most frequently occuring commute durations in Hutto are 30 to 34 minutes (2,693 commuters, 19.8%), 20 to 24 minutes (2,272 commuters, 16.7%), and 15 to 19 minutes (2,095 commuters, 15.4%).
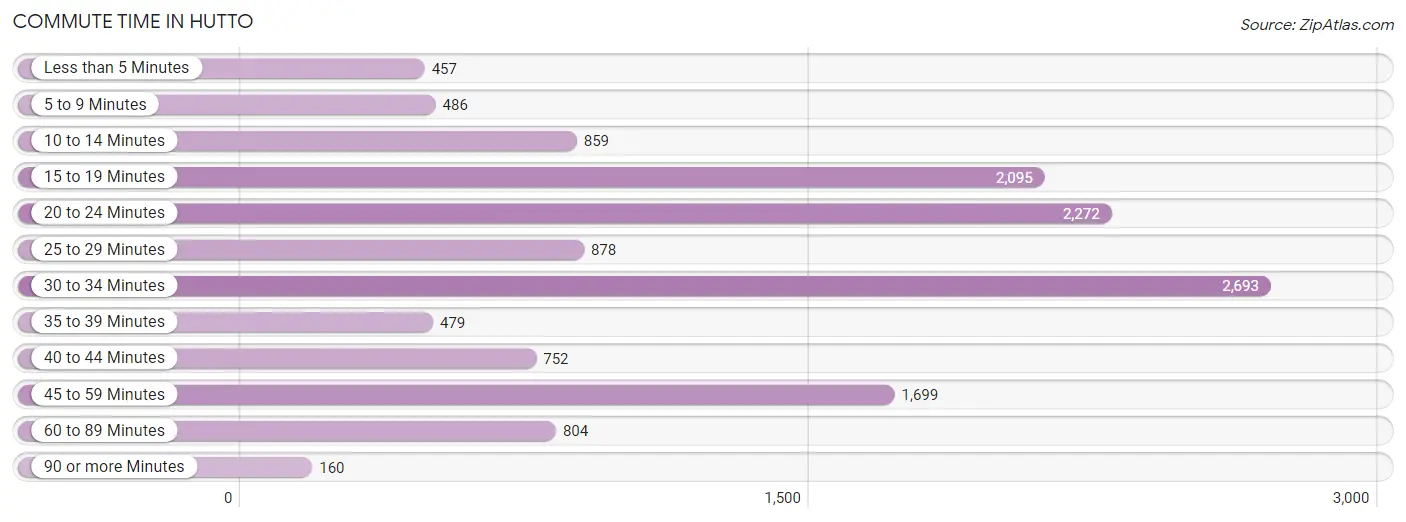
| Commute Time | # Commuters | % Commuters |
| Less than 5 Minutes | 457 | 3.4% |
| 5 to 9 Minutes | 486 | 3.6% |
| 10 to 14 Minutes | 859 | 6.3% |
| 15 to 19 Minutes | 2,095 | 15.4% |
| 20 to 24 Minutes | 2,272 | 16.7% |
| 25 to 29 Minutes | 878 | 6.4% |
| 30 to 34 Minutes | 2,693 | 19.8% |
| 35 to 39 Minutes | 479 | 3.5% |
| 40 to 44 Minutes | 752 | 5.5% |
| 45 to 59 Minutes | 1,699 | 12.5% |
| 60 to 89 Minutes | 804 | 5.9% |
| 90 or more Minutes | 160 | 1.2% |
Commute Time by Sex in Hutto
The most common commute times in Hutto are 30 to 34 minutes (1,888 commuters, 25.3%) for males and 15 to 19 minutes (983 commuters, 15.9%) for females.
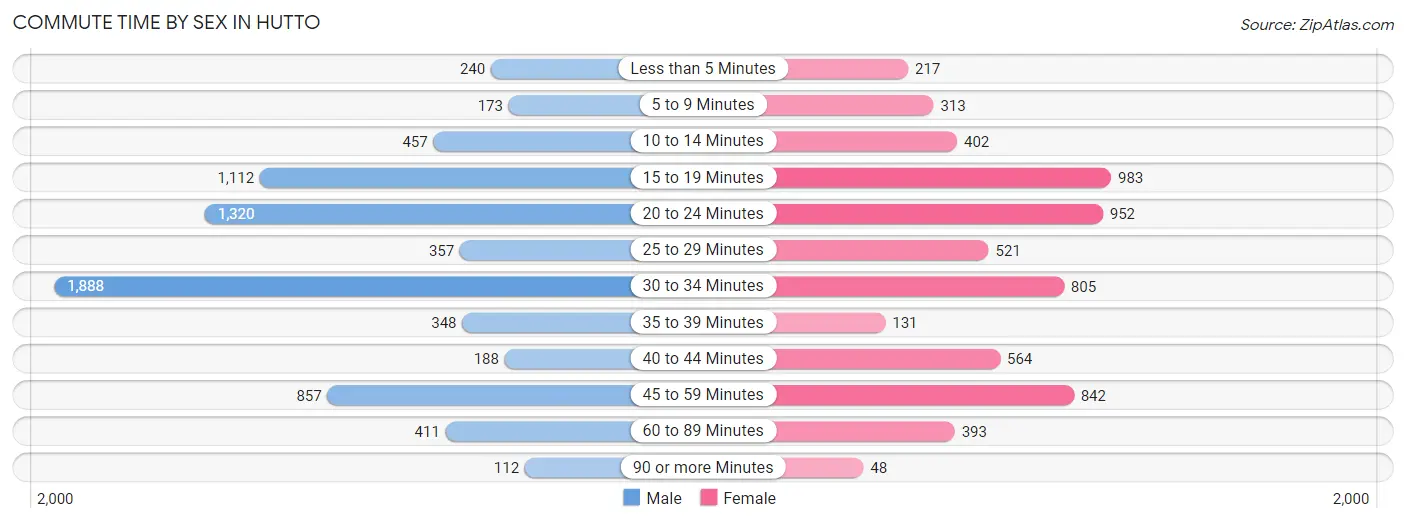
| Commute Time | Male | Female |
| Less than 5 Minutes | 240 (3.2%) | 217 (3.5%) |
| 5 to 9 Minutes | 173 (2.3%) | 313 (5.1%) |
| 10 to 14 Minutes | 457 (6.1%) | 402 (6.5%) |
| 15 to 19 Minutes | 1,112 (14.9%) | 983 (15.9%) |
| 20 to 24 Minutes | 1,320 (17.7%) | 952 (15.4%) |
| 25 to 29 Minutes | 357 (4.8%) | 521 (8.4%) |
| 30 to 34 Minutes | 1,888 (25.3%) | 805 (13.0%) |
| 35 to 39 Minutes | 348 (4.7%) | 131 (2.1%) |
| 40 to 44 Minutes | 188 (2.5%) | 564 (9.1%) |
| 45 to 59 Minutes | 857 (11.5%) | 842 (13.6%) |
| 60 to 89 Minutes | 411 (5.5%) | 393 (6.4%) |
| 90 or more Minutes | 112 (1.5%) | 48 (0.8%) |
Time of Departure to Work by Sex in Hutto
The most frequent times of departure to work in Hutto are 7:30 AM to 7:59 AM (989, 13.3%) for males and 7:00 AM to 7:29 AM (1,239, 20.1%) for females.
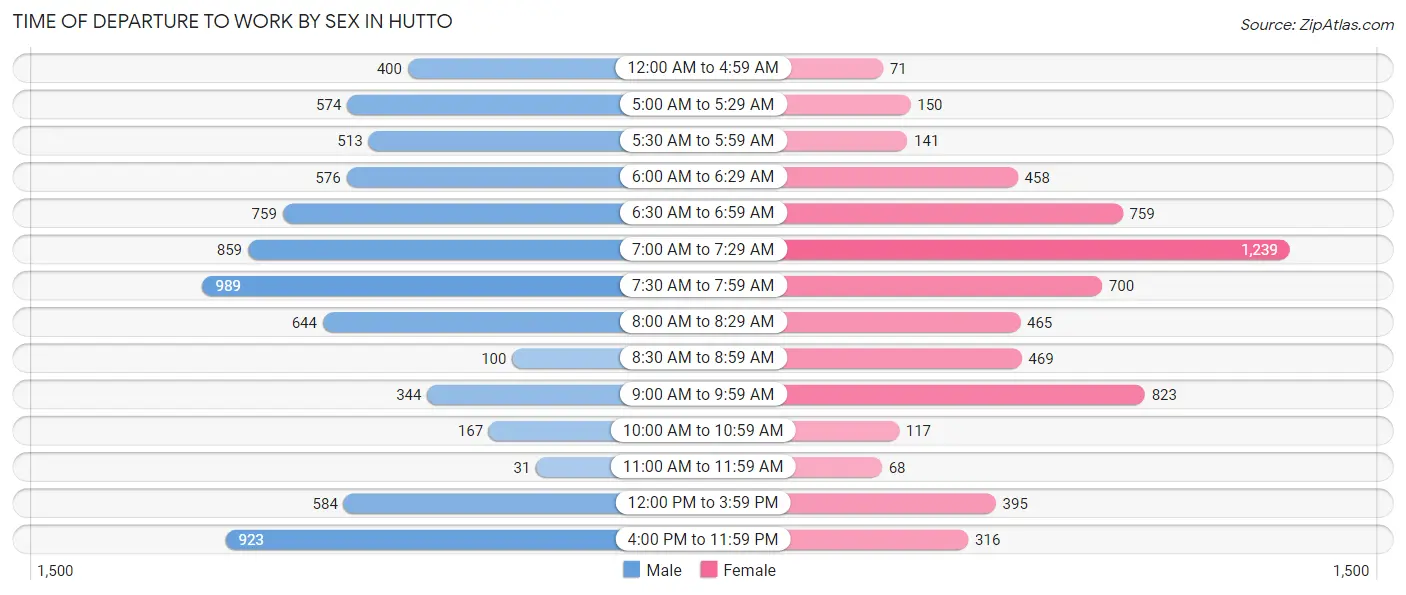
| Time of Departure | Male | Female |
| 12:00 AM to 4:59 AM | 400 (5.4%) | 71 (1.1%) |
| 5:00 AM to 5:29 AM | 574 (7.7%) | 150 (2.4%) |
| 5:30 AM to 5:59 AM | 513 (6.9%) | 141 (2.3%) |
| 6:00 AM to 6:29 AM | 576 (7.7%) | 458 (7.4%) |
| 6:30 AM to 6:59 AM | 759 (10.2%) | 759 (12.3%) |
| 7:00 AM to 7:29 AM | 859 (11.5%) | 1,239 (20.1%) |
| 7:30 AM to 7:59 AM | 989 (13.3%) | 700 (11.3%) |
| 8:00 AM to 8:29 AM | 644 (8.6%) | 465 (7.5%) |
| 8:30 AM to 8:59 AM | 100 (1.3%) | 469 (7.6%) |
| 9:00 AM to 9:59 AM | 344 (4.6%) | 823 (13.3%) |
| 10:00 AM to 10:59 AM | 167 (2.2%) | 117 (1.9%) |
| 11:00 AM to 11:59 AM | 31 (0.4%) | 68 (1.1%) |
| 12:00 PM to 3:59 PM | 584 (7.8%) | 395 (6.4%) |
| 4:00 PM to 11:59 PM | 923 (12.4%) | 316 (5.1%) |
| Total | 7,463 (100.0%) | 6,171 (100.0%) |
Housing Occupancy in Hutto
Occupancy by Ownership in Hutto
Of the total 9,875 dwellings in Hutto, owner-occupied units account for 8,169 (82.7%), while renter-occupied units make up 1,706 (17.3%).
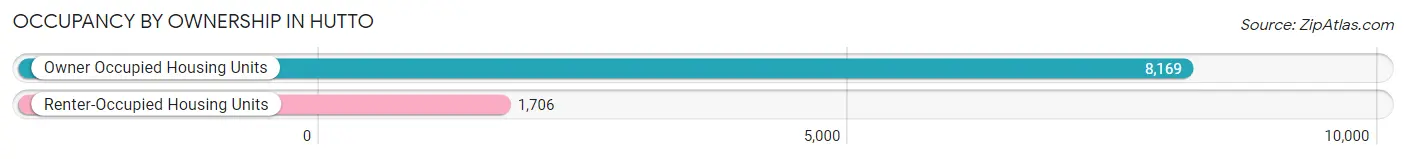
| Occupancy | # Housing Units | % Housing Units |
| Owner Occupied Housing Units | 8,169 | 82.7% |
| Renter-Occupied Housing Units | 1,706 | 17.3% |
| Total Occupied Housing Units | 9,875 | 100.0% |
Occupancy by Household Size in Hutto
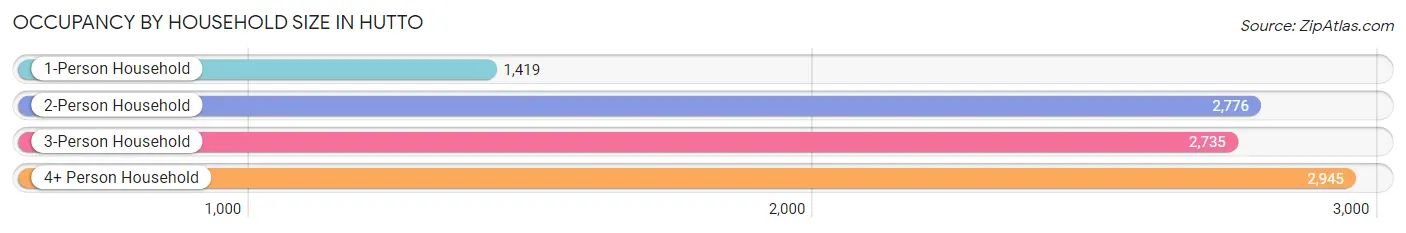
| Household Size | # Housing Units | % Housing Units |
| 1-Person Household | 1,419 | 14.4% |
| 2-Person Household | 2,776 | 28.1% |
| 3-Person Household | 2,735 | 27.7% |
| 4+ Person Household | 2,945 | 29.8% |
| Total Housing Units | 9,875 | 100.0% |
Occupancy by Ownership by Household Size in Hutto
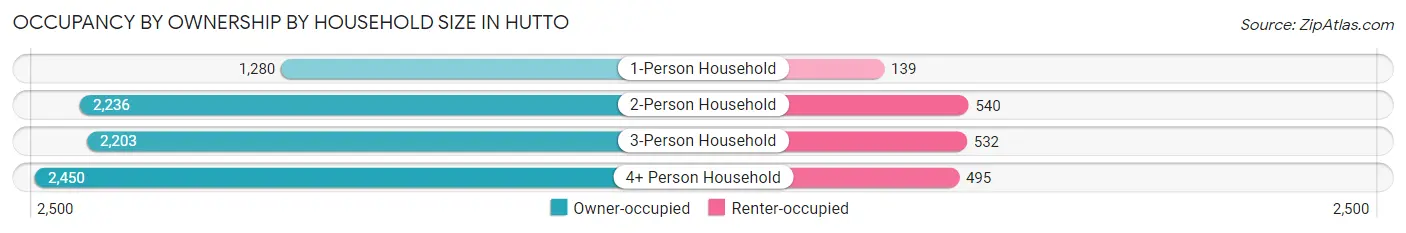
| Household Size | Owner-occupied | Renter-occupied |
| 1-Person Household | 1,280 (90.2%) | 139 (9.8%) |
| 2-Person Household | 2,236 (80.5%) | 540 (19.5%) |
| 3-Person Household | 2,203 (80.5%) | 532 (19.5%) |
| 4+ Person Household | 2,450 (83.2%) | 495 (16.8%) |
| Total Housing Units | 8,169 (82.7%) | 1,706 (17.3%) |
Occupancy by Educational Attainment in Hutto
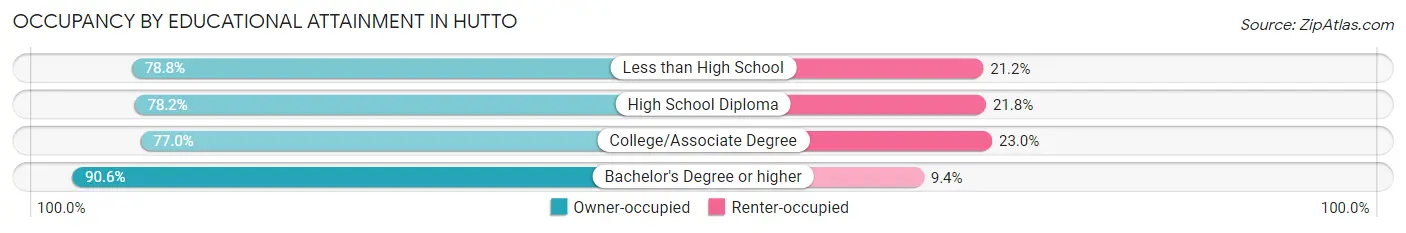
| Household Size | Owner-occupied | Renter-occupied |
| Less than High School | 304 (78.8%) | 82 (21.2%) |
| High School Diploma | 1,542 (78.2%) | 429 (21.8%) |
| College/Associate Degree | 2,763 (77.0%) | 824 (23.0%) |
| Bachelor's Degree or higher | 3,560 (90.6%) | 371 (9.4%) |
Occupancy by Age of Householder in Hutto
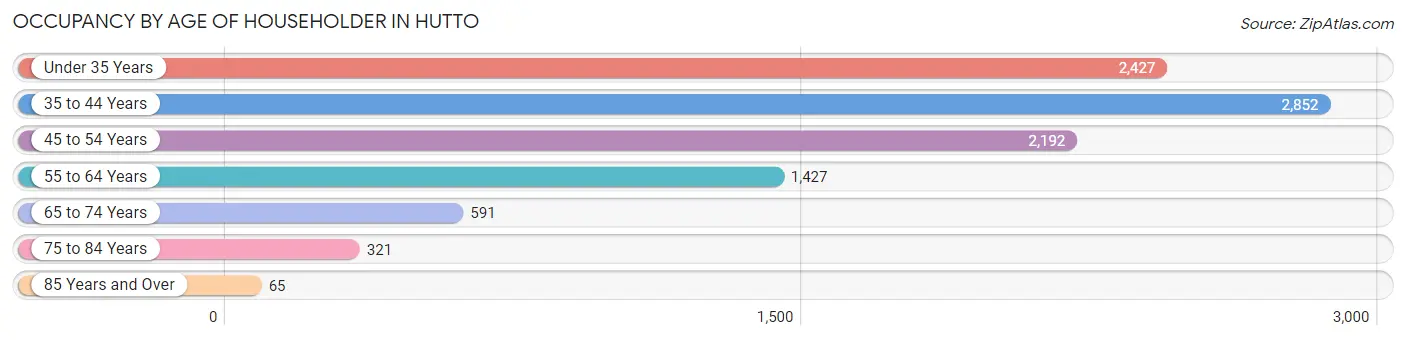
| Age Bracket | # Households | % Households |
| Under 35 Years | 2,427 | 24.6% |
| 35 to 44 Years | 2,852 | 28.9% |
| 45 to 54 Years | 2,192 | 22.2% |
| 55 to 64 Years | 1,427 | 14.4% |
| 65 to 74 Years | 591 | 6.0% |
| 75 to 84 Years | 321 | 3.3% |
| 85 Years and Over | 65 | 0.7% |
| Total | 9,875 | 100.0% |
Housing Finances in Hutto
Median Income by Occupancy in Hutto
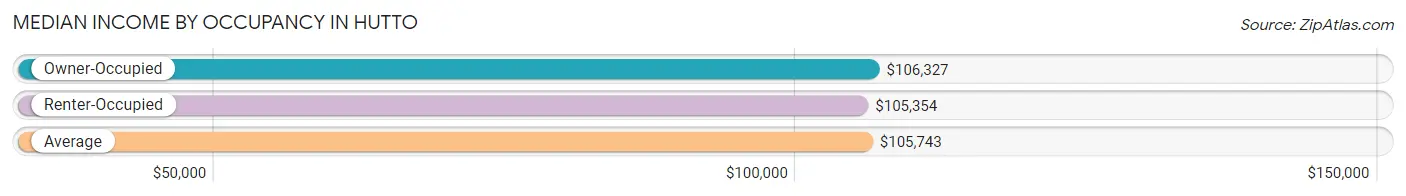
| Occupancy Type | # Households | Median Income |
| Owner-Occupied | 8,169 (82.7%) | $106,327 |
| Renter-Occupied | 1,706 (17.3%) | $105,354 |
| Average | 9,875 (100.0%) | $105,743 |
Occupancy by Householder Income Bracket in Hutto
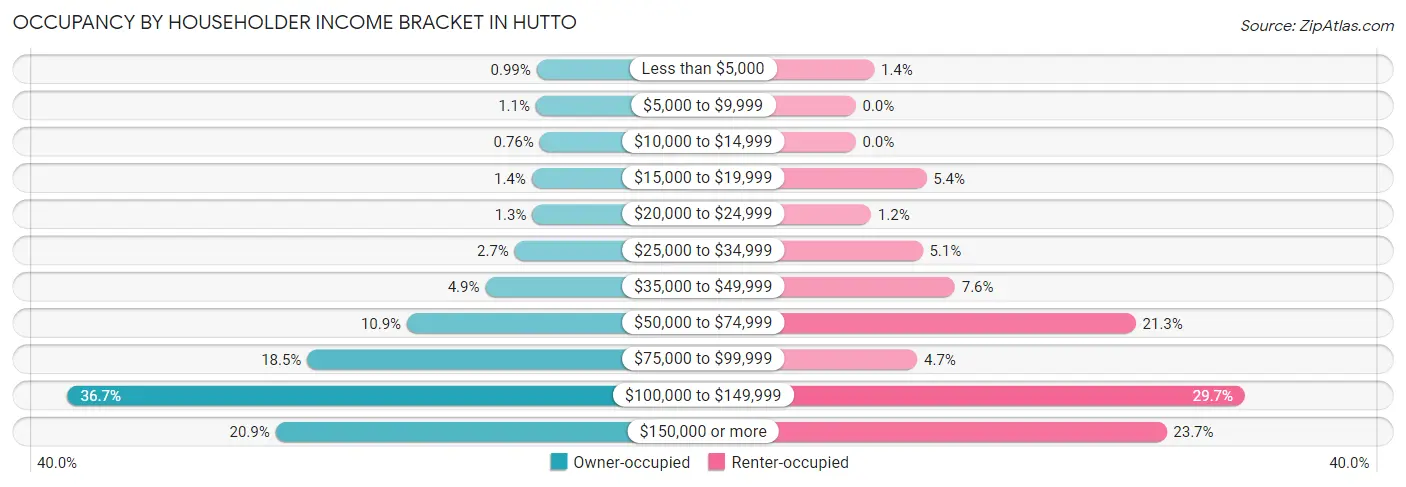
| Income Bracket | Owner-occupied | Renter-occupied |
| Less than $5,000 | 81 (1.0%) | 24 (1.4%) |
| $5,000 to $9,999 | 86 (1.1%) | 0 (0.0%) |
| $10,000 to $14,999 | 62 (0.8%) | 0 (0.0%) |
| $15,000 to $19,999 | 112 (1.4%) | 92 (5.4%) |
| $20,000 to $24,999 | 108 (1.3%) | 20 (1.2%) |
| $25,000 to $34,999 | 217 (2.7%) | 87 (5.1%) |
| $35,000 to $49,999 | 400 (4.9%) | 129 (7.6%) |
| $50,000 to $74,999 | 888 (10.9%) | 364 (21.3%) |
| $75,000 to $99,999 | 1,509 (18.5%) | 80 (4.7%) |
| $100,000 to $149,999 | 3,000 (36.7%) | 506 (29.7%) |
| $150,000 or more | 1,706 (20.9%) | 404 (23.7%) |
| Total | 8,169 (100.0%) | 1,706 (100.0%) |
Monthly Housing Cost Tiers in Hutto
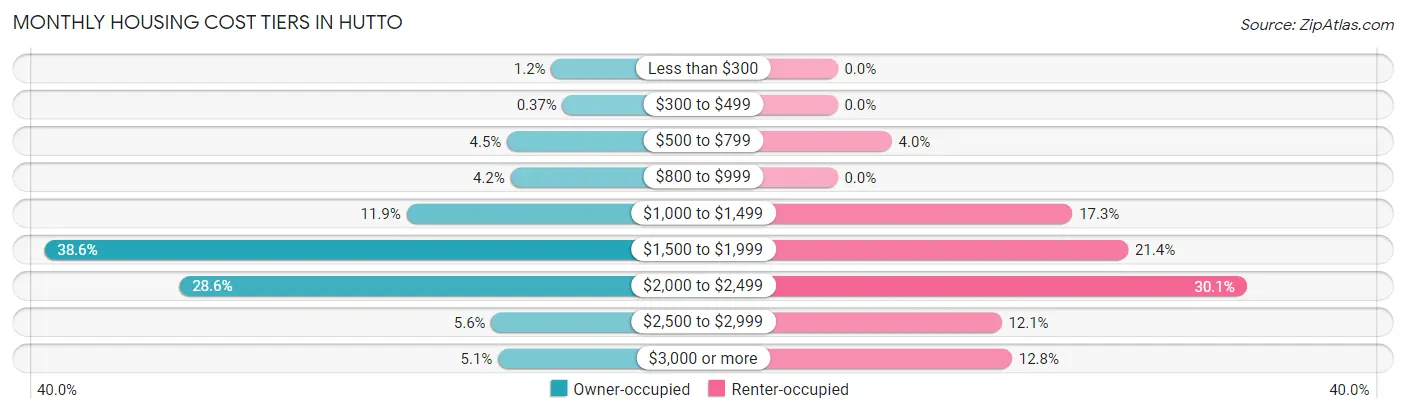
| Monthly Cost | Owner-occupied | Renter-occupied |
| Less than $300 | 98 (1.2%) | 0 (0.0%) |
| $300 to $499 | 30 (0.4%) | 0 (0.0%) |
| $500 to $799 | 364 (4.5%) | 68 (4.0%) |
| $800 to $999 | 344 (4.2%) | 0 (0.0%) |
| $1,000 to $1,499 | 970 (11.9%) | 295 (17.3%) |
| $1,500 to $1,999 | 3,149 (38.6%) | 365 (21.4%) |
| $2,000 to $2,499 | 2,337 (28.6%) | 514 (30.1%) |
| $2,500 to $2,999 | 459 (5.6%) | 206 (12.1%) |
| $3,000 or more | 418 (5.1%) | 219 (12.8%) |
| Total | 8,169 (100.0%) | 1,706 (100.0%) |
Physical Housing Characteristics in Hutto
Housing Structures in Hutto
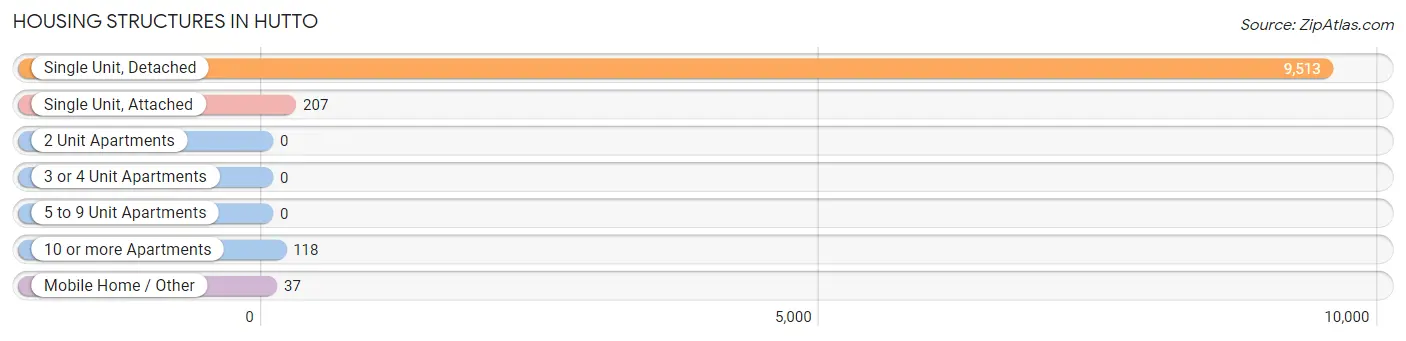
| Structure Type | # Housing Units | % Housing Units |
| Single Unit, Detached | 9,513 | 96.3% |
| Single Unit, Attached | 207 | 2.1% |
| 2 Unit Apartments | 0 | 0.0% |
| 3 or 4 Unit Apartments | 0 | 0.0% |
| 5 to 9 Unit Apartments | 0 | 0.0% |
| 10 or more Apartments | 118 | 1.2% |
| Mobile Home / Other | 37 | 0.4% |
| Total | 9,875 | 100.0% |
Housing Structures by Occupancy in Hutto
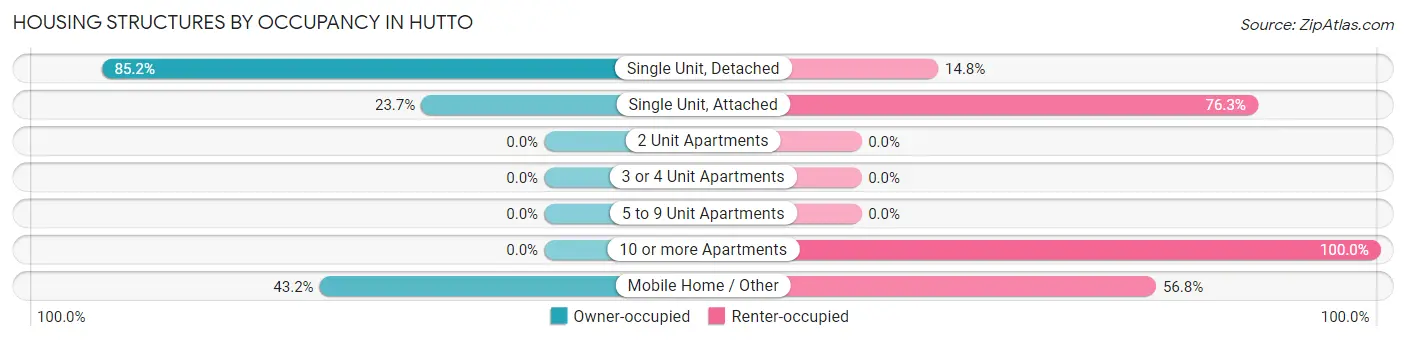
| Structure Type | Owner-occupied | Renter-occupied |
| Single Unit, Detached | 8,104 (85.2%) | 1,409 (14.8%) |
| Single Unit, Attached | 49 (23.7%) | 158 (76.3%) |
| 2 Unit Apartments | 0 (0.0%) | 0 (0.0%) |
| 3 or 4 Unit Apartments | 0 (0.0%) | 0 (0.0%) |
| 5 to 9 Unit Apartments | 0 (0.0%) | 0 (0.0%) |
| 10 or more Apartments | 0 (0.0%) | 118 (100.0%) |
| Mobile Home / Other | 16 (43.2%) | 21 (56.8%) |
| Total | 8,169 (82.7%) | 1,706 (17.3%) |
Housing Structures by Number of Rooms in Hutto
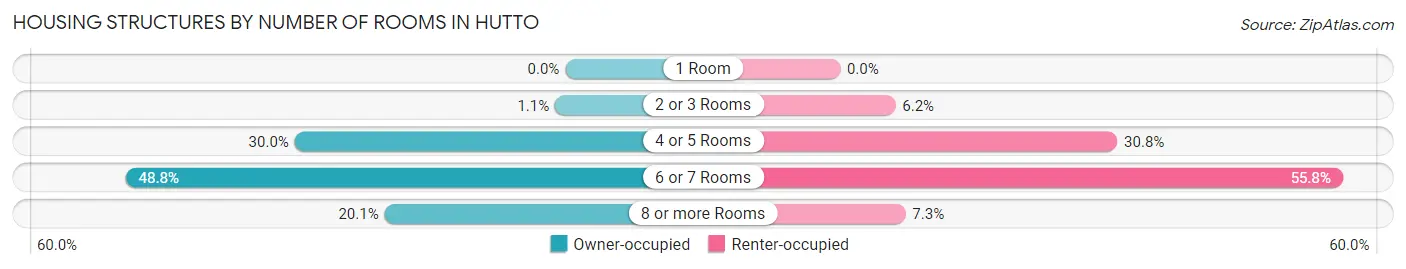
| Number of Rooms | Owner-occupied | Renter-occupied |
| 1 Room | 0 (0.0%) | 0 (0.0%) |
| 2 or 3 Rooms | 92 (1.1%) | 105 (6.1%) |
| 4 or 5 Rooms | 2,453 (30.0%) | 525 (30.8%) |
| 6 or 7 Rooms | 3,985 (48.8%) | 952 (55.8%) |
| 8 or more Rooms | 1,639 (20.1%) | 124 (7.3%) |
| Total | 8,169 (100.0%) | 1,706 (100.0%) |
Housing Structure by Heating Type in Hutto
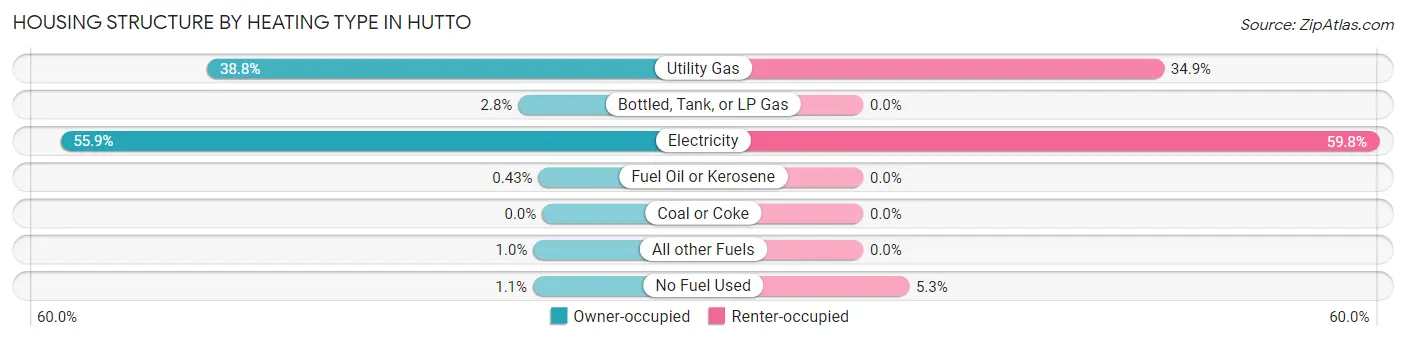
| Heating Type | Owner-occupied | Renter-occupied |
| Utility Gas | 3,173 (38.8%) | 595 (34.9%) |
| Bottled, Tank, or LP Gas | 226 (2.8%) | 0 (0.0%) |
| Electricity | 4,564 (55.9%) | 1,020 (59.8%) |
| Fuel Oil or Kerosene | 35 (0.4%) | 0 (0.0%) |
| Coal or Coke | 0 (0.0%) | 0 (0.0%) |
| All other Fuels | 84 (1.0%) | 0 (0.0%) |
| No Fuel Used | 87 (1.1%) | 91 (5.3%) |
| Total | 8,169 (100.0%) | 1,706 (100.0%) |
Household Vehicle Usage in Hutto
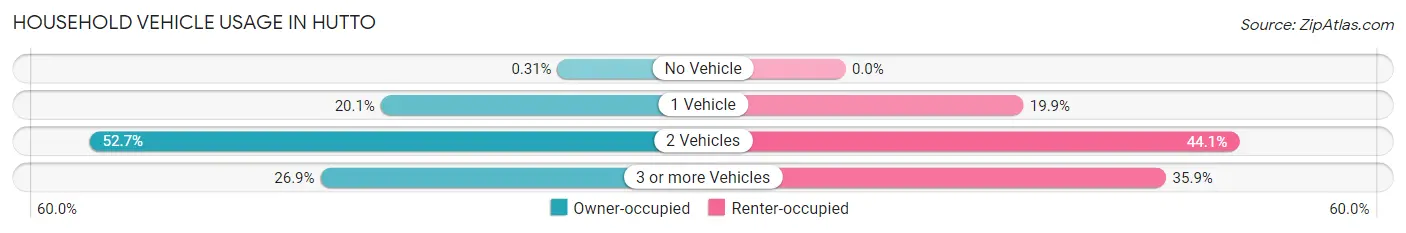
| Vehicles per Household | Owner-occupied | Renter-occupied |
| No Vehicle | 25 (0.3%) | 0 (0.0%) |
| 1 Vehicle | 1,643 (20.1%) | 340 (19.9%) |
| 2 Vehicles | 4,306 (52.7%) | 753 (44.1%) |
| 3 or more Vehicles | 2,195 (26.9%) | 613 (35.9%) |
| Total | 8,169 (100.0%) | 1,706 (100.0%) |
Real Estate & Mortgages in Hutto
Real Estate and Mortgage Overview in Hutto
| Characteristic | Without Mortgage | With Mortgage |
| Housing Units | 918 | 7,251 |
| Median Property Value | $305,600 | $277,800 |
| Median Household Income | $114,833 | $1,526 |
| Monthly Housing Costs | $854 | $418 |
| Real Estate Taxes | $5,957 | $288 |
Property Value by Mortgage Status in Hutto
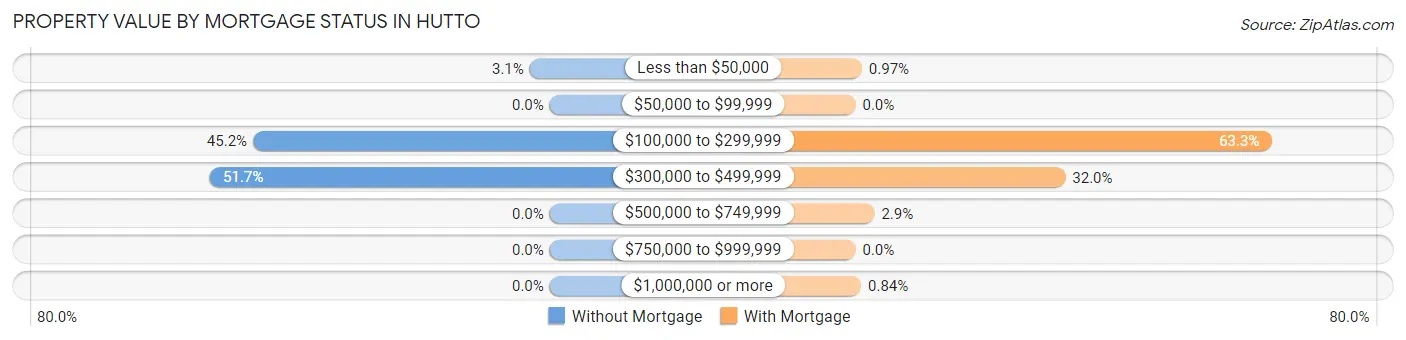
| Property Value | Without Mortgage | With Mortgage |
| Less than $50,000 | 28 (3.0%) | 70 (1.0%) |
| $50,000 to $99,999 | 0 (0.0%) | 0 (0.0%) |
| $100,000 to $299,999 | 415 (45.2%) | 4,593 (63.3%) |
| $300,000 to $499,999 | 475 (51.7%) | 2,318 (32.0%) |
| $500,000 to $749,999 | 0 (0.0%) | 209 (2.9%) |
| $750,000 to $999,999 | 0 (0.0%) | 0 (0.0%) |
| $1,000,000 or more | 0 (0.0%) | 61 (0.8%) |
| Total | 918 (100.0%) | 7,251 (100.0%) |
Household Income by Mortgage Status in Hutto
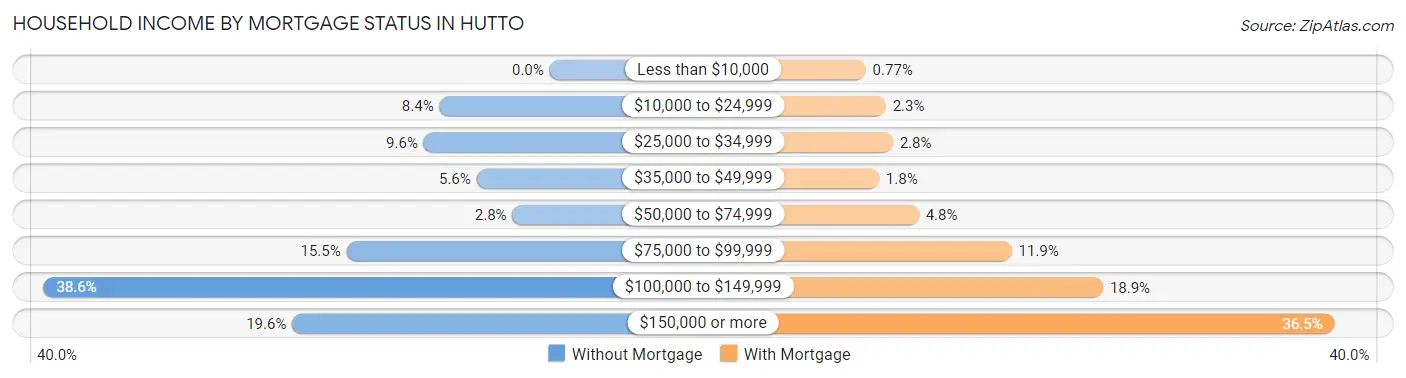
| Household Income | Without Mortgage | With Mortgage |
| Less than $10,000 | 0 (0.0%) | 56 (0.8%) |
| $10,000 to $24,999 | 77 (8.4%) | 167 (2.3%) |
| $25,000 to $34,999 | 88 (9.6%) | 205 (2.8%) |
| $35,000 to $49,999 | 51 (5.6%) | 129 (1.8%) |
| $50,000 to $74,999 | 26 (2.8%) | 349 (4.8%) |
| $75,000 to $99,999 | 142 (15.5%) | 862 (11.9%) |
| $100,000 to $149,999 | 354 (38.6%) | 1,367 (18.9%) |
| $150,000 or more | 180 (19.6%) | 2,646 (36.5%) |
| Total | 918 (100.0%) | 7,251 (100.0%) |
Property Value to Household Income Ratio in Hutto
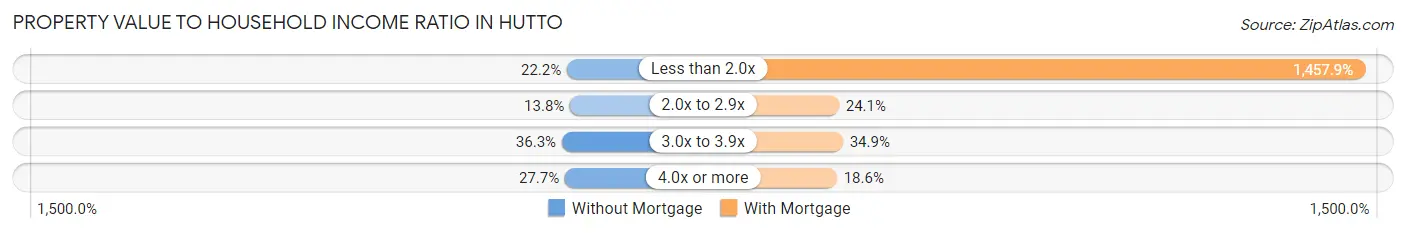
| Value-to-Income Ratio | Without Mortgage | With Mortgage |
| Less than 2.0x | 204 (22.2%) | 105,711 (1,457.9%) |
| 2.0x to 2.9x | 127 (13.8%) | 1,744 (24.0%) |
| 3.0x to 3.9x | 333 (36.3%) | 2,530 (34.9%) |
| 4.0x or more | 254 (27.7%) | 1,347 (18.6%) |
| Total | 918 (100.0%) | 7,251 (100.0%) |
Real Estate Taxes by Mortgage Status in Hutto
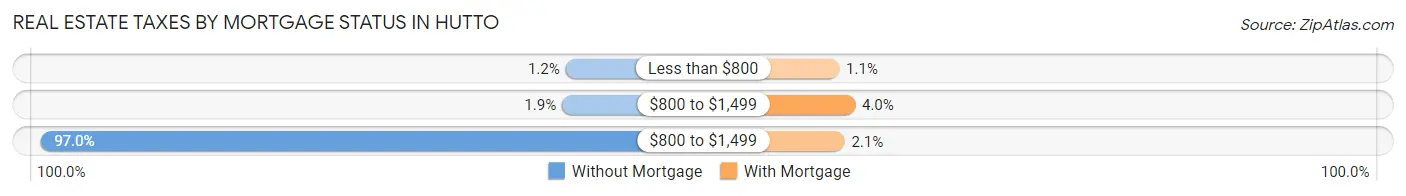
| Property Taxes | Without Mortgage | With Mortgage |
| Less than $800 | 11 (1.2%) | 81 (1.1%) |
| $800 to $1,499 | 17 (1.8%) | 291 (4.0%) |
| $800 to $1,499 | 890 (97.0%) | 151 (2.1%) |
| Total | 918 (100.0%) | 7,251 (100.0%) |
Health & Disability in Hutto
Health Insurance Coverage by Age in Hutto
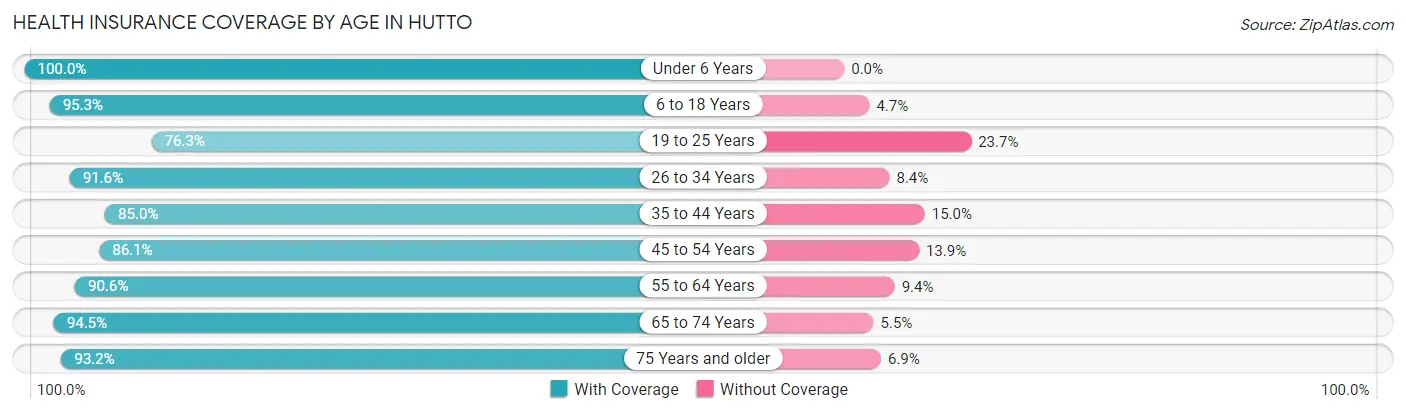
| Age Bracket | With Coverage | Without Coverage |
| Under 6 Years | 2,619 (100.0%) | 0 (0.0%) |
| 6 to 18 Years | 5,227 (95.3%) | 257 (4.7%) |
| 19 to 25 Years | 1,693 (76.3%) | 525 (23.7%) |
| 26 to 34 Years | 3,914 (91.6%) | 361 (8.4%) |
| 35 to 44 Years | 5,466 (85.0%) | 966 (15.0%) |
| 45 to 54 Years | 3,622 (86.1%) | 586 (13.9%) |
| 55 to 64 Years | 2,109 (90.6%) | 219 (9.4%) |
| 65 to 74 Years | 1,178 (94.5%) | 68 (5.5%) |
| 75 Years and older | 544 (93.1%) | 40 (6.9%) |
| Total | 26,372 (89.7%) | 3,022 (10.3%) |
Health Insurance Coverage by Citizenship Status in Hutto
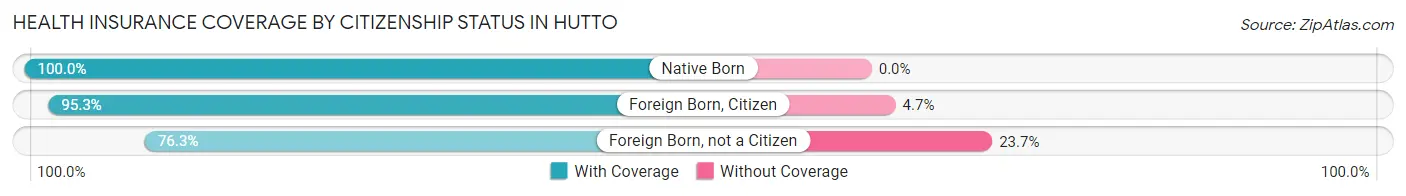
| Citizenship Status | With Coverage | Without Coverage |
| Native Born | 2,619 (100.0%) | 0 (0.0%) |
| Foreign Born, Citizen | 5,227 (95.3%) | 257 (4.7%) |
| Foreign Born, not a Citizen | 1,693 (76.3%) | 525 (23.7%) |
Health Insurance Coverage by Household Income in Hutto
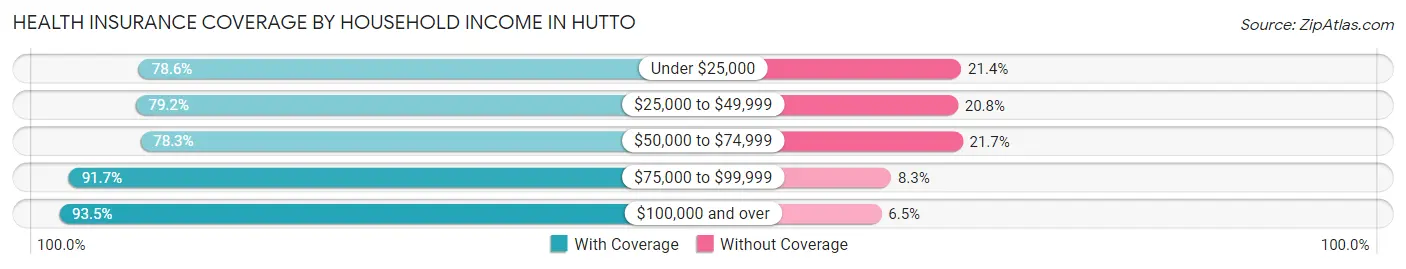
| Household Income | With Coverage | Without Coverage |
| Under $25,000 | 888 (78.6%) | 242 (21.4%) |
| $25,000 to $49,999 | 1,855 (79.2%) | 487 (20.8%) |
| $50,000 to $74,999 | 2,733 (78.3%) | 757 (21.7%) |
| $75,000 to $99,999 | 4,205 (91.7%) | 379 (8.3%) |
| $100,000 and over | 16,689 (93.5%) | 1,157 (6.5%) |
Public vs Private Health Insurance Coverage by Age in Hutto
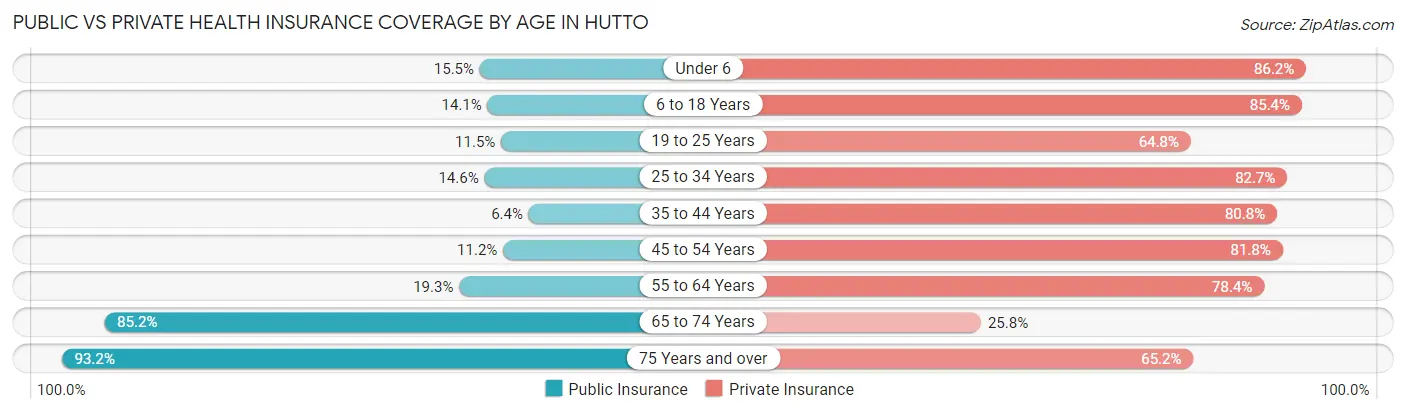
| Age Bracket | Public Insurance | Private Insurance |
| Under 6 | 406 (15.5%) | 2,257 (86.2%) |
| 6 to 18 Years | 771 (14.1%) | 4,683 (85.4%) |
| 19 to 25 Years | 256 (11.5%) | 1,437 (64.8%) |
| 25 to 34 Years | 626 (14.6%) | 3,534 (82.7%) |
| 35 to 44 Years | 412 (6.4%) | 5,195 (80.8%) |
| 45 to 54 Years | 470 (11.2%) | 3,443 (81.8%) |
| 55 to 64 Years | 450 (19.3%) | 1,825 (78.4%) |
| 65 to 74 Years | 1,062 (85.2%) | 322 (25.8%) |
| 75 Years and over | 544 (93.1%) | 381 (65.2%) |
| Total | 4,997 (17.0%) | 23,077 (78.5%) |
Disability Status by Sex by Age in Hutto
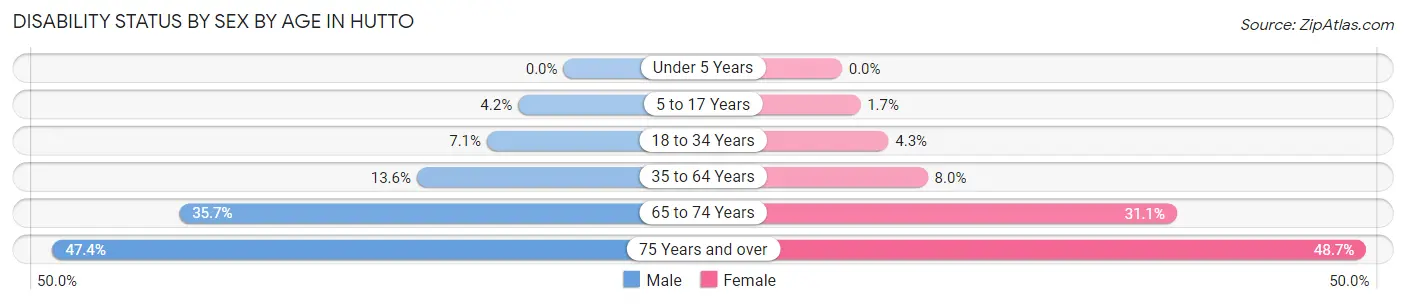
| Age Bracket | Male | Female |
| Under 5 Years | 0 (0.0%) | 0 (0.0%) |
| 5 to 17 Years | 120 (4.2%) | 47 (1.7%) |
| 18 to 34 Years | 219 (7.1%) | 162 (4.3%) |
| 35 to 64 Years | 922 (13.6%) | 493 (8.0%) |
| 65 to 74 Years | 200 (35.6%) | 213 (31.1%) |
| 75 Years and over | 82 (47.4%) | 200 (48.7%) |
Disability Class by Sex by Age in Hutto
Disability Class: Hearing Difficulty
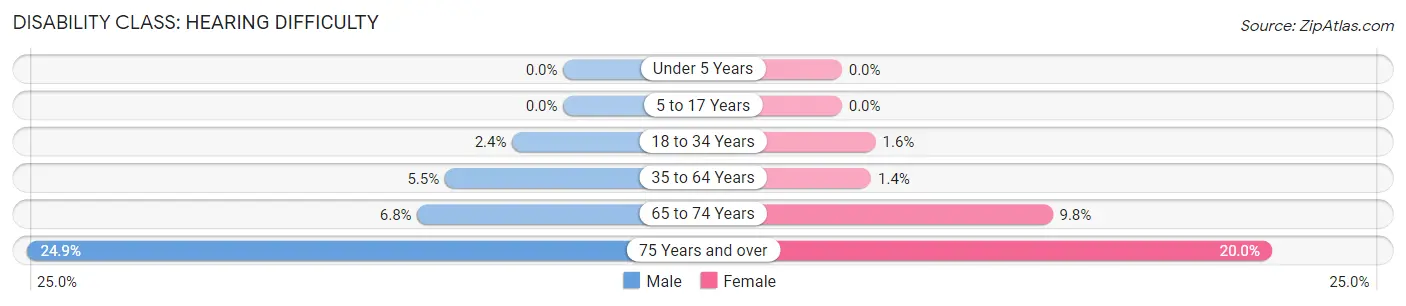
| Age Bracket | Male | Female |
| Under 5 Years | 0 (0.0%) | 0 (0.0%) |
| 5 to 17 Years | 0 (0.0%) | 0 (0.0%) |
| 18 to 34 Years | 73 (2.4%) | 59 (1.6%) |
| 35 to 64 Years | 372 (5.5%) | 84 (1.4%) |
| 65 to 74 Years | 38 (6.8%) | 67 (9.8%) |
| 75 Years and over | 43 (24.9%) | 82 (20.0%) |
Disability Class: Vision Difficulty
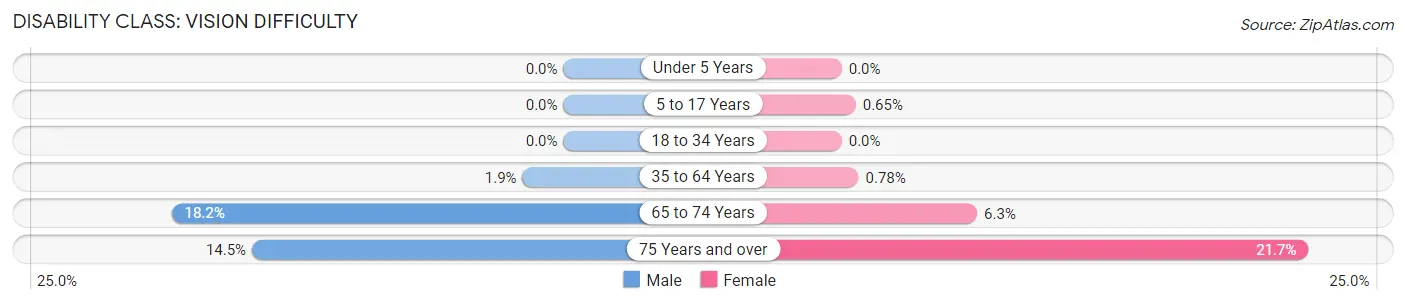
| Age Bracket | Male | Female |
| Under 5 Years | 0 (0.0%) | 0 (0.0%) |
| 5 to 17 Years | 0 (0.0%) | 18 (0.6%) |
| 18 to 34 Years | 0 (0.0%) | 0 (0.0%) |
| 35 to 64 Years | 129 (1.9%) | 48 (0.8%) |
| 65 to 74 Years | 102 (18.2%) | 43 (6.3%) |
| 75 Years and over | 25 (14.4%) | 89 (21.6%) |
Disability Class: Cognitive Difficulty
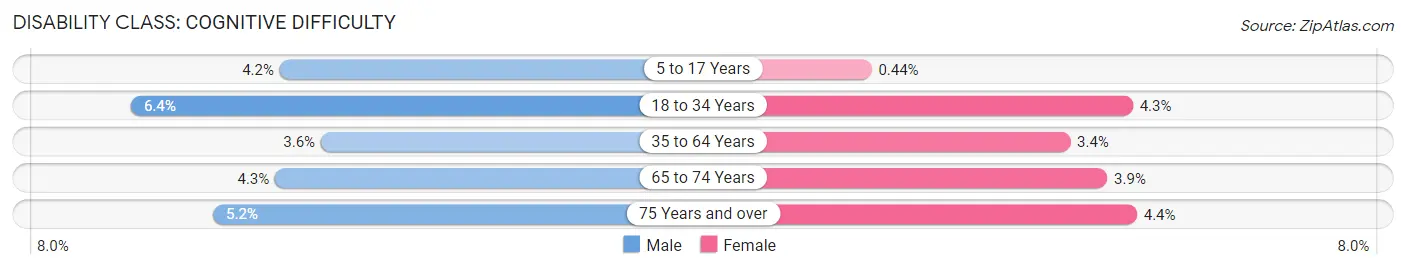
| Age Bracket | Male | Female |
| 5 to 17 Years | 120 (4.2%) | 12 (0.4%) |
| 18 to 34 Years | 198 (6.4%) | 162 (4.3%) |
| 35 to 64 Years | 244 (3.6%) | 210 (3.4%) |
| 65 to 74 Years | 24 (4.3%) | 27 (3.9%) |
| 75 Years and over | 9 (5.2%) | 18 (4.4%) |
Disability Class: Ambulatory Difficulty
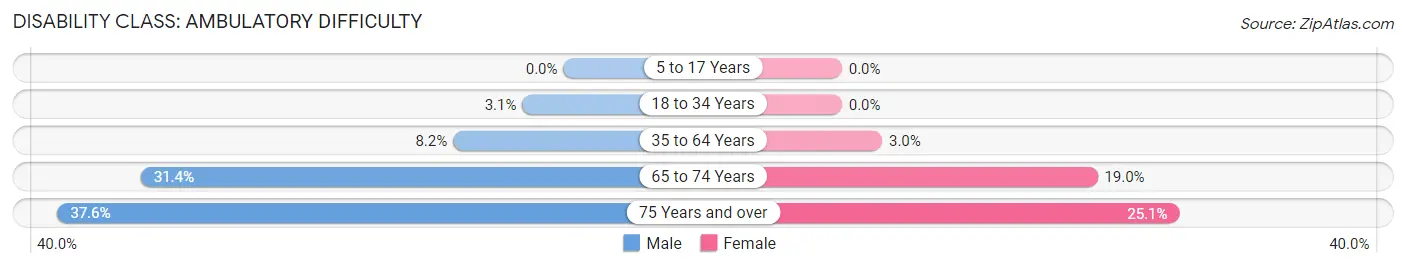
| Age Bracket | Male | Female |
| 5 to 17 Years | 0 (0.0%) | 0 (0.0%) |
| 18 to 34 Years | 94 (3.0%) | 0 (0.0%) |
| 35 to 64 Years | 555 (8.2%) | 185 (3.0%) |
| 65 to 74 Years | 176 (31.4%) | 130 (19.0%) |
| 75 Years and over | 65 (37.6%) | 103 (25.1%) |
Disability Class: Self-Care Difficulty
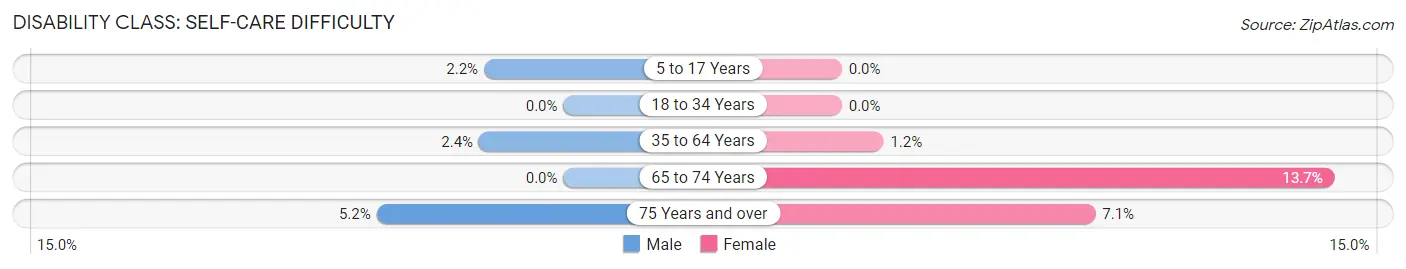
| Age Bracket | Male | Female |
| 5 to 17 Years | 63 (2.2%) | 0 (0.0%) |
| 18 to 34 Years | 0 (0.0%) | 0 (0.0%) |
| 35 to 64 Years | 159 (2.4%) | 72 (1.2%) |
| 65 to 74 Years | 0 (0.0%) | 94 (13.7%) |
| 75 Years and over | 9 (5.2%) | 29 (7.1%) |
Technology Access in Hutto
Computing Device Access in Hutto
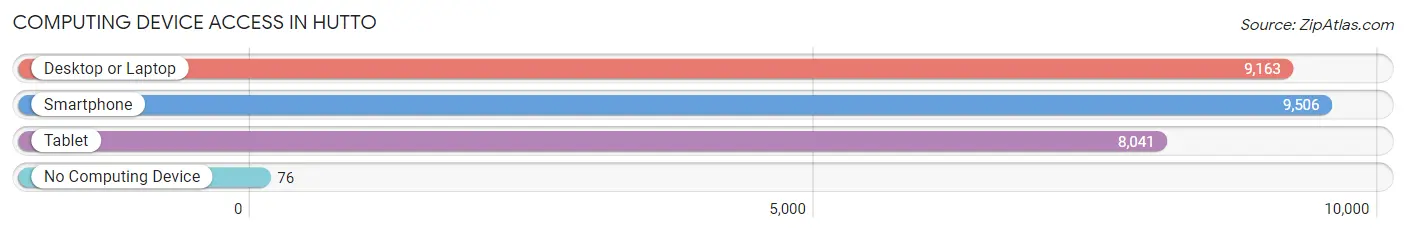
| Device Type | # Households | % Households |
| Desktop or Laptop | 9,163 | 92.8% |
| Smartphone | 9,506 | 96.3% |
| Tablet | 8,041 | 81.4% |
| No Computing Device | 76 | 0.8% |
| Total | 9,875 | 100.0% |
Internet Access in Hutto
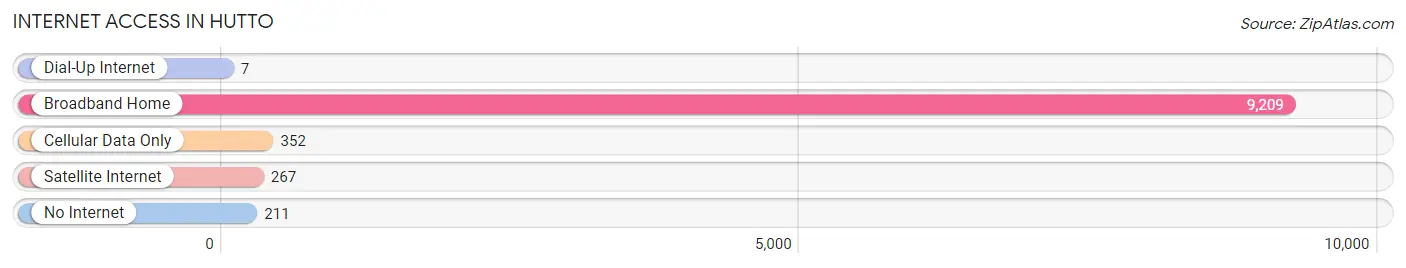
| Internet Type | # Households | % Households |
| Dial-Up Internet | 7 | 0.1% |
| Broadband Home | 9,209 | 93.3% |
| Cellular Data Only | 352 | 3.6% |
| Satellite Internet | 267 | 2.7% |
| No Internet | 211 | 2.1% |
| Total | 9,875 | 100.0% |
Hutto Summary
Hutto is a city located in Williamson County, Texas, United States. It is part of the Austin-Round Rock metropolitan area. The population was 14,698 at the 2010 census. Hutto is one of the fastest-growing cities in the United States, with a population increase of nearly 300% between 2000 and 2010.
History
Hutto was founded in 1876 by the Rev. William Hutto, a former Confederate soldier. He named the town after himself and opened a general store. The town was incorporated in 1878 and was the first town in Williamson County to have a post office.
In the early 1900s, Hutto was a thriving agricultural community. Cotton was the main crop, and the town had several cotton gins and a cottonseed oil mill. The town also had a blacksmith shop, a livery stable, a hotel, and a bank.
In the 1950s, the population of Hutto began to decline as people moved away from rural areas to larger cities. By the 1970s, the population had dropped to just over 500 people.
In the late 1990s, the population began to increase again as people moved to the area for its proximity to Austin and Round Rock. The population has grown rapidly since then, and the city has seen a surge in development.
Geography
Hutto is located in central Williamson County at 30°32'17" North, 97°33'17" West (30.538056, -97.554722). It is bordered to the north by the city of Taylor, to the east by the city of Round Rock, to the south by the city of Pflugerville, and to the west by the city of Georgetown.
The city has a total area of 8 2 square miles all of it land
Economy
Hutto is home to several major employers, including Dell, Samsung, and Amazon. The city also has a thriving retail sector, with several shopping centers and restaurants.
The city is also home to several industrial parks, including the Hutto Technology Park, which is home to several high-tech companies.
Demographics
As of the 2010 census, there were 14,698 people, 4,945 households, and 3,845 families residing in the city. The population density was 1,795.2 people per square mile. The racial makeup of the city was 74.3% White, 11.2% African American, 0.5% Native American, 5.2% Asian, 0.1% Pacific Islander, 6.2% from other races, and 2.5% from two or more races. Hispanic or Latino of any race were 19.3% of the population.
The median income for a household in the city was $63,945, and the median income for a family was $71,945. The per capita income for the city was $25,945. About 5.2% of families and 7.2% of the population were below the poverty line, including 8.2% of those under age 18 and 6.2% of those age 65 or over.
Common Questions
What is Per Capita Income in Hutto?
Per Capita income in Hutto is $38,974.
What is the Median Family Income in Hutto?
Median Family Income in Hutto is $108,281.
What is the Median Household income in Hutto?
Median Household Income in Hutto is $105,743.
What is Income or Wage Gap in Hutto?
Income or Wage Gap in Hutto is 29.6%.
Women in Hutto earn 70.4 cents for every dollar earned by a man.
What is Inequality or Gini Index in Hutto?
Inequality or Gini Index in Hutto is 0.32.
What is the Total Population of Hutto?
Total Population of Hutto is 29,498.
What is the Total Male Population of Hutto?
Total Male Population of Hutto is 15,008.
What is the Total Female Population of Hutto?
Total Female Population of Hutto is 14,490.
What is the Ratio of Males per 100 Females in Hutto?
There are 103.57 Males per 100 Females in Hutto.
What is the Ratio of Females per 100 Males in Hutto?
There are 96.55 Females per 100 Males in Hutto.
What is the Median Population Age in Hutto?
Median Population Age in Hutto is 35.2 Years.
What is the Average Family Size in Hutto
Average Family Size in Hutto is 3.2 People.
What is the Average Household Size in Hutto
Average Household Size in Hutto is 3.0 People.
How Large is the Labor Force in Hutto?
There are 17,525 People in the Labor Forcein in Hutto.
What is the Percentage of People in the Labor Force in Hutto?
77.3% of People are in the Labor Force in Hutto.
What is the Unemployment Rate in Hutto?
Unemployment Rate in Hutto is 6.1%.