La Quinta, CA Map & Demographics
La Quinta Map
La Quinta Overview
$58,577
PER CAPITA INCOME
$111,992
AVG FAMILY INCOME
$92,776
AVG HOUSEHOLD INCOME
19.0%
WAGE / INCOME GAP [ % ]
81.0¢/ $1
WAGE / INCOME GAP [ $ ]
0.50
INEQUALITY / GINI INDEX
37,933
TOTAL POPULATION
19,760
MALE POPULATION
18,173
FEMALE POPULATION
108.73
MALES / 100 FEMALES
91.97
FEMALES / 100 MALES
51.0
MEDIAN AGE
2.9
AVG FAMILY SIZE
2.5
AVG HOUSEHOLD SIZE
16,670
LABOR FORCE [ PEOPLE ]
52.0%
PERCENT IN LABOR FORCE
8.1%
UNEMPLOYMENT RATE
La Quinta Zip Codes
La Quinta Area Codes
Income in La Quinta
Income Overview in La Quinta
Per Capita Income in La Quinta is $58,577, while median incomes of families and households are $111,992 and $92,776 respectively.
| Characteristic | Number | Measure |
| Per Capita Income | 37,933 | $58,577 |
| Median Family Income | 10,523 | $111,992 |
| Mean Family Income | 10,523 | $163,867 |
| Median Household Income | 15,392 | $92,776 |
| Mean Household Income | 15,392 | $140,692 |
| Income Deficit | 10,523 | $0 |
| Wage / Income Gap (%) | 37,933 | 18.95% |
| Wage / Income Gap ($) | 37,933 | 81.05¢ per $1 |
| Gini / Inequality Index | 37,933 | 0.50 |
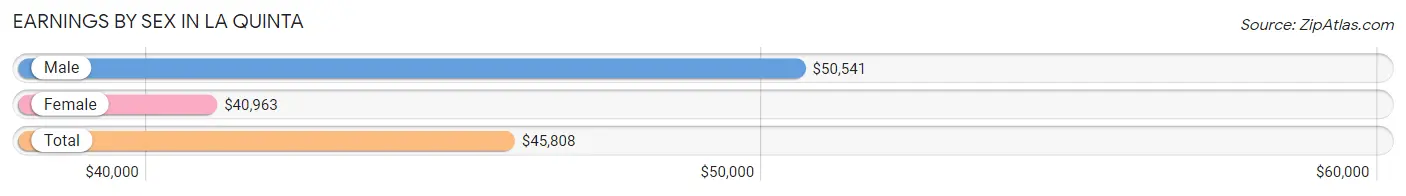
Earnings by Sex in La Quinta
Average Earnings in La Quinta are $45,808, $50,541 for men and $40,963 for women, a difference of 19.0%.
| Sex | Number | Average Earnings |
| Male | 9,643 (55.5%) | $50,541 |
| Female | 7,740 (44.5%) | $40,963 |
| Total | 17,383 (100.0%) | $45,808 |
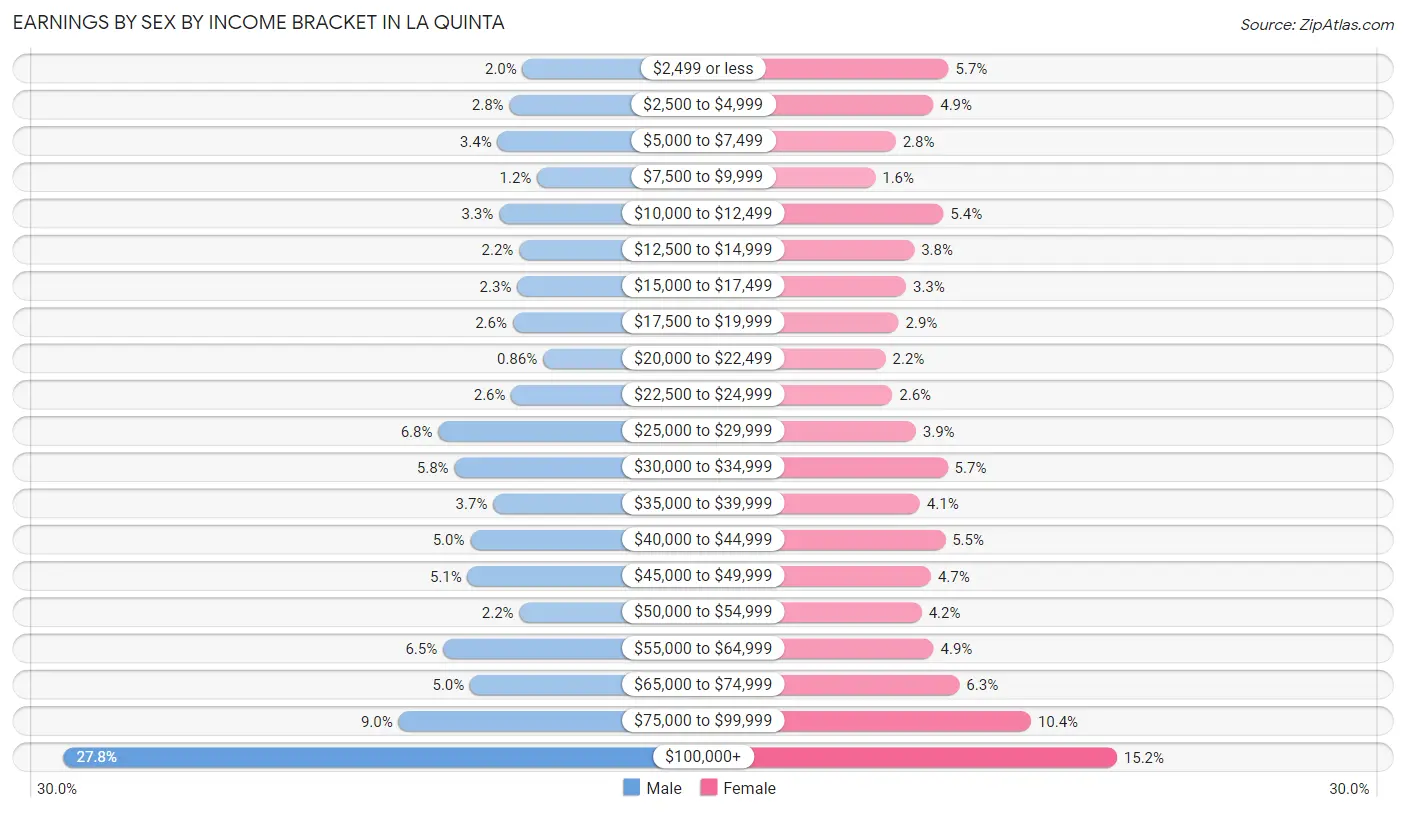
Earnings by Sex by Income Bracket in La Quinta
The most common earnings brackets in La Quinta are $100,000+ for men (2,682 | 27.8%) and $100,000+ for women (1,175 | 15.2%).
| Income | Male | Female |
| $2,499 or less | 194 (2.0%) | 443 (5.7%) |
| $2,500 to $4,999 | 265 (2.8%) | 376 (4.9%) |
| $5,000 to $7,499 | 330 (3.4%) | 213 (2.8%) |
| $7,500 to $9,999 | 115 (1.2%) | 124 (1.6%) |
| $10,000 to $12,499 | 321 (3.3%) | 420 (5.4%) |
| $12,500 to $14,999 | 212 (2.2%) | 293 (3.8%) |
| $15,000 to $17,499 | 223 (2.3%) | 258 (3.3%) |
| $17,500 to $19,999 | 247 (2.6%) | 225 (2.9%) |
| $20,000 to $22,499 | 83 (0.9%) | 169 (2.2%) |
| $22,500 to $24,999 | 255 (2.6%) | 198 (2.6%) |
| $25,000 to $29,999 | 651 (6.8%) | 300 (3.9%) |
| $30,000 to $34,999 | 563 (5.8%) | 439 (5.7%) |
| $35,000 to $39,999 | 353 (3.7%) | 318 (4.1%) |
| $40,000 to $44,999 | 477 (5.0%) | 428 (5.5%) |
| $45,000 to $49,999 | 492 (5.1%) | 366 (4.7%) |
| $50,000 to $54,999 | 211 (2.2%) | 326 (4.2%) |
| $55,000 to $64,999 | 625 (6.5%) | 378 (4.9%) |
| $65,000 to $74,999 | 478 (5.0%) | 490 (6.3%) |
| $75,000 to $99,999 | 866 (9.0%) | 801 (10.3%) |
| $100,000+ | 2,682 (27.8%) | 1,175 (15.2%) |
| Total | 9,643 (100.0%) | 7,740 (100.0%) |
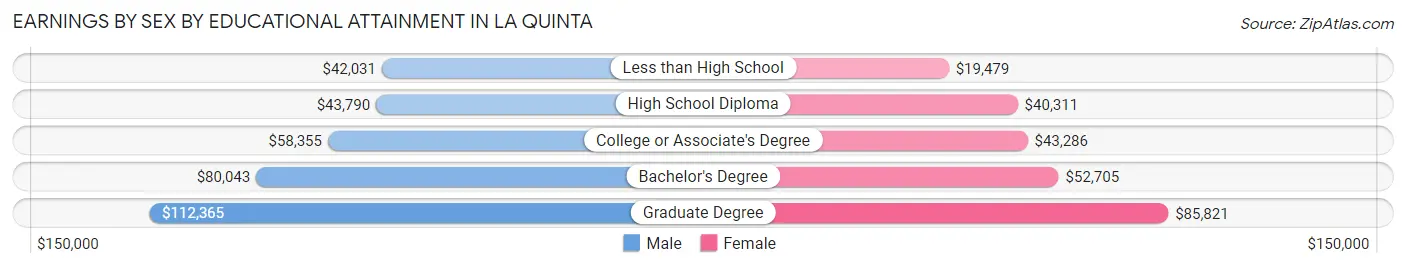
Earnings by Sex by Educational Attainment in La Quinta
Average earnings in La Quinta are $62,453 for men and $45,310 for women, a difference of 27.5%. Men with an educational attainment of graduate degree enjoy the highest average annual earnings of $112,365, while those with less than high school education earn the least with $42,031. Women with an educational attainment of graduate degree earn the most with the average annual earnings of $85,821, while those with less than high school education have the smallest earnings of $19,479.
| Educational Attainment | Male Income | Female Income |
| Less than High School | $42,031 | $19,479 |
| High School Diploma | $43,790 | $40,311 |
| College or Associate's Degree | $58,355 | $43,286 |
| Bachelor's Degree | $80,043 | $52,705 |
| Graduate Degree | $112,365 | $85,821 |
| Total | $62,453 | $45,310 |
Family Income in La Quinta
Family Income Brackets in La Quinta
According to the La Quinta family income data, there are 2,504 families falling into the $200,000+ income range, which is the most common income bracket and makes up 23.8% of all families. Conversely, the $10,000 to $14,999 income bracket is the least frequent group with only 137 families (1.3%) belonging to this category.
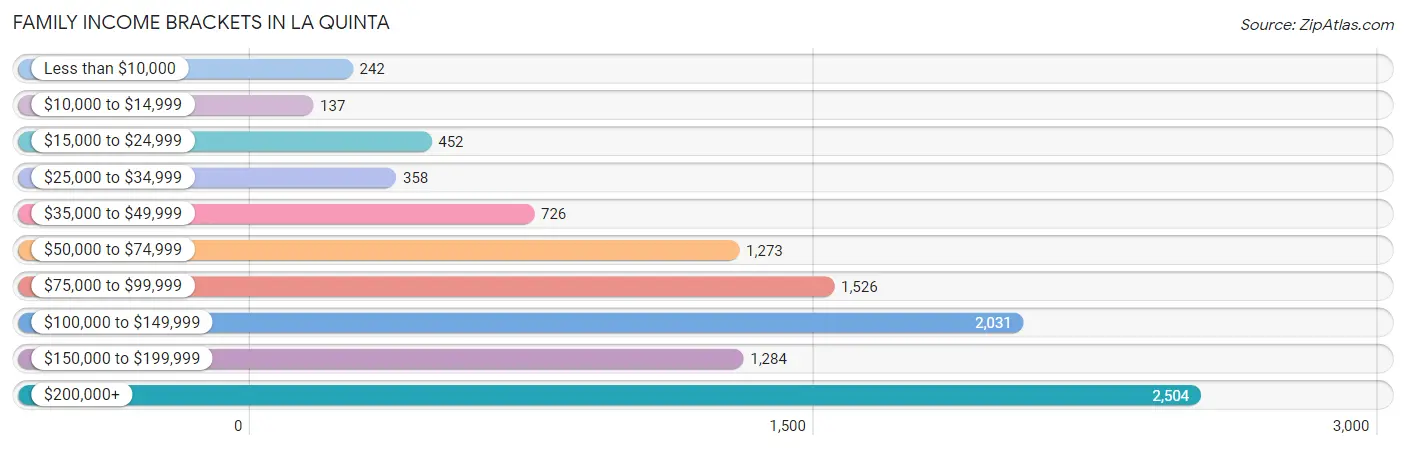
| Income Bracket | # Families | % Families |
| Less than $10,000 | 242 | 2.3% |
| $10,000 to $14,999 | 137 | 1.3% |
| $15,000 to $24,999 | 452 | 4.3% |
| $25,000 to $34,999 | 358 | 3.4% |
| $35,000 to $49,999 | 726 | 6.9% |
| $50,000 to $74,999 | 1,273 | 12.1% |
| $75,000 to $99,999 | 1,526 | 14.5% |
| $100,000 to $149,999 | 2,031 | 19.3% |
| $150,000 to $199,999 | 1,284 | 12.2% |
| $200,000+ | 2,504 | 23.8% |
Family Income by Famaliy Size in La Quinta
4-person families (1,171 | 11.1%) account for the highest median family income in La Quinta with $130,842 per family, while 2-person families (6,552 | 62.3%) have the highest median income of $57,012 per family member.
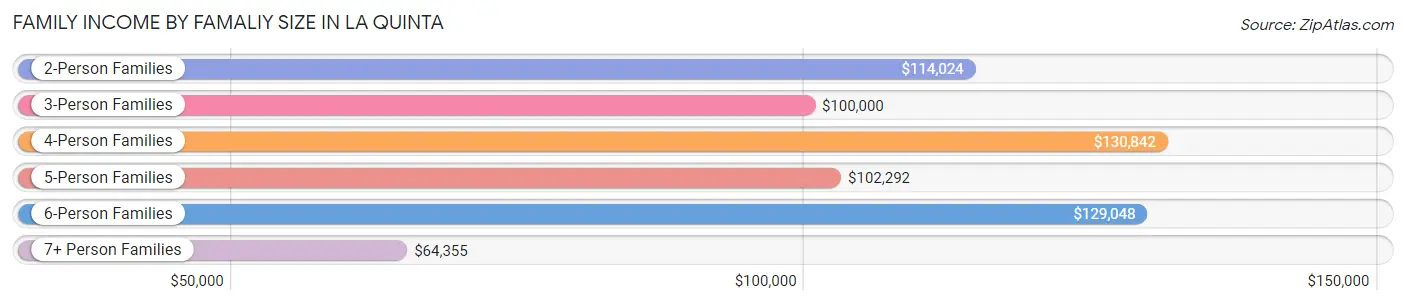
| Income Bracket | # Families | Median Income |
| 2-Person Families | 6,552 (62.3%) | $114,024 |
| 3-Person Families | 1,860 (17.7%) | $100,000 |
| 4-Person Families | 1,171 (11.1%) | $130,842 |
| 5-Person Families | 726 (6.9%) | $102,292 |
| 6-Person Families | 108 (1.0%) | $129,048 |
| 7+ Person Families | 106 (1.0%) | $64,355 |
| Total | 10,523 (100.0%) | $111,992 |
Family Income by Number of Earners in La Quinta
The median family income in La Quinta is $111,992, with families comprising 3+ earners (761) having the highest median family income of $151,797, while families with no earners (2,991) have the lowest median family income of $92,083, accounting for 7.2% and 28.4% of families, respectively.
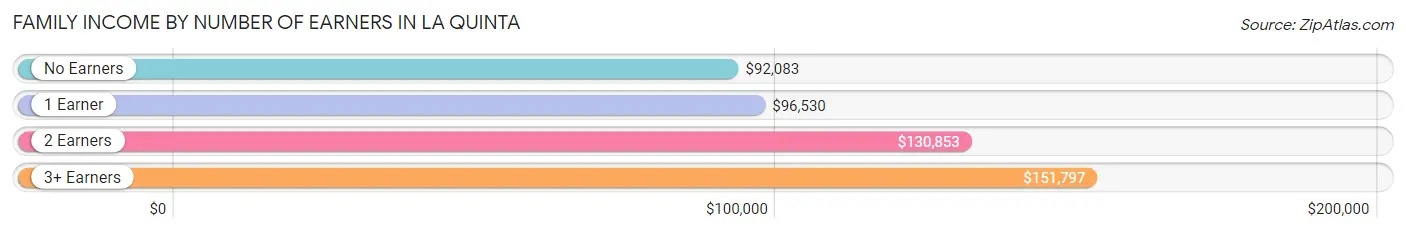
| Number of Earners | # Families | Median Income |
| No Earners | 2,991 (28.4%) | $92,083 |
| 1 Earner | 3,240 (30.8%) | $96,530 |
| 2 Earners | 3,531 (33.6%) | $130,853 |
| 3+ Earners | 761 (7.2%) | $151,797 |
| Total | 10,523 (100.0%) | $111,992 |
Household Income in La Quinta
Household Income Brackets in La Quinta
With 2,817 households falling in the category, the $200,000+ income range is the most frequent in La Quinta, accounting for 18.3% of all households. In contrast, only 185 households (1.2%) fall into the $10,000 to $14,999 income bracket, making it the least populous group.
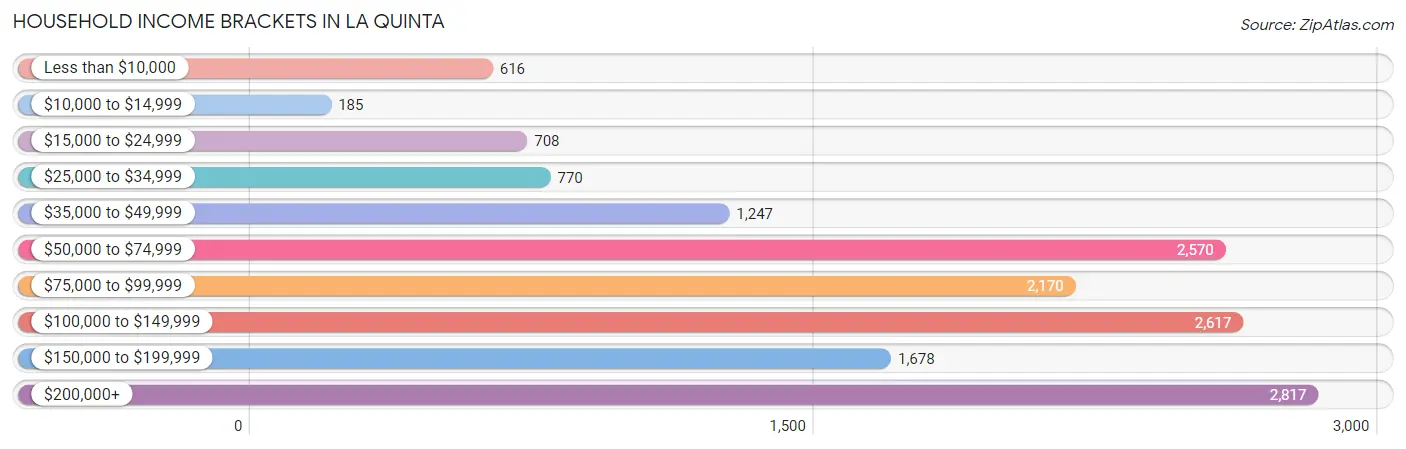
| Income Bracket | # Households | % Households |
| Less than $10,000 | 616 | 4.0% |
| $10,000 to $14,999 | 185 | 1.2% |
| $15,000 to $24,999 | 708 | 4.6% |
| $25,000 to $34,999 | 770 | 5.0% |
| $35,000 to $49,999 | 1,247 | 8.1% |
| $50,000 to $74,999 | 2,570 | 16.7% |
| $75,000 to $99,999 | 2,170 | 14.1% |
| $100,000 to $149,999 | 2,617 | 17.0% |
| $150,000 to $199,999 | 1,678 | 10.9% |
| $200,000+ | 2,817 | 18.3% |
Household Income by Householder Age in La Quinta
The median household income in La Quinta is $92,776, with the highest median household income of $110,402 found in the 45 to 64 years age bracket for the primary householder. A total of 5,152 households (33.5%) fall into this category. Meanwhile, the 15 to 24 years age bracket for the primary householder has the lowest median household income of $0, with 275 households (1.8%) in this group.
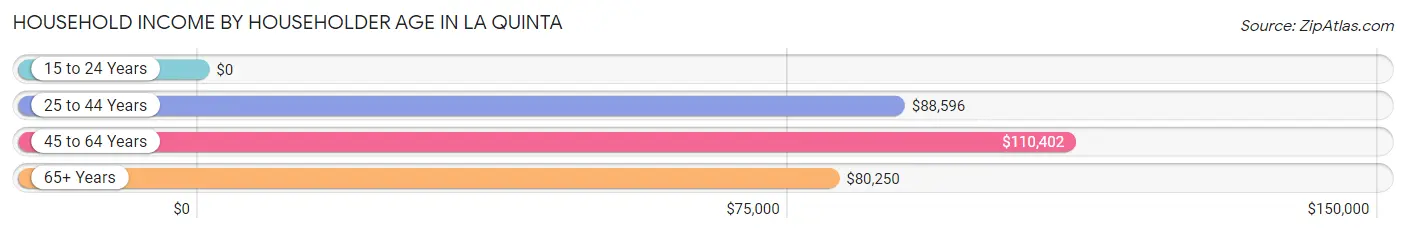
| Income Bracket | # Households | Median Income |
| 15 to 24 Years | 275 (1.8%) | $0 |
| 25 to 44 Years | 3,166 (20.6%) | $88,596 |
| 45 to 64 Years | 5,152 (33.5%) | $110,402 |
| 65+ Years | 6,799 (44.2%) | $80,250 |
| Total | 15,392 (100.0%) | $92,776 |
Poverty in La Quinta
Income Below Poverty by Sex and Age in La Quinta
With 7.5% poverty level for males and 11.7% for females among the residents of La Quinta, 6 to 11 year old males and 12 to 14 year old females are the most vulnerable to poverty, with 280 males (18.3%) and 159 females (34.4%) in their respective age groups living below the poverty level.
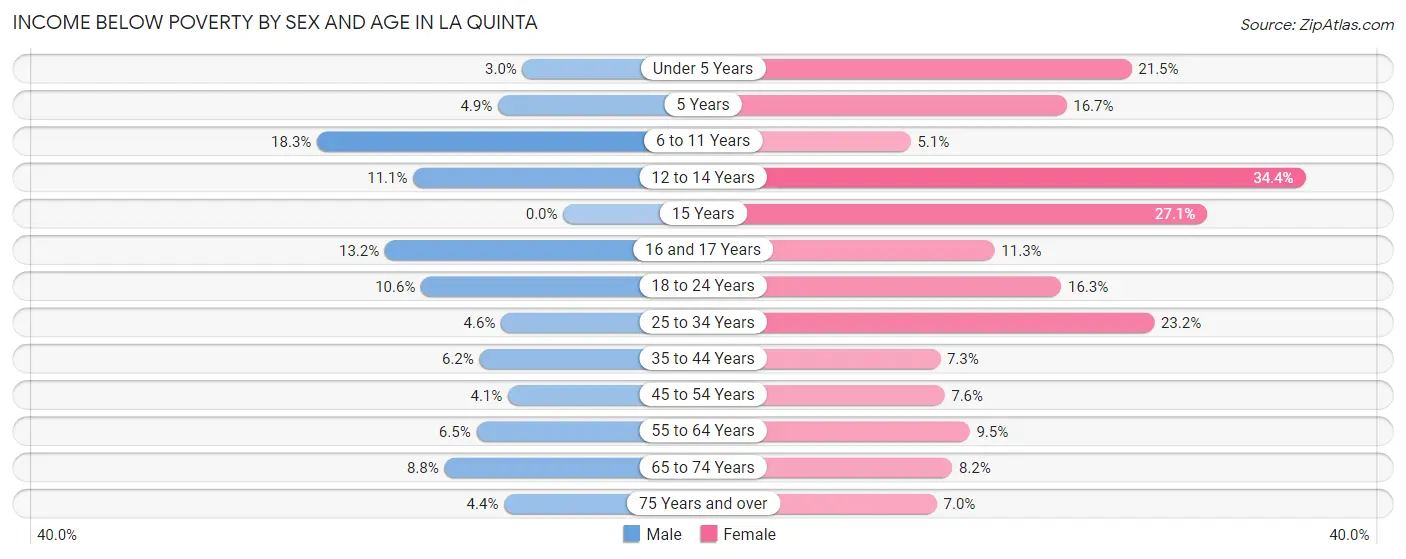
| Age Bracket | Male | Female |
| Under 5 Years | 28 (3.0%) | 143 (21.5%) |
| 5 Years | 8 (4.9%) | 25 (16.7%) |
| 6 to 11 Years | 280 (18.3%) | 40 (5.1%) |
| 12 to 14 Years | 88 (11.1%) | 159 (34.4%) |
| 15 Years | 0 (0.0%) | 32 (27.1%) |
| 16 and 17 Years | 92 (13.2%) | 41 (11.3%) |
| 18 to 24 Years | 173 (10.5%) | 177 (16.3%) |
| 25 to 34 Years | 83 (4.6%) | 513 (23.2%) |
| 35 to 44 Years | 113 (6.2%) | 91 (7.3%) |
| 45 to 54 Years | 84 (4.1%) | 162 (7.6%) |
| 55 to 64 Years | 171 (6.5%) | 278 (9.5%) |
| 65 to 74 Years | 250 (8.8%) | 295 (8.2%) |
| 75 Years and over | 114 (4.4%) | 168 (7.0%) |
| Total | 1,484 (7.5%) | 2,124 (11.7%) |
Income Above Poverty by Sex and Age in La Quinta
According to the poverty statistics in La Quinta, males aged 15 years and females aged 6 to 11 years are the age groups that are most secure financially, with 100.0% of males and 94.9% of females in these age groups living above the poverty line.
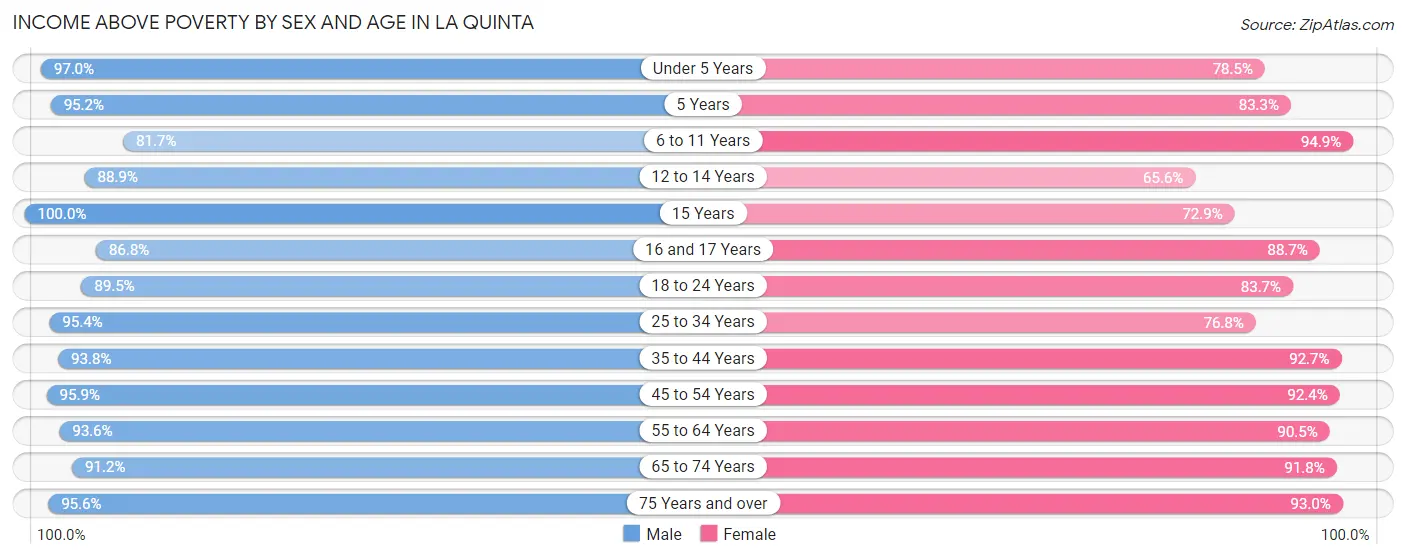
| Age Bracket | Male | Female |
| Under 5 Years | 900 (97.0%) | 522 (78.5%) |
| 5 Years | 157 (95.2%) | 125 (83.3%) |
| 6 to 11 Years | 1,252 (81.7%) | 745 (94.9%) |
| 12 to 14 Years | 702 (88.9%) | 303 (65.6%) |
| 15 Years | 178 (100.0%) | 86 (72.9%) |
| 16 and 17 Years | 603 (86.8%) | 321 (88.7%) |
| 18 to 24 Years | 1,467 (89.4%) | 910 (83.7%) |
| 25 to 34 Years | 1,716 (95.4%) | 1,700 (76.8%) |
| 35 to 44 Years | 1,705 (93.8%) | 1,157 (92.7%) |
| 45 to 54 Years | 1,964 (95.9%) | 1,967 (92.4%) |
| 55 to 64 Years | 2,481 (93.5%) | 2,653 (90.5%) |
| 65 to 74 Years | 2,583 (91.2%) | 3,310 (91.8%) |
| 75 Years and over | 2,481 (95.6%) | 2,217 (93.0%) |
| Total | 18,189 (92.5%) | 16,016 (88.3%) |
Income Below Poverty Among Married-Couple Families in La Quinta
The poverty statistics for married-couple families in La Quinta show that 4.4% or 369 of the total 8,403 families live below the poverty line. Families with 3 or 4 children have the highest poverty rate of 9.1%, comprising of 25 families. On the other hand, families with no children have the lowest poverty rate of 3.7%, which includes 234 families.
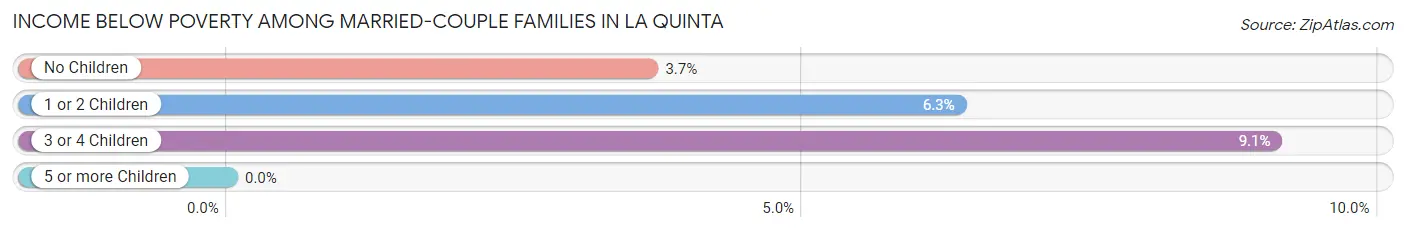
| Children | Above Poverty | Below Poverty |
| No Children | 6,159 (96.3%) | 234 (3.7%) |
| 1 or 2 Children | 1,625 (93.7%) | 110 (6.3%) |
| 3 or 4 Children | 250 (90.9%) | 25 (9.1%) |
| 5 or more Children | 0 (0.0%) | 0 (0.0%) |
| Total | 8,034 (95.6%) | 369 (4.4%) |
Income Below Poverty Among Single-Parent Households in La Quinta
According to the poverty data in La Quinta, 5.3% or 35 single-father households and 20.3% or 295 single-mother households are living below the poverty line. Among single-father households, those with 1 or 2 children have the highest poverty rate, with 35 households (8.6%) experiencing poverty. Likewise, among single-mother households, those with 3 or 4 children have the highest poverty rate, with 80 households (69.6%) falling below the poverty line.
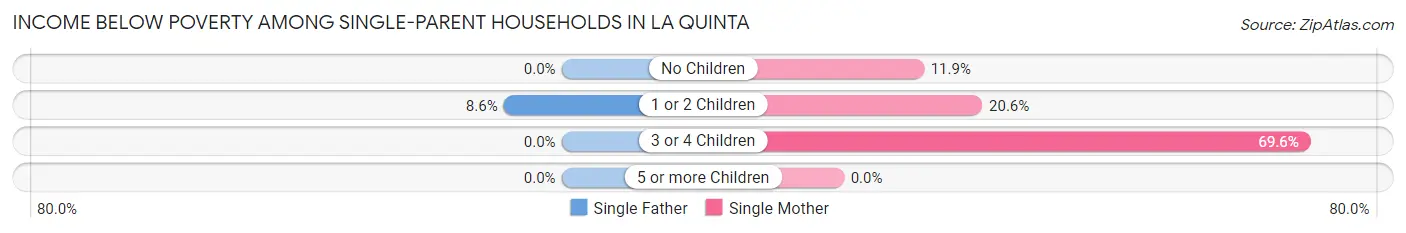
| Children | Single Father | Single Mother |
| No Children | 0 (0.0%) | 84 (11.9%) |
| 1 or 2 Children | 35 (8.6%) | 131 (20.6%) |
| 3 or 4 Children | 0 (0.0%) | 80 (69.6%) |
| 5 or more Children | 0 (0.0%) | 0 (0.0%) |
| Total | 35 (5.3%) | 295 (20.3%) |
Income Below Poverty Among Married-Couple vs Single-Parent Households in La Quinta
The poverty data for La Quinta shows that 369 of the married-couple family households (4.4%) and 330 of the single-parent households (15.6%) are living below the poverty level. Within the married-couple family households, those with 3 or 4 children have the highest poverty rate, with 25 households (9.1%) falling below the poverty line. Among the single-parent households, those with 3 or 4 children have the highest poverty rate, with 80 household (41.9%) living below poverty.
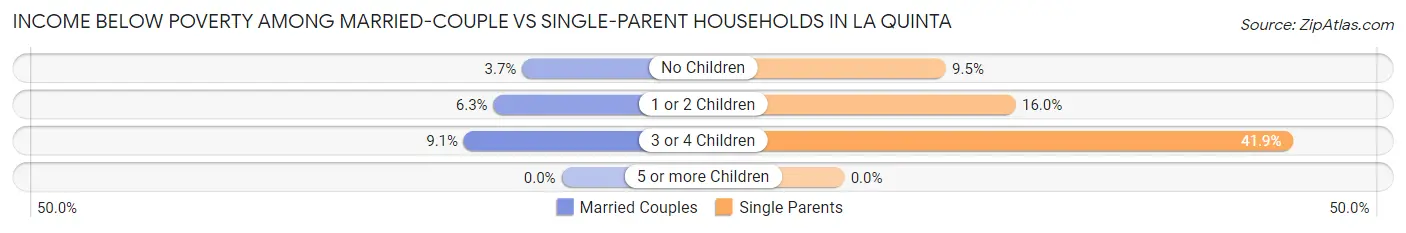
| Children | Married-Couple Families | Single-Parent Households |
| No Children | 234 (3.7%) | 84 (9.5%) |
| 1 or 2 Children | 110 (6.3%) | 166 (16.0%) |
| 3 or 4 Children | 25 (9.1%) | 80 (41.9%) |
| 5 or more Children | 0 (0.0%) | 0 (0.0%) |
| Total | 369 (4.4%) | 330 (15.6%) |
Race in La Quinta
The most populous races in La Quinta are White / Caucasian (24,732 | 65.2%), Hispanic or Latino (13,866 | 36.5%), and Two or more Races (6,107 | 16.1%).
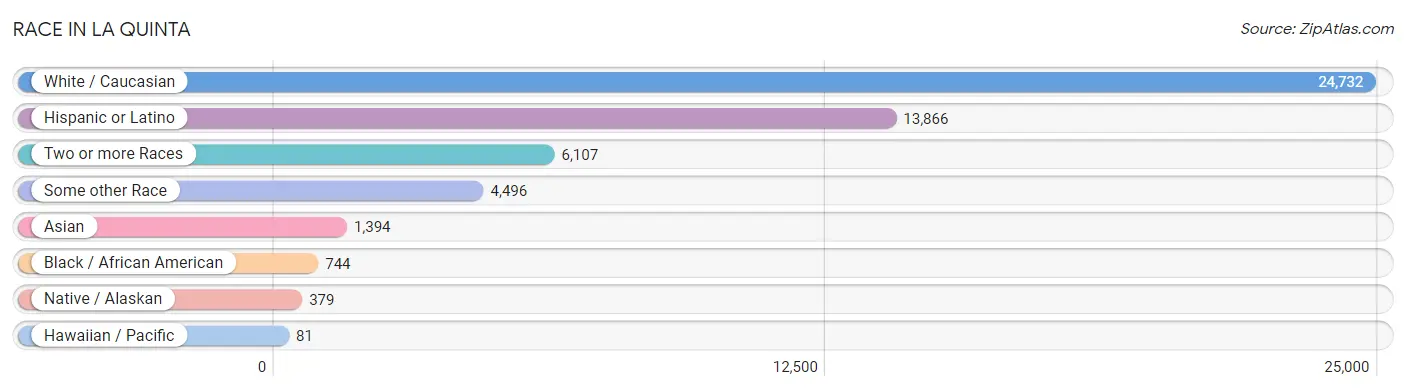
| Race | # Population | % Population |
| Asian | 1,394 | 3.7% |
| Black / African American | 744 | 2.0% |
| Hawaiian / Pacific | 81 | 0.2% |
| Hispanic or Latino | 13,866 | 36.5% |
| Native / Alaskan | 379 | 1.0% |
| White / Caucasian | 24,732 | 65.2% |
| Two or more Races | 6,107 | 16.1% |
| Some other Race | 4,496 | 11.8% |
| Total | 37,933 | 100.0% |
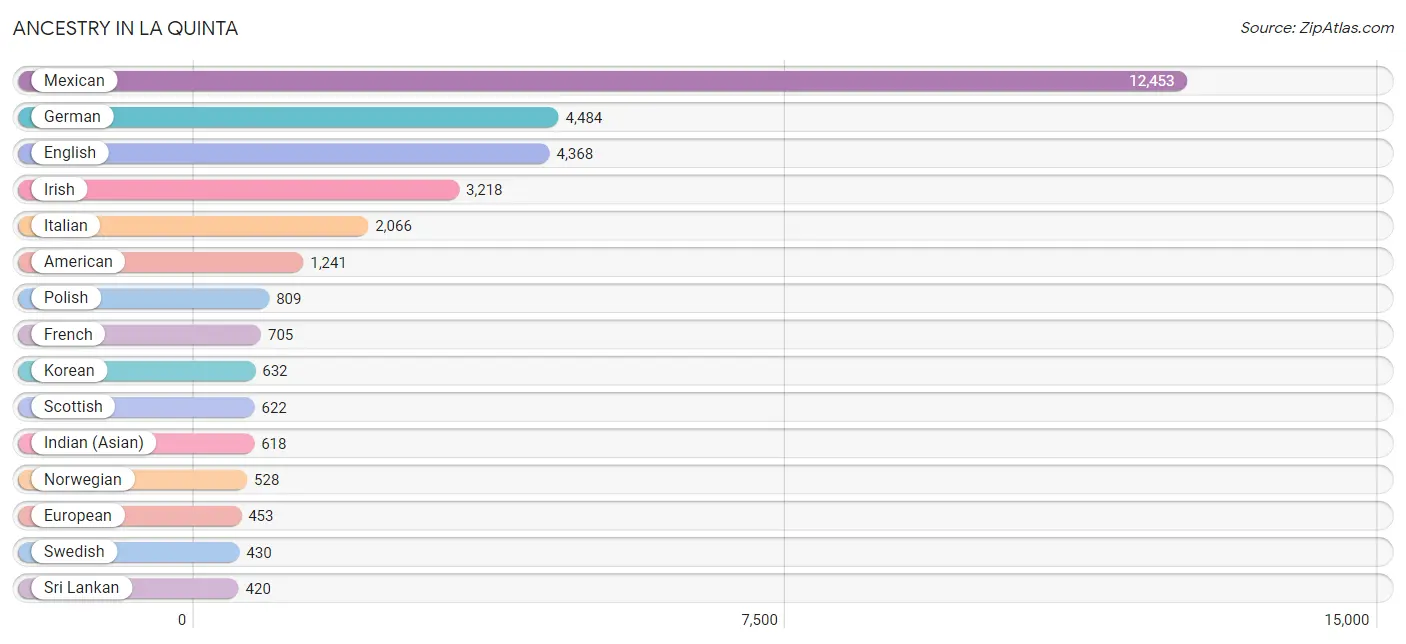
Ancestry in La Quinta
The most populous ancestries reported in La Quinta are Mexican (12,453 | 32.8%), German (4,484 | 11.8%), English (4,368 | 11.5%), Irish (3,218 | 8.5%), and Italian (2,066 | 5.4%), together accounting for 70.1% of all La Quinta residents.
| Ancestry | # Population | % Population |
| African | 97 | 0.3% |
| Albanian | 15 | 0.0% |
| American | 1,241 | 3.3% |
| Apache | 34 | 0.1% |
| Arab | 167 | 0.4% |
| Argentinean | 96 | 0.3% |
| Armenian | 194 | 0.5% |
| Australian | 51 | 0.1% |
| Austrian | 173 | 0.5% |
| Basque | 23 | 0.1% |
| Belgian | 52 | 0.1% |
| Bhutanese | 199 | 0.5% |
| Blackfeet | 128 | 0.3% |
| Brazilian | 10 | 0.0% |
| British | 285 | 0.7% |
| Bulgarian | 21 | 0.1% |
| Burmese | 73 | 0.2% |
| Canadian | 371 | 1.0% |
| Central American | 266 | 0.7% |
| Cherokee | 166 | 0.4% |
| Chickasaw | 16 | 0.0% |
| Chilean | 54 | 0.1% |
| Choctaw | 14 | 0.0% |
| Colombian | 45 | 0.1% |
| Croatian | 102 | 0.3% |
| Cuban | 107 | 0.3% |
| Czech | 226 | 0.6% |
| Czechoslovakian | 59 | 0.2% |
| Danish | 131 | 0.4% |
| Dutch | 326 | 0.9% |
| Eastern European | 193 | 0.5% |
| Ecuadorian | 7 | 0.0% |
| Egyptian | 63 | 0.2% |
| English | 4,368 | 11.5% |
| Estonian | 33 | 0.1% |
| European | 453 | 1.2% |
| Filipino | 114 | 0.3% |
| Finnish | 79 | 0.2% |
| French | 705 | 1.9% |
| French American Indian | 8 | 0.0% |
| French Canadian | 402 | 1.1% |
| German | 4,484 | 11.8% |
| Ghanaian | 6 | 0.0% |
| Greek | 166 | 0.4% |
| Guamanian / Chamorro | 48 | 0.1% |
| Guatemalan | 174 | 0.5% |
| Hungarian | 154 | 0.4% |
| Indian (Asian) | 618 | 1.6% |
| Iranian | 25 | 0.1% |
| Irish | 3,218 | 8.5% |
| Italian | 2,066 | 5.4% |
| Korean | 632 | 1.7% |
| Laotian | 11 | 0.0% |
| Latvian | 11 | 0.0% |
| Lebanese | 37 | 0.1% |
| Lithuanian | 45 | 0.1% |
| Mexican | 12,453 | 32.8% |
| Mexican American Indian | 118 | 0.3% |
| Moroccan | 17 | 0.0% |
| Native Hawaiian | 9 | 0.0% |
| Navajo | 16 | 0.0% |
| Nicaraguan | 30 | 0.1% |
| Northern European | 102 | 0.3% |
| Norwegian | 528 | 1.4% |
| Pakistani | 17 | 0.0% |
| Palestinian | 37 | 0.1% |
| Panamanian | 31 | 0.1% |
| Pennsylvania German | 16 | 0.0% |
| Peruvian | 58 | 0.2% |
| Polish | 809 | 2.1% |
| Portuguese | 219 | 0.6% |
| Potawatomi | 17 | 0.0% |
| Puerto Rican | 139 | 0.4% |
| Romanian | 50 | 0.1% |
| Russian | 287 | 0.8% |
| Salvadoran | 31 | 0.1% |
| Samoan | 28 | 0.1% |
| Scandinavian | 186 | 0.5% |
| Scotch-Irish | 329 | 0.9% |
| Scottish | 622 | 1.6% |
| Serbian | 11 | 0.0% |
| Shoshone | 8 | 0.0% |
| Sioux | 8 | 0.0% |
| Slavic | 15 | 0.0% |
| Slovak | 123 | 0.3% |
| South American | 260 | 0.7% |
| Spaniard | 295 | 0.8% |
| Spanish | 172 | 0.4% |
| Spanish American | 15 | 0.0% |
| Spanish American Indian | 15 | 0.0% |
| Sri Lankan | 420 | 1.1% |
| Subsaharan African | 103 | 0.3% |
| Swedish | 430 | 1.1% |
| Swiss | 177 | 0.5% |
| Syrian | 13 | 0.0% |
| Thai | 384 | 1.0% |
| Tongan | 26 | 0.1% |
| Turkish | 18 | 0.1% |
| Ukrainian | 52 | 0.1% |
| Welsh | 155 | 0.4% |
| Yaqui | 115 | 0.3% |
| Yugoslavian | 8 | 0.0% | View All 102 Rows |
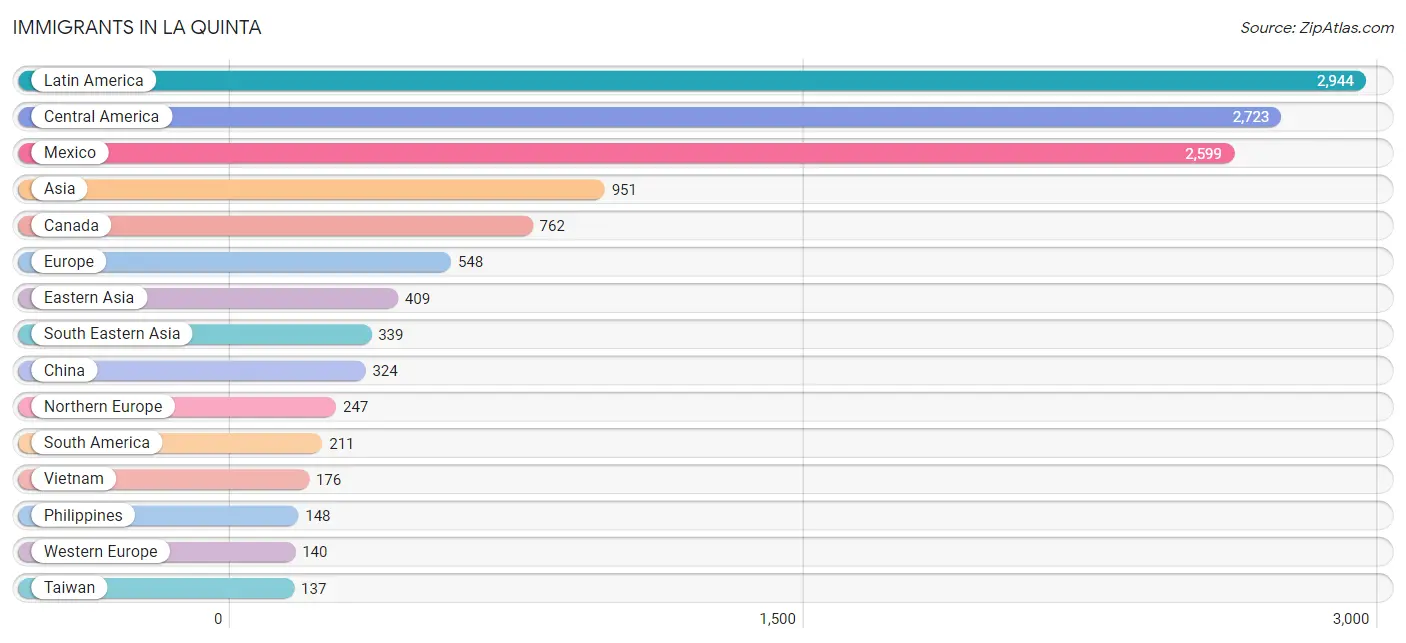
Immigrants in La Quinta
The most numerous immigrant groups reported in La Quinta came from Latin America (2,944 | 7.8%), Central America (2,723 | 7.2%), Mexico (2,599 | 6.9%), Asia (951 | 2.5%), and Canada (762 | 2.0%), together accounting for 26.3% of all La Quinta residents.
| Immigration Origin | # Population | % Population |
| Africa | 135 | 0.4% |
| Albania | 3 | 0.0% |
| Argentina | 96 | 0.3% |
| Armenia | 65 | 0.2% |
| Asia | 951 | 2.5% |
| Australia | 17 | 0.0% |
| Brazil | 22 | 0.1% |
| Canada | 762 | 2.0% |
| Caribbean | 10 | 0.0% |
| Central America | 2,723 | 7.2% |
| China | 324 | 0.9% |
| Colombia | 43 | 0.1% |
| Czechoslovakia | 20 | 0.1% |
| Denmark | 3 | 0.0% |
| Eastern Africa | 31 | 0.1% |
| Eastern Asia | 409 | 1.1% |
| Eastern Europe | 108 | 0.3% |
| Egypt | 40 | 0.1% |
| El Salvador | 3 | 0.0% |
| England | 124 | 0.3% |
| Europe | 548 | 1.4% |
| France | 8 | 0.0% |
| Germany | 89 | 0.2% |
| Greece | 15 | 0.0% |
| Guatemala | 103 | 0.3% |
| Hong Kong | 24 | 0.1% |
| India | 57 | 0.2% |
| Iran | 27 | 0.1% |
| Ireland | 34 | 0.1% |
| Israel | 13 | 0.0% |
| Italy | 28 | 0.1% |
| Japan | 48 | 0.1% |
| Korea | 37 | 0.1% |
| Latin America | 2,944 | 7.8% |
| Mexico | 2,599 | 6.9% |
| Netherlands | 43 | 0.1% |
| Nicaragua | 10 | 0.0% |
| North Macedonia | 5 | 0.0% |
| Northern Africa | 40 | 0.1% |
| Northern Europe | 247 | 0.6% |
| Oceania | 52 | 0.1% |
| Pakistan | 27 | 0.1% |
| Panama | 8 | 0.0% |
| Peru | 50 | 0.1% |
| Philippines | 148 | 0.4% |
| Poland | 45 | 0.1% |
| Romania | 24 | 0.1% |
| Scotland | 56 | 0.2% |
| Sierra Leone | 28 | 0.1% |
| Singapore | 15 | 0.0% |
| South Africa | 36 | 0.1% |
| South America | 211 | 0.6% |
| South Central Asia | 111 | 0.3% |
| South Eastern Asia | 339 | 0.9% |
| Southern Europe | 53 | 0.1% |
| Spain | 10 | 0.0% |
| Taiwan | 137 | 0.4% |
| Trinidad and Tobago | 9 | 0.0% |
| Vietnam | 176 | 0.5% |
| West Indies | 1 | 0.0% |
| Western Africa | 28 | 0.1% |
| Western Asia | 78 | 0.2% |
| Western Europe | 140 | 0.4% | View All 63 Rows |
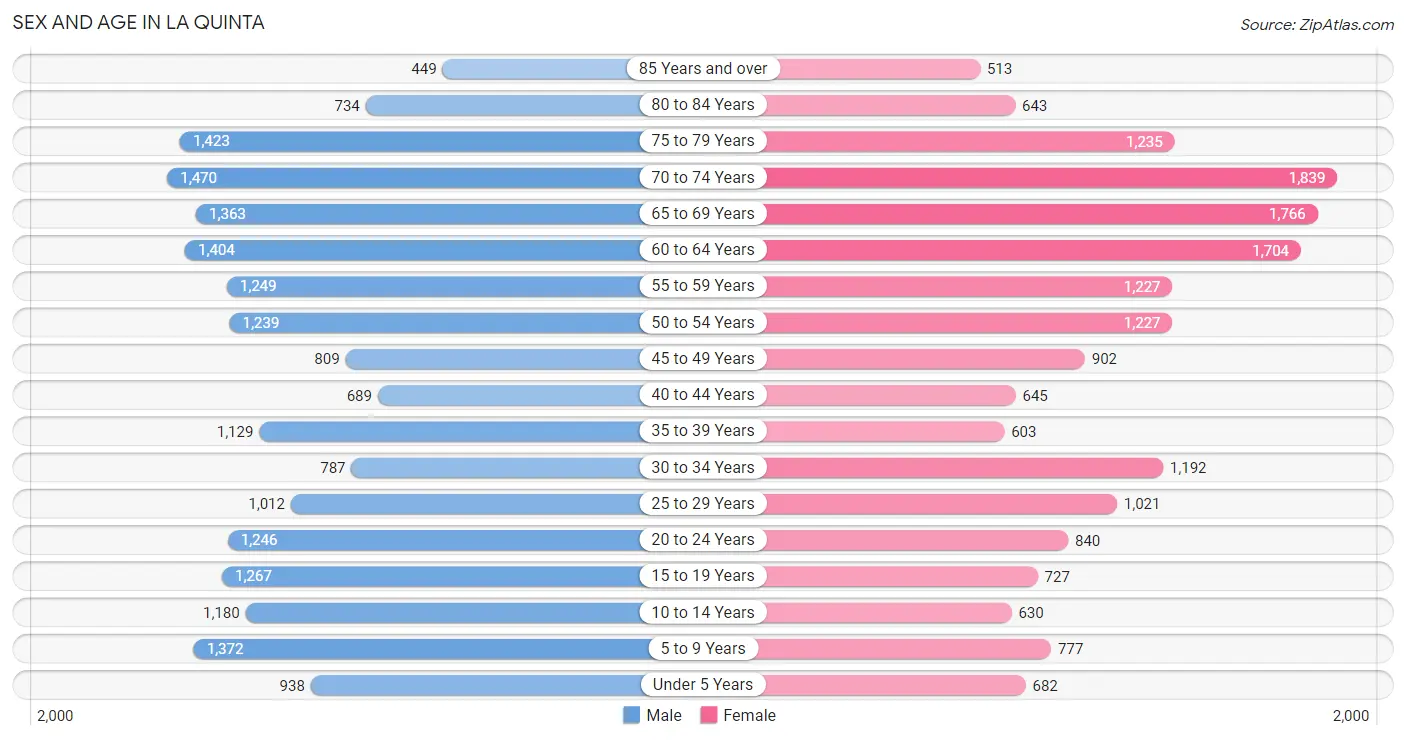
Sex and Age in La Quinta
Sex and Age in La Quinta
The most populous age groups in La Quinta are 70 to 74 Years (1,470 | 7.4%) for men and 70 to 74 Years (1,839 | 10.1%) for women.
| Age Bracket | Male | Female |
| Under 5 Years | 938 (4.8%) | 682 (3.7%) |
| 5 to 9 Years | 1,372 (6.9%) | 777 (4.3%) |
| 10 to 14 Years | 1,180 (6.0%) | 630 (3.5%) |
| 15 to 19 Years | 1,267 (6.4%) | 727 (4.0%) |
| 20 to 24 Years | 1,246 (6.3%) | 840 (4.6%) |
| 25 to 29 Years | 1,012 (5.1%) | 1,021 (5.6%) |
| 30 to 34 Years | 787 (4.0%) | 1,192 (6.6%) |
| 35 to 39 Years | 1,129 (5.7%) | 603 (3.3%) |
| 40 to 44 Years | 689 (3.5%) | 645 (3.5%) |
| 45 to 49 Years | 809 (4.1%) | 902 (5.0%) |
| 50 to 54 Years | 1,239 (6.3%) | 1,227 (6.8%) |
| 55 to 59 Years | 1,249 (6.3%) | 1,227 (6.8%) |
| 60 to 64 Years | 1,404 (7.1%) | 1,704 (9.4%) |
| 65 to 69 Years | 1,363 (6.9%) | 1,766 (9.7%) |
| 70 to 74 Years | 1,470 (7.4%) | 1,839 (10.1%) |
| 75 to 79 Years | 1,423 (7.2%) | 1,235 (6.8%) |
| 80 to 84 Years | 734 (3.7%) | 643 (3.5%) |
| 85 Years and over | 449 (2.3%) | 513 (2.8%) |
| Total | 19,760 (100.0%) | 18,173 (100.0%) |
Families and Households in La Quinta
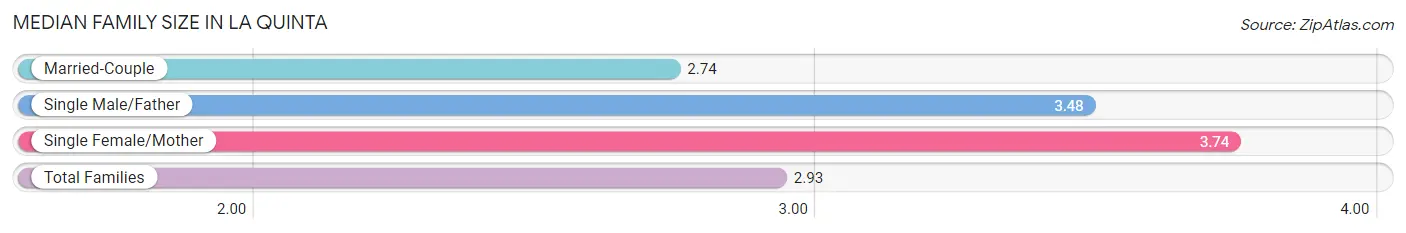
Median Family Size in La Quinta
The median family size in La Quinta is 2.93 persons per family, with single female/mother families (1,454 | 13.8%) accounting for the largest median family size of 3.74 persons per family. On the other hand, married-couple families (8,403 | 79.8%) represent the smallest median family size with 2.74 persons per family.
| Family Type | # Families | Family Size |
| Married-Couple | 8,403 (79.8%) | 2.74 |
| Single Male/Father | 666 (6.3%) | 3.48 |
| Single Female/Mother | 1,454 (13.8%) | 3.74 |
| Total Families | 10,523 (100.0%) | 2.93 |
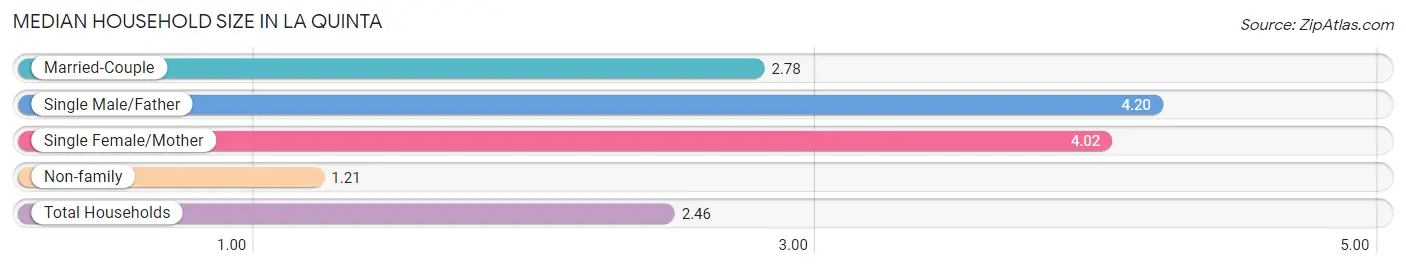
Median Household Size in La Quinta
The median household size in La Quinta is 2.46 persons per household, with single male/father households (666 | 4.3%) accounting for the largest median household size of 4.2 persons per household. non-family households (4,869 | 31.6%) represent the smallest median household size with 1.21 persons per household.
| Household Type | # Households | Household Size |
| Married-Couple | 8,403 (54.6%) | 2.78 |
| Single Male/Father | 666 (4.3%) | 4.20 |
| Single Female/Mother | 1,454 (9.5%) | 4.02 |
| Non-family | 4,869 (31.6%) | 1.21 |
| Total Households | 15,392 (100.0%) | 2.46 |
Household Size by Marriage Status in La Quinta
Out of a total of 15,392 households in La Quinta, 10,523 (68.4%) are family households, while 4,869 (31.6%) are nonfamily households. The most numerous type of family households are 2-person households, comprising 6,234, and the most common type of nonfamily households are 1-person households, comprising 3,979.
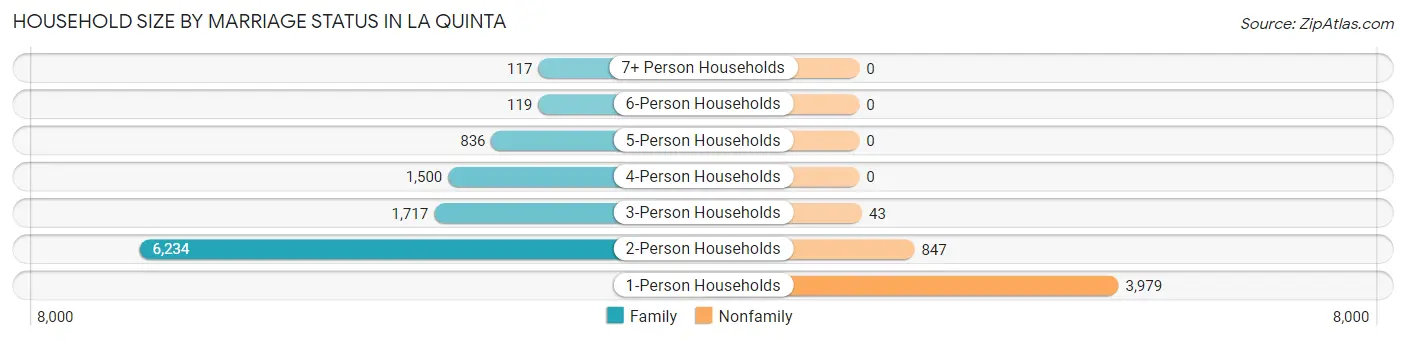
| Household Size | Family Households | Nonfamily Households |
| 1-Person Households | - | 3,979 (25.9%) |
| 2-Person Households | 6,234 (40.5%) | 847 (5.5%) |
| 3-Person Households | 1,717 (11.2%) | 43 (0.3%) |
| 4-Person Households | 1,500 (9.8%) | 0 (0.0%) |
| 5-Person Households | 836 (5.4%) | 0 (0.0%) |
| 6-Person Households | 119 (0.8%) | 0 (0.0%) |
| 7+ Person Households | 117 (0.8%) | 0 (0.0%) |
| Total | 10,523 (68.4%) | 4,869 (31.6%) |
Female Fertility in La Quinta
Fertility by Age in La Quinta
Average fertility rate in La Quinta is 46.0 births per 1,000 women. Women in the age bracket of 20 to 34 years have the highest fertility rate with 87.0 births per 1,000 women. Women in the age bracket of 20 to 34 years acount for 93.3% of all women with births.
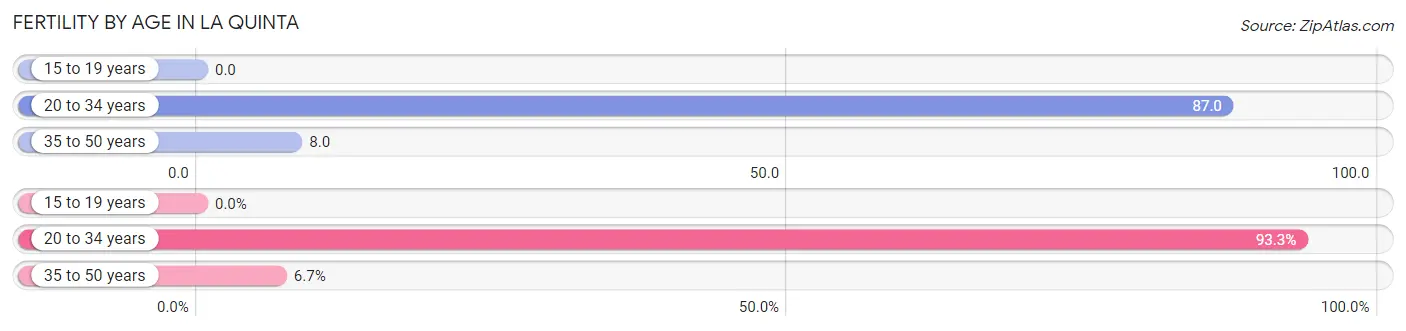
| Age Bracket | Women with Births | Births / 1,000 Women |
| 15 to 19 years | 0 (0.0%) | 0.0 |
| 20 to 34 years | 265 (93.3%) | 87.0 |
| 35 to 50 years | 19 (6.7%) | 8.0 |
| Total | 284 (100.0%) | 46.0 |
Fertility by Age by Marriage Status in La Quinta
82.0% of women with births (284) in La Quinta are married. The highest percentage of unmarried women with births falls into 20 to 34 years age bracket with 19.3% of them unmarried at the time of birth, while the lowest percentage of unmarried women with births belong to 35 to 50 years age bracket with 0.0% of them unmarried.
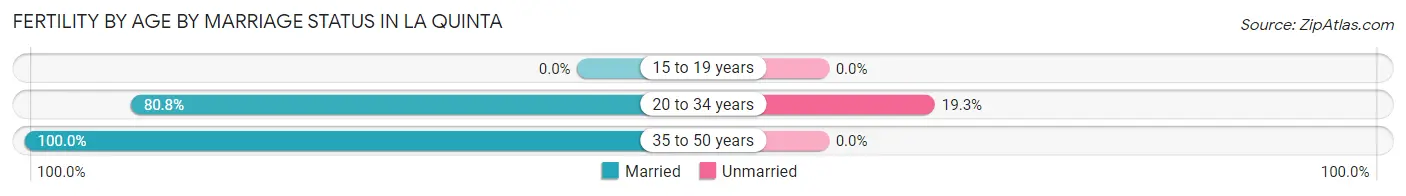
| Age Bracket | Married | Unmarried |
| 15 to 19 years | 0 (0.0%) | 0 (0.0%) |
| 20 to 34 years | 214 (80.7%) | 51 (19.3%) |
| 35 to 50 years | 19 (100.0%) | 0 (0.0%) |
| Total | 233 (82.0%) | 51 (18.0%) |
Fertility by Education in La Quinta
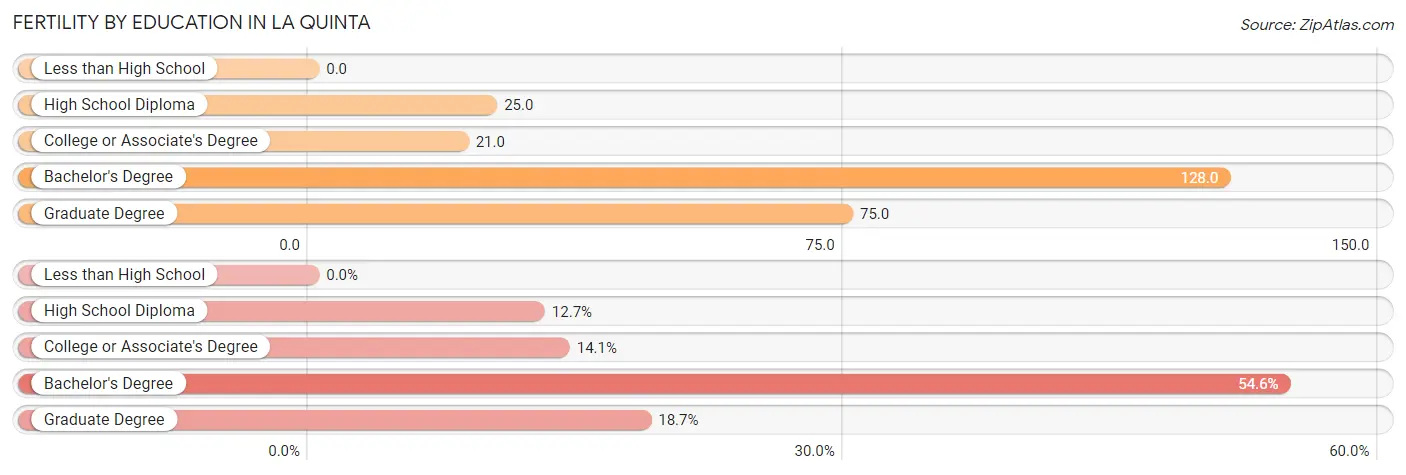
| Educational Attainment | Women with Births | Births / 1,000 Women |
| Less than High School | 0 (0.0%) | 0.0 |
| High School Diploma | 36 (12.7%) | 25.0 |
| College or Associate's Degree | 40 (14.1%) | 21.0 |
| Bachelor's Degree | 155 (54.6%) | 128.0 |
| Graduate Degree | 53 (18.7%) | 75.0 |
| Total | 284 (100.0%) | 46.0 |
Fertility by Education by Marriage Status in La Quinta
18.0% of women with births in La Quinta are unmarried. Women with the educational attainment of high school diploma are most likely to be married with 100.0% of them married at childbirth, while women with the educational attainment of college or associate's degree are least likely to be married with 77.5% of them unmarried at childbirth.
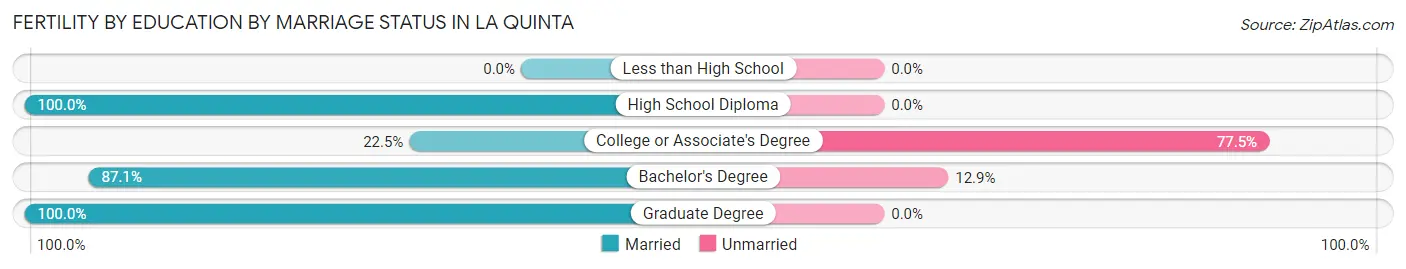
| Educational Attainment | Married | Unmarried |
| Less than High School | 0 (0.0%) | 0 (0.0%) |
| High School Diploma | 36 (100.0%) | 0 (0.0%) |
| College or Associate's Degree | 9 (22.5%) | 31 (77.5%) |
| Bachelor's Degree | 135 (87.1%) | 20 (12.9%) |
| Graduate Degree | 53 (100.0%) | 0 (0.0%) |
| Total | 233 (82.0%) | 51 (18.0%) |
Employment Characteristics in La Quinta
Employment by Class of Employer in La Quinta
Among the 14,934 employed individuals in La Quinta, private company employees (9,116 | 61.0%), local government employees (1,785 | 11.9%), and self-employed (not incorporated) (1,454 | 9.7%) make up the most common classes of employment.
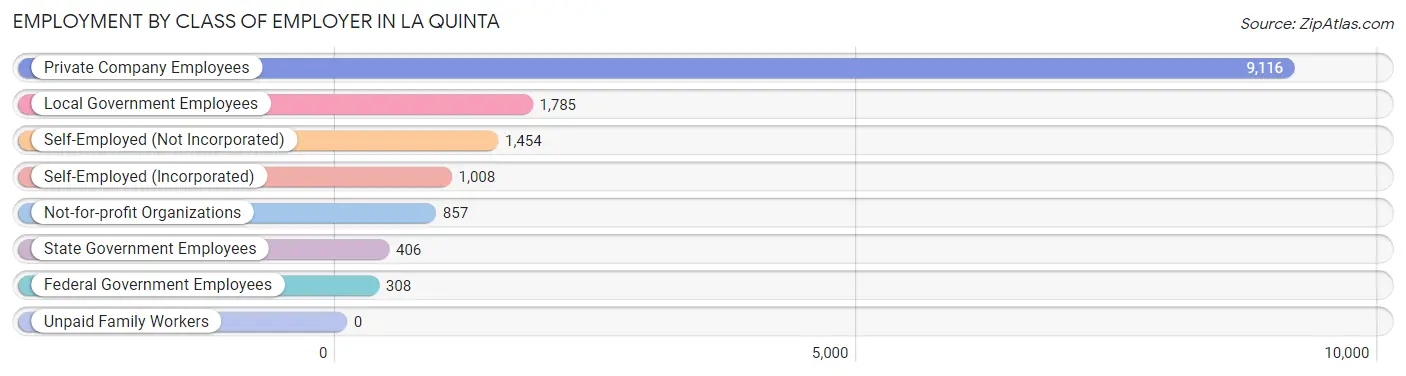
| Employer Class | # Employees | % Employees |
| Private Company Employees | 9,116 | 61.0% |
| Self-Employed (Incorporated) | 1,008 | 6.8% |
| Self-Employed (Not Incorporated) | 1,454 | 9.7% |
| Not-for-profit Organizations | 857 | 5.7% |
| Local Government Employees | 1,785 | 11.9% |
| State Government Employees | 406 | 2.7% |
| Federal Government Employees | 308 | 2.1% |
| Unpaid Family Workers | 0 | 0.0% |
| Total | 14,934 | 100.0% |
Employment Status by Age in La Quinta
According to the labor force statistics for La Quinta, out of the total population over 16 years of age (32,058), 52.0% or 16,670 individuals are in the labor force, with 8.1% or 1,350 of them unemployed. The age group with the highest labor force participation rate is 35 to 44 years, with 90.2% or 2,766 individuals in the labor force. Within the labor force, the 16 to 19 years age range has the highest percentage of unemployed individuals, with 30.1% or 130 of them being unemployed.
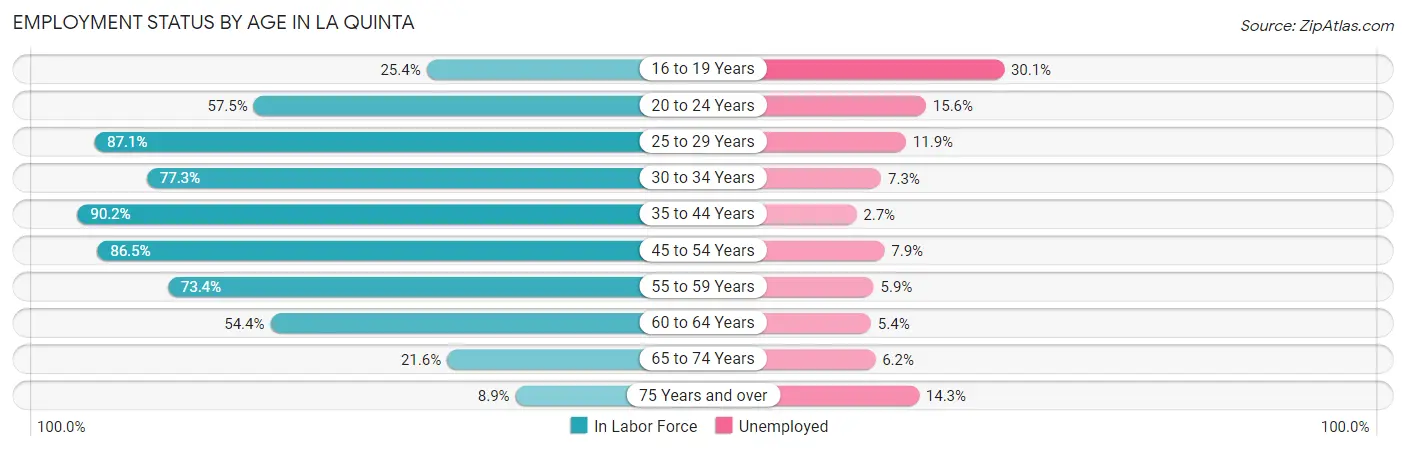
| Age Bracket | In Labor Force | Unemployed |
| 16 to 19 Years | 431 (25.4%) | 130 (30.1%) |
| 20 to 24 Years | 1,199 (57.5%) | 187 (15.6%) |
| 25 to 29 Years | 1,771 (87.1%) | 211 (11.9%) |
| 30 to 34 Years | 1,530 (77.3%) | 112 (7.3%) |
| 35 to 44 Years | 2,766 (90.2%) | 75 (2.7%) |
| 45 to 54 Years | 3,613 (86.5%) | 285 (7.9%) |
| 55 to 59 Years | 1,817 (73.4%) | 107 (5.9%) |
| 60 to 64 Years | 1,691 (54.4%) | 91 (5.4%) |
| 65 to 74 Years | 1,391 (21.6%) | 86 (6.2%) |
| 75 Years and over | 445 (8.9%) | 64 (14.3%) |
| Total | 16,670 (52.0%) | 1,350 (8.1%) |
Employment Status by Educational Attainment in La Quinta
According to labor force statistics for La Quinta, 78.3% of individuals (13,185) out of the total population between 25 and 64 years of age (16,839) are in the labor force, with 6.7% or 883 of them being unemployed. The group with the highest labor force participation rate are those with the educational attainment of high school diploma, with 81.2% or 3,262 individuals in the labor force. Within the labor force, individuals with college / associate degree education have the highest percentage of unemployment, with 9.3% or 402 of them being unemployed.
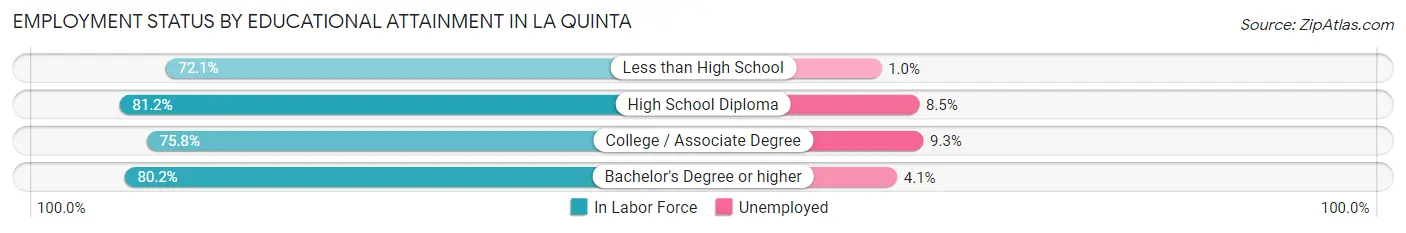
| Educational Attainment | In Labor Force | Unemployed |
| Less than High School | 913 (72.1%) | 13 (1.0%) |
| High School Diploma | 3,262 (81.2%) | 341 (8.5%) |
| College / Associate Degree | 4,327 (75.8%) | 531 (9.3%) |
| Bachelor's Degree or higher | 4,689 (80.2%) | 240 (4.1%) |
| Total | 13,185 (78.3%) | 1,128 (6.7%) |
Employment Occupations by Sex in La Quinta
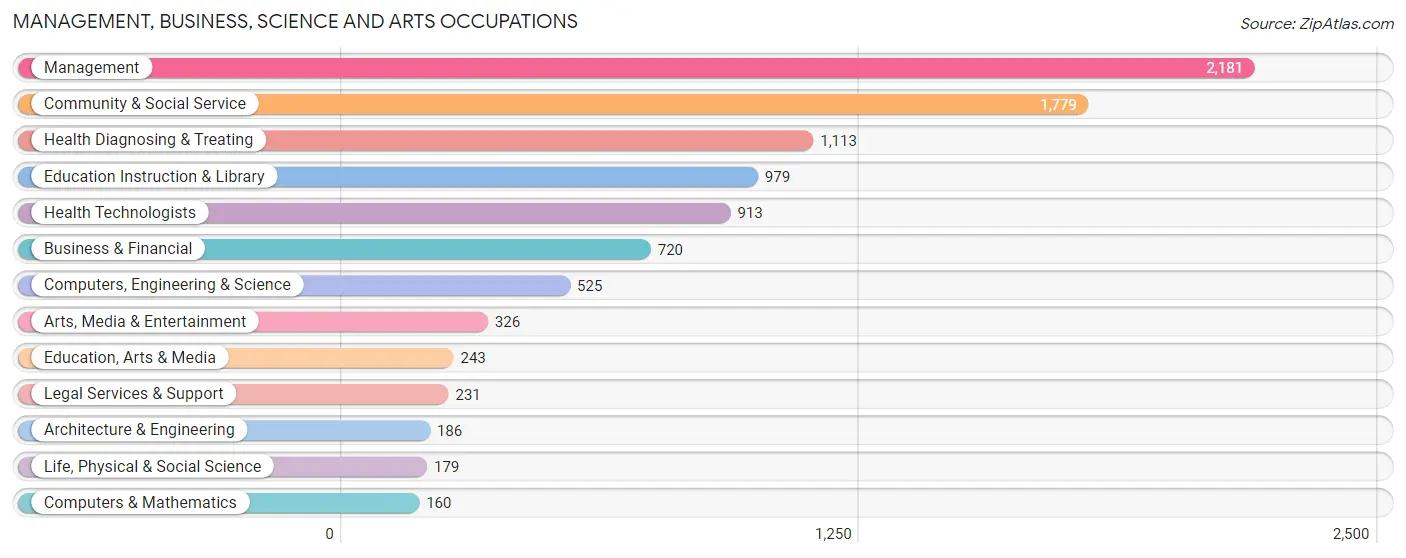
Management, Business, Science and Arts Occupations
The most common Management, Business, Science and Arts occupations in La Quinta are Management (2,181 | 14.3%), Community & Social Service (1,779 | 11.6%), Health Diagnosing & Treating (1,113 | 7.3%), Education Instruction & Library (979 | 6.4%), and Health Technologists (913 | 6.0%).
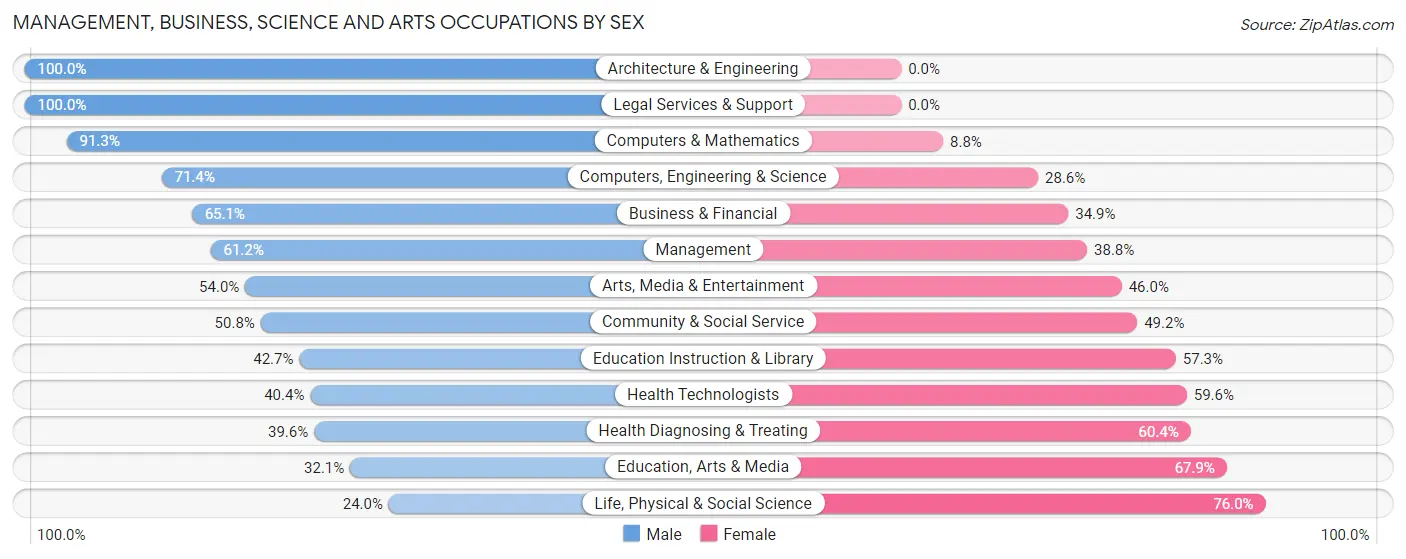
Management, Business, Science and Arts Occupations by Sex
Within the Management, Business, Science and Arts occupations in La Quinta, the most male-oriented occupations are Architecture & Engineering (100.0%), Legal Services & Support (100.0%), and Computers & Mathematics (91.2%), while the most female-oriented occupations are Life, Physical & Social Science (76.0%), Education, Arts & Media (67.9%), and Health Diagnosing & Treating (60.4%).
| Occupation | Male | Female |
| Management | 1,335 (61.2%) | 846 (38.8%) |
| Business & Financial | 469 (65.1%) | 251 (34.9%) |
| Computers, Engineering & Science | 375 (71.4%) | 150 (28.6%) |
| Computers & Mathematics | 146 (91.2%) | 14 (8.7%) |
| Architecture & Engineering | 186 (100.0%) | 0 (0.0%) |
| Life, Physical & Social Science | 43 (24.0%) | 136 (76.0%) |
| Community & Social Service | 903 (50.8%) | 876 (49.2%) |
| Education, Arts & Media | 78 (32.1%) | 165 (67.9%) |
| Legal Services & Support | 231 (100.0%) | 0 (0.0%) |
| Education Instruction & Library | 418 (42.7%) | 561 (57.3%) |
| Arts, Media & Entertainment | 176 (54.0%) | 150 (46.0%) |
| Health Diagnosing & Treating | 441 (39.6%) | 672 (60.4%) |
| Health Technologists | 369 (40.4%) | 544 (59.6%) |
| Total (Category) | 3,523 (55.8%) | 2,795 (44.2%) |
| Total (Overall) | 8,659 (56.7%) | 6,627 (43.3%) |
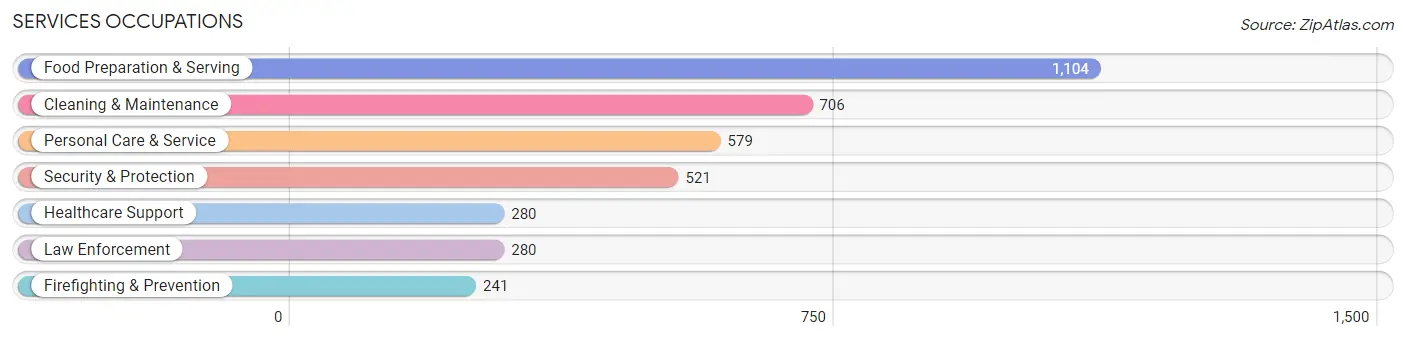
Services Occupations
The most common Services occupations in La Quinta are Food Preparation & Serving (1,104 | 7.2%), Cleaning & Maintenance (706 | 4.6%), Personal Care & Service (579 | 3.8%), Security & Protection (521 | 3.4%), and Healthcare Support (280 | 1.8%).
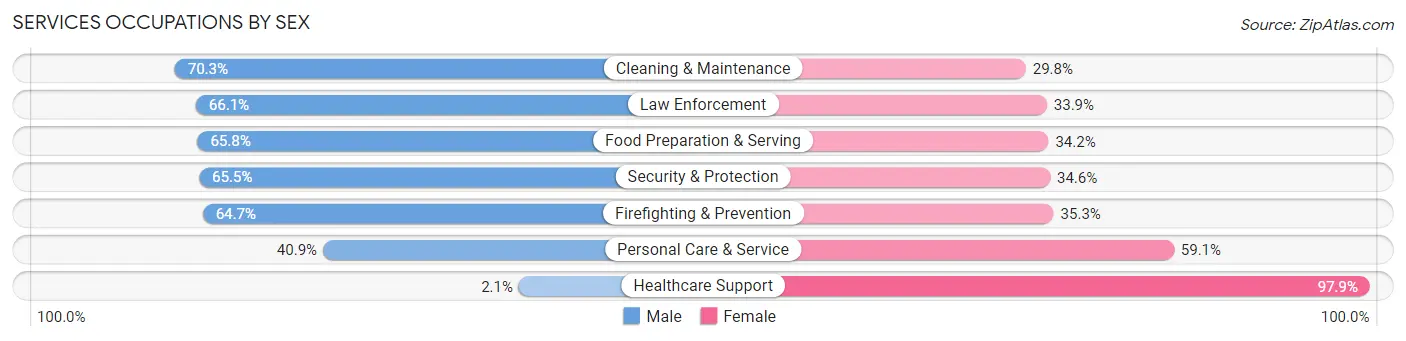
Services Occupations by Sex
Within the Services occupations in La Quinta, the most male-oriented occupations are Cleaning & Maintenance (70.3%), Law Enforcement (66.1%), and Food Preparation & Serving (65.8%), while the most female-oriented occupations are Healthcare Support (97.9%), Personal Care & Service (59.1%), and Firefighting & Prevention (35.3%).
| Occupation | Male | Female |
| Healthcare Support | 6 (2.1%) | 274 (97.9%) |
| Security & Protection | 341 (65.4%) | 180 (34.5%) |
| Firefighting & Prevention | 156 (64.7%) | 85 (35.3%) |
| Law Enforcement | 185 (66.1%) | 95 (33.9%) |
| Food Preparation & Serving | 726 (65.8%) | 378 (34.2%) |
| Cleaning & Maintenance | 496 (70.3%) | 210 (29.7%) |
| Personal Care & Service | 237 (40.9%) | 342 (59.1%) |
| Total (Category) | 1,806 (56.6%) | 1,384 (43.4%) |
| Total (Overall) | 8,659 (56.7%) | 6,627 (43.3%) |
Sales and Office Occupations
The most common Sales and Office occupations in La Quinta are Office & Administration (1,785 | 11.7%), and Sales & Related (1,459 | 9.5%).
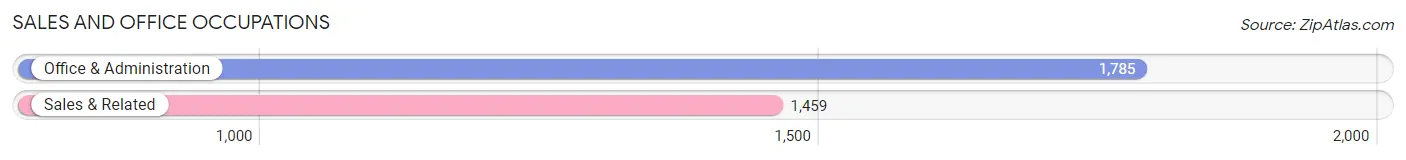
Sales and Office Occupations by Sex
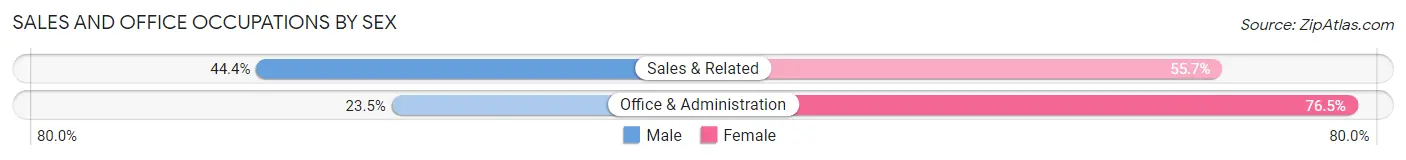
| Occupation | Male | Female |
| Sales & Related | 647 (44.4%) | 812 (55.6%) |
| Office & Administration | 420 (23.5%) | 1,365 (76.5%) |
| Total (Category) | 1,067 (32.9%) | 2,177 (67.1%) |
| Total (Overall) | 8,659 (56.7%) | 6,627 (43.3%) |
Natural Resources, Construction and Maintenance Occupations
The most common Natural Resources, Construction and Maintenance occupations in La Quinta are Construction & Extraction (754 | 4.9%), Installation, Maintenance & Repair (658 | 4.3%), and Farming, Fishing & Forestry (112 | 0.7%).
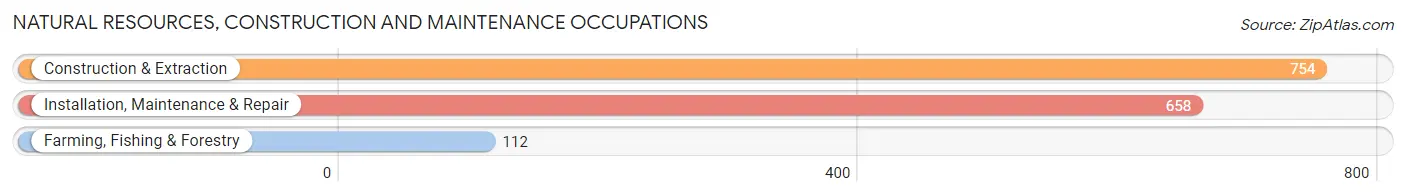
Natural Resources, Construction and Maintenance Occupations by Sex
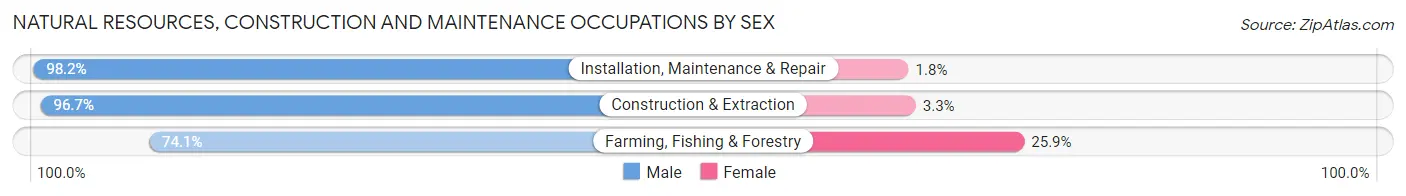
| Occupation | Male | Female |
| Farming, Fishing & Forestry | 83 (74.1%) | 29 (25.9%) |
| Construction & Extraction | 729 (96.7%) | 25 (3.3%) |
| Installation, Maintenance & Repair | 646 (98.2%) | 12 (1.8%) |
| Total (Category) | 1,458 (95.7%) | 66 (4.3%) |
| Total (Overall) | 8,659 (56.7%) | 6,627 (43.3%) |
Production, Transportation and Moving Occupations
The most common Production, Transportation and Moving occupations in La Quinta are Transportation (525 | 3.4%), Production (332 | 2.2%), and Material Moving (153 | 1.0%).
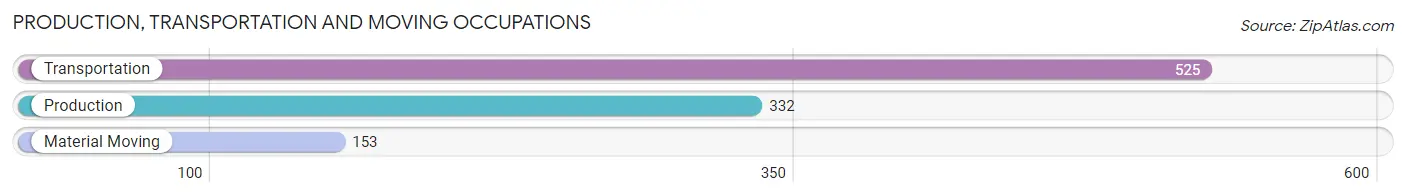
Production, Transportation and Moving Occupations by Sex
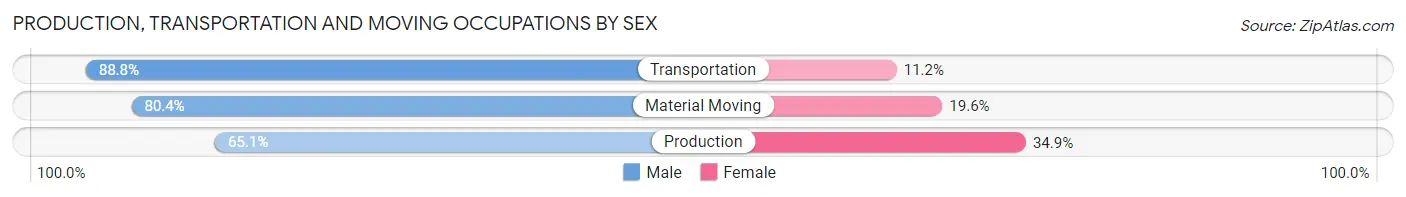
| Occupation | Male | Female |
| Production | 216 (65.1%) | 116 (34.9%) |
| Transportation | 466 (88.8%) | 59 (11.2%) |
| Material Moving | 123 (80.4%) | 30 (19.6%) |
| Total (Category) | 805 (79.7%) | 205 (20.3%) |
| Total (Overall) | 8,659 (56.7%) | 6,627 (43.3%) |
Employment Industries by Sex in La Quinta
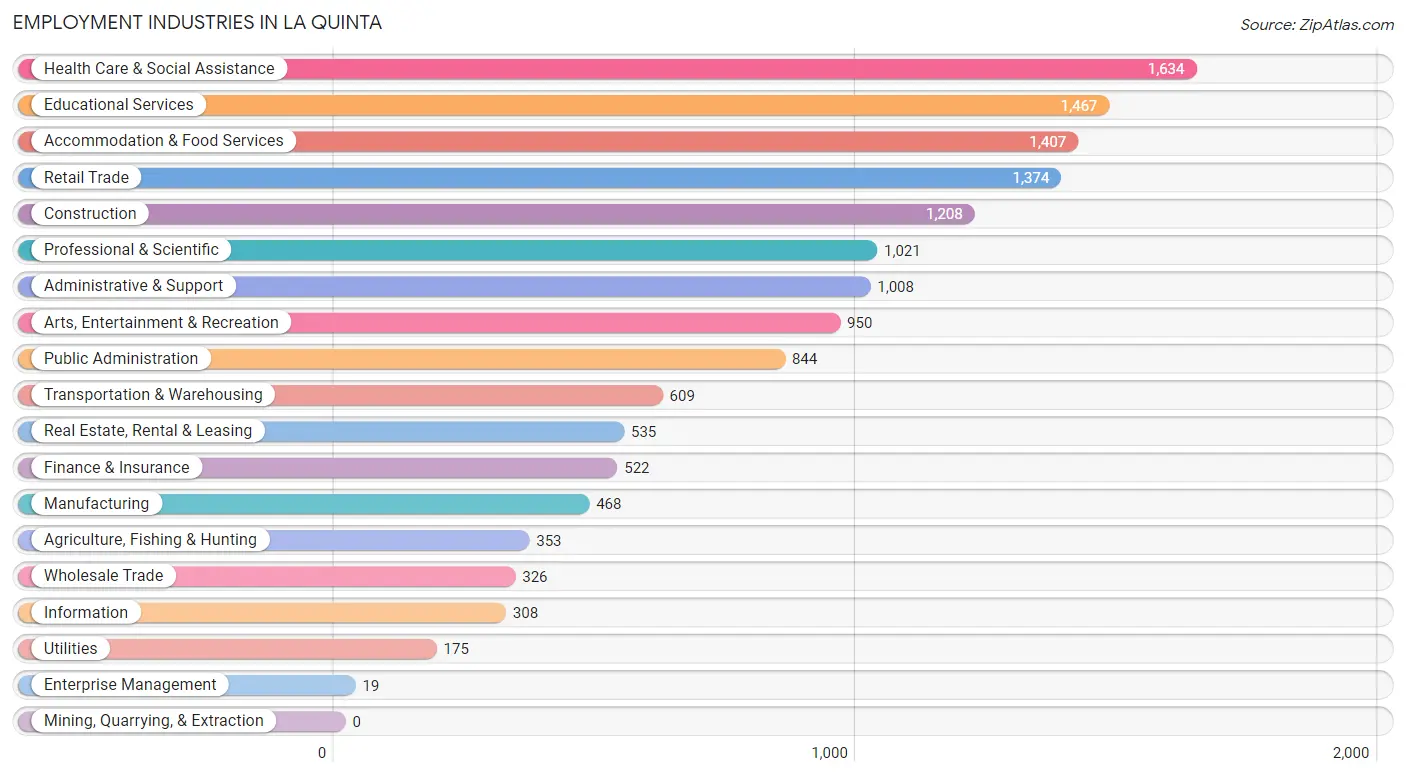
Employment Industries in La Quinta
The major employment industries in La Quinta include Health Care & Social Assistance (1,634 | 10.7%), Educational Services (1,467 | 9.6%), Accommodation & Food Services (1,407 | 9.2%), Retail Trade (1,374 | 9.0%), and Construction (1,208 | 7.9%).
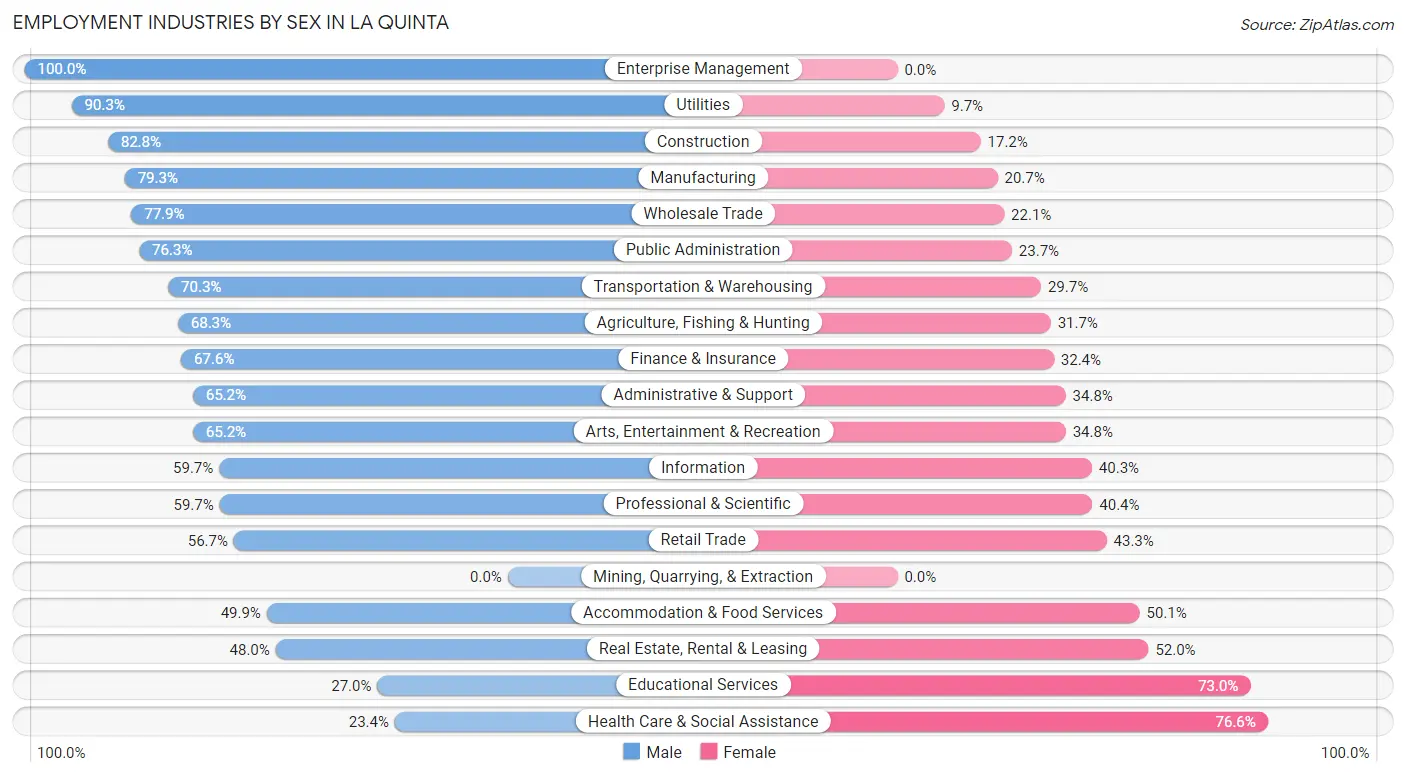
Employment Industries by Sex in La Quinta
The La Quinta industries that see more men than women are Enterprise Management (100.0%), Utilities (90.3%), and Construction (82.8%), whereas the industries that tend to have a higher number of women are Health Care & Social Assistance (76.6%), Educational Services (73.0%), and Real Estate, Rental & Leasing (52.0%).
| Industry | Male | Female |
| Agriculture, Fishing & Hunting | 241 (68.3%) | 112 (31.7%) |
| Mining, Quarrying, & Extraction | 0 (0.0%) | 0 (0.0%) |
| Construction | 1,000 (82.8%) | 208 (17.2%) |
| Manufacturing | 371 (79.3%) | 97 (20.7%) |
| Wholesale Trade | 254 (77.9%) | 72 (22.1%) |
| Retail Trade | 779 (56.7%) | 595 (43.3%) |
| Transportation & Warehousing | 428 (70.3%) | 181 (29.7%) |
| Utilities | 158 (90.3%) | 17 (9.7%) |
| Information | 184 (59.7%) | 124 (40.3%) |
| Finance & Insurance | 353 (67.6%) | 169 (32.4%) |
| Real Estate, Rental & Leasing | 257 (48.0%) | 278 (52.0%) |
| Professional & Scientific | 609 (59.7%) | 412 (40.4%) |
| Enterprise Management | 19 (100.0%) | 0 (0.0%) |
| Administrative & Support | 657 (65.2%) | 351 (34.8%) |
| Educational Services | 396 (27.0%) | 1,071 (73.0%) |
| Health Care & Social Assistance | 382 (23.4%) | 1,252 (76.6%) |
| Arts, Entertainment & Recreation | 619 (65.2%) | 331 (34.8%) |
| Accommodation & Food Services | 702 (49.9%) | 705 (50.1%) |
| Public Administration | 644 (76.3%) | 200 (23.7%) |
| Total | 8,659 (56.7%) | 6,627 (43.3%) |
Education in La Quinta
School Enrollment in La Quinta
The most common levels of schooling among the 7,540 students in La Quinta are high school (1,821 | 24.1%), college / undergraduate (1,794 | 23.8%), and elementary school (1,512 | 20.1%).
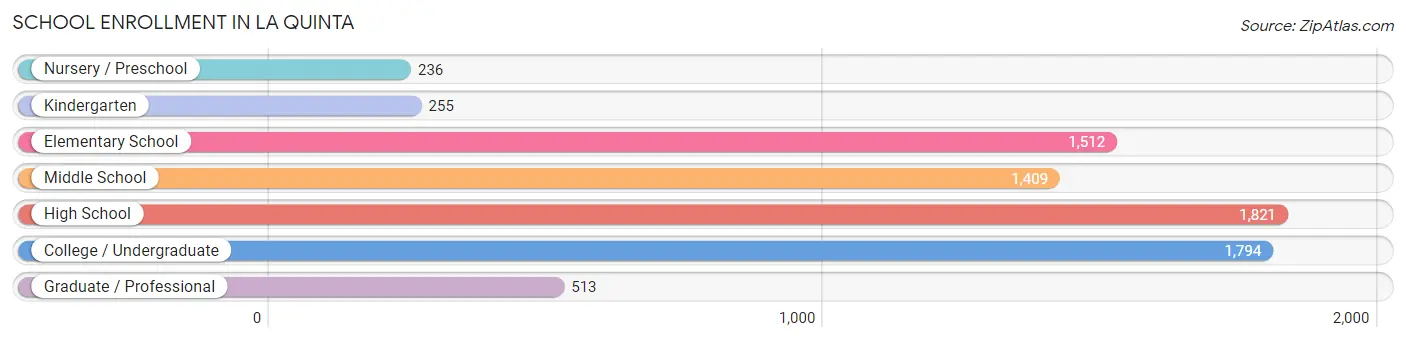
| School Level | # Students | % Students |
| Nursery / Preschool | 236 | 3.1% |
| Kindergarten | 255 | 3.4% |
| Elementary School | 1,512 | 20.1% |
| Middle School | 1,409 | 18.7% |
| High School | 1,821 | 24.1% |
| College / Undergraduate | 1,794 | 23.8% |
| Graduate / Professional | 513 | 6.8% |
| Total | 7,540 | 100.0% |
School Enrollment by Age by Funding Source in La Quinta
Out of a total of 7,540 students who are enrolled in schools in La Quinta, 1,214 (16.1%) attend a private institution, while the remaining 6,326 (83.9%) are enrolled in public schools. The age group of 3 to 4 year olds has the highest likelihood of being enrolled in private schools, with 121 (73.8% in the age bracket) enrolled. Conversely, the age group of 18 to 19 year olds has the lowest likelihood of being enrolled in a private school, with 509 (93.2% in the age bracket) attending a public institution.
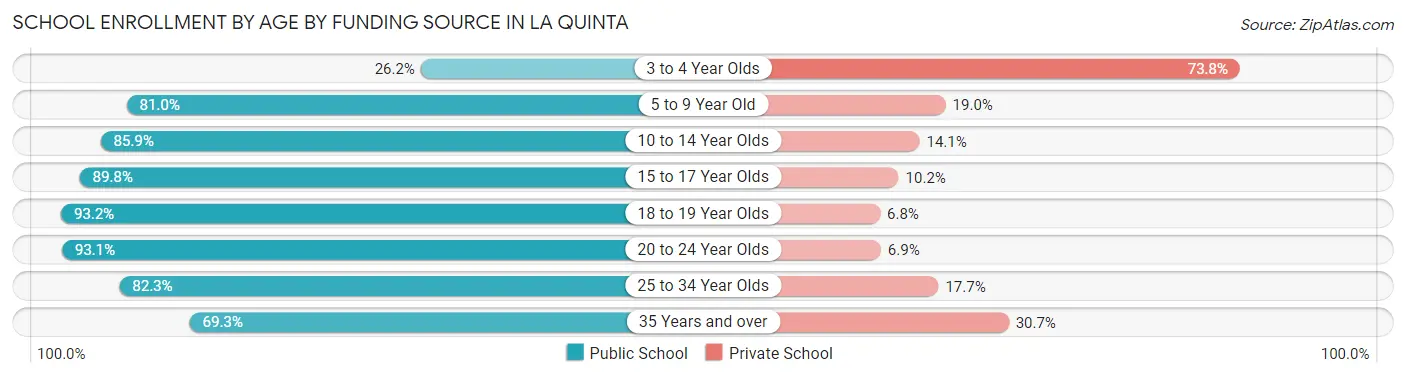
| Age Bracket | Public School | Private School |
| 3 to 4 Year Olds | 43 (26.2%) | 121 (73.8%) |
| 5 to 9 Year Old | 1,441 (81.0%) | 338 (19.0%) |
| 10 to 14 Year Olds | 1,554 (85.9%) | 256 (14.1%) |
| 15 to 17 Year Olds | 1,201 (89.8%) | 137 (10.2%) |
| 18 to 19 Year Olds | 509 (93.2%) | 37 (6.8%) |
| 20 to 24 Year Olds | 751 (93.1%) | 56 (6.9%) |
| 25 to 34 Year Olds | 415 (82.3%) | 89 (17.7%) |
| 35 Years and over | 410 (69.3%) | 182 (30.7%) |
| Total | 6,326 (83.9%) | 1,214 (16.1%) |
Educational Attainment by Field of Study in La Quinta
Business (2,766 | 23.7%), social sciences (1,327 | 11.4%), education (1,324 | 11.3%), science & technology (1,032 | 8.8%), and psychology (905 | 7.7%) are the most common fields of study among 11,691 individuals in La Quinta who have obtained a bachelor's degree or higher.
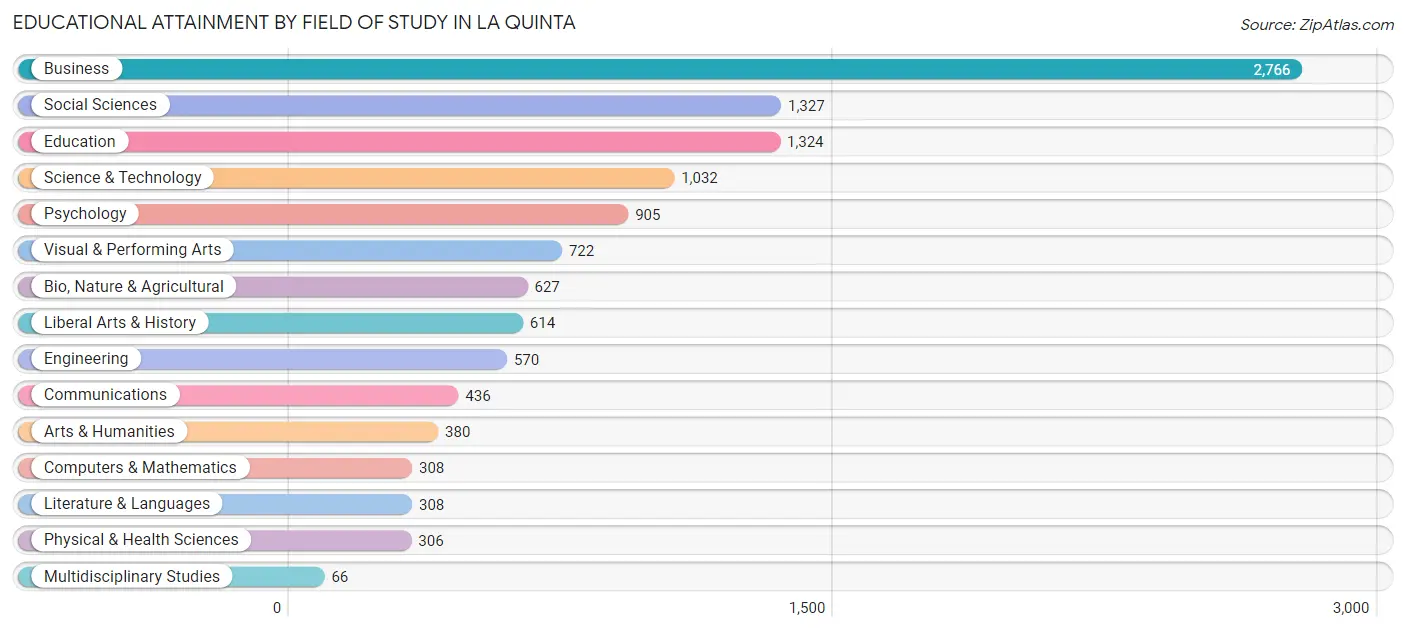
| Field of Study | # Graduates | % Graduates |
| Computers & Mathematics | 308 | 2.6% |
| Bio, Nature & Agricultural | 627 | 5.4% |
| Physical & Health Sciences | 306 | 2.6% |
| Psychology | 905 | 7.7% |
| Social Sciences | 1,327 | 11.4% |
| Engineering | 570 | 4.9% |
| Multidisciplinary Studies | 66 | 0.6% |
| Science & Technology | 1,032 | 8.8% |
| Business | 2,766 | 23.7% |
| Education | 1,324 | 11.3% |
| Literature & Languages | 308 | 2.6% |
| Liberal Arts & History | 614 | 5.2% |
| Visual & Performing Arts | 722 | 6.2% |
| Communications | 436 | 3.7% |
| Arts & Humanities | 380 | 3.3% |
| Total | 11,691 | 100.0% |
Transportation & Commute in La Quinta
Vehicle Availability by Sex in La Quinta
The most prevalent vehicle ownership categories in La Quinta are males with 2 vehicles (3,965, accounting for 46.8%) and females with 2 vehicles (2,987, making up 61.4%).
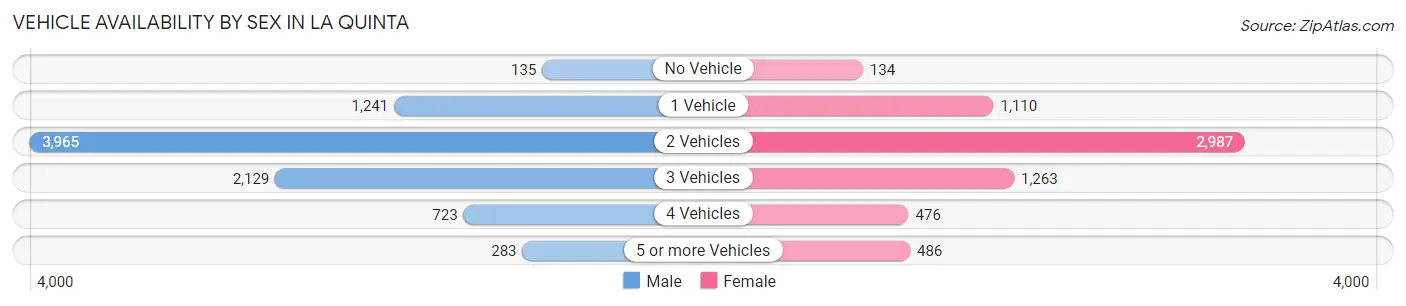
| Vehicles Available | Male | Female |
| No Vehicle | 135 (1.6%) | 134 (2.1%) |
| 1 Vehicle | 1,241 (14.6%) | 1,110 (17.2%) |
| 2 Vehicles | 3,965 (46.8%) | 2,987 (46.3%) |
| 3 Vehicles | 2,129 (25.1%) | 1,263 (19.6%) |
| 4 Vehicles | 723 (8.5%) | 476 (7.4%) |
| 5 or more Vehicles | 283 (3.3%) | 486 (7.5%) |
| Total | 8,476 (100.0%) | 6,456 (100.0%) |
Commute Time in La Quinta
The most frequently occuring commute durations in La Quinta are 20 to 24 minutes (2,170 commuters, 17.1%), 15 to 19 minutes (1,913 commuters, 15.0%), and 10 to 14 minutes (1,904 commuters, 15.0%).
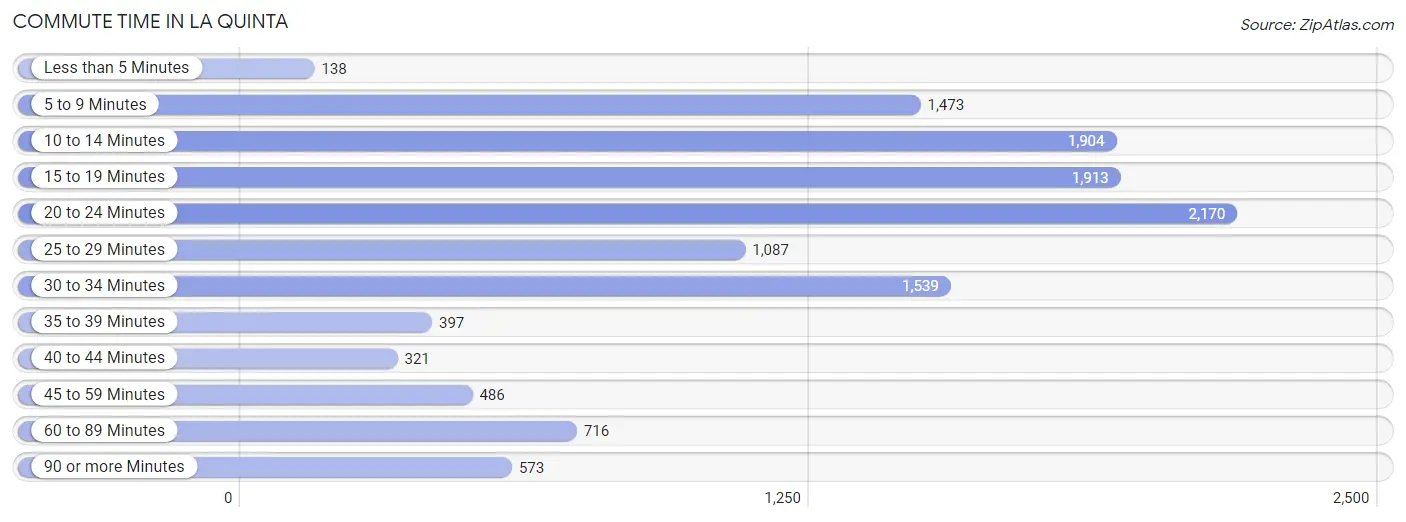
| Commute Time | # Commuters | % Commuters |
| Less than 5 Minutes | 138 | 1.1% |
| 5 to 9 Minutes | 1,473 | 11.6% |
| 10 to 14 Minutes | 1,904 | 15.0% |
| 15 to 19 Minutes | 1,913 | 15.0% |
| 20 to 24 Minutes | 2,170 | 17.1% |
| 25 to 29 Minutes | 1,087 | 8.6% |
| 30 to 34 Minutes | 1,539 | 12.1% |
| 35 to 39 Minutes | 397 | 3.1% |
| 40 to 44 Minutes | 321 | 2.5% |
| 45 to 59 Minutes | 486 | 3.8% |
| 60 to 89 Minutes | 716 | 5.6% |
| 90 or more Minutes | 573 | 4.5% |
Commute Time by Sex in La Quinta
The most common commute times in La Quinta are 20 to 24 minutes (1,168 commuters, 16.1%) for males and 5 to 9 minutes (1,025 commuters, 18.8%) for females.
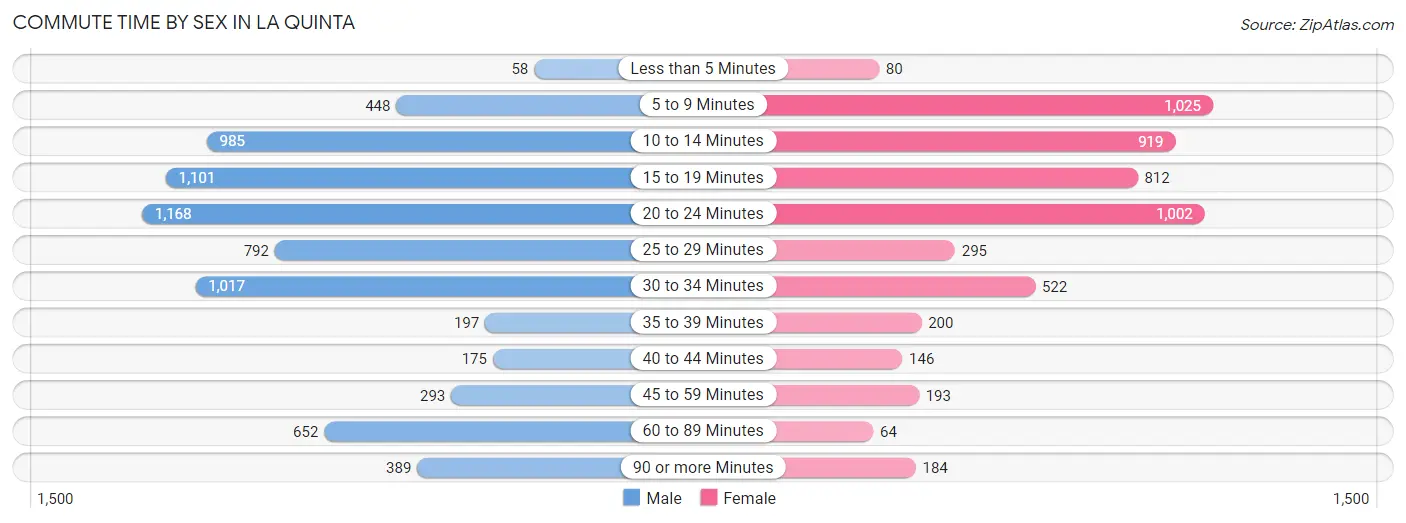
| Commute Time | Male | Female |
| Less than 5 Minutes | 58 (0.8%) | 80 (1.5%) |
| 5 to 9 Minutes | 448 (6.2%) | 1,025 (18.8%) |
| 10 to 14 Minutes | 985 (13.5%) | 919 (16.9%) |
| 15 to 19 Minutes | 1,101 (15.1%) | 812 (14.9%) |
| 20 to 24 Minutes | 1,168 (16.1%) | 1,002 (18.4%) |
| 25 to 29 Minutes | 792 (10.9%) | 295 (5.4%) |
| 30 to 34 Minutes | 1,017 (14.0%) | 522 (9.6%) |
| 35 to 39 Minutes | 197 (2.7%) | 200 (3.7%) |
| 40 to 44 Minutes | 175 (2.4%) | 146 (2.7%) |
| 45 to 59 Minutes | 293 (4.0%) | 193 (3.5%) |
| 60 to 89 Minutes | 652 (9.0%) | 64 (1.2%) |
| 90 or more Minutes | 389 (5.3%) | 184 (3.4%) |
Time of Departure to Work by Sex in La Quinta
The most frequent times of departure to work in La Quinta are 8:00 AM to 8:29 AM (1,295, 17.8%) for males and 8:00 AM to 8:29 AM (1,073, 19.7%) for females.
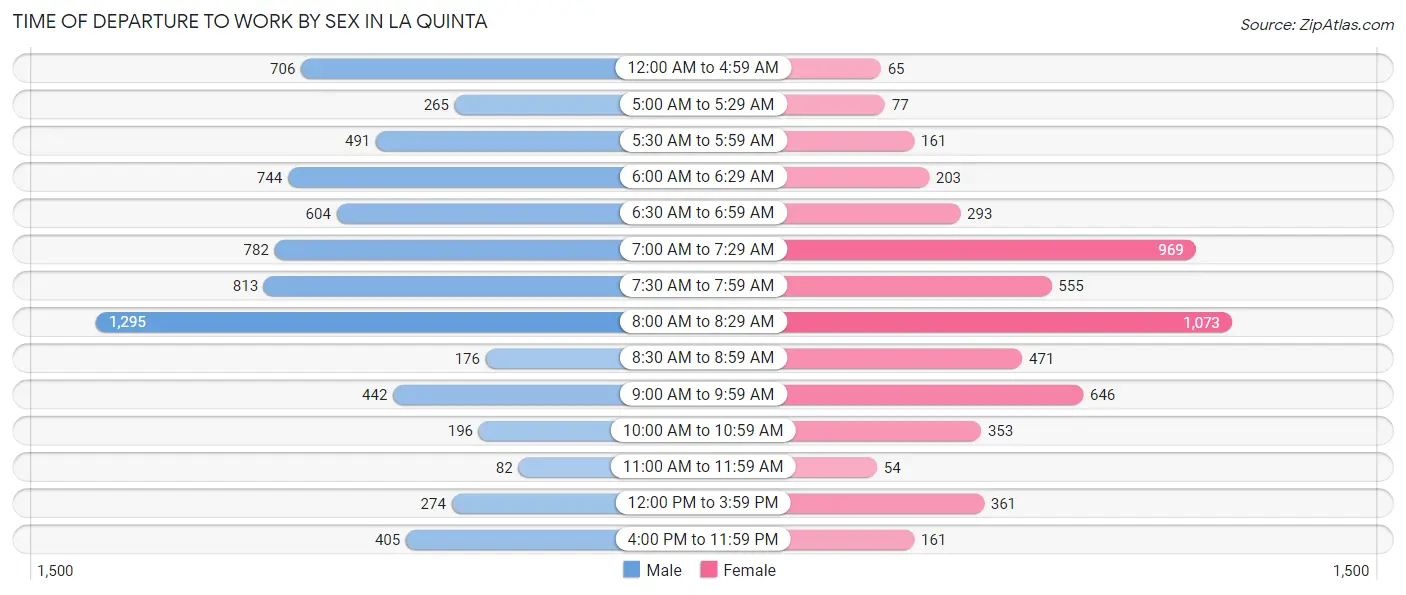
| Time of Departure | Male | Female |
| 12:00 AM to 4:59 AM | 706 (9.7%) | 65 (1.2%) |
| 5:00 AM to 5:29 AM | 265 (3.6%) | 77 (1.4%) |
| 5:30 AM to 5:59 AM | 491 (6.8%) | 161 (3.0%) |
| 6:00 AM to 6:29 AM | 744 (10.2%) | 203 (3.7%) |
| 6:30 AM to 6:59 AM | 604 (8.3%) | 293 (5.4%) |
| 7:00 AM to 7:29 AM | 782 (10.7%) | 969 (17.8%) |
| 7:30 AM to 7:59 AM | 813 (11.2%) | 555 (10.2%) |
| 8:00 AM to 8:29 AM | 1,295 (17.8%) | 1,073 (19.7%) |
| 8:30 AM to 8:59 AM | 176 (2.4%) | 471 (8.6%) |
| 9:00 AM to 9:59 AM | 442 (6.1%) | 646 (11.9%) |
| 10:00 AM to 10:59 AM | 196 (2.7%) | 353 (6.5%) |
| 11:00 AM to 11:59 AM | 82 (1.1%) | 54 (1.0%) |
| 12:00 PM to 3:59 PM | 274 (3.8%) | 361 (6.6%) |
| 4:00 PM to 11:59 PM | 405 (5.6%) | 161 (3.0%) |
| Total | 7,275 (100.0%) | 5,442 (100.0%) |
Housing Occupancy in La Quinta
Occupancy by Ownership in La Quinta
Of the total 15,392 dwellings in La Quinta, owner-occupied units account for 11,411 (74.1%), while renter-occupied units make up 3,981 (25.9%).
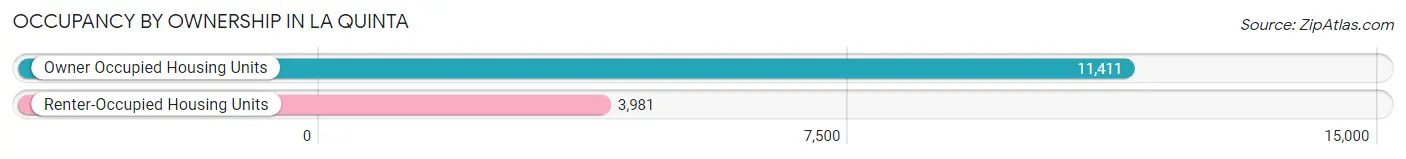
| Occupancy | # Housing Units | % Housing Units |
| Owner Occupied Housing Units | 11,411 | 74.1% |
| Renter-Occupied Housing Units | 3,981 | 25.9% |
| Total Occupied Housing Units | 15,392 | 100.0% |
Occupancy by Household Size in La Quinta
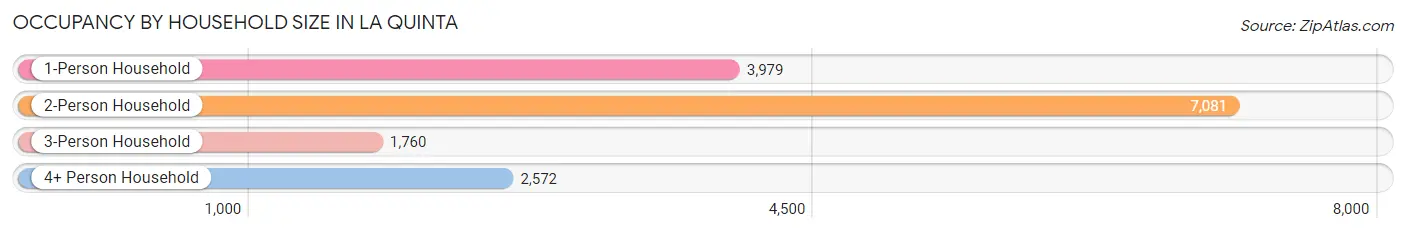
| Household Size | # Housing Units | % Housing Units |
| 1-Person Household | 3,979 | 25.9% |
| 2-Person Household | 7,081 | 46.0% |
| 3-Person Household | 1,760 | 11.4% |
| 4+ Person Household | 2,572 | 16.7% |
| Total Housing Units | 15,392 | 100.0% |
Occupancy by Ownership by Household Size in La Quinta
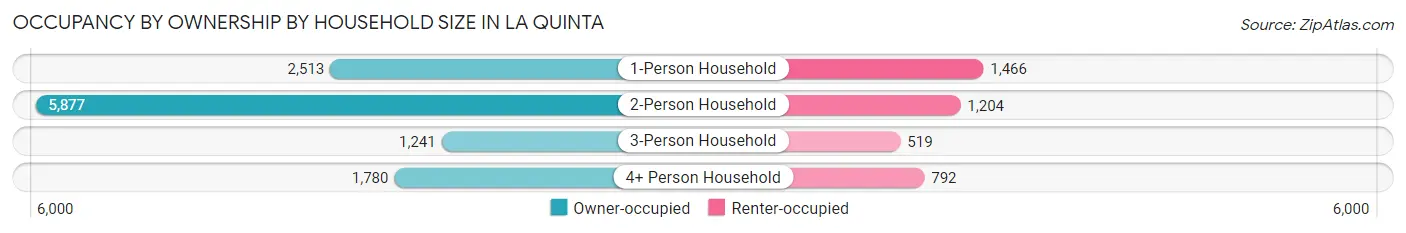
| Household Size | Owner-occupied | Renter-occupied |
| 1-Person Household | 2,513 (63.2%) | 1,466 (36.8%) |
| 2-Person Household | 5,877 (83.0%) | 1,204 (17.0%) |
| 3-Person Household | 1,241 (70.5%) | 519 (29.5%) |
| 4+ Person Household | 1,780 (69.2%) | 792 (30.8%) |
| Total Housing Units | 11,411 (74.1%) | 3,981 (25.9%) |
Occupancy by Educational Attainment in La Quinta
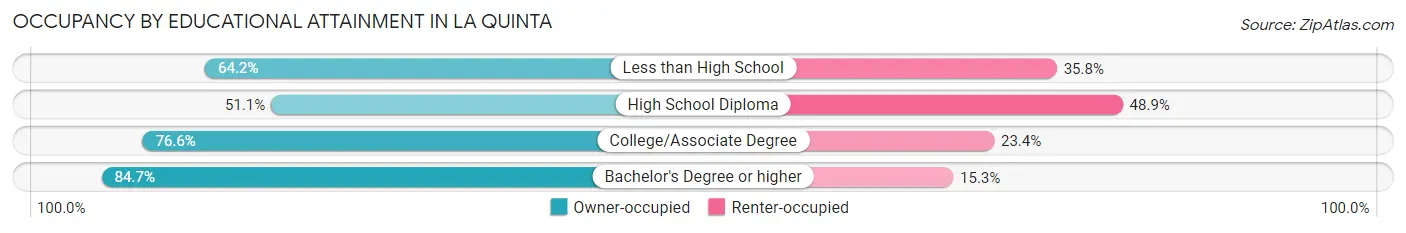
| Household Size | Owner-occupied | Renter-occupied |
| Less than High School | 608 (64.2%) | 339 (35.8%) |
| High School Diploma | 1,578 (51.1%) | 1,508 (48.9%) |
| College/Associate Degree | 3,787 (76.6%) | 1,155 (23.4%) |
| Bachelor's Degree or higher | 5,438 (84.7%) | 979 (15.3%) |
Occupancy by Age of Householder in La Quinta
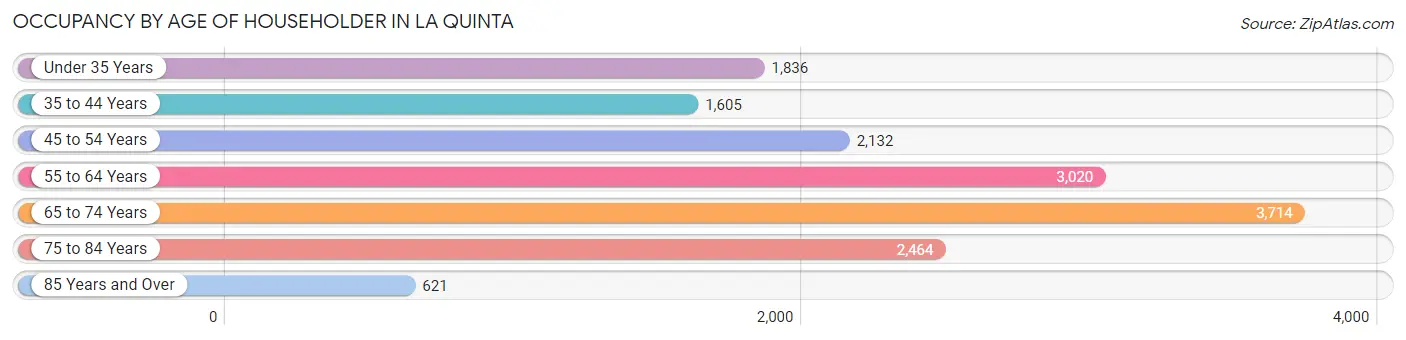
| Age Bracket | # Households | % Households |
| Under 35 Years | 1,836 | 11.9% |
| 35 to 44 Years | 1,605 | 10.4% |
| 45 to 54 Years | 2,132 | 13.9% |
| 55 to 64 Years | 3,020 | 19.6% |
| 65 to 74 Years | 3,714 | 24.1% |
| 75 to 84 Years | 2,464 | 16.0% |
| 85 Years and Over | 621 | 4.0% |
| Total | 15,392 | 100.0% |
Housing Finances in La Quinta
Median Income by Occupancy in La Quinta
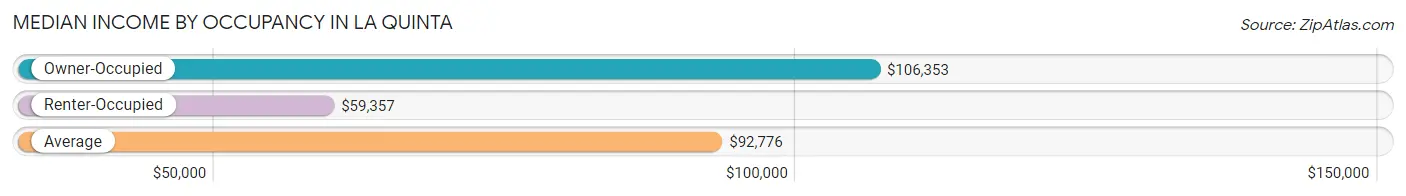
| Occupancy Type | # Households | Median Income |
| Owner-Occupied | 11,411 (74.1%) | $106,353 |
| Renter-Occupied | 3,981 (25.9%) | $59,357 |
| Average | 15,392 (100.0%) | $92,776 |
Occupancy by Householder Income Bracket in La Quinta
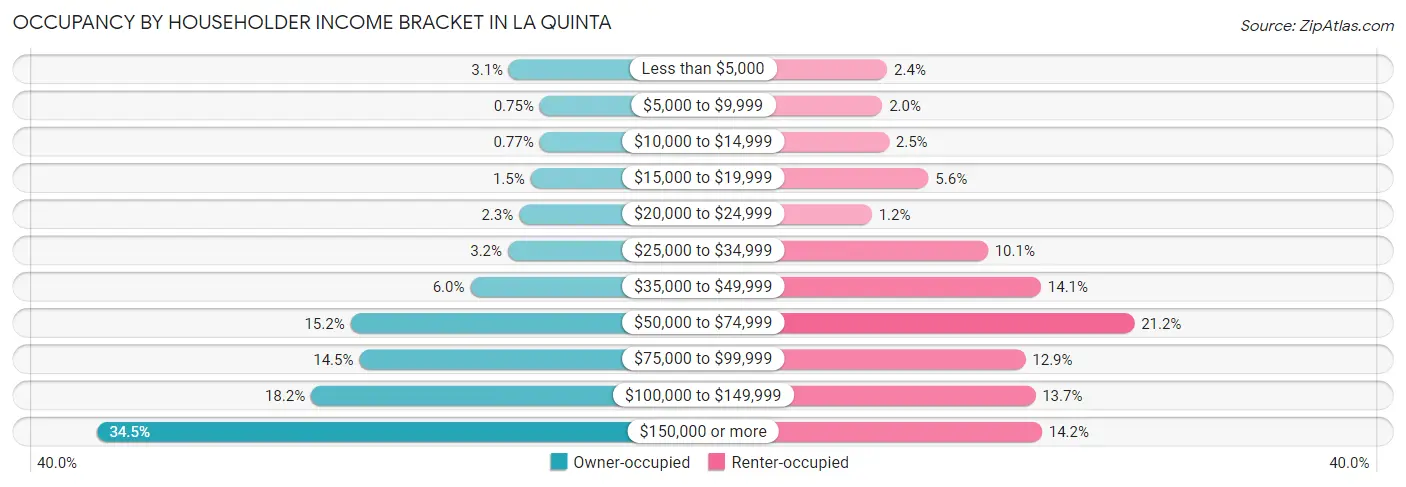
| Income Bracket | Owner-occupied | Renter-occupied |
| Less than $5,000 | 354 (3.1%) | 96 (2.4%) |
| $5,000 to $9,999 | 86 (0.7%) | 81 (2.0%) |
| $10,000 to $14,999 | 88 (0.8%) | 101 (2.5%) |
| $15,000 to $19,999 | 165 (1.5%) | 221 (5.6%) |
| $20,000 to $24,999 | 266 (2.3%) | 49 (1.2%) |
| $25,000 to $34,999 | 363 (3.2%) | 401 (10.1%) |
| $35,000 to $49,999 | 689 (6.0%) | 562 (14.1%) |
| $50,000 to $74,999 | 1,731 (15.2%) | 845 (21.2%) |
| $75,000 to $99,999 | 1,655 (14.5%) | 515 (12.9%) |
| $100,000 to $149,999 | 2,075 (18.2%) | 545 (13.7%) |
| $150,000 or more | 3,939 (34.5%) | 565 (14.2%) |
| Total | 11,411 (100.0%) | 3,981 (100.0%) |
Monthly Housing Cost Tiers in La Quinta
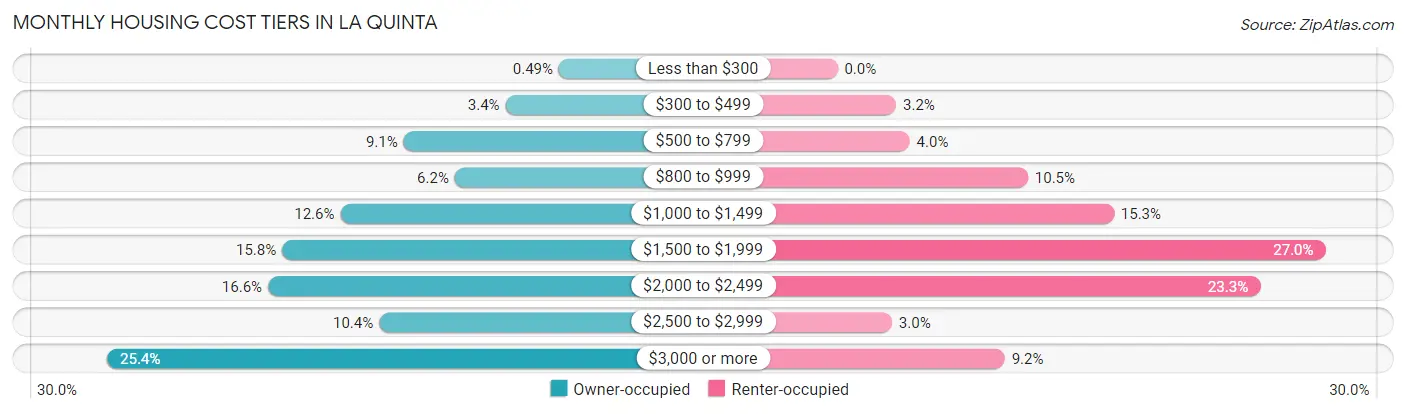
| Monthly Cost | Owner-occupied | Renter-occupied |
| Less than $300 | 56 (0.5%) | 0 (0.0%) |
| $300 to $499 | 392 (3.4%) | 129 (3.2%) |
| $500 to $799 | 1,035 (9.1%) | 159 (4.0%) |
| $800 to $999 | 712 (6.2%) | 419 (10.5%) |
| $1,000 to $1,499 | 1,433 (12.6%) | 608 (15.3%) |
| $1,500 to $1,999 | 1,801 (15.8%) | 1,073 (27.0%) |
| $2,000 to $2,499 | 1,890 (16.6%) | 929 (23.3%) |
| $2,500 to $2,999 | 1,189 (10.4%) | 120 (3.0%) |
| $3,000 or more | 2,903 (25.4%) | 368 (9.2%) |
| Total | 11,411 (100.0%) | 3,981 (100.0%) |
Physical Housing Characteristics in La Quinta
Housing Structures in La Quinta
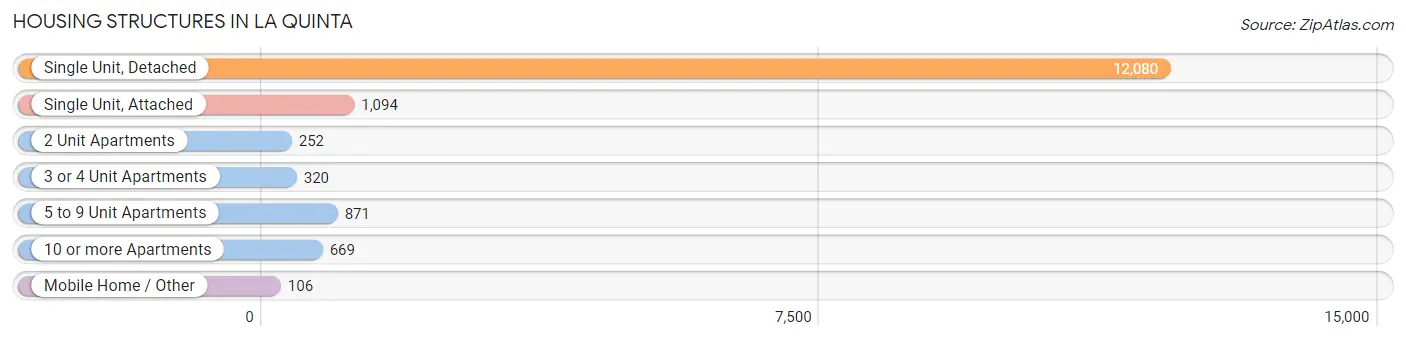
| Structure Type | # Housing Units | % Housing Units |
| Single Unit, Detached | 12,080 | 78.5% |
| Single Unit, Attached | 1,094 | 7.1% |
| 2 Unit Apartments | 252 | 1.6% |
| 3 or 4 Unit Apartments | 320 | 2.1% |
| 5 to 9 Unit Apartments | 871 | 5.7% |
| 10 or more Apartments | 669 | 4.3% |
| Mobile Home / Other | 106 | 0.7% |
| Total | 15,392 | 100.0% |
Housing Structures by Occupancy in La Quinta
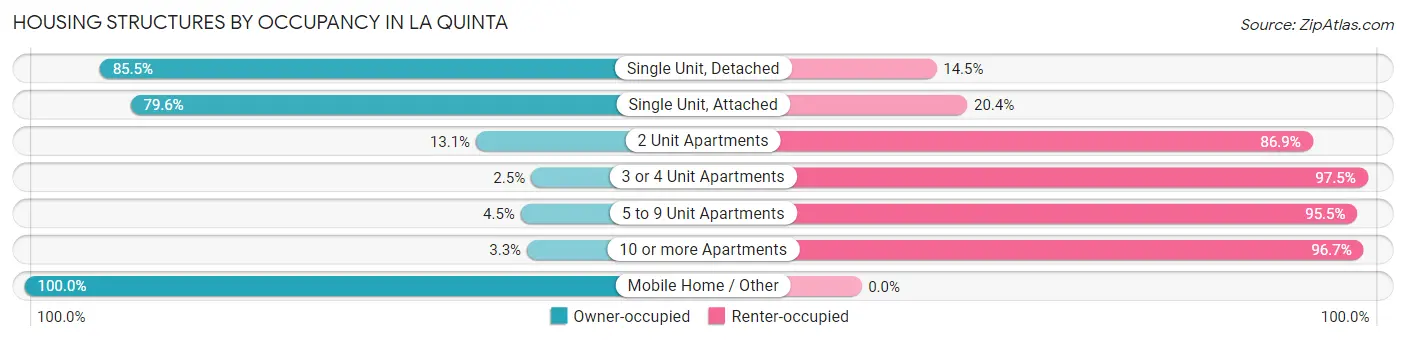
| Structure Type | Owner-occupied | Renter-occupied |
| Single Unit, Detached | 10,332 (85.5%) | 1,748 (14.5%) |
| Single Unit, Attached | 871 (79.6%) | 223 (20.4%) |
| 2 Unit Apartments | 33 (13.1%) | 219 (86.9%) |
| 3 or 4 Unit Apartments | 8 (2.5%) | 312 (97.5%) |
| 5 to 9 Unit Apartments | 39 (4.5%) | 832 (95.5%) |
| 10 or more Apartments | 22 (3.3%) | 647 (96.7%) |
| Mobile Home / Other | 106 (100.0%) | 0 (0.0%) |
| Total | 11,411 (74.1%) | 3,981 (25.9%) |
Housing Structures by Number of Rooms in La Quinta
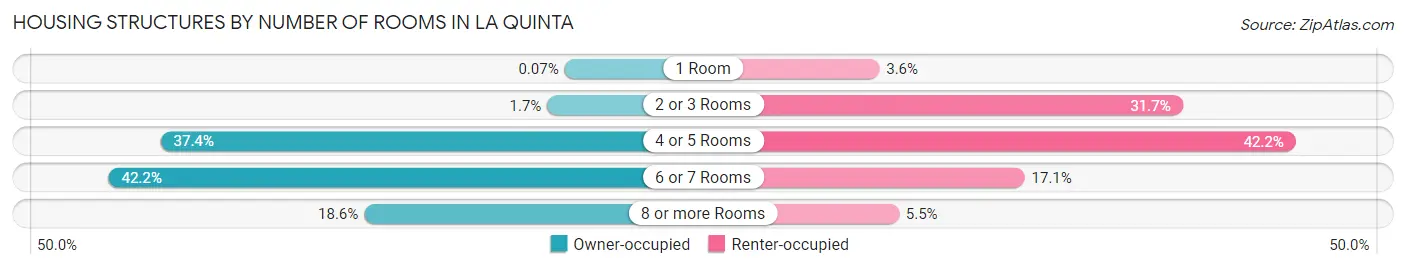
| Number of Rooms | Owner-occupied | Renter-occupied |
| 1 Room | 8 (0.1%) | 145 (3.6%) |
| 2 or 3 Rooms | 191 (1.7%) | 1,261 (31.7%) |
| 4 or 5 Rooms | 4,270 (37.4%) | 1,678 (42.1%) |
| 6 or 7 Rooms | 4,819 (42.2%) | 680 (17.1%) |
| 8 or more Rooms | 2,123 (18.6%) | 217 (5.4%) |
| Total | 11,411 (100.0%) | 3,981 (100.0%) |
Housing Structure by Heating Type in La Quinta
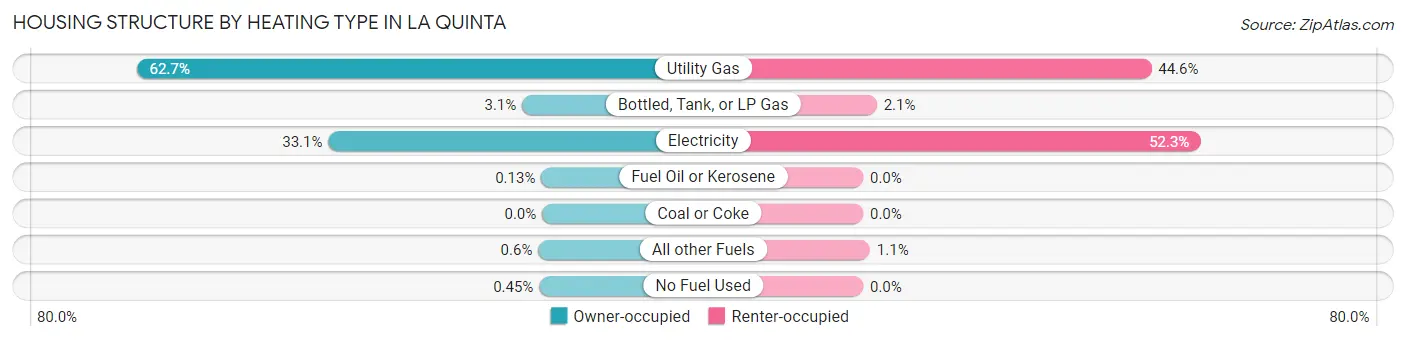
| Heating Type | Owner-occupied | Renter-occupied |
| Utility Gas | 7,153 (62.7%) | 1,774 (44.6%) |
| Bottled, Tank, or LP Gas | 353 (3.1%) | 84 (2.1%) |
| Electricity | 3,771 (33.1%) | 2,081 (52.3%) |
| Fuel Oil or Kerosene | 15 (0.1%) | 0 (0.0%) |
| Coal or Coke | 0 (0.0%) | 0 (0.0%) |
| All other Fuels | 68 (0.6%) | 42 (1.1%) |
| No Fuel Used | 51 (0.4%) | 0 (0.0%) |
| Total | 11,411 (100.0%) | 3,981 (100.0%) |
Household Vehicle Usage in La Quinta
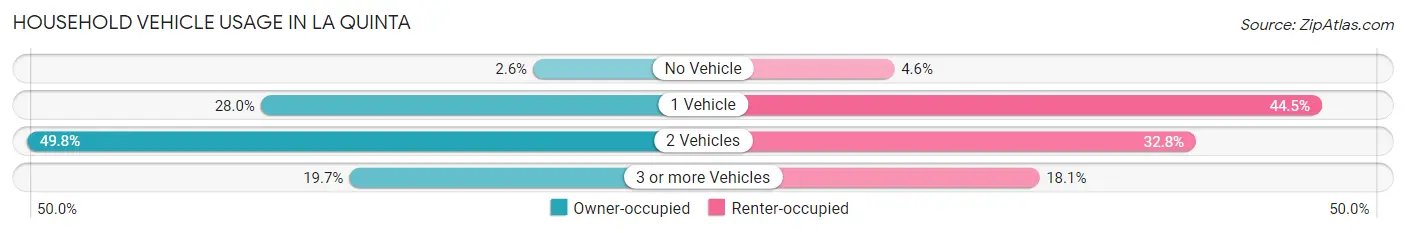
| Vehicles per Household | Owner-occupied | Renter-occupied |
| No Vehicle | 291 (2.5%) | 183 (4.6%) |
| 1 Vehicle | 3,190 (28.0%) | 1,772 (44.5%) |
| 2 Vehicles | 5,682 (49.8%) | 1,304 (32.8%) |
| 3 or more Vehicles | 2,248 (19.7%) | 722 (18.1%) |
| Total | 11,411 (100.0%) | 3,981 (100.0%) |
Real Estate & Mortgages in La Quinta
Real Estate and Mortgage Overview in La Quinta
| Characteristic | Without Mortgage | With Mortgage |
| Housing Units | 3,724 | 7,687 |
| Median Property Value | $605,400 | $538,500 |
| Median Household Income | $94,400 | $2,716 |
| Monthly Housing Costs | $953 | $2,772 |
| Real Estate Taxes | $5,835 | $54 |
Property Value by Mortgage Status in La Quinta
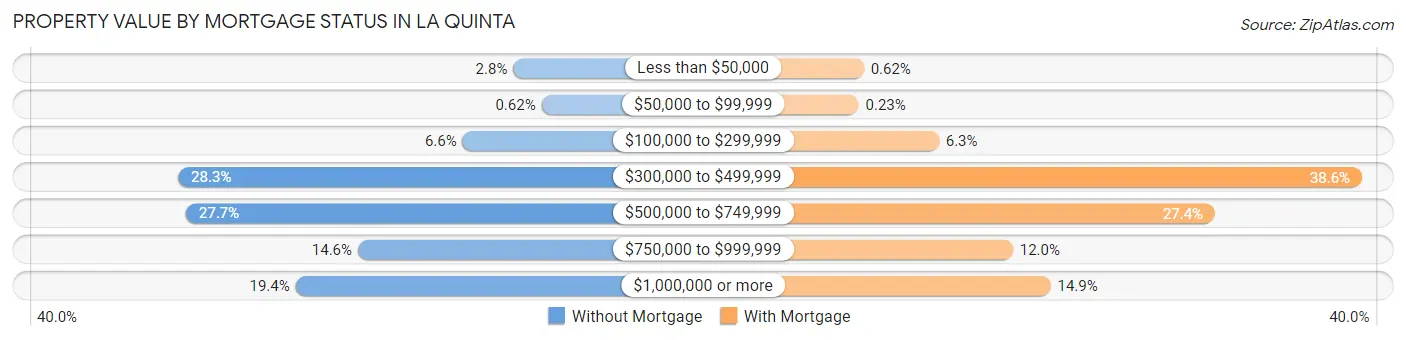
| Property Value | Without Mortgage | With Mortgage |
| Less than $50,000 | 103 (2.8%) | 48 (0.6%) |
| $50,000 to $99,999 | 23 (0.6%) | 18 (0.2%) |
| $100,000 to $299,999 | 247 (6.6%) | 487 (6.3%) |
| $300,000 to $499,999 | 1,054 (28.3%) | 2,966 (38.6%) |
| $500,000 to $749,999 | 1,032 (27.7%) | 2,105 (27.4%) |
| $750,000 to $999,999 | 544 (14.6%) | 921 (12.0%) |
| $1,000,000 or more | 721 (19.4%) | 1,142 (14.9%) |
| Total | 3,724 (100.0%) | 7,687 (100.0%) |
Household Income by Mortgage Status in La Quinta
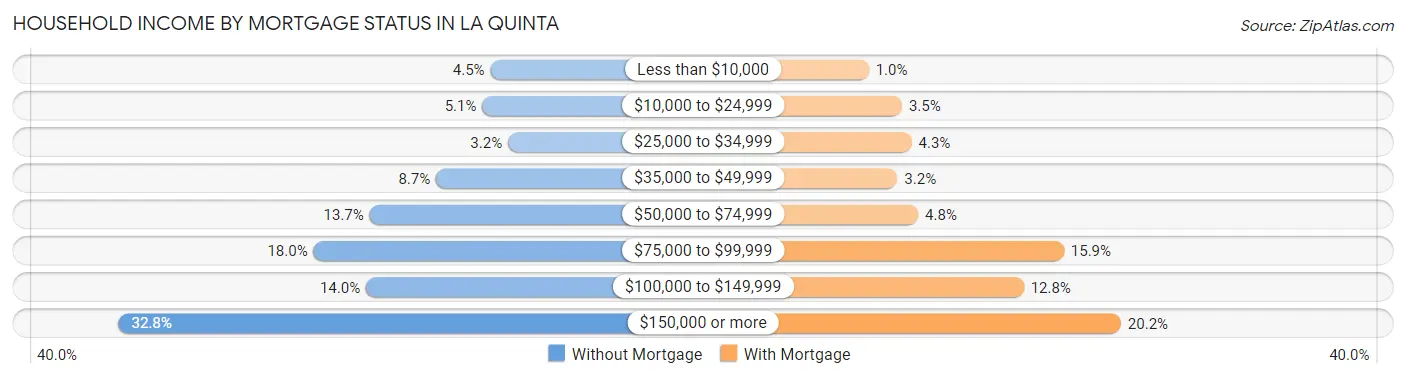
| Household Income | Without Mortgage | With Mortgage |
| Less than $10,000 | 168 (4.5%) | 77 (1.0%) |
| $10,000 to $24,999 | 191 (5.1%) | 272 (3.5%) |
| $25,000 to $34,999 | 118 (3.2%) | 328 (4.3%) |
| $35,000 to $49,999 | 322 (8.6%) | 245 (3.2%) |
| $50,000 to $74,999 | 511 (13.7%) | 367 (4.8%) |
| $75,000 to $99,999 | 670 (18.0%) | 1,220 (15.9%) |
| $100,000 to $149,999 | 521 (14.0%) | 985 (12.8%) |
| $150,000 or more | 1,223 (32.8%) | 1,554 (20.2%) |
| Total | 3,724 (100.0%) | 7,687 (100.0%) |
Property Value to Household Income Ratio in La Quinta
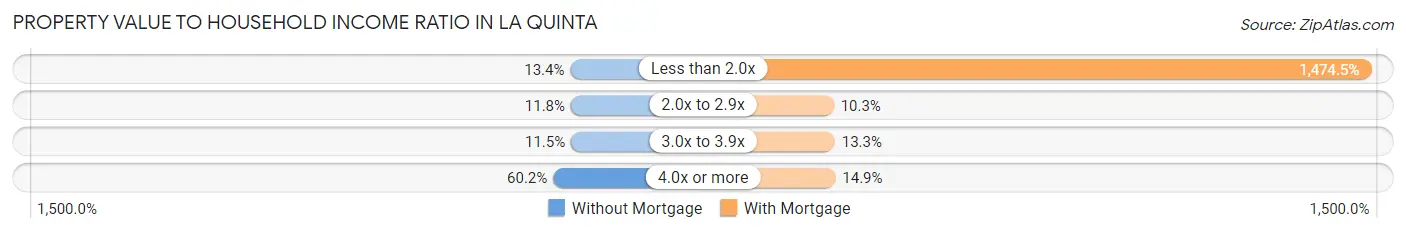
| Value-to-Income Ratio | Without Mortgage | With Mortgage |
| Less than 2.0x | 499 (13.4%) | 113,343 (1,474.5%) |
| 2.0x to 2.9x | 440 (11.8%) | 789 (10.3%) |
| 3.0x to 3.9x | 427 (11.5%) | 1,025 (13.3%) |
| 4.0x or more | 2,242 (60.2%) | 1,144 (14.9%) |
| Total | 3,724 (100.0%) | 7,687 (100.0%) |
Real Estate Taxes by Mortgage Status in La Quinta
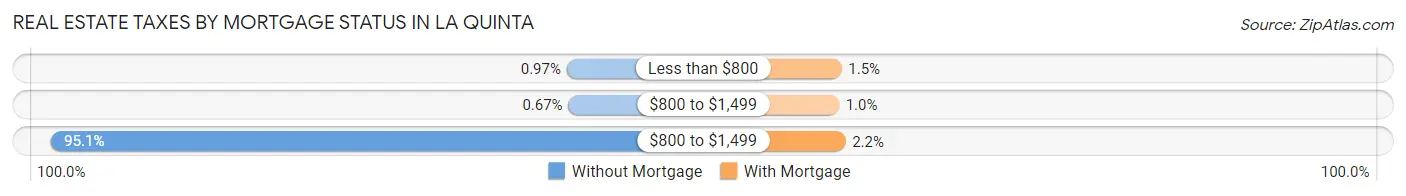
| Property Taxes | Without Mortgage | With Mortgage |
| Less than $800 | 36 (1.0%) | 117 (1.5%) |
| $800 to $1,499 | 25 (0.7%) | 80 (1.0%) |
| $800 to $1,499 | 3,543 (95.1%) | 171 (2.2%) |
| Total | 3,724 (100.0%) | 7,687 (100.0%) |
Health & Disability in La Quinta
Health Insurance Coverage by Age in La Quinta
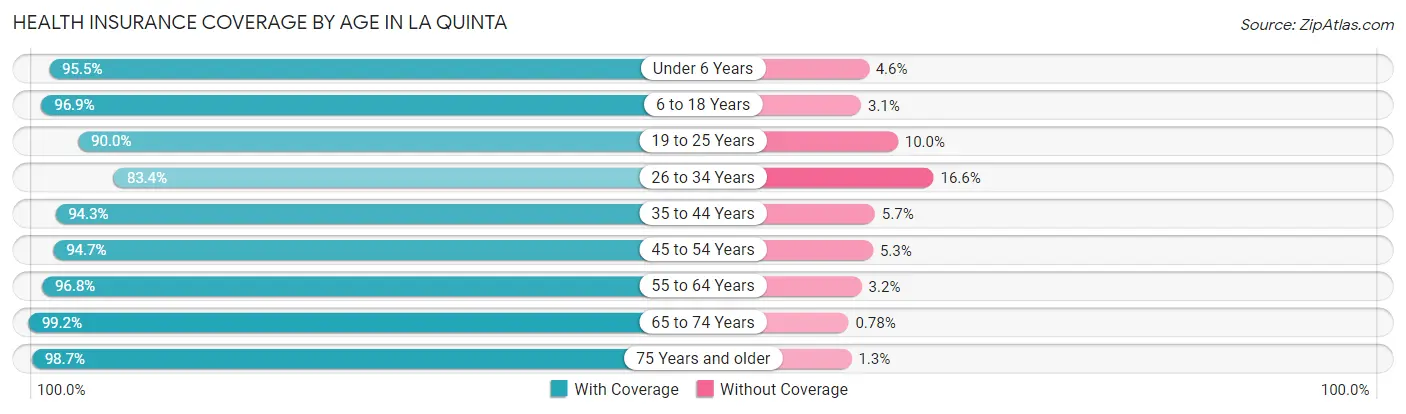
| Age Bracket | With Coverage | Without Coverage |
| Under 6 Years | 1,847 (95.5%) | 88 (4.5%) |
| 6 to 18 Years | 5,091 (96.9%) | 164 (3.1%) |
| 19 to 25 Years | 2,412 (90.0%) | 267 (10.0%) |
| 26 to 34 Years | 3,146 (83.4%) | 628 (16.6%) |
| 35 to 44 Years | 2,891 (94.3%) | 175 (5.7%) |
| 45 to 54 Years | 3,954 (94.7%) | 223 (5.3%) |
| 55 to 64 Years | 5,402 (96.8%) | 181 (3.2%) |
| 65 to 74 Years | 6,388 (99.2%) | 50 (0.8%) |
| 75 Years and older | 4,914 (98.7%) | 66 (1.3%) |
| Total | 36,045 (95.1%) | 1,842 (4.9%) |
Health Insurance Coverage by Citizenship Status in La Quinta
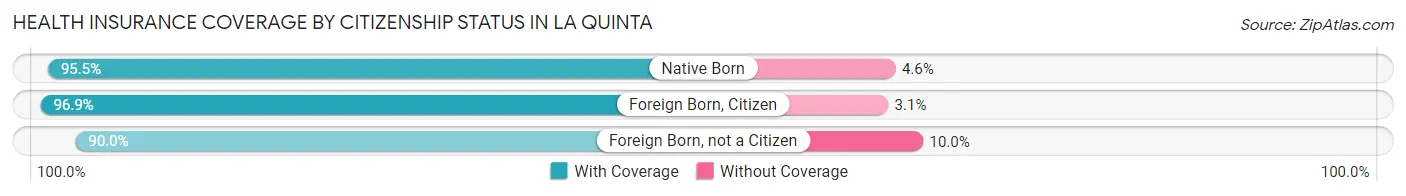
| Citizenship Status | With Coverage | Without Coverage |
| Native Born | 1,847 (95.5%) | 88 (4.5%) |
| Foreign Born, Citizen | 5,091 (96.9%) | 164 (3.1%) |
| Foreign Born, not a Citizen | 2,412 (90.0%) | 267 (10.0%) |
Health Insurance Coverage by Household Income in La Quinta
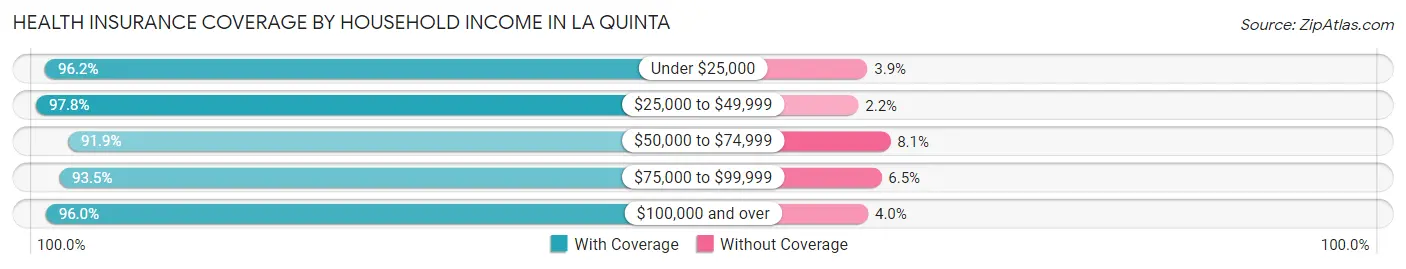
| Household Income | With Coverage | Without Coverage |
| Under $25,000 | 2,597 (96.2%) | 104 (3.8%) |
| $25,000 to $49,999 | 3,894 (97.8%) | 86 (2.2%) |
| $50,000 to $74,999 | 5,906 (91.9%) | 523 (8.1%) |
| $75,000 to $99,999 | 5,433 (93.5%) | 376 (6.5%) |
| $100,000 and over | 18,153 (96.0%) | 753 (4.0%) |
Public vs Private Health Insurance Coverage by Age in La Quinta
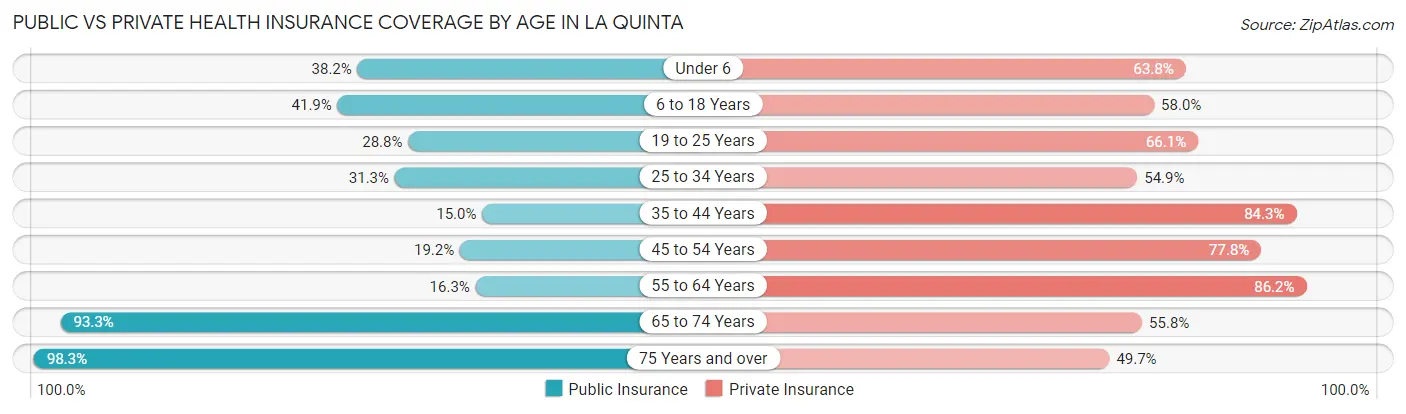
| Age Bracket | Public Insurance | Private Insurance |
| Under 6 | 739 (38.2%) | 1,235 (63.8%) |
| 6 to 18 Years | 2,202 (41.9%) | 3,047 (58.0%) |
| 19 to 25 Years | 771 (28.8%) | 1,771 (66.1%) |
| 25 to 34 Years | 1,180 (31.3%) | 2,070 (54.8%) |
| 35 to 44 Years | 461 (15.0%) | 2,586 (84.3%) |
| 45 to 54 Years | 801 (19.2%) | 3,251 (77.8%) |
| 55 to 64 Years | 909 (16.3%) | 4,813 (86.2%) |
| 65 to 74 Years | 6,009 (93.3%) | 3,589 (55.7%) |
| 75 Years and over | 4,895 (98.3%) | 2,474 (49.7%) |
| Total | 17,967 (47.4%) | 24,836 (65.5%) |
Disability Status by Sex by Age in La Quinta
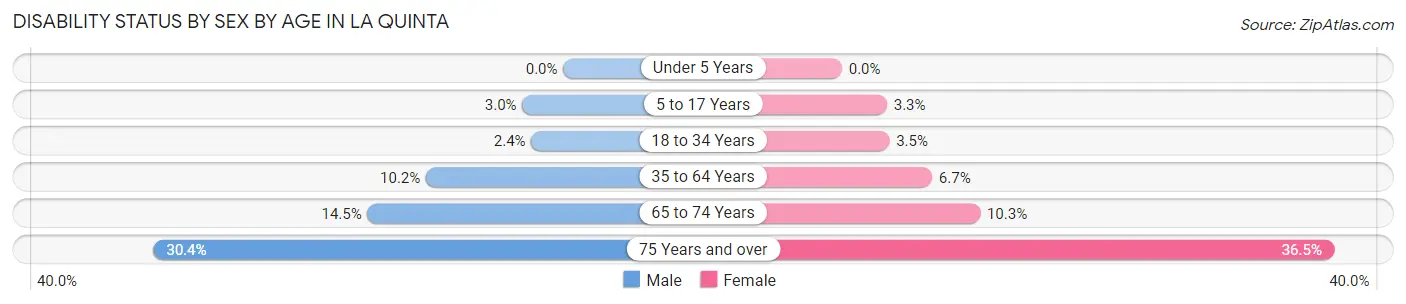
| Age Bracket | Male | Female |
| Under 5 Years | 0 (0.0%) | 0 (0.0%) |
| 5 to 17 Years | 104 (3.0%) | 63 (3.3%) |
| 18 to 34 Years | 81 (2.4%) | 116 (3.5%) |
| 35 to 64 Years | 664 (10.2%) | 422 (6.7%) |
| 65 to 74 Years | 412 (14.5%) | 370 (10.3%) |
| 75 Years and over | 790 (30.4%) | 871 (36.5%) |
Disability Class by Sex by Age in La Quinta
Disability Class: Hearing Difficulty
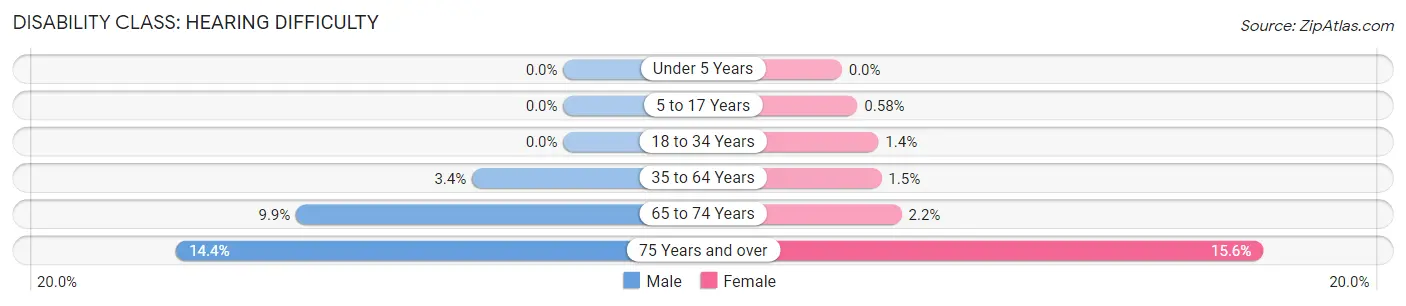
| Age Bracket | Male | Female |
| Under 5 Years | 0 (0.0%) | 0 (0.0%) |
| 5 to 17 Years | 0 (0.0%) | 11 (0.6%) |
| 18 to 34 Years | 0 (0.0%) | 45 (1.4%) |
| 35 to 64 Years | 221 (3.4%) | 93 (1.5%) |
| 65 to 74 Years | 281 (9.9%) | 80 (2.2%) |
| 75 Years and over | 373 (14.4%) | 373 (15.6%) |
Disability Class: Vision Difficulty
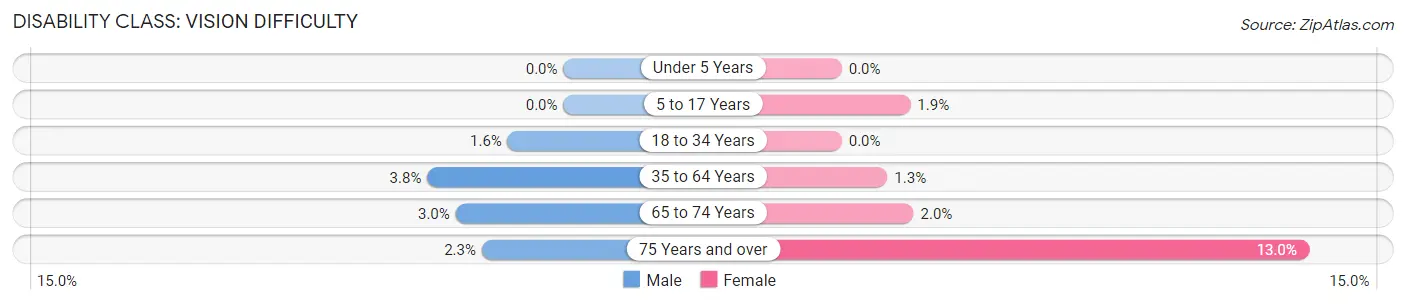
| Age Bracket | Male | Female |
| Under 5 Years | 0 (0.0%) | 0 (0.0%) |
| 5 to 17 Years | 0 (0.0%) | 36 (1.9%) |
| 18 to 34 Years | 53 (1.5%) | 0 (0.0%) |
| 35 to 64 Years | 247 (3.8%) | 80 (1.3%) |
| 65 to 74 Years | 85 (3.0%) | 72 (2.0%) |
| 75 Years and over | 59 (2.3%) | 310 (13.0%) |
Disability Class: Cognitive Difficulty
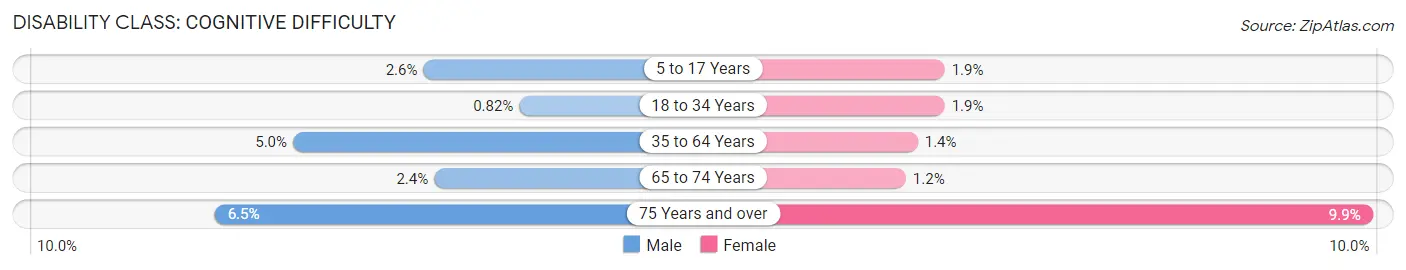
| Age Bracket | Male | Female |
| 5 to 17 Years | 89 (2.6%) | 36 (1.9%) |
| 18 to 34 Years | 28 (0.8%) | 63 (1.9%) |
| 35 to 64 Years | 327 (5.0%) | 89 (1.4%) |
| 65 to 74 Years | 68 (2.4%) | 43 (1.2%) |
| 75 Years and over | 168 (6.5%) | 235 (9.9%) |
Disability Class: Ambulatory Difficulty
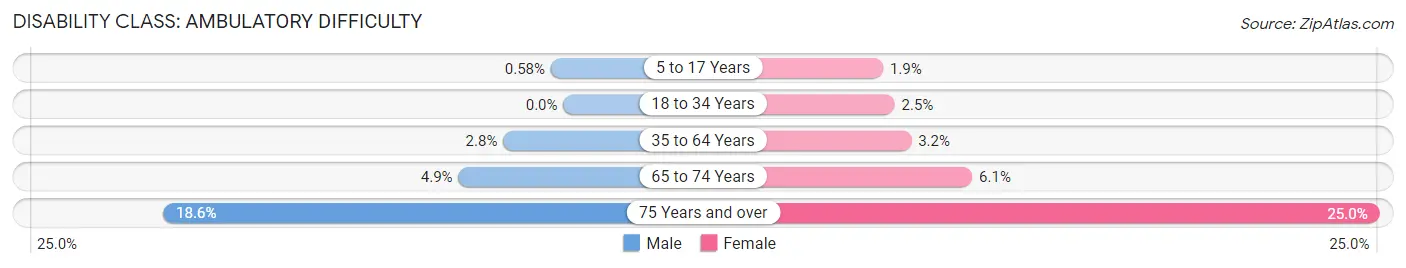
| Age Bracket | Male | Female |
| 5 to 17 Years | 20 (0.6%) | 36 (1.9%) |
| 18 to 34 Years | 0 (0.0%) | 81 (2.5%) |
| 35 to 64 Years | 182 (2.8%) | 203 (3.2%) |
| 65 to 74 Years | 138 (4.9%) | 218 (6.0%) |
| 75 Years and over | 482 (18.6%) | 595 (24.9%) |
Disability Class: Self-Care Difficulty
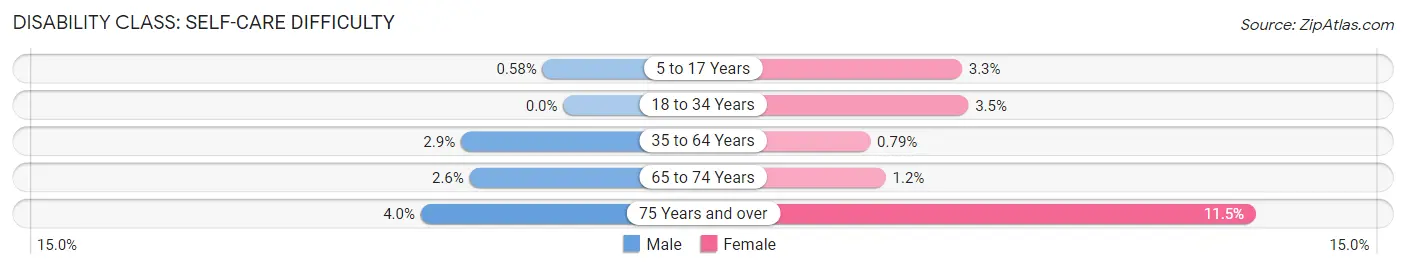
| Age Bracket | Male | Female |
| 5 to 17 Years | 20 (0.6%) | 63 (3.3%) |
| 18 to 34 Years | 0 (0.0%) | 116 (3.5%) |
| 35 to 64 Years | 186 (2.9%) | 50 (0.8%) |
| 65 to 74 Years | 74 (2.6%) | 44 (1.2%) |
| 75 Years and over | 103 (4.0%) | 275 (11.5%) |
Technology Access in La Quinta
Computing Device Access in La Quinta
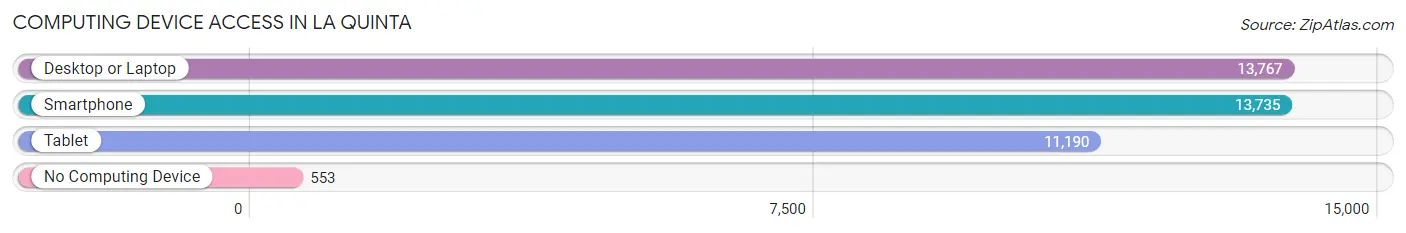
| Device Type | # Households | % Households |
| Desktop or Laptop | 13,767 | 89.4% |
| Smartphone | 13,735 | 89.2% |
| Tablet | 11,190 | 72.7% |
| No Computing Device | 553 | 3.6% |
| Total | 15,392 | 100.0% |
Internet Access in La Quinta
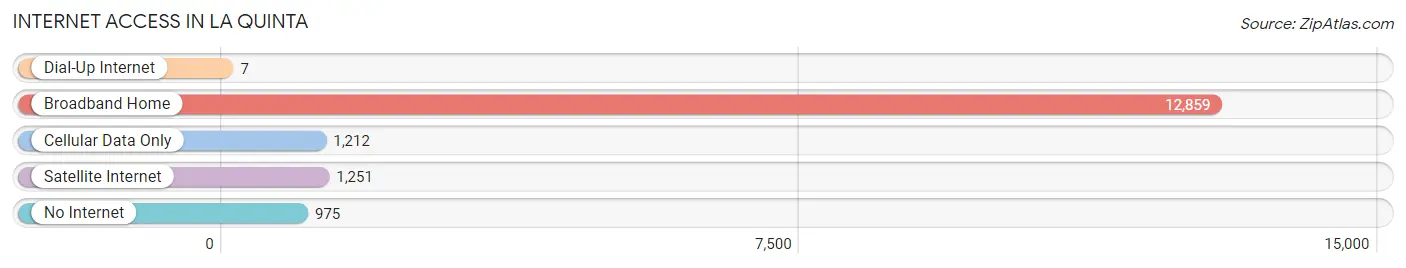
| Internet Type | # Households | % Households |
| Dial-Up Internet | 7 | 0.1% |
| Broadband Home | 12,859 | 83.5% |
| Cellular Data Only | 1,212 | 7.9% |
| Satellite Internet | 1,251 | 8.1% |
| No Internet | 975 | 6.3% |
| Total | 15,392 | 100.0% |
La Quinta Summary
La Quinta is a city located in Riverside County, California, United States. It is situated in the Coachella Valley, approximately 13 miles east of Palm Springs. The city was incorporated in 1982 and is known for its golf courses, resorts, and spas. La Quinta is a popular destination for tourists and retirees alike, and is home to a diverse population of over 40,000 people.
Geography
La Quinta is located in the Coachella Valley, a desert region of Southern California. The city is situated in the foothills of the Santa Rosa Mountains, and is bordered by the cities of Palm Desert, Indian Wells, and Indio. The city covers an area of approximately 31 square miles, and has an elevation of approximately 500 feet. The climate in La Quinta is arid and hot, with temperatures ranging from the mid-90s in the summer to the mid-60s in the winter.
History
The area that is now La Quinta was originally inhabited by the Cahuilla Indians. The first non-native settlers arrived in the area in the late 19th century, and the city was officially incorporated in 1982. La Quinta quickly became a popular destination for tourists and retirees, and the city’s population has grown steadily since then.
Economy
La Quinta’s economy is largely driven by tourism and retirement. The city is home to numerous golf courses, resorts, and spas, which attract visitors from all over the world. The city is also home to a number of corporate headquarters, including the headquarters of the PGA Tour. Additionally, La Quinta is home to a number of retail stores, restaurants, and other businesses.
Demographics
As of the 2010 census, La Quinta had a population of 37,467. The racial makeup of the city was 73.3% White, 5.2% African American, 0.7% Native American, 1.3% Asian, 0.1% Pacific Islander, 16.2% from other races, and 3.2% from two or more races. Hispanic or Latino of any race were 33.2% of the population.
The median household income in La Quinta was $60,845, and the median family income was $71,945. The per capita income for the city was $35,945. About 8.3% of families and 11.2% of the population were below the poverty line, including 15.2% of those under age 18 and 5.2% of those age 65 or over.
Conclusion
La Quinta is a city located in Riverside County, California, United States. It is situated in the Coachella Valley, approximately 13 miles east of Palm Springs. The city was incorporated in 1982 and is known for its golf courses, resorts, and spas. La Quinta is a popular destination for tourists and retirees alike, and is home to a diverse population of over 40,000 people. The city’s economy is largely driven by tourism and retirement, and the city is home to numerous golf courses, resorts, and spas. The racial makeup of the city is 73.3% White, 5.2% African American, 0.7% Native American, 1.3% Asian, 0.1% Pacific Islander, 16.2% from other races, and 3.2% from two or more races. The median household income in La Quinta was $60,845, and the median family income was $71,945. La Quinta is a vibrant and diverse city that offers a variety of activities and attractions for visitors and residents alike.
Common Questions
What is Per Capita Income in La Quinta?
Per Capita income in La Quinta is $58,577.
What is the Median Family Income in La Quinta?
Median Family Income in La Quinta is $111,992.
What is the Median Household income in La Quinta?
Median Household Income in La Quinta is $92,776.
What is Income or Wage Gap in La Quinta?
Income or Wage Gap in La Quinta is 19.0%.
Women in La Quinta earn 81.0 cents for every dollar earned by a man.
What is Inequality or Gini Index in La Quinta?
Inequality or Gini Index in La Quinta is 0.50.
What is the Total Population of La Quinta?
Total Population of La Quinta is 37,933.
What is the Total Male Population of La Quinta?
Total Male Population of La Quinta is 19,760.
What is the Total Female Population of La Quinta?
Total Female Population of La Quinta is 18,173.
What is the Ratio of Males per 100 Females in La Quinta?
There are 108.73 Males per 100 Females in La Quinta.
What is the Ratio of Females per 100 Males in La Quinta?
There are 91.97 Females per 100 Males in La Quinta.
What is the Median Population Age in La Quinta?
Median Population Age in La Quinta is 51.0 Years.
What is the Average Family Size in La Quinta
Average Family Size in La Quinta is 2.9 People.
What is the Average Household Size in La Quinta
Average Household Size in La Quinta is 2.5 People.
How Large is the Labor Force in La Quinta?
There are 16,670 People in the Labor Forcein in La Quinta.
What is the Percentage of People in the Labor Force in La Quinta?
52.0% of People are in the Labor Force in La Quinta.
What is the Unemployment Rate in La Quinta?
Unemployment Rate in La Quinta is 8.1%.