Swampscott, MA Map & Demographics
Swampscott Map
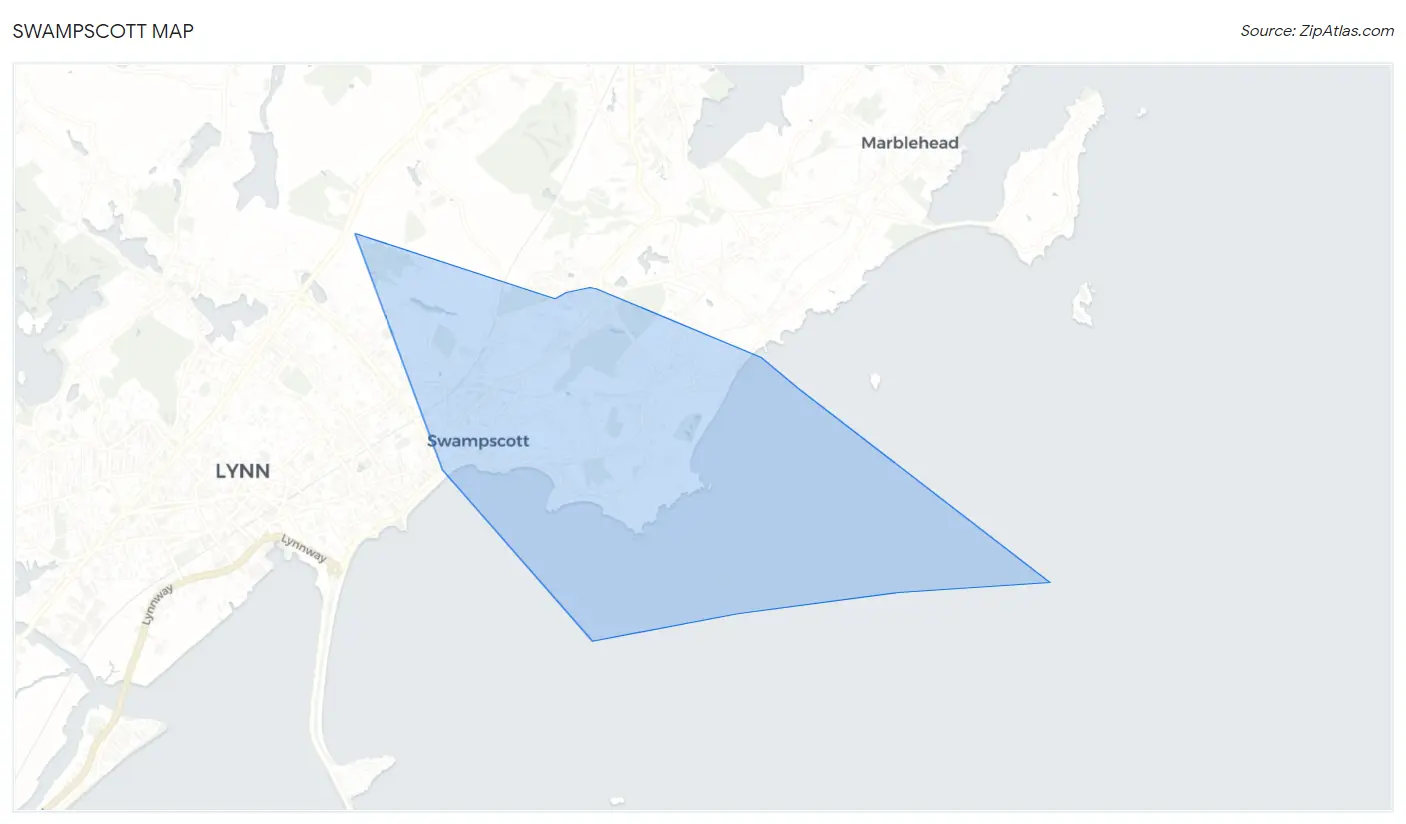
Swampscott Overview
$72,512
PER CAPITA INCOME
$157,614
AVG FAMILY INCOME
$118,646
AVG HOUSEHOLD INCOME
15.3%
WAGE / INCOME GAP [ % ]
84.7¢/ $1
WAGE / INCOME GAP [ $ ]
0.52
INEQUALITY / GINI INDEX
15,125
TOTAL POPULATION
7,130
MALE POPULATION
7,995
FEMALE POPULATION
89.18
MALES / 100 FEMALES
112.13
FEMALES / 100 MALES
45.3
MEDIAN AGE
2.9
AVG FAMILY SIZE
2.4
AVG HOUSEHOLD SIZE
8,582
LABOR FORCE [ PEOPLE ]
69.1%
PERCENT IN LABOR FORCE
5.4%
UNEMPLOYMENT RATE
Swampscott Zip Codes
Income in Swampscott
Income Overview in Swampscott
Per Capita Income in Swampscott is $72,512, while median incomes of families and households are $157,614 and $118,646 respectively.
| Characteristic | Number | Measure |
| Per Capita Income | 15,125 | $72,512 |
| Median Family Income | 4,267 | $157,614 |
| Mean Family Income | 4,267 | $216,013 |
| Median Household Income | 6,278 | $118,646 |
| Mean Household Income | 6,278 | $173,512 |
| Income Deficit | 4,267 | $0 |
| Wage / Income Gap (%) | 15,125 | 15.29% |
| Wage / Income Gap ($) | 15,125 | 84.71¢ per $1 |
| Gini / Inequality Index | 15,125 | 0.52 |
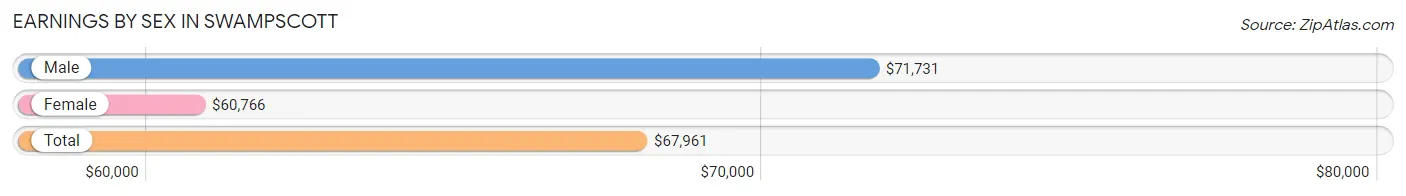
Earnings by Sex in Swampscott
Average Earnings in Swampscott are $67,961, $71,731 for men and $60,766 for women, a difference of 15.3%.
| Sex | Number | Average Earnings |
| Male | 4,416 (49.5%) | $71,731 |
| Female | 4,499 (50.5%) | $60,766 |
| Total | 8,915 (100.0%) | $67,961 |
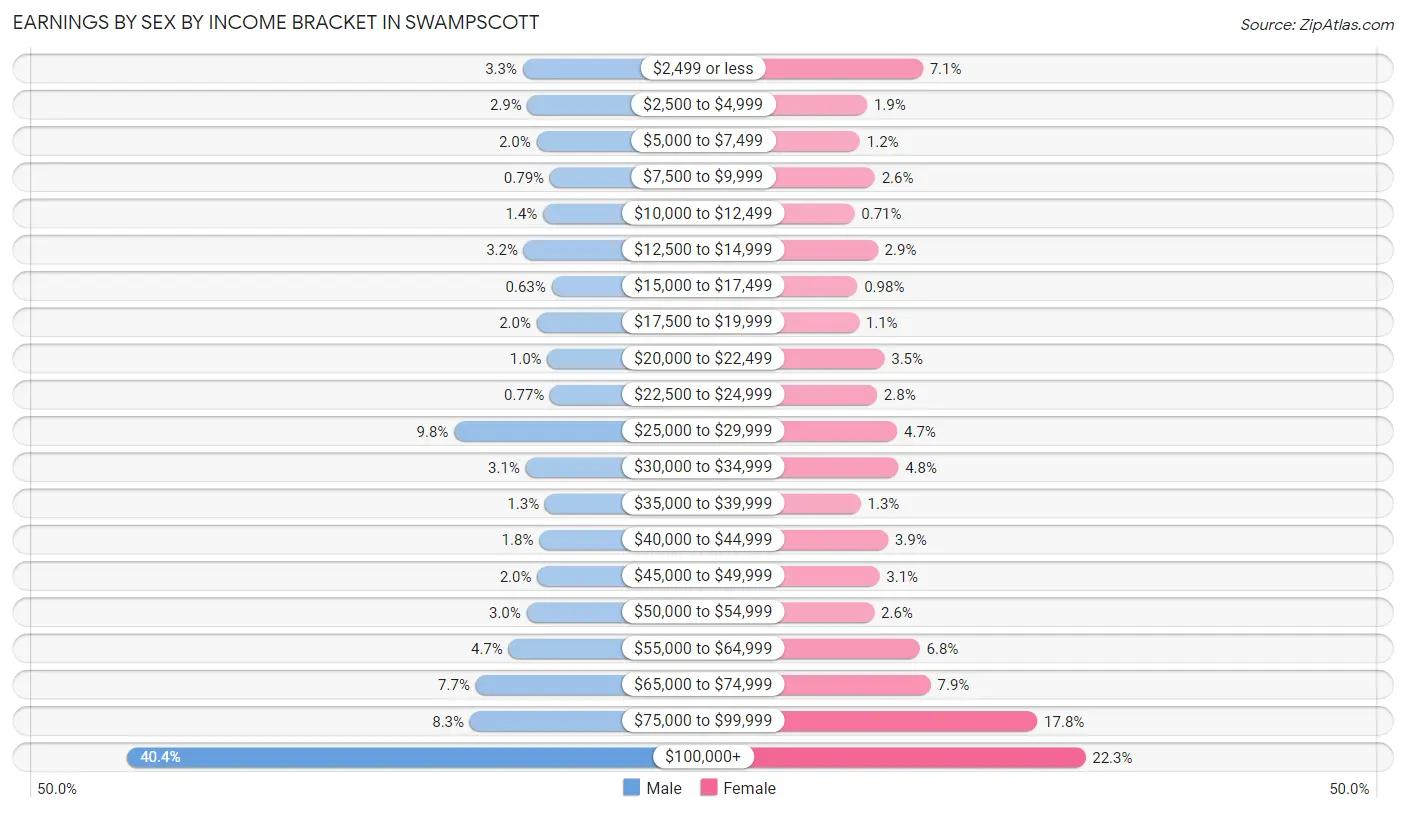
Earnings by Sex by Income Bracket in Swampscott
The most common earnings brackets in Swampscott are $100,000+ for men (1,783 | 40.4%) and $100,000+ for women (1,005 | 22.3%).
| Income | Male | Female |
| $2,499 or less | 147 (3.3%) | 320 (7.1%) |
| $2,500 to $4,999 | 127 (2.9%) | 85 (1.9%) |
| $5,000 to $7,499 | 90 (2.0%) | 55 (1.2%) |
| $7,500 to $9,999 | 35 (0.8%) | 118 (2.6%) |
| $10,000 to $12,499 | 63 (1.4%) | 32 (0.7%) |
| $12,500 to $14,999 | 143 (3.2%) | 130 (2.9%) |
| $15,000 to $17,499 | 28 (0.6%) | 44 (1.0%) |
| $17,500 to $19,999 | 89 (2.0%) | 51 (1.1%) |
| $20,000 to $22,499 | 45 (1.0%) | 158 (3.5%) |
| $22,500 to $24,999 | 34 (0.8%) | 127 (2.8%) |
| $25,000 to $29,999 | 431 (9.8%) | 212 (4.7%) |
| $30,000 to $34,999 | 135 (3.1%) | 217 (4.8%) |
| $35,000 to $39,999 | 55 (1.3%) | 58 (1.3%) |
| $40,000 to $44,999 | 79 (1.8%) | 173 (3.8%) |
| $45,000 to $49,999 | 87 (2.0%) | 137 (3.0%) |
| $50,000 to $54,999 | 131 (3.0%) | 115 (2.6%) |
| $55,000 to $64,999 | 206 (4.7%) | 307 (6.8%) |
| $65,000 to $74,999 | 342 (7.7%) | 353 (7.9%) |
| $75,000 to $99,999 | 366 (8.3%) | 802 (17.8%) |
| $100,000+ | 1,783 (40.4%) | 1,005 (22.3%) |
| Total | 4,416 (100.0%) | 4,499 (100.0%) |
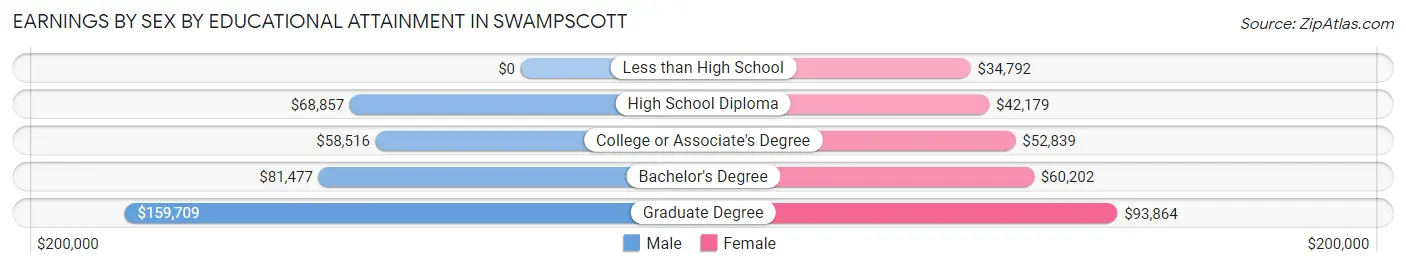
Earnings by Sex by Educational Attainment in Swampscott
Average earnings in Swampscott are $86,078 for men and $70,036 for women, a difference of 18.6%. Men with an educational attainment of graduate degree enjoy the highest average annual earnings of $159,709, while those with college or associate's degree education earn the least with $58,516. Women with an educational attainment of graduate degree earn the most with the average annual earnings of $93,864, while those with less than high school education have the smallest earnings of $34,792.
| Educational Attainment | Male Income | Female Income |
| Less than High School | - | - |
| High School Diploma | $68,857 | $42,179 |
| College or Associate's Degree | $58,516 | $52,839 |
| Bachelor's Degree | $81,477 | $60,202 |
| Graduate Degree | $159,709 | $93,864 |
| Total | $86,078 | $70,036 |
Family Income in Swampscott
Family Income Brackets in Swampscott
According to the Swampscott family income data, there are 1,515 families falling into the $200,000+ income range, which is the most common income bracket and makes up 35.5% of all families. Conversely, the $15,000 to $24,999 income bracket is the least frequent group with only 17 families (0.4%) belonging to this category.
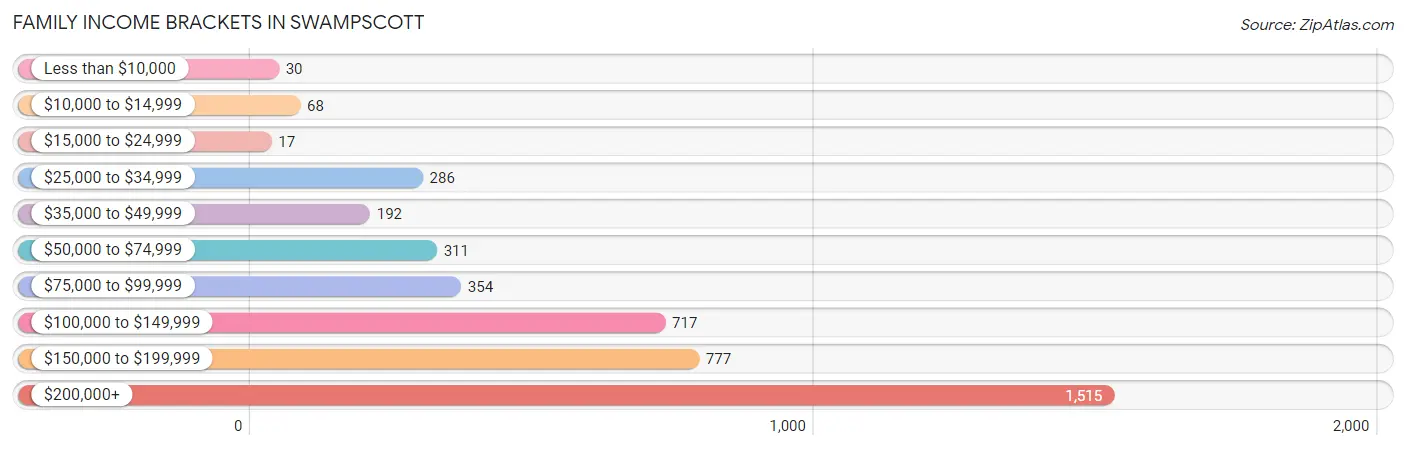
| Income Bracket | # Families | % Families |
| Less than $10,000 | 30 | 0.7% |
| $10,000 to $14,999 | 68 | 1.6% |
| $15,000 to $24,999 | 17 | 0.4% |
| $25,000 to $34,999 | 286 | 6.7% |
| $35,000 to $49,999 | 192 | 4.5% |
| $50,000 to $74,999 | 311 | 7.3% |
| $75,000 to $99,999 | 354 | 8.3% |
| $100,000 to $149,999 | 717 | 16.8% |
| $150,000 to $199,999 | 777 | 18.2% |
| $200,000+ | 1,515 | 35.5% |
Family Income by Famaliy Size in Swampscott
6-person families (45 | 1.1%) account for the highest median family income in Swampscott with $250,001 per family, while 3-person families (1,068 | 25.0%) have the highest median income of $59,425 per family member.
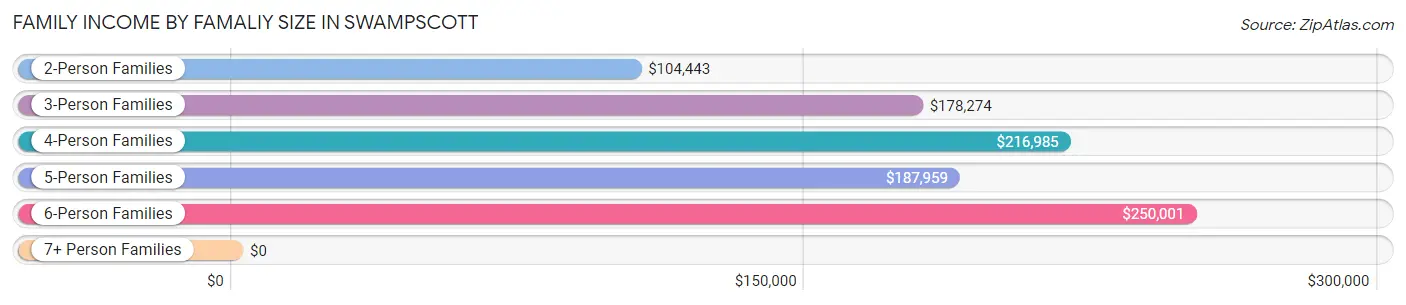
| Income Bracket | # Families | Median Income |
| 2-Person Families | 1,969 (46.1%) | $104,443 |
| 3-Person Families | 1,068 (25.0%) | $178,274 |
| 4-Person Families | 963 (22.6%) | $216,985 |
| 5-Person Families | 204 (4.8%) | $187,959 |
| 6-Person Families | 45 (1.1%) | $250,001 |
| 7+ Person Families | 18 (0.4%) | $0 |
| Total | 4,267 (100.0%) | $157,614 |
Family Income by Number of Earners in Swampscott
The median family income in Swampscott is $157,614, with families comprising 3+ earners (510) having the highest median family income of $193,333, while families with no earners (538) have the lowest median family income of $66,875, accounting for 11.9% and 12.6% of families, respectively.
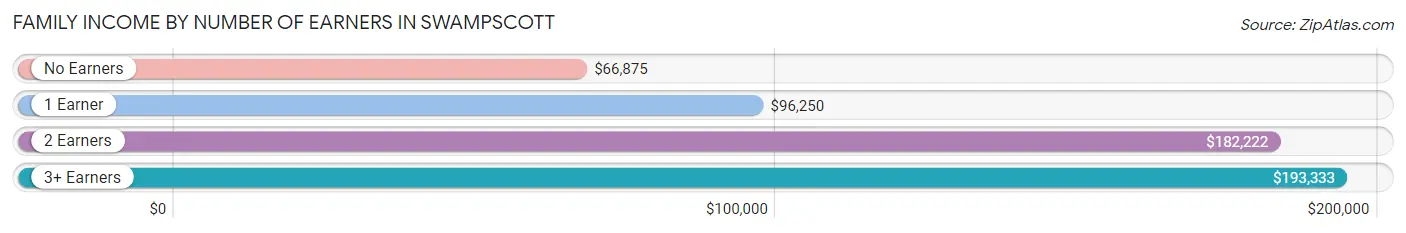
| Number of Earners | # Families | Median Income |
| No Earners | 538 (12.6%) | $66,875 |
| 1 Earner | 907 (21.3%) | $96,250 |
| 2 Earners | 2,312 (54.2%) | $182,222 |
| 3+ Earners | 510 (11.9%) | $193,333 |
| Total | 4,267 (100.0%) | $157,614 |
Household Income in Swampscott
Household Income Brackets in Swampscott
With 1,607 households falling in the category, the $200,000+ income range is the most frequent in Swampscott, accounting for 25.6% of all households. In contrast, only 182 households (2.9%) fall into the $10,000 to $14,999 income bracket, making it the least populous group.
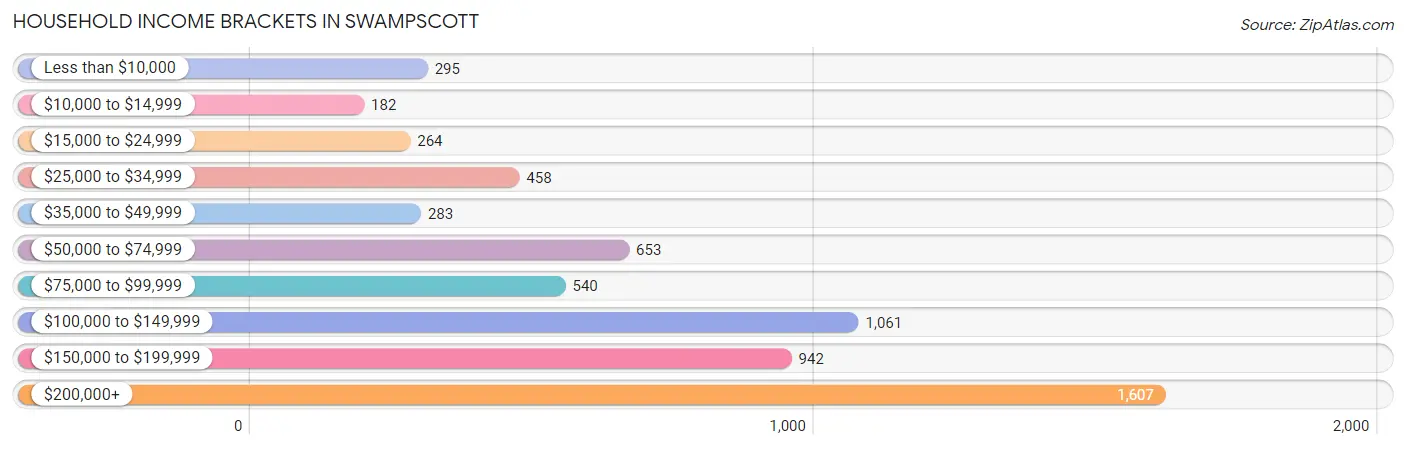
| Income Bracket | # Households | % Households |
| Less than $10,000 | 295 | 4.7% |
| $10,000 to $14,999 | 182 | 2.9% |
| $15,000 to $24,999 | 264 | 4.2% |
| $25,000 to $34,999 | 458 | 7.3% |
| $35,000 to $49,999 | 283 | 4.5% |
| $50,000 to $74,999 | 653 | 10.4% |
| $75,000 to $99,999 | 540 | 8.6% |
| $100,000 to $149,999 | 1,061 | 16.9% |
| $150,000 to $199,999 | 942 | 15.0% |
| $200,000+ | 1,607 | 25.6% |
Household Income by Householder Age in Swampscott
The median household income in Swampscott is $118,646, with the highest median household income of $168,697 found in the 45 to 64 years age bracket for the primary householder. A total of 2,545 households (40.5%) fall into this category. Meanwhile, the 65+ years age bracket for the primary householder has the lowest median household income of $52,465, with 1,933 households (30.8%) in this group.
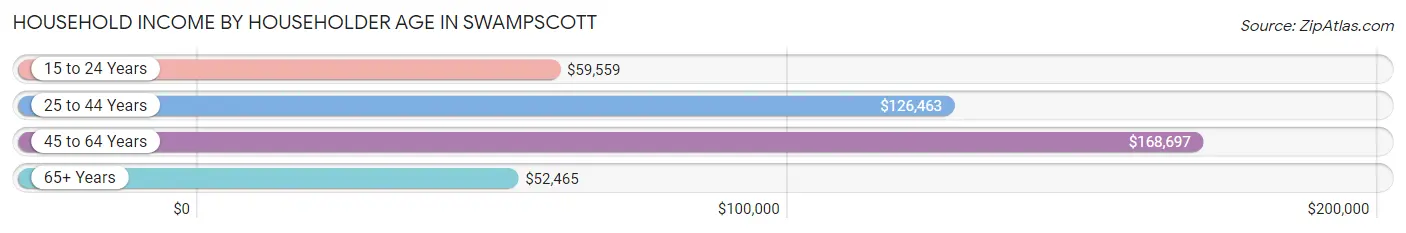
| Income Bracket | # Households | Median Income |
| 15 to 24 Years | 92 (1.5%) | $59,559 |
| 25 to 44 Years | 1,708 (27.2%) | $126,463 |
| 45 to 64 Years | 2,545 (40.5%) | $168,697 |
| 65+ Years | 1,933 (30.8%) | $52,465 |
| Total | 6,278 (100.0%) | $118,646 |
Poverty in Swampscott
Income Below Poverty by Sex and Age in Swampscott
With 5.7% poverty level for males and 7.6% for females among the residents of Swampscott, 75 year old and over males and under 5 year old females are the most vulnerable to poverty, with 51 males (10.5%) and 122 females (24.4%) in their respective age groups living below the poverty level.
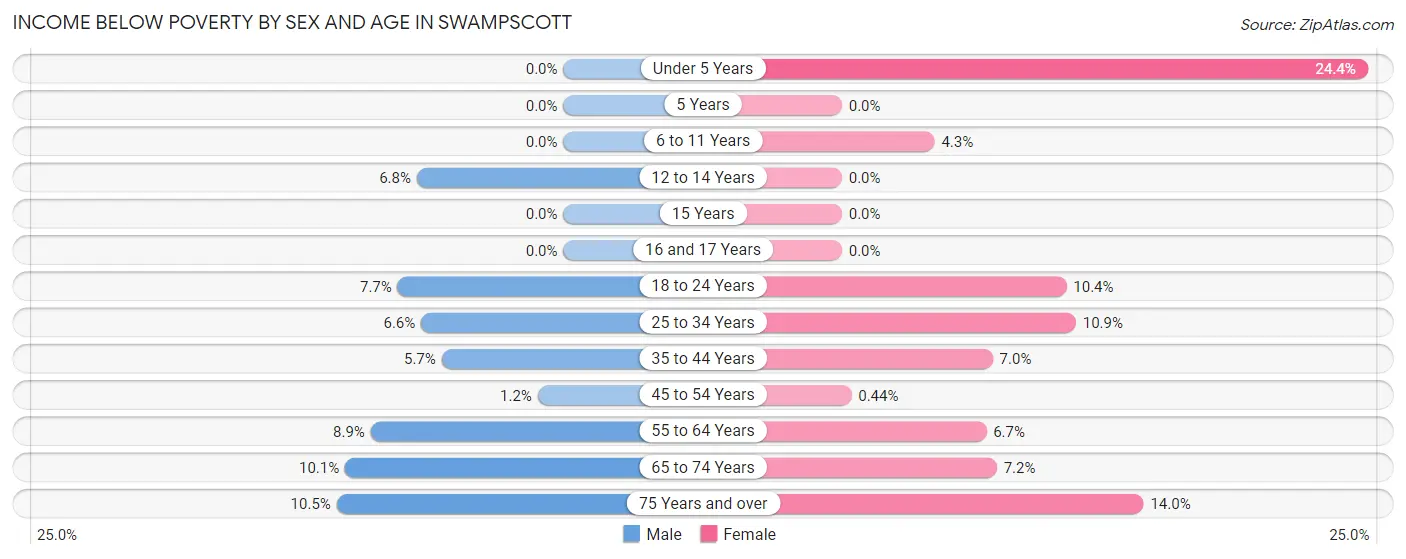
| Age Bracket | Male | Female |
| Under 5 Years | 0 (0.0%) | 122 (24.4%) |
| 5 Years | 0 (0.0%) | 0 (0.0%) |
| 6 to 11 Years | 0 (0.0%) | 25 (4.3%) |
| 12 to 14 Years | 31 (6.8%) | 0 (0.0%) |
| 15 Years | 0 (0.0%) | 0 (0.0%) |
| 16 and 17 Years | 0 (0.0%) | 0 (0.0%) |
| 18 to 24 Years | 41 (7.7%) | 59 (10.4%) |
| 25 to 34 Years | 32 (6.6%) | 92 (10.9%) |
| 35 to 44 Years | 66 (5.7%) | 63 (7.0%) |
| 45 to 54 Years | 14 (1.2%) | 6 (0.4%) |
| 55 to 64 Years | 87 (8.9%) | 75 (6.7%) |
| 65 to 74 Years | 79 (10.1%) | 69 (7.2%) |
| 75 Years and over | 51 (10.5%) | 90 (14.0%) |
| Total | 401 (5.7%) | 601 (7.6%) |
Income Above Poverty by Sex and Age in Swampscott
According to the poverty statistics in Swampscott, males aged under 5 years and females aged 5 years are the age groups that are most secure financially, with 100.0% of males and 100.0% of females in these age groups living above the poverty line.
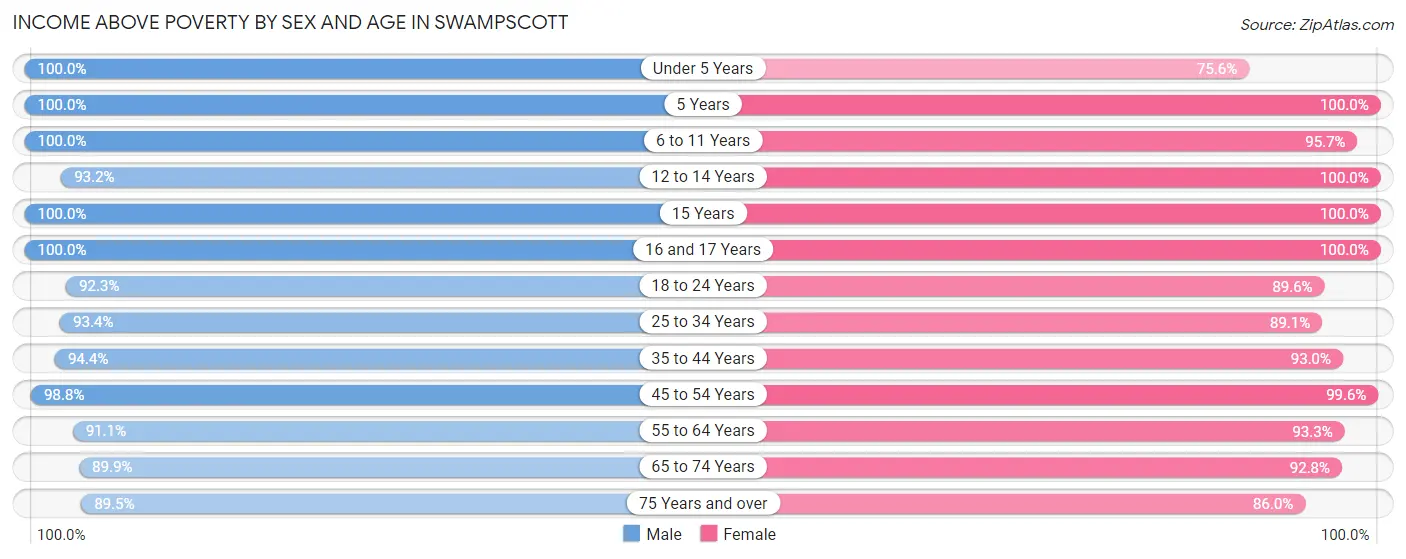
| Age Bracket | Male | Female |
| Under 5 Years | 317 (100.0%) | 378 (75.6%) |
| 5 Years | 93 (100.0%) | 54 (100.0%) |
| 6 to 11 Years | 351 (100.0%) | 556 (95.7%) |
| 12 to 14 Years | 425 (93.2%) | 205 (100.0%) |
| 15 Years | 80 (100.0%) | 44 (100.0%) |
| 16 and 17 Years | 184 (100.0%) | 120 (100.0%) |
| 18 to 24 Years | 492 (92.3%) | 507 (89.6%) |
| 25 to 34 Years | 453 (93.4%) | 755 (89.1%) |
| 35 to 44 Years | 1,103 (94.4%) | 837 (93.0%) |
| 45 to 54 Years | 1,162 (98.8%) | 1,361 (99.6%) |
| 55 to 64 Years | 886 (91.1%) | 1,045 (93.3%) |
| 65 to 74 Years | 701 (89.9%) | 891 (92.8%) |
| 75 Years and over | 434 (89.5%) | 553 (86.0%) |
| Total | 6,681 (94.3%) | 7,306 (92.4%) |
Income Below Poverty Among Married-Couple Families in Swampscott
The poverty statistics for married-couple families in Swampscott show that 2.9% or 102 of the total 3,559 families live below the poverty line. Families with 1 or 2 children have the highest poverty rate of 3.2%, comprising of 43 families. On the other hand, families with 3 or 4 children have the lowest poverty rate of 0.0%, which includes 0 families.
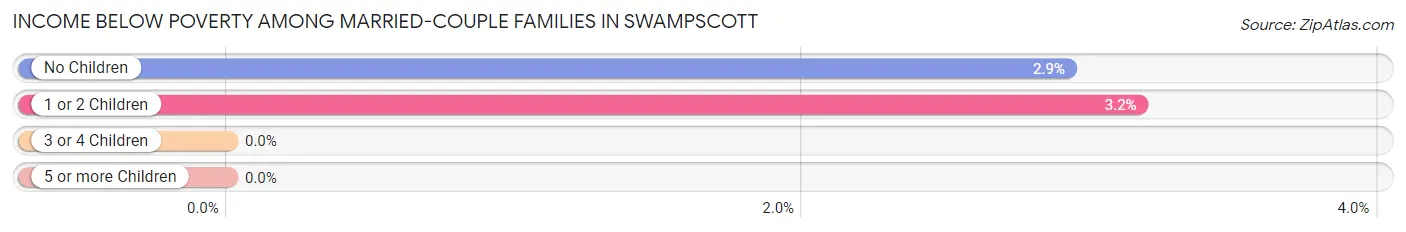
| Children | Above Poverty | Below Poverty |
| No Children | 1,965 (97.1%) | 59 (2.9%) |
| 1 or 2 Children | 1,313 (96.8%) | 43 (3.2%) |
| 3 or 4 Children | 179 (100.0%) | 0 (0.0%) |
| 5 or more Children | 0 (0.0%) | 0 (0.0%) |
| Total | 3,457 (97.1%) | 102 (2.9%) |
Income Below Poverty Among Single-Parent Households in Swampscott
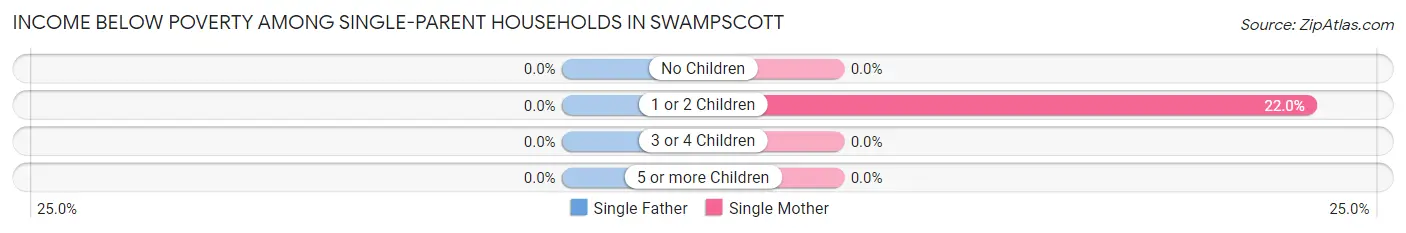
| Children | Single Father | Single Mother |
| No Children | 0 (0.0%) | 0 (0.0%) |
| 1 or 2 Children | 0 (0.0%) | 37 (22.0%) |
| 3 or 4 Children | 0 (0.0%) | 0 (0.0%) |
| 5 or more Children | 0 (0.0%) | 0 (0.0%) |
| Total | 0 (0.0%) | 37 (6.7%) |
Income Below Poverty Among Married-Couple vs Single-Parent Households in Swampscott
The poverty data for Swampscott shows that 102 of the married-couple family households (2.9%) and 37 of the single-parent households (5.2%) are living below the poverty level. Within the married-couple family households, those with 1 or 2 children have the highest poverty rate, with 43 households (3.2%) falling below the poverty line. Among the single-parent households, those with 1 or 2 children have the highest poverty rate, with 37 household (14.3%) living below poverty.
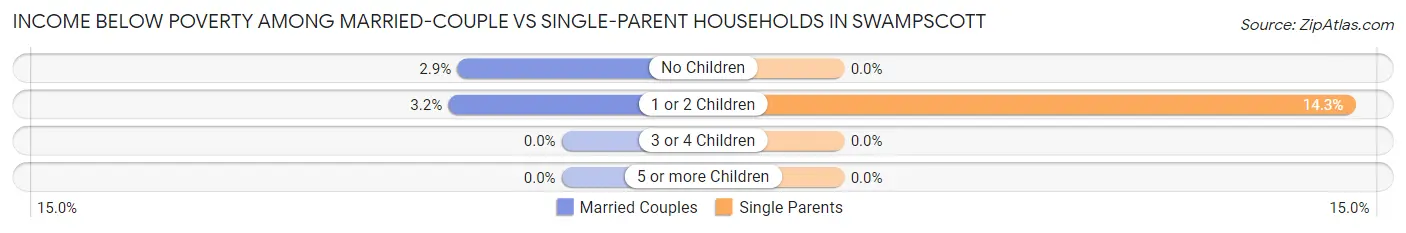
| Children | Married-Couple Families | Single-Parent Households |
| No Children | 59 (2.9%) | 0 (0.0%) |
| 1 or 2 Children | 43 (3.2%) | 37 (14.3%) |
| 3 or 4 Children | 0 (0.0%) | 0 (0.0%) |
| 5 or more Children | 0 (0.0%) | 0 (0.0%) |
| Total | 102 (2.9%) | 37 (5.2%) |
Race in Swampscott
The most populous races in Swampscott are White / Caucasian (13,564 | 89.7%), Hispanic or Latino (778 | 5.1%), and Two or more Races (603 | 4.0%).
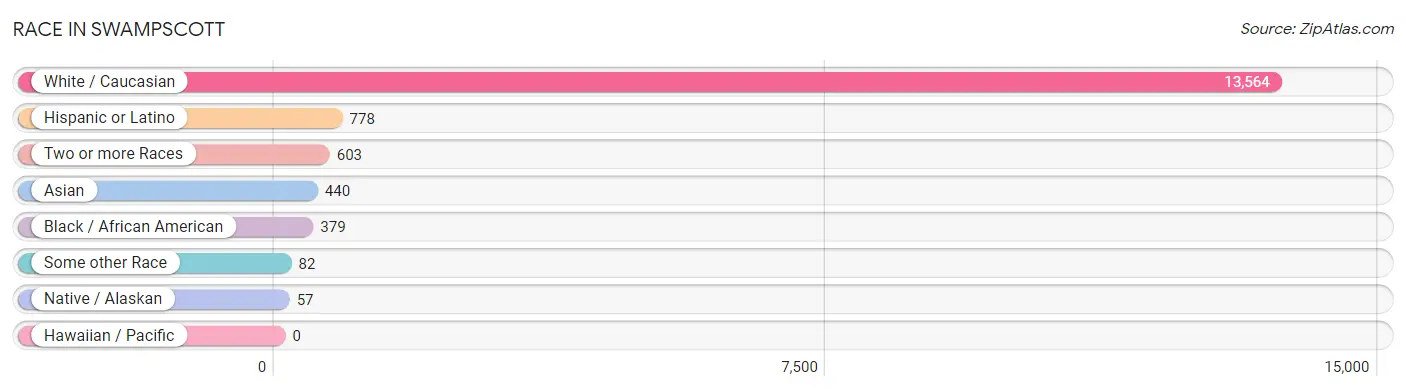
| Race | # Population | % Population |
| Asian | 440 | 2.9% |
| Black / African American | 379 | 2.5% |
| Hawaiian / Pacific | 0 | 0.0% |
| Hispanic or Latino | 778 | 5.1% |
| Native / Alaskan | 57 | 0.4% |
| White / Caucasian | 13,564 | 89.7% |
| Two or more Races | 603 | 4.0% |
| Some other Race | 82 | 0.5% |
| Total | 15,125 | 100.0% |
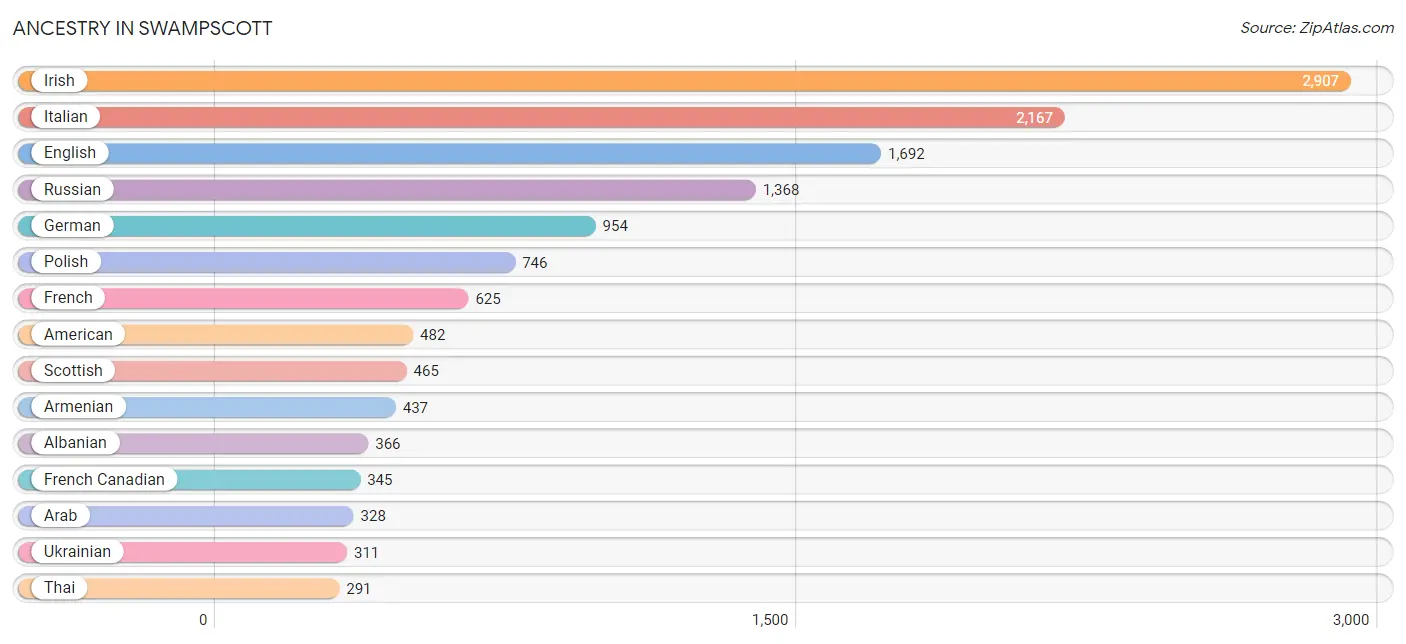
Ancestry in Swampscott
The most populous ancestries reported in Swampscott are Irish (2,907 | 19.2%), Italian (2,167 | 14.3%), English (1,692 | 11.2%), Russian (1,368 | 9.0%), and German (954 | 6.3%), together accounting for 60.1% of all Swampscott residents.
| Ancestry | # Population | % Population |
| African | 38 | 0.3% |
| Albanian | 366 | 2.4% |
| Alsatian | 23 | 0.2% |
| American | 482 | 3.2% |
| Arab | 328 | 2.2% |
| Armenian | 437 | 2.9% |
| Australian | 15 | 0.1% |
| Austrian | 5 | 0.0% |
| Belgian | 19 | 0.1% |
| Bhutanese | 44 | 0.3% |
| Bolivian | 6 | 0.0% |
| Brazilian | 53 | 0.4% |
| British | 42 | 0.3% |
| Burmese | 17 | 0.1% |
| Canadian | 148 | 1.0% |
| Cape Verdean | 9 | 0.1% |
| Central American | 188 | 1.2% |
| Central American Indian | 67 | 0.4% |
| Cherokee | 10 | 0.1% |
| Colombian | 16 | 0.1% |
| Czech | 90 | 0.6% |
| Danish | 5 | 0.0% |
| Dominican | 99 | 0.6% |
| Dutch | 39 | 0.3% |
| Eastern European | 164 | 1.1% |
| English | 1,692 | 11.2% |
| European | 154 | 1.0% |
| Finnish | 41 | 0.3% |
| French | 625 | 4.1% |
| French Canadian | 345 | 2.3% |
| German | 954 | 6.3% |
| Greek | 244 | 1.6% |
| Guatemalan | 68 | 0.4% |
| Haitian | 138 | 0.9% |
| Hungarian | 73 | 0.5% |
| Indian (Asian) | 120 | 0.8% |
| Iranian | 28 | 0.2% |
| Irish | 2,907 | 19.2% |
| Italian | 2,167 | 14.3% |
| Korean | 45 | 0.3% |
| Latvian | 5 | 0.0% |
| Lebanese | 38 | 0.3% |
| Lithuanian | 154 | 1.0% |
| Malaysian | 4 | 0.0% |
| Maltese | 19 | 0.1% |
| Mexican | 39 | 0.3% |
| Moroccan | 224 | 1.5% |
| Nicaraguan | 44 | 0.3% |
| Northern European | 25 | 0.2% |
| Norwegian | 61 | 0.4% |
| Pakistani | 12 | 0.1% |
| Palestinian | 13 | 0.1% |
| Polish | 746 | 4.9% |
| Portuguese | 261 | 1.7% |
| Puerto Rican | 60 | 0.4% |
| Romanian | 142 | 0.9% |
| Russian | 1,368 | 9.0% |
| Salvadoran | 76 | 0.5% |
| Scandinavian | 27 | 0.2% |
| Scotch-Irish | 36 | 0.2% |
| Scottish | 465 | 3.1% |
| Serbian | 106 | 0.7% |
| Sioux | 15 | 0.1% |
| Slovak | 16 | 0.1% |
| South American | 65 | 0.4% |
| Spaniard | 183 | 1.2% |
| Spanish | 33 | 0.2% |
| Spanish American | 68 | 0.4% |
| Sri Lankan | 12 | 0.1% |
| Subsaharan African | 93 | 0.6% |
| Swedish | 118 | 0.8% |
| Syrian | 53 | 0.4% |
| Thai | 291 | 1.9% |
| Turkish | 28 | 0.2% |
| Ukrainian | 311 | 2.1% |
| Uruguayan | 43 | 0.3% |
| Welsh | 62 | 0.4% |
| Yugoslavian | 9 | 0.1% | View All 78 Rows |
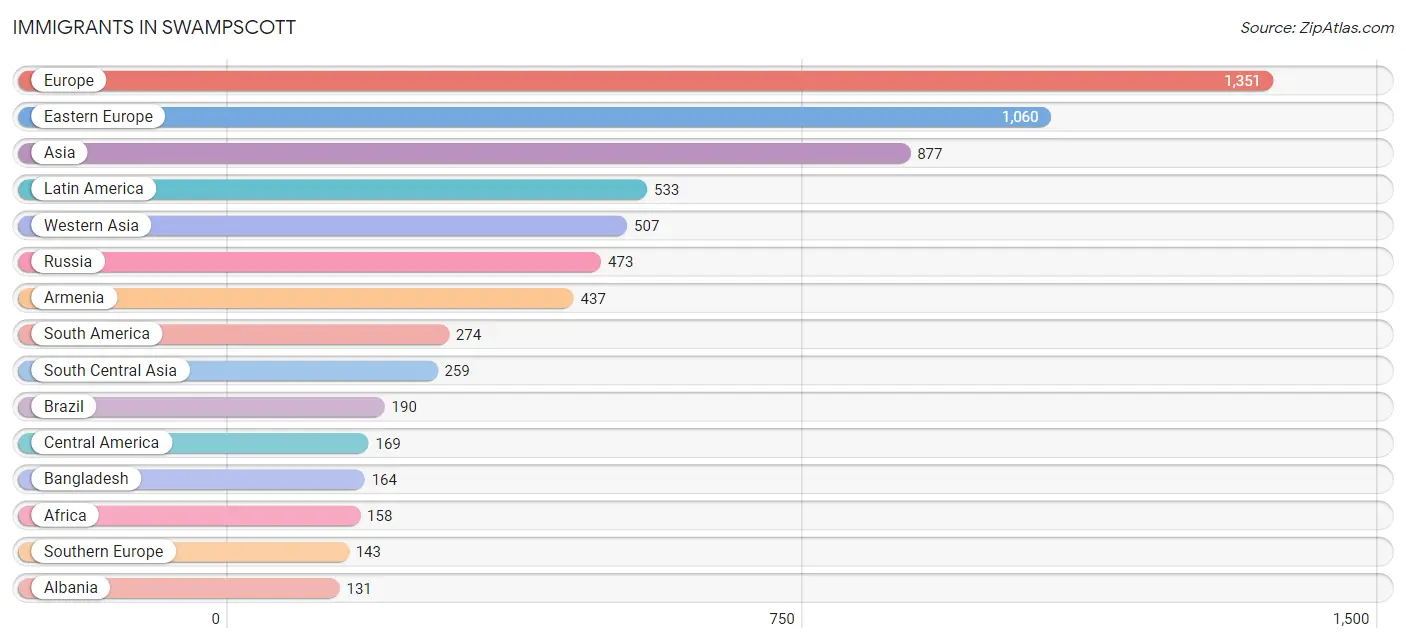
Immigrants in Swampscott
The most numerous immigrant groups reported in Swampscott came from Europe (1,351 | 8.9%), Eastern Europe (1,060 | 7.0%), Asia (877 | 5.8%), Latin America (533 | 3.5%), and Western Asia (507 | 3.4%), together accounting for 28.6% of all Swampscott residents.
| Immigration Origin | # Population | % Population |
| Africa | 158 | 1.0% |
| Albania | 131 | 0.9% |
| Argentina | 14 | 0.1% |
| Armenia | 437 | 2.9% |
| Asia | 877 | 5.8% |
| Bangladesh | 164 | 1.1% |
| Bosnia and Herzegovina | 10 | 0.1% |
| Brazil | 190 | 1.3% |
| Canada | 93 | 0.6% |
| Caribbean | 90 | 0.6% |
| Central America | 169 | 1.1% |
| China | 49 | 0.3% |
| Colombia | 16 | 0.1% |
| Dominican Republic | 26 | 0.2% |
| Eastern Asia | 106 | 0.7% |
| Eastern Europe | 1,060 | 7.0% |
| El Salvador | 92 | 0.6% |
| Europe | 1,351 | 8.9% |
| France | 40 | 0.3% |
| Germany | 6 | 0.0% |
| Greece | 118 | 0.8% |
| Guatemala | 68 | 0.4% |
| Haiti | 64 | 0.4% |
| India | 37 | 0.2% |
| Iran | 28 | 0.2% |
| Iraq | 10 | 0.1% |
| Ireland | 33 | 0.2% |
| Israel | 40 | 0.3% |
| Japan | 44 | 0.3% |
| Korea | 13 | 0.1% |
| Latin America | 533 | 3.5% |
| Latvia | 51 | 0.3% |
| Lithuania | 31 | 0.2% |
| Middle Africa | 11 | 0.1% |
| Moldova | 74 | 0.5% |
| Morocco | 102 | 0.7% |
| Netherlands | 13 | 0.1% |
| Nicaragua | 9 | 0.1% |
| Northern Africa | 102 | 0.7% |
| Northern Europe | 89 | 0.6% |
| Peru | 11 | 0.1% |
| Poland | 5 | 0.0% |
| Russia | 473 | 3.1% |
| Scotland | 18 | 0.1% |
| Serbia | 50 | 0.3% |
| South America | 274 | 1.8% |
| South Central Asia | 259 | 1.7% |
| South Eastern Asia | 5 | 0.0% |
| Southern Europe | 143 | 0.9% |
| Spain | 25 | 0.2% |
| Thailand | 5 | 0.0% |
| Turkey | 20 | 0.1% |
| Ukraine | 112 | 0.7% |
| Uruguay | 43 | 0.3% |
| Western Africa | 7 | 0.1% |
| Western Asia | 507 | 3.4% |
| Western Europe | 59 | 0.4% | View All 57 Rows |
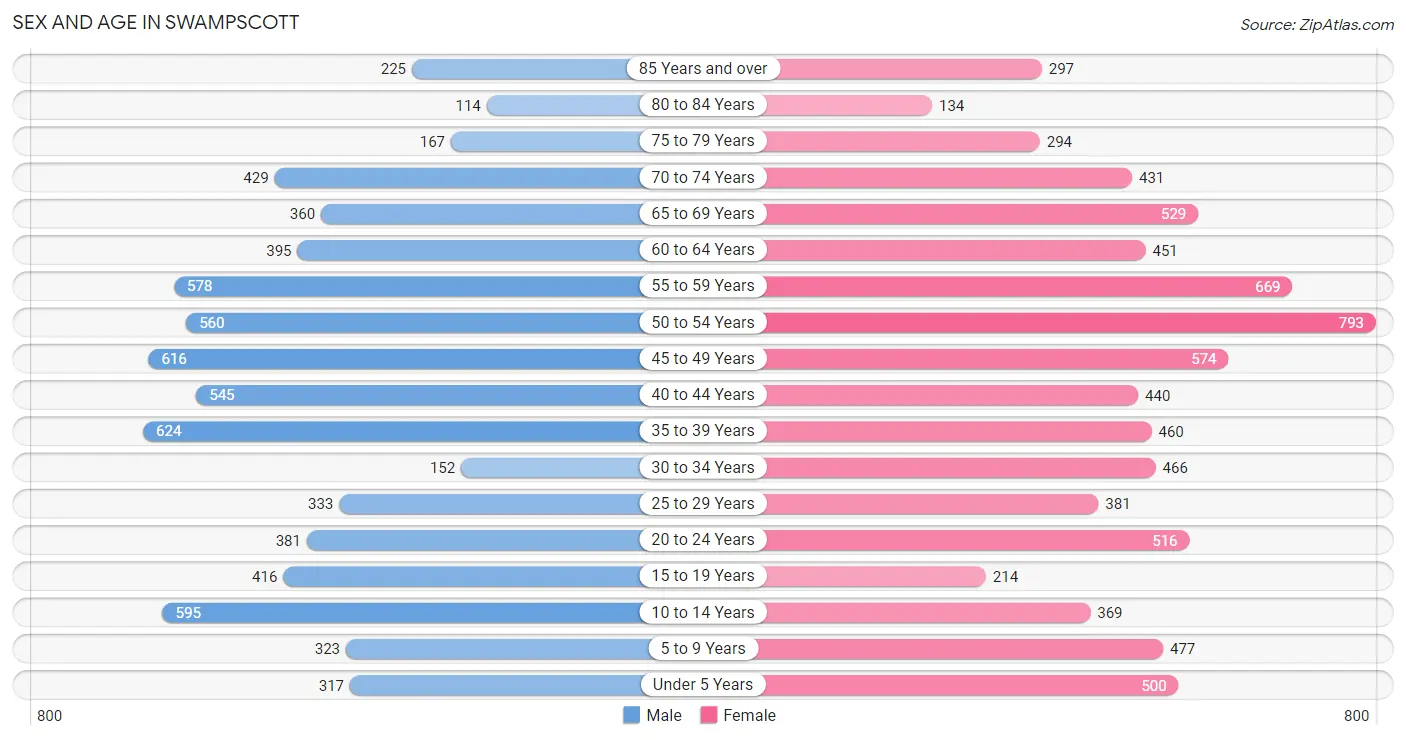
Sex and Age in Swampscott
Sex and Age in Swampscott
The most populous age groups in Swampscott are 35 to 39 Years (624 | 8.7%) for men and 50 to 54 Years (793 | 9.9%) for women.
| Age Bracket | Male | Female |
| Under 5 Years | 317 (4.4%) | 500 (6.2%) |
| 5 to 9 Years | 323 (4.5%) | 477 (6.0%) |
| 10 to 14 Years | 595 (8.4%) | 369 (4.6%) |
| 15 to 19 Years | 416 (5.8%) | 214 (2.7%) |
| 20 to 24 Years | 381 (5.3%) | 516 (6.5%) |
| 25 to 29 Years | 333 (4.7%) | 381 (4.8%) |
| 30 to 34 Years | 152 (2.1%) | 466 (5.8%) |
| 35 to 39 Years | 624 (8.7%) | 460 (5.8%) |
| 40 to 44 Years | 545 (7.6%) | 440 (5.5%) |
| 45 to 49 Years | 616 (8.6%) | 574 (7.2%) |
| 50 to 54 Years | 560 (7.9%) | 793 (9.9%) |
| 55 to 59 Years | 578 (8.1%) | 669 (8.4%) |
| 60 to 64 Years | 395 (5.5%) | 451 (5.6%) |
| 65 to 69 Years | 360 (5.1%) | 529 (6.6%) |
| 70 to 74 Years | 429 (6.0%) | 431 (5.4%) |
| 75 to 79 Years | 167 (2.3%) | 294 (3.7%) |
| 80 to 84 Years | 114 (1.6%) | 134 (1.7%) |
| 85 Years and over | 225 (3.2%) | 297 (3.7%) |
| Total | 7,130 (100.0%) | 7,995 (100.0%) |
Families and Households in Swampscott
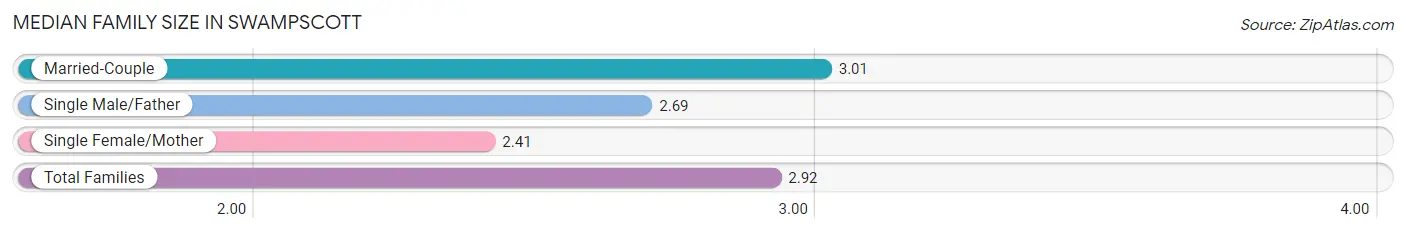
Median Family Size in Swampscott
The median family size in Swampscott is 2.92 persons per family, with married-couple families (3,559 | 83.4%) accounting for the largest median family size of 3.01 persons per family. On the other hand, single female/mother families (552 | 12.9%) represent the smallest median family size with 2.41 persons per family.
| Family Type | # Families | Family Size |
| Married-Couple | 3,559 (83.4%) | 3.01 |
| Single Male/Father | 156 (3.7%) | 2.69 |
| Single Female/Mother | 552 (12.9%) | 2.41 |
| Total Families | 4,267 (100.0%) | 2.92 |
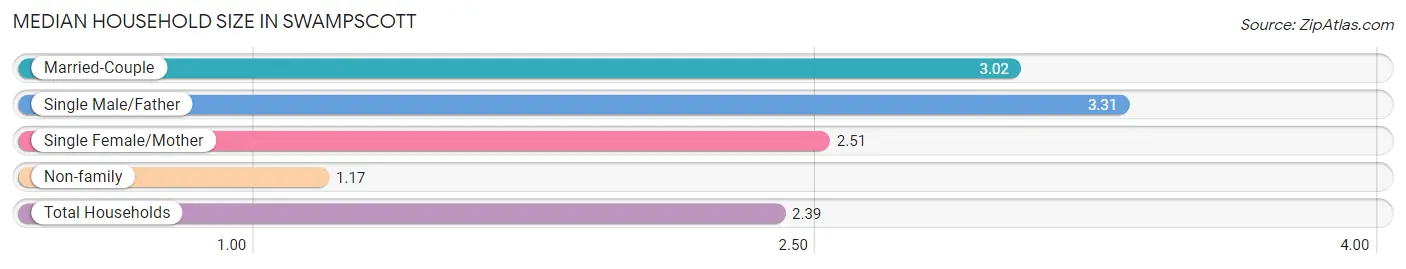
Median Household Size in Swampscott
The median household size in Swampscott is 2.39 persons per household, with single male/father households (156 | 2.5%) accounting for the largest median household size of 3.31 persons per household. non-family households (2,011 | 32.0%) represent the smallest median household size with 1.17 persons per household.
| Household Type | # Households | Household Size |
| Married-Couple | 3,559 (56.7%) | 3.02 |
| Single Male/Father | 156 (2.5%) | 3.31 |
| Single Female/Mother | 552 (8.8%) | 2.51 |
| Non-family | 2,011 (32.0%) | 1.17 |
| Total Households | 6,278 (100.0%) | 2.39 |
Household Size by Marriage Status in Swampscott
Out of a total of 6,278 households in Swampscott, 4,267 (68.0%) are family households, while 2,011 (32.0%) are nonfamily households. The most numerous type of family households are 2-person households, comprising 1,899, and the most common type of nonfamily households are 1-person households, comprising 1,692.
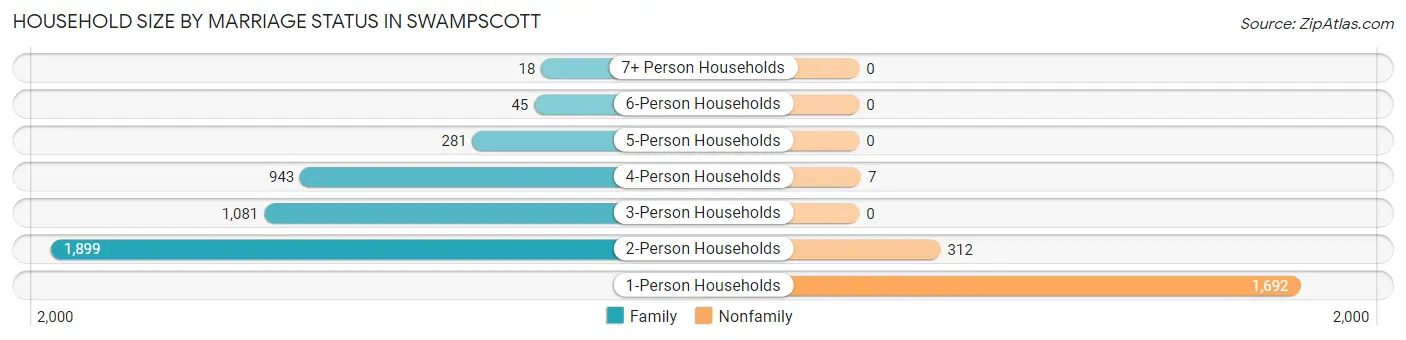
| Household Size | Family Households | Nonfamily Households |
| 1-Person Households | - | 1,692 (27.0%) |
| 2-Person Households | 1,899 (30.2%) | 312 (5.0%) |
| 3-Person Households | 1,081 (17.2%) | 0 (0.0%) |
| 4-Person Households | 943 (15.0%) | 7 (0.1%) |
| 5-Person Households | 281 (4.5%) | 0 (0.0%) |
| 6-Person Households | 45 (0.7%) | 0 (0.0%) |
| 7+ Person Households | 18 (0.3%) | 0 (0.0%) |
| Total | 4,267 (68.0%) | 2,011 (32.0%) |
Female Fertility in Swampscott
Fertility by Age in Swampscott
Average fertility rate in Swampscott is 51.0 births per 1,000 women. Women in the age bracket of 20 to 34 years have the highest fertility rate with 65.0 births per 1,000 women. Women in the age bracket of 20 to 34 years acount for 52.0% of all women with births.
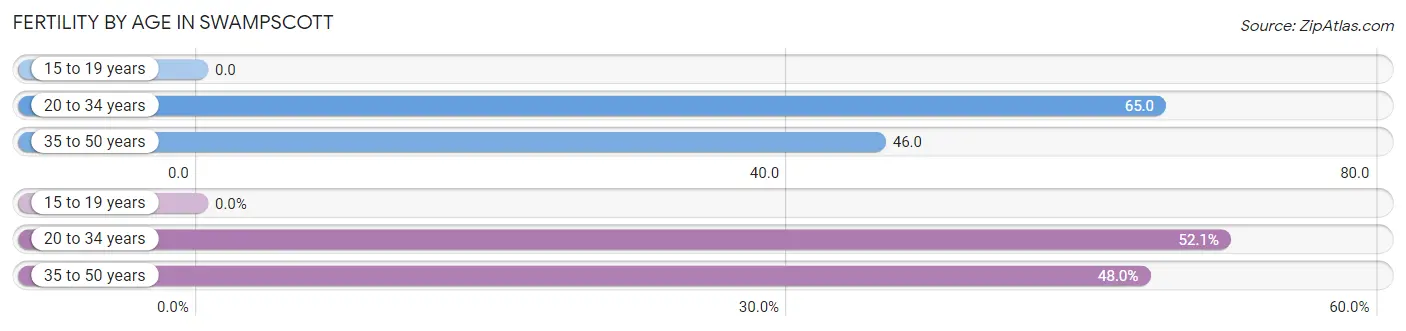
| Age Bracket | Women with Births | Births / 1,000 Women |
| 15 to 19 years | 0 (0.0%) | 0.0 |
| 20 to 34 years | 89 (52.0%) | 65.0 |
| 35 to 50 years | 82 (47.9%) | 46.0 |
| Total | 171 (100.0%) | 51.0 |
Fertility by Age by Marriage Status in Swampscott
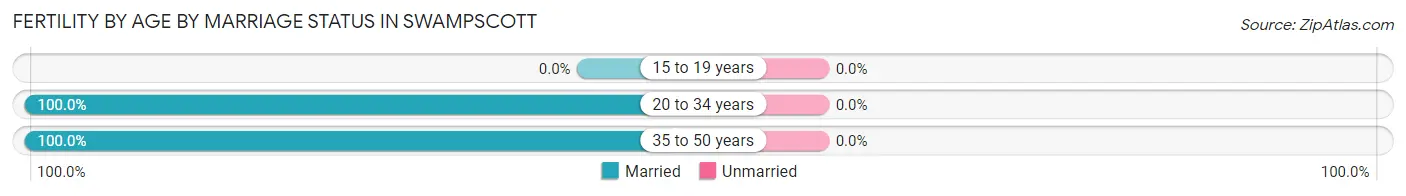
| Age Bracket | Married | Unmarried |
| 15 to 19 years | 0 (0.0%) | 0 (0.0%) |
| 20 to 34 years | 89 (100.0%) | 0 (0.0%) |
| 35 to 50 years | 82 (100.0%) | 0 (0.0%) |
| Total | 171 (100.0%) | 0 (0.0%) |
Fertility by Education in Swampscott
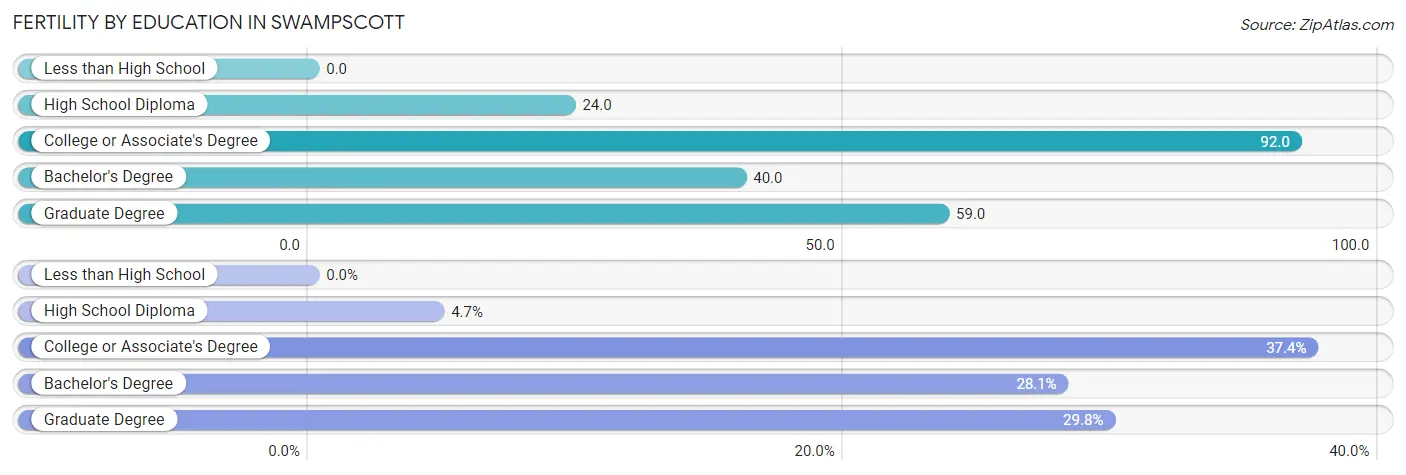
| Educational Attainment | Women with Births | Births / 1,000 Women |
| Less than High School | 0 (0.0%) | 0.0 |
| High School Diploma | 8 (4.7%) | 24.0 |
| College or Associate's Degree | 64 (37.4%) | 92.0 |
| Bachelor's Degree | 48 (28.1%) | 40.0 |
| Graduate Degree | 51 (29.8%) | 59.0 |
| Total | 171 (100.0%) | 51.0 |
Fertility by Education by Marriage Status in Swampscott
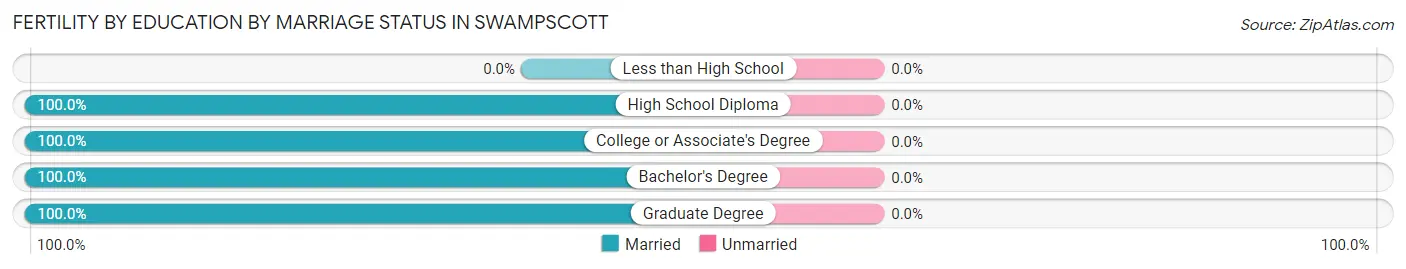
| Educational Attainment | Married | Unmarried |
| Less than High School | 0 (0.0%) | 0 (0.0%) |
| High School Diploma | 8 (100.0%) | 0 (0.0%) |
| College or Associate's Degree | 64 (100.0%) | 0 (0.0%) |
| Bachelor's Degree | 48 (100.0%) | 0 (0.0%) |
| Graduate Degree | 51 (100.0%) | 0 (0.0%) |
| Total | 171 (100.0%) | 0 (0.0%) |
Employment Characteristics in Swampscott
Employment by Class of Employer in Swampscott
Among the 8,108 employed individuals in Swampscott, private company employees (4,857 | 59.9%), not-for-profit organizations (1,189 | 14.7%), and self-employed (not incorporated) (782 | 9.6%) make up the most common classes of employment.
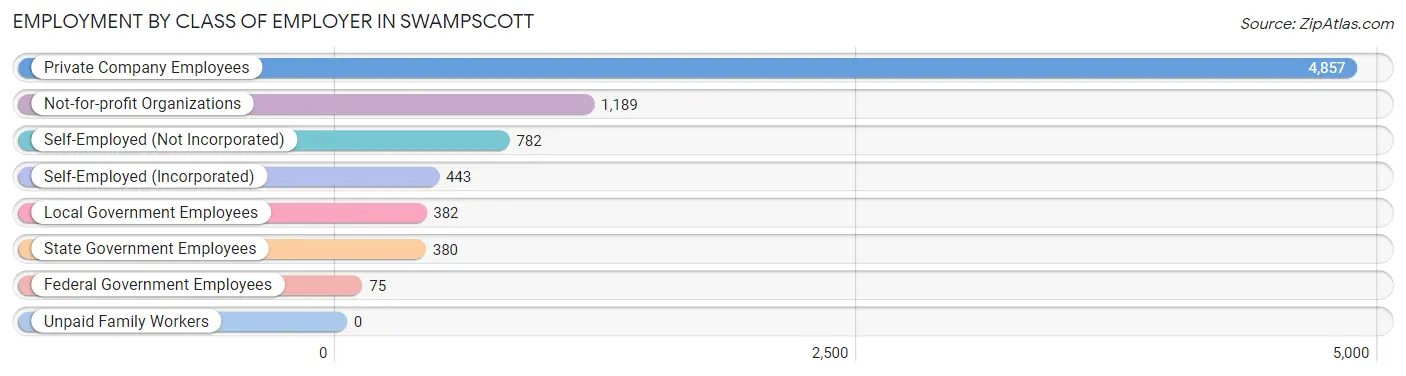
| Employer Class | # Employees | % Employees |
| Private Company Employees | 4,857 | 59.9% |
| Self-Employed (Incorporated) | 443 | 5.5% |
| Self-Employed (Not Incorporated) | 782 | 9.6% |
| Not-for-profit Organizations | 1,189 | 14.7% |
| Local Government Employees | 382 | 4.7% |
| State Government Employees | 380 | 4.7% |
| Federal Government Employees | 75 | 0.9% |
| Unpaid Family Workers | 0 | 0.0% |
| Total | 8,108 | 100.0% |
Employment Status by Age in Swampscott
According to the labor force statistics for Swampscott, out of the total population over 16 years of age (12,420), 69.1% or 8,582 individuals are in the labor force, with 5.4% or 463 of them unemployed. The age group with the highest labor force participation rate is 25 to 29 years, with 95.1% or 679 individuals in the labor force. Within the labor force, the 25 to 29 years age range has the highest percentage of unemployed individuals, with 11.8% or 80 of them being unemployed.
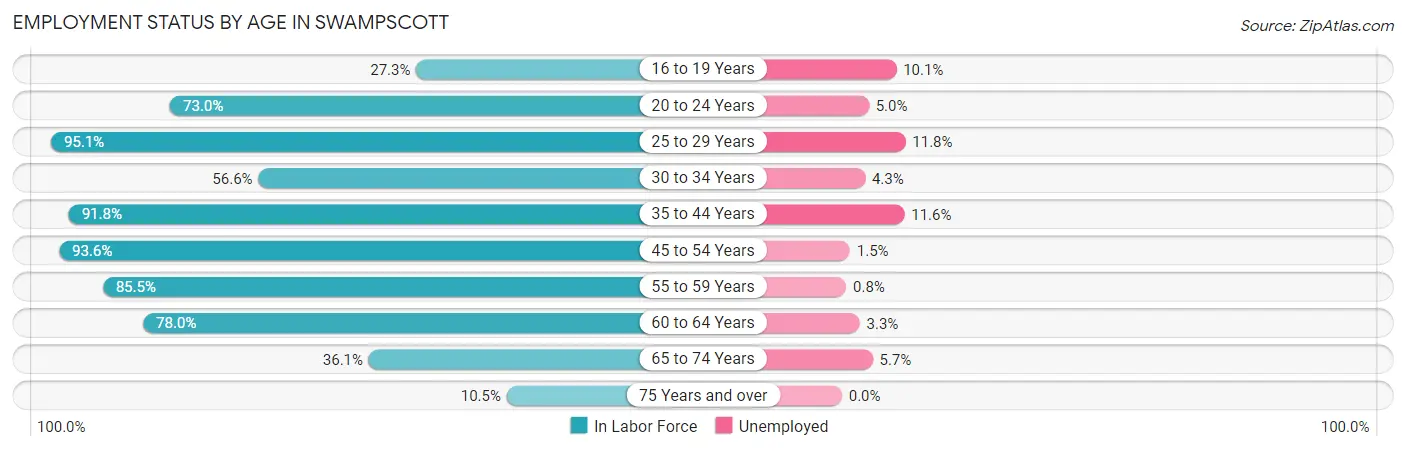
| Age Bracket | In Labor Force | Unemployed |
| 16 to 19 Years | 138 (27.3%) | 14 (10.1%) |
| 20 to 24 Years | 655 (73.0%) | 33 (5.0%) |
| 25 to 29 Years | 679 (95.1%) | 80 (11.8%) |
| 30 to 34 Years | 350 (56.6%) | 15 (4.3%) |
| 35 to 44 Years | 1,899 (91.8%) | 220 (11.6%) |
| 45 to 54 Years | 2,380 (93.6%) | 36 (1.5%) |
| 55 to 59 Years | 1,066 (85.5%) | 9 (0.8%) |
| 60 to 64 Years | 660 (78.0%) | 22 (3.3%) |
| 65 to 74 Years | 631 (36.1%) | 36 (5.7%) |
| 75 Years and over | 129 (10.5%) | 0 (0.0%) |
| Total | 8,582 (69.1%) | 463 (5.4%) |
Employment Status by Educational Attainment in Swampscott
According to labor force statistics for Swampscott, 87.5% of individuals (7,032) out of the total population between 25 and 64 years of age (8,037) are in the labor force, with 5.4% or 380 of them being unemployed. The group with the highest labor force participation rate are those with the educational attainment of bachelor's degree or higher, with 94.1% or 5,072 individuals in the labor force. Within the labor force, individuals with less than high school education have the highest percentage of unemployment, with 10.8% or 17 of them being unemployed.
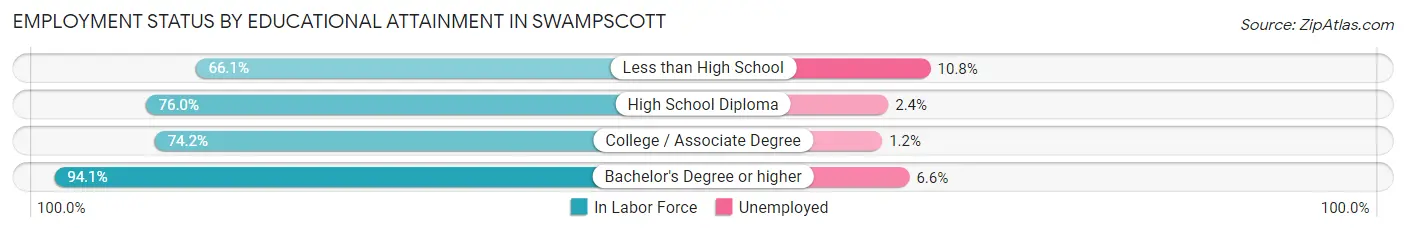
| Educational Attainment | In Labor Force | Unemployed |
| Less than High School | 158 (66.1%) | 26 (10.8%) |
| High School Diploma | 665 (76.0%) | 21 (2.4%) |
| College / Associate Degree | 1,137 (74.2%) | 18 (1.2%) |
| Bachelor's Degree or higher | 5,072 (94.1%) | 356 (6.6%) |
| Total | 7,032 (87.5%) | 434 (5.4%) |
Employment Occupations by Sex in Swampscott
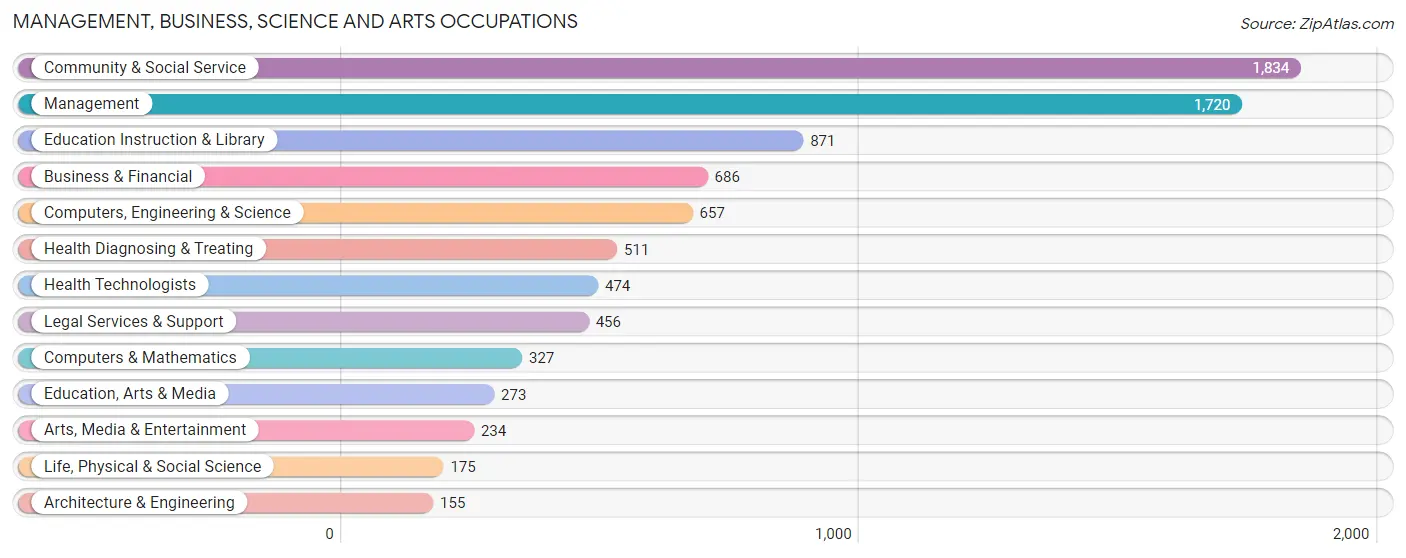
Management, Business, Science and Arts Occupations
The most common Management, Business, Science and Arts occupations in Swampscott are Community & Social Service (1,834 | 22.6%), Management (1,720 | 21.2%), Education Instruction & Library (871 | 10.7%), Business & Financial (686 | 8.5%), and Computers, Engineering & Science (657 | 8.1%).
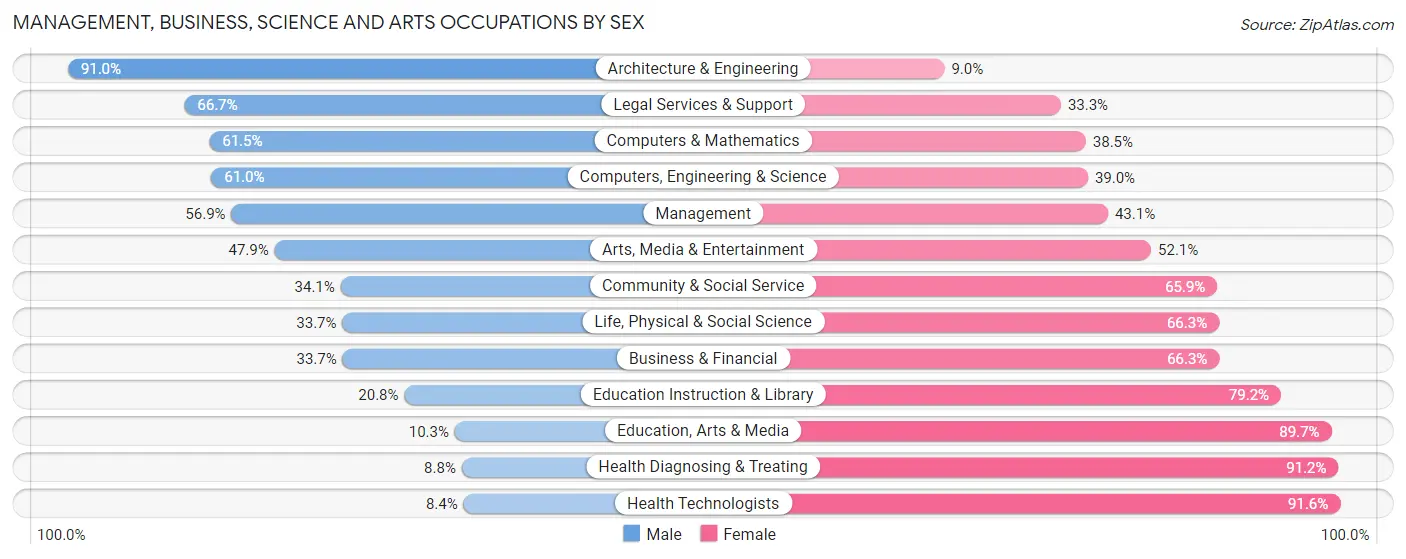
Management, Business, Science and Arts Occupations by Sex
Within the Management, Business, Science and Arts occupations in Swampscott, the most male-oriented occupations are Architecture & Engineering (91.0%), Legal Services & Support (66.7%), and Computers & Mathematics (61.5%), while the most female-oriented occupations are Health Technologists (91.6%), Health Diagnosing & Treating (91.2%), and Education, Arts & Media (89.7%).
| Occupation | Male | Female |
| Management | 978 (56.9%) | 742 (43.1%) |
| Business & Financial | 231 (33.7%) | 455 (66.3%) |
| Computers, Engineering & Science | 401 (61.0%) | 256 (39.0%) |
| Computers & Mathematics | 201 (61.5%) | 126 (38.5%) |
| Architecture & Engineering | 141 (91.0%) | 14 (9.0%) |
| Life, Physical & Social Science | 59 (33.7%) | 116 (66.3%) |
| Community & Social Service | 625 (34.1%) | 1,209 (65.9%) |
| Education, Arts & Media | 28 (10.3%) | 245 (89.7%) |
| Legal Services & Support | 304 (66.7%) | 152 (33.3%) |
| Education Instruction & Library | 181 (20.8%) | 690 (79.2%) |
| Arts, Media & Entertainment | 112 (47.9%) | 122 (52.1%) |
| Health Diagnosing & Treating | 45 (8.8%) | 466 (91.2%) |
| Health Technologists | 40 (8.4%) | 434 (91.6%) |
| Total (Category) | 2,280 (42.2%) | 3,128 (57.8%) |
| Total (Overall) | 3,854 (47.5%) | 4,260 (52.5%) |
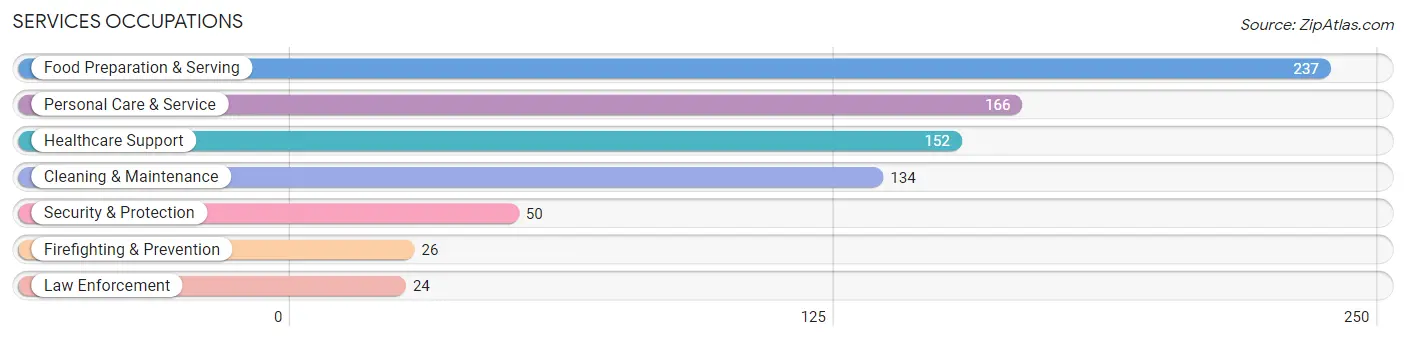
Services Occupations
The most common Services occupations in Swampscott are Food Preparation & Serving (237 | 2.9%), Personal Care & Service (166 | 2.1%), Healthcare Support (152 | 1.9%), Cleaning & Maintenance (134 | 1.7%), and Security & Protection (50 | 0.6%).
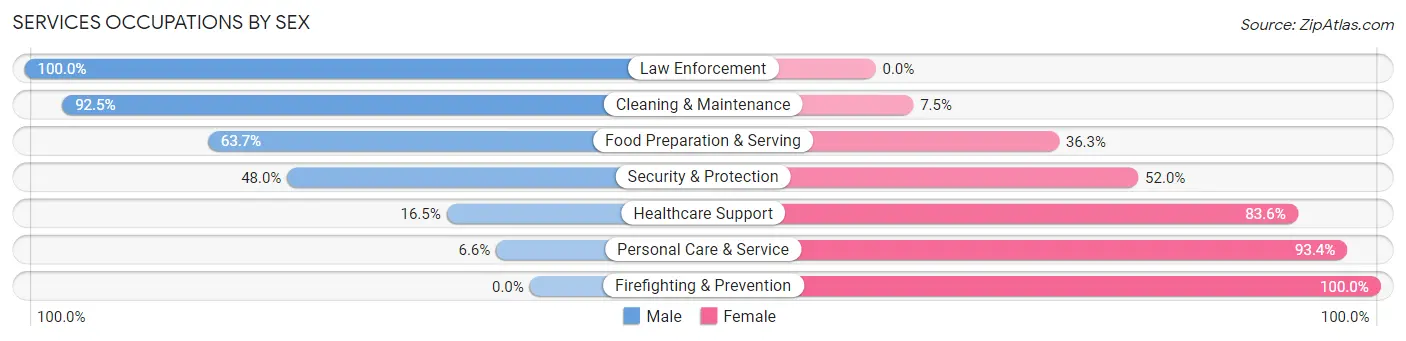
Services Occupations by Sex
Within the Services occupations in Swampscott, the most male-oriented occupations are Law Enforcement (100.0%), Cleaning & Maintenance (92.5%), and Food Preparation & Serving (63.7%), while the most female-oriented occupations are Firefighting & Prevention (100.0%), Personal Care & Service (93.4%), and Healthcare Support (83.6%).
| Occupation | Male | Female |
| Healthcare Support | 25 (16.5%) | 127 (83.6%) |
| Security & Protection | 24 (48.0%) | 26 (52.0%) |
| Firefighting & Prevention | 0 (0.0%) | 26 (100.0%) |
| Law Enforcement | 24 (100.0%) | 0 (0.0%) |
| Food Preparation & Serving | 151 (63.7%) | 86 (36.3%) |
| Cleaning & Maintenance | 124 (92.5%) | 10 (7.5%) |
| Personal Care & Service | 11 (6.6%) | 155 (93.4%) |
| Total (Category) | 335 (45.3%) | 404 (54.7%) |
| Total (Overall) | 3,854 (47.5%) | 4,260 (52.5%) |
Sales and Office Occupations
The most common Sales and Office occupations in Swampscott are Office & Administration (593 | 7.3%), and Sales & Related (587 | 7.2%).
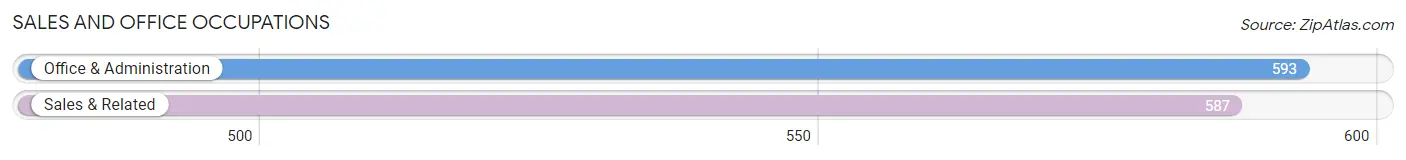
Sales and Office Occupations by Sex
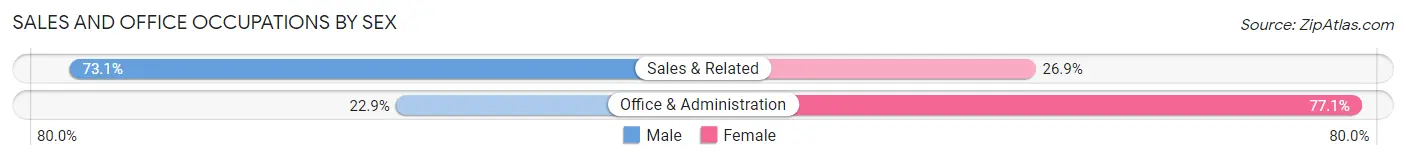
| Occupation | Male | Female |
| Sales & Related | 429 (73.1%) | 158 (26.9%) |
| Office & Administration | 136 (22.9%) | 457 (77.1%) |
| Total (Category) | 565 (47.9%) | 615 (52.1%) |
| Total (Overall) | 3,854 (47.5%) | 4,260 (52.5%) |
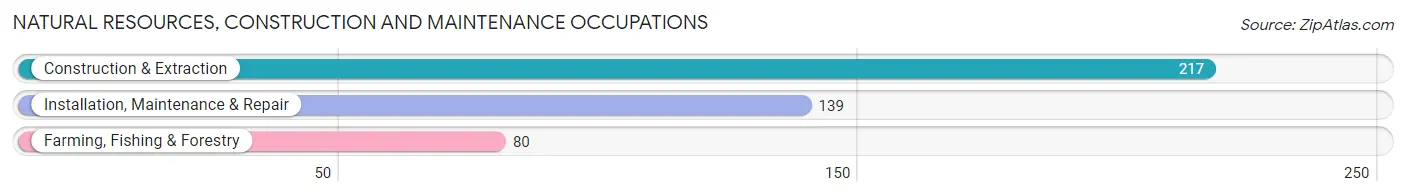
Natural Resources, Construction and Maintenance Occupations
The most common Natural Resources, Construction and Maintenance occupations in Swampscott are Construction & Extraction (217 | 2.7%), Installation, Maintenance & Repair (139 | 1.7%), and Farming, Fishing & Forestry (80 | 1.0%).
Natural Resources, Construction and Maintenance Occupations by Sex
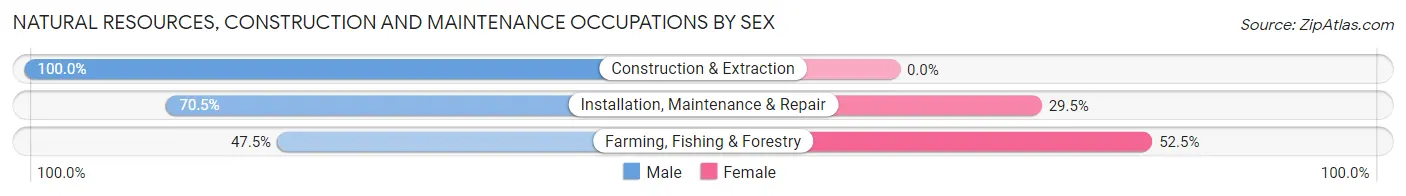
| Occupation | Male | Female |
| Farming, Fishing & Forestry | 38 (47.5%) | 42 (52.5%) |
| Construction & Extraction | 217 (100.0%) | 0 (0.0%) |
| Installation, Maintenance & Repair | 98 (70.5%) | 41 (29.5%) |
| Total (Category) | 353 (81.0%) | 83 (19.0%) |
| Total (Overall) | 3,854 (47.5%) | 4,260 (52.5%) |
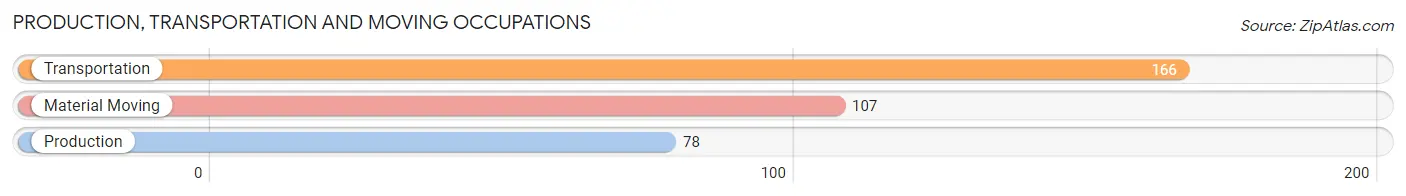
Production, Transportation and Moving Occupations
The most common Production, Transportation and Moving occupations in Swampscott are Transportation (166 | 2.1%), Material Moving (107 | 1.3%), and Production (78 | 1.0%).
Production, Transportation and Moving Occupations by Sex
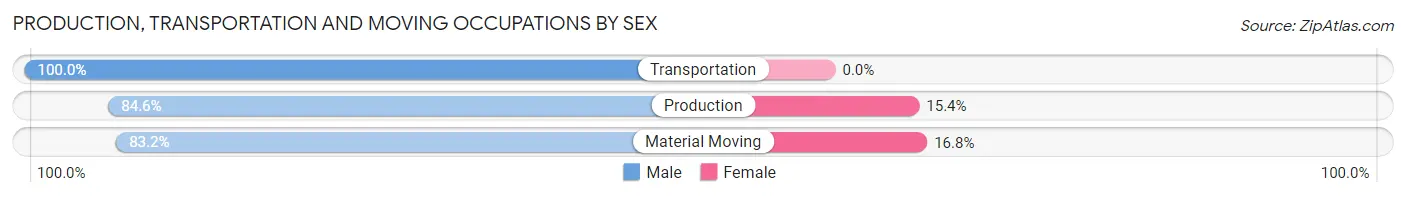
| Occupation | Male | Female |
| Production | 66 (84.6%) | 12 (15.4%) |
| Transportation | 166 (100.0%) | 0 (0.0%) |
| Material Moving | 89 (83.2%) | 18 (16.8%) |
| Total (Category) | 321 (91.4%) | 30 (8.6%) |
| Total (Overall) | 3,854 (47.5%) | 4,260 (52.5%) |
Employment Industries by Sex in Swampscott
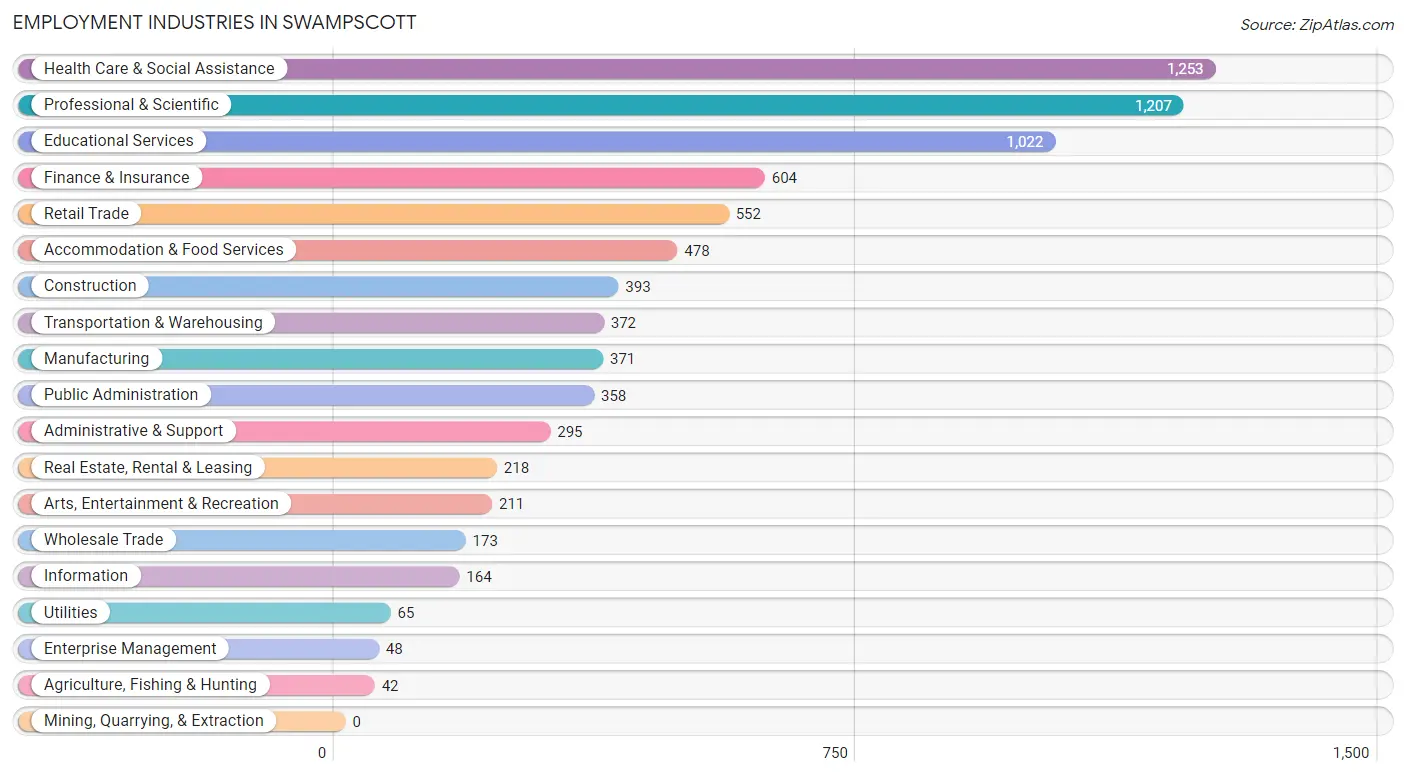
Employment Industries in Swampscott
The major employment industries in Swampscott include Health Care & Social Assistance (1,253 | 15.4%), Professional & Scientific (1,207 | 14.9%), Educational Services (1,022 | 12.6%), Finance & Insurance (604 | 7.4%), and Retail Trade (552 | 6.8%).
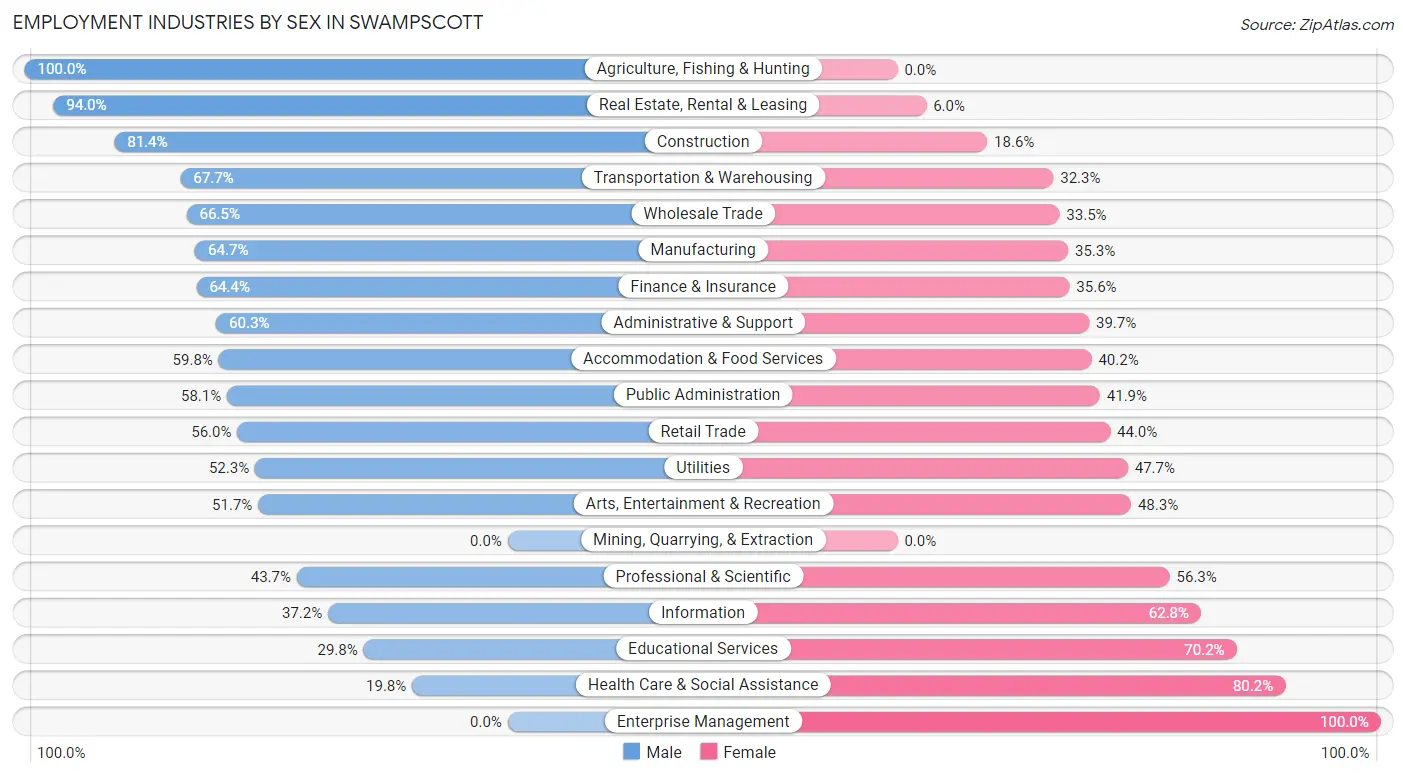
Employment Industries by Sex in Swampscott
The Swampscott industries that see more men than women are Agriculture, Fishing & Hunting (100.0%), Real Estate, Rental & Leasing (94.0%), and Construction (81.4%), whereas the industries that tend to have a higher number of women are Enterprise Management (100.0%), Health Care & Social Assistance (80.2%), and Educational Services (70.2%).
| Industry | Male | Female |
| Agriculture, Fishing & Hunting | 42 (100.0%) | 0 (0.0%) |
| Mining, Quarrying, & Extraction | 0 (0.0%) | 0 (0.0%) |
| Construction | 320 (81.4%) | 73 (18.6%) |
| Manufacturing | 240 (64.7%) | 131 (35.3%) |
| Wholesale Trade | 115 (66.5%) | 58 (33.5%) |
| Retail Trade | 309 (56.0%) | 243 (44.0%) |
| Transportation & Warehousing | 252 (67.7%) | 120 (32.3%) |
| Utilities | 34 (52.3%) | 31 (47.7%) |
| Information | 61 (37.2%) | 103 (62.8%) |
| Finance & Insurance | 389 (64.4%) | 215 (35.6%) |
| Real Estate, Rental & Leasing | 205 (94.0%) | 13 (6.0%) |
| Professional & Scientific | 527 (43.7%) | 680 (56.3%) |
| Enterprise Management | 0 (0.0%) | 48 (100.0%) |
| Administrative & Support | 178 (60.3%) | 117 (39.7%) |
| Educational Services | 305 (29.8%) | 717 (70.2%) |
| Health Care & Social Assistance | 248 (19.8%) | 1,005 (80.2%) |
| Arts, Entertainment & Recreation | 109 (51.7%) | 102 (48.3%) |
| Accommodation & Food Services | 286 (59.8%) | 192 (40.2%) |
| Public Administration | 208 (58.1%) | 150 (41.9%) |
| Total | 3,854 (47.5%) | 4,260 (52.5%) |
Education in Swampscott
School Enrollment in Swampscott
The most common levels of schooling among the 3,214 students in Swampscott are middle school (792 | 24.6%), elementary school (615 | 19.1%), and high school (567 | 17.6%).
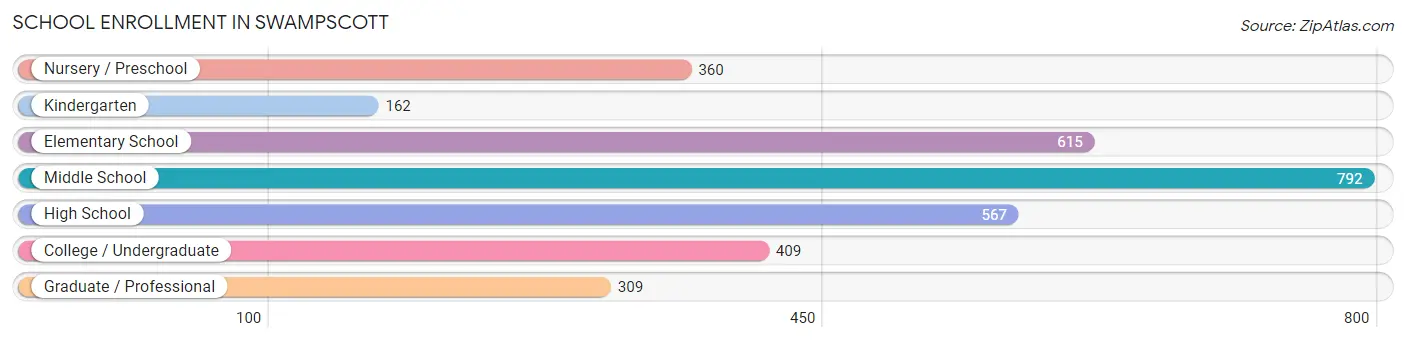
| School Level | # Students | % Students |
| Nursery / Preschool | 360 | 11.2% |
| Kindergarten | 162 | 5.0% |
| Elementary School | 615 | 19.1% |
| Middle School | 792 | 24.6% |
| High School | 567 | 17.6% |
| College / Undergraduate | 409 | 12.7% |
| Graduate / Professional | 309 | 9.6% |
| Total | 3,214 | 100.0% |
School Enrollment by Age by Funding Source in Swampscott
Out of a total of 3,214 students who are enrolled in schools in Swampscott, 816 (25.4%) attend a private institution, while the remaining 2,398 (74.6%) are enrolled in public schools. The age group of 20 to 24 year olds has the highest likelihood of being enrolled in private schools, with 210 (72.2% in the age bracket) enrolled. Conversely, the age group of 5 to 9 year old has the lowest likelihood of being enrolled in a private school, with 656 (89.2% in the age bracket) attending a public institution.
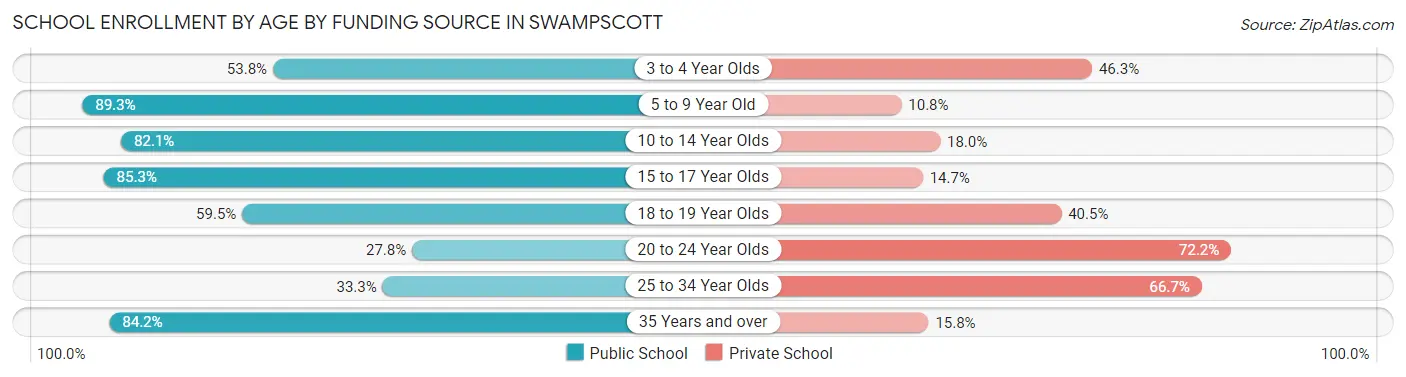
| Age Bracket | Public School | Private School |
| 3 to 4 Year Olds | 172 (53.7%) | 148 (46.3%) |
| 5 to 9 Year Old | 656 (89.2%) | 79 (10.7%) |
| 10 to 14 Year Olds | 791 (82.1%) | 173 (17.9%) |
| 15 to 17 Year Olds | 365 (85.3%) | 63 (14.7%) |
| 18 to 19 Year Olds | 91 (59.5%) | 62 (40.5%) |
| 20 to 24 Year Olds | 81 (27.8%) | 210 (72.2%) |
| 25 to 34 Year Olds | 19 (33.3%) | 38 (66.7%) |
| 35 Years and over | 224 (84.2%) | 42 (15.8%) |
| Total | 2,398 (74.6%) | 816 (25.4%) |
Educational Attainment by Field of Study in Swampscott
Business (1,100 | 14.1%), social sciences (868 | 11.1%), literature & languages (735 | 9.4%), engineering (688 | 8.8%), and education (641 | 8.2%) are the most common fields of study among 7,792 individuals in Swampscott who have obtained a bachelor's degree or higher.
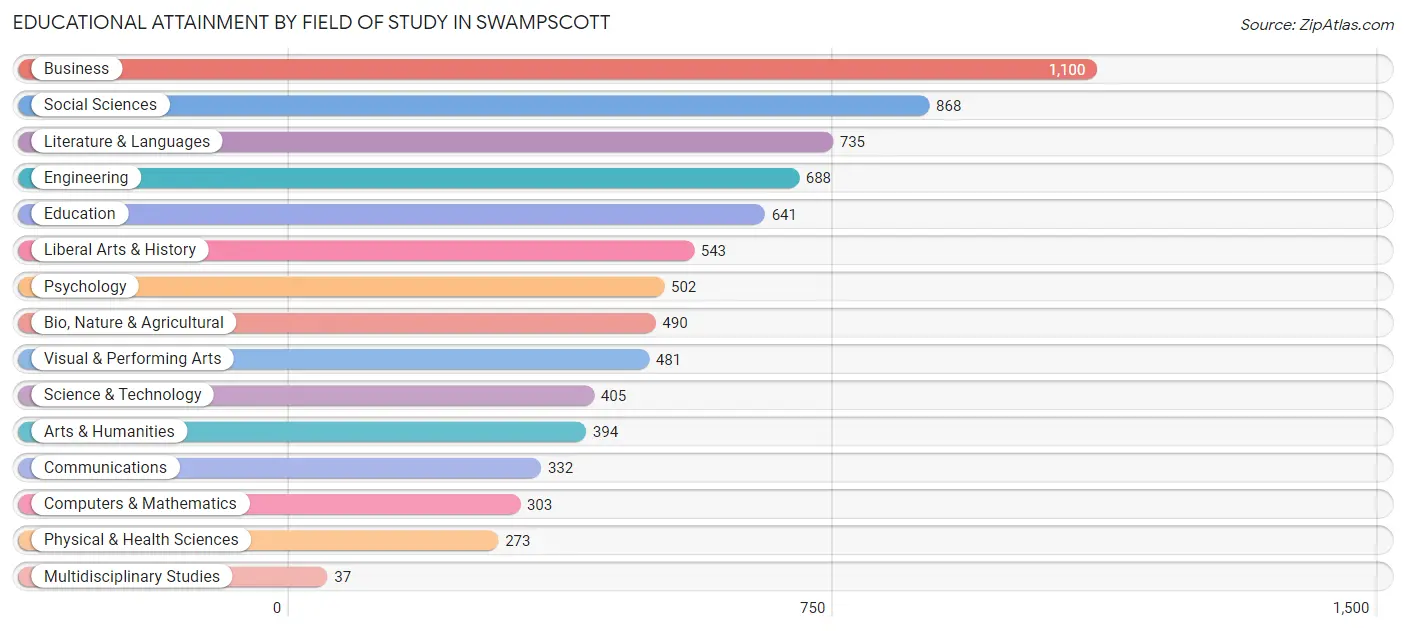
| Field of Study | # Graduates | % Graduates |
| Computers & Mathematics | 303 | 3.9% |
| Bio, Nature & Agricultural | 490 | 6.3% |
| Physical & Health Sciences | 273 | 3.5% |
| Psychology | 502 | 6.4% |
| Social Sciences | 868 | 11.1% |
| Engineering | 688 | 8.8% |
| Multidisciplinary Studies | 37 | 0.5% |
| Science & Technology | 405 | 5.2% |
| Business | 1,100 | 14.1% |
| Education | 641 | 8.2% |
| Literature & Languages | 735 | 9.4% |
| Liberal Arts & History | 543 | 7.0% |
| Visual & Performing Arts | 481 | 6.2% |
| Communications | 332 | 4.3% |
| Arts & Humanities | 394 | 5.1% |
| Total | 7,792 | 100.0% |
Transportation & Commute in Swampscott
Vehicle Availability by Sex in Swampscott
The most prevalent vehicle ownership categories in Swampscott are males with 2 vehicles (2,147, accounting for 55.6%) and females with 2 vehicles (2,059, making up 50.6%).
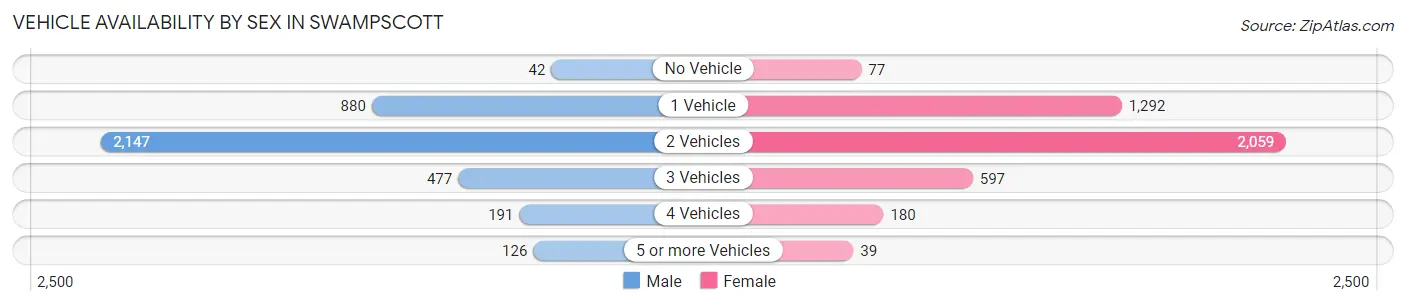
| Vehicles Available | Male | Female |
| No Vehicle | 42 (1.1%) | 77 (1.8%) |
| 1 Vehicle | 880 (22.8%) | 1,292 (30.4%) |
| 2 Vehicles | 2,147 (55.6%) | 2,059 (48.5%) |
| 3 Vehicles | 477 (12.3%) | 597 (14.1%) |
| 4 Vehicles | 191 (4.9%) | 180 (4.2%) |
| 5 or more Vehicles | 126 (3.3%) | 39 (0.9%) |
| Total | 3,863 (100.0%) | 4,244 (100.0%) |
Commute Time in Swampscott
The most frequently occuring commute durations in Swampscott are 60 to 89 minutes (1,527 commuters, 23.7%), 45 to 59 minutes (689 commuters, 10.7%), and 20 to 24 minutes (679 commuters, 10.5%).
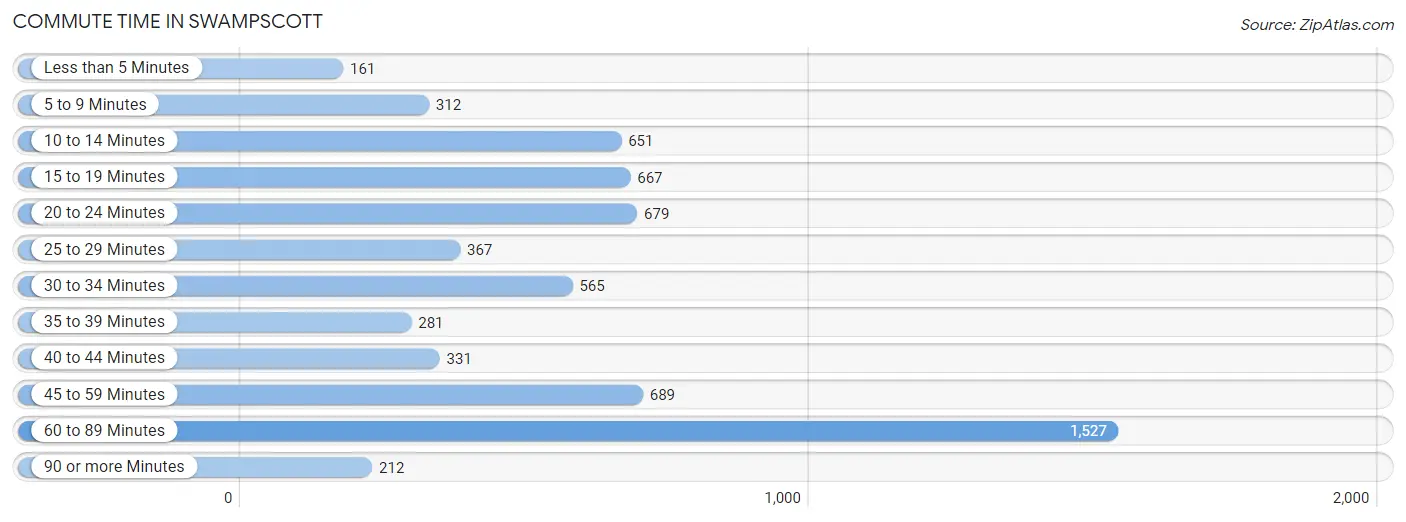
| Commute Time | # Commuters | % Commuters |
| Less than 5 Minutes | 161 | 2.5% |
| 5 to 9 Minutes | 312 | 4.8% |
| 10 to 14 Minutes | 651 | 10.1% |
| 15 to 19 Minutes | 667 | 10.3% |
| 20 to 24 Minutes | 679 | 10.5% |
| 25 to 29 Minutes | 367 | 5.7% |
| 30 to 34 Minutes | 565 | 8.8% |
| 35 to 39 Minutes | 281 | 4.4% |
| 40 to 44 Minutes | 331 | 5.1% |
| 45 to 59 Minutes | 689 | 10.7% |
| 60 to 89 Minutes | 1,527 | 23.7% |
| 90 or more Minutes | 212 | 3.3% |
Commute Time by Sex in Swampscott
The most common commute times in Swampscott are 60 to 89 minutes (885 commuters, 28.5%) for males and 60 to 89 minutes (642 commuters, 19.2%) for females.
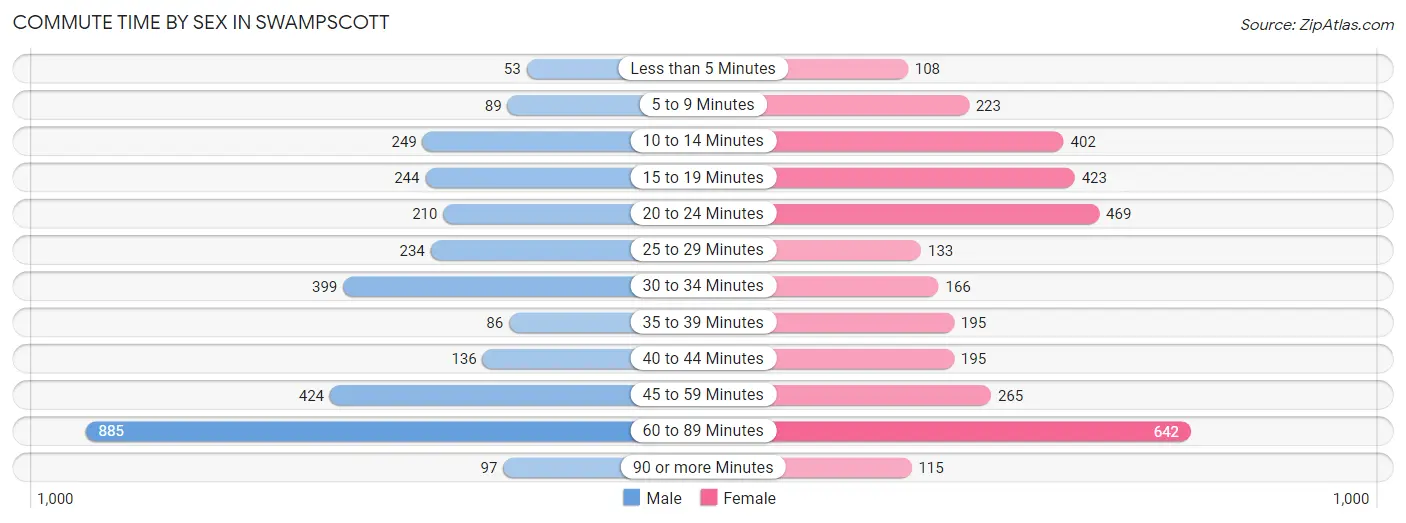
| Commute Time | Male | Female |
| Less than 5 Minutes | 53 (1.7%) | 108 (3.2%) |
| 5 to 9 Minutes | 89 (2.9%) | 223 (6.7%) |
| 10 to 14 Minutes | 249 (8.0%) | 402 (12.0%) |
| 15 to 19 Minutes | 244 (7.9%) | 423 (12.7%) |
| 20 to 24 Minutes | 210 (6.8%) | 469 (14.1%) |
| 25 to 29 Minutes | 234 (7.5%) | 133 (4.0%) |
| 30 to 34 Minutes | 399 (12.9%) | 166 (5.0%) |
| 35 to 39 Minutes | 86 (2.8%) | 195 (5.9%) |
| 40 to 44 Minutes | 136 (4.4%) | 195 (5.9%) |
| 45 to 59 Minutes | 424 (13.7%) | 265 (7.9%) |
| 60 to 89 Minutes | 885 (28.5%) | 642 (19.2%) |
| 90 or more Minutes | 97 (3.1%) | 115 (3.5%) |
Time of Departure to Work by Sex in Swampscott
The most frequent times of departure to work in Swampscott are 7:30 AM to 7:59 AM (437, 14.1%) for males and 8:00 AM to 8:29 AM (647, 19.4%) for females.
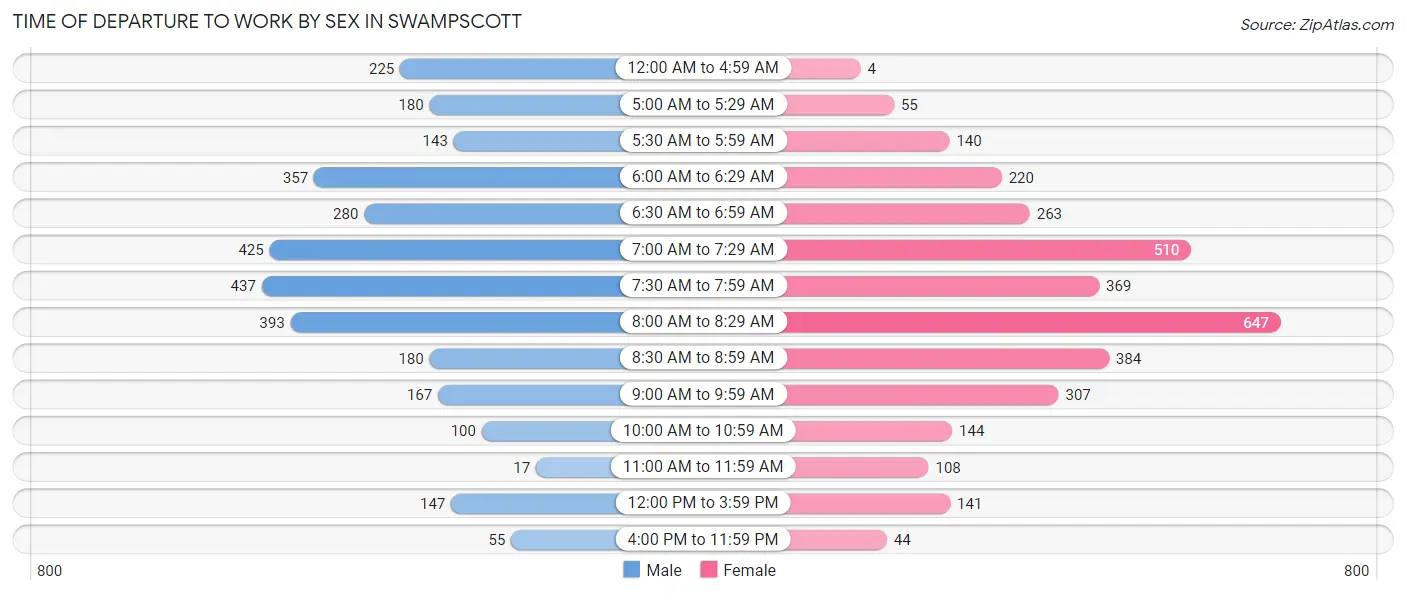
| Time of Departure | Male | Female |
| 12:00 AM to 4:59 AM | 225 (7.2%) | 4 (0.1%) |
| 5:00 AM to 5:29 AM | 180 (5.8%) | 55 (1.7%) |
| 5:30 AM to 5:59 AM | 143 (4.6%) | 140 (4.2%) |
| 6:00 AM to 6:29 AM | 357 (11.5%) | 220 (6.6%) |
| 6:30 AM to 6:59 AM | 280 (9.0%) | 263 (7.9%) |
| 7:00 AM to 7:29 AM | 425 (13.7%) | 510 (15.3%) |
| 7:30 AM to 7:59 AM | 437 (14.1%) | 369 (11.1%) |
| 8:00 AM to 8:29 AM | 393 (12.7%) | 647 (19.4%) |
| 8:30 AM to 8:59 AM | 180 (5.8%) | 384 (11.5%) |
| 9:00 AM to 9:59 AM | 167 (5.4%) | 307 (9.2%) |
| 10:00 AM to 10:59 AM | 100 (3.2%) | 144 (4.3%) |
| 11:00 AM to 11:59 AM | 17 (0.5%) | 108 (3.2%) |
| 12:00 PM to 3:59 PM | 147 (4.7%) | 141 (4.2%) |
| 4:00 PM to 11:59 PM | 55 (1.8%) | 44 (1.3%) |
| Total | 3,106 (100.0%) | 3,336 (100.0%) |
Housing Occupancy in Swampscott
Occupancy by Ownership in Swampscott
Of the total 6,278 dwellings in Swampscott, owner-occupied units account for 4,591 (73.1%), while renter-occupied units make up 1,687 (26.9%).
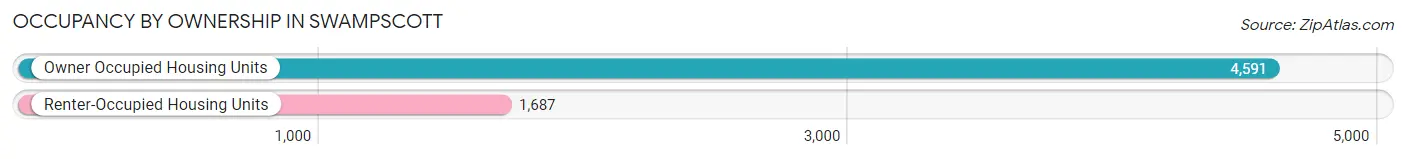
| Occupancy | # Housing Units | % Housing Units |
| Owner Occupied Housing Units | 4,591 | 73.1% |
| Renter-Occupied Housing Units | 1,687 | 26.9% |
| Total Occupied Housing Units | 6,278 | 100.0% |
Occupancy by Household Size in Swampscott
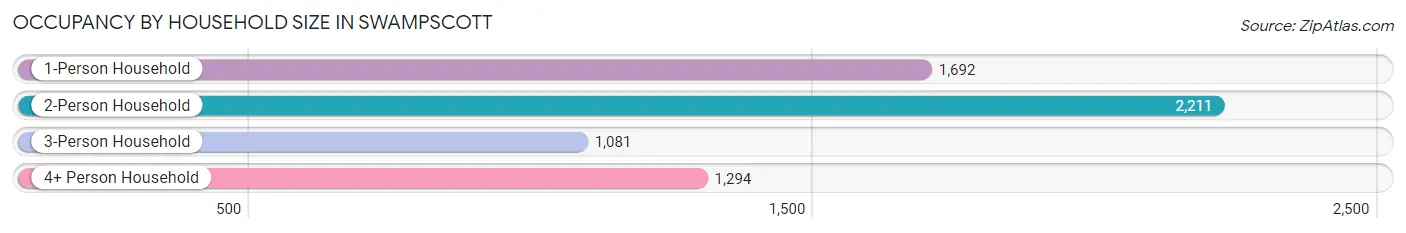
| Household Size | # Housing Units | % Housing Units |
| 1-Person Household | 1,692 | 27.0% |
| 2-Person Household | 2,211 | 35.2% |
| 3-Person Household | 1,081 | 17.2% |
| 4+ Person Household | 1,294 | 20.6% |
| Total Housing Units | 6,278 | 100.0% |
Occupancy by Ownership by Household Size in Swampscott
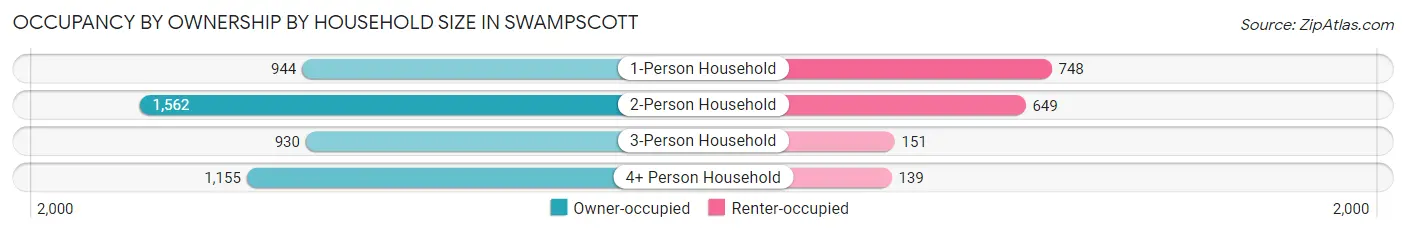
| Household Size | Owner-occupied | Renter-occupied |
| 1-Person Household | 944 (55.8%) | 748 (44.2%) |
| 2-Person Household | 1,562 (70.7%) | 649 (29.3%) |
| 3-Person Household | 930 (86.0%) | 151 (14.0%) |
| 4+ Person Household | 1,155 (89.3%) | 139 (10.7%) |
| Total Housing Units | 4,591 (73.1%) | 1,687 (26.9%) |
Occupancy by Educational Attainment in Swampscott
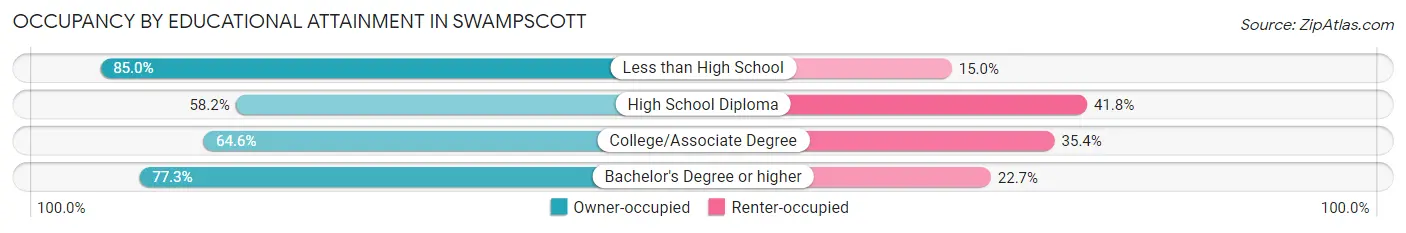
| Household Size | Owner-occupied | Renter-occupied |
| Less than High School | 102 (85.0%) | 18 (15.0%) |
| High School Diploma | 348 (58.2%) | 250 (41.8%) |
| College/Associate Degree | 791 (64.6%) | 433 (35.4%) |
| Bachelor's Degree or higher | 3,350 (77.3%) | 986 (22.7%) |
Occupancy by Age of Householder in Swampscott
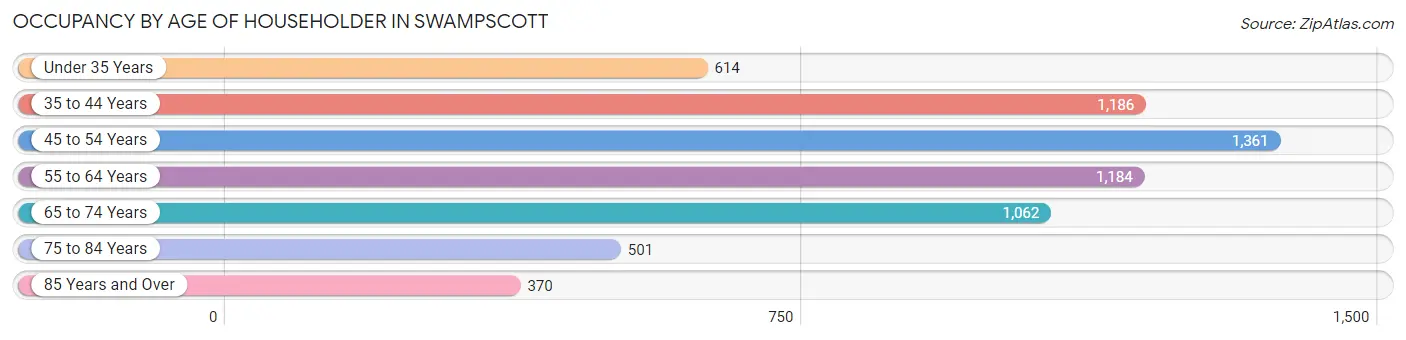
| Age Bracket | # Households | % Households |
| Under 35 Years | 614 | 9.8% |
| 35 to 44 Years | 1,186 | 18.9% |
| 45 to 54 Years | 1,361 | 21.7% |
| 55 to 64 Years | 1,184 | 18.9% |
| 65 to 74 Years | 1,062 | 16.9% |
| 75 to 84 Years | 501 | 8.0% |
| 85 Years and Over | 370 | 5.9% |
| Total | 6,278 | 100.0% |
Housing Finances in Swampscott
Median Income by Occupancy in Swampscott
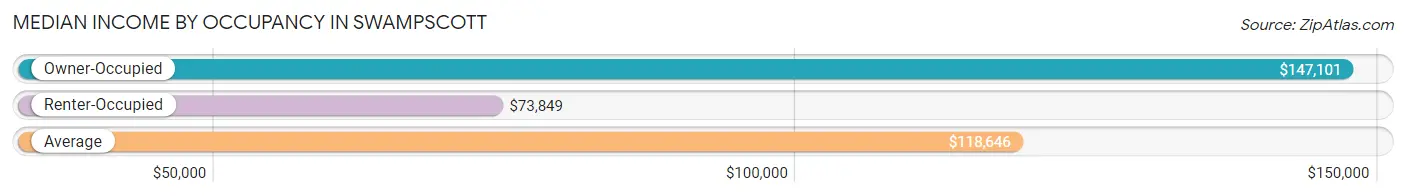
| Occupancy Type | # Households | Median Income |
| Owner-Occupied | 4,591 (73.1%) | $147,101 |
| Renter-Occupied | 1,687 (26.9%) | $73,849 |
| Average | 6,278 (100.0%) | $118,646 |
Occupancy by Householder Income Bracket in Swampscott
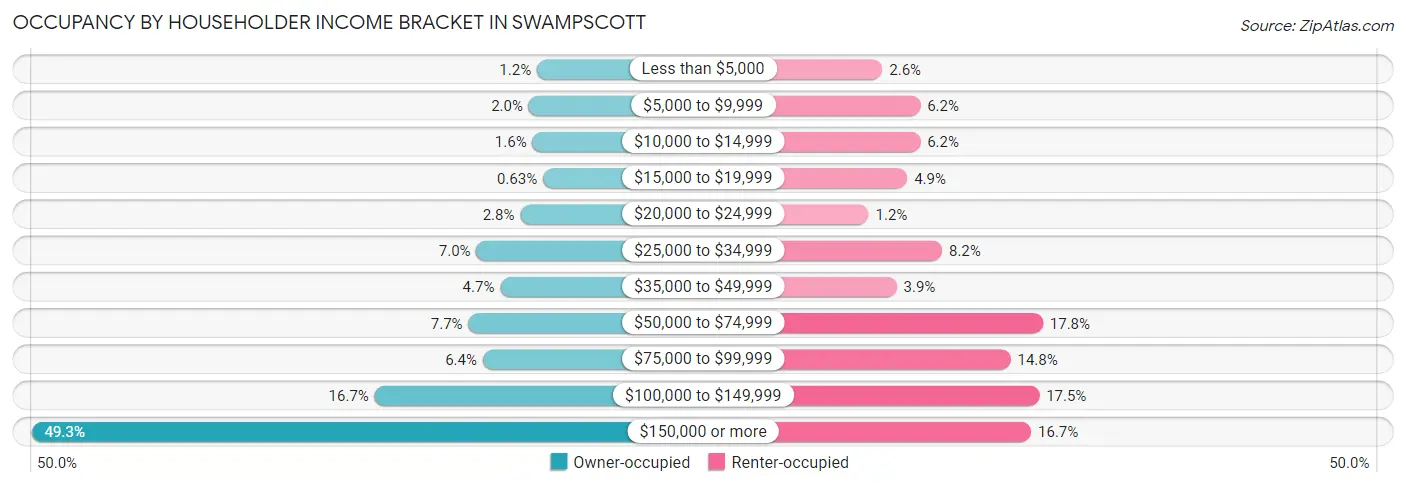
| Income Bracket | Owner-occupied | Renter-occupied |
| Less than $5,000 | 55 (1.2%) | 43 (2.5%) |
| $5,000 to $9,999 | 91 (2.0%) | 104 (6.2%) |
| $10,000 to $14,999 | 75 (1.6%) | 104 (6.2%) |
| $15,000 to $19,999 | 29 (0.6%) | 83 (4.9%) |
| $20,000 to $24,999 | 128 (2.8%) | 21 (1.2%) |
| $25,000 to $34,999 | 320 (7.0%) | 139 (8.2%) |
| $35,000 to $49,999 | 216 (4.7%) | 66 (3.9%) |
| $50,000 to $74,999 | 355 (7.7%) | 301 (17.8%) |
| $75,000 to $99,999 | 292 (6.4%) | 249 (14.8%) |
| $100,000 to $149,999 | 765 (16.7%) | 295 (17.5%) |
| $150,000 or more | 2,265 (49.3%) | 282 (16.7%) |
| Total | 4,591 (100.0%) | 1,687 (100.0%) |
Monthly Housing Cost Tiers in Swampscott
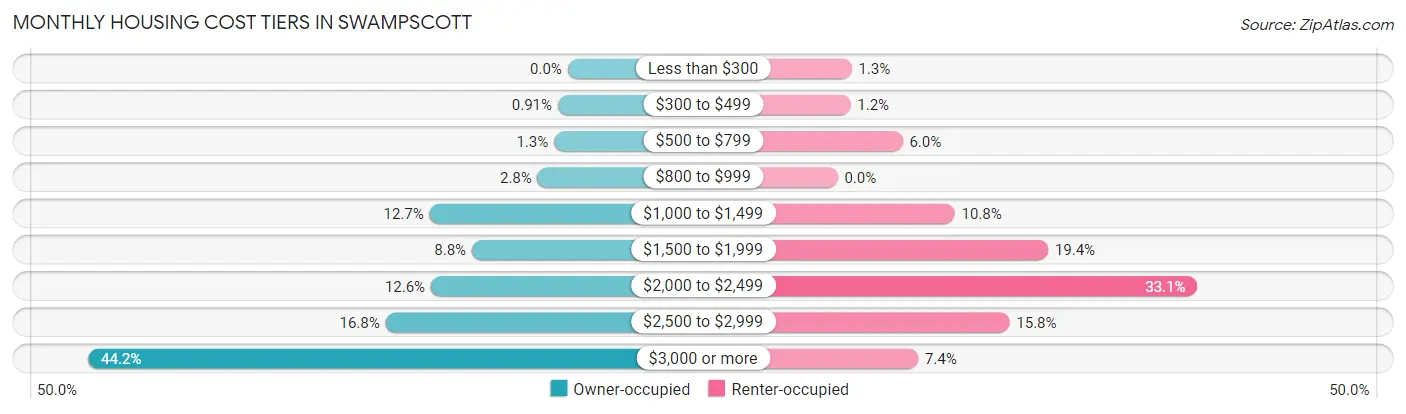
| Monthly Cost | Owner-occupied | Renter-occupied |
| Less than $300 | 0 (0.0%) | 22 (1.3%) |
| $300 to $499 | 42 (0.9%) | 20 (1.2%) |
| $500 to $799 | 58 (1.3%) | 101 (6.0%) |
| $800 to $999 | 127 (2.8%) | 0 (0.0%) |
| $1,000 to $1,499 | 584 (12.7%) | 182 (10.8%) |
| $1,500 to $1,999 | 405 (8.8%) | 327 (19.4%) |
| $2,000 to $2,499 | 578 (12.6%) | 559 (33.1%) |
| $2,500 to $2,999 | 770 (16.8%) | 267 (15.8%) |
| $3,000 or more | 2,027 (44.2%) | 125 (7.4%) |
| Total | 4,591 (100.0%) | 1,687 (100.0%) |
Physical Housing Characteristics in Swampscott
Housing Structures in Swampscott
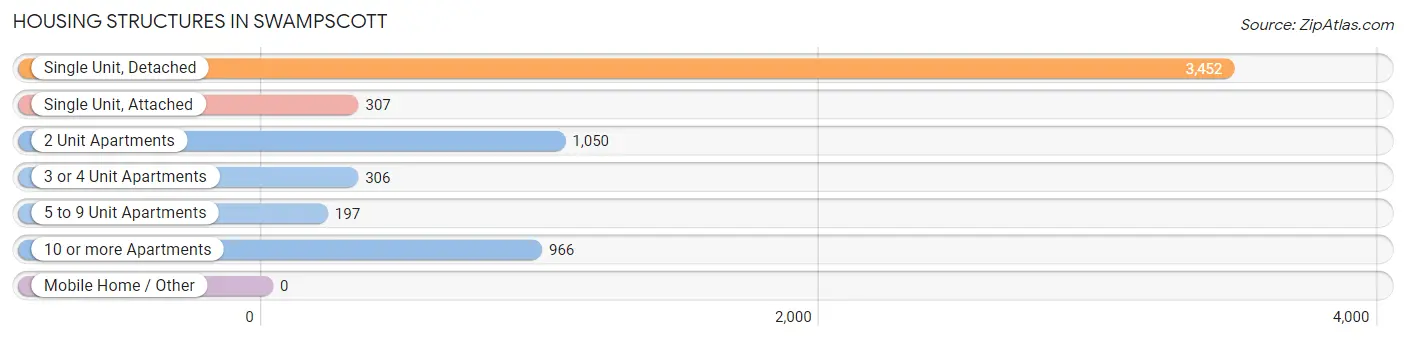
| Structure Type | # Housing Units | % Housing Units |
| Single Unit, Detached | 3,452 | 55.0% |
| Single Unit, Attached | 307 | 4.9% |
| 2 Unit Apartments | 1,050 | 16.7% |
| 3 or 4 Unit Apartments | 306 | 4.9% |
| 5 to 9 Unit Apartments | 197 | 3.1% |
| 10 or more Apartments | 966 | 15.4% |
| Mobile Home / Other | 0 | 0.0% |
| Total | 6,278 | 100.0% |
Housing Structures by Occupancy in Swampscott
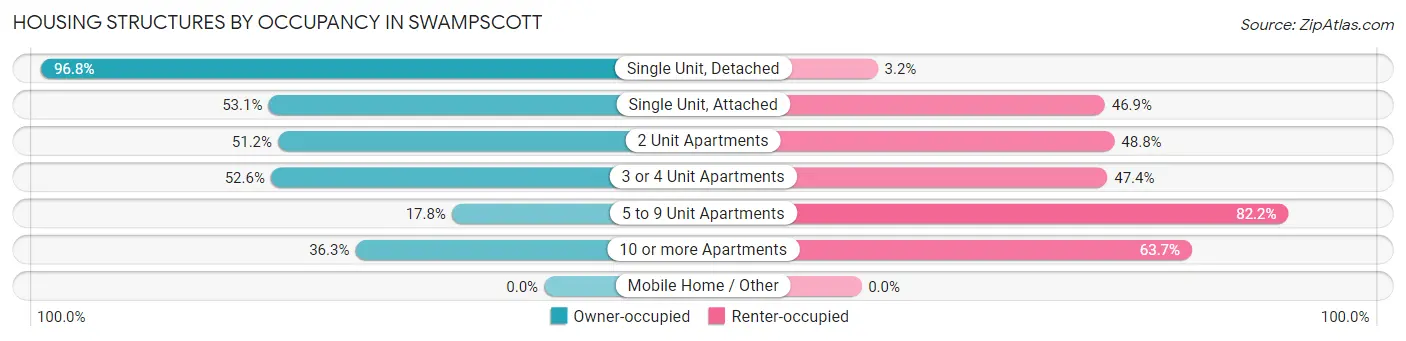
| Structure Type | Owner-occupied | Renter-occupied |
| Single Unit, Detached | 3,343 (96.8%) | 109 (3.2%) |
| Single Unit, Attached | 163 (53.1%) | 144 (46.9%) |
| 2 Unit Apartments | 538 (51.2%) | 512 (48.8%) |
| 3 or 4 Unit Apartments | 161 (52.6%) | 145 (47.4%) |
| 5 to 9 Unit Apartments | 35 (17.8%) | 162 (82.2%) |
| 10 or more Apartments | 351 (36.3%) | 615 (63.7%) |
| Mobile Home / Other | 0 (0.0%) | 0 (0.0%) |
| Total | 4,591 (73.1%) | 1,687 (26.9%) |
Housing Structures by Number of Rooms in Swampscott
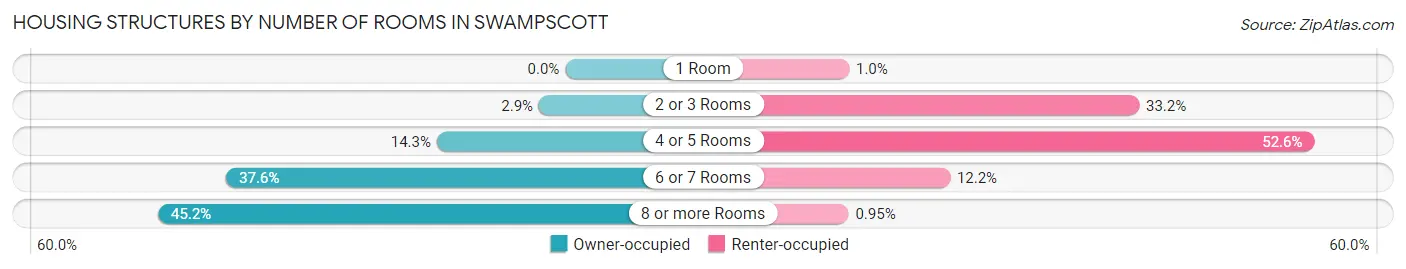
| Number of Rooms | Owner-occupied | Renter-occupied |
| 1 Room | 0 (0.0%) | 17 (1.0%) |
| 2 or 3 Rooms | 134 (2.9%) | 560 (33.2%) |
| 4 or 5 Rooms | 654 (14.2%) | 888 (52.6%) |
| 6 or 7 Rooms | 1,728 (37.6%) | 206 (12.2%) |
| 8 or more Rooms | 2,075 (45.2%) | 16 (0.9%) |
| Total | 4,591 (100.0%) | 1,687 (100.0%) |
Housing Structure by Heating Type in Swampscott
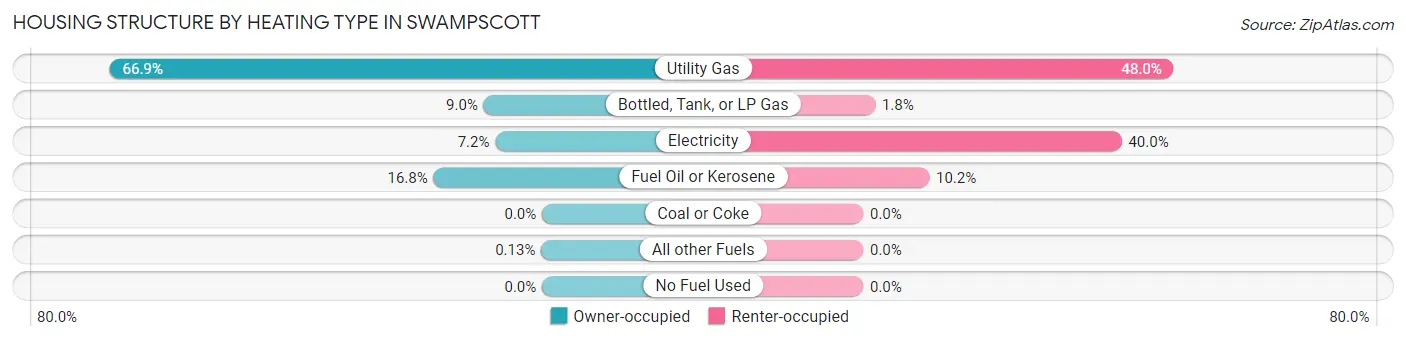
| Heating Type | Owner-occupied | Renter-occupied |
| Utility Gas | 3,069 (66.8%) | 810 (48.0%) |
| Bottled, Tank, or LP Gas | 414 (9.0%) | 31 (1.8%) |
| Electricity | 332 (7.2%) | 674 (40.0%) |
| Fuel Oil or Kerosene | 770 (16.8%) | 172 (10.2%) |
| Coal or Coke | 0 (0.0%) | 0 (0.0%) |
| All other Fuels | 6 (0.1%) | 0 (0.0%) |
| No Fuel Used | 0 (0.0%) | 0 (0.0%) |
| Total | 4,591 (100.0%) | 1,687 (100.0%) |
Household Vehicle Usage in Swampscott
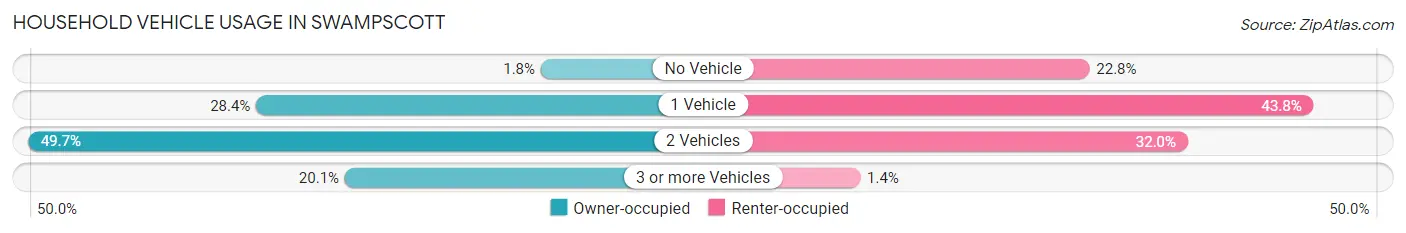
| Vehicles per Household | Owner-occupied | Renter-occupied |
| No Vehicle | 83 (1.8%) | 385 (22.8%) |
| 1 Vehicle | 1,303 (28.4%) | 738 (43.8%) |
| 2 Vehicles | 2,282 (49.7%) | 540 (32.0%) |
| 3 or more Vehicles | 923 (20.1%) | 24 (1.4%) |
| Total | 4,591 (100.0%) | 1,687 (100.0%) |
Real Estate & Mortgages in Swampscott
Real Estate and Mortgage Overview in Swampscott
| Characteristic | Without Mortgage | With Mortgage |
| Housing Units | 1,038 | 3,553 |
| Median Property Value | $616,700 | $653,200 |
| Median Household Income | $95,238 | $1,905 |
| Monthly Housing Costs | $1,249 | $2,011 |
| Real Estate Taxes | $7,607 | $0 |
Property Value by Mortgage Status in Swampscott
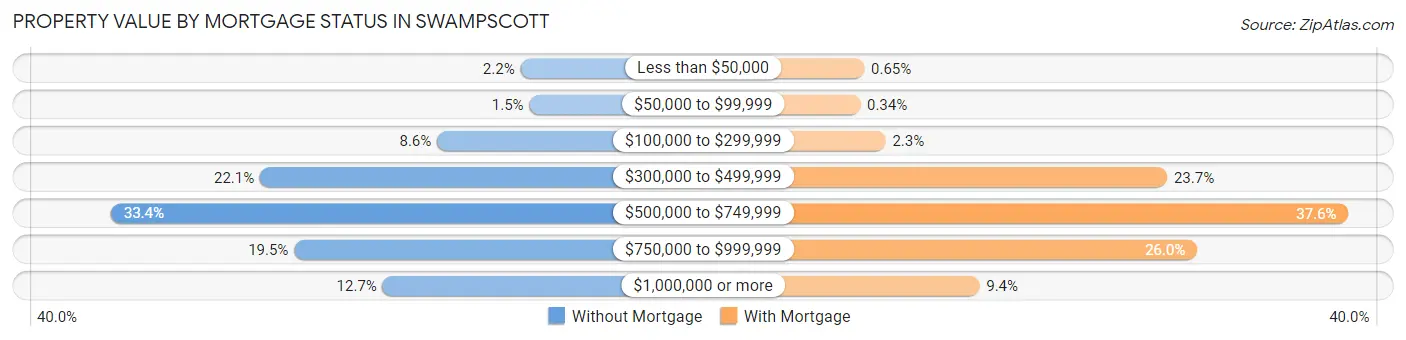
| Property Value | Without Mortgage | With Mortgage |
| Less than $50,000 | 23 (2.2%) | 23 (0.6%) |
| $50,000 to $99,999 | 16 (1.5%) | 12 (0.3%) |
| $100,000 to $299,999 | 89 (8.6%) | 81 (2.3%) |
| $300,000 to $499,999 | 229 (22.1%) | 843 (23.7%) |
| $500,000 to $749,999 | 347 (33.4%) | 1,334 (37.6%) |
| $750,000 to $999,999 | 202 (19.5%) | 925 (26.0%) |
| $1,000,000 or more | 132 (12.7%) | 335 (9.4%) |
| Total | 1,038 (100.0%) | 3,553 (100.0%) |
Household Income by Mortgage Status in Swampscott
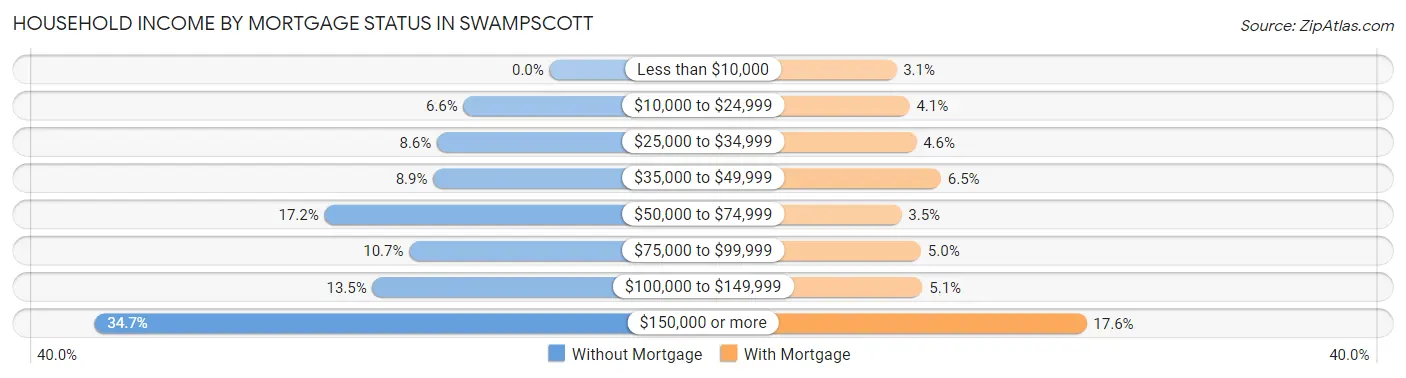
| Household Income | Without Mortgage | With Mortgage |
| Less than $10,000 | 0 (0.0%) | 110 (3.1%) |
| $10,000 to $24,999 | 68 (6.6%) | 146 (4.1%) |
| $25,000 to $34,999 | 89 (8.6%) | 164 (4.6%) |
| $35,000 to $49,999 | 92 (8.9%) | 231 (6.5%) |
| $50,000 to $74,999 | 178 (17.2%) | 124 (3.5%) |
| $75,000 to $99,999 | 111 (10.7%) | 177 (5.0%) |
| $100,000 to $149,999 | 140 (13.5%) | 181 (5.1%) |
| $150,000 or more | 360 (34.7%) | 625 (17.6%) |
| Total | 1,038 (100.0%) | 3,553 (100.0%) |
Property Value to Household Income Ratio in Swampscott
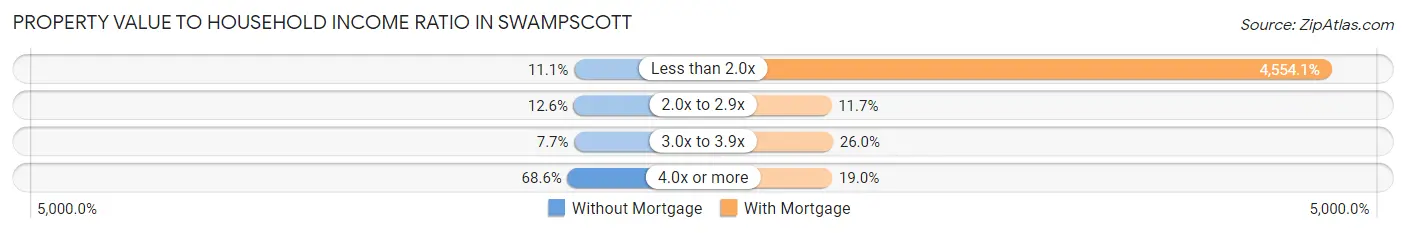
| Value-to-Income Ratio | Without Mortgage | With Mortgage |
| Less than 2.0x | 115 (11.1%) | 161,806 (4,554.1%) |
| 2.0x to 2.9x | 131 (12.6%) | 417 (11.7%) |
| 3.0x to 3.9x | 80 (7.7%) | 924 (26.0%) |
| 4.0x or more | 712 (68.6%) | 674 (19.0%) |
| Total | 1,038 (100.0%) | 3,553 (100.0%) |
Real Estate Taxes by Mortgage Status in Swampscott
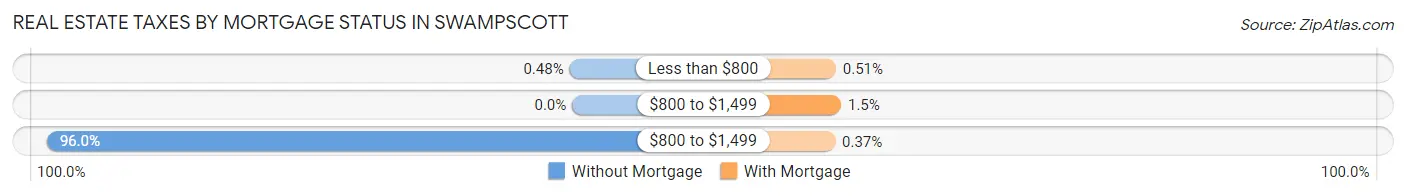
| Property Taxes | Without Mortgage | With Mortgage |
| Less than $800 | 5 (0.5%) | 18 (0.5%) |
| $800 to $1,499 | 0 (0.0%) | 52 (1.5%) |
| $800 to $1,499 | 996 (96.0%) | 13 (0.4%) |
| Total | 1,038 (100.0%) | 3,553 (100.0%) |
Health & Disability in Swampscott
Health Insurance Coverage by Age in Swampscott
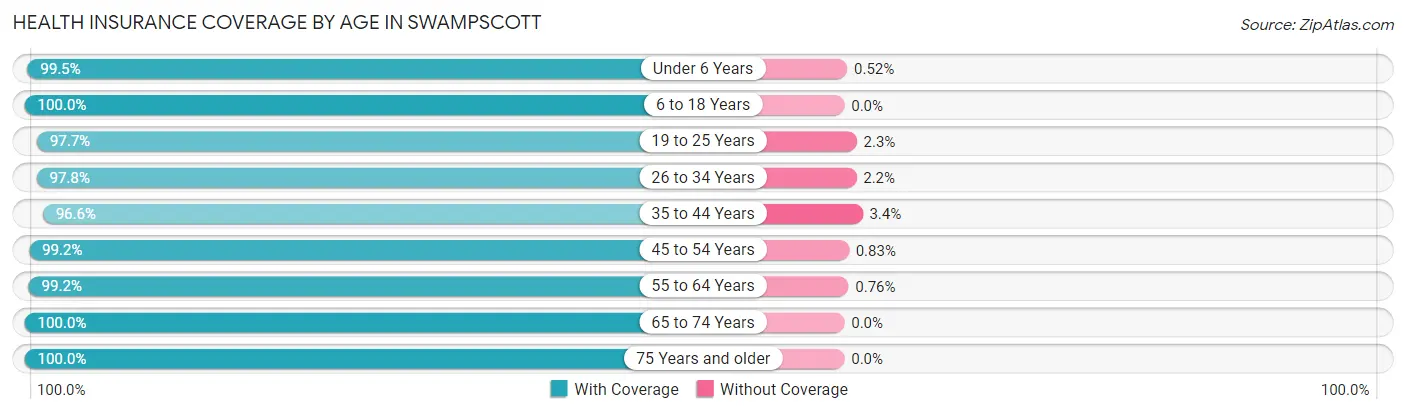
| Age Bracket | With Coverage | Without Coverage |
| Under 6 Years | 964 (99.5%) | 5 (0.5%) |
| 6 to 18 Years | 2,160 (100.0%) | 0 (0.0%) |
| 19 to 25 Years | 1,021 (97.7%) | 24 (2.3%) |
| 26 to 34 Years | 1,229 (97.8%) | 28 (2.2%) |
| 35 to 44 Years | 1,999 (96.6%) | 70 (3.4%) |
| 45 to 54 Years | 2,522 (99.2%) | 21 (0.8%) |
| 55 to 64 Years | 2,077 (99.2%) | 16 (0.8%) |
| 65 to 74 Years | 1,740 (100.0%) | 0 (0.0%) |
| 75 Years and older | 1,128 (100.0%) | 0 (0.0%) |
| Total | 14,840 (98.9%) | 164 (1.1%) |
Health Insurance Coverage by Citizenship Status in Swampscott
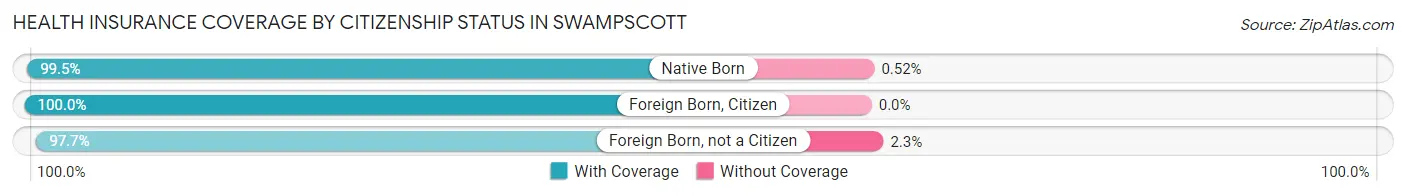
| Citizenship Status | With Coverage | Without Coverage |
| Native Born | 964 (99.5%) | 5 (0.5%) |
| Foreign Born, Citizen | 2,160 (100.0%) | 0 (0.0%) |
| Foreign Born, not a Citizen | 1,021 (97.7%) | 24 (2.3%) |
Health Insurance Coverage by Household Income in Swampscott
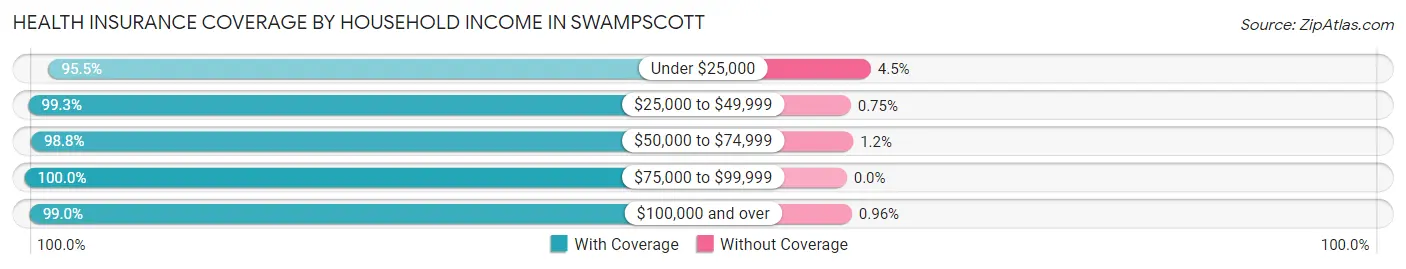
| Household Income | With Coverage | Without Coverage |
| Under $25,000 | 847 (95.5%) | 40 (4.5%) |
| $25,000 to $49,999 | 1,456 (99.3%) | 11 (0.7%) |
| $50,000 to $74,999 | 1,147 (98.8%) | 14 (1.2%) |
| $75,000 to $99,999 | 1,138 (100.0%) | 0 (0.0%) |
| $100,000 and over | 10,233 (99.0%) | 99 (1.0%) |
Public vs Private Health Insurance Coverage by Age in Swampscott
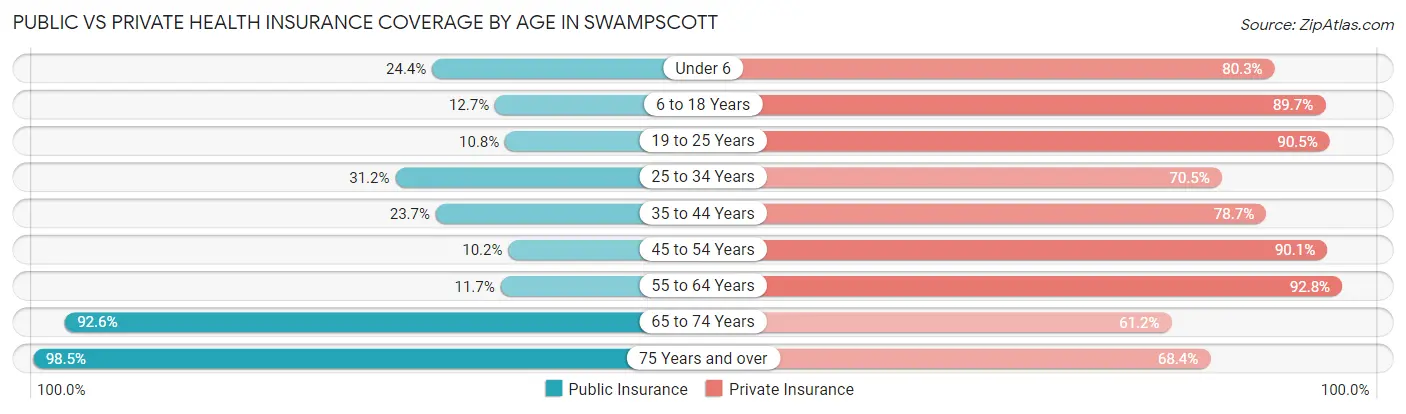
| Age Bracket | Public Insurance | Private Insurance |
| Under 6 | 236 (24.4%) | 778 (80.3%) |
| 6 to 18 Years | 274 (12.7%) | 1,937 (89.7%) |
| 19 to 25 Years | 113 (10.8%) | 946 (90.5%) |
| 25 to 34 Years | 392 (31.2%) | 886 (70.5%) |
| 35 to 44 Years | 490 (23.7%) | 1,629 (78.7%) |
| 45 to 54 Years | 260 (10.2%) | 2,290 (90.0%) |
| 55 to 64 Years | 244 (11.7%) | 1,943 (92.8%) |
| 65 to 74 Years | 1,612 (92.6%) | 1,064 (61.2%) |
| 75 Years and over | 1,111 (98.5%) | 771 (68.3%) |
| Total | 4,732 (31.5%) | 12,244 (81.6%) |
Disability Status by Sex by Age in Swampscott
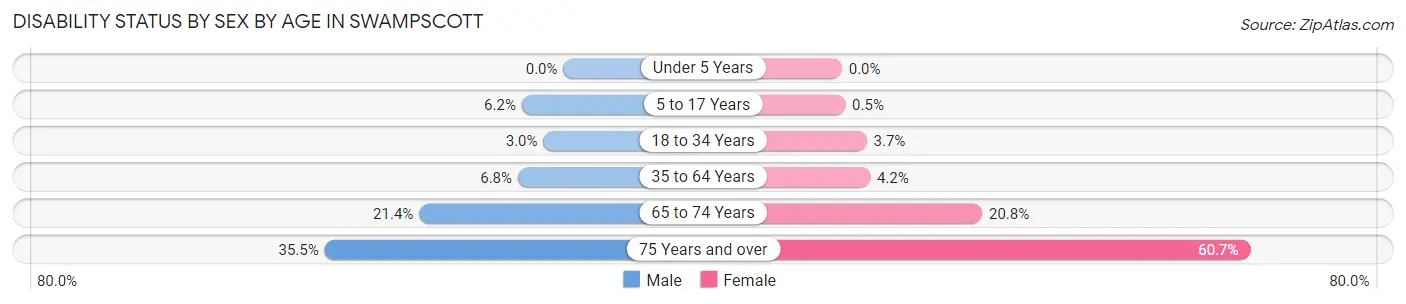
| Age Bracket | Male | Female |
| Under 5 Years | 0 (0.0%) | 0 (0.0%) |
| 5 to 17 Years | 73 (6.2%) | 5 (0.5%) |
| 18 to 34 Years | 30 (3.0%) | 52 (3.7%) |
| 35 to 64 Years | 224 (6.8%) | 142 (4.2%) |
| 65 to 74 Years | 167 (21.4%) | 200 (20.8%) |
| 75 Years and over | 172 (35.5%) | 390 (60.7%) |
Disability Class by Sex by Age in Swampscott
Disability Class: Hearing Difficulty
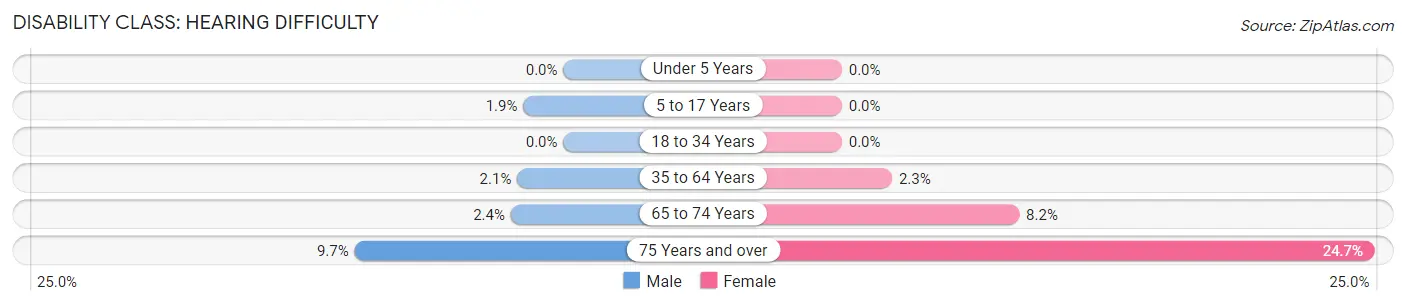
| Age Bracket | Male | Female |
| Under 5 Years | 0 (0.0%) | 0 (0.0%) |
| 5 to 17 Years | 22 (1.9%) | 0 (0.0%) |
| 18 to 34 Years | 0 (0.0%) | 0 (0.0%) |
| 35 to 64 Years | 71 (2.1%) | 79 (2.3%) |
| 65 to 74 Years | 19 (2.4%) | 79 (8.2%) |
| 75 Years and over | 47 (9.7%) | 159 (24.7%) |
Disability Class: Vision Difficulty
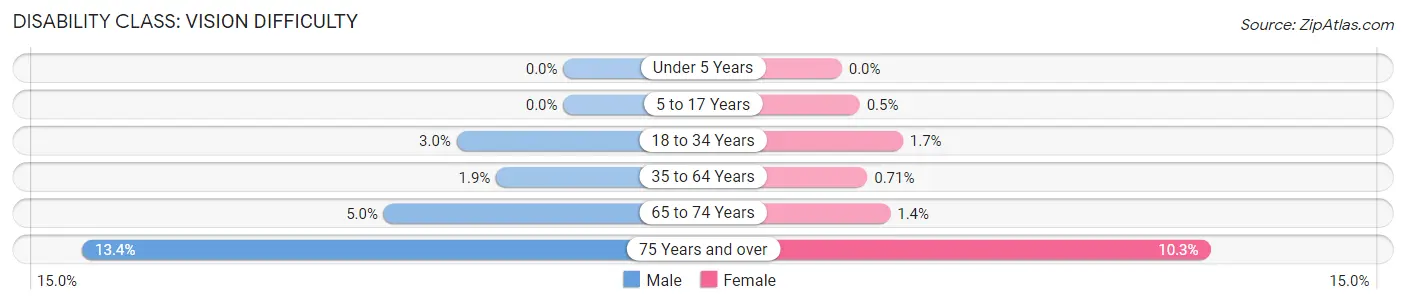
| Age Bracket | Male | Female |
| Under 5 Years | 0 (0.0%) | 0 (0.0%) |
| 5 to 17 Years | 0 (0.0%) | 5 (0.5%) |
| 18 to 34 Years | 30 (3.0%) | 24 (1.7%) |
| 35 to 64 Years | 62 (1.9%) | 24 (0.7%) |
| 65 to 74 Years | 39 (5.0%) | 13 (1.3%) |
| 75 Years and over | 65 (13.4%) | 66 (10.3%) |
Disability Class: Cognitive Difficulty
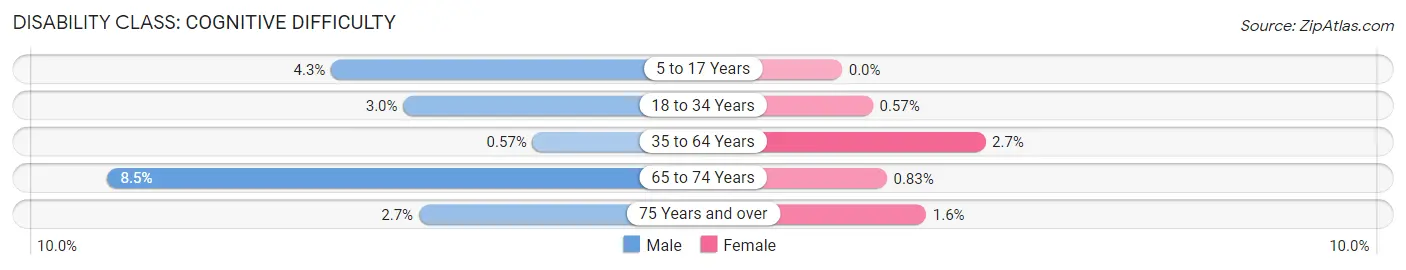
| Age Bracket | Male | Female |
| 5 to 17 Years | 51 (4.3%) | 0 (0.0%) |
| 18 to 34 Years | 30 (3.0%) | 8 (0.6%) |
| 35 to 64 Years | 19 (0.6%) | 90 (2.7%) |
| 65 to 74 Years | 66 (8.5%) | 8 (0.8%) |
| 75 Years and over | 13 (2.7%) | 10 (1.6%) |
Disability Class: Ambulatory Difficulty
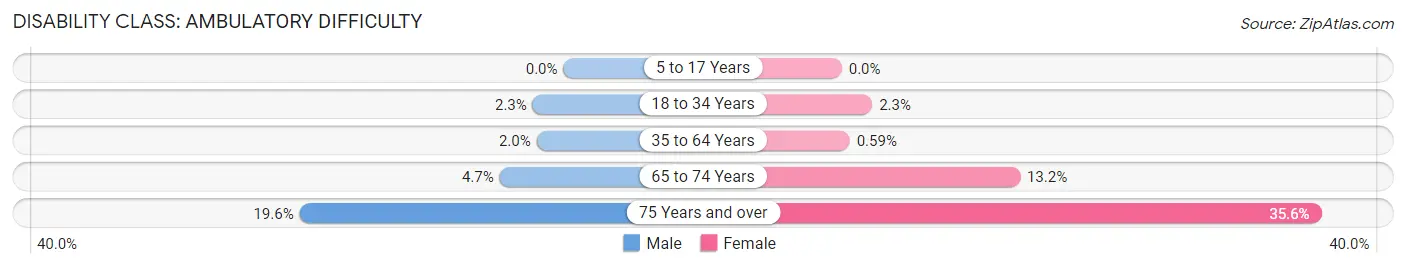
| Age Bracket | Male | Female |
| 5 to 17 Years | 0 (0.0%) | 0 (0.0%) |
| 18 to 34 Years | 23 (2.3%) | 32 (2.3%) |
| 35 to 64 Years | 66 (2.0%) | 20 (0.6%) |
| 65 to 74 Years | 37 (4.7%) | 127 (13.2%) |
| 75 Years and over | 95 (19.6%) | 229 (35.6%) |
Disability Class: Self-Care Difficulty
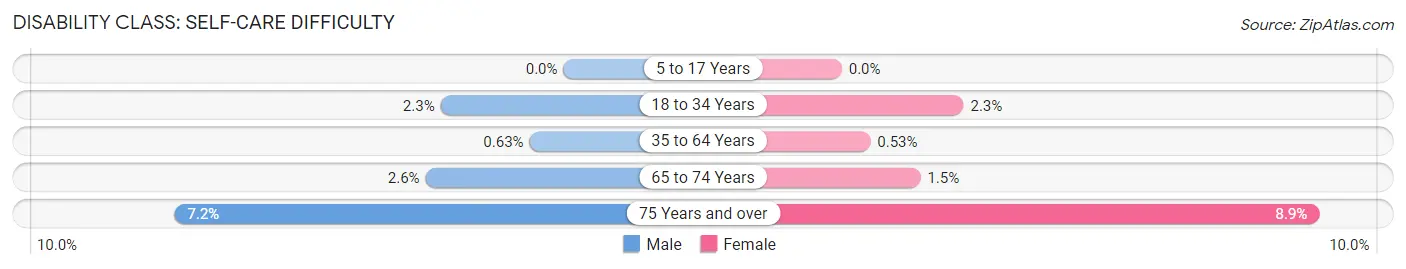
| Age Bracket | Male | Female |
| 5 to 17 Years | 0 (0.0%) | 0 (0.0%) |
| 18 to 34 Years | 23 (2.3%) | 32 (2.3%) |
| 35 to 64 Years | 21 (0.6%) | 18 (0.5%) |
| 65 to 74 Years | 20 (2.6%) | 14 (1.5%) |
| 75 Years and over | 35 (7.2%) | 57 (8.9%) |
Technology Access in Swampscott
Computing Device Access in Swampscott
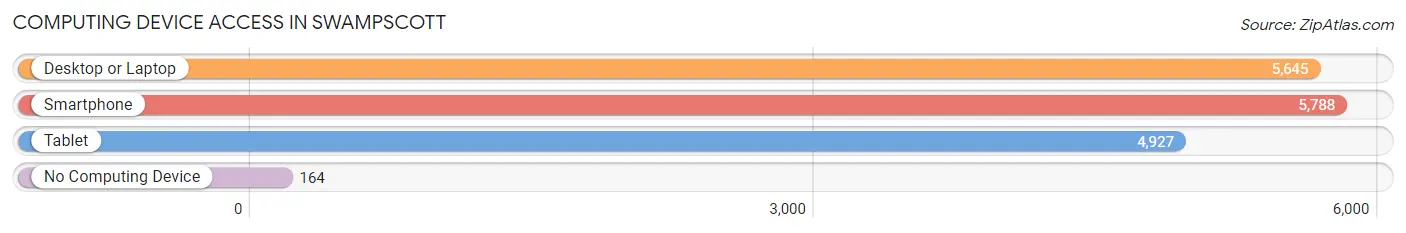
| Device Type | # Households | % Households |
| Desktop or Laptop | 5,645 | 89.9% |
| Smartphone | 5,788 | 92.2% |
| Tablet | 4,927 | 78.5% |
| No Computing Device | 164 | 2.6% |
| Total | 6,278 | 100.0% |
Internet Access in Swampscott
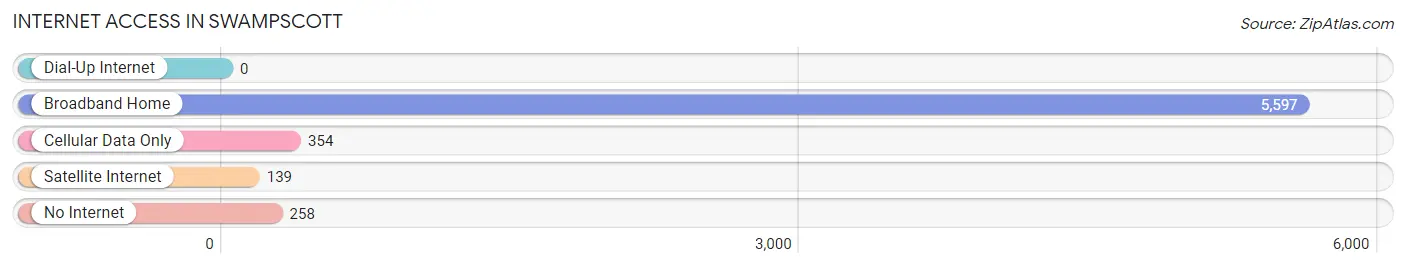
| Internet Type | # Households | % Households |
| Dial-Up Internet | 0 | 0.0% |
| Broadband Home | 5,597 | 89.1% |
| Cellular Data Only | 354 | 5.6% |
| Satellite Internet | 139 | 2.2% |
| No Internet | 258 | 4.1% |
| Total | 6,278 | 100.0% |
Swampscott Summary
Swampscott, Massachusetts is a small coastal town located in Essex County, just north of the city of Lynn. It is bordered by Marblehead to the east, Salem to the south, and Lynn to the west. The town has a population of 13,787 as of the 2010 census, and is known for its beautiful beaches, historic homes, and vibrant downtown.
History
Swampscott was first settled in 1629 by a group of English settlers led by William Pynchon. The town was originally part of Lynn, but was incorporated as its own town in 1852. The town was named after the local Native American tribe, the Massachusett, who called the area “swampscot”, meaning “cold brook”.
In the 19th century, Swampscott was a popular summer resort for wealthy Bostonians, who built grand summer homes along the coast. The town was also home to a number of prominent figures, including poet Henry Wadsworth Longfellow, who wrote his famous poem “The Wreck of the Hesperus” while living in Swampscott.
Geography
Swampscott is located on the Atlantic Ocean, and is bordered by Marblehead to the east, Salem to the south, and Lynn to the west. The town is divided into two parts by the Saugus River, which runs through the center of town. The northern part of town is known as “The Neck”, and is home to the town’s beaches and historic homes. The southern part of town is more residential, and is home to the town’s schools, businesses, and municipal buildings.
The town is home to several beaches, including Phillips Beach, King’s Beach, and Fisherman’s Beach. The town also has several parks, including the Swampscott Town Common, which is home to a number of historic buildings, and the Swampscott Rail Trail, which is a popular spot for walking and biking.
Economy
Swampscott’s economy is largely based on tourism, with many visitors coming to the town to enjoy its beaches and historic homes. The town is also home to a number of businesses, including restaurants, retail stores, and professional services. The town is also home to a number of technology companies, including the software company LogMeIn, which is headquartered in Swampscott.
Demographics
As of the 2010 census, Swampscott had a population of 13,787. The town is predominantly white, with 87.3% of the population identifying as white, and 8.2% identifying as Hispanic or Latino. The town also has a large Jewish population, with 8.3% of the population identifying as Jewish. The median household income in the town is $90,845, and the median home value is $521,400.
Swampscott is a small coastal town with a rich history and vibrant culture. The town is home to beautiful beaches, historic homes, and a thriving economy. The town is also home to a diverse population, with a large white, Jewish, and Hispanic population. The town is a great place to live, work, and visit, and is sure to continue to be a popular destination for years to come.
Common Questions
What is Per Capita Income in Swampscott?
Per Capita income in Swampscott is $72,512.
What is the Median Family Income in Swampscott?
Median Family Income in Swampscott is $157,614.
What is the Median Household income in Swampscott?
Median Household Income in Swampscott is $118,646.
What is Income or Wage Gap in Swampscott?
Income or Wage Gap in Swampscott is 15.3%.
Women in Swampscott earn 84.7 cents for every dollar earned by a man.
What is Inequality or Gini Index in Swampscott?
Inequality or Gini Index in Swampscott is 0.52.
What is the Total Population of Swampscott?
Total Population of Swampscott is 15,125.
What is the Total Male Population of Swampscott?
Total Male Population of Swampscott is 7,130.
What is the Total Female Population of Swampscott?
Total Female Population of Swampscott is 7,995.
What is the Ratio of Males per 100 Females in Swampscott?
There are 89.18 Males per 100 Females in Swampscott.
What is the Ratio of Females per 100 Males in Swampscott?
There are 112.13 Females per 100 Males in Swampscott.
What is the Median Population Age in Swampscott?
Median Population Age in Swampscott is 45.3 Years.
What is the Average Family Size in Swampscott
Average Family Size in Swampscott is 2.9 People.
What is the Average Household Size in Swampscott
Average Household Size in Swampscott is 2.4 People.
How Large is the Labor Force in Swampscott?
There are 8,582 People in the Labor Forcein in Swampscott.
What is the Percentage of People in the Labor Force in Swampscott?
69.1% of People are in the Labor Force in Swampscott.
What is the Unemployment Rate in Swampscott?
Unemployment Rate in Swampscott is 5.4%.