East Northport, NY Map & Demographics
East Northport Map
East Northport Overview
$60,680
PER CAPITA INCOME
$165,912
AVG FAMILY INCOME
$148,098
AVG HOUSEHOLD INCOME
36.3%
WAGE / INCOME GAP [ % ]
63.7¢/ $1
WAGE / INCOME GAP [ $ ]
0.40
INEQUALITY / GINI INDEX
20,287
TOTAL POPULATION
10,115
MALE POPULATION
10,172
FEMALE POPULATION
99.44
MALES / 100 FEMALES
100.56
FEMALES / 100 MALES
44.7
MEDIAN AGE
3.4
AVG FAMILY SIZE
2.8
AVG HOUSEHOLD SIZE
11,553
LABOR FORCE [ PEOPLE ]
71.1%
PERCENT IN LABOR FORCE
4.4%
UNEMPLOYMENT RATE
East Northport Zip Codes
East Northport Area Codes
Income in East Northport
Income Overview in East Northport
Per Capita Income in East Northport is $60,680, while median incomes of families and households are $165,912 and $148,098 respectively.
| Characteristic | Number | Measure |
| Per Capita Income | 20,287 | $60,680 |
| Median Family Income | 5,217 | $165,912 |
| Mean Family Income | 5,217 | $191,382 |
| Median Household Income | 7,199 | $148,098 |
| Mean Household Income | 7,199 | $167,143 |
| Income Deficit | 5,217 | $0 |
| Wage / Income Gap (%) | 20,287 | 36.28% |
| Wage / Income Gap ($) | 20,287 | 63.72¢ per $1 |
| Gini / Inequality Index | 20,287 | 0.40 |
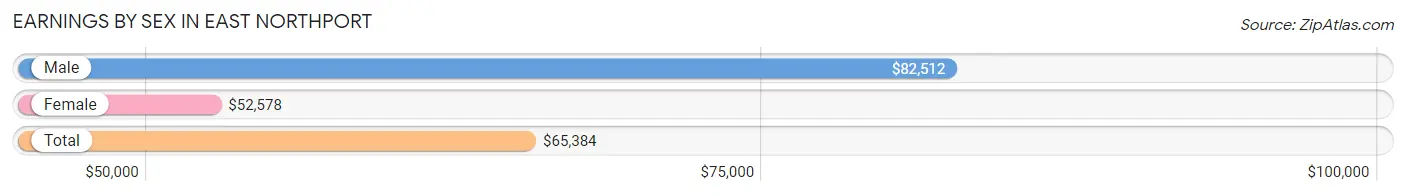
Earnings by Sex in East Northport
Average Earnings in East Northport are $65,384, $82,512 for men and $52,578 for women, a difference of 36.3%.
| Sex | Number | Average Earnings |
| Male | 6,033 (51.3%) | $82,512 |
| Female | 5,727 (48.7%) | $52,578 |
| Total | 11,760 (100.0%) | $65,384 |
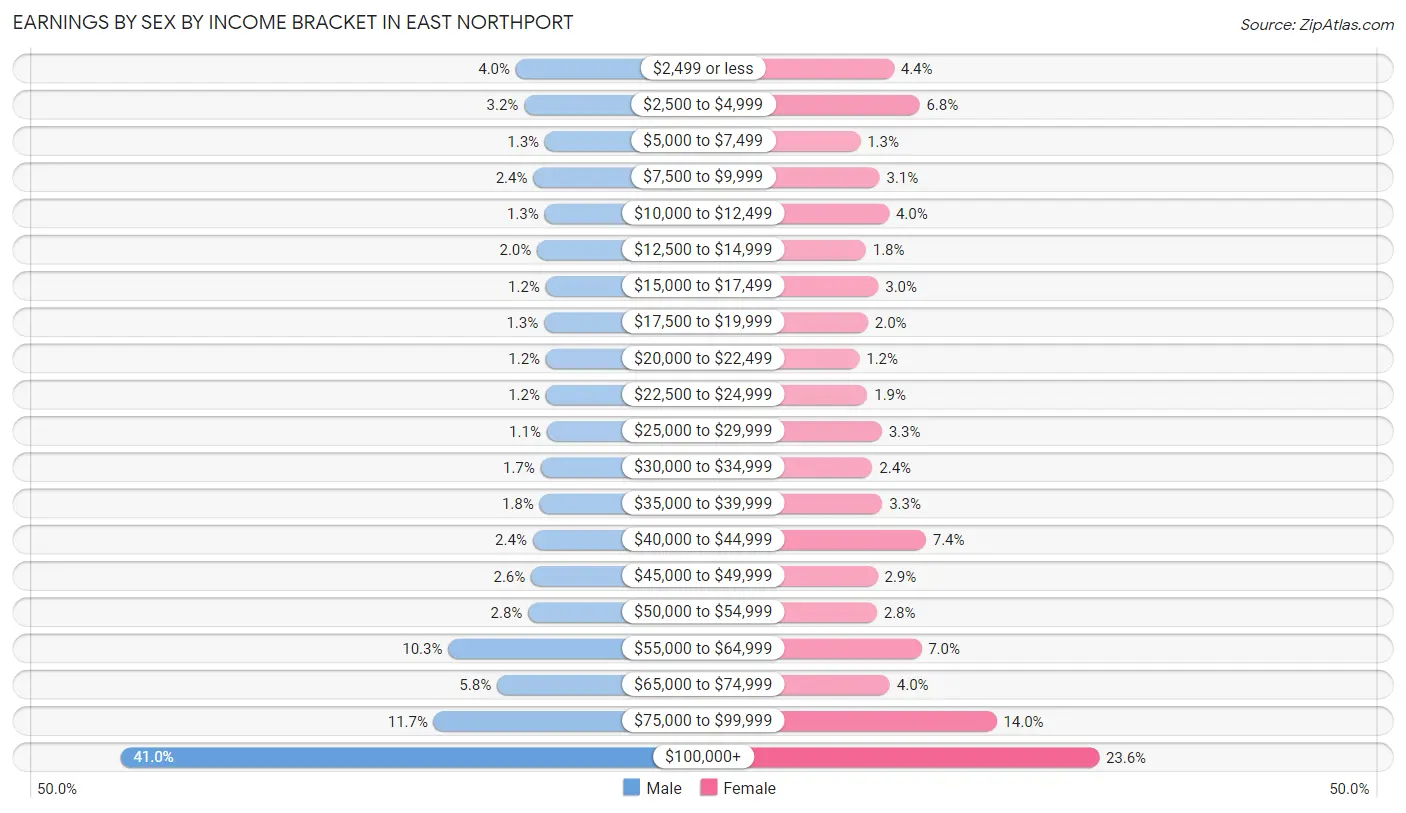
Earnings by Sex by Income Bracket in East Northport
The most common earnings brackets in East Northport are $100,000+ for men (2,475 | 41.0%) and $100,000+ for women (1,353 | 23.6%).
| Income | Male | Female |
| $2,499 or less | 240 (4.0%) | 252 (4.4%) |
| $2,500 to $4,999 | 193 (3.2%) | 390 (6.8%) |
| $5,000 to $7,499 | 76 (1.3%) | 72 (1.3%) |
| $7,500 to $9,999 | 142 (2.4%) | 176 (3.1%) |
| $10,000 to $12,499 | 78 (1.3%) | 226 (4.0%) |
| $12,500 to $14,999 | 120 (2.0%) | 102 (1.8%) |
| $15,000 to $17,499 | 72 (1.2%) | 169 (2.9%) |
| $17,500 to $19,999 | 81 (1.3%) | 113 (2.0%) |
| $20,000 to $22,499 | 70 (1.2%) | 67 (1.2%) |
| $22,500 to $24,999 | 71 (1.2%) | 110 (1.9%) |
| $25,000 to $29,999 | 66 (1.1%) | 187 (3.3%) |
| $30,000 to $34,999 | 100 (1.7%) | 137 (2.4%) |
| $35,000 to $39,999 | 106 (1.8%) | 190 (3.3%) |
| $40,000 to $44,999 | 145 (2.4%) | 424 (7.4%) |
| $45,000 to $49,999 | 154 (2.5%) | 165 (2.9%) |
| $50,000 to $54,999 | 171 (2.8%) | 161 (2.8%) |
| $55,000 to $64,999 | 622 (10.3%) | 399 (7.0%) |
| $65,000 to $74,999 | 347 (5.8%) | 231 (4.0%) |
| $75,000 to $99,999 | 704 (11.7%) | 803 (14.0%) |
| $100,000+ | 2,475 (41.0%) | 1,353 (23.6%) |
| Total | 6,033 (100.0%) | 5,727 (100.0%) |
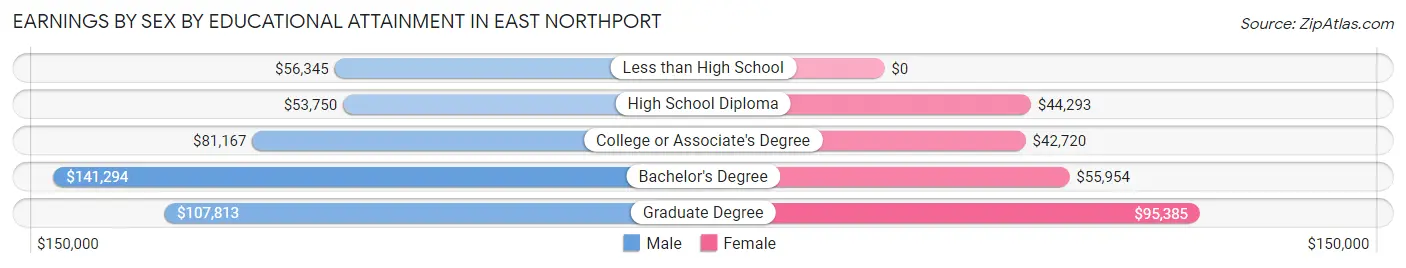
Earnings by Sex by Educational Attainment in East Northport
Average earnings in East Northport are $96,250 for men and $58,179 for women, a difference of 39.6%. Men with an educational attainment of bachelor's degree enjoy the highest average annual earnings of $141,294, while those with high school diploma education earn the least with $53,750. Women with an educational attainment of graduate degree earn the most with the average annual earnings of $95,385, while those with college or associate's degree education have the smallest earnings of $42,720.
| Educational Attainment | Male Income | Female Income |
| Less than High School | $56,345 | $0 |
| High School Diploma | $53,750 | $44,293 |
| College or Associate's Degree | $81,167 | $42,720 |
| Bachelor's Degree | $141,294 | $55,954 |
| Graduate Degree | $107,813 | $95,385 |
| Total | $96,250 | $58,179 |
Family Income in East Northport
Family Income Brackets in East Northport
According to the East Northport family income data, there are 1,977 families falling into the $200,000+ income range, which is the most common income bracket and makes up 37.9% of all families. Conversely, the $15,000 to $24,999 income bracket is the least frequent group with only 31 families (0.6%) belonging to this category.
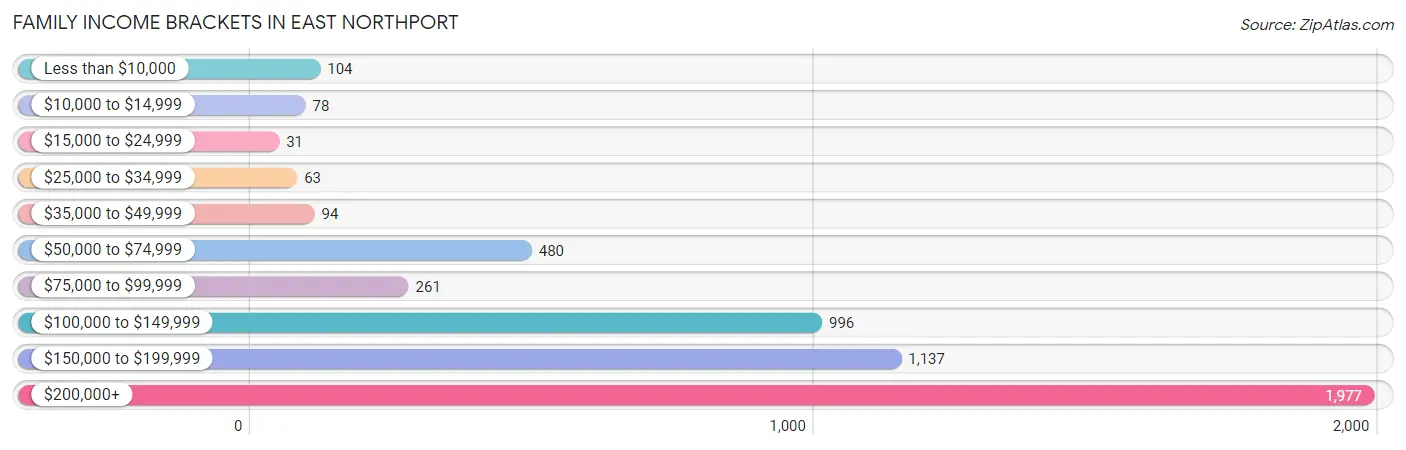
| Income Bracket | # Families | % Families |
| Less than $10,000 | 104 | 2.0% |
| $10,000 to $14,999 | 78 | 1.5% |
| $15,000 to $24,999 | 31 | 0.6% |
| $25,000 to $34,999 | 63 | 1.2% |
| $35,000 to $49,999 | 94 | 1.8% |
| $50,000 to $74,999 | 480 | 9.2% |
| $75,000 to $99,999 | 261 | 5.0% |
| $100,000 to $149,999 | 996 | 19.1% |
| $150,000 to $199,999 | 1,137 | 21.8% |
| $200,000+ | 1,977 | 37.9% |
Family Income by Famaliy Size in East Northport
7+ person families (32 | 0.6%) account for the highest median family income in East Northport with $250,001 per family, while 2-person families (1,811 | 34.7%) have the highest median income of $65,230 per family member.
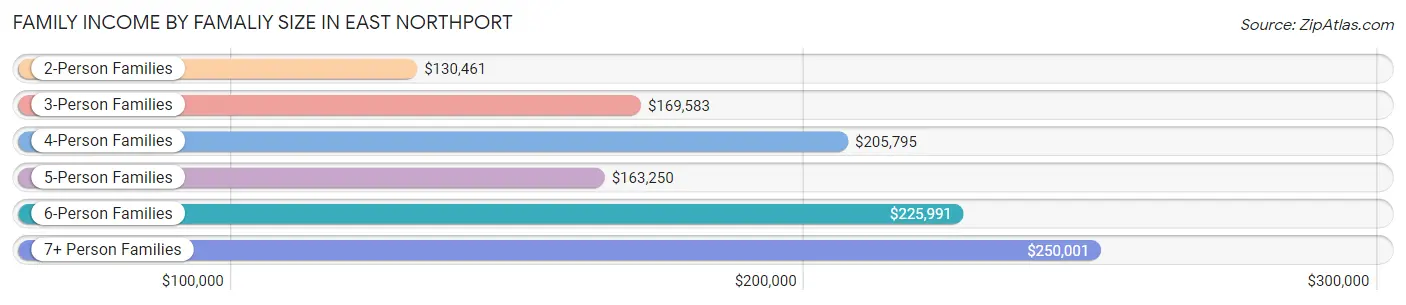
| Income Bracket | # Families | Median Income |
| 2-Person Families | 1,811 (34.7%) | $130,461 |
| 3-Person Families | 1,396 (26.8%) | $169,583 |
| 4-Person Families | 1,303 (25.0%) | $205,795 |
| 5-Person Families | 576 (11.0%) | $163,250 |
| 6-Person Families | 99 (1.9%) | $225,991 |
| 7+ Person Families | 32 (0.6%) | $250,001 |
| Total | 5,217 (100.0%) | $165,912 |
Family Income by Number of Earners in East Northport
The median family income in East Northport is $165,912, with families comprising 3+ earners (1,180) having the highest median family income of $222,500, while families with no earners (698) have the lowest median family income of $65,833, accounting for 22.6% and 13.4% of families, respectively.
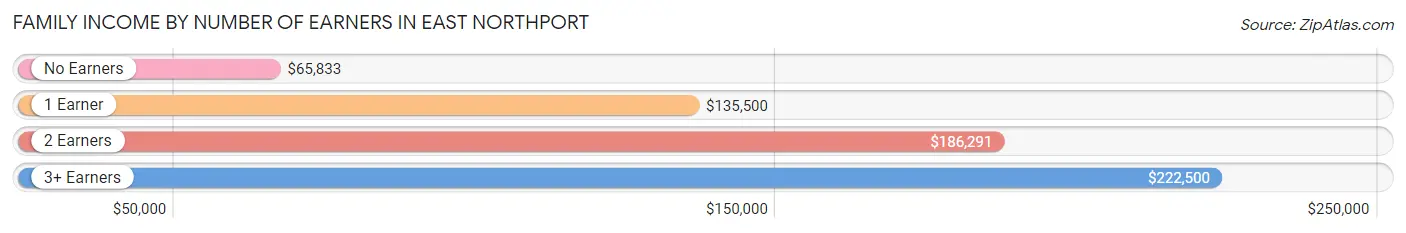
| Number of Earners | # Families | Median Income |
| No Earners | 698 (13.4%) | $65,833 |
| 1 Earner | 874 (16.8%) | $135,500 |
| 2 Earners | 2,465 (47.2%) | $186,291 |
| 3+ Earners | 1,180 (22.6%) | $222,500 |
| Total | 5,217 (100.0%) | $165,912 |
Household Income in East Northport
Household Income Brackets in East Northport
With 2,124 households falling in the category, the $200,000+ income range is the most frequent in East Northport, accounting for 29.5% of all households. In contrast, only 115 households (1.6%) fall into the $10,000 to $14,999 income bracket, making it the least populous group.
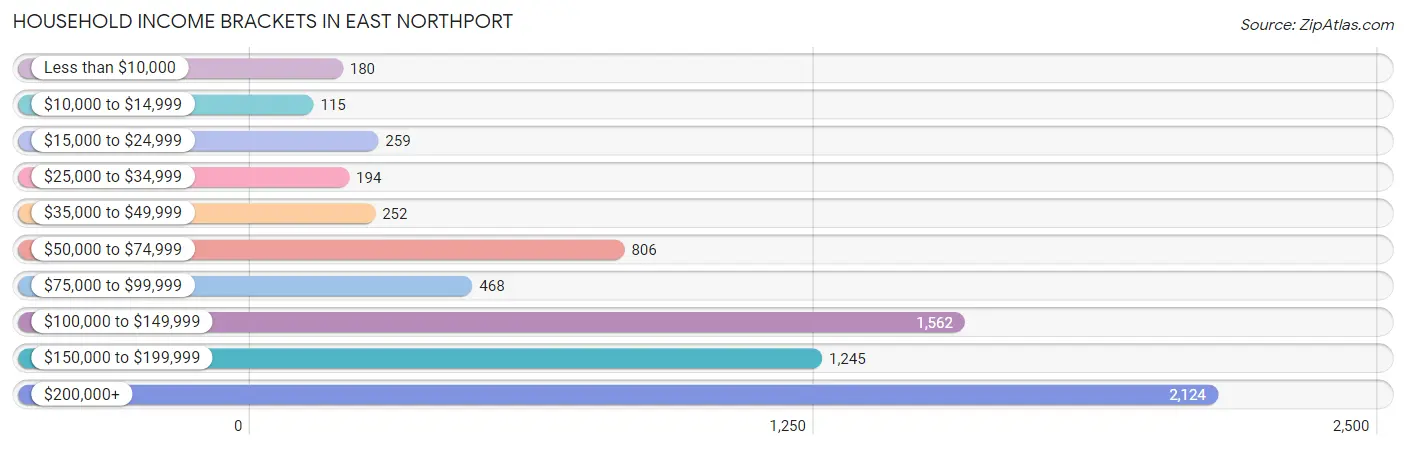
| Income Bracket | # Households | % Households |
| Less than $10,000 | 180 | 2.5% |
| $10,000 to $14,999 | 115 | 1.6% |
| $15,000 to $24,999 | 259 | 3.6% |
| $25,000 to $34,999 | 194 | 2.7% |
| $35,000 to $49,999 | 252 | 3.5% |
| $50,000 to $74,999 | 806 | 11.2% |
| $75,000 to $99,999 | 468 | 6.5% |
| $100,000 to $149,999 | 1,562 | 21.7% |
| $150,000 to $199,999 | 1,245 | 17.3% |
| $200,000+ | 2,124 | 29.5% |
Household Income by Householder Age in East Northport
The median household income in East Northport is $148,098, with the highest median household income of $181,190 found in the 25 to 44 years age bracket for the primary householder. A total of 1,330 households (18.5%) fall into this category.
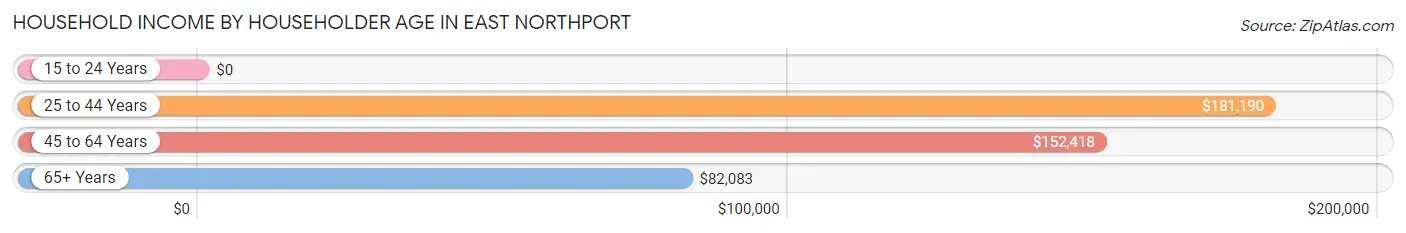
| Income Bracket | # Households | Median Income |
| 15 to 24 Years | 0 (0.0%) | $0 |
| 25 to 44 Years | 1,330 (18.5%) | $181,190 |
| 45 to 64 Years | 3,804 (52.8%) | $152,418 |
| 65+ Years | 2,065 (28.7%) | $82,083 |
| Total | 7,199 (100.0%) | $148,098 |
Poverty in East Northport
Income Below Poverty by Sex and Age in East Northport
With 6.0% poverty level for males and 5.6% for females among the residents of East Northport, 12 to 14 year old males and 18 to 24 year old females are the most vulnerable to poverty, with 92 males (22.6%) and 74 females (9.8%) in their respective age groups living below the poverty level.
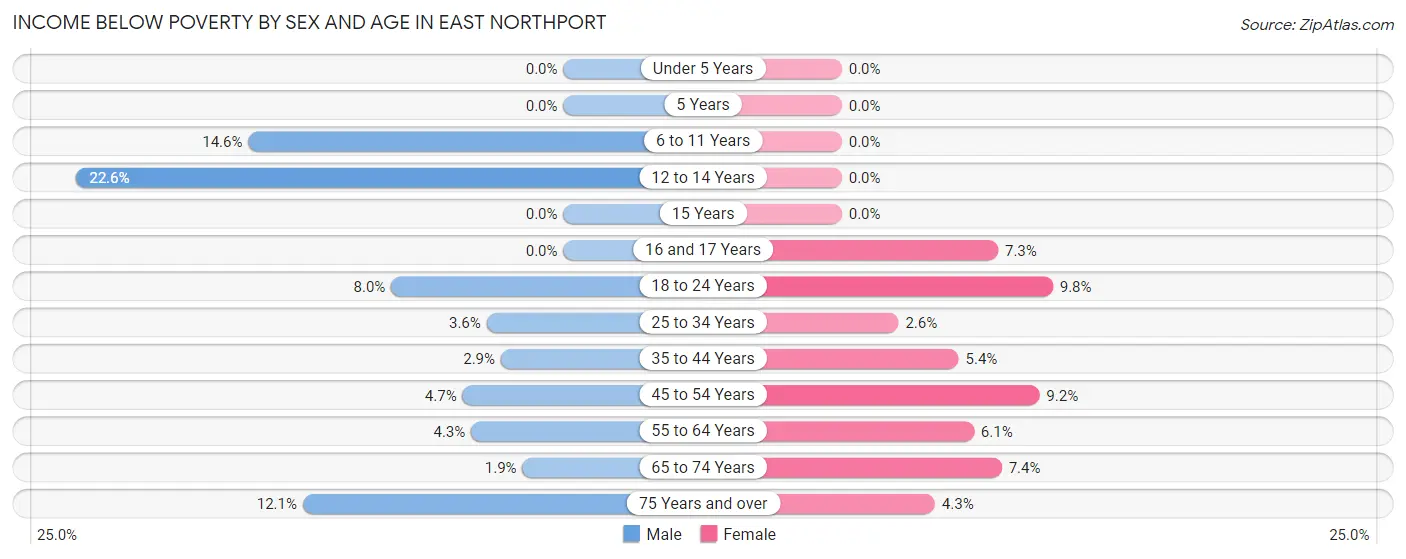
| Age Bracket | Male | Female |
| Under 5 Years | 0 (0.0%) | 0 (0.0%) |
| 5 Years | 0 (0.0%) | 0 (0.0%) |
| 6 to 11 Years | 148 (14.6%) | 0 (0.0%) |
| 12 to 14 Years | 92 (22.6%) | 0 (0.0%) |
| 15 Years | 0 (0.0%) | 0 (0.0%) |
| 16 and 17 Years | 0 (0.0%) | 24 (7.2%) |
| 18 to 24 Years | 66 (8.0%) | 74 (9.8%) |
| 25 to 34 Years | 30 (3.6%) | 23 (2.6%) |
| 35 to 44 Years | 37 (2.9%) | 57 (5.4%) |
| 45 to 54 Years | 62 (4.7%) | 150 (9.2%) |
| 55 to 64 Years | 82 (4.3%) | 110 (6.1%) |
| 65 to 74 Years | 13 (1.9%) | 96 (7.4%) |
| 75 Years and over | 81 (12.1%) | 31 (4.3%) |
| Total | 611 (6.0%) | 565 (5.6%) |
Income Above Poverty by Sex and Age in East Northport
According to the poverty statistics in East Northport, males aged under 5 years and females aged under 5 years are the age groups that are most secure financially, with 100.0% of males and 100.0% of females in these age groups living above the poverty line.
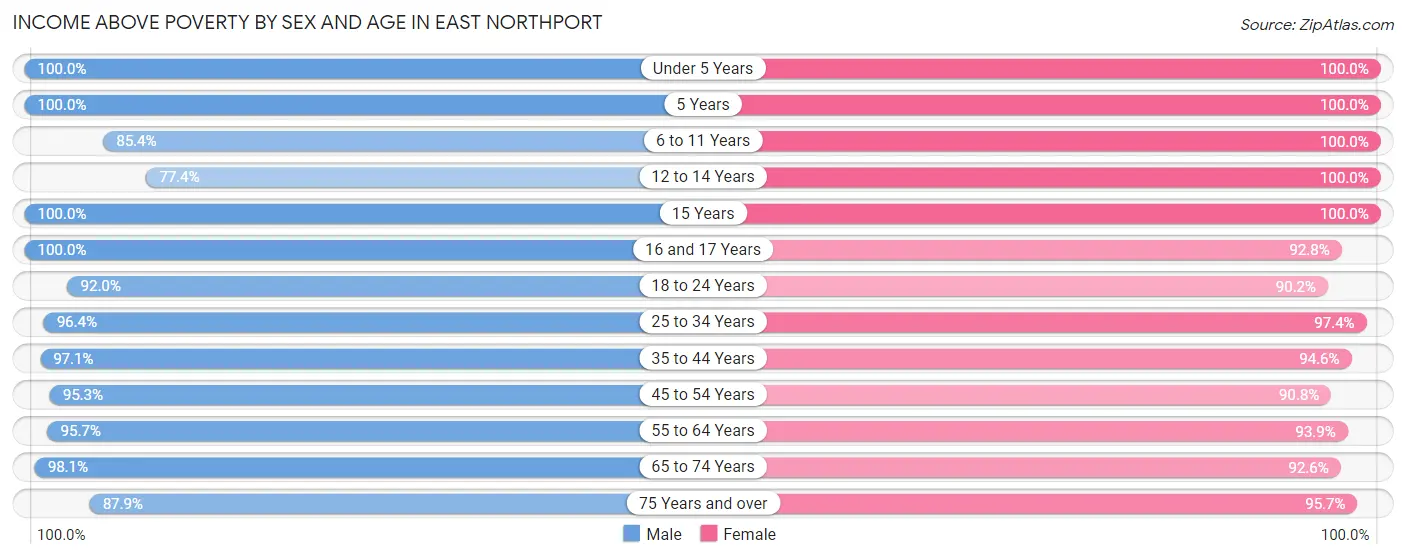
| Age Bracket | Male | Female |
| Under 5 Years | 692 (100.0%) | 781 (100.0%) |
| 5 Years | 76 (100.0%) | 100 (100.0%) |
| 6 to 11 Years | 864 (85.4%) | 555 (100.0%) |
| 12 to 14 Years | 315 (77.4%) | 242 (100.0%) |
| 15 Years | 127 (100.0%) | 31 (100.0%) |
| 16 and 17 Years | 237 (100.0%) | 307 (92.7%) |
| 18 to 24 Years | 760 (92.0%) | 682 (90.2%) |
| 25 to 34 Years | 812 (96.4%) | 850 (97.4%) |
| 35 to 44 Years | 1,240 (97.1%) | 994 (94.6%) |
| 45 to 54 Years | 1,264 (95.3%) | 1,486 (90.8%) |
| 55 to 64 Years | 1,836 (95.7%) | 1,683 (93.9%) |
| 65 to 74 Years | 672 (98.1%) | 1,197 (92.6%) |
| 75 Years and over | 589 (87.9%) | 686 (95.7%) |
| Total | 9,484 (94.0%) | 9,594 (94.4%) |
Income Below Poverty Among Married-Couple Families in East Northport
The poverty statistics for married-couple families in East Northport show that 1.7% or 75 of the total 4,343 families live below the poverty line. Families with no children have the highest poverty rate of 3.3%, comprising of 75 families. On the other hand, families with 1 or 2 children have the lowest poverty rate of 0.0%, which includes 0 families.
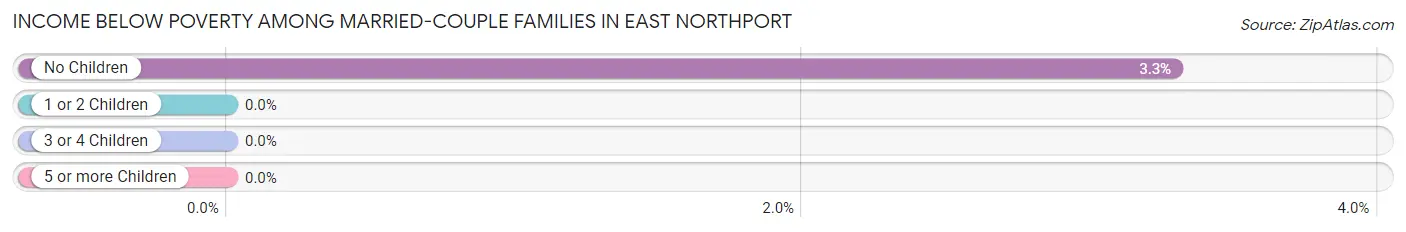
| Children | Above Poverty | Below Poverty |
| No Children | 2,203 (96.7%) | 75 (3.3%) |
| 1 or 2 Children | 1,692 (100.0%) | 0 (0.0%) |
| 3 or 4 Children | 361 (100.0%) | 0 (0.0%) |
| 5 or more Children | 12 (100.0%) | 0 (0.0%) |
| Total | 4,268 (98.3%) | 75 (1.7%) |
Income Below Poverty Among Single-Parent Households in East Northport
According to the poverty data in East Northport, 7.2% or 18 single-father households and 18.9% or 118 single-mother households are living below the poverty line. Among single-father households, those with 1 or 2 children have the highest poverty rate, with 18 households (27.3%) experiencing poverty. Likewise, among single-mother households, those with 1 or 2 children have the highest poverty rate, with 98 households (37.6%) falling below the poverty line.
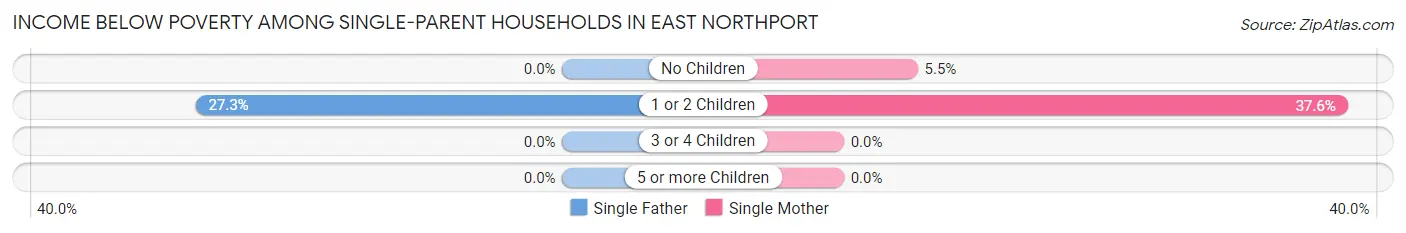
| Children | Single Father | Single Mother |
| No Children | 0 (0.0%) | 20 (5.5%) |
| 1 or 2 Children | 18 (27.3%) | 98 (37.6%) |
| 3 or 4 Children | 0 (0.0%) | 0 (0.0%) |
| 5 or more Children | 0 (0.0%) | 0 (0.0%) |
| Total | 18 (7.2%) | 118 (18.9%) |
Income Below Poverty Among Married-Couple vs Single-Parent Households in East Northport
The poverty data for East Northport shows that 75 of the married-couple family households (1.7%) and 136 of the single-parent households (15.6%) are living below the poverty level. Within the married-couple family households, those with no children have the highest poverty rate, with 75 households (3.3%) falling below the poverty line. Among the single-parent households, those with 1 or 2 children have the highest poverty rate, with 116 household (35.5%) living below poverty.
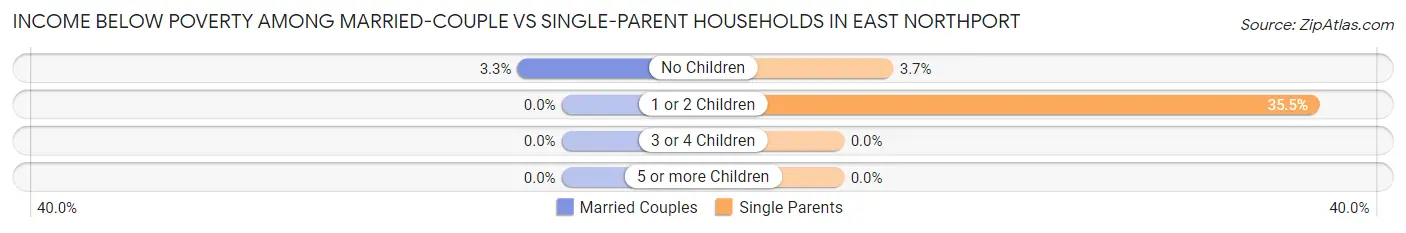
| Children | Married-Couple Families | Single-Parent Households |
| No Children | 75 (3.3%) | 20 (3.7%) |
| 1 or 2 Children | 0 (0.0%) | 116 (35.5%) |
| 3 or 4 Children | 0 (0.0%) | 0 (0.0%) |
| 5 or more Children | 0 (0.0%) | 0 (0.0%) |
| Total | 75 (1.7%) | 136 (15.6%) |
Race in East Northport
The most populous races in East Northport are White / Caucasian (17,805 | 87.8%), Hispanic or Latino (1,315 | 6.5%), and Two or more Races (846 | 4.2%).
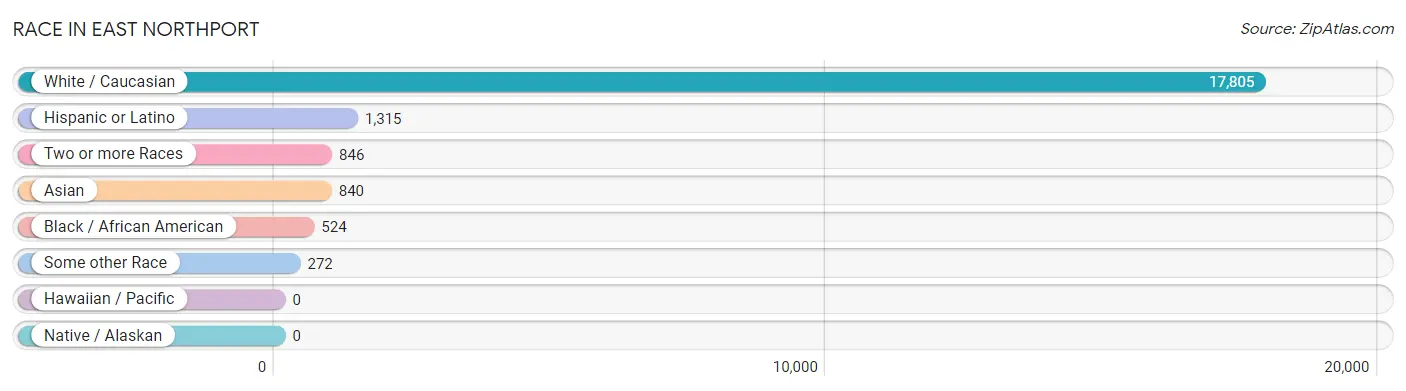
| Race | # Population | % Population |
| Asian | 840 | 4.1% |
| Black / African American | 524 | 2.6% |
| Hawaiian / Pacific | 0 | 0.0% |
| Hispanic or Latino | 1,315 | 6.5% |
| Native / Alaskan | 0 | 0.0% |
| White / Caucasian | 17,805 | 87.8% |
| Two or more Races | 846 | 4.2% |
| Some other Race | 272 | 1.3% |
| Total | 20,287 | 100.0% |
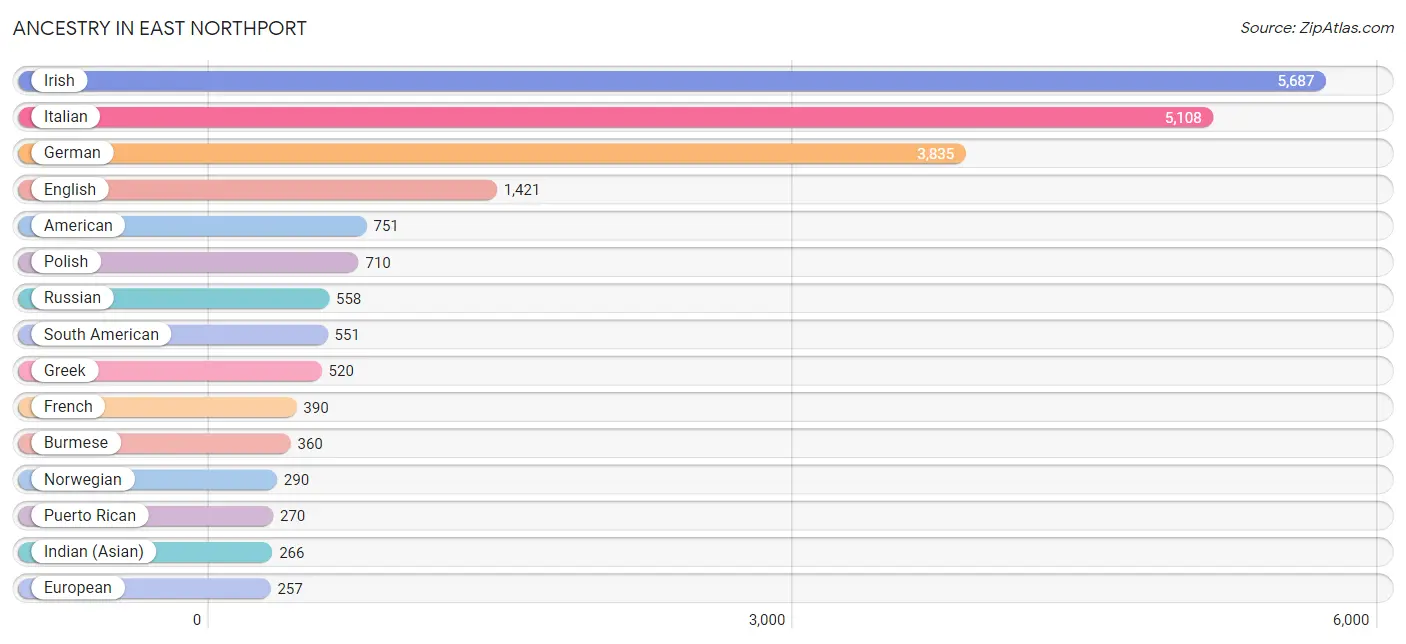
Ancestry in East Northport
The most populous ancestries reported in East Northport are Irish (5,687 | 28.0%), Italian (5,108 | 25.2%), German (3,835 | 18.9%), English (1,421 | 7.0%), and American (751 | 3.7%), together accounting for 82.8% of all East Northport residents.
| Ancestry | # Population | % Population |
| Albanian | 9 | 0.0% |
| American | 751 | 3.7% |
| Arab | 78 | 0.4% |
| Armenian | 124 | 0.6% |
| Austrian | 121 | 0.6% |
| Bhutanese | 108 | 0.5% |
| Bolivian | 57 | 0.3% |
| British | 64 | 0.3% |
| Burmese | 360 | 1.8% |
| Canadian | 11 | 0.1% |
| Central American | 226 | 1.1% |
| Cherokee | 14 | 0.1% |
| Chilean | 33 | 0.2% |
| Colombian | 195 | 1.0% |
| Croatian | 76 | 0.4% |
| Cuban | 62 | 0.3% |
| Czech | 143 | 0.7% |
| Czechoslovakian | 10 | 0.1% |
| Danish | 170 | 0.8% |
| Dominican | 50 | 0.3% |
| Dutch | 115 | 0.6% |
| Eastern European | 235 | 1.2% |
| Ecuadorian | 48 | 0.2% |
| Egyptian | 47 | 0.2% |
| English | 1,421 | 7.0% |
| Estonian | 24 | 0.1% |
| European | 257 | 1.3% |
| Finnish | 10 | 0.1% |
| French | 390 | 1.9% |
| French Canadian | 53 | 0.3% |
| German | 3,835 | 18.9% |
| Greek | 520 | 2.6% |
| Guatemalan | 63 | 0.3% |
| Guyanese | 14 | 0.1% |
| Hungarian | 118 | 0.6% |
| Indian (Asian) | 266 | 1.3% |
| Iranian | 41 | 0.2% |
| Irish | 5,687 | 28.0% |
| Israeli | 10 | 0.1% |
| Italian | 5,108 | 25.2% |
| Jamaican | 90 | 0.4% |
| Korean | 107 | 0.5% |
| Lebanese | 16 | 0.1% |
| Lithuanian | 94 | 0.5% |
| Maltese | 130 | 0.6% |
| Mexican | 81 | 0.4% |
| Northern European | 11 | 0.1% |
| Norwegian | 290 | 1.4% |
| Pakistani | 28 | 0.1% |
| Panamanian | 78 | 0.4% |
| Paraguayan | 27 | 0.1% |
| Peruvian | 191 | 0.9% |
| Polish | 710 | 3.5% |
| Puerto Rican | 270 | 1.3% |
| Romanian | 74 | 0.4% |
| Russian | 558 | 2.8% |
| Salvadoran | 85 | 0.4% |
| Scandinavian | 28 | 0.1% |
| Scotch-Irish | 77 | 0.4% |
| Scottish | 169 | 0.8% |
| South American | 551 | 2.7% |
| Spaniard | 50 | 0.3% |
| Spanish | 23 | 0.1% |
| Swedish | 78 | 0.4% |
| Thai | 233 | 1.1% |
| Turkish | 54 | 0.3% |
| Ukrainian | 13 | 0.1% |
| Welsh | 50 | 0.3% |
| West Indian | 12 | 0.1% | View All 69 Rows |
Immigrants in East Northport
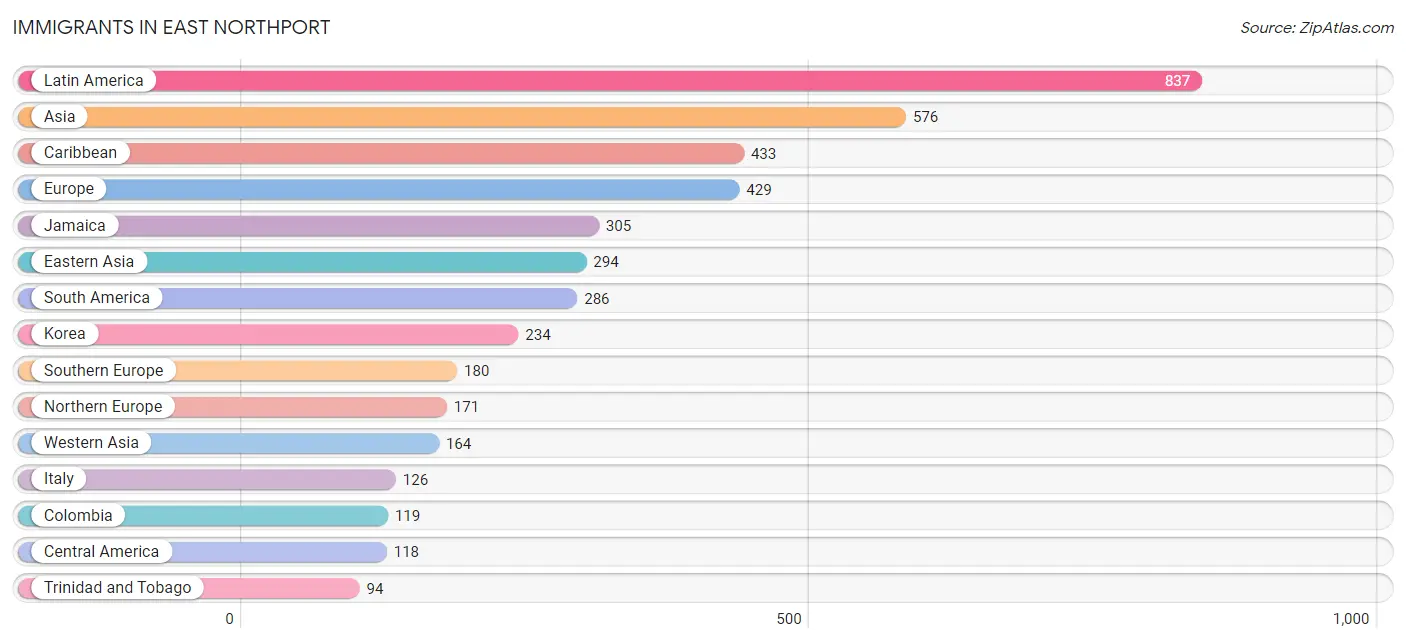
The most numerous immigrant groups reported in East Northport came from Latin America (837 | 4.1%), Asia (576 | 2.8%), Caribbean (433 | 2.1%), Europe (429 | 2.1%), and Jamaica (305 | 1.5%), together accounting for 12.7% of all East Northport residents.
| Immigration Origin | # Population | % Population |
| Africa | 56 | 0.3% |
| Armenia | 64 | 0.3% |
| Asia | 576 | 2.8% |
| Bolivia | 57 | 0.3% |
| Caribbean | 433 | 2.1% |
| Central America | 118 | 0.6% |
| Chile | 33 | 0.2% |
| China | 60 | 0.3% |
| Colombia | 119 | 0.6% |
| Croatia | 7 | 0.0% |
| Dominican Republic | 34 | 0.2% |
| Eastern Asia | 294 | 1.5% |
| Eastern Europe | 40 | 0.2% |
| Egypt | 35 | 0.2% |
| El Salvador | 85 | 0.4% |
| England | 53 | 0.3% |
| Europe | 429 | 2.1% |
| Germany | 38 | 0.2% |
| Guatemala | 16 | 0.1% |
| India | 22 | 0.1% |
| Iran | 40 | 0.2% |
| Ireland | 14 | 0.1% |
| Italy | 126 | 0.6% |
| Jamaica | 305 | 1.5% |
| Korea | 234 | 1.1% |
| Kuwait | 18 | 0.1% |
| Latin America | 837 | 4.1% |
| Moldova | 12 | 0.1% |
| Northern Africa | 35 | 0.2% |
| Northern Europe | 171 | 0.8% |
| Panama | 17 | 0.1% |
| Peru | 38 | 0.2% |
| Philippines | 39 | 0.2% |
| Portugal | 28 | 0.1% |
| Russia | 11 | 0.1% |
| South Africa | 19 | 0.1% |
| South America | 286 | 1.4% |
| South Central Asia | 62 | 0.3% |
| South Eastern Asia | 56 | 0.3% |
| Southern Europe | 180 | 0.9% |
| Spain | 26 | 0.1% |
| Sweden | 13 | 0.1% |
| Taiwan | 12 | 0.1% |
| Trinidad and Tobago | 94 | 0.5% |
| Turkey | 38 | 0.2% |
| Ukraine | 1 | 0.0% |
| Vietnam | 17 | 0.1% |
| Western Asia | 164 | 0.8% |
| Western Europe | 38 | 0.2% | View All 49 Rows |
Sex and Age in East Northport
Sex and Age in East Northport
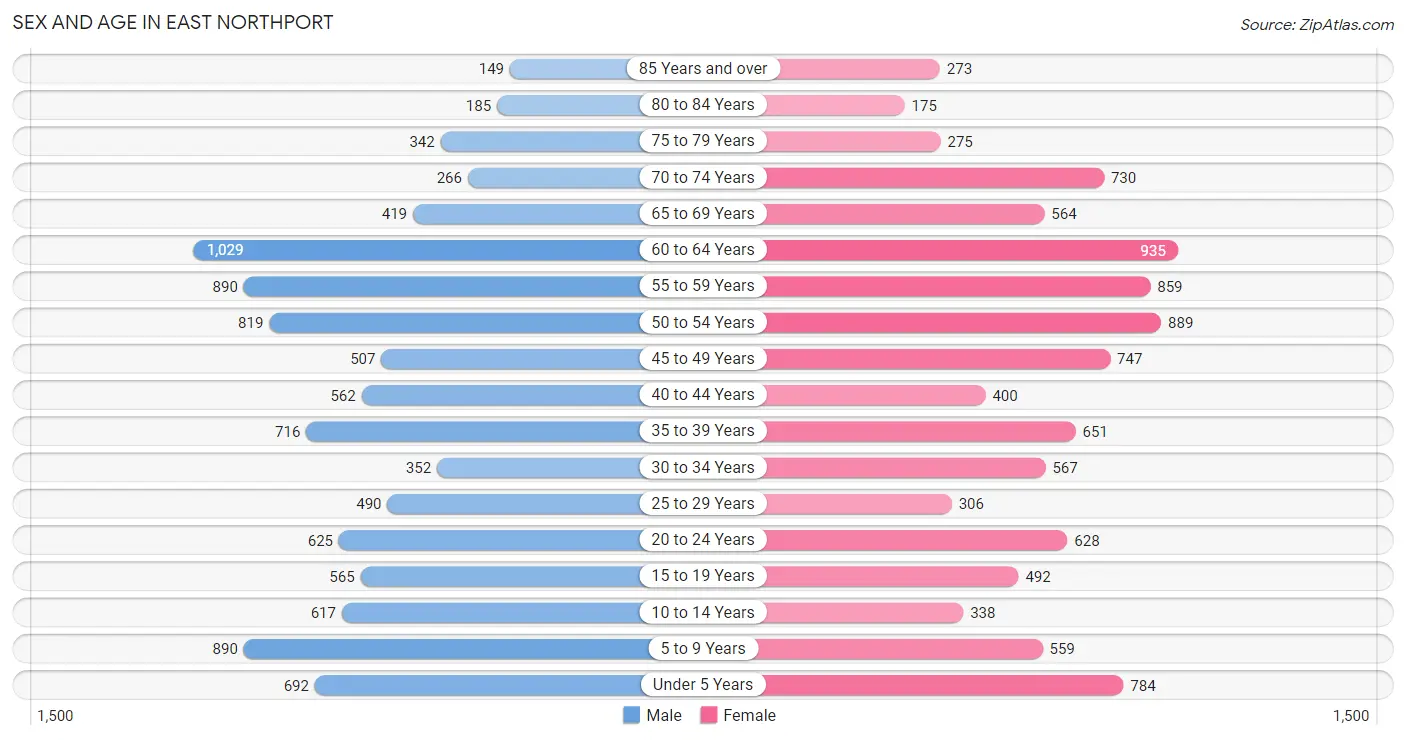
The most populous age groups in East Northport are 60 to 64 Years (1,029 | 10.2%) for men and 60 to 64 Years (935 | 9.2%) for women.
| Age Bracket | Male | Female |
| Under 5 Years | 692 (6.8%) | 784 (7.7%) |
| 5 to 9 Years | 890 (8.8%) | 559 (5.5%) |
| 10 to 14 Years | 617 (6.1%) | 338 (3.3%) |
| 15 to 19 Years | 565 (5.6%) | 492 (4.8%) |
| 20 to 24 Years | 625 (6.2%) | 628 (6.2%) |
| 25 to 29 Years | 490 (4.8%) | 306 (3.0%) |
| 30 to 34 Years | 352 (3.5%) | 567 (5.6%) |
| 35 to 39 Years | 716 (7.1%) | 651 (6.4%) |
| 40 to 44 Years | 562 (5.6%) | 400 (3.9%) |
| 45 to 49 Years | 507 (5.0%) | 747 (7.3%) |
| 50 to 54 Years | 819 (8.1%) | 889 (8.7%) |
| 55 to 59 Years | 890 (8.8%) | 859 (8.4%) |
| 60 to 64 Years | 1,029 (10.2%) | 935 (9.2%) |
| 65 to 69 Years | 419 (4.1%) | 564 (5.5%) |
| 70 to 74 Years | 266 (2.6%) | 730 (7.2%) |
| 75 to 79 Years | 342 (3.4%) | 275 (2.7%) |
| 80 to 84 Years | 185 (1.8%) | 175 (1.7%) |
| 85 Years and over | 149 (1.5%) | 273 (2.7%) |
| Total | 10,115 (100.0%) | 10,172 (100.0%) |
Families and Households in East Northport
Median Family Size in East Northport
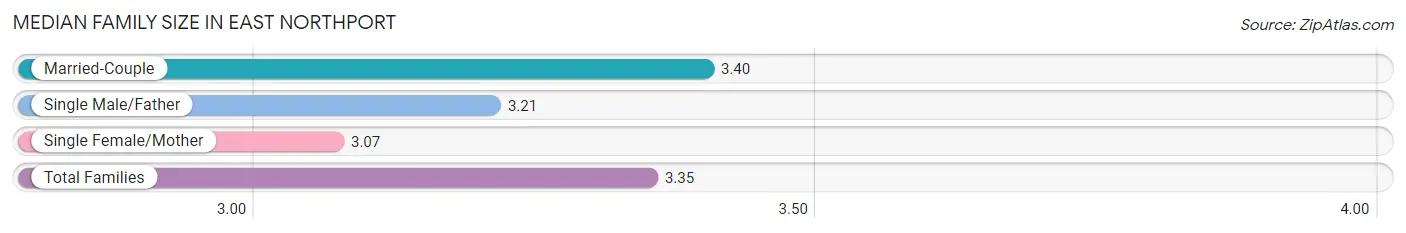
The median family size in East Northport is 3.35 persons per family, with married-couple families (4,343 | 83.3%) accounting for the largest median family size of 3.4 persons per family. On the other hand, single female/mother families (624 | 12.0%) represent the smallest median family size with 3.07 persons per family.
| Family Type | # Families | Family Size |
| Married-Couple | 4,343 (83.3%) | 3.40 |
| Single Male/Father | 250 (4.8%) | 3.21 |
| Single Female/Mother | 624 (12.0%) | 3.07 |
| Total Families | 5,217 (100.0%) | 3.35 |
Median Household Size in East Northport
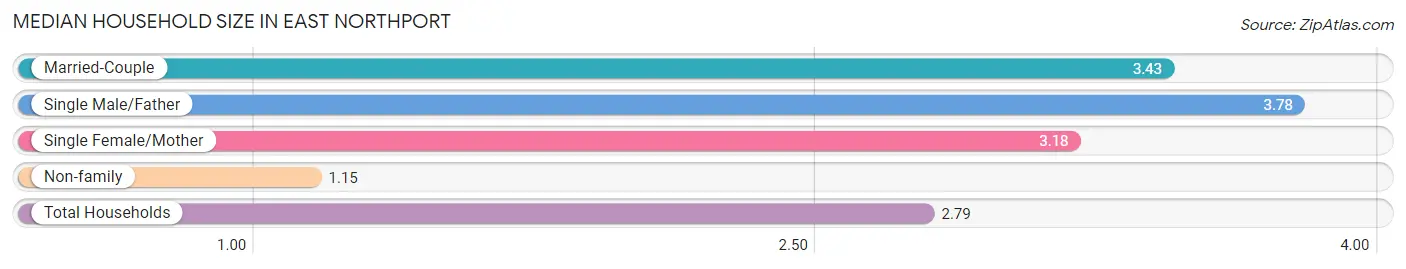
The median household size in East Northport is 2.79 persons per household, with single male/father households (250 | 3.5%) accounting for the largest median household size of 3.78 persons per household. non-family households (1,982 | 27.5%) represent the smallest median household size with 1.15 persons per household.
| Household Type | # Households | Household Size |
| Married-Couple | 4,343 (60.3%) | 3.43 |
| Single Male/Father | 250 (3.5%) | 3.78 |
| Single Female/Mother | 624 (8.7%) | 3.18 |
| Non-family | 1,982 (27.5%) | 1.15 |
| Total Households | 7,199 (100.0%) | 2.79 |
Household Size by Marriage Status in East Northport
Out of a total of 7,199 households in East Northport, 5,217 (72.5%) are family households, while 1,982 (27.5%) are nonfamily households. The most numerous type of family households are 2-person households, comprising 1,701, and the most common type of nonfamily households are 1-person households, comprising 1,770.
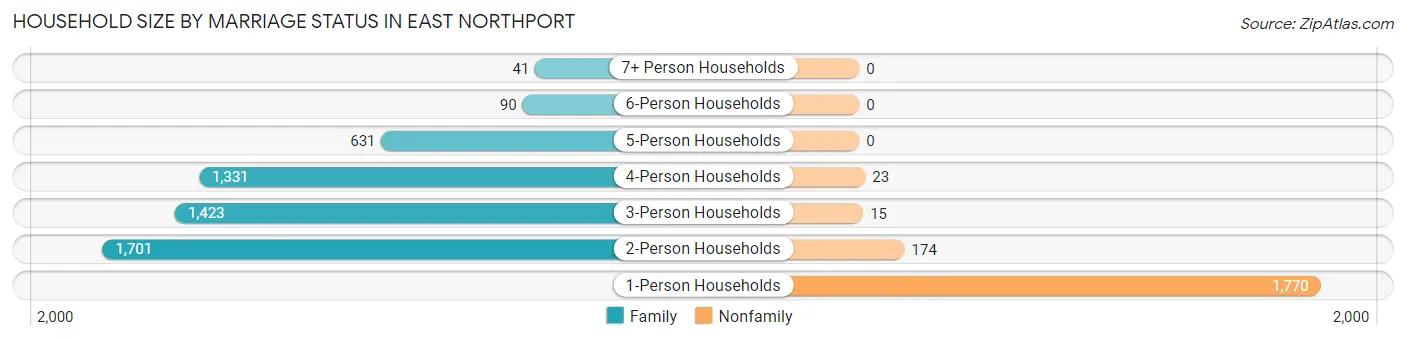
| Household Size | Family Households | Nonfamily Households |
| 1-Person Households | - | 1,770 (24.6%) |
| 2-Person Households | 1,701 (23.6%) | 174 (2.4%) |
| 3-Person Households | 1,423 (19.8%) | 15 (0.2%) |
| 4-Person Households | 1,331 (18.5%) | 23 (0.3%) |
| 5-Person Households | 631 (8.8%) | 0 (0.0%) |
| 6-Person Households | 90 (1.3%) | 0 (0.0%) |
| 7+ Person Households | 41 (0.6%) | 0 (0.0%) |
| Total | 5,217 (72.5%) | 1,982 (27.5%) |
Female Fertility in East Northport
Fertility by Age in East Northport
Average fertility rate in East Northport is 77.0 births per 1,000 women. Women in the age bracket of 20 to 34 years have the highest fertility rate with 115.0 births per 1,000 women. Women in the age bracket of 20 to 34 years acount for 58.1% of all women with births.
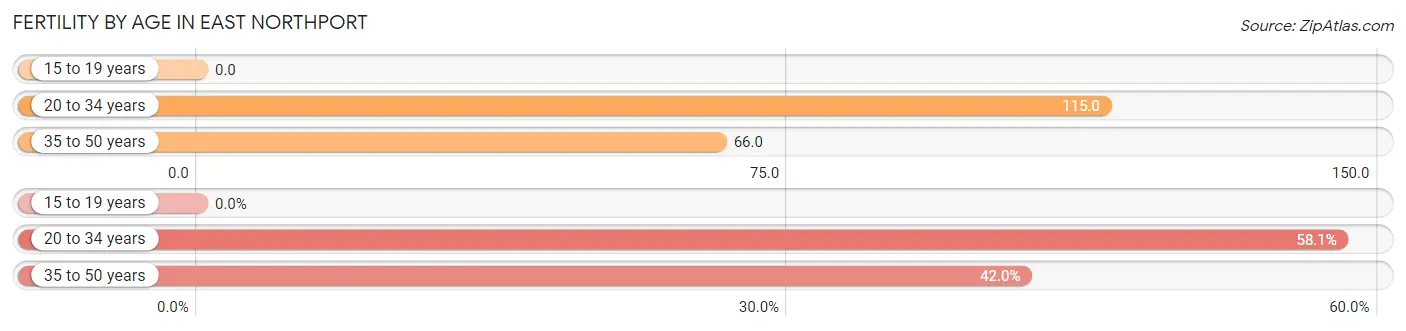
| Age Bracket | Women with Births | Births / 1,000 Women |
| 15 to 19 years | 0 (0.0%) | 0.0 |
| 20 to 34 years | 173 (58.1%) | 115.0 |
| 35 to 50 years | 125 (41.9%) | 66.0 |
| Total | 298 (100.0%) | 77.0 |
Fertility by Age by Marriage Status in East Northport
94.6% of women with births (298) in East Northport are married. The highest percentage of unmarried women with births falls into 35 to 50 years age bracket with 6.4% of them unmarried at the time of birth, while the lowest percentage of unmarried women with births belong to 20 to 34 years age bracket with 4.6% of them unmarried.
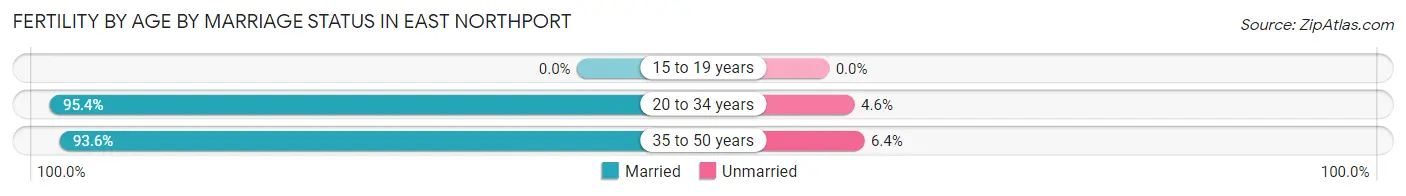
| Age Bracket | Married | Unmarried |
| 15 to 19 years | 0 (0.0%) | 0 (0.0%) |
| 20 to 34 years | 165 (95.4%) | 8 (4.6%) |
| 35 to 50 years | 117 (93.6%) | 8 (6.4%) |
| Total | 282 (94.6%) | 16 (5.4%) |
Fertility by Education in East Northport
Average fertility rate in East Northport is 77.0 births per 1,000 women. Women with the education attainment of graduate degree have the highest fertility rate of 128.0 births per 1,000 women, while women with the education attainment of college or associate's degree have the lowest fertility at 21.0 births per 1,000 women. Women with the education attainment of graduate degree represent 42.9% of all women with births.
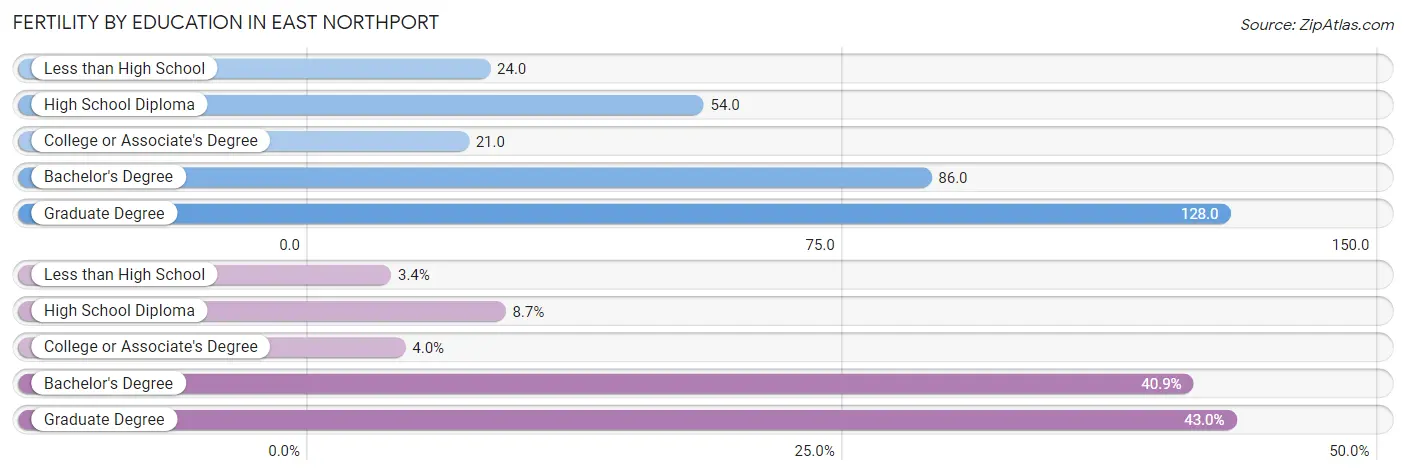
| Educational Attainment | Women with Births | Births / 1,000 Women |
| Less than High School | 10 (3.4%) | 24.0 |
| High School Diploma | 26 (8.7%) | 54.0 |
| College or Associate's Degree | 12 (4.0%) | 21.0 |
| Bachelor's Degree | 122 (40.9%) | 86.0 |
| Graduate Degree | 128 (42.9%) | 128.0 |
| Total | 298 (100.0%) | 77.0 |
Fertility by Education by Marriage Status in East Northport
5.4% of women with births in East Northport are unmarried. Women with the educational attainment of college or associate's degree are most likely to be married with 100.0% of them married at childbirth, while women with the educational attainment of less than high school are least likely to be married with 100.0% of them unmarried at childbirth.
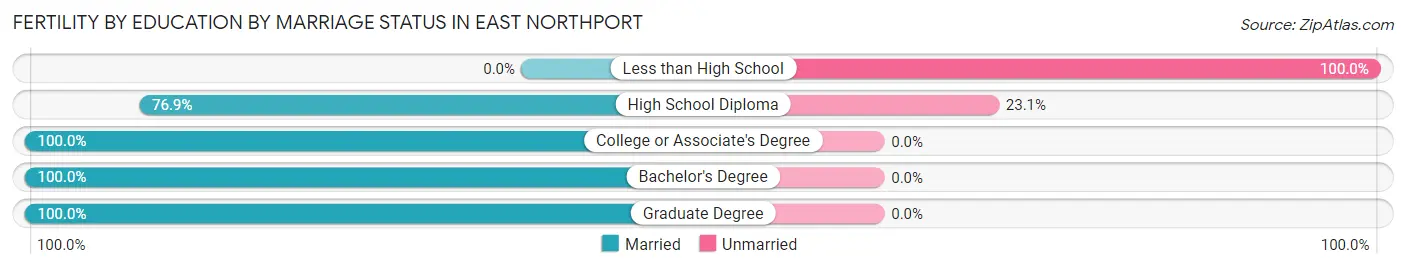
| Educational Attainment | Married | Unmarried |
| Less than High School | 0 (0.0%) | 10 (100.0%) |
| High School Diploma | 20 (76.9%) | 6 (23.1%) |
| College or Associate's Degree | 12 (100.0%) | 0 (0.0%) |
| Bachelor's Degree | 122 (100.0%) | 0 (0.0%) |
| Graduate Degree | 128 (100.0%) | 0 (0.0%) |
| Total | 282 (94.6%) | 16 (5.4%) |
Employment Characteristics in East Northport
Employment by Class of Employer in East Northport
Among the 10,816 employed individuals in East Northport, private company employees (6,709 | 62.0%), local government employees (1,776 | 16.4%), and not-for-profit organizations (1,071 | 9.9%) make up the most common classes of employment.
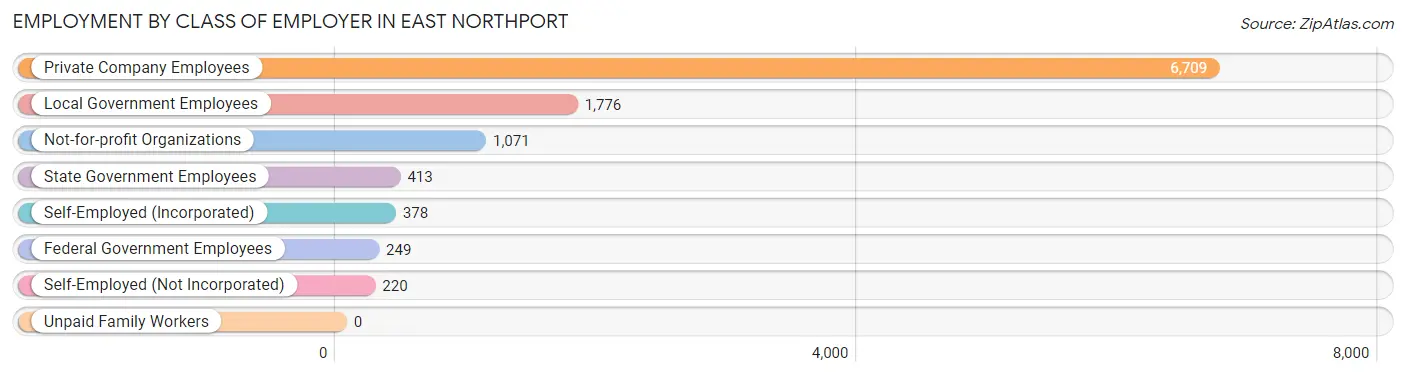
| Employer Class | # Employees | % Employees |
| Private Company Employees | 6,709 | 62.0% |
| Self-Employed (Incorporated) | 378 | 3.5% |
| Self-Employed (Not Incorporated) | 220 | 2.0% |
| Not-for-profit Organizations | 1,071 | 9.9% |
| Local Government Employees | 1,776 | 16.4% |
| State Government Employees | 413 | 3.8% |
| Federal Government Employees | 249 | 2.3% |
| Unpaid Family Workers | 0 | 0.0% |
| Total | 10,816 | 100.0% |
Employment Status by Age in East Northport
According to the labor force statistics for East Northport, out of the total population over 16 years of age (16,249), 71.1% or 11,553 individuals are in the labor force, with 4.4% or 508 of them unemployed. The age group with the highest labor force participation rate is 35 to 44 years, with 91.0% or 2,119 individuals in the labor force. Within the labor force, the 75 years and over age range has the highest percentage of unemployed individuals, with 24.6% or 68 of them being unemployed.
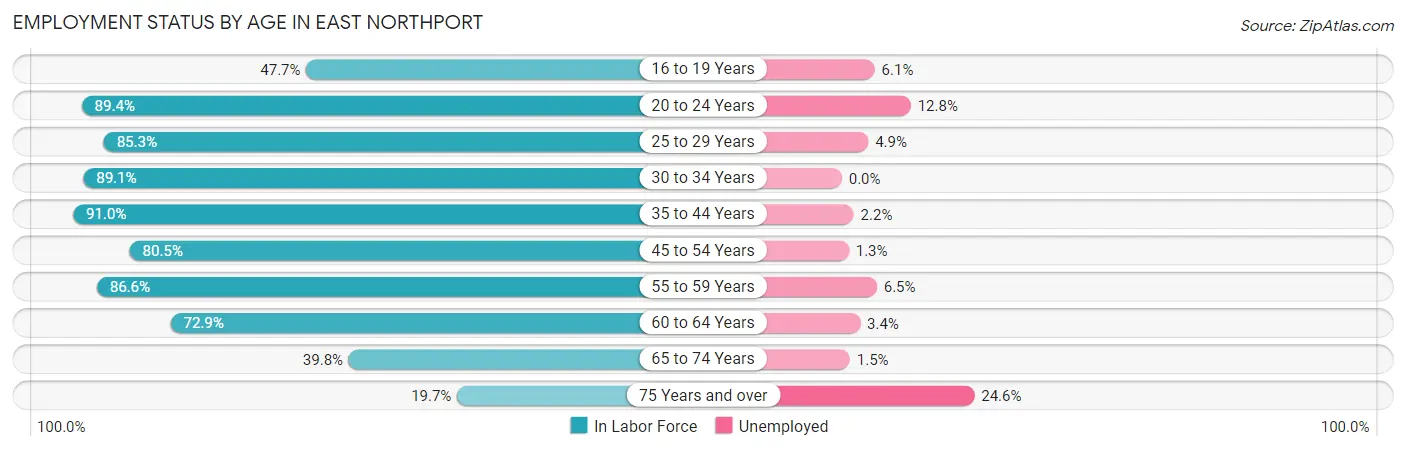
| Age Bracket | In Labor Force | Unemployed |
| 16 to 19 Years | 429 (47.7%) | 26 (6.1%) |
| 20 to 24 Years | 1,120 (89.4%) | 143 (12.8%) |
| 25 to 29 Years | 679 (85.3%) | 33 (4.9%) |
| 30 to 34 Years | 819 (89.1%) | 0 (0.0%) |
| 35 to 44 Years | 2,119 (91.0%) | 47 (2.2%) |
| 45 to 54 Years | 2,384 (80.5%) | 31 (1.3%) |
| 55 to 59 Years | 1,515 (86.6%) | 98 (6.5%) |
| 60 to 64 Years | 1,432 (72.9%) | 49 (3.4%) |
| 65 to 74 Years | 788 (39.8%) | 12 (1.5%) |
| 75 Years and over | 276 (19.7%) | 68 (24.6%) |
| Total | 11,553 (71.1%) | 508 (4.4%) |
Employment Status by Educational Attainment in East Northport
According to labor force statistics for East Northport, 83.5% of individuals (8,950) out of the total population between 25 and 64 years of age (10,719) are in the labor force, with 2.9% or 260 of them being unemployed. The group with the highest labor force participation rate are those with the educational attainment of bachelor's degree or higher, with 88.4% or 5,243 individuals in the labor force. Within the labor force, individuals with high school diploma education have the highest percentage of unemployment, with 11.1% or 135 of them being unemployed.
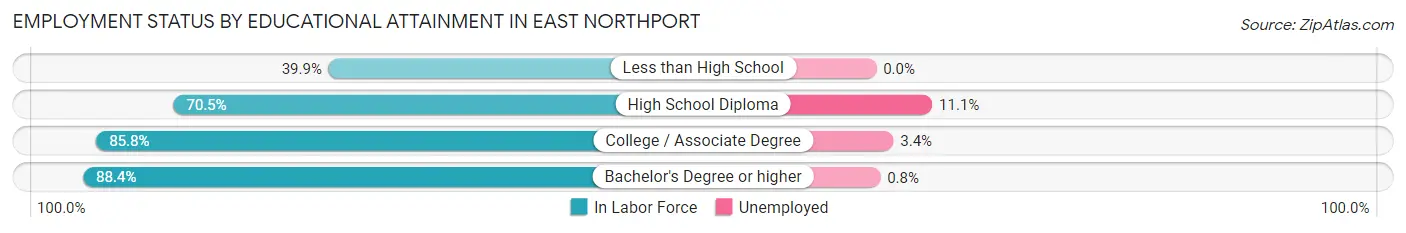
| Educational Attainment | In Labor Force | Unemployed |
| Less than High School | 121 (39.9%) | 0 (0.0%) |
| High School Diploma | 1,212 (70.5%) | 191 (11.1%) |
| College / Associate Degree | 2,373 (85.8%) | 94 (3.4%) |
| Bachelor's Degree or higher | 5,243 (88.4%) | 47 (0.8%) |
| Total | 8,950 (83.5%) | 311 (2.9%) |
Employment Occupations by Sex in East Northport
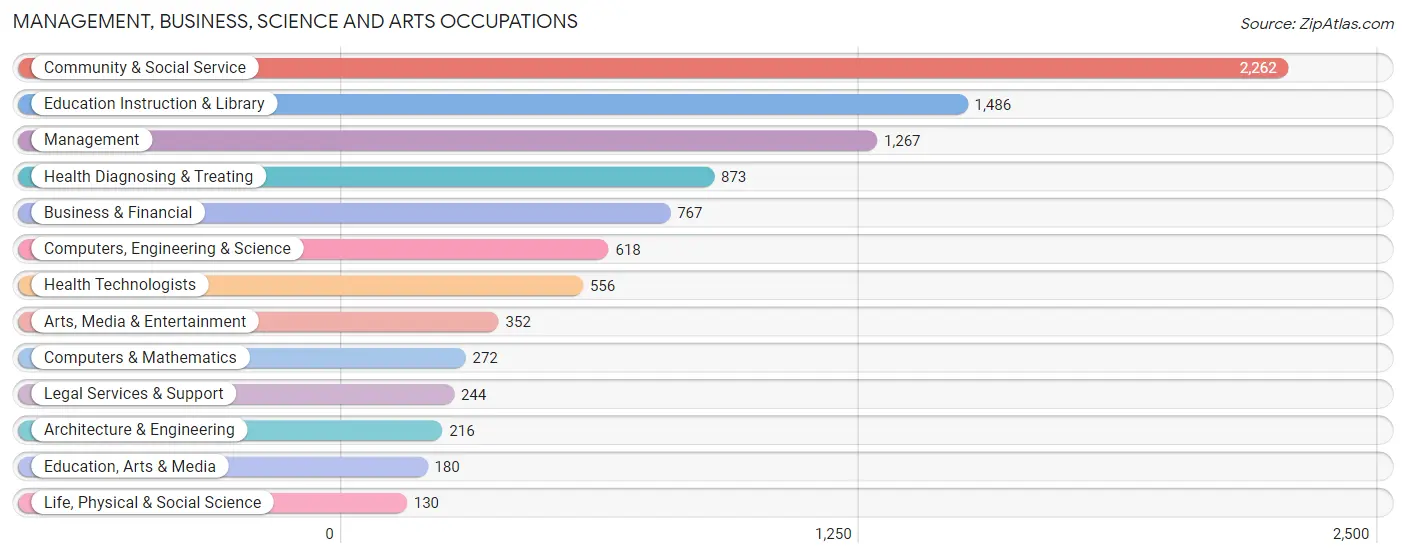
Management, Business, Science and Arts Occupations
The most common Management, Business, Science and Arts occupations in East Northport are Community & Social Service (2,262 | 20.5%), Education Instruction & Library (1,486 | 13.5%), Management (1,267 | 11.5%), Health Diagnosing & Treating (873 | 7.9%), and Business & Financial (767 | 7.0%).
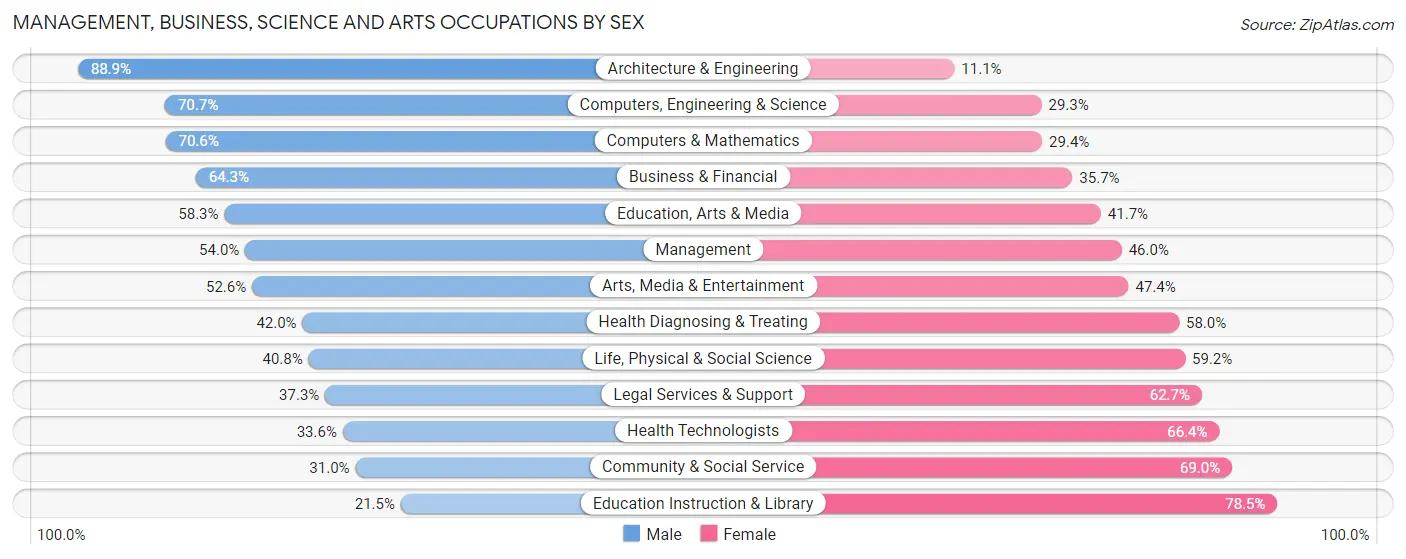
Management, Business, Science and Arts Occupations by Sex
Within the Management, Business, Science and Arts occupations in East Northport, the most male-oriented occupations are Architecture & Engineering (88.9%), Computers, Engineering & Science (70.7%), and Computers & Mathematics (70.6%), while the most female-oriented occupations are Education Instruction & Library (78.5%), Community & Social Service (69.0%), and Health Technologists (66.4%).
| Occupation | Male | Female |
| Management | 684 (54.0%) | 583 (46.0%) |
| Business & Financial | 493 (64.3%) | 274 (35.7%) |
| Computers, Engineering & Science | 437 (70.7%) | 181 (29.3%) |
| Computers & Mathematics | 192 (70.6%) | 80 (29.4%) |
| Architecture & Engineering | 192 (88.9%) | 24 (11.1%) |
| Life, Physical & Social Science | 53 (40.8%) | 77 (59.2%) |
| Community & Social Service | 701 (31.0%) | 1,561 (69.0%) |
| Education, Arts & Media | 105 (58.3%) | 75 (41.7%) |
| Legal Services & Support | 91 (37.3%) | 153 (62.7%) |
| Education Instruction & Library | 320 (21.5%) | 1,166 (78.5%) |
| Arts, Media & Entertainment | 185 (52.6%) | 167 (47.4%) |
| Health Diagnosing & Treating | 367 (42.0%) | 506 (58.0%) |
| Health Technologists | 187 (33.6%) | 369 (66.4%) |
| Total (Category) | 2,682 (46.4%) | 3,105 (53.6%) |
| Total (Overall) | 5,627 (51.0%) | 5,414 (49.0%) |
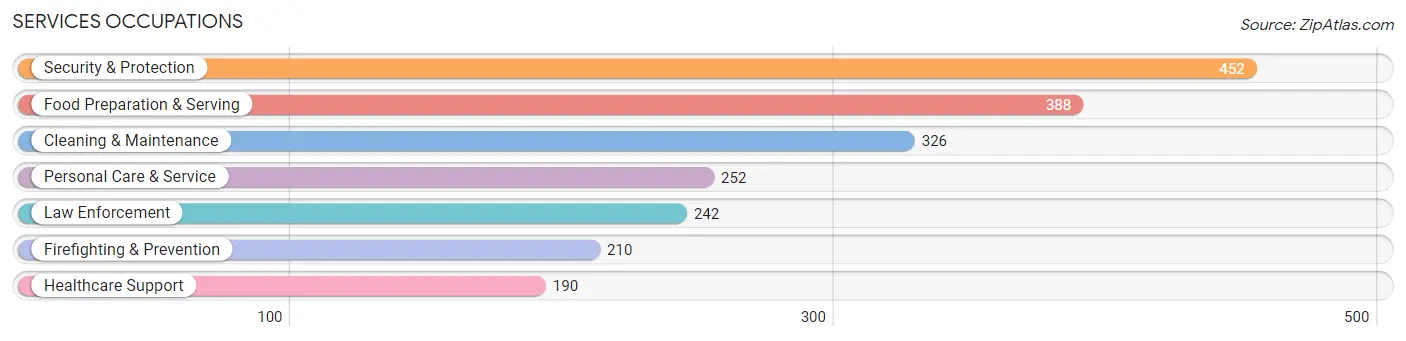
Services Occupations
The most common Services occupations in East Northport are Security & Protection (452 | 4.1%), Food Preparation & Serving (388 | 3.5%), Cleaning & Maintenance (326 | 2.9%), Personal Care & Service (252 | 2.3%), and Law Enforcement (242 | 2.2%).
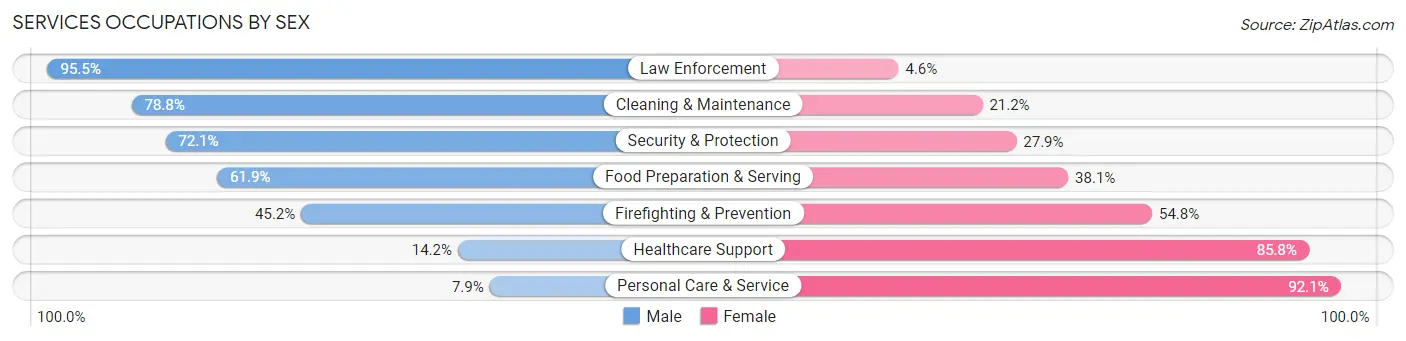
Services Occupations by Sex
Within the Services occupations in East Northport, the most male-oriented occupations are Law Enforcement (95.5%), Cleaning & Maintenance (78.8%), and Security & Protection (72.1%), while the most female-oriented occupations are Personal Care & Service (92.1%), Healthcare Support (85.8%), and Firefighting & Prevention (54.8%).
| Occupation | Male | Female |
| Healthcare Support | 27 (14.2%) | 163 (85.8%) |
| Security & Protection | 326 (72.1%) | 126 (27.9%) |
| Firefighting & Prevention | 95 (45.2%) | 115 (54.8%) |
| Law Enforcement | 231 (95.5%) | 11 (4.5%) |
| Food Preparation & Serving | 240 (61.9%) | 148 (38.1%) |
| Cleaning & Maintenance | 257 (78.8%) | 69 (21.2%) |
| Personal Care & Service | 20 (7.9%) | 232 (92.1%) |
| Total (Category) | 870 (54.1%) | 738 (45.9%) |
| Total (Overall) | 5,627 (51.0%) | 5,414 (49.0%) |
Sales and Office Occupations
The most common Sales and Office occupations in East Northport are Office & Administration (1,370 | 12.4%), and Sales & Related (871 | 7.9%).
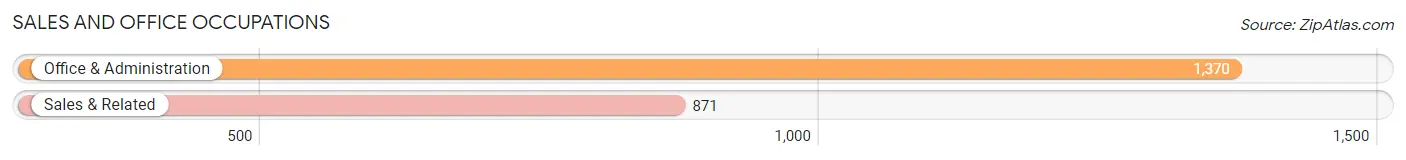
Sales and Office Occupations by Sex

| Occupation | Male | Female |
| Sales & Related | 508 (58.3%) | 363 (41.7%) |
| Office & Administration | 248 (18.1%) | 1,122 (81.9%) |
| Total (Category) | 756 (33.7%) | 1,485 (66.3%) |
| Total (Overall) | 5,627 (51.0%) | 5,414 (49.0%) |
Natural Resources, Construction and Maintenance Occupations
The most common Natural Resources, Construction and Maintenance occupations in East Northport are Construction & Extraction (568 | 5.1%), and Installation, Maintenance & Repair (228 | 2.1%).
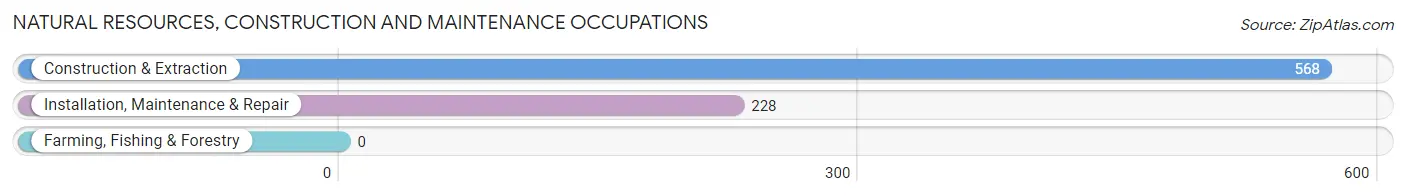
Natural Resources, Construction and Maintenance Occupations by Sex
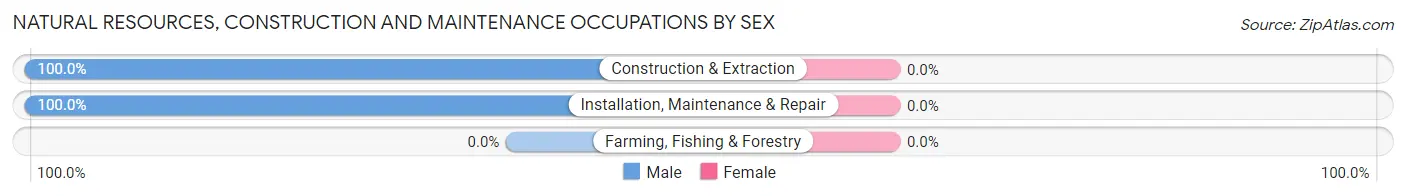
| Occupation | Male | Female |
| Farming, Fishing & Forestry | 0 (0.0%) | 0 (0.0%) |
| Construction & Extraction | 568 (100.0%) | 0 (0.0%) |
| Installation, Maintenance & Repair | 228 (100.0%) | 0 (0.0%) |
| Total (Category) | 796 (100.0%) | 0 (0.0%) |
| Total (Overall) | 5,627 (51.0%) | 5,414 (49.0%) |
Production, Transportation and Moving Occupations
The most common Production, Transportation and Moving occupations in East Northport are Transportation (299 | 2.7%), Production (210 | 1.9%), and Material Moving (100 | 0.9%).
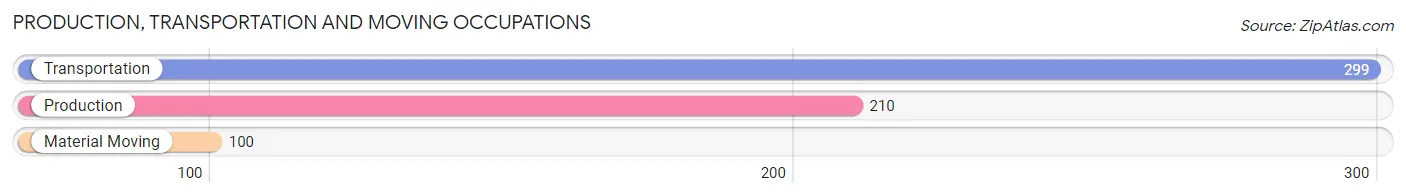
Production, Transportation and Moving Occupations by Sex
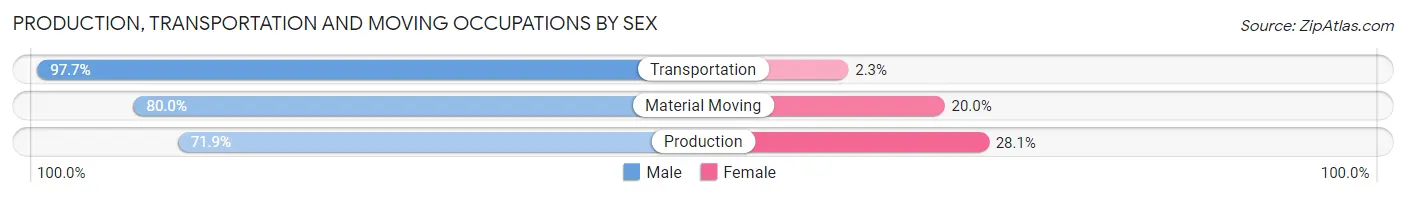
| Occupation | Male | Female |
| Production | 151 (71.9%) | 59 (28.1%) |
| Transportation | 292 (97.7%) | 7 (2.3%) |
| Material Moving | 80 (80.0%) | 20 (20.0%) |
| Total (Category) | 523 (85.9%) | 86 (14.1%) |
| Total (Overall) | 5,627 (51.0%) | 5,414 (49.0%) |
Employment Industries by Sex in East Northport
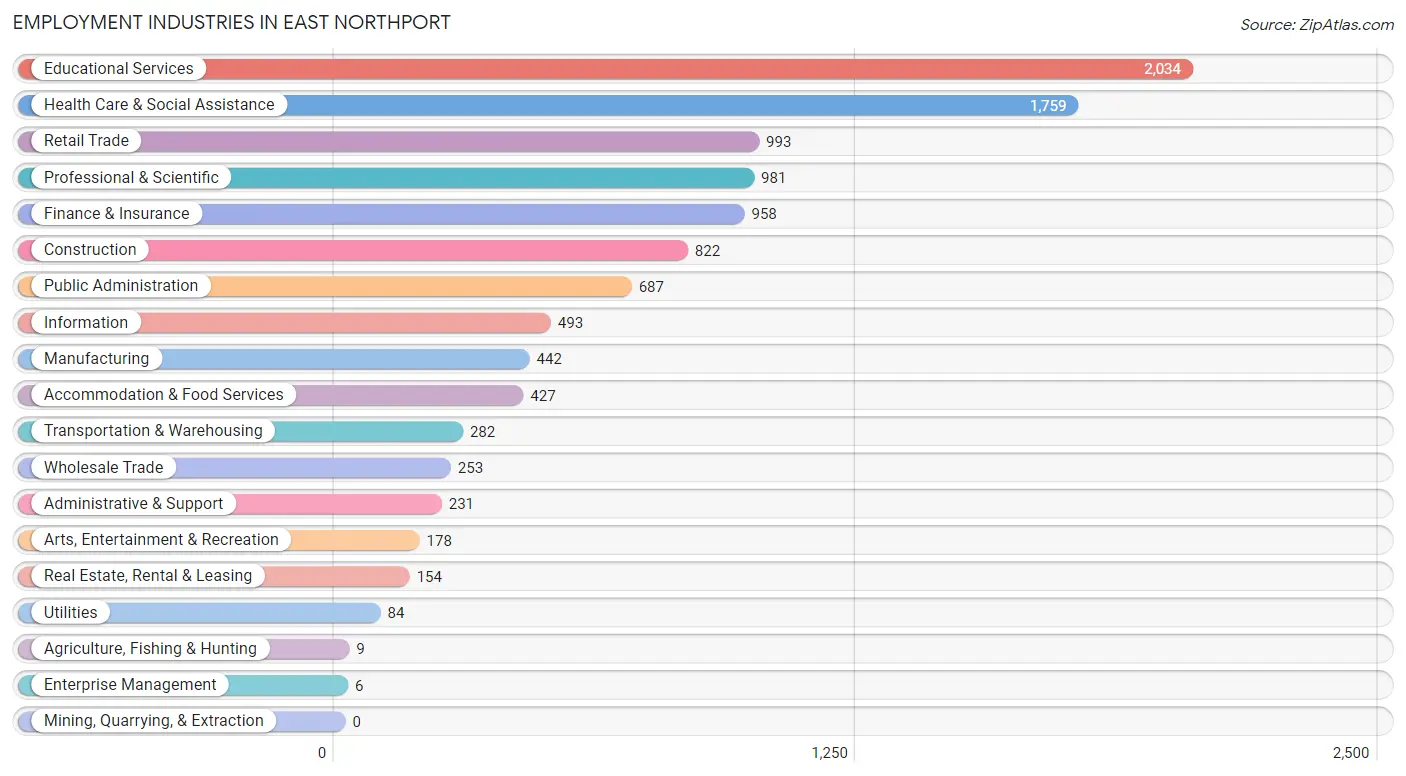
Employment Industries in East Northport
The major employment industries in East Northport include Educational Services (2,034 | 18.4%), Health Care & Social Assistance (1,759 | 15.9%), Retail Trade (993 | 9.0%), Professional & Scientific (981 | 8.9%), and Finance & Insurance (958 | 8.7%).
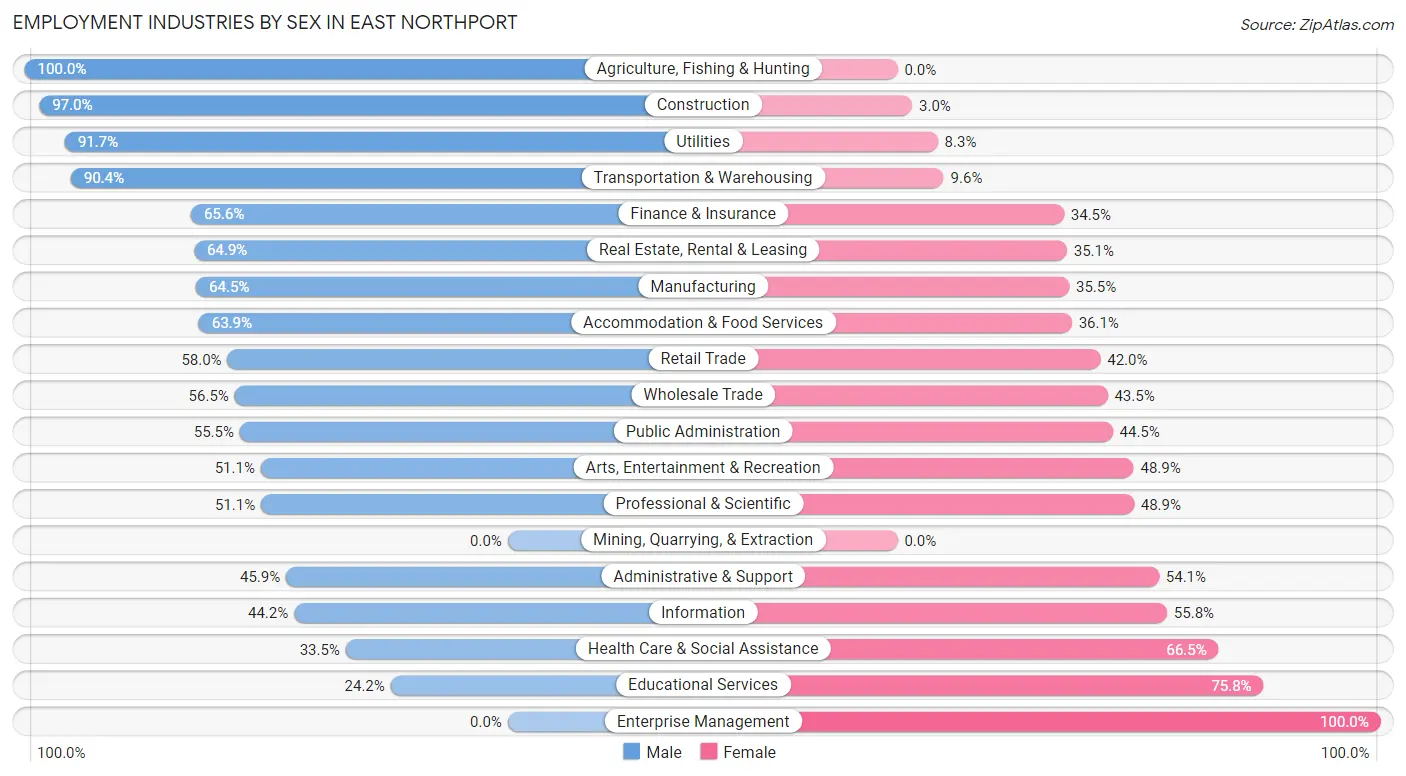
Employment Industries by Sex in East Northport
The East Northport industries that see more men than women are Agriculture, Fishing & Hunting (100.0%), Construction (97.0%), and Utilities (91.7%), whereas the industries that tend to have a higher number of women are Enterprise Management (100.0%), Educational Services (75.8%), and Health Care & Social Assistance (66.5%).
| Industry | Male | Female |
| Agriculture, Fishing & Hunting | 9 (100.0%) | 0 (0.0%) |
| Mining, Quarrying, & Extraction | 0 (0.0%) | 0 (0.0%) |
| Construction | 797 (97.0%) | 25 (3.0%) |
| Manufacturing | 285 (64.5%) | 157 (35.5%) |
| Wholesale Trade | 143 (56.5%) | 110 (43.5%) |
| Retail Trade | 576 (58.0%) | 417 (42.0%) |
| Transportation & Warehousing | 255 (90.4%) | 27 (9.6%) |
| Utilities | 77 (91.7%) | 7 (8.3%) |
| Information | 218 (44.2%) | 275 (55.8%) |
| Finance & Insurance | 628 (65.5%) | 330 (34.4%) |
| Real Estate, Rental & Leasing | 100 (64.9%) | 54 (35.1%) |
| Professional & Scientific | 501 (51.1%) | 480 (48.9%) |
| Enterprise Management | 0 (0.0%) | 6 (100.0%) |
| Administrative & Support | 106 (45.9%) | 125 (54.1%) |
| Educational Services | 493 (24.2%) | 1,541 (75.8%) |
| Health Care & Social Assistance | 590 (33.5%) | 1,169 (66.5%) |
| Arts, Entertainment & Recreation | 91 (51.1%) | 87 (48.9%) |
| Accommodation & Food Services | 273 (63.9%) | 154 (36.1%) |
| Public Administration | 381 (55.5%) | 306 (44.5%) |
| Total | 5,627 (51.0%) | 5,414 (49.0%) |
Education in East Northport
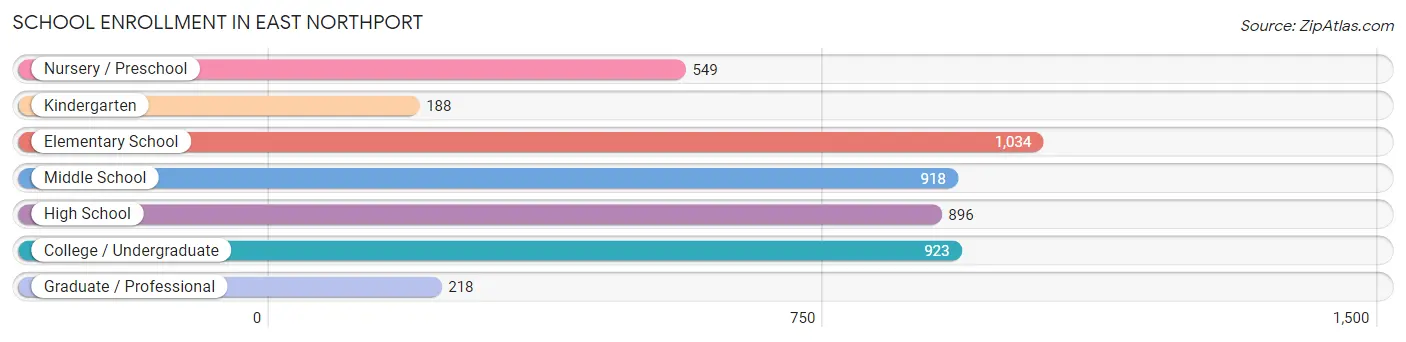
School Enrollment in East Northport
The most common levels of schooling among the 4,726 students in East Northport are elementary school (1,034 | 21.9%), college / undergraduate (923 | 19.5%), and middle school (918 | 19.4%).
| School Level | # Students | % Students |
| Nursery / Preschool | 549 | 11.6% |
| Kindergarten | 188 | 4.0% |
| Elementary School | 1,034 | 21.9% |
| Middle School | 918 | 19.4% |
| High School | 896 | 19.0% |
| College / Undergraduate | 923 | 19.5% |
| Graduate / Professional | 218 | 4.6% |
| Total | 4,726 | 100.0% |
School Enrollment by Age by Funding Source in East Northport
Out of a total of 4,726 students who are enrolled in schools in East Northport, 1,182 (25.0%) attend a private institution, while the remaining 3,544 (75.0%) are enrolled in public schools. The age group of 3 to 4 year olds has the highest likelihood of being enrolled in private schools, with 369 (84.6% in the age bracket) enrolled. Conversely, the age group of 15 to 17 year olds has the lowest likelihood of being enrolled in a private school, with 695 (100.0% in the age bracket) attending a public institution.
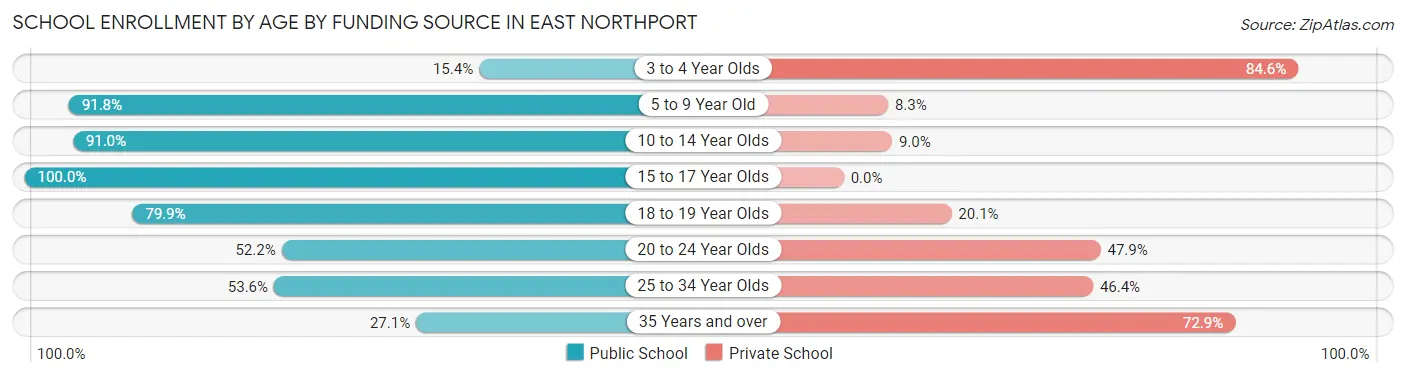
| Age Bracket | Public School | Private School |
| 3 to 4 Year Olds | 67 (15.4%) | 369 (84.6%) |
| 5 to 9 Year Old | 1,279 (91.7%) | 115 (8.3%) |
| 10 to 14 Year Olds | 859 (91.0%) | 85 (9.0%) |
| 15 to 17 Year Olds | 695 (100.0%) | 0 (0.0%) |
| 18 to 19 Year Olds | 223 (79.9%) | 56 (20.1%) |
| 20 to 24 Year Olds | 230 (52.1%) | 211 (47.8%) |
| 25 to 34 Year Olds | 90 (53.6%) | 78 (46.4%) |
| 35 Years and over | 100 (27.1%) | 269 (72.9%) |
| Total | 3,544 (75.0%) | 1,182 (25.0%) |
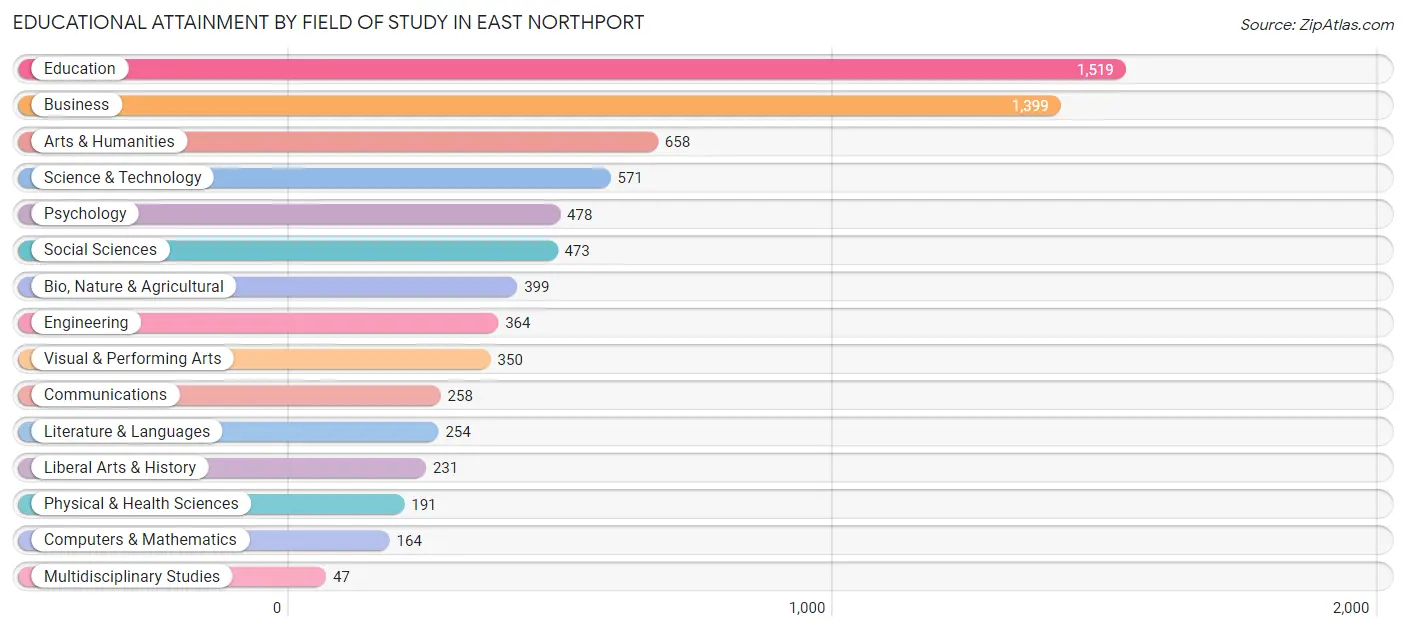
Educational Attainment by Field of Study in East Northport
Education (1,519 | 20.6%), business (1,399 | 19.0%), arts & humanities (658 | 8.9%), science & technology (571 | 7.8%), and psychology (478 | 6.5%) are the most common fields of study among 7,356 individuals in East Northport who have obtained a bachelor's degree or higher.
| Field of Study | # Graduates | % Graduates |
| Computers & Mathematics | 164 | 2.2% |
| Bio, Nature & Agricultural | 399 | 5.4% |
| Physical & Health Sciences | 191 | 2.6% |
| Psychology | 478 | 6.5% |
| Social Sciences | 473 | 6.4% |
| Engineering | 364 | 5.0% |
| Multidisciplinary Studies | 47 | 0.6% |
| Science & Technology | 571 | 7.8% |
| Business | 1,399 | 19.0% |
| Education | 1,519 | 20.6% |
| Literature & Languages | 254 | 3.5% |
| Liberal Arts & History | 231 | 3.1% |
| Visual & Performing Arts | 350 | 4.8% |
| Communications | 258 | 3.5% |
| Arts & Humanities | 658 | 8.9% |
| Total | 7,356 | 100.0% |
Transportation & Commute in East Northport
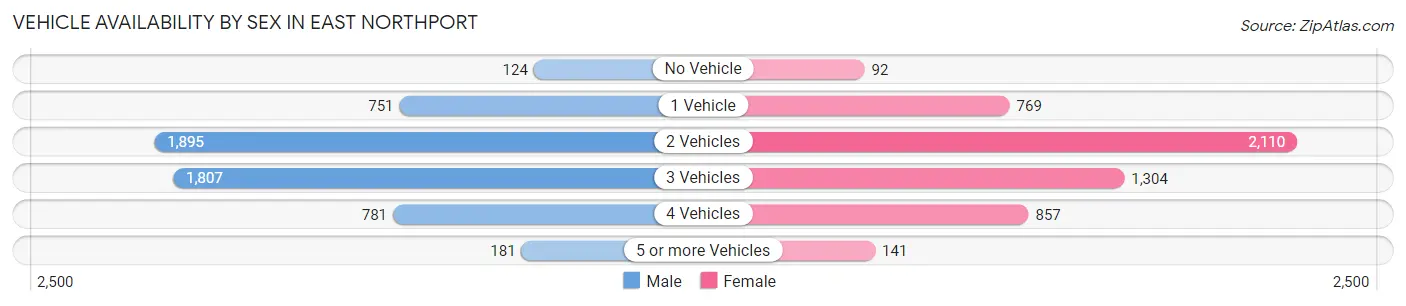
Vehicle Availability by Sex in East Northport
The most prevalent vehicle ownership categories in East Northport are males with 2 vehicles (1,895, accounting for 34.2%) and females with 2 vehicles (2,110, making up 35.9%).
| Vehicles Available | Male | Female |
| No Vehicle | 124 (2.2%) | 92 (1.7%) |
| 1 Vehicle | 751 (13.6%) | 769 (14.6%) |
| 2 Vehicles | 1,895 (34.2%) | 2,110 (40.0%) |
| 3 Vehicles | 1,807 (32.6%) | 1,304 (24.7%) |
| 4 Vehicles | 781 (14.1%) | 857 (16.3%) |
| 5 or more Vehicles | 181 (3.3%) | 141 (2.7%) |
| Total | 5,539 (100.0%) | 5,273 (100.0%) |
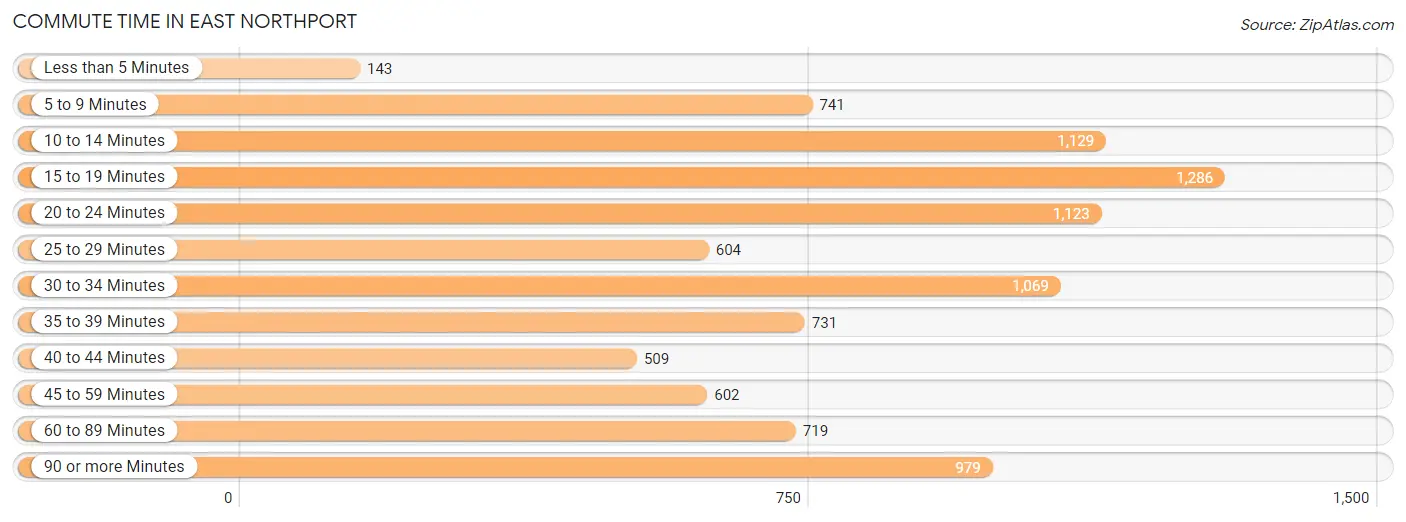
Commute Time in East Northport
The most frequently occuring commute durations in East Northport are 15 to 19 minutes (1,286 commuters, 13.4%), 10 to 14 minutes (1,129 commuters, 11.7%), and 20 to 24 minutes (1,123 commuters, 11.7%).
| Commute Time | # Commuters | % Commuters |
| Less than 5 Minutes | 143 | 1.5% |
| 5 to 9 Minutes | 741 | 7.7% |
| 10 to 14 Minutes | 1,129 | 11.7% |
| 15 to 19 Minutes | 1,286 | 13.4% |
| 20 to 24 Minutes | 1,123 | 11.7% |
| 25 to 29 Minutes | 604 | 6.3% |
| 30 to 34 Minutes | 1,069 | 11.1% |
| 35 to 39 Minutes | 731 | 7.6% |
| 40 to 44 Minutes | 509 | 5.3% |
| 45 to 59 Minutes | 602 | 6.2% |
| 60 to 89 Minutes | 719 | 7.5% |
| 90 or more Minutes | 979 | 10.2% |
Commute Time by Sex in East Northport
The most common commute times in East Northport are 30 to 34 minutes (725 commuters, 14.4%) for males and 10 to 14 minutes (925 commuters, 20.2%) for females.
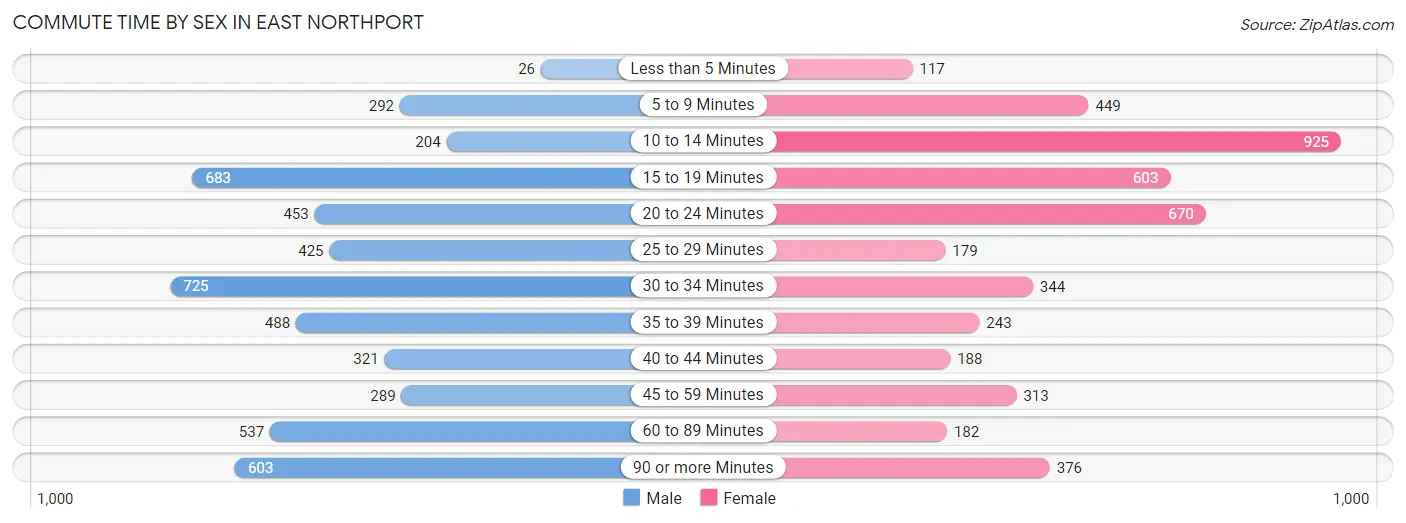
| Commute Time | Male | Female |
| Less than 5 Minutes | 26 (0.5%) | 117 (2.5%) |
| 5 to 9 Minutes | 292 (5.8%) | 449 (9.8%) |
| 10 to 14 Minutes | 204 (4.0%) | 925 (20.2%) |
| 15 to 19 Minutes | 683 (13.5%) | 603 (13.1%) |
| 20 to 24 Minutes | 453 (9.0%) | 670 (14.6%) |
| 25 to 29 Minutes | 425 (8.4%) | 179 (3.9%) |
| 30 to 34 Minutes | 725 (14.4%) | 344 (7.5%) |
| 35 to 39 Minutes | 488 (9.7%) | 243 (5.3%) |
| 40 to 44 Minutes | 321 (6.4%) | 188 (4.1%) |
| 45 to 59 Minutes | 289 (5.7%) | 313 (6.8%) |
| 60 to 89 Minutes | 537 (10.6%) | 182 (4.0%) |
| 90 or more Minutes | 603 (11.9%) | 376 (8.2%) |
Time of Departure to Work by Sex in East Northport
The most frequent times of departure to work in East Northport are 7:30 AM to 7:59 AM (794, 15.7%) for males and 8:30 AM to 8:59 AM (787, 17.2%) for females.
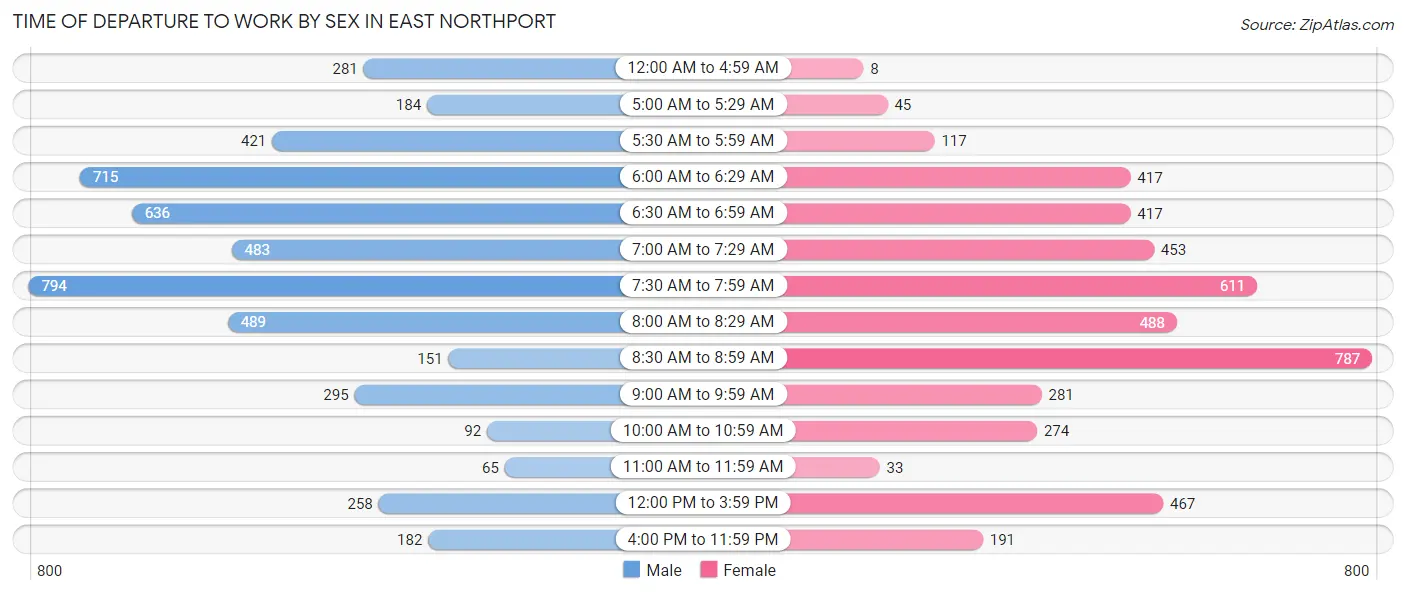
| Time of Departure | Male | Female |
| 12:00 AM to 4:59 AM | 281 (5.6%) | 8 (0.2%) |
| 5:00 AM to 5:29 AM | 184 (3.6%) | 45 (1.0%) |
| 5:30 AM to 5:59 AM | 421 (8.3%) | 117 (2.5%) |
| 6:00 AM to 6:29 AM | 715 (14.2%) | 417 (9.1%) |
| 6:30 AM to 6:59 AM | 636 (12.6%) | 417 (9.1%) |
| 7:00 AM to 7:29 AM | 483 (9.6%) | 453 (9.9%) |
| 7:30 AM to 7:59 AM | 794 (15.7%) | 611 (13.3%) |
| 8:00 AM to 8:29 AM | 489 (9.7%) | 488 (10.6%) |
| 8:30 AM to 8:59 AM | 151 (3.0%) | 787 (17.2%) |
| 9:00 AM to 9:59 AM | 295 (5.9%) | 281 (6.1%) |
| 10:00 AM to 10:59 AM | 92 (1.8%) | 274 (6.0%) |
| 11:00 AM to 11:59 AM | 65 (1.3%) | 33 (0.7%) |
| 12:00 PM to 3:59 PM | 258 (5.1%) | 467 (10.2%) |
| 4:00 PM to 11:59 PM | 182 (3.6%) | 191 (4.2%) |
| Total | 5,046 (100.0%) | 4,589 (100.0%) |
Housing Occupancy in East Northport
Occupancy by Ownership in East Northport
Of the total 7,199 dwellings in East Northport, owner-occupied units account for 6,408 (89.0%), while renter-occupied units make up 791 (11.0%).
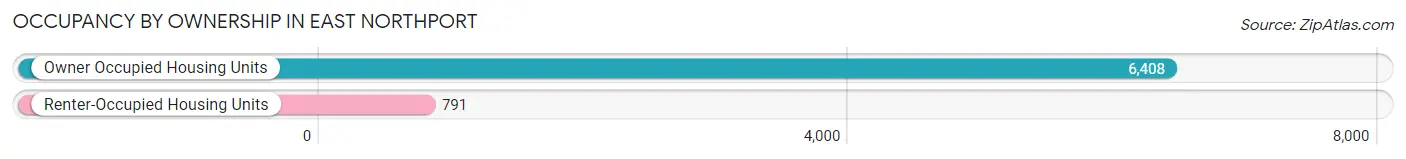
| Occupancy | # Housing Units | % Housing Units |
| Owner Occupied Housing Units | 6,408 | 89.0% |
| Renter-Occupied Housing Units | 791 | 11.0% |
| Total Occupied Housing Units | 7,199 | 100.0% |
Occupancy by Household Size in East Northport
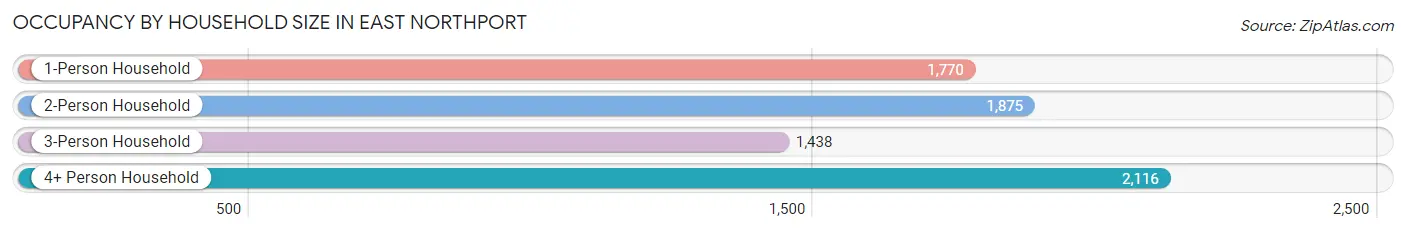
| Household Size | # Housing Units | % Housing Units |
| 1-Person Household | 1,770 | 24.6% |
| 2-Person Household | 1,875 | 26.1% |
| 3-Person Household | 1,438 | 20.0% |
| 4+ Person Household | 2,116 | 29.4% |
| Total Housing Units | 7,199 | 100.0% |
Occupancy by Ownership by Household Size in East Northport
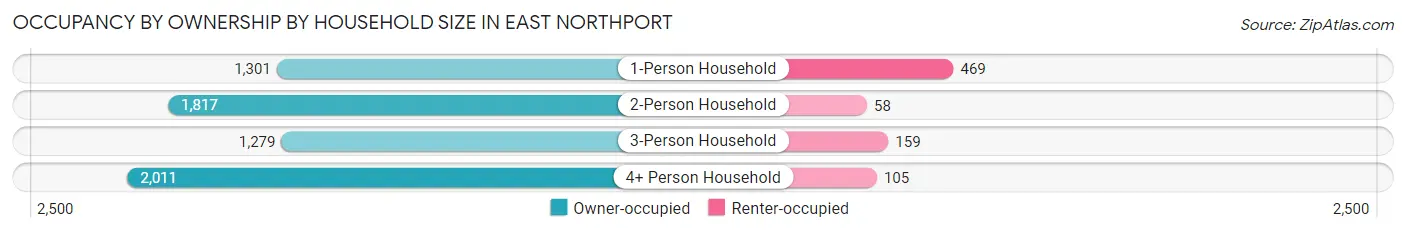
| Household Size | Owner-occupied | Renter-occupied |
| 1-Person Household | 1,301 (73.5%) | 469 (26.5%) |
| 2-Person Household | 1,817 (96.9%) | 58 (3.1%) |
| 3-Person Household | 1,279 (88.9%) | 159 (11.1%) |
| 4+ Person Household | 2,011 (95.0%) | 105 (5.0%) |
| Total Housing Units | 6,408 (89.0%) | 791 (11.0%) |
Occupancy by Educational Attainment in East Northport
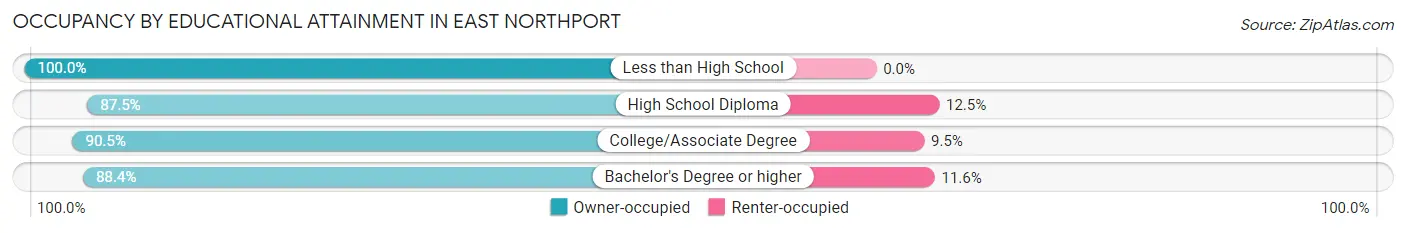
| Household Size | Owner-occupied | Renter-occupied |
| Less than High School | 143 (100.0%) | 0 (0.0%) |
| High School Diploma | 1,307 (87.5%) | 186 (12.5%) |
| College/Associate Degree | 1,722 (90.5%) | 181 (9.5%) |
| Bachelor's Degree or higher | 3,236 (88.4%) | 424 (11.6%) |
Occupancy by Age of Householder in East Northport
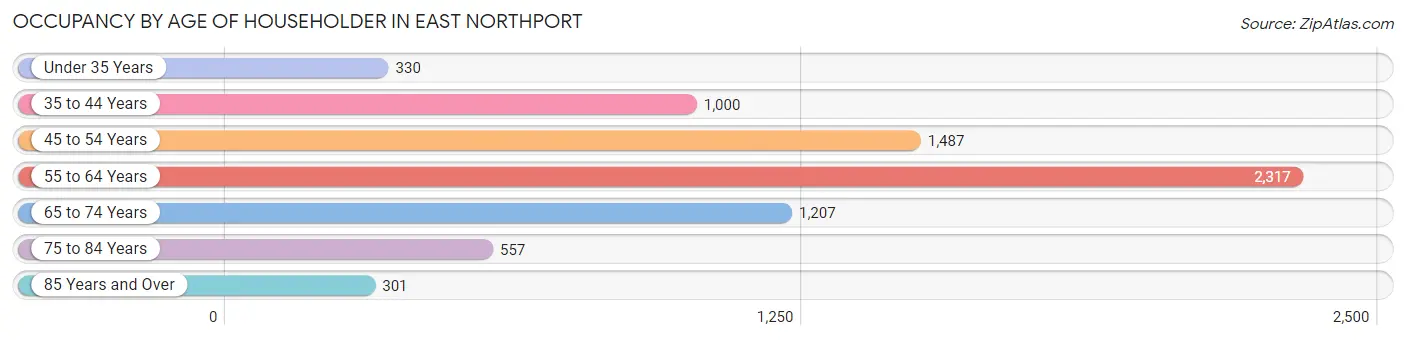
| Age Bracket | # Households | % Households |
| Under 35 Years | 330 | 4.6% |
| 35 to 44 Years | 1,000 | 13.9% |
| 45 to 54 Years | 1,487 | 20.7% |
| 55 to 64 Years | 2,317 | 32.2% |
| 65 to 74 Years | 1,207 | 16.8% |
| 75 to 84 Years | 557 | 7.7% |
| 85 Years and Over | 301 | 4.2% |
| Total | 7,199 | 100.0% |
Housing Finances in East Northport
Median Income by Occupancy in East Northport
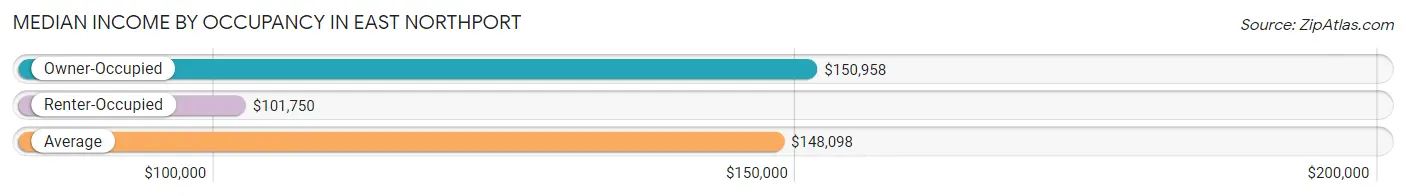
| Occupancy Type | # Households | Median Income |
| Owner-Occupied | 6,408 (89.0%) | $150,958 |
| Renter-Occupied | 791 (11.0%) | $101,750 |
| Average | 7,199 (100.0%) | $148,098 |
Occupancy by Householder Income Bracket in East Northport
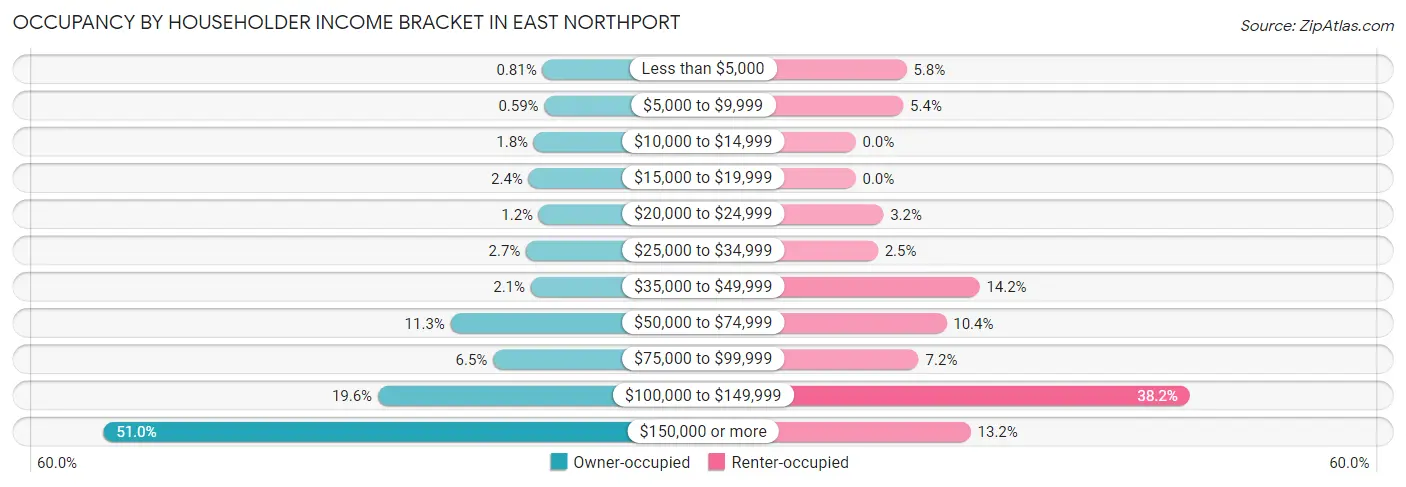
| Income Bracket | Owner-occupied | Renter-occupied |
| Less than $5,000 | 52 (0.8%) | 46 (5.8%) |
| $5,000 to $9,999 | 38 (0.6%) | 43 (5.4%) |
| $10,000 to $14,999 | 115 (1.8%) | 0 (0.0%) |
| $15,000 to $19,999 | 153 (2.4%) | 0 (0.0%) |
| $20,000 to $24,999 | 78 (1.2%) | 25 (3.2%) |
| $25,000 to $34,999 | 172 (2.7%) | 20 (2.5%) |
| $35,000 to $49,999 | 137 (2.1%) | 112 (14.2%) |
| $50,000 to $74,999 | 725 (11.3%) | 82 (10.4%) |
| $75,000 to $99,999 | 413 (6.5%) | 57 (7.2%) |
| $100,000 to $149,999 | 1,257 (19.6%) | 302 (38.2%) |
| $150,000 or more | 3,268 (51.0%) | 104 (13.2%) |
| Total | 6,408 (100.0%) | 791 (100.0%) |
Monthly Housing Cost Tiers in East Northport
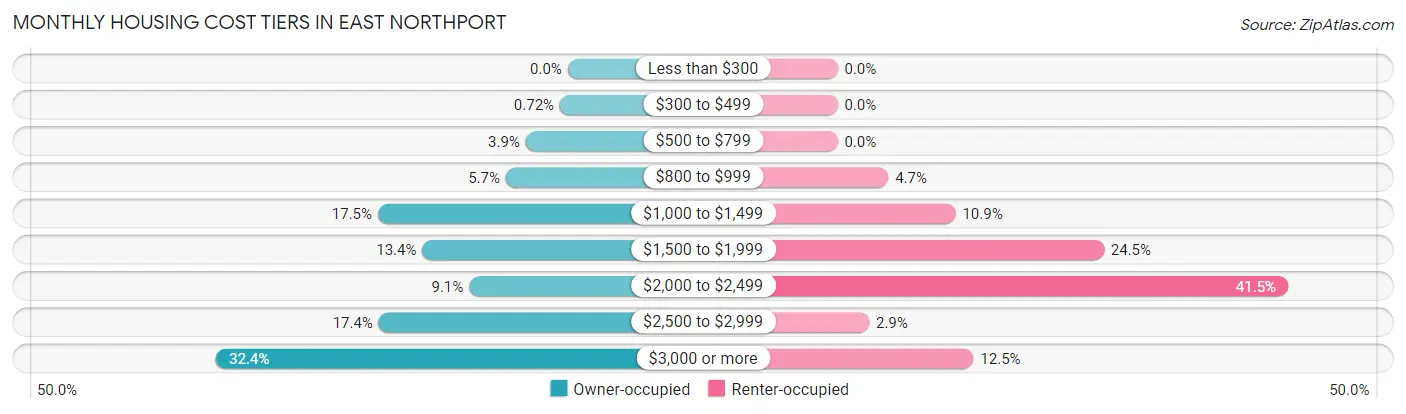
| Monthly Cost | Owner-occupied | Renter-occupied |
| Less than $300 | 0 (0.0%) | 0 (0.0%) |
| $300 to $499 | 46 (0.7%) | 0 (0.0%) |
| $500 to $799 | 248 (3.9%) | 0 (0.0%) |
| $800 to $999 | 365 (5.7%) | 37 (4.7%) |
| $1,000 to $1,499 | 1,120 (17.5%) | 86 (10.9%) |
| $1,500 to $1,999 | 858 (13.4%) | 194 (24.5%) |
| $2,000 to $2,499 | 582 (9.1%) | 328 (41.5%) |
| $2,500 to $2,999 | 1,115 (17.4%) | 23 (2.9%) |
| $3,000 or more | 2,074 (32.4%) | 99 (12.5%) |
| Total | 6,408 (100.0%) | 791 (100.0%) |
Physical Housing Characteristics in East Northport
Housing Structures in East Northport
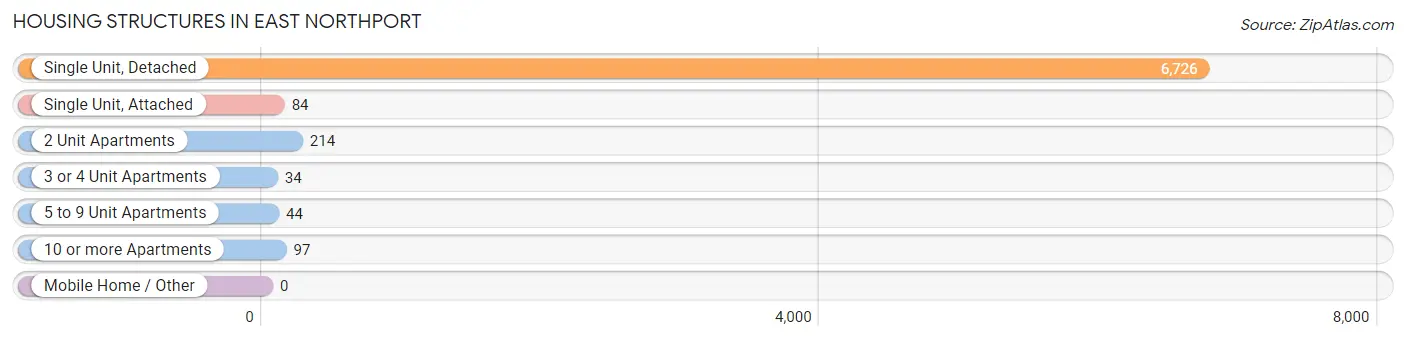
| Structure Type | # Housing Units | % Housing Units |
| Single Unit, Detached | 6,726 | 93.4% |
| Single Unit, Attached | 84 | 1.2% |
| 2 Unit Apartments | 214 | 3.0% |
| 3 or 4 Unit Apartments | 34 | 0.5% |
| 5 to 9 Unit Apartments | 44 | 0.6% |
| 10 or more Apartments | 97 | 1.3% |
| Mobile Home / Other | 0 | 0.0% |
| Total | 7,199 | 100.0% |
Housing Structures by Occupancy in East Northport
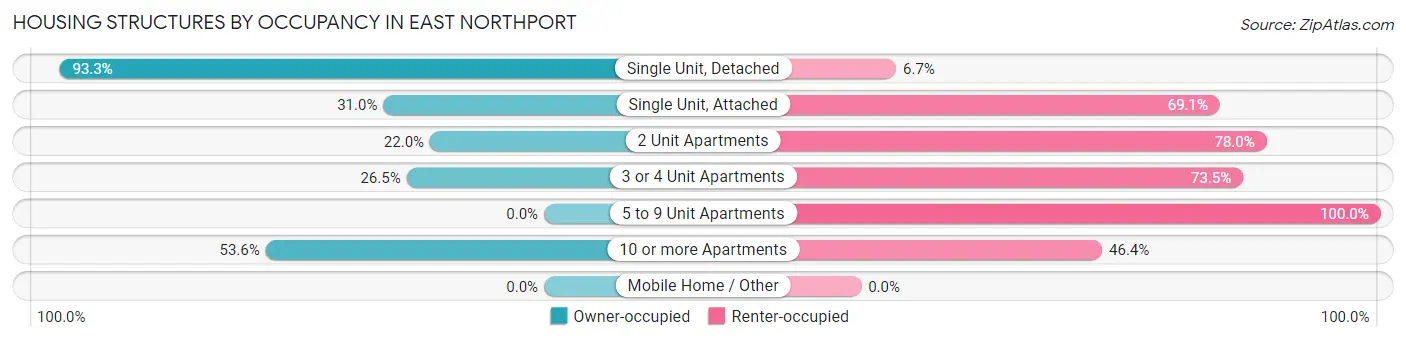
| Structure Type | Owner-occupied | Renter-occupied |
| Single Unit, Detached | 6,274 (93.3%) | 452 (6.7%) |
| Single Unit, Attached | 26 (30.9%) | 58 (69.1%) |
| 2 Unit Apartments | 47 (22.0%) | 167 (78.0%) |
| 3 or 4 Unit Apartments | 9 (26.5%) | 25 (73.5%) |
| 5 to 9 Unit Apartments | 0 (0.0%) | 44 (100.0%) |
| 10 or more Apartments | 52 (53.6%) | 45 (46.4%) |
| Mobile Home / Other | 0 (0.0%) | 0 (0.0%) |
| Total | 6,408 (89.0%) | 791 (11.0%) |
Housing Structures by Number of Rooms in East Northport
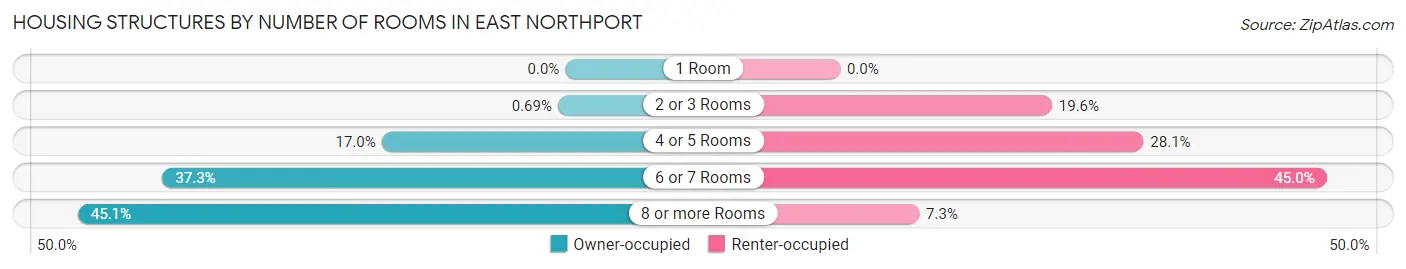
| Number of Rooms | Owner-occupied | Renter-occupied |
| 1 Room | 0 (0.0%) | 0 (0.0%) |
| 2 or 3 Rooms | 44 (0.7%) | 155 (19.6%) |
| 4 or 5 Rooms | 1,089 (17.0%) | 222 (28.1%) |
| 6 or 7 Rooms | 2,387 (37.2%) | 356 (45.0%) |
| 8 or more Rooms | 2,888 (45.1%) | 58 (7.3%) |
| Total | 6,408 (100.0%) | 791 (100.0%) |
Housing Structure by Heating Type in East Northport
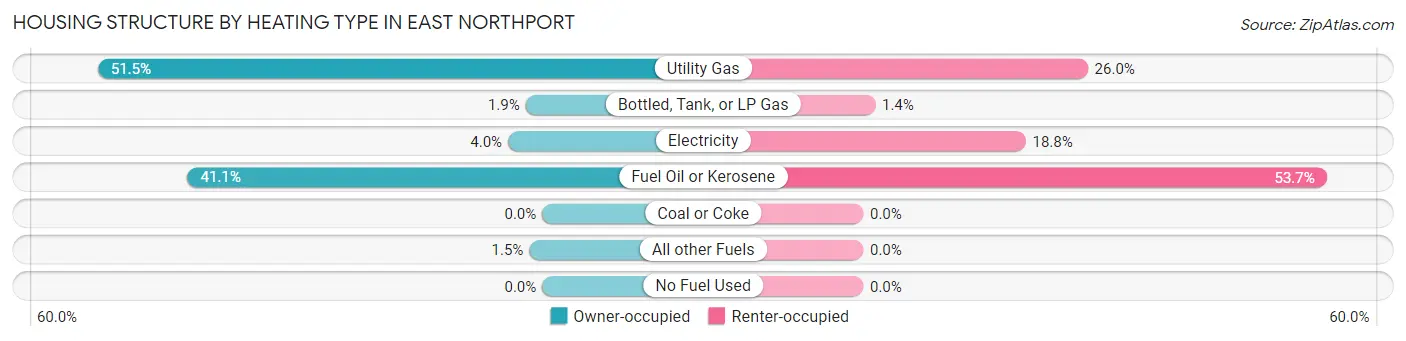
| Heating Type | Owner-occupied | Renter-occupied |
| Utility Gas | 3,301 (51.5%) | 206 (26.0%) |
| Bottled, Tank, or LP Gas | 123 (1.9%) | 11 (1.4%) |
| Electricity | 254 (4.0%) | 149 (18.8%) |
| Fuel Oil or Kerosene | 2,634 (41.1%) | 425 (53.7%) |
| Coal or Coke | 0 (0.0%) | 0 (0.0%) |
| All other Fuels | 96 (1.5%) | 0 (0.0%) |
| No Fuel Used | 0 (0.0%) | 0 (0.0%) |
| Total | 6,408 (100.0%) | 791 (100.0%) |
Household Vehicle Usage in East Northport
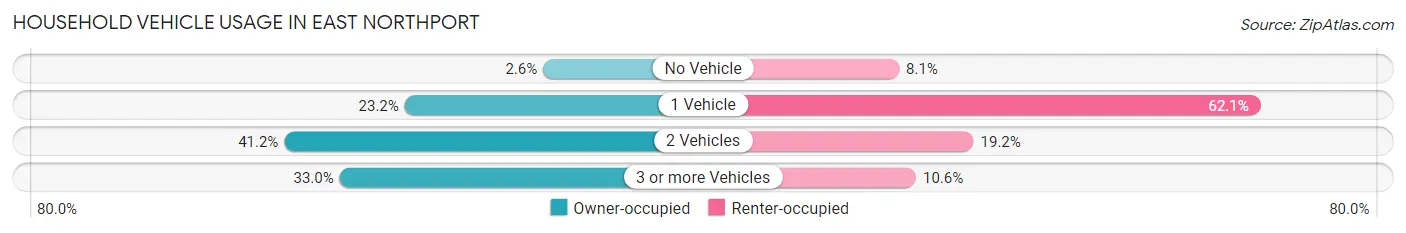
| Vehicles per Household | Owner-occupied | Renter-occupied |
| No Vehicle | 165 (2.6%) | 64 (8.1%) |
| 1 Vehicle | 1,489 (23.2%) | 491 (62.1%) |
| 2 Vehicles | 2,642 (41.2%) | 152 (19.2%) |
| 3 or more Vehicles | 2,112 (33.0%) | 84 (10.6%) |
| Total | 6,408 (100.0%) | 791 (100.0%) |
Real Estate & Mortgages in East Northport
Real Estate and Mortgage Overview in East Northport
| Characteristic | Without Mortgage | With Mortgage |
| Housing Units | 2,380 | 4,028 |
| Median Property Value | $582,300 | $585,000 |
| Median Household Income | $107,683 | $2,376 |
| Monthly Housing Costs | $1,229 | $2,059 |
| Real Estate Taxes | $9,167 | $79 |
Property Value by Mortgage Status in East Northport
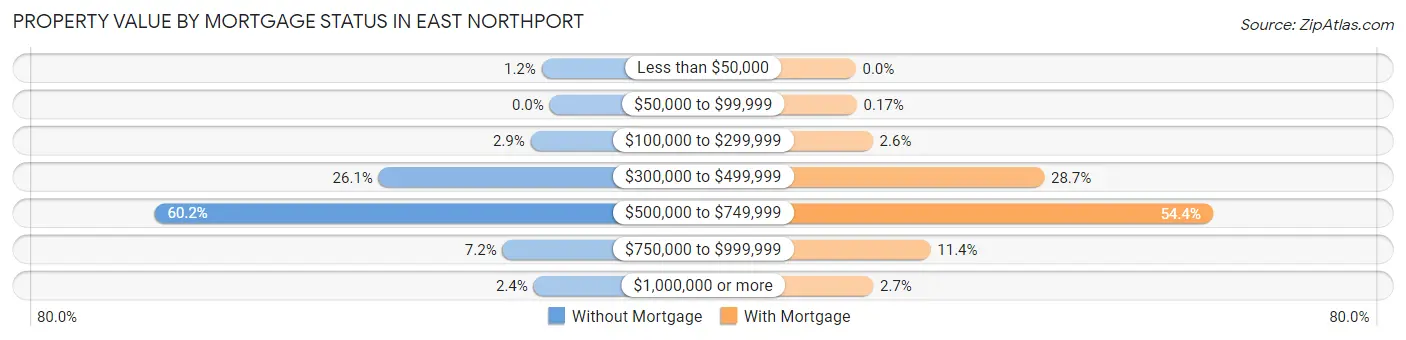
| Property Value | Without Mortgage | With Mortgage |
| Less than $50,000 | 29 (1.2%) | 0 (0.0%) |
| $50,000 to $99,999 | 0 (0.0%) | 7 (0.2%) |
| $100,000 to $299,999 | 69 (2.9%) | 105 (2.6%) |
| $300,000 to $499,999 | 620 (26.1%) | 1,157 (28.7%) |
| $500,000 to $749,999 | 1,433 (60.2%) | 2,192 (54.4%) |
| $750,000 to $999,999 | 171 (7.2%) | 459 (11.4%) |
| $1,000,000 or more | 58 (2.4%) | 108 (2.7%) |
| Total | 2,380 (100.0%) | 4,028 (100.0%) |
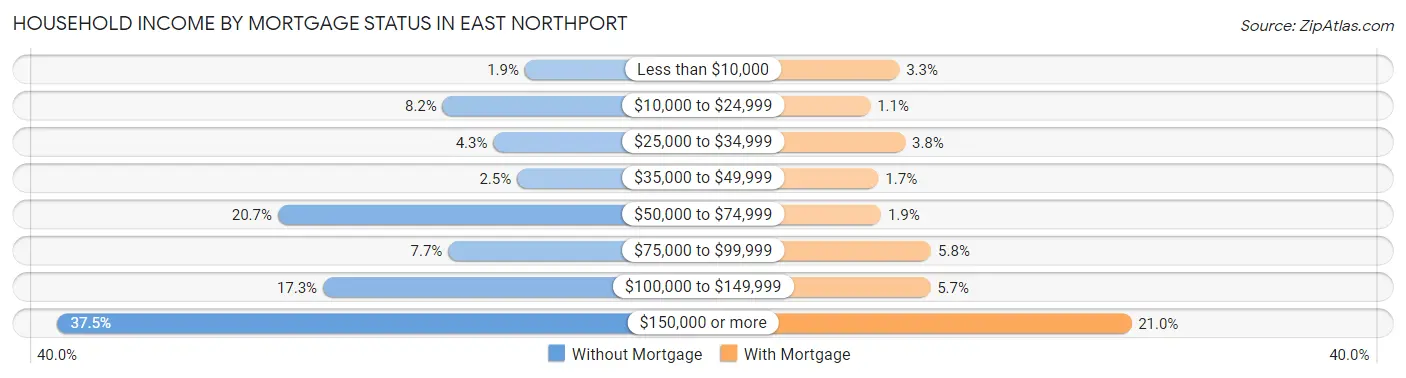
Household Income by Mortgage Status in East Northport
| Household Income | Without Mortgage | With Mortgage |
| Less than $10,000 | 45 (1.9%) | 134 (3.3%) |
| $10,000 to $24,999 | 194 (8.2%) | 45 (1.1%) |
| $25,000 to $34,999 | 102 (4.3%) | 152 (3.8%) |
| $35,000 to $49,999 | 59 (2.5%) | 70 (1.7%) |
| $50,000 to $74,999 | 493 (20.7%) | 78 (1.9%) |
| $75,000 to $99,999 | 184 (7.7%) | 232 (5.8%) |
| $100,000 to $149,999 | 411 (17.3%) | 229 (5.7%) |
| $150,000 or more | 892 (37.5%) | 846 (21.0%) |
| Total | 2,380 (100.0%) | 4,028 (100.0%) |
Property Value to Household Income Ratio in East Northport
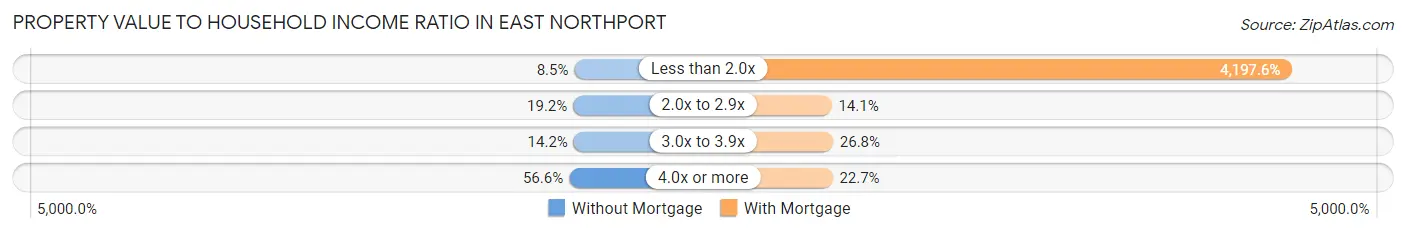
| Value-to-Income Ratio | Without Mortgage | With Mortgage |
| Less than 2.0x | 201 (8.5%) | 169,079 (4,197.6%) |
| 2.0x to 2.9x | 458 (19.2%) | 566 (14.1%) |
| 3.0x to 3.9x | 337 (14.2%) | 1,078 (26.8%) |
| 4.0x or more | 1,346 (56.6%) | 916 (22.7%) |
| Total | 2,380 (100.0%) | 4,028 (100.0%) |
Real Estate Taxes by Mortgage Status in East Northport
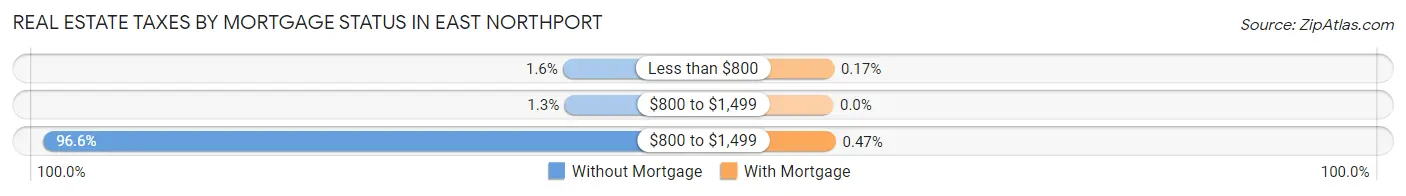
| Property Taxes | Without Mortgage | With Mortgage |
| Less than $800 | 37 (1.5%) | 7 (0.2%) |
| $800 to $1,499 | 31 (1.3%) | 0 (0.0%) |
| $800 to $1,499 | 2,299 (96.6%) | 19 (0.5%) |
| Total | 2,380 (100.0%) | 4,028 (100.0%) |
Health & Disability in East Northport
Health Insurance Coverage by Age in East Northport
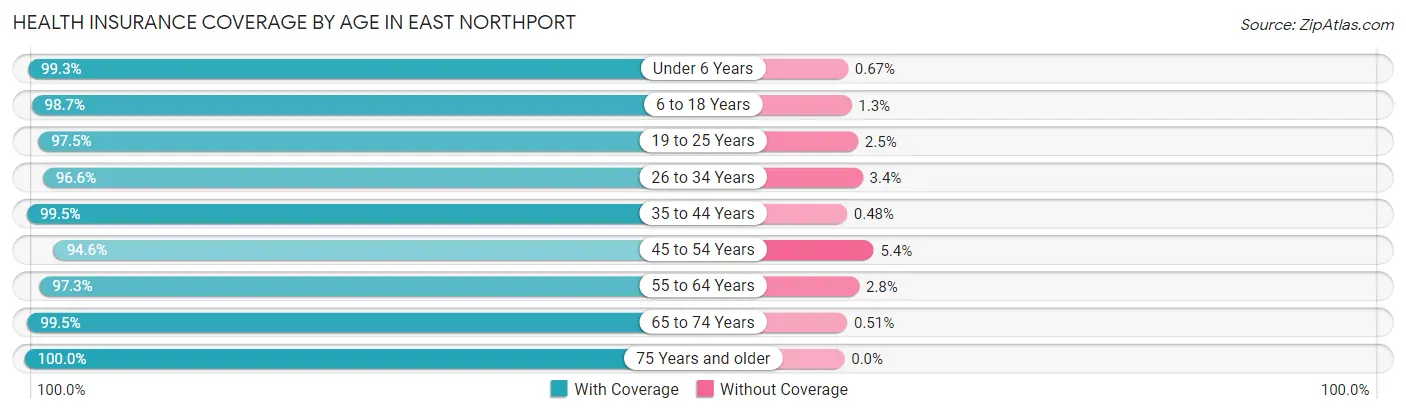
| Age Bracket | With Coverage | Without Coverage |
| Under 6 Years | 1,641 (99.3%) | 11 (0.7%) |
| 6 to 18 Years | 3,080 (98.7%) | 41 (1.3%) |
| 19 to 25 Years | 1,537 (97.5%) | 40 (2.5%) |
| 26 to 34 Years | 1,500 (96.6%) | 53 (3.4%) |
| 35 to 44 Years | 2,303 (99.5%) | 11 (0.5%) |
| 45 to 54 Years | 2,801 (94.6%) | 161 (5.4%) |
| 55 to 64 Years | 3,609 (97.3%) | 102 (2.8%) |
| 65 to 74 Years | 1,968 (99.5%) | 10 (0.5%) |
| 75 Years and older | 1,387 (100.0%) | 0 (0.0%) |
| Total | 19,826 (97.9%) | 429 (2.1%) |
Health Insurance Coverage by Citizenship Status in East Northport
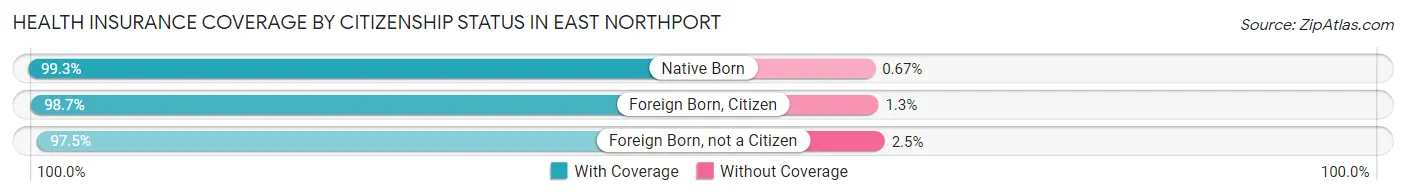
| Citizenship Status | With Coverage | Without Coverage |
| Native Born | 1,641 (99.3%) | 11 (0.7%) |
| Foreign Born, Citizen | 3,080 (98.7%) | 41 (1.3%) |
| Foreign Born, not a Citizen | 1,537 (97.5%) | 40 (2.5%) |
Health Insurance Coverage by Household Income in East Northport
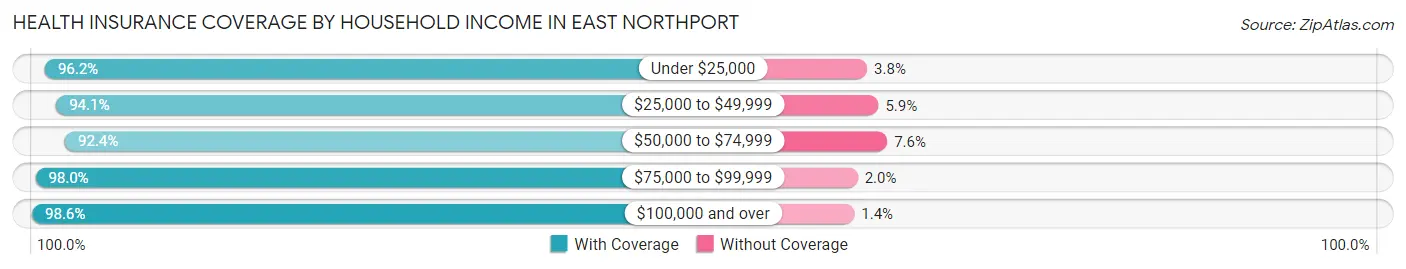
| Household Income | With Coverage | Without Coverage |
| Under $25,000 | 1,082 (96.2%) | 43 (3.8%) |
| $25,000 to $49,999 | 634 (94.1%) | 40 (5.9%) |
| $50,000 to $74,999 | 1,232 (92.4%) | 101 (7.6%) |
| $75,000 to $99,999 | 958 (98.0%) | 20 (2.0%) |
| $100,000 and over | 15,733 (98.6%) | 225 (1.4%) |
Public vs Private Health Insurance Coverage by Age in East Northport
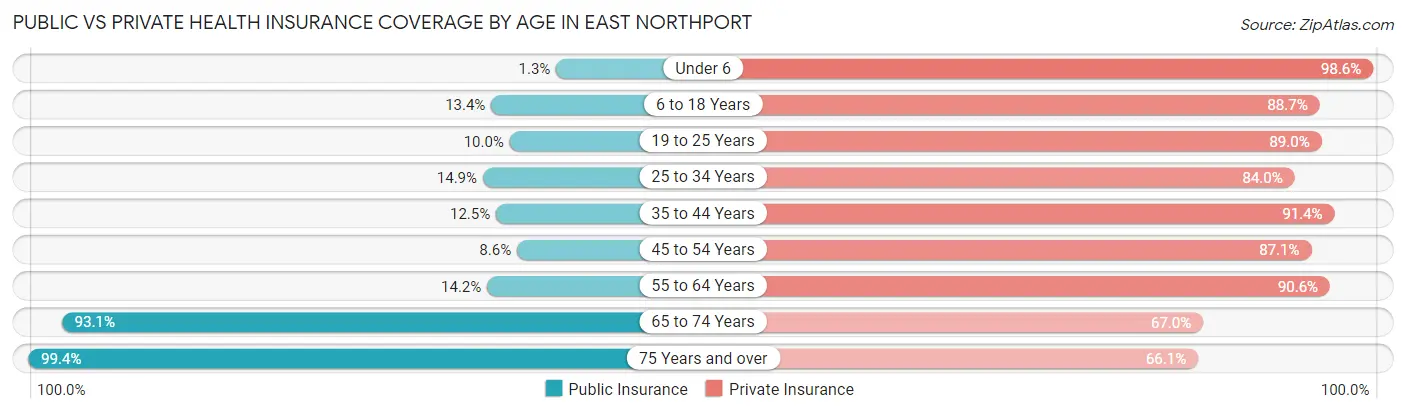
| Age Bracket | Public Insurance | Private Insurance |
| Under 6 | 22 (1.3%) | 1,629 (98.6%) |
| 6 to 18 Years | 418 (13.4%) | 2,767 (88.7%) |
| 19 to 25 Years | 157 (10.0%) | 1,404 (89.0%) |
| 25 to 34 Years | 232 (14.9%) | 1,305 (84.0%) |
| 35 to 44 Years | 289 (12.5%) | 2,116 (91.4%) |
| 45 to 54 Years | 255 (8.6%) | 2,581 (87.1%) |
| 55 to 64 Years | 525 (14.1%) | 3,362 (90.6%) |
| 65 to 74 Years | 1,842 (93.1%) | 1,326 (67.0%) |
| 75 Years and over | 1,378 (99.4%) | 917 (66.1%) |
| Total | 5,118 (25.3%) | 17,407 (85.9%) |
Disability Status by Sex by Age in East Northport
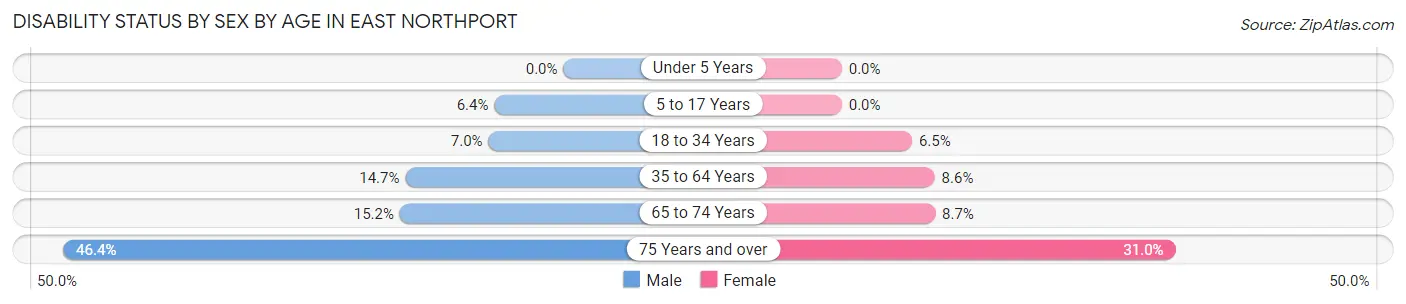
| Age Bracket | Male | Female |
| Under 5 Years | 0 (0.0%) | 0 (0.0%) |
| 5 to 17 Years | 120 (6.4%) | 0 (0.0%) |
| 18 to 34 Years | 116 (7.0%) | 106 (6.5%) |
| 35 to 64 Years | 661 (14.7%) | 386 (8.6%) |
| 65 to 74 Years | 104 (15.2%) | 112 (8.7%) |
| 75 Years and over | 311 (46.4%) | 222 (31.0%) |
Disability Class by Sex by Age in East Northport
Disability Class: Hearing Difficulty
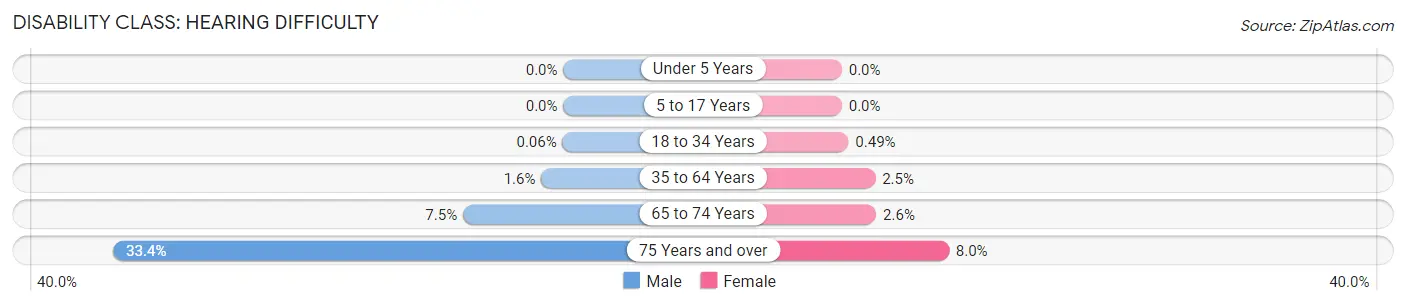
| Age Bracket | Male | Female |
| Under 5 Years | 0 (0.0%) | 0 (0.0%) |
| 5 to 17 Years | 0 (0.0%) | 0 (0.0%) |
| 18 to 34 Years | 1 (0.1%) | 8 (0.5%) |
| 35 to 64 Years | 74 (1.6%) | 111 (2.5%) |
| 65 to 74 Years | 51 (7.4%) | 33 (2.5%) |
| 75 Years and over | 224 (33.4%) | 57 (8.0%) |
Disability Class: Vision Difficulty
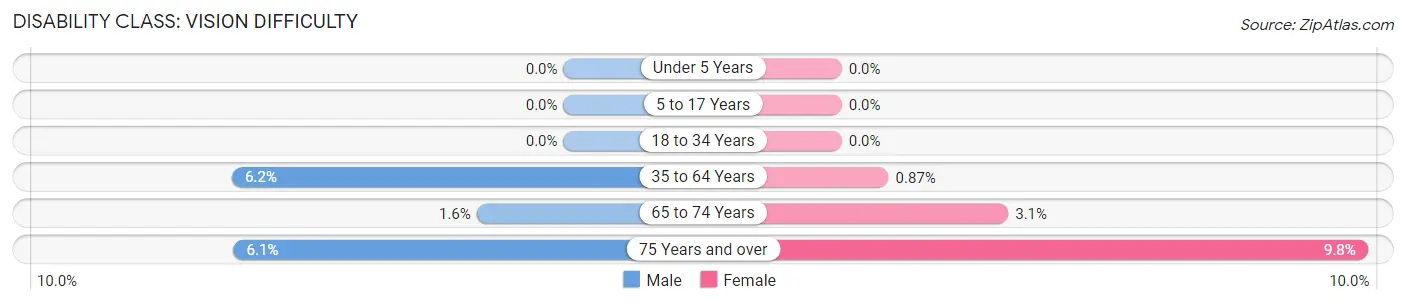
| Age Bracket | Male | Female |
| Under 5 Years | 0 (0.0%) | 0 (0.0%) |
| 5 to 17 Years | 0 (0.0%) | 0 (0.0%) |
| 18 to 34 Years | 0 (0.0%) | 0 (0.0%) |
| 35 to 64 Years | 277 (6.1%) | 39 (0.9%) |
| 65 to 74 Years | 11 (1.6%) | 40 (3.1%) |
| 75 Years and over | 41 (6.1%) | 70 (9.8%) |
Disability Class: Cognitive Difficulty
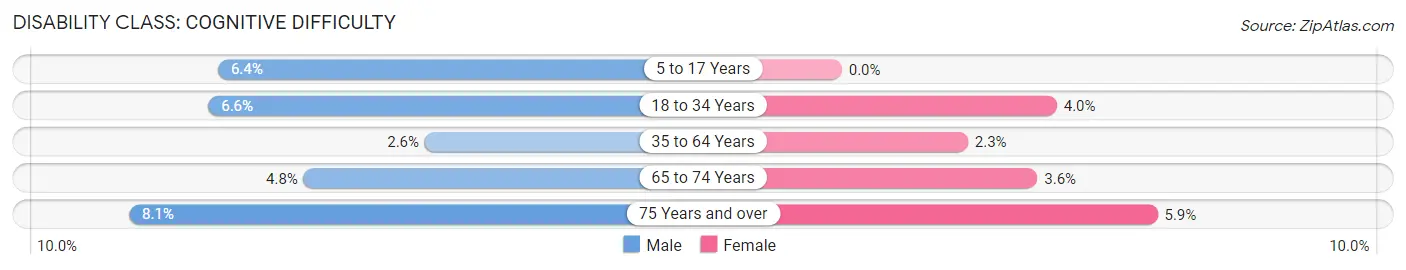
| Age Bracket | Male | Female |
| 5 to 17 Years | 120 (6.4%) | 0 (0.0%) |
| 18 to 34 Years | 110 (6.6%) | 65 (4.0%) |
| 35 to 64 Years | 116 (2.6%) | 105 (2.3%) |
| 65 to 74 Years | 33 (4.8%) | 47 (3.6%) |
| 75 Years and over | 54 (8.1%) | 42 (5.9%) |
Disability Class: Ambulatory Difficulty
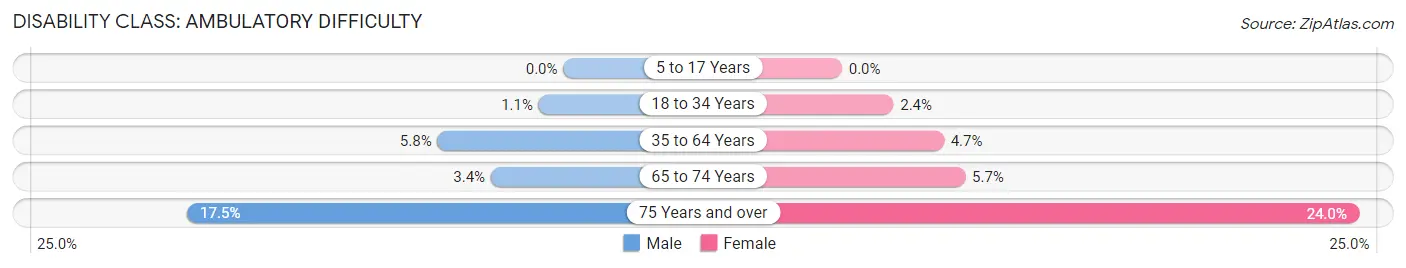
| Age Bracket | Male | Female |
| 5 to 17 Years | 0 (0.0%) | 0 (0.0%) |
| 18 to 34 Years | 19 (1.1%) | 39 (2.4%) |
| 35 to 64 Years | 263 (5.8%) | 212 (4.7%) |
| 65 to 74 Years | 23 (3.4%) | 74 (5.7%) |
| 75 Years and over | 117 (17.5%) | 172 (24.0%) |
Disability Class: Self-Care Difficulty
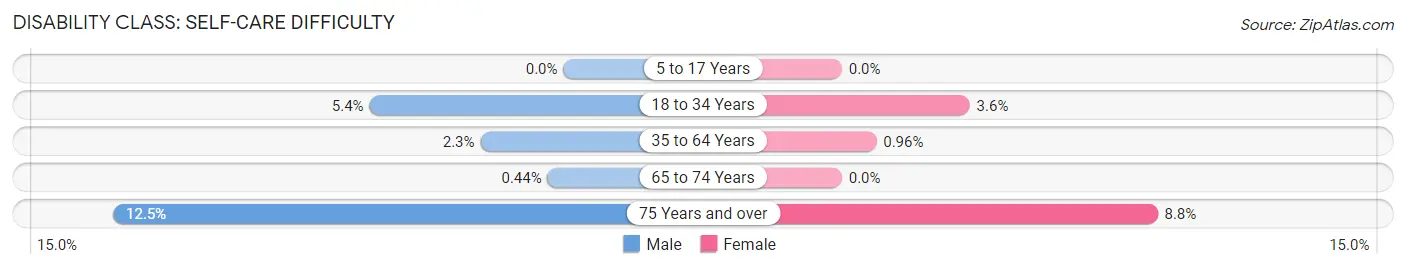
| Age Bracket | Male | Female |
| 5 to 17 Years | 0 (0.0%) | 0 (0.0%) |
| 18 to 34 Years | 90 (5.4%) | 58 (3.6%) |
| 35 to 64 Years | 104 (2.3%) | 43 (1.0%) |
| 65 to 74 Years | 3 (0.4%) | 0 (0.0%) |
| 75 Years and over | 84 (12.5%) | 63 (8.8%) |
Technology Access in East Northport
Computing Device Access in East Northport
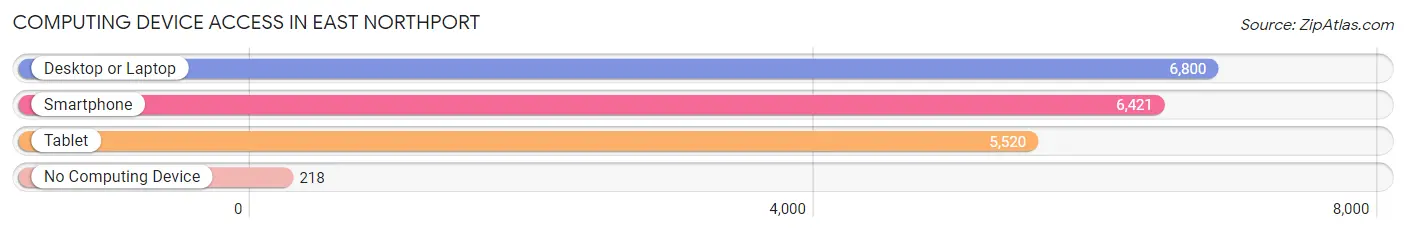
| Device Type | # Households | % Households |
| Desktop or Laptop | 6,800 | 94.5% |
| Smartphone | 6,421 | 89.2% |
| Tablet | 5,520 | 76.7% |
| No Computing Device | 218 | 3.0% |
| Total | 7,199 | 100.0% |
Internet Access in East Northport
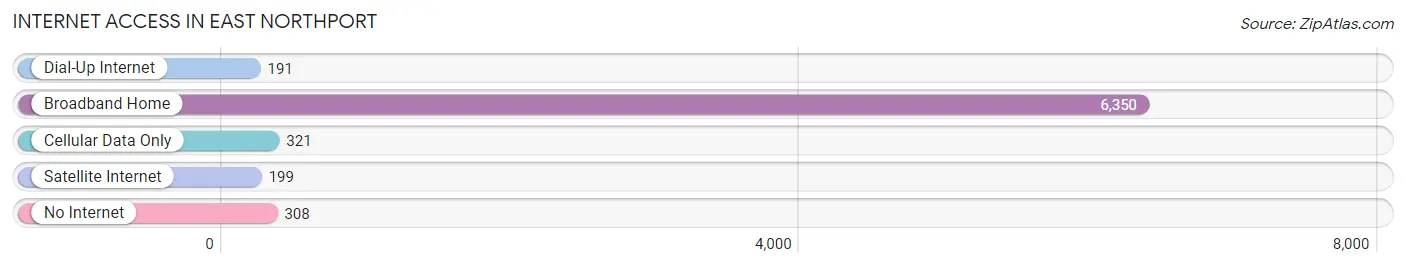
| Internet Type | # Households | % Households |
| Dial-Up Internet | 191 | 2.6% |
| Broadband Home | 6,350 | 88.2% |
| Cellular Data Only | 321 | 4.5% |
| Satellite Internet | 199 | 2.8% |
| No Internet | 308 | 4.3% |
| Total | 7,199 | 100.0% |
East Northport Summary
Northport is a hamlet located in the Town of Huntington in Suffolk County, New York. It is situated on the North Shore of Long Island, approximately 40 miles east of Manhattan. Northport is bordered by the hamlets of East Northport, Fort Salonga, and Greenlawn. The hamlet is served by the Northport-East Northport School District, and is home to the Northport Village Historic District, which is listed on the National Register of Historic Places.
History
The area that is now Northport was originally inhabited by the Matinecock Native American tribe. The first European settlers arrived in the area in the late 1600s, and the hamlet was officially established in 1837. The hamlet was originally known as Great Cow Harbour, and was renamed Northport in 1837.
In the late 1800s, Northport became a popular summer resort destination for wealthy New Yorkers. The hamlet was home to several large estates, including the estate of William K. Vanderbilt, which was later converted into a golf course.
In the early 1900s, Northport became a popular destination for artists and writers, including F. Scott Fitzgerald and John Steinbeck. The hamlet was also home to several large factories, including a shipbuilding plant and a paper mill.
Geography
Northport is located on the North Shore of Long Island, approximately 40 miles east of Manhattan. The hamlet is bordered by the hamlets of East Northport, Fort Salonga, and Greenlawn. Northport is situated on the north side of Northport Bay, which is part of the Long Island Sound. The hamlet is home to several parks, including Northport Village Park, which is located on the waterfront.
Economy
Northport’s economy is largely based on tourism and retail. The hamlet is home to several restaurants, bars, and shops, as well as a marina and a golf course. Northport is also home to several large employers, including Northport-East Northport School District, Northport-East Northport Public Library, and Northport-East Northport Fire Department.
Demographics
As of the 2010 census, Northport had a population of 7,401. The median household income was $90,945, and the median age was 43. The racial makeup of the hamlet was 94.3% White, 1.3% African American, 0.3% Native American, 1.7% Asian, and 2.4% from other races.
Northport is home to a diverse population, with a large Italian-American population, as well as a growing Hispanic population. The hamlet is also home to a large Jewish population, with several synagogues located in the area.
Common Questions
What is Per Capita Income in East Northport?
Per Capita income in East Northport is $60,680.
What is the Median Family Income in East Northport?
Median Family Income in East Northport is $165,912.
What is the Median Household income in East Northport?
Median Household Income in East Northport is $148,098.
What is Income or Wage Gap in East Northport?
Income or Wage Gap in East Northport is 36.3%.
Women in East Northport earn 63.7 cents for every dollar earned by a man.
What is Inequality or Gini Index in East Northport?
Inequality or Gini Index in East Northport is 0.40.
What is the Total Population of East Northport?
Total Population of East Northport is 20,287.
What is the Total Male Population of East Northport?
Total Male Population of East Northport is 10,115.
What is the Total Female Population of East Northport?
Total Female Population of East Northport is 10,172.
What is the Ratio of Males per 100 Females in East Northport?
There are 99.44 Males per 100 Females in East Northport.
What is the Ratio of Females per 100 Males in East Northport?
There are 100.56 Females per 100 Males in East Northport.
What is the Median Population Age in East Northport?
Median Population Age in East Northport is 44.7 Years.
What is the Average Family Size in East Northport
Average Family Size in East Northport is 3.4 People.
What is the Average Household Size in East Northport
Average Household Size in East Northport is 2.8 People.
How Large is the Labor Force in East Northport?
There are 11,553 People in the Labor Forcein in East Northport.
What is the Percentage of People in the Labor Force in East Northport?
71.1% of People are in the Labor Force in East Northport.
What is the Unemployment Rate in East Northport?
Unemployment Rate in East Northport is 4.4%.