Waltham, MA Map & Demographics
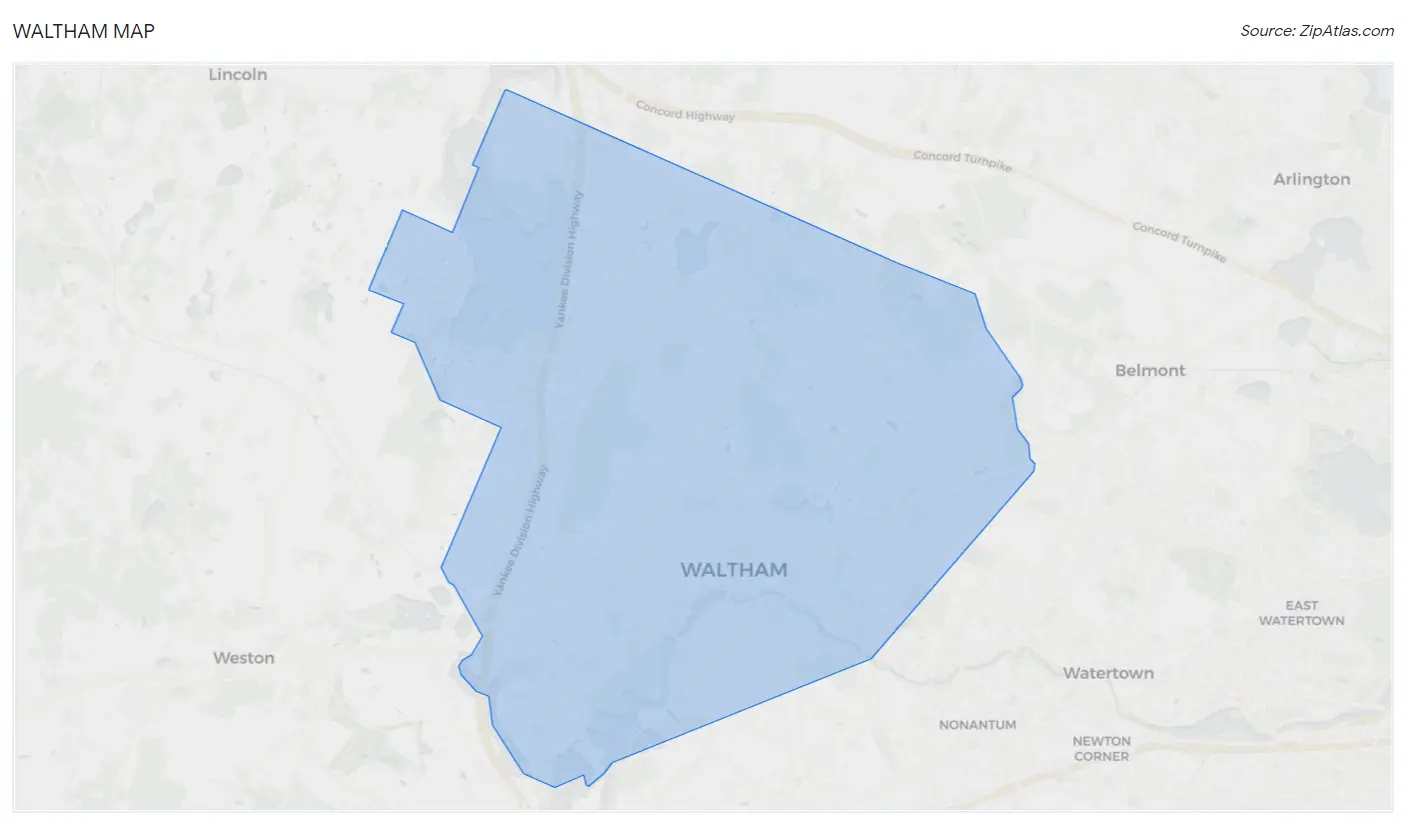
Waltham Map
Waltham Overview
$56,716
PER CAPITA INCOME
$139,507
AVG FAMILY INCOME
$113,443
AVG HOUSEHOLD INCOME
23.3%
WAGE / INCOME GAP [ % ]
76.7¢/ $1
WAGE / INCOME GAP [ $ ]
$10,164
FAMILY INCOME DEFICIT
0.43
INEQUALITY / GINI INDEX
64,711
TOTAL POPULATION
32,042
MALE POPULATION
32,669
FEMALE POPULATION
98.08
MALES / 100 FEMALES
101.96
FEMALES / 100 MALES
34.7
MEDIAN AGE
2.9
AVG FAMILY SIZE
2.2
AVG HOUSEHOLD SIZE
39,459
LABOR FORCE [ PEOPLE ]
69.3%
PERCENT IN LABOR FORCE
3.1%
UNEMPLOYMENT RATE
Income in Waltham
Income Overview in Waltham
Per Capita Income in Waltham is $56,716, while median incomes of families and households are $139,507 and $113,443 respectively.
| Characteristic | Number | Measure |
| Per Capita Income | 64,711 | $56,716 |
| Median Family Income | 13,232 | $139,507 |
| Mean Family Income | 13,232 | $167,251 |
| Median Household Income | 26,124 | $113,443 |
| Mean Household Income | 26,124 | $138,740 |
| Income Deficit | 13,232 | $10,164 |
| Wage / Income Gap (%) | 64,711 | 23.32% |
| Wage / Income Gap ($) | 64,711 | 76.68¢ per $1 |
| Gini / Inequality Index | 64,711 | 0.43 |
Earnings by Sex in Waltham
Average Earnings in Waltham are $56,331, $64,842 for men and $49,719 for women, a difference of 23.3%.
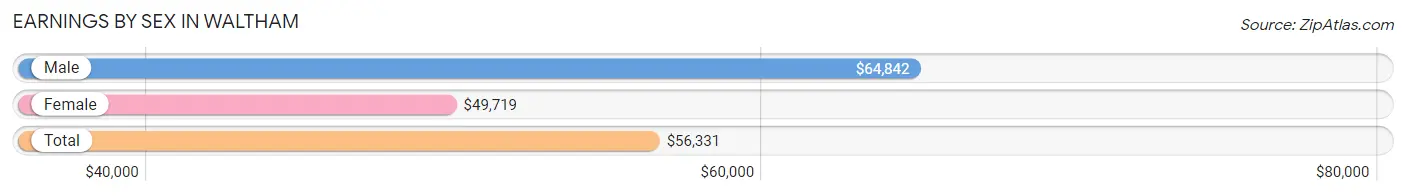
| Sex | Number | Average Earnings |
| Male | 21,787 (51.5%) | $64,842 |
| Female | 20,497 (48.5%) | $49,719 |
| Total | 42,284 (100.0%) | $56,331 |
Earnings by Sex by Income Bracket in Waltham
The most common earnings brackets in Waltham are $100,000+ for men (6,249 | 28.7%) and $100,000+ for women (3,699 | 18.0%).
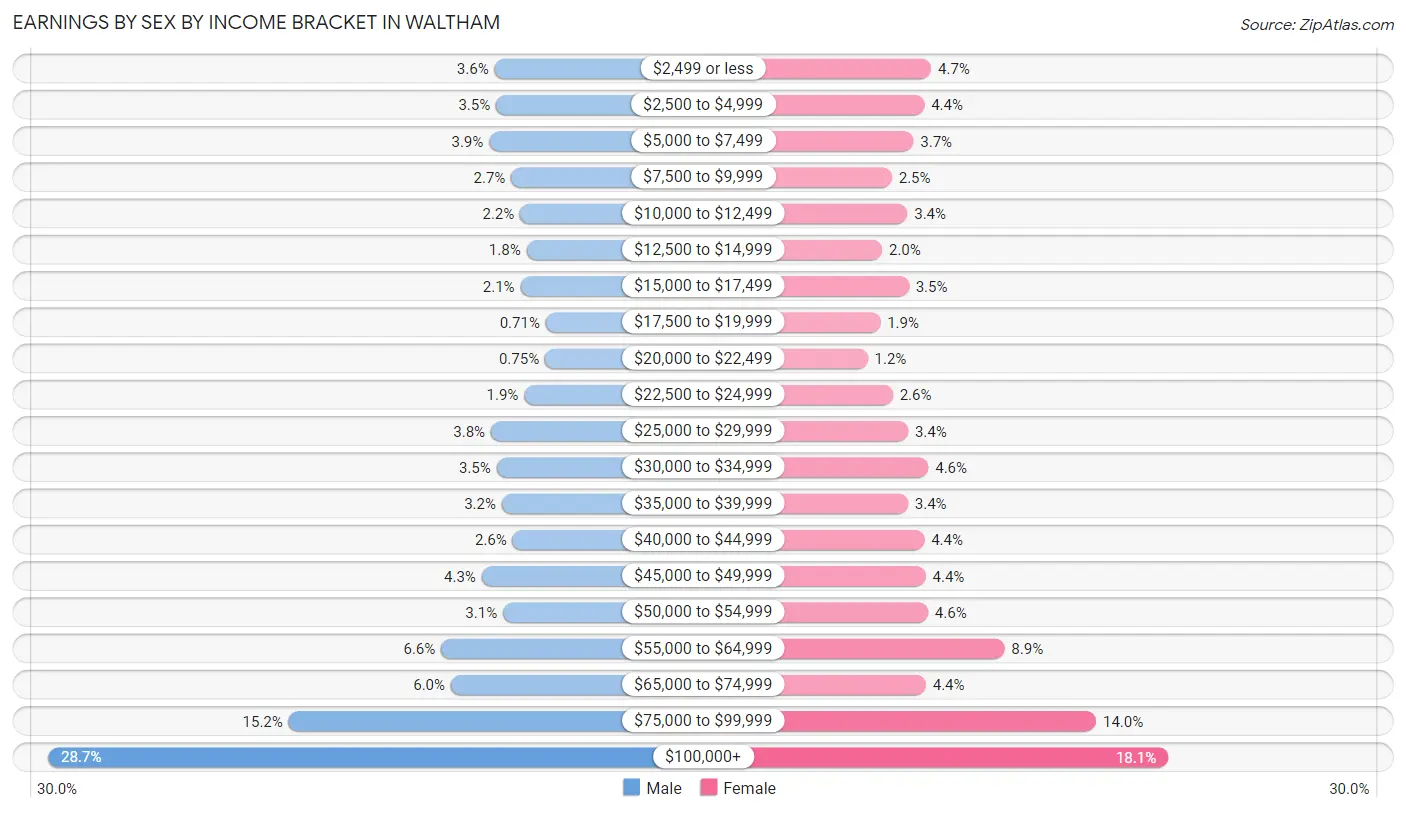
| Income | Male | Female |
| $2,499 or less | 783 (3.6%) | 971 (4.7%) |
| $2,500 to $4,999 | 763 (3.5%) | 892 (4.3%) |
| $5,000 to $7,499 | 848 (3.9%) | 766 (3.7%) |
| $7,500 to $9,999 | 578 (2.6%) | 518 (2.5%) |
| $10,000 to $12,499 | 468 (2.1%) | 697 (3.4%) |
| $12,500 to $14,999 | 391 (1.8%) | 405 (2.0%) |
| $15,000 to $17,499 | 463 (2.1%) | 714 (3.5%) |
| $17,500 to $19,999 | 154 (0.7%) | 386 (1.9%) |
| $20,000 to $22,499 | 164 (0.7%) | 240 (1.2%) |
| $22,500 to $24,999 | 419 (1.9%) | 529 (2.6%) |
| $25,000 to $29,999 | 826 (3.8%) | 706 (3.4%) |
| $30,000 to $34,999 | 757 (3.5%) | 938 (4.6%) |
| $35,000 to $39,999 | 693 (3.2%) | 704 (3.4%) |
| $40,000 to $44,999 | 560 (2.6%) | 892 (4.3%) |
| $45,000 to $49,999 | 938 (4.3%) | 907 (4.4%) |
| $50,000 to $54,999 | 677 (3.1%) | 934 (4.6%) |
| $55,000 to $64,999 | 1,436 (6.6%) | 1,816 (8.9%) |
| $65,000 to $74,999 | 1,317 (6.0%) | 911 (4.4%) |
| $75,000 to $99,999 | 3,303 (15.2%) | 2,872 (14.0%) |
| $100,000+ | 6,249 (28.7%) | 3,699 (18.0%) |
| Total | 21,787 (100.0%) | 20,497 (100.0%) |
Earnings by Sex by Educational Attainment in Waltham
Average earnings in Waltham are $80,988 for men and $58,406 for women, a difference of 27.9%. Men with an educational attainment of graduate degree enjoy the highest average annual earnings of $103,590, while those with less than high school education earn the least with $39,928. Women with an educational attainment of graduate degree earn the most with the average annual earnings of $83,528, while those with less than high school education have the smallest earnings of $28,426.
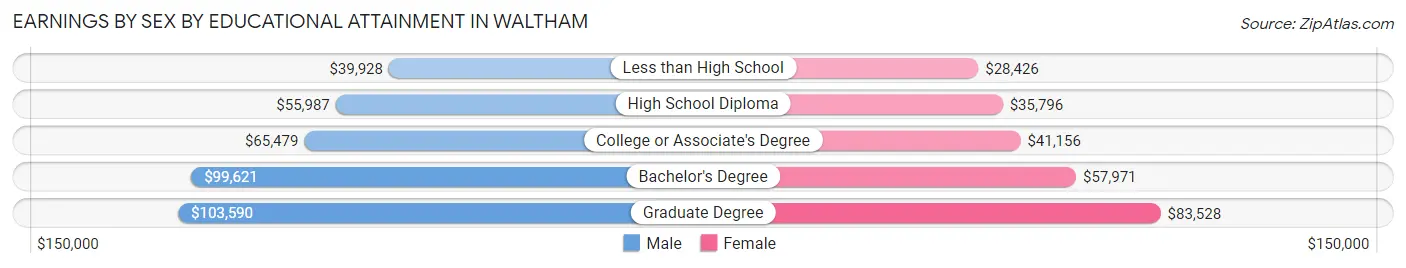
| Educational Attainment | Male Income | Female Income |
| Less than High School | $39,928 | $28,426 |
| High School Diploma | $55,987 | $35,796 |
| College or Associate's Degree | $65,479 | $41,156 |
| Bachelor's Degree | $99,621 | $57,971 |
| Graduate Degree | $103,590 | $83,528 |
| Total | $80,988 | $58,406 |
Family Income in Waltham
Family Income Brackets in Waltham
According to the Waltham family income data, there are 4,049 families falling into the $200,000+ income range, which is the most common income bracket and makes up 30.6% of all families. Conversely, the $10,000 to $14,999 income bracket is the least frequent group with only 159 families (1.2%) belonging to this category.
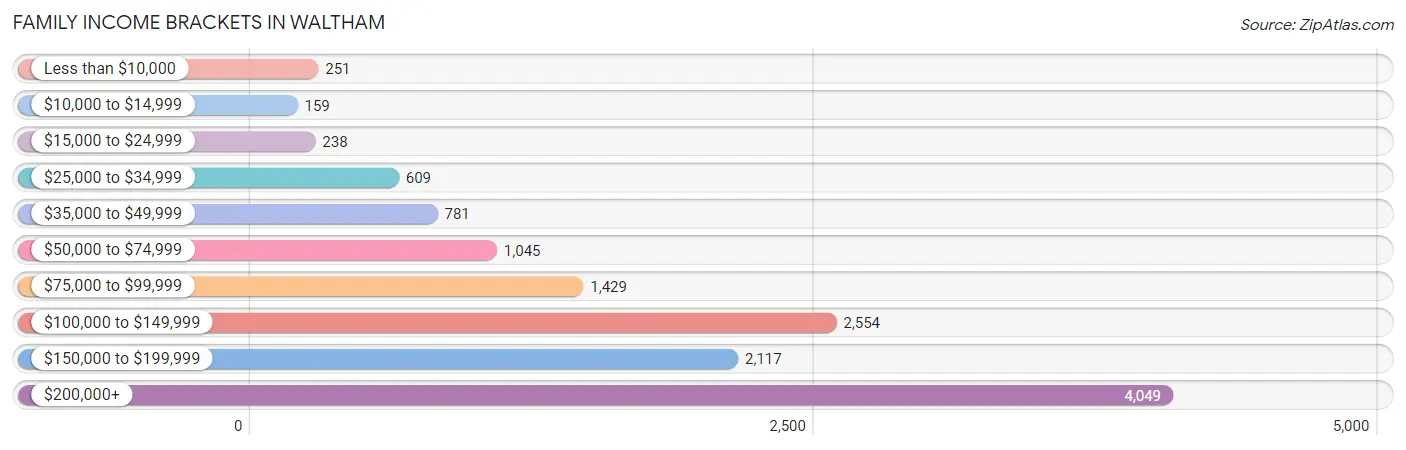
| Income Bracket | # Families | % Families |
| Less than $10,000 | 251 | 1.9% |
| $10,000 to $14,999 | 159 | 1.2% |
| $15,000 to $24,999 | 238 | 1.8% |
| $25,000 to $34,999 | 609 | 4.6% |
| $35,000 to $49,999 | 781 | 5.9% |
| $50,000 to $74,999 | 1,045 | 7.9% |
| $75,000 to $99,999 | 1,429 | 10.8% |
| $100,000 to $149,999 | 2,554 | 19.3% |
| $150,000 to $199,999 | 2,117 | 16.0% |
| $200,000+ | 4,049 | 30.6% |
Family Income by Famaliy Size in Waltham
5-person families (969 | 7.3%) account for the highest median family income in Waltham with $216,681 per family, while 2-person families (6,822 | 51.6%) have the highest median income of $64,066 per family member.
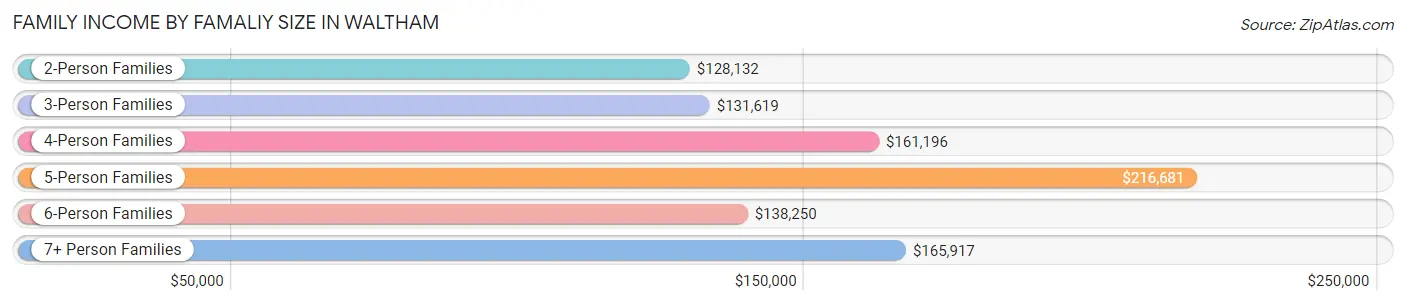
| Income Bracket | # Families | Median Income |
| 2-Person Families | 6,822 (51.6%) | $128,132 |
| 3-Person Families | 2,982 (22.5%) | $131,619 |
| 4-Person Families | 2,004 (15.1%) | $161,196 |
| 5-Person Families | 969 (7.3%) | $216,681 |
| 6-Person Families | 244 (1.8%) | $138,250 |
| 7+ Person Families | 211 (1.6%) | $165,917 |
| Total | 13,232 (100.0%) | $139,507 |
Family Income by Number of Earners in Waltham
The median family income in Waltham is $139,507, with families comprising 2 earners (6,810) having the highest median family income of $172,222, while families with no earners (1,469) have the lowest median family income of $57,361, accounting for 51.5% and 11.1% of families, respectively.
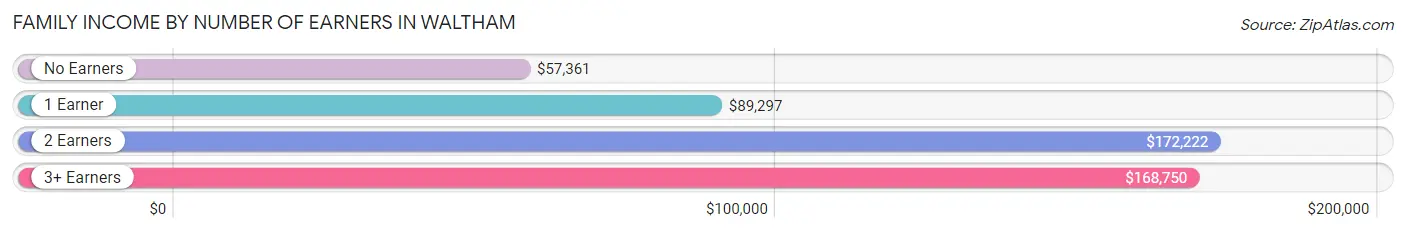
| Number of Earners | # Families | Median Income |
| No Earners | 1,469 (11.1%) | $57,361 |
| 1 Earner | 3,262 (24.6%) | $89,297 |
| 2 Earners | 6,810 (51.5%) | $172,222 |
| 3+ Earners | 1,691 (12.8%) | $168,750 |
| Total | 13,232 (100.0%) | $139,507 |
Household Income in Waltham
Household Income Brackets in Waltham
With 5,773 households falling in the category, the $200,000+ income range is the most frequent in Waltham, accounting for 22.1% of all households. In contrast, only 679 households (2.6%) fall into the $10,000 to $14,999 income bracket, making it the least populous group.
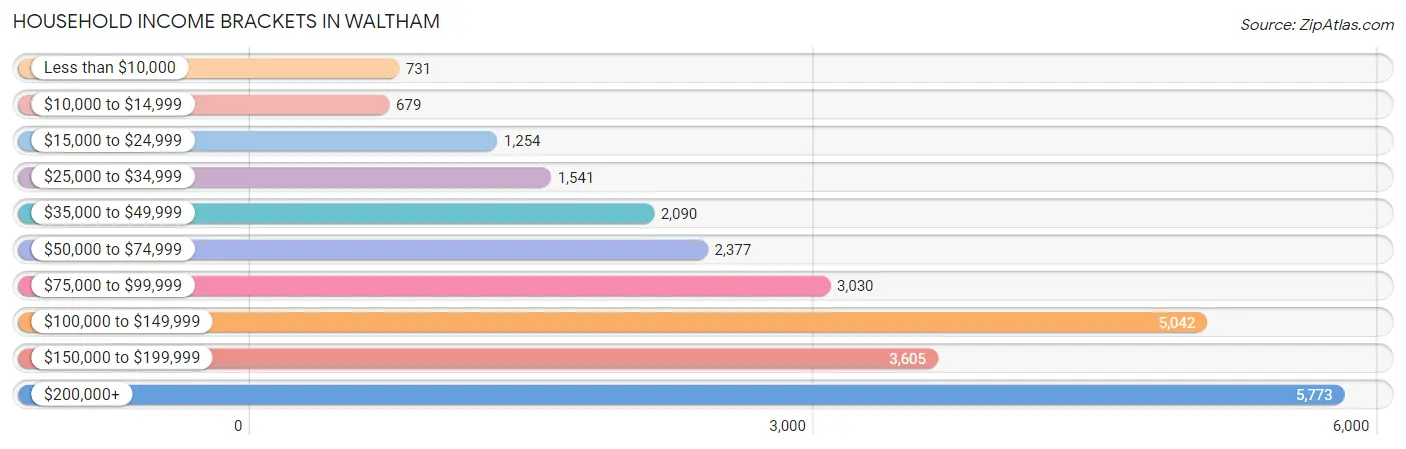
| Income Bracket | # Households | % Households |
| Less than $10,000 | 731 | 2.8% |
| $10,000 to $14,999 | 679 | 2.6% |
| $15,000 to $24,999 | 1,254 | 4.8% |
| $25,000 to $34,999 | 1,541 | 5.9% |
| $35,000 to $49,999 | 2,090 | 8.0% |
| $50,000 to $74,999 | 2,377 | 9.1% |
| $75,000 to $99,999 | 3,030 | 11.6% |
| $100,000 to $149,999 | 5,042 | 19.3% |
| $150,000 to $199,999 | 3,605 | 13.8% |
| $200,000+ | 5,773 | 22.1% |
Household Income by Householder Age in Waltham
The median household income in Waltham is $113,443, with the highest median household income of $141,992 found in the 25 to 44 years age bracket for the primary householder. A total of 9,806 households (37.5%) fall into this category. Meanwhile, the 65+ years age bracket for the primary householder has the lowest median household income of $57,304, with 6,728 households (25.8%) in this group.
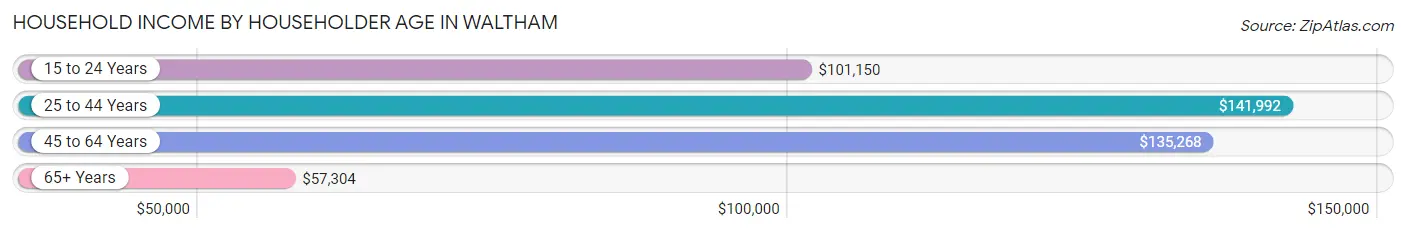
| Income Bracket | # Households | Median Income |
| 15 to 24 Years | 1,681 (6.4%) | $101,150 |
| 25 to 44 Years | 9,806 (37.5%) | $141,992 |
| 45 to 64 Years | 7,909 (30.3%) | $135,268 |
| 65+ Years | 6,728 (25.8%) | $57,304 |
| Total | 26,124 (100.0%) | $113,443 |
Poverty in Waltham
Income Below Poverty by Sex and Age in Waltham
With 9.4% poverty level for males and 8.3% for females among the residents of Waltham, 18 to 24 year old males and 18 to 24 year old females are the most vulnerable to poverty, with 822 males (27.0%) and 437 females (13.9%) in their respective age groups living below the poverty level.
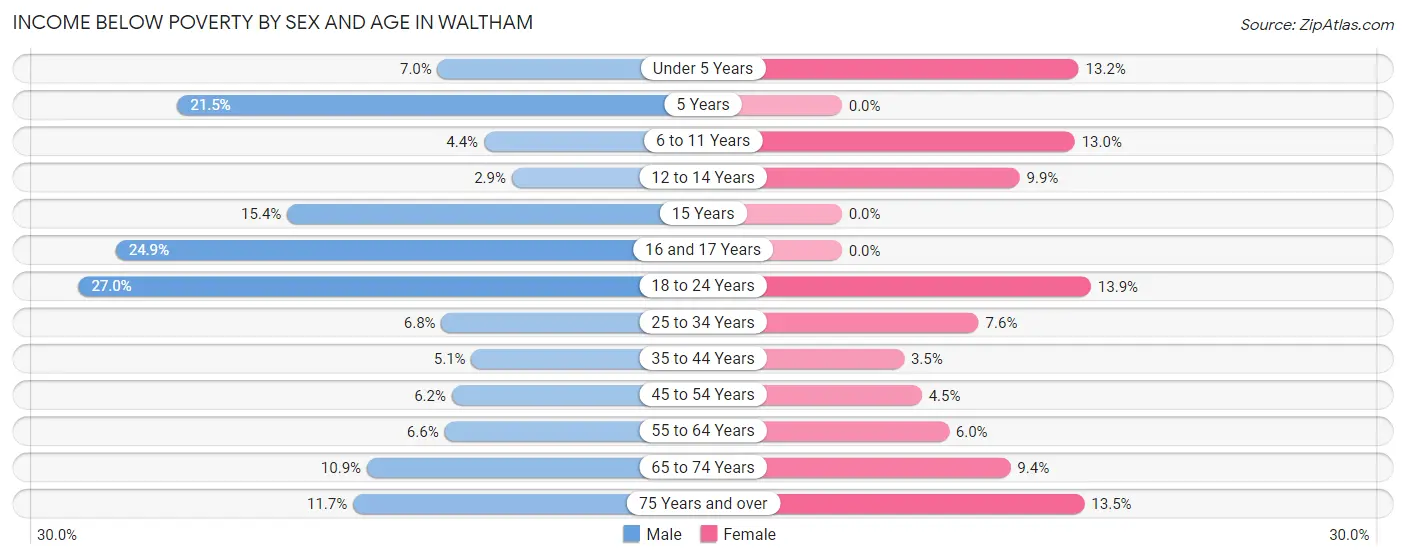
| Age Bracket | Male | Female |
| Under 5 Years | 112 (7.0%) | 194 (13.2%) |
| 5 Years | 52 (21.5%) | 0 (0.0%) |
| 6 to 11 Years | 45 (4.4%) | 201 (13.0%) |
| 12 to 14 Years | 19 (2.9%) | 52 (9.9%) |
| 15 Years | 24 (15.4%) | 0 (0.0%) |
| 16 and 17 Years | 83 (24.9%) | 0 (0.0%) |
| 18 to 24 Years | 822 (27.0%) | 437 (13.9%) |
| 25 to 34 Years | 427 (6.8%) | 434 (7.6%) |
| 35 to 44 Years | 220 (5.1%) | 134 (3.5%) |
| 45 to 54 Years | 196 (6.2%) | 132 (4.4%) |
| 55 to 64 Years | 262 (6.6%) | 203 (6.0%) |
| 65 to 74 Years | 260 (10.9%) | 324 (9.4%) |
| 75 Years and over | 199 (11.7%) | 343 (13.5%) |
| Total | 2,721 (9.4%) | 2,454 (8.3%) |
Income Above Poverty by Sex and Age in Waltham
According to the poverty statistics in Waltham, males aged 12 to 14 years and females aged 5 years are the age groups that are most secure financially, with 97.1% of males and 100.0% of females in these age groups living above the poverty line.
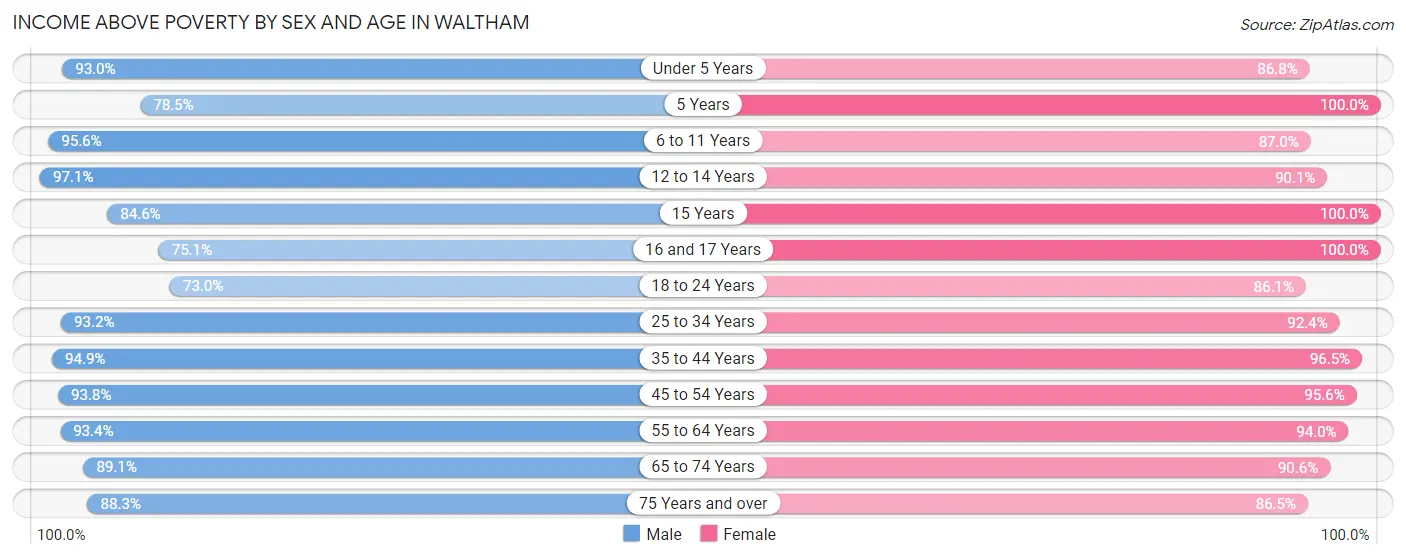
| Age Bracket | Male | Female |
| Under 5 Years | 1,487 (93.0%) | 1,277 (86.8%) |
| 5 Years | 190 (78.5%) | 240 (100.0%) |
| 6 to 11 Years | 972 (95.6%) | 1,349 (87.0%) |
| 12 to 14 Years | 643 (97.1%) | 473 (90.1%) |
| 15 Years | 132 (84.6%) | 148 (100.0%) |
| 16 and 17 Years | 250 (75.1%) | 459 (100.0%) |
| 18 to 24 Years | 2,223 (73.0%) | 2,714 (86.1%) |
| 25 to 34 Years | 5,858 (93.2%) | 5,263 (92.4%) |
| 35 to 44 Years | 4,073 (94.9%) | 3,738 (96.5%) |
| 45 to 54 Years | 2,958 (93.8%) | 2,831 (95.6%) |
| 55 to 64 Years | 3,698 (93.4%) | 3,202 (94.0%) |
| 65 to 74 Years | 2,116 (89.1%) | 3,127 (90.6%) |
| 75 Years and over | 1,501 (88.3%) | 2,196 (86.5%) |
| Total | 26,101 (90.6%) | 27,017 (91.7%) |
Income Below Poverty Among Married-Couple Families in Waltham
The poverty statistics for married-couple families in Waltham show that 3.5% or 352 of the total 9,952 families live below the poverty line. Families with 3 or 4 children have the highest poverty rate of 5.5%, comprising of 27 families. On the other hand, families with no children have the lowest poverty rate of 3.1%, which includes 199 families.
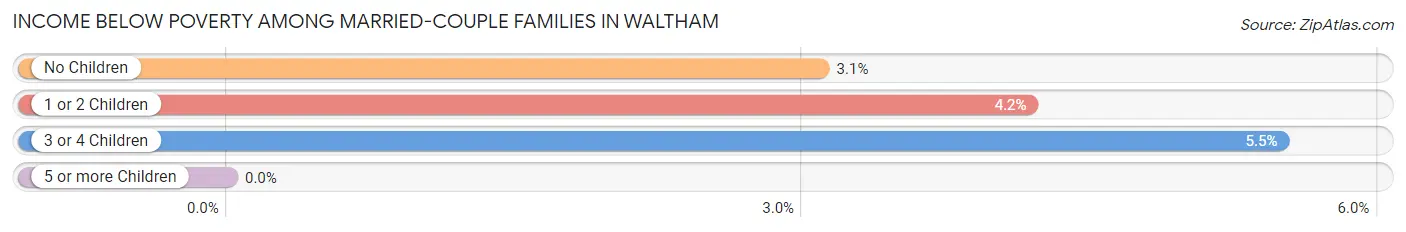
| Children | Above Poverty | Below Poverty |
| No Children | 6,246 (96.9%) | 199 (3.1%) |
| 1 or 2 Children | 2,889 (95.8%) | 126 (4.2%) |
| 3 or 4 Children | 465 (94.5%) | 27 (5.5%) |
| 5 or more Children | 0 (0.0%) | 0 (0.0%) |
| Total | 9,600 (96.5%) | 352 (3.5%) |
Income Below Poverty Among Single-Parent Households in Waltham
According to the poverty data in Waltham, 6.1% or 60 single-father households and 8.7% or 200 single-mother households are living below the poverty line. Among single-father households, those with no children have the highest poverty rate, with 51 households (7.6%) experiencing poverty. Likewise, among single-mother households, those with 3 or 4 children have the highest poverty rate, with 24 households (20.0%) falling below the poverty line.
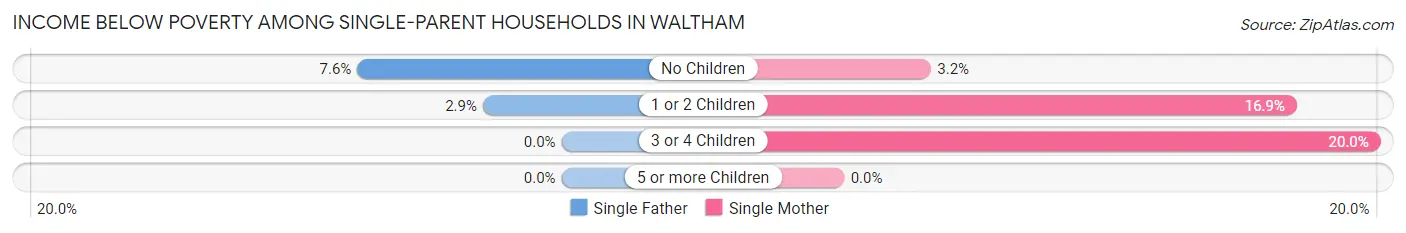
| Children | Single Father | Single Mother |
| No Children | 51 (7.6%) | 45 (3.2%) |
| 1 or 2 Children | 9 (2.9%) | 131 (16.9%) |
| 3 or 4 Children | 0 (0.0%) | 24 (20.0%) |
| 5 or more Children | 0 (0.0%) | 0 (0.0%) |
| Total | 60 (6.1%) | 200 (8.7%) |
Income Below Poverty Among Married-Couple vs Single-Parent Households in Waltham
The poverty data for Waltham shows that 352 of the married-couple family households (3.5%) and 260 of the single-parent households (7.9%) are living below the poverty level. Within the married-couple family households, those with 3 or 4 children have the highest poverty rate, with 27 households (5.5%) falling below the poverty line. Among the single-parent households, those with 3 or 4 children have the highest poverty rate, with 24 household (18.0%) living below poverty.
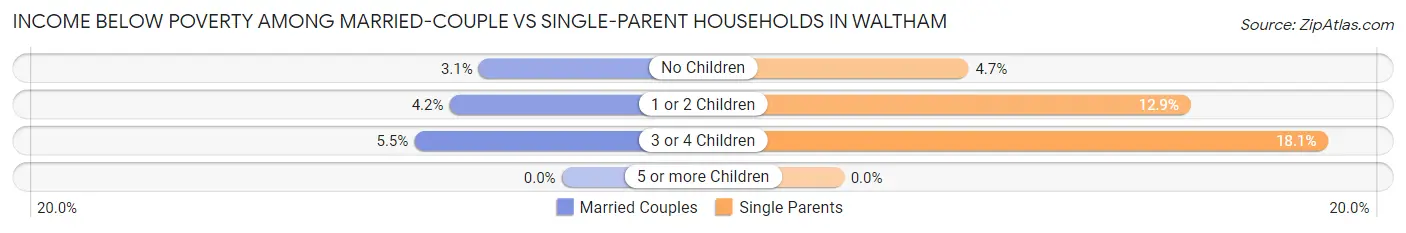
| Children | Married-Couple Families | Single-Parent Households |
| No Children | 199 (3.1%) | 96 (4.6%) |
| 1 or 2 Children | 126 (4.2%) | 140 (12.9%) |
| 3 or 4 Children | 27 (5.5%) | 24 (18.0%) |
| 5 or more Children | 0 (0.0%) | 0 (0.0%) |
| Total | 352 (3.5%) | 260 (7.9%) |
Race in Waltham
The most populous races in Waltham are White / Caucasian (42,432 | 65.6%), Hispanic or Latino (9,904 | 15.3%), and Asian (8,412 | 13.0%).
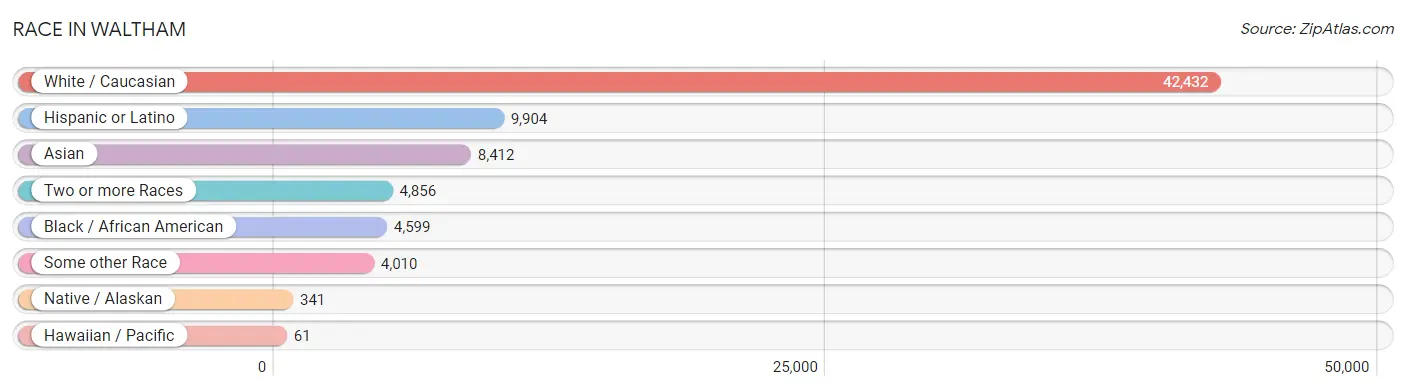
| Race | # Population | % Population |
| Asian | 8,412 | 13.0% |
| Black / African American | 4,599 | 7.1% |
| Hawaiian / Pacific | 61 | 0.1% |
| Hispanic or Latino | 9,904 | 15.3% |
| Native / Alaskan | 341 | 0.5% |
| White / Caucasian | 42,432 | 65.6% |
| Two or more Races | 4,856 | 7.5% |
| Some other Race | 4,010 | 6.2% |
| Total | 64,711 | 100.0% |
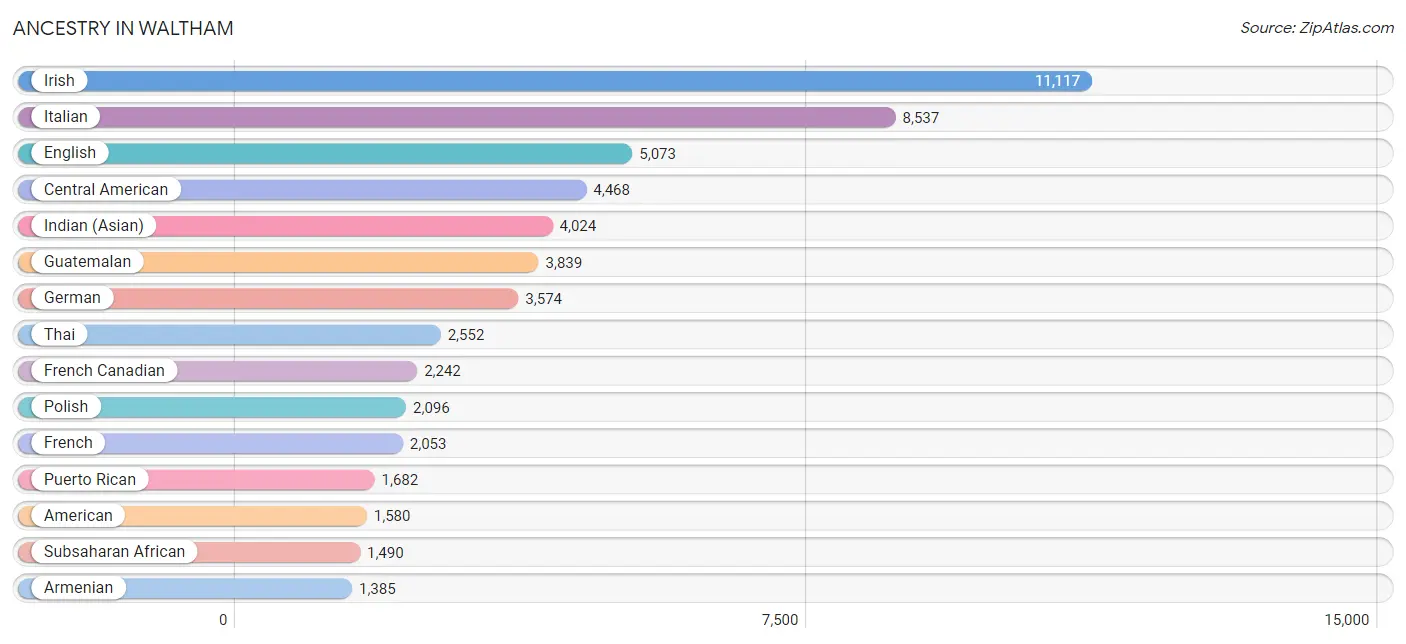
Ancestry in Waltham
The most populous ancestries reported in Waltham are Irish (11,117 | 17.2%), Italian (8,537 | 13.2%), English (5,073 | 7.8%), Central American (4,468 | 6.9%), and Indian (Asian) (4,024 | 6.2%), together accounting for 51.3% of all Waltham residents.
| Ancestry | # Population | % Population |
| African | 549 | 0.9% |
| Albanian | 71 | 0.1% |
| American | 1,580 | 2.4% |
| Arab | 473 | 0.7% |
| Argentinean | 26 | 0.0% |
| Armenian | 1,385 | 2.1% |
| Assyrian / Chaldean / Syriac | 14 | 0.0% |
| Austrian | 66 | 0.1% |
| Barbadian | 4 | 0.0% |
| Basque | 7 | 0.0% |
| Belgian | 205 | 0.3% |
| Bhutanese | 169 | 0.3% |
| Blackfeet | 29 | 0.0% |
| Bolivian | 99 | 0.2% |
| Brazilian | 211 | 0.3% |
| British | 246 | 0.4% |
| British West Indian | 33 | 0.1% |
| Bulgarian | 95 | 0.2% |
| Burmese | 560 | 0.9% |
| Canadian | 520 | 0.8% |
| Cape Verdean | 26 | 0.0% |
| Celtic | 23 | 0.0% |
| Central American | 4,468 | 6.9% |
| Central American Indian | 303 | 0.5% |
| Cherokee | 19 | 0.0% |
| Chilean | 103 | 0.2% |
| Choctaw | 40 | 0.1% |
| Colombian | 396 | 0.6% |
| Costa Rican | 8 | 0.0% |
| Croatian | 31 | 0.1% |
| Cuban | 348 | 0.5% |
| Cypriot | 5 | 0.0% |
| Czech | 118 | 0.2% |
| Czechoslovakian | 20 | 0.0% |
| Danish | 58 | 0.1% |
| Dominican | 761 | 1.2% |
| Dutch | 155 | 0.2% |
| Eastern European | 497 | 0.8% |
| Ecuadorian | 66 | 0.1% |
| Egyptian | 42 | 0.1% |
| English | 5,073 | 7.8% |
| European | 841 | 1.3% |
| Filipino | 151 | 0.2% |
| Finnish | 100 | 0.2% |
| French | 2,053 | 3.2% |
| French Canadian | 2,242 | 3.5% |
| German | 3,574 | 5.5% |
| German Russian | 12 | 0.0% |
| Ghanaian | 5 | 0.0% |
| Greek | 765 | 1.2% |
| Guamanian / Chamorro | 21 | 0.0% |
| Guatemalan | 3,839 | 5.9% |
| Guyanese | 6 | 0.0% |
| Haitian | 839 | 1.3% |
| Honduran | 7 | 0.0% |
| Hungarian | 228 | 0.4% |
| Icelander | 3 | 0.0% |
| Indian (Asian) | 4,024 | 6.2% |
| Iranian | 398 | 0.6% |
| Iraqi | 6 | 0.0% |
| Irish | 11,117 | 17.2% |
| Israeli | 12 | 0.0% |
| Italian | 8,537 | 13.2% |
| Jamaican | 273 | 0.4% |
| Japanese | 30 | 0.1% |
| Kenyan | 73 | 0.1% |
| Korean | 173 | 0.3% |
| Laotian | 56 | 0.1% |
| Latvian | 7 | 0.0% |
| Lebanese | 134 | 0.2% |
| Lithuanian | 315 | 0.5% |
| Malaysian | 73 | 0.1% |
| Mexican | 723 | 1.1% |
| Mexican American Indian | 13 | 0.0% |
| Mongolian | 9 | 0.0% |
| Moroccan | 52 | 0.1% |
| Native Hawaiian | 34 | 0.1% |
| Nicaraguan | 21 | 0.0% |
| Nigerian | 157 | 0.2% |
| Northern European | 123 | 0.2% |
| Norwegian | 297 | 0.5% |
| Pakistani | 66 | 0.1% |
| Palestinian | 169 | 0.3% |
| Panamanian | 3 | 0.0% |
| Peruvian | 292 | 0.4% |
| Polish | 2,096 | 3.2% |
| Portuguese | 565 | 0.9% |
| Puerto Rican | 1,682 | 2.6% |
| Romanian | 113 | 0.2% |
| Russian | 1,019 | 1.6% |
| Salvadoran | 590 | 0.9% |
| Samoan | 17 | 0.0% |
| Scandinavian | 62 | 0.1% |
| Scotch-Irish | 450 | 0.7% |
| Scottish | 1,190 | 1.8% |
| Slavic | 64 | 0.1% |
| Slovak | 142 | 0.2% |
| Slovene | 7 | 0.0% |
| Somali | 3 | 0.0% |
| South African | 4 | 0.0% |
| South American | 1,092 | 1.7% |
| Spaniard | 45 | 0.1% |
| Spanish | 180 | 0.3% |
| Sri Lankan | 412 | 0.6% |
| Subsaharan African | 1,490 | 2.3% |
| Swedish | 738 | 1.1% |
| Swiss | 157 | 0.2% |
| Syrian | 34 | 0.1% |
| Thai | 2,552 | 3.9% |
| Tongan | 11 | 0.0% |
| Trinidadian and Tobagonian | 7 | 0.0% |
| Turkish | 129 | 0.2% |
| Ugandan | 709 | 1.1% |
| Ukrainian | 408 | 0.6% |
| Venezuelan | 110 | 0.2% |
| Vietnamese | 28 | 0.0% |
| Welsh | 339 | 0.5% |
| Yugoslavian | 7 | 0.0% |
| Zimbabwean | 6 | 0.0% | View All 119 Rows |
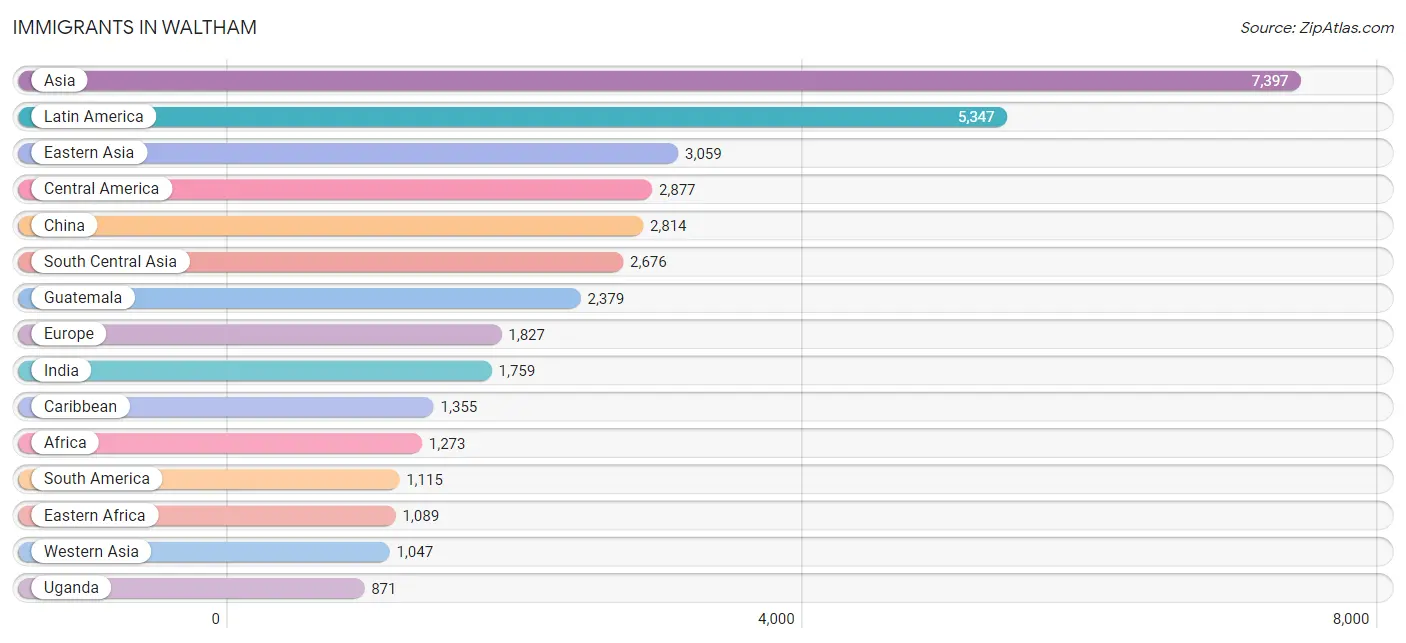
Immigrants in Waltham
The most numerous immigrant groups reported in Waltham came from Asia (7,397 | 11.4%), Latin America (5,347 | 8.3%), Eastern Asia (3,059 | 4.7%), Central America (2,877 | 4.4%), and China (2,814 | 4.3%), together accounting for 33.2% of all Waltham residents.
| Immigration Origin | # Population | % Population |
| Africa | 1,273 | 2.0% |
| Albania | 41 | 0.1% |
| Argentina | 40 | 0.1% |
| Armenia | 233 | 0.4% |
| Asia | 7,397 | 11.4% |
| Australia | 18 | 0.0% |
| Bangladesh | 59 | 0.1% |
| Belarus | 62 | 0.1% |
| Bolivia | 60 | 0.1% |
| Brazil | 296 | 0.5% |
| Bulgaria | 42 | 0.1% |
| Cambodia | 30 | 0.1% |
| Canada | 684 | 1.1% |
| Caribbean | 1,355 | 2.1% |
| Central America | 2,877 | 4.4% |
| Chile | 65 | 0.1% |
| China | 2,814 | 4.3% |
| Colombia | 246 | 0.4% |
| Cuba | 49 | 0.1% |
| Dominican Republic | 395 | 0.6% |
| Eastern Africa | 1,089 | 1.7% |
| Eastern Asia | 3,059 | 4.7% |
| Eastern Europe | 806 | 1.3% |
| Ecuador | 43 | 0.1% |
| Egypt | 15 | 0.0% |
| El Salvador | 337 | 0.5% |
| England | 109 | 0.2% |
| Europe | 1,827 | 2.8% |
| France | 56 | 0.1% |
| Germany | 68 | 0.1% |
| Ghana | 5 | 0.0% |
| Greece | 50 | 0.1% |
| Guatemala | 2,379 | 3.7% |
| Haiti | 628 | 1.0% |
| Hong Kong | 91 | 0.1% |
| Hungary | 29 | 0.0% |
| India | 1,759 | 2.7% |
| Indonesia | 42 | 0.1% |
| Iran | 360 | 0.6% |
| Iraq | 20 | 0.0% |
| Ireland | 134 | 0.2% |
| Israel | 34 | 0.1% |
| Italy | 364 | 0.6% |
| Jamaica | 205 | 0.3% |
| Japan | 49 | 0.1% |
| Jordan | 83 | 0.1% |
| Kazakhstan | 64 | 0.1% |
| Kenya | 82 | 0.1% |
| Korea | 196 | 0.3% |
| Laos | 69 | 0.1% |
| Latin America | 5,347 | 8.3% |
| Lebanon | 359 | 0.5% |
| Lithuania | 20 | 0.0% |
| Malaysia | 6 | 0.0% |
| Mexico | 149 | 0.2% |
| Moldova | 32 | 0.1% |
| Morocco | 52 | 0.1% |
| Nepal | 44 | 0.1% |
| Nicaragua | 12 | 0.0% |
| Nigeria | 60 | 0.1% |
| Northern Africa | 67 | 0.1% |
| Northern Europe | 393 | 0.6% |
| Norway | 5 | 0.0% |
| Oceania | 18 | 0.0% |
| Pakistan | 340 | 0.5% |
| Peru | 286 | 0.4% |
| Philippines | 57 | 0.1% |
| Poland | 47 | 0.1% |
| Portugal | 10 | 0.0% |
| Romania | 31 | 0.1% |
| Russia | 302 | 0.5% |
| Saudi Arabia | 17 | 0.0% |
| Senegal | 30 | 0.1% |
| Singapore | 11 | 0.0% |
| Somalia | 3 | 0.0% |
| South America | 1,115 | 1.7% |
| South Central Asia | 2,676 | 4.1% |
| South Eastern Asia | 599 | 0.9% |
| Southern Europe | 468 | 0.7% |
| Spain | 44 | 0.1% |
| Sri Lanka | 39 | 0.1% |
| Sweden | 13 | 0.0% |
| Switzerland | 22 | 0.0% |
| Syria | 91 | 0.1% |
| Taiwan | 428 | 0.7% |
| Thailand | 66 | 0.1% |
| Trinidad and Tobago | 69 | 0.1% |
| Turkey | 179 | 0.3% |
| Uganda | 871 | 1.3% |
| Ukraine | 178 | 0.3% |
| Venezuela | 79 | 0.1% |
| Vietnam | 292 | 0.4% |
| Western Africa | 117 | 0.2% |
| Western Asia | 1,047 | 1.6% |
| Western Europe | 146 | 0.2% |
| Zimbabwe | 133 | 0.2% | View All 96 Rows |
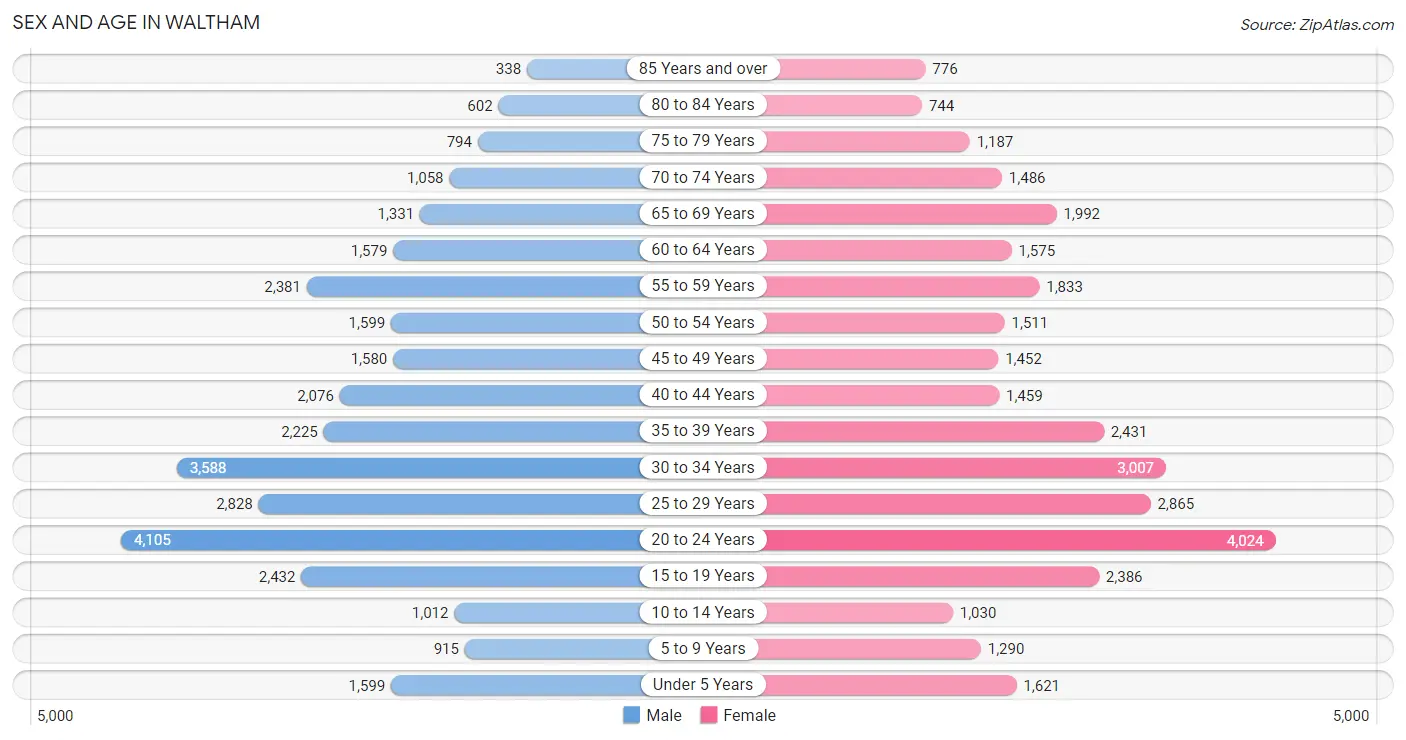
Sex and Age in Waltham
Sex and Age in Waltham
The most populous age groups in Waltham are 20 to 24 Years (4,105 | 12.8%) for men and 20 to 24 Years (4,024 | 12.3%) for women.
| Age Bracket | Male | Female |
| Under 5 Years | 1,599 (5.0%) | 1,621 (5.0%) |
| 5 to 9 Years | 915 (2.9%) | 1,290 (4.0%) |
| 10 to 14 Years | 1,012 (3.2%) | 1,030 (3.2%) |
| 15 to 19 Years | 2,432 (7.6%) | 2,386 (7.3%) |
| 20 to 24 Years | 4,105 (12.8%) | 4,024 (12.3%) |
| 25 to 29 Years | 2,828 (8.8%) | 2,865 (8.8%) |
| 30 to 34 Years | 3,588 (11.2%) | 3,007 (9.2%) |
| 35 to 39 Years | 2,225 (6.9%) | 2,431 (7.4%) |
| 40 to 44 Years | 2,076 (6.5%) | 1,459 (4.5%) |
| 45 to 49 Years | 1,580 (4.9%) | 1,452 (4.4%) |
| 50 to 54 Years | 1,599 (5.0%) | 1,511 (4.6%) |
| 55 to 59 Years | 2,381 (7.4%) | 1,833 (5.6%) |
| 60 to 64 Years | 1,579 (4.9%) | 1,575 (4.8%) |
| 65 to 69 Years | 1,331 (4.2%) | 1,992 (6.1%) |
| 70 to 74 Years | 1,058 (3.3%) | 1,486 (4.5%) |
| 75 to 79 Years | 794 (2.5%) | 1,187 (3.6%) |
| 80 to 84 Years | 602 (1.9%) | 744 (2.3%) |
| 85 Years and over | 338 (1.1%) | 776 (2.4%) |
| Total | 32,042 (100.0%) | 32,669 (100.0%) |
Families and Households in Waltham
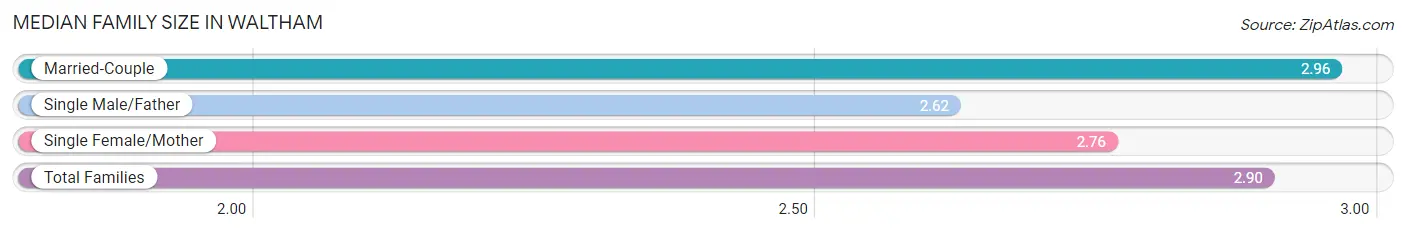
Median Family Size in Waltham
The median family size in Waltham is 2.90 persons per family, with married-couple families (9,952 | 75.2%) accounting for the largest median family size of 2.96 persons per family. On the other hand, single male/father families (990 | 7.5%) represent the smallest median family size with 2.62 persons per family.
| Family Type | # Families | Family Size |
| Married-Couple | 9,952 (75.2%) | 2.96 |
| Single Male/Father | 990 (7.5%) | 2.62 |
| Single Female/Mother | 2,290 (17.3%) | 2.76 |
| Total Families | 13,232 (100.0%) | 2.90 |
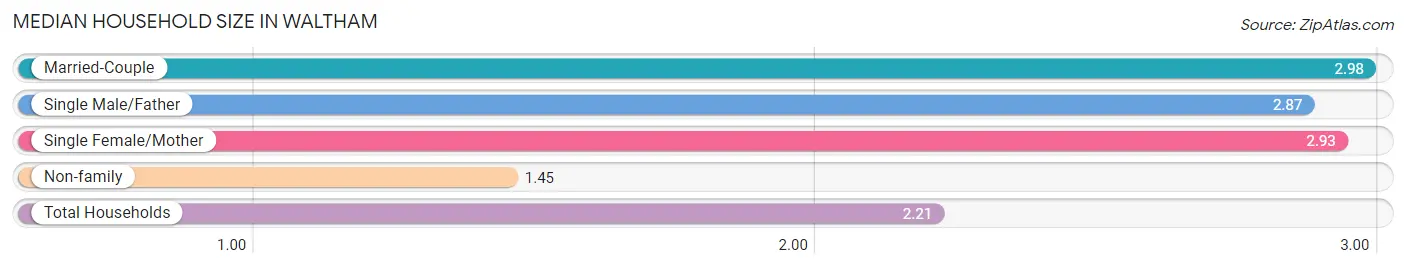
Median Household Size in Waltham
The median household size in Waltham is 2.21 persons per household, with married-couple households (9,952 | 38.1%) accounting for the largest median household size of 2.98 persons per household. non-family households (12,892 | 49.3%) represent the smallest median household size with 1.45 persons per household.
| Household Type | # Households | Household Size |
| Married-Couple | 9,952 (38.1%) | 2.98 |
| Single Male/Father | 990 (3.8%) | 2.87 |
| Single Female/Mother | 2,290 (8.8%) | 2.93 |
| Non-family | 12,892 (49.3%) | 1.45 |
| Total Households | 26,124 (100.0%) | 2.21 |
Household Size by Marriage Status in Waltham
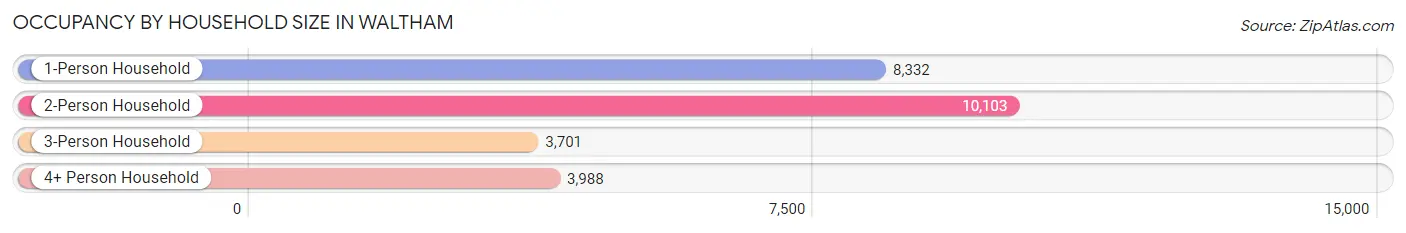
Out of a total of 26,124 households in Waltham, 13,232 (50.6%) are family households, while 12,892 (49.3%) are nonfamily households. The most numerous type of family households are 2-person households, comprising 6,479, and the most common type of nonfamily households are 1-person households, comprising 8,332.
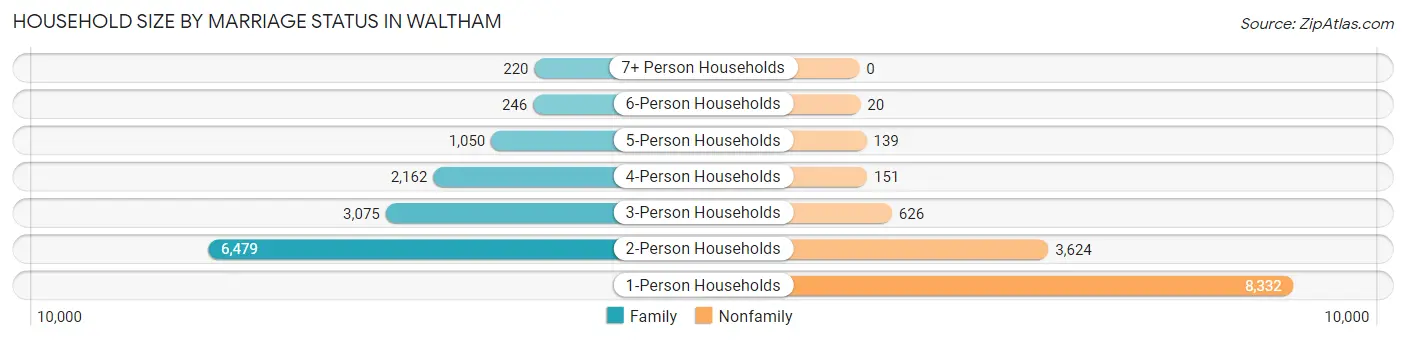
| Household Size | Family Households | Nonfamily Households |
| 1-Person Households | - | 8,332 (31.9%) |
| 2-Person Households | 6,479 (24.8%) | 3,624 (13.9%) |
| 3-Person Households | 3,075 (11.8%) | 626 (2.4%) |
| 4-Person Households | 2,162 (8.3%) | 151 (0.6%) |
| 5-Person Households | 1,050 (4.0%) | 139 (0.5%) |
| 6-Person Households | 246 (0.9%) | 20 (0.1%) |
| 7+ Person Households | 220 (0.8%) | 0 (0.0%) |
| Total | 13,232 (50.6%) | 12,892 (49.3%) |
Female Fertility in Waltham
Fertility by Age in Waltham
Average fertility rate in Waltham is 31.0 births per 1,000 women. Women in the age bracket of 35 to 50 years have the highest fertility rate with 55.0 births per 1,000 women. Women in the age bracket of 35 to 50 years acount for 56.3% of all women with births.
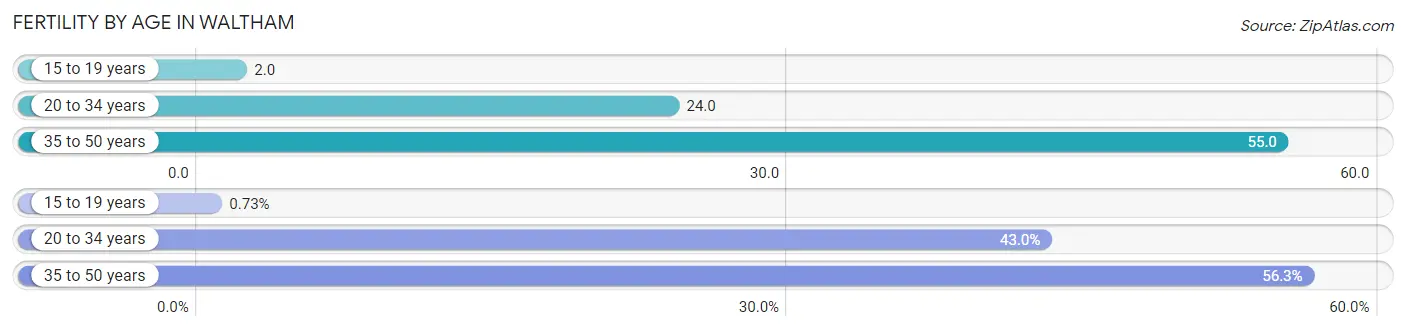
| Age Bracket | Women with Births | Births / 1,000 Women |
| 15 to 19 years | 4 (0.7%) | 2.0 |
| 20 to 34 years | 235 (43.0%) | 24.0 |
| 35 to 50 years | 308 (56.3%) | 55.0 |
| Total | 547 (100.0%) | 31.0 |
Fertility by Age by Marriage Status in Waltham
84.1% of women with births (547) in Waltham are married. The highest percentage of unmarried women with births falls into 15 to 19 years age bracket with 100.0% of them unmarried at the time of birth, while the lowest percentage of unmarried women with births belong to 20 to 34 years age bracket with 14.9% of them unmarried.
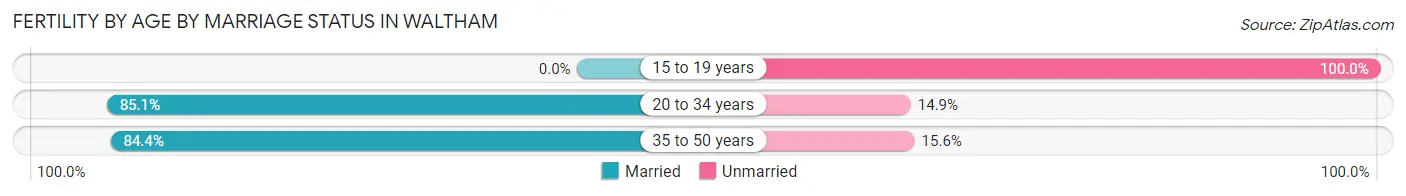
| Age Bracket | Married | Unmarried |
| 15 to 19 years | 0 (0.0%) | 4 (100.0%) |
| 20 to 34 years | 200 (85.1%) | 35 (14.9%) |
| 35 to 50 years | 260 (84.4%) | 48 (15.6%) |
| Total | 460 (84.1%) | 87 (15.9%) |
Fertility by Education in Waltham
Average fertility rate in Waltham is 31.0 births per 1,000 women. Women with the education attainment of graduate degree have the highest fertility rate of 63.0 births per 1,000 women, while women with the education attainment of college or associate's degree have the lowest fertility at 13.0 births per 1,000 women. Women with the education attainment of graduate degree represent 47.3% of all women with births.
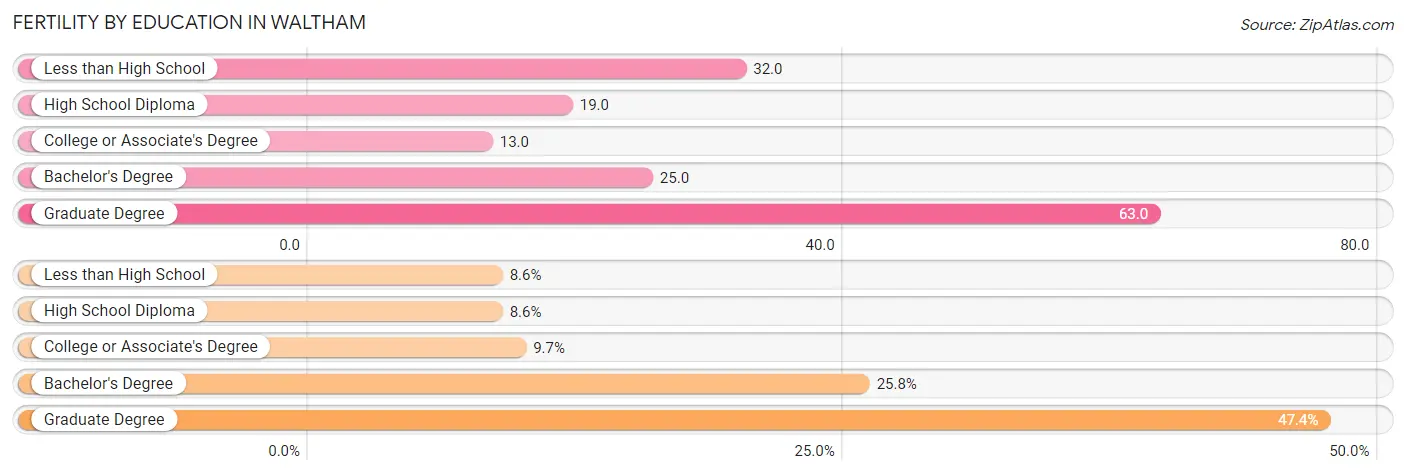
| Educational Attainment | Women with Births | Births / 1,000 Women |
| Less than High School | 47 (8.6%) | 32.0 |
| High School Diploma | 47 (8.6%) | 19.0 |
| College or Associate's Degree | 53 (9.7%) | 13.0 |
| Bachelor's Degree | 141 (25.8%) | 25.0 |
| Graduate Degree | 259 (47.3%) | 63.0 |
| Total | 547 (100.0%) | 31.0 |
Fertility by Education by Marriage Status in Waltham
15.9% of women with births in Waltham are unmarried. Women with the educational attainment of graduate degree are most likely to be married with 100.0% of them married at childbirth, while women with the educational attainment of high school diploma are least likely to be married with 42.5% of them unmarried at childbirth.
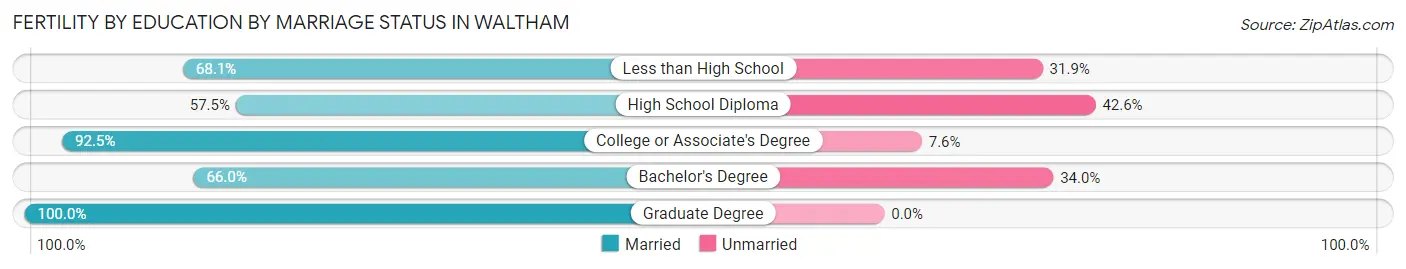
| Educational Attainment | Married | Unmarried |
| Less than High School | 32 (68.1%) | 15 (31.9%) |
| High School Diploma | 27 (57.5%) | 20 (42.5%) |
| College or Associate's Degree | 49 (92.4%) | 4 (7.5%) |
| Bachelor's Degree | 93 (66.0%) | 48 (34.0%) |
| Graduate Degree | 259 (100.0%) | 0 (0.0%) |
| Total | 460 (84.1%) | 87 (15.9%) |
Employment Characteristics in Waltham
Employment by Class of Employer in Waltham
Among the 37,697 employed individuals in Waltham, private company employees (25,453 | 67.5%), not-for-profit organizations (5,160 | 13.7%), and local government employees (2,528 | 6.7%) make up the most common classes of employment.
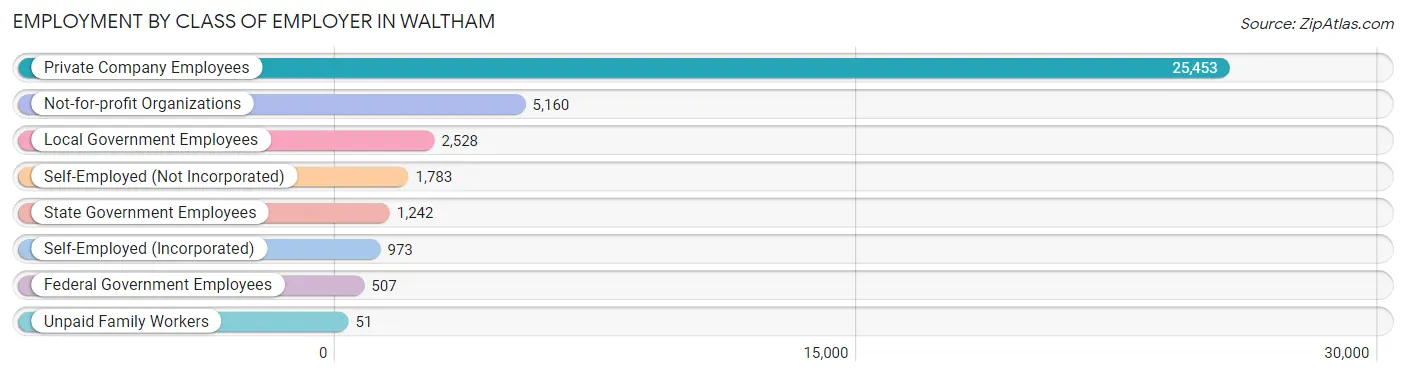
| Employer Class | # Employees | % Employees |
| Private Company Employees | 25,453 | 67.5% |
| Self-Employed (Incorporated) | 973 | 2.6% |
| Self-Employed (Not Incorporated) | 1,783 | 4.7% |
| Not-for-profit Organizations | 5,160 | 13.7% |
| Local Government Employees | 2,528 | 6.7% |
| State Government Employees | 1,242 | 3.3% |
| Federal Government Employees | 507 | 1.3% |
| Unpaid Family Workers | 51 | 0.1% |
| Total | 37,697 | 100.0% |
Employment Status by Age in Waltham
According to the labor force statistics for Waltham, out of the total population over 16 years of age (56,940), 69.3% or 39,459 individuals are in the labor force, with 3.1% or 1,223 of them unemployed. The age group with the highest labor force participation rate is 30 to 34 years, with 92.4% or 6,094 individuals in the labor force. Within the labor force, the 16 to 19 years age range has the highest percentage of unemployed individuals, with 9.3% or 132 of them being unemployed.
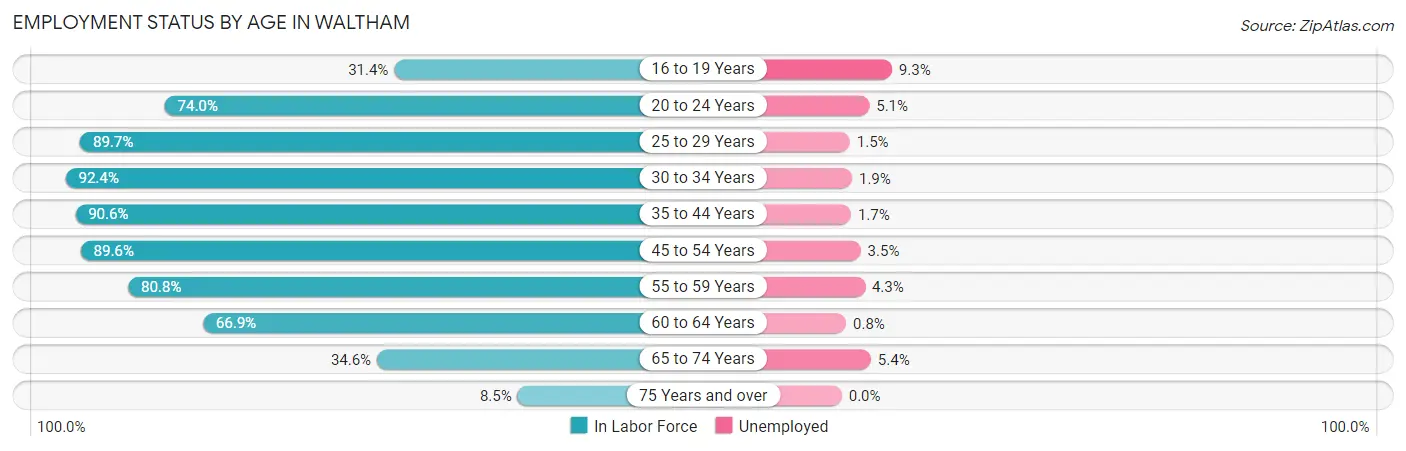
| Age Bracket | In Labor Force | Unemployed |
| 16 to 19 Years | 1,417 (31.4%) | 132 (9.3%) |
| 20 to 24 Years | 6,015 (74.0%) | 307 (5.1%) |
| 25 to 29 Years | 5,107 (89.7%) | 77 (1.5%) |
| 30 to 34 Years | 6,094 (92.4%) | 116 (1.9%) |
| 35 to 44 Years | 7,421 (90.6%) | 126 (1.7%) |
| 45 to 54 Years | 5,503 (89.6%) | 193 (3.5%) |
| 55 to 59 Years | 3,405 (80.8%) | 146 (4.3%) |
| 60 to 64 Years | 2,110 (66.9%) | 17 (0.8%) |
| 65 to 74 Years | 2,030 (34.6%) | 110 (5.4%) |
| 75 Years and over | 377 (8.5%) | 0 (0.0%) |
| Total | 39,459 (69.3%) | 1,223 (3.1%) |
Employment Status by Educational Attainment in Waltham
According to labor force statistics for Waltham, 87.2% of individuals (29,638) out of the total population between 25 and 64 years of age (33,989) are in the labor force, with 2.3% or 682 of them being unemployed. The group with the highest labor force participation rate are those with the educational attainment of bachelor's degree or higher, with 92.9% or 19,212 individuals in the labor force. Within the labor force, individuals with high school diploma education have the highest percentage of unemployment, with 6.5% or 246 of them being unemployed.
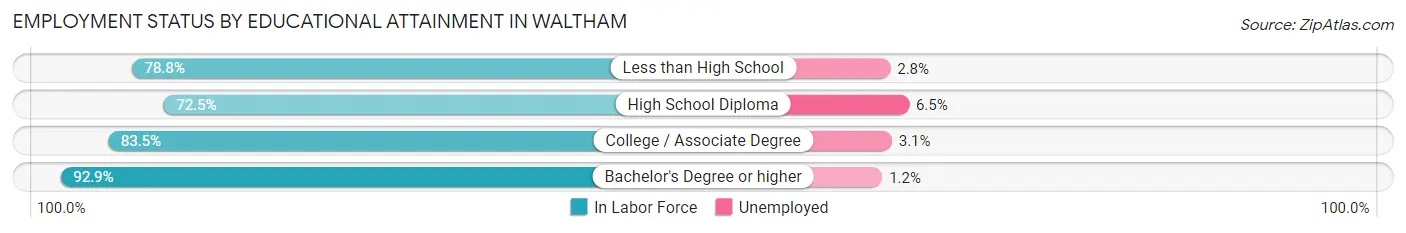
| Educational Attainment | In Labor Force | Unemployed |
| Less than High School | 1,696 (78.8%) | 60 (2.8%) |
| High School Diploma | 3,791 (72.5%) | 340 (6.5%) |
| College / Associate Degree | 4,950 (83.5%) | 184 (3.1%) |
| Bachelor's Degree or higher | 19,212 (92.9%) | 248 (1.2%) |
| Total | 29,638 (87.2%) | 782 (2.3%) |
Employment Occupations by Sex in Waltham
Management, Business, Science and Arts Occupations
The most common Management, Business, Science and Arts occupations in Waltham are Community & Social Service (6,084 | 15.9%), Computers, Engineering & Science (5,954 | 15.6%), Management (4,867 | 12.7%), Education Instruction & Library (3,908 | 10.2%), and Business & Financial (3,107 | 8.1%).
Management, Business, Science and Arts Occupations by Sex
Within the Management, Business, Science and Arts occupations in Waltham, the most male-oriented occupations are Computers & Mathematics (81.8%), Computers, Engineering & Science (67.9%), and Management (59.9%), while the most female-oriented occupations are Education, Arts & Media (81.1%), Health Diagnosing & Treating (78.1%), and Health Technologists (75.6%).
| Occupation | Male | Female |
| Management | 2,916 (59.9%) | 1,951 (40.1%) |
| Business & Financial | 1,412 (45.5%) | 1,695 (54.5%) |
| Computers, Engineering & Science | 4,042 (67.9%) | 1,912 (32.1%) |
| Computers & Mathematics | 2,427 (81.8%) | 541 (18.2%) |
| Architecture & Engineering | 949 (58.9%) | 662 (41.1%) |
| Life, Physical & Social Science | 666 (48.4%) | 709 (51.6%) |
| Community & Social Service | 2,031 (33.4%) | 4,053 (66.6%) |
| Education, Arts & Media | 142 (18.9%) | 608 (81.1%) |
| Legal Services & Support | 167 (49.4%) | 171 (50.6%) |
| Education Instruction & Library | 1,161 (29.7%) | 2,747 (70.3%) |
| Arts, Media & Entertainment | 561 (51.6%) | 527 (48.4%) |
| Health Diagnosing & Treating | 458 (21.8%) | 1,638 (78.1%) |
| Health Technologists | 341 (24.4%) | 1,055 (75.6%) |
| Total (Category) | 10,859 (49.1%) | 11,249 (50.9%) |
| Total (Overall) | 19,534 (51.1%) | 18,703 (48.9%) |
Services Occupations
The most common Services occupations in Waltham are Food Preparation & Serving (1,318 | 3.5%), Cleaning & Maintenance (1,276 | 3.3%), Healthcare Support (1,271 | 3.3%), Personal Care & Service (1,122 | 2.9%), and Security & Protection (515 | 1.3%).
Services Occupations by Sex
Within the Services occupations in Waltham, the most male-oriented occupations are Law Enforcement (90.3%), Security & Protection (78.1%), and Cleaning & Maintenance (74.8%), while the most female-oriented occupations are Personal Care & Service (79.9%), Healthcare Support (72.7%), and Food Preparation & Serving (48.4%).
| Occupation | Male | Female |
| Healthcare Support | 347 (27.3%) | 924 (72.7%) |
| Security & Protection | 402 (78.1%) | 113 (21.9%) |
| Firefighting & Prevention | 187 (67.5%) | 90 (32.5%) |
| Law Enforcement | 215 (90.3%) | 23 (9.7%) |
| Food Preparation & Serving | 680 (51.6%) | 638 (48.4%) |
| Cleaning & Maintenance | 954 (74.8%) | 322 (25.2%) |
| Personal Care & Service | 226 (20.1%) | 896 (79.9%) |
| Total (Category) | 2,609 (47.4%) | 2,893 (52.6%) |
| Total (Overall) | 19,534 (51.1%) | 18,703 (48.9%) |
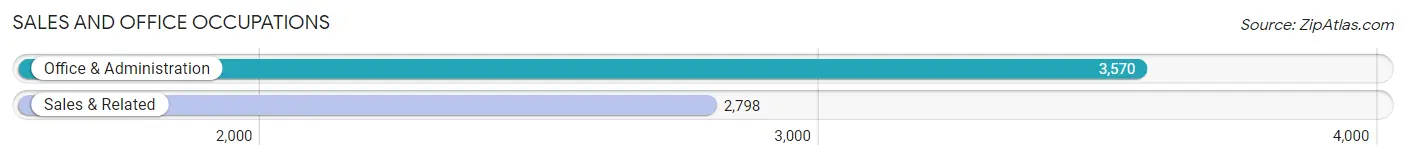
Sales and Office Occupations
The most common Sales and Office occupations in Waltham are Office & Administration (3,570 | 9.3%), and Sales & Related (2,798 | 7.3%).
Sales and Office Occupations by Sex
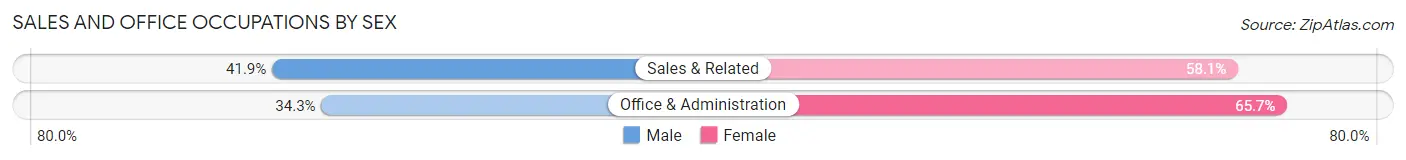
| Occupation | Male | Female |
| Sales & Related | 1,173 (41.9%) | 1,625 (58.1%) |
| Office & Administration | 1,226 (34.3%) | 2,344 (65.7%) |
| Total (Category) | 2,399 (37.7%) | 3,969 (62.3%) |
| Total (Overall) | 19,534 (51.1%) | 18,703 (48.9%) |
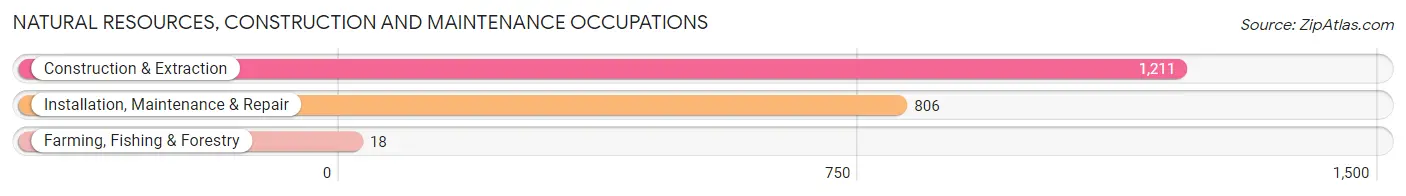
Natural Resources, Construction and Maintenance Occupations
The most common Natural Resources, Construction and Maintenance occupations in Waltham are Construction & Extraction (1,211 | 3.2%), Installation, Maintenance & Repair (806 | 2.1%), and Farming, Fishing & Forestry (18 | 0.1%).
Natural Resources, Construction and Maintenance Occupations by Sex
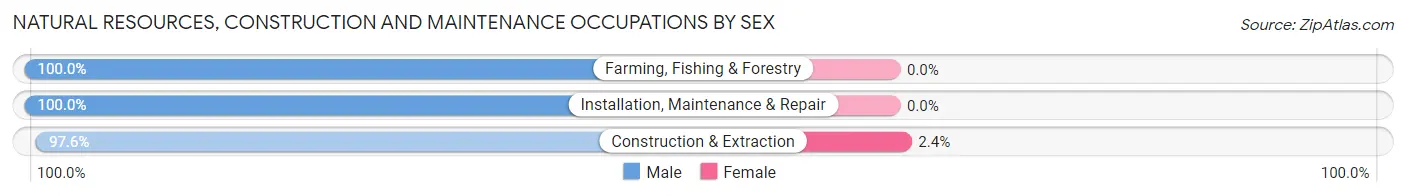
| Occupation | Male | Female |
| Farming, Fishing & Forestry | 18 (100.0%) | 0 (0.0%) |
| Construction & Extraction | 1,182 (97.6%) | 29 (2.4%) |
| Installation, Maintenance & Repair | 806 (100.0%) | 0 (0.0%) |
| Total (Category) | 2,006 (98.6%) | 29 (1.4%) |
| Total (Overall) | 19,534 (51.1%) | 18,703 (48.9%) |
Production, Transportation and Moving Occupations
The most common Production, Transportation and Moving occupations in Waltham are Production (939 | 2.5%), Material Moving (749 | 2.0%), and Transportation (536 | 1.4%).
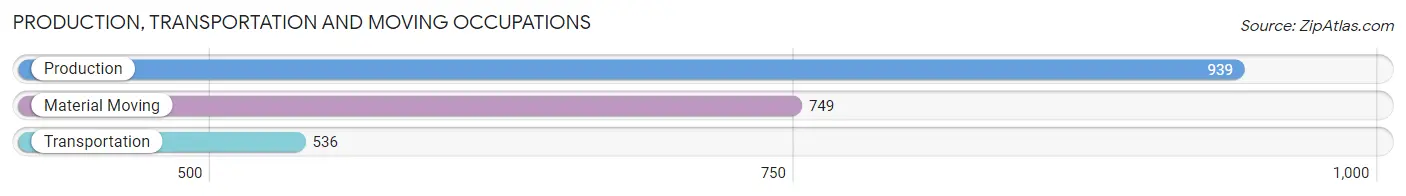
Production, Transportation and Moving Occupations by Sex
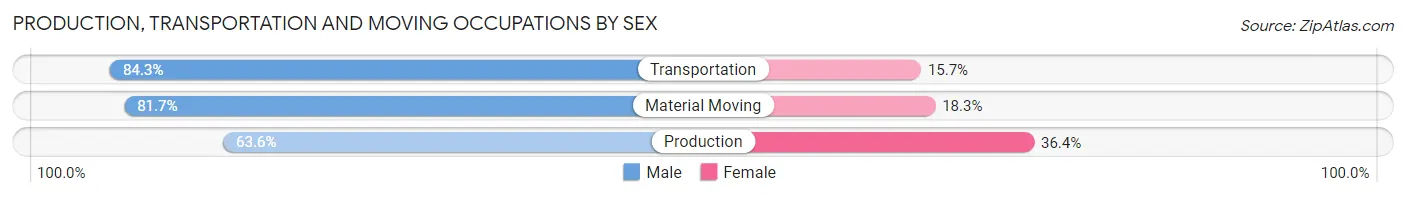
| Occupation | Male | Female |
| Production | 597 (63.6%) | 342 (36.4%) |
| Transportation | 452 (84.3%) | 84 (15.7%) |
| Material Moving | 612 (81.7%) | 137 (18.3%) |
| Total (Category) | 1,661 (74.7%) | 563 (25.3%) |
| Total (Overall) | 19,534 (51.1%) | 18,703 (48.9%) |
Employment Industries by Sex in Waltham
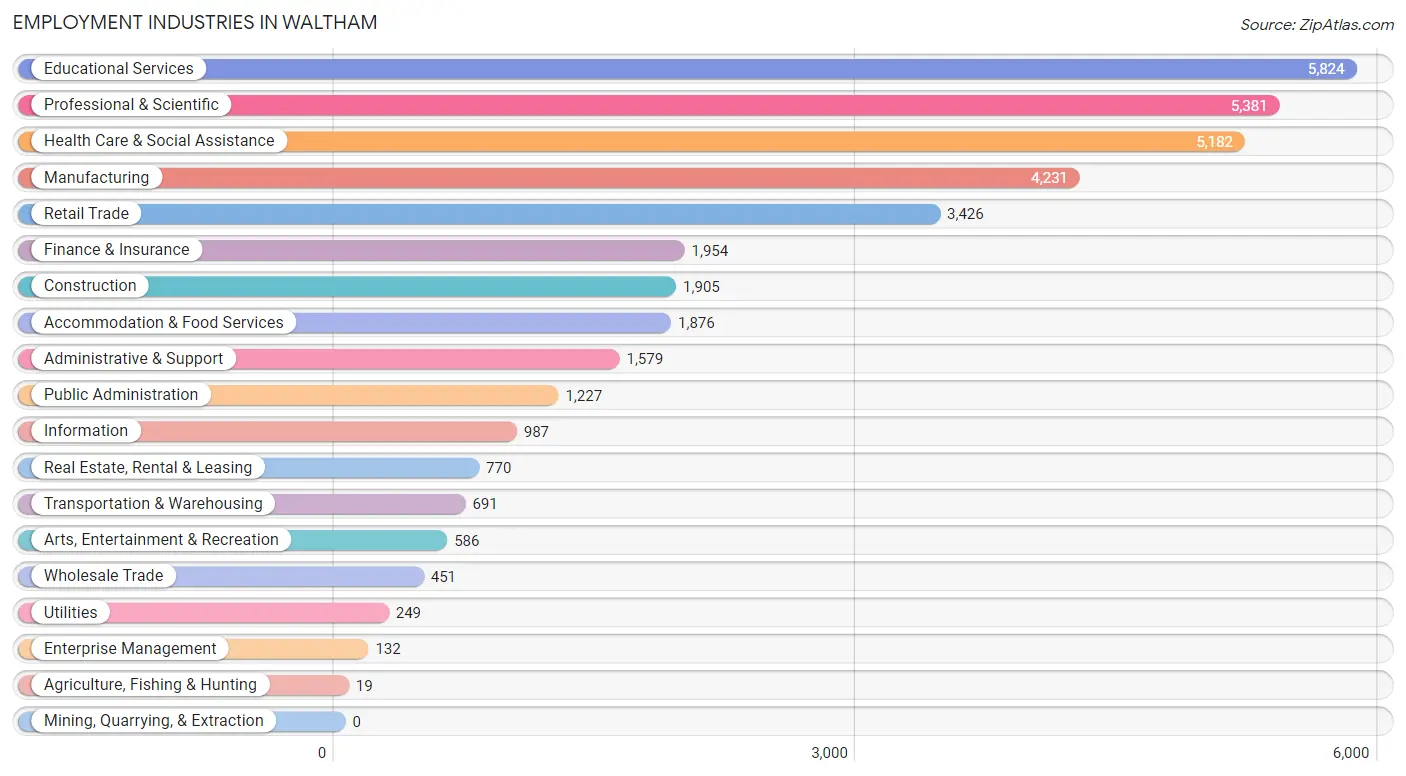
Employment Industries in Waltham
The major employment industries in Waltham include Educational Services (5,824 | 15.2%), Professional & Scientific (5,381 | 14.1%), Health Care & Social Assistance (5,182 | 13.6%), Manufacturing (4,231 | 11.1%), and Retail Trade (3,426 | 9.0%).
Employment Industries by Sex in Waltham
The Waltham industries that see more men than women are Construction (94.4%), Transportation & Warehousing (94.1%), and Enterprise Management (83.3%), whereas the industries that tend to have a higher number of women are Agriculture, Fishing & Hunting (100.0%), Wholesale Trade (86.9%), and Health Care & Social Assistance (75.9%).
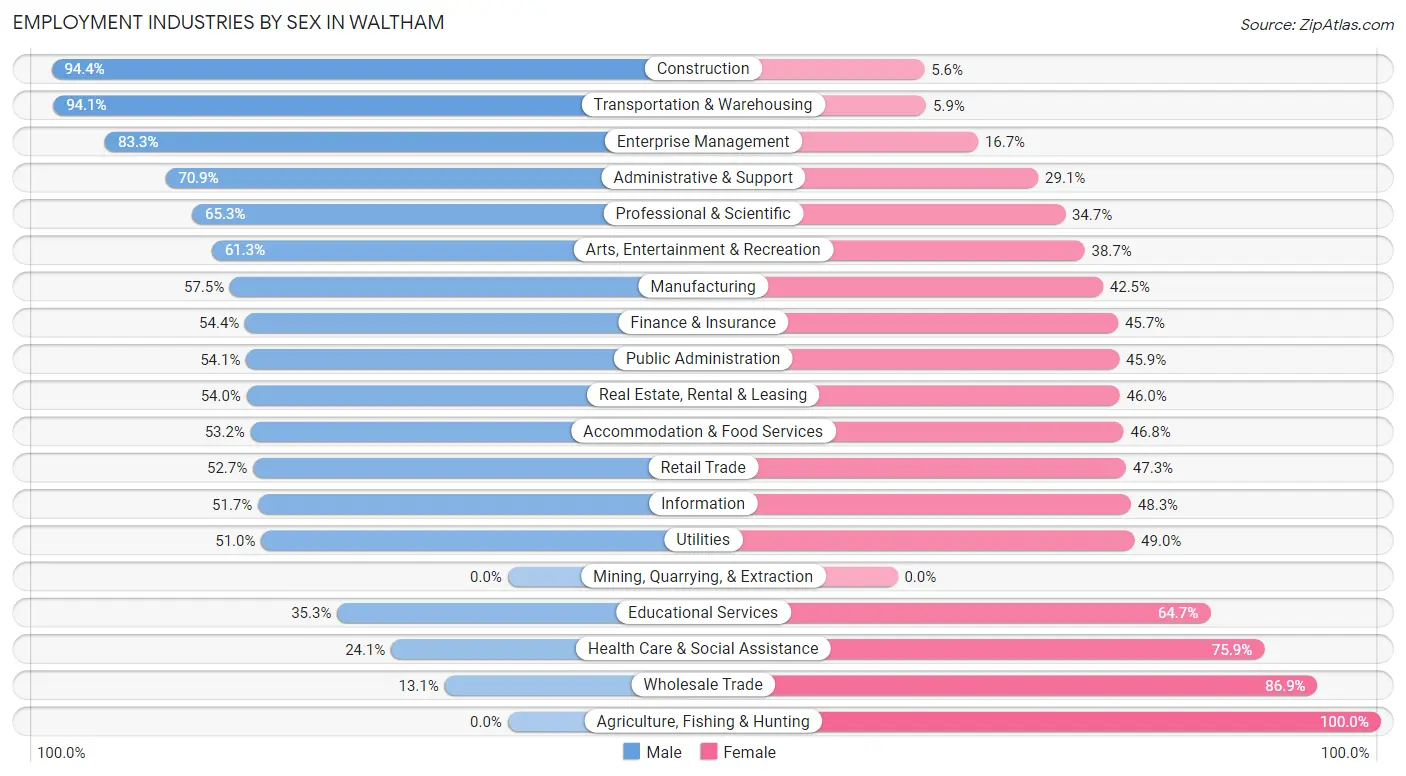
| Industry | Male | Female |
| Agriculture, Fishing & Hunting | 0 (0.0%) | 19 (100.0%) |
| Mining, Quarrying, & Extraction | 0 (0.0%) | 0 (0.0%) |
| Construction | 1,799 (94.4%) | 106 (5.6%) |
| Manufacturing | 2,432 (57.5%) | 1,799 (42.5%) |
| Wholesale Trade | 59 (13.1%) | 392 (86.9%) |
| Retail Trade | 1,806 (52.7%) | 1,620 (47.3%) |
| Transportation & Warehousing | 650 (94.1%) | 41 (5.9%) |
| Utilities | 127 (51.0%) | 122 (49.0%) |
| Information | 510 (51.7%) | 477 (48.3%) |
| Finance & Insurance | 1,062 (54.3%) | 892 (45.7%) |
| Real Estate, Rental & Leasing | 416 (54.0%) | 354 (46.0%) |
| Professional & Scientific | 3,515 (65.3%) | 1,866 (34.7%) |
| Enterprise Management | 110 (83.3%) | 22 (16.7%) |
| Administrative & Support | 1,119 (70.9%) | 460 (29.1%) |
| Educational Services | 2,055 (35.3%) | 3,769 (64.7%) |
| Health Care & Social Assistance | 1,250 (24.1%) | 3,932 (75.9%) |
| Arts, Entertainment & Recreation | 359 (61.3%) | 227 (38.7%) |
| Accommodation & Food Services | 998 (53.2%) | 878 (46.8%) |
| Public Administration | 664 (54.1%) | 563 (45.9%) |
| Total | 19,534 (51.1%) | 18,703 (48.9%) |
Education in Waltham
School Enrollment in Waltham
The most common levels of schooling among the 17,667 students in Waltham are college / undergraduate (8,366 | 47.3%), graduate / professional (2,794 | 15.8%), and middle school (1,800 | 10.2%).
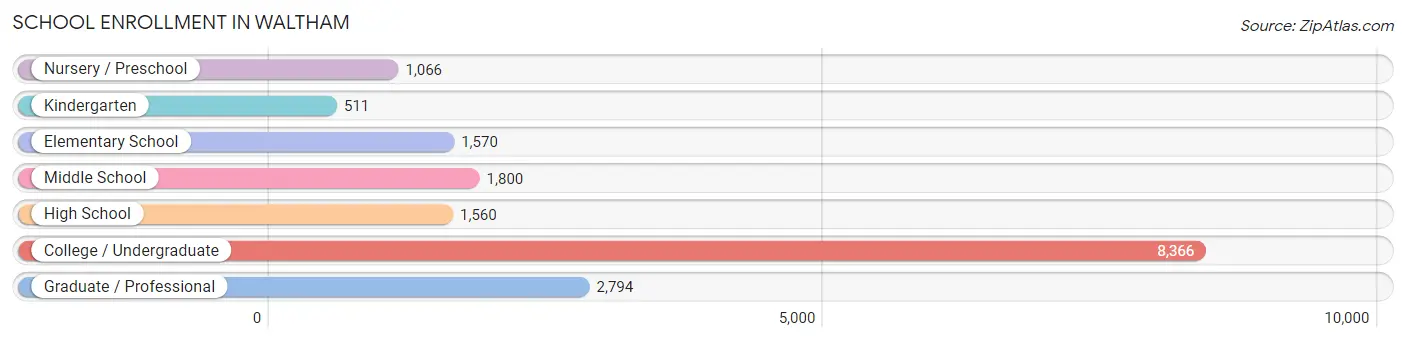
| School Level | # Students | % Students |
| Nursery / Preschool | 1,066 | 6.0% |
| Kindergarten | 511 | 2.9% |
| Elementary School | 1,570 | 8.9% |
| Middle School | 1,800 | 10.2% |
| High School | 1,560 | 8.8% |
| College / Undergraduate | 8,366 | 47.3% |
| Graduate / Professional | 2,794 | 15.8% |
| Total | 17,667 | 100.0% |
School Enrollment by Age by Funding Source in Waltham
Out of a total of 17,667 students who are enrolled in schools in Waltham, 8,993 (50.9%) attend a private institution, while the remaining 8,674 (49.1%) are enrolled in public schools. The age group of 18 to 19 year olds has the highest likelihood of being enrolled in private schools, with 2,792 (78.1% in the age bracket) enrolled. Conversely, the age group of 10 to 14 year olds has the lowest likelihood of being enrolled in a private school, with 1,853 (90.7% in the age bracket) attending a public institution.
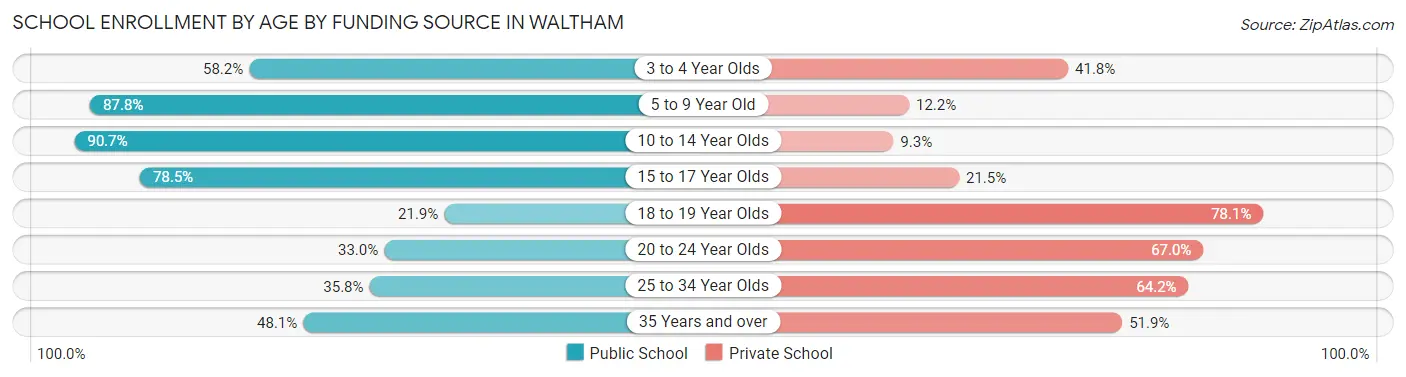
| Age Bracket | Public School | Private School |
| 3 to 4 Year Olds | 565 (58.2%) | 406 (41.8%) |
| 5 to 9 Year Old | 1,824 (87.8%) | 253 (12.2%) |
| 10 to 14 Year Olds | 1,853 (90.7%) | 189 (9.3%) |
| 15 to 17 Year Olds | 877 (78.5%) | 240 (21.5%) |
| 18 to 19 Year Olds | 781 (21.9%) | 2,792 (78.1%) |
| 20 to 24 Year Olds | 1,710 (33.0%) | 3,465 (67.0%) |
| 25 to 34 Year Olds | 676 (35.8%) | 1,213 (64.2%) |
| 35 Years and over | 396 (48.1%) | 427 (51.9%) |
| Total | 8,674 (49.1%) | 8,993 (50.9%) |
Educational Attainment by Field of Study in Waltham
Business (4,199 | 15.5%), engineering (3,082 | 11.4%), social sciences (2,120 | 7.8%), education (2,001 | 7.4%), and psychology (1,963 | 7.2%) are the most common fields of study among 27,141 individuals in Waltham who have obtained a bachelor's degree or higher.
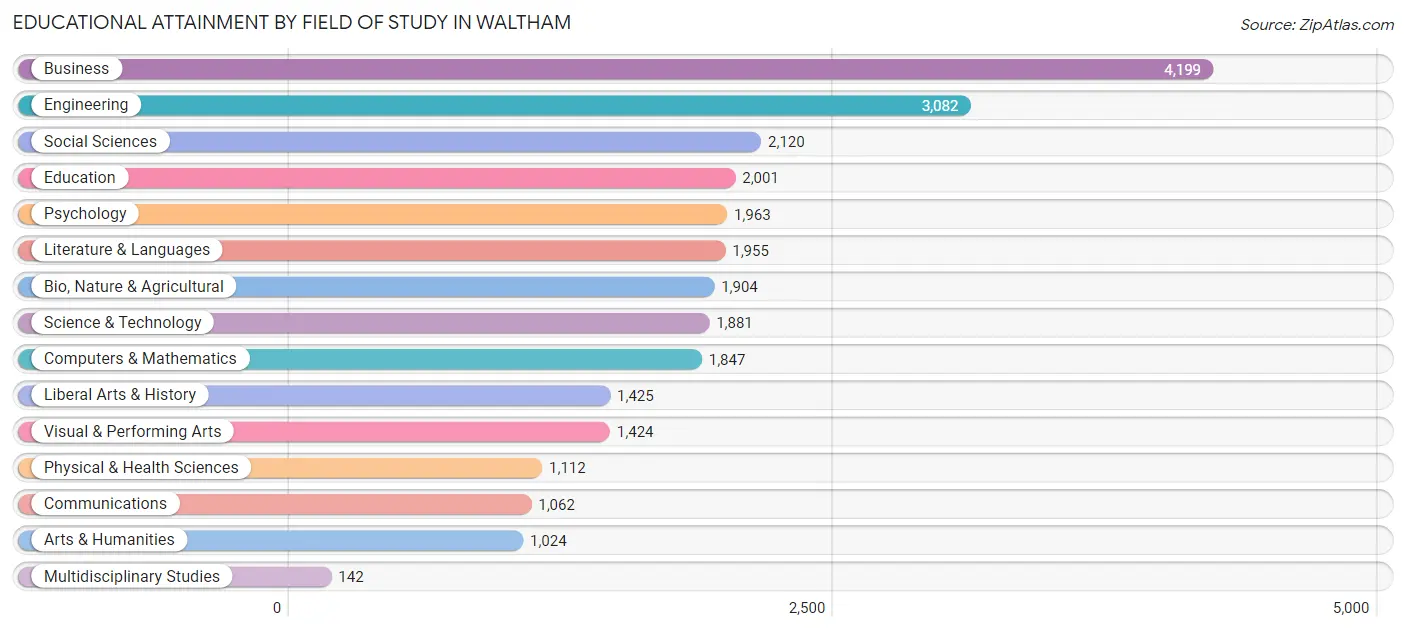
| Field of Study | # Graduates | % Graduates |
| Computers & Mathematics | 1,847 | 6.8% |
| Bio, Nature & Agricultural | 1,904 | 7.0% |
| Physical & Health Sciences | 1,112 | 4.1% |
| Psychology | 1,963 | 7.2% |
| Social Sciences | 2,120 | 7.8% |
| Engineering | 3,082 | 11.4% |
| Multidisciplinary Studies | 142 | 0.5% |
| Science & Technology | 1,881 | 6.9% |
| Business | 4,199 | 15.5% |
| Education | 2,001 | 7.4% |
| Literature & Languages | 1,955 | 7.2% |
| Liberal Arts & History | 1,425 | 5.2% |
| Visual & Performing Arts | 1,424 | 5.2% |
| Communications | 1,062 | 3.9% |
| Arts & Humanities | 1,024 | 3.8% |
| Total | 27,141 | 100.0% |
Transportation & Commute in Waltham
Vehicle Availability by Sex in Waltham
The most prevalent vehicle ownership categories in Waltham are males with 2 vehicles (8,295, accounting for 45.3%) and females with 2 vehicles (8,137, making up 48.8%).
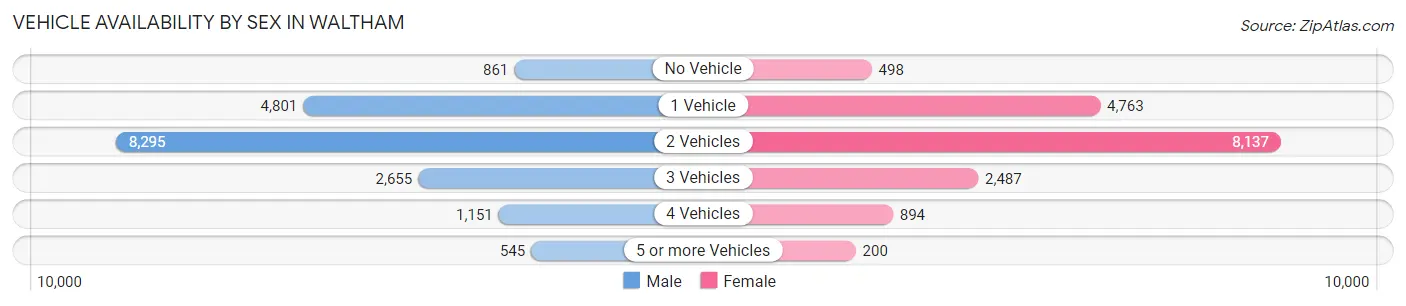
| Vehicles Available | Male | Female |
| No Vehicle | 861 (4.7%) | 498 (2.9%) |
| 1 Vehicle | 4,801 (26.2%) | 4,763 (28.1%) |
| 2 Vehicles | 8,295 (45.3%) | 8,137 (47.9%) |
| 3 Vehicles | 2,655 (14.5%) | 2,487 (14.6%) |
| 4 Vehicles | 1,151 (6.3%) | 894 (5.3%) |
| 5 or more Vehicles | 545 (3.0%) | 200 (1.2%) |
| Total | 18,308 (100.0%) | 16,979 (100.0%) |
Commute Time in Waltham
The most frequently occuring commute durations in Waltham are 30 to 34 minutes (5,148 commuters, 16.8%), 20 to 24 minutes (5,052 commuters, 16.5%), and 10 to 14 minutes (4,552 commuters, 14.8%).
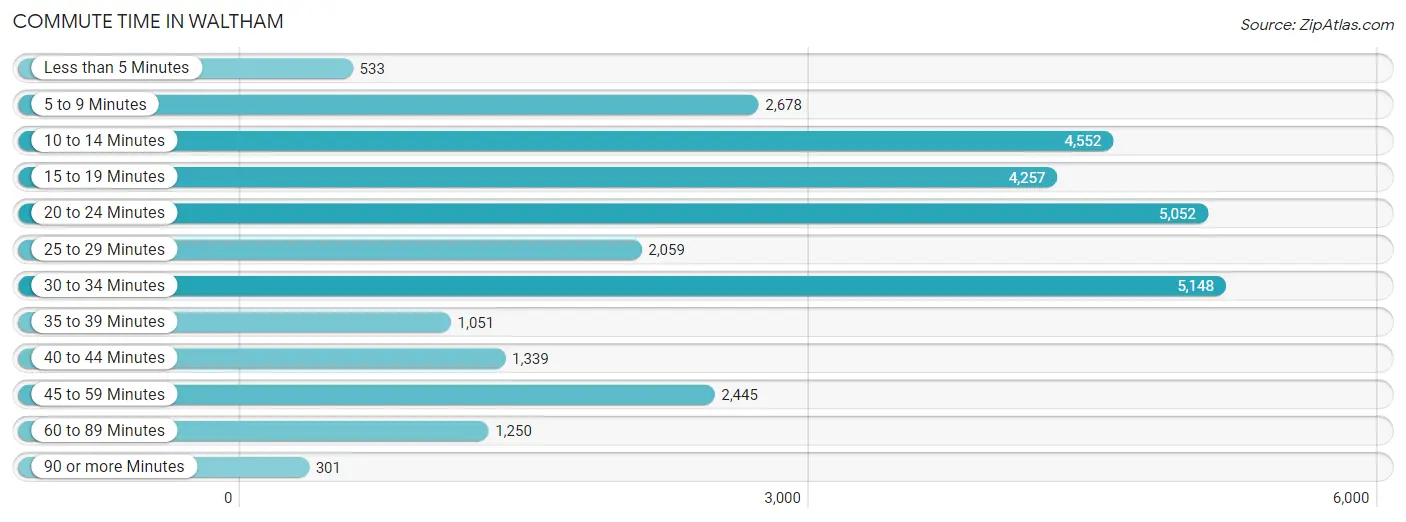
| Commute Time | # Commuters | % Commuters |
| Less than 5 Minutes | 533 | 1.7% |
| 5 to 9 Minutes | 2,678 | 8.7% |
| 10 to 14 Minutes | 4,552 | 14.8% |
| 15 to 19 Minutes | 4,257 | 13.9% |
| 20 to 24 Minutes | 5,052 | 16.5% |
| 25 to 29 Minutes | 2,059 | 6.7% |
| 30 to 34 Minutes | 5,148 | 16.8% |
| 35 to 39 Minutes | 1,051 | 3.4% |
| 40 to 44 Minutes | 1,339 | 4.4% |
| 45 to 59 Minutes | 2,445 | 8.0% |
| 60 to 89 Minutes | 1,250 | 4.1% |
| 90 or more Minutes | 301 | 1.0% |
Commute Time by Sex in Waltham
The most common commute times in Waltham are 20 to 24 minutes (2,774 commuters, 17.9%) for males and 30 to 34 minutes (2,738 commuters, 18.0%) for females.
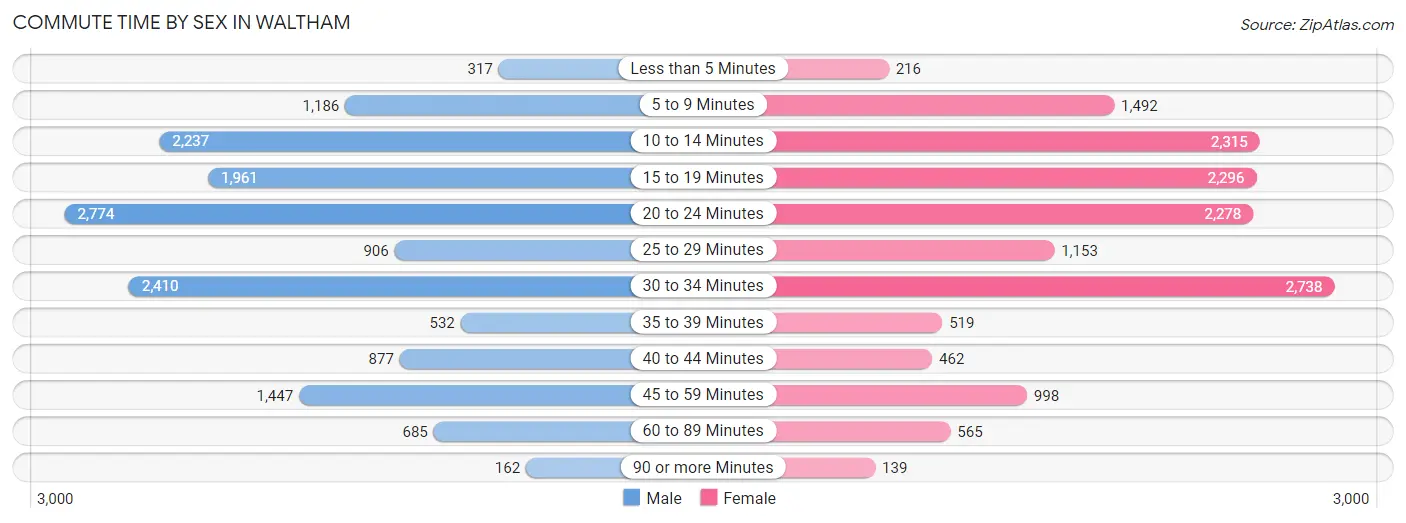
| Commute Time | Male | Female |
| Less than 5 Minutes | 317 (2.1%) | 216 (1.4%) |
| 5 to 9 Minutes | 1,186 (7.6%) | 1,492 (9.8%) |
| 10 to 14 Minutes | 2,237 (14.4%) | 2,315 (15.3%) |
| 15 to 19 Minutes | 1,961 (12.7%) | 2,296 (15.1%) |
| 20 to 24 Minutes | 2,774 (17.9%) | 2,278 (15.0%) |
| 25 to 29 Minutes | 906 (5.9%) | 1,153 (7.6%) |
| 30 to 34 Minutes | 2,410 (15.5%) | 2,738 (18.0%) |
| 35 to 39 Minutes | 532 (3.4%) | 519 (3.4%) |
| 40 to 44 Minutes | 877 (5.7%) | 462 (3.0%) |
| 45 to 59 Minutes | 1,447 (9.3%) | 998 (6.6%) |
| 60 to 89 Minutes | 685 (4.4%) | 565 (3.7%) |
| 90 or more Minutes | 162 (1.1%) | 139 (0.9%) |
Time of Departure to Work by Sex in Waltham
The most frequent times of departure to work in Waltham are 8:00 AM to 8:29 AM (2,209, 14.3%) for males and 7:00 AM to 7:29 AM (2,522, 16.6%) for females.
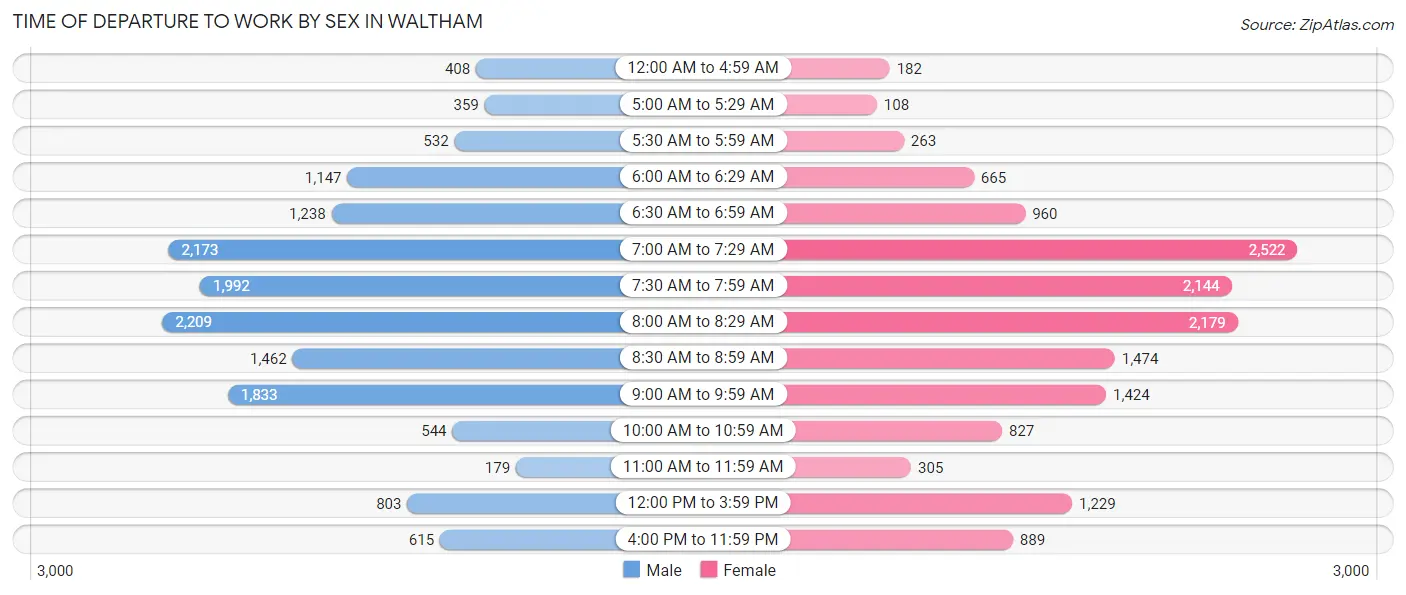
| Time of Departure | Male | Female |
| 12:00 AM to 4:59 AM | 408 (2.6%) | 182 (1.2%) |
| 5:00 AM to 5:29 AM | 359 (2.3%) | 108 (0.7%) |
| 5:30 AM to 5:59 AM | 532 (3.4%) | 263 (1.7%) |
| 6:00 AM to 6:29 AM | 1,147 (7.4%) | 665 (4.4%) |
| 6:30 AM to 6:59 AM | 1,238 (8.0%) | 960 (6.3%) |
| 7:00 AM to 7:29 AM | 2,173 (14.0%) | 2,522 (16.6%) |
| 7:30 AM to 7:59 AM | 1,992 (12.9%) | 2,144 (14.1%) |
| 8:00 AM to 8:29 AM | 2,209 (14.3%) | 2,179 (14.4%) |
| 8:30 AM to 8:59 AM | 1,462 (9.4%) | 1,474 (9.7%) |
| 9:00 AM to 9:59 AM | 1,833 (11.8%) | 1,424 (9.4%) |
| 10:00 AM to 10:59 AM | 544 (3.5%) | 827 (5.4%) |
| 11:00 AM to 11:59 AM | 179 (1.2%) | 305 (2.0%) |
| 12:00 PM to 3:59 PM | 803 (5.2%) | 1,229 (8.1%) |
| 4:00 PM to 11:59 PM | 615 (4.0%) | 889 (5.9%) |
| Total | 15,494 (100.0%) | 15,171 (100.0%) |
Housing Occupancy in Waltham
Occupancy by Ownership in Waltham
Of the total 26,124 dwellings in Waltham, owner-occupied units account for 12,518 (47.9%), while renter-occupied units make up 13,606 (52.1%).
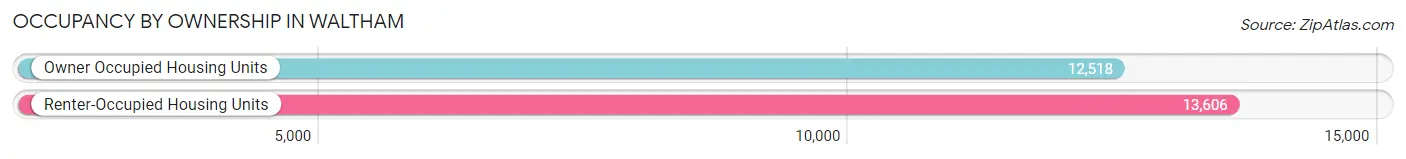
| Occupancy | # Housing Units | % Housing Units |
| Owner Occupied Housing Units | 12,518 | 47.9% |
| Renter-Occupied Housing Units | 13,606 | 52.1% |
| Total Occupied Housing Units | 26,124 | 100.0% |
Occupancy by Household Size in Waltham
| Household Size | # Housing Units | % Housing Units |
| 1-Person Household | 8,332 | 31.9% |
| 2-Person Household | 10,103 | 38.7% |
| 3-Person Household | 3,701 | 14.2% |
| 4+ Person Household | 3,988 | 15.3% |
| Total Housing Units | 26,124 | 100.0% |
Occupancy by Ownership by Household Size in Waltham
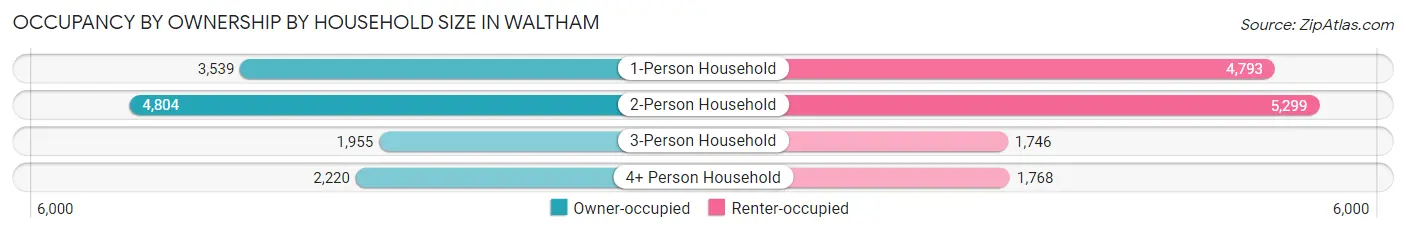
| Household Size | Owner-occupied | Renter-occupied |
| 1-Person Household | 3,539 (42.5%) | 4,793 (57.5%) |
| 2-Person Household | 4,804 (47.5%) | 5,299 (52.4%) |
| 3-Person Household | 1,955 (52.8%) | 1,746 (47.2%) |
| 4+ Person Household | 2,220 (55.7%) | 1,768 (44.3%) |
| Total Housing Units | 12,518 (47.9%) | 13,606 (52.1%) |
Occupancy by Educational Attainment in Waltham
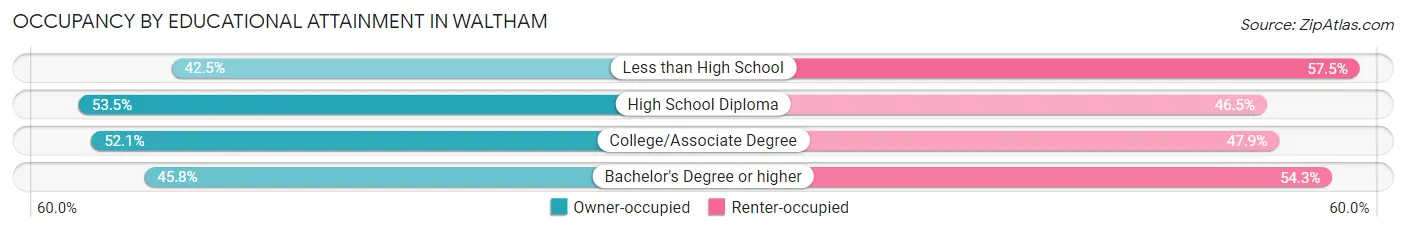
| Household Size | Owner-occupied | Renter-occupied |
| Less than High School | 661 (42.5%) | 894 (57.5%) |
| High School Diploma | 2,301 (53.5%) | 1,997 (46.5%) |
| College/Associate Degree | 2,322 (52.1%) | 2,137 (47.9%) |
| Bachelor's Degree or higher | 7,234 (45.8%) | 8,578 (54.2%) |
Occupancy by Age of Householder in Waltham
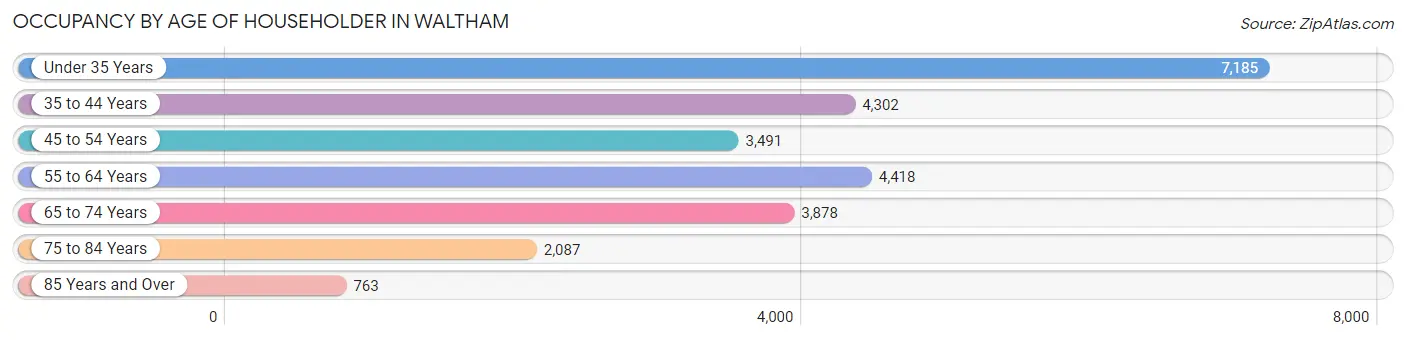
| Age Bracket | # Households | % Households |
| Under 35 Years | 7,185 | 27.5% |
| 35 to 44 Years | 4,302 | 16.5% |
| 45 to 54 Years | 3,491 | 13.4% |
| 55 to 64 Years | 4,418 | 16.9% |
| 65 to 74 Years | 3,878 | 14.8% |
| 75 to 84 Years | 2,087 | 8.0% |
| 85 Years and Over | 763 | 2.9% |
| Total | 26,124 | 100.0% |
Housing Finances in Waltham
Median Income by Occupancy in Waltham
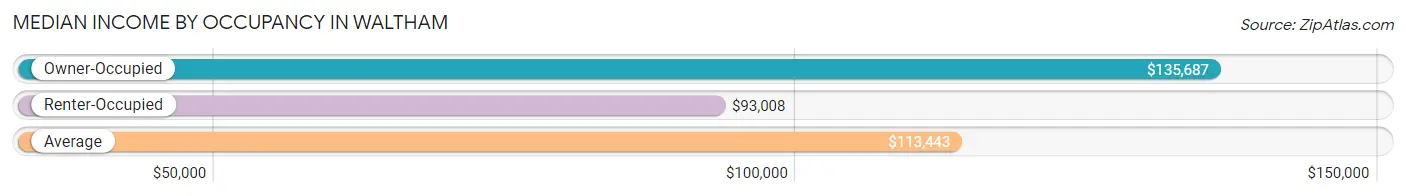
| Occupancy Type | # Households | Median Income |
| Owner-Occupied | 12,518 (47.9%) | $135,687 |
| Renter-Occupied | 13,606 (52.1%) | $93,008 |
| Average | 26,124 (100.0%) | $113,443 |
Occupancy by Householder Income Bracket in Waltham
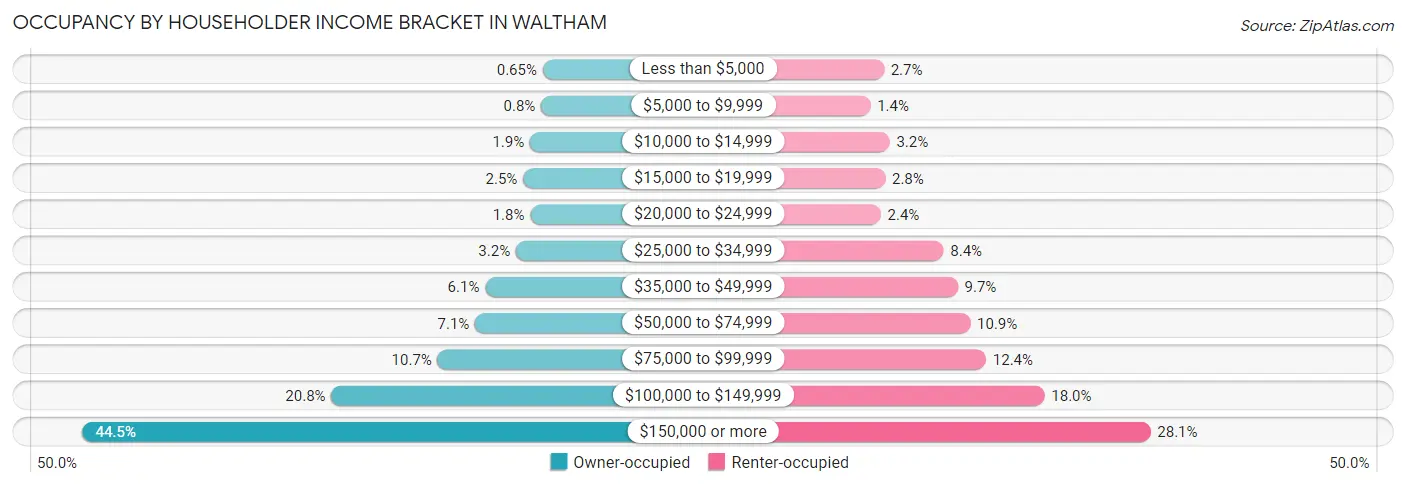
| Income Bracket | Owner-occupied | Renter-occupied |
| Less than $5,000 | 81 (0.6%) | 365 (2.7%) |
| $5,000 to $9,999 | 100 (0.8%) | 191 (1.4%) |
| $10,000 to $14,999 | 233 (1.9%) | 440 (3.2%) |
| $15,000 to $19,999 | 315 (2.5%) | 382 (2.8%) |
| $20,000 to $24,999 | 230 (1.8%) | 325 (2.4%) |
| $25,000 to $34,999 | 400 (3.2%) | 1,138 (8.4%) |
| $35,000 to $49,999 | 767 (6.1%) | 1,323 (9.7%) |
| $50,000 to $74,999 | 888 (7.1%) | 1,485 (10.9%) |
| $75,000 to $99,999 | 1,335 (10.7%) | 1,689 (12.4%) |
| $100,000 to $149,999 | 2,601 (20.8%) | 2,447 (18.0%) |
| $150,000 or more | 5,568 (44.5%) | 3,821 (28.1%) |
| Total | 12,518 (100.0%) | 13,606 (100.0%) |
Monthly Housing Cost Tiers in Waltham
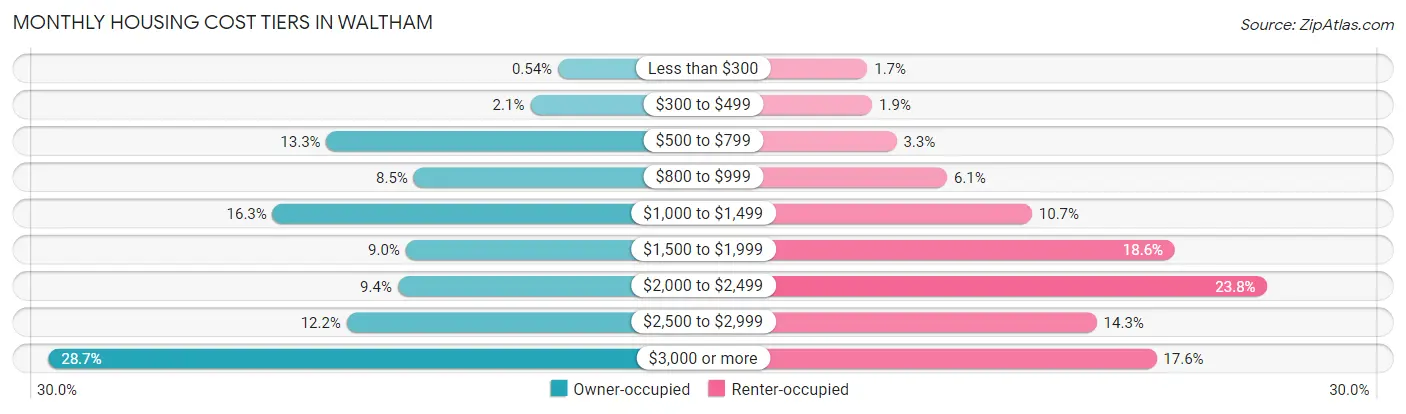
| Monthly Cost | Owner-occupied | Renter-occupied |
| Less than $300 | 68 (0.5%) | 224 (1.7%) |
| $300 to $499 | 259 (2.1%) | 261 (1.9%) |
| $500 to $799 | 1,669 (13.3%) | 443 (3.3%) |
| $800 to $999 | 1,065 (8.5%) | 823 (6.0%) |
| $1,000 to $1,499 | 2,041 (16.3%) | 1,461 (10.7%) |
| $1,500 to $1,999 | 1,120 (8.9%) | 2,536 (18.6%) |
| $2,000 to $2,499 | 1,176 (9.4%) | 3,231 (23.7%) |
| $2,500 to $2,999 | 1,529 (12.2%) | 1,948 (14.3%) |
| $3,000 or more | 3,591 (28.7%) | 2,397 (17.6%) |
| Total | 12,518 (100.0%) | 13,606 (100.0%) |
Physical Housing Characteristics in Waltham
Housing Structures in Waltham
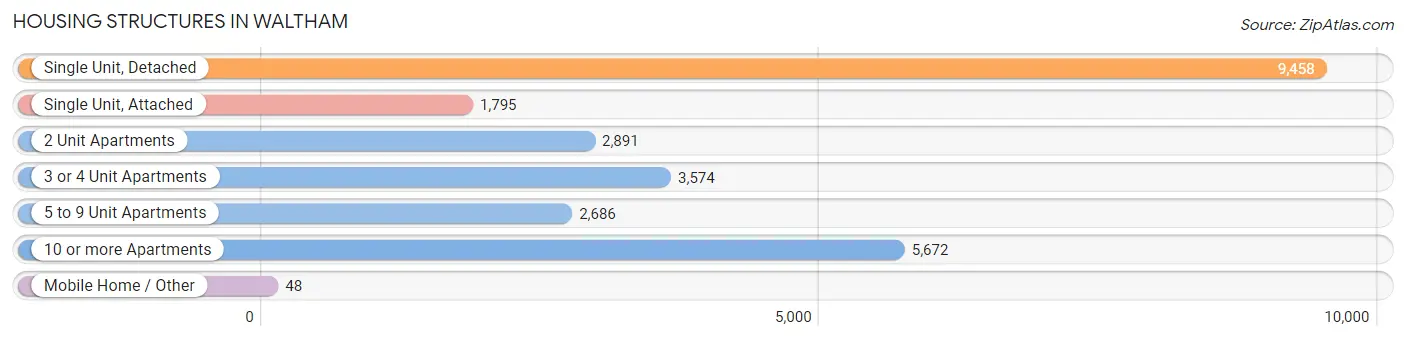
| Structure Type | # Housing Units | % Housing Units |
| Single Unit, Detached | 9,458 | 36.2% |
| Single Unit, Attached | 1,795 | 6.9% |
| 2 Unit Apartments | 2,891 | 11.1% |
| 3 or 4 Unit Apartments | 3,574 | 13.7% |
| 5 to 9 Unit Apartments | 2,686 | 10.3% |
| 10 or more Apartments | 5,672 | 21.7% |
| Mobile Home / Other | 48 | 0.2% |
| Total | 26,124 | 100.0% |
Housing Structures by Occupancy in Waltham
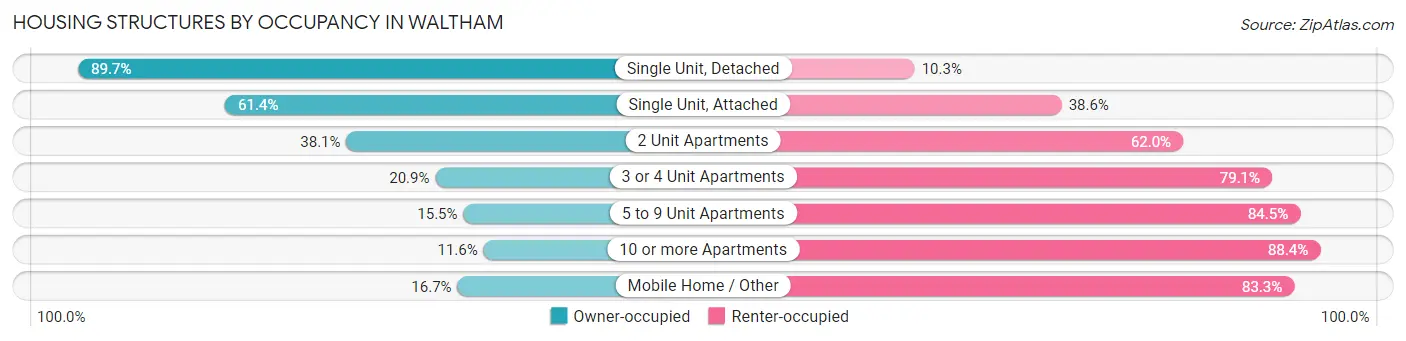
| Structure Type | Owner-occupied | Renter-occupied |
| Single Unit, Detached | 8,483 (89.7%) | 975 (10.3%) |
| Single Unit, Attached | 1,102 (61.4%) | 693 (38.6%) |
| 2 Unit Apartments | 1,100 (38.1%) | 1,791 (62.0%) |
| 3 or 4 Unit Apartments | 748 (20.9%) | 2,826 (79.1%) |
| 5 to 9 Unit Apartments | 417 (15.5%) | 2,269 (84.5%) |
| 10 or more Apartments | 660 (11.6%) | 5,012 (88.4%) |
| Mobile Home / Other | 8 (16.7%) | 40 (83.3%) |
| Total | 12,518 (47.9%) | 13,606 (52.1%) |
Housing Structures by Number of Rooms in Waltham
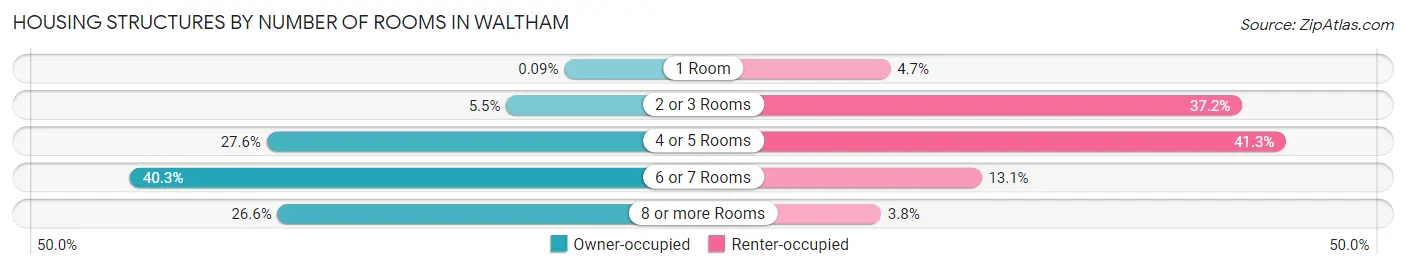
| Number of Rooms | Owner-occupied | Renter-occupied |
| 1 Room | 11 (0.1%) | 633 (4.6%) |
| 2 or 3 Rooms | 682 (5.4%) | 5,061 (37.2%) |
| 4 or 5 Rooms | 3,456 (27.6%) | 5,615 (41.3%) |
| 6 or 7 Rooms | 5,038 (40.3%) | 1,781 (13.1%) |
| 8 or more Rooms | 3,331 (26.6%) | 516 (3.8%) |
| Total | 12,518 (100.0%) | 13,606 (100.0%) |
Housing Structure by Heating Type in Waltham
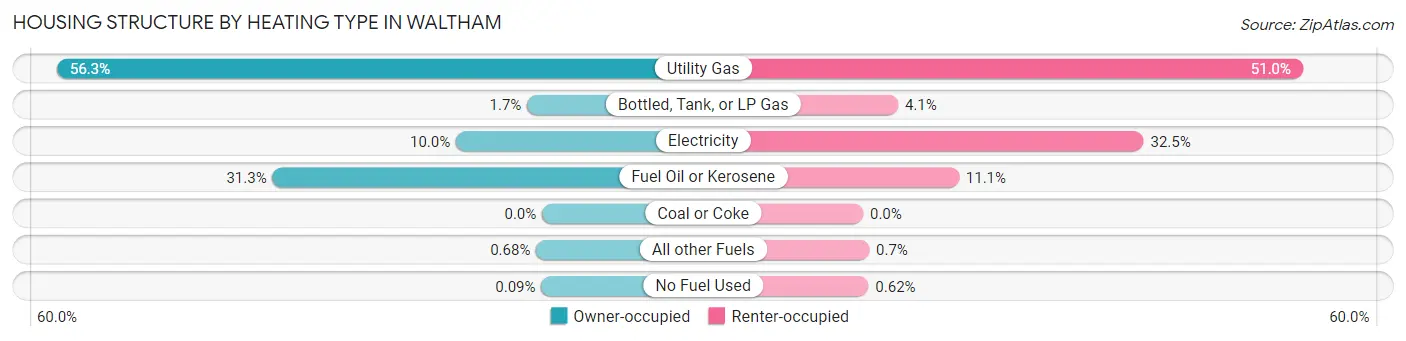
| Heating Type | Owner-occupied | Renter-occupied |
| Utility Gas | 7,043 (56.3%) | 6,938 (51.0%) |
| Bottled, Tank, or LP Gas | 217 (1.7%) | 552 (4.1%) |
| Electricity | 1,249 (10.0%) | 4,424 (32.5%) |
| Fuel Oil or Kerosene | 3,913 (31.3%) | 1,512 (11.1%) |
| Coal or Coke | 0 (0.0%) | 0 (0.0%) |
| All other Fuels | 85 (0.7%) | 95 (0.7%) |
| No Fuel Used | 11 (0.1%) | 85 (0.6%) |
| Total | 12,518 (100.0%) | 13,606 (100.0%) |
Household Vehicle Usage in Waltham
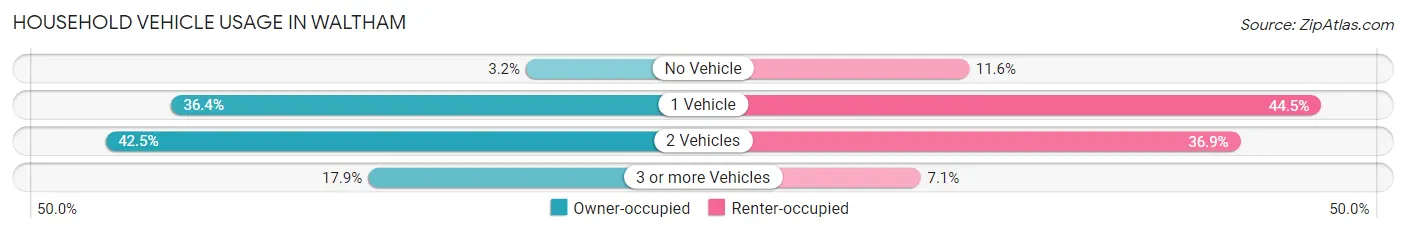
| Vehicles per Household | Owner-occupied | Renter-occupied |
| No Vehicle | 402 (3.2%) | 1,573 (11.6%) |
| 1 Vehicle | 4,554 (36.4%) | 6,048 (44.5%) |
| 2 Vehicles | 5,316 (42.5%) | 5,024 (36.9%) |
| 3 or more Vehicles | 2,246 (17.9%) | 961 (7.1%) |
| Total | 12,518 (100.0%) | 13,606 (100.0%) |
Real Estate & Mortgages in Waltham
Real Estate and Mortgage Overview in Waltham
| Characteristic | Without Mortgage | With Mortgage |
| Housing Units | 4,895 | 7,623 |
| Median Property Value | $624,400 | $715,200 |
| Median Household Income | $91,701 | $4,362 |
| Monthly Housing Costs | $891 | $3,563 |
| Real Estate Taxes | $4,667 | $35 |
Property Value by Mortgage Status in Waltham
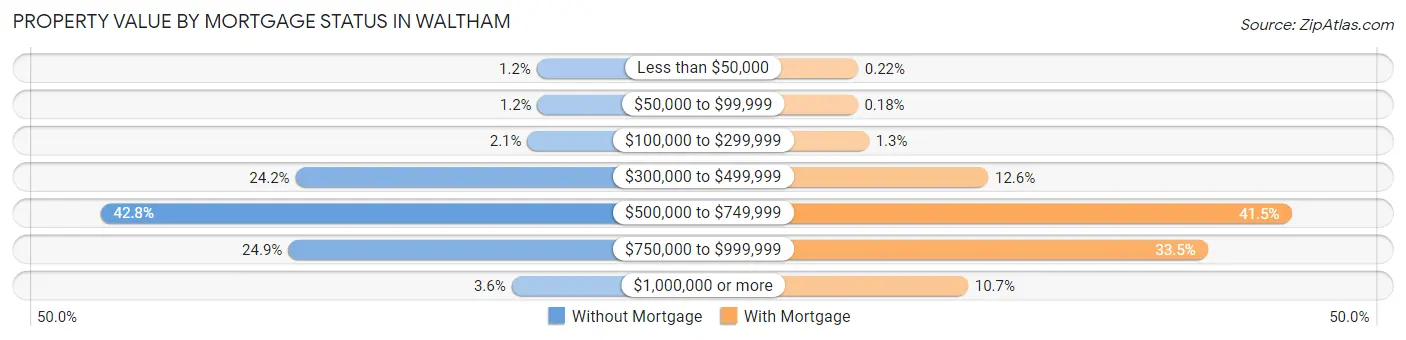
| Property Value | Without Mortgage | With Mortgage |
| Less than $50,000 | 60 (1.2%) | 17 (0.2%) |
| $50,000 to $99,999 | 57 (1.2%) | 14 (0.2%) |
| $100,000 to $299,999 | 104 (2.1%) | 95 (1.3%) |
| $300,000 to $499,999 | 1,185 (24.2%) | 962 (12.6%) |
| $500,000 to $749,999 | 2,093 (42.8%) | 3,164 (41.5%) |
| $750,000 to $999,999 | 1,219 (24.9%) | 2,556 (33.5%) |
| $1,000,000 or more | 177 (3.6%) | 815 (10.7%) |
| Total | 4,895 (100.0%) | 7,623 (100.0%) |
Household Income by Mortgage Status in Waltham
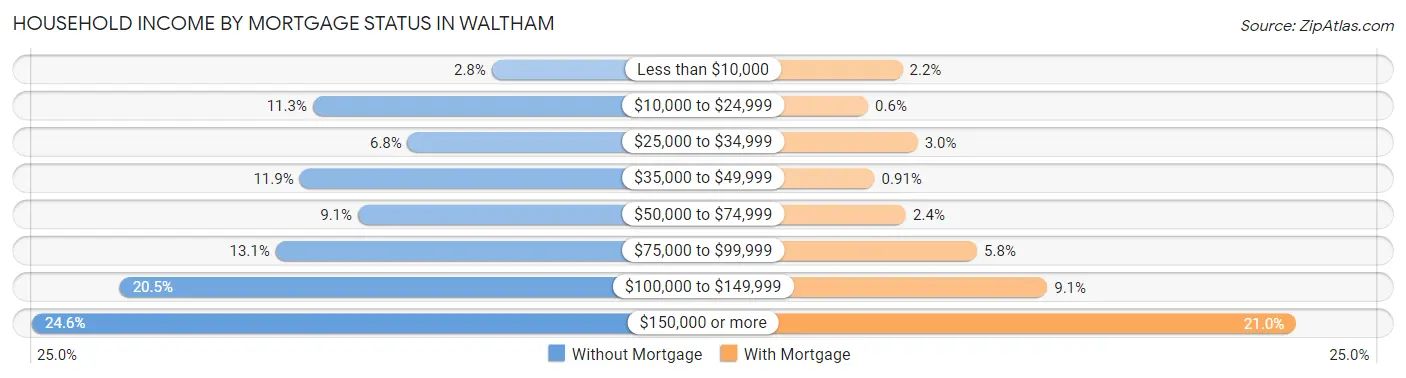
| Household Income | Without Mortgage | With Mortgage |
| Less than $10,000 | 135 (2.8%) | 171 (2.2%) |
| $10,000 to $24,999 | 552 (11.3%) | 46 (0.6%) |
| $25,000 to $34,999 | 331 (6.8%) | 226 (3.0%) |
| $35,000 to $49,999 | 583 (11.9%) | 69 (0.9%) |
| $50,000 to $74,999 | 447 (9.1%) | 184 (2.4%) |
| $75,000 to $99,999 | 639 (13.1%) | 441 (5.8%) |
| $100,000 to $149,999 | 1,002 (20.5%) | 696 (9.1%) |
| $150,000 or more | 1,206 (24.6%) | 1,599 (21.0%) |
| Total | 4,895 (100.0%) | 7,623 (100.0%) |
Property Value to Household Income Ratio in Waltham
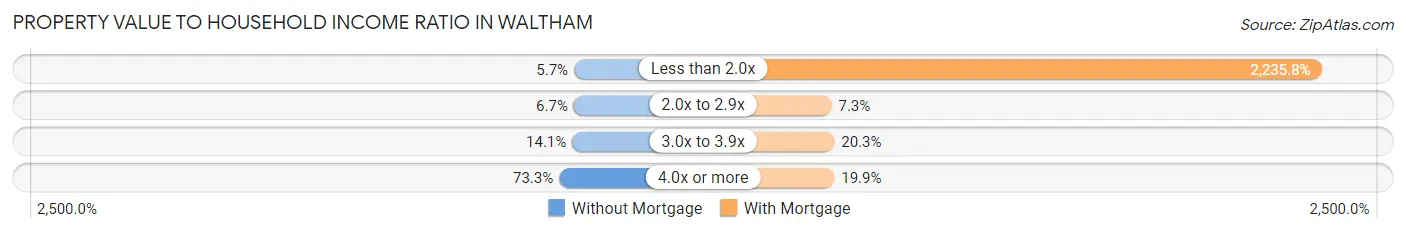
| Value-to-Income Ratio | Without Mortgage | With Mortgage |
| Less than 2.0x | 278 (5.7%) | 170,436 (2,235.8%) |
| 2.0x to 2.9x | 326 (6.7%) | 559 (7.3%) |
| 3.0x to 3.9x | 692 (14.1%) | 1,545 (20.3%) |
| 4.0x or more | 3,586 (73.3%) | 1,520 (19.9%) |
| Total | 4,895 (100.0%) | 7,623 (100.0%) |
Real Estate Taxes by Mortgage Status in Waltham
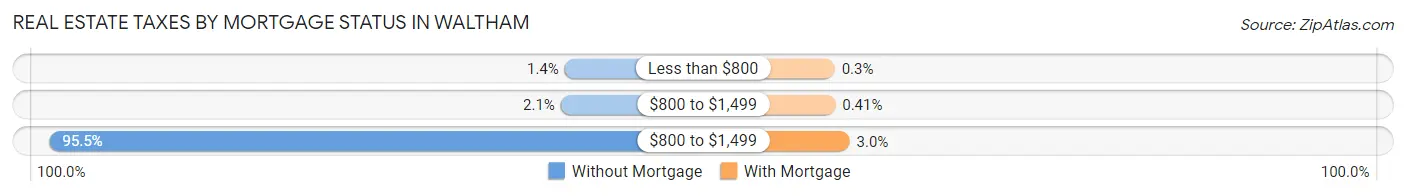
| Property Taxes | Without Mortgage | With Mortgage |
| Less than $800 | 67 (1.4%) | 23 (0.3%) |
| $800 to $1,499 | 102 (2.1%) | 31 (0.4%) |
| $800 to $1,499 | 4,673 (95.5%) | 230 (3.0%) |
| Total | 4,895 (100.0%) | 7,623 (100.0%) |
Health & Disability in Waltham
Health Insurance Coverage by Age in Waltham
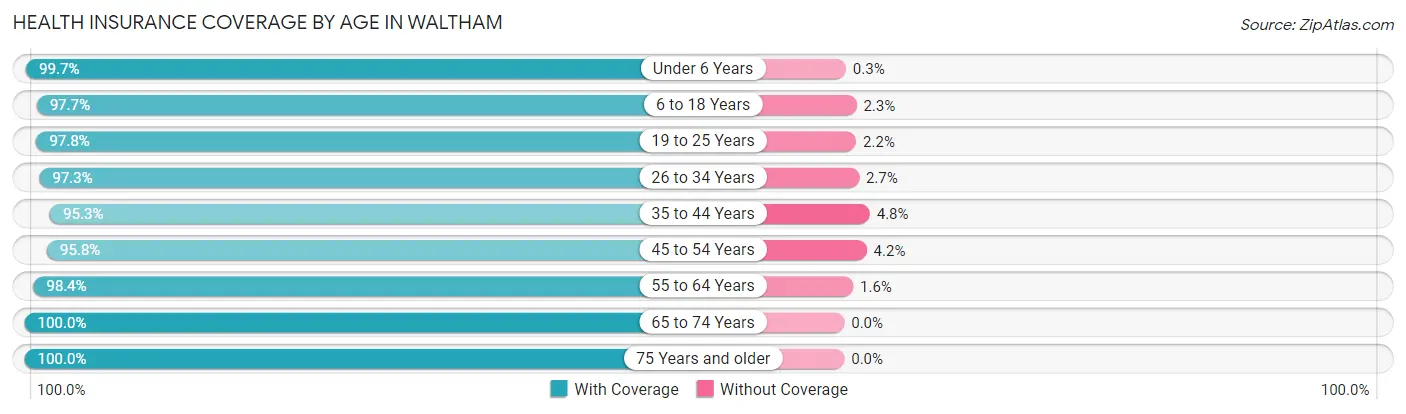
| Age Bracket | With Coverage | Without Coverage |
| Under 6 Years | 3,691 (99.7%) | 11 (0.3%) |
| 6 to 18 Years | 6,255 (97.7%) | 145 (2.3%) |
| 19 to 25 Years | 11,567 (97.8%) | 262 (2.2%) |
| 26 to 34 Years | 10,422 (97.3%) | 294 (2.7%) |
| 35 to 44 Years | 7,802 (95.3%) | 389 (4.8%) |
| 45 to 54 Years | 5,886 (95.8%) | 256 (4.2%) |
| 55 to 64 Years | 7,244 (98.4%) | 121 (1.6%) |
| 65 to 74 Years | 5,827 (100.0%) | 0 (0.0%) |
| 75 Years and older | 4,239 (100.0%) | 0 (0.0%) |
| Total | 62,933 (97.7%) | 1,478 (2.3%) |
Health Insurance Coverage by Citizenship Status in Waltham
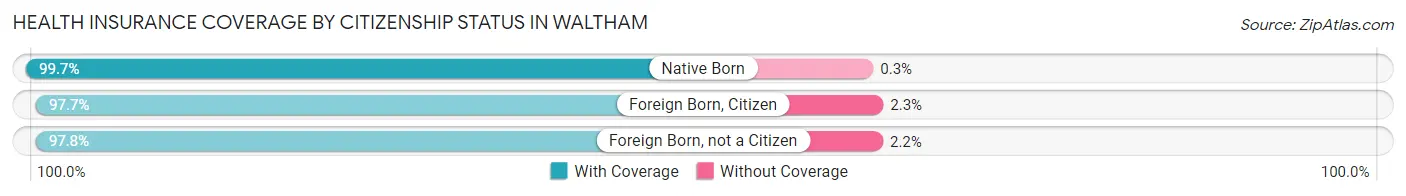
| Citizenship Status | With Coverage | Without Coverage |
| Native Born | 3,691 (99.7%) | 11 (0.3%) |
| Foreign Born, Citizen | 6,255 (97.7%) | 145 (2.3%) |
| Foreign Born, not a Citizen | 11,567 (97.8%) | 262 (2.2%) |
Health Insurance Coverage by Household Income in Waltham
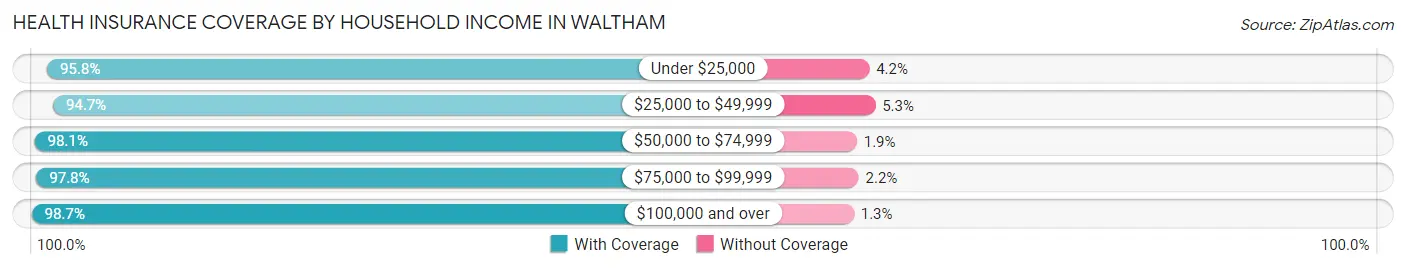
| Household Income | With Coverage | Without Coverage |
| Under $25,000 | 3,699 (95.8%) | 162 (4.2%) |
| $25,000 to $49,999 | 6,775 (94.7%) | 381 (5.3%) |
| $50,000 to $74,999 | 4,261 (98.1%) | 81 (1.9%) |
| $75,000 to $99,999 | 5,432 (97.8%) | 123 (2.2%) |
| $100,000 and over | 36,425 (98.7%) | 483 (1.3%) |
Public vs Private Health Insurance Coverage by Age in Waltham
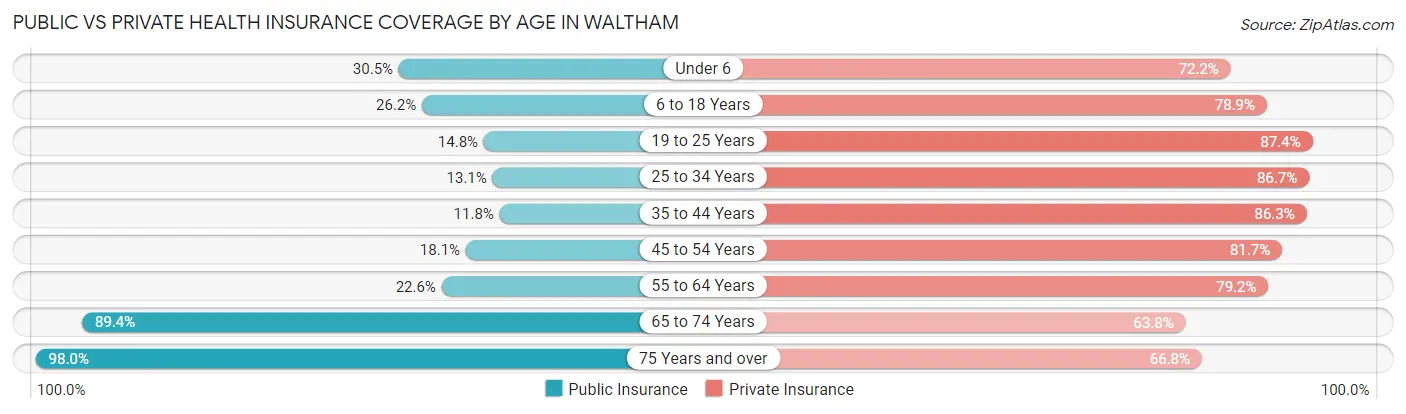
| Age Bracket | Public Insurance | Private Insurance |
| Under 6 | 1,130 (30.5%) | 2,672 (72.2%) |
| 6 to 18 Years | 1,678 (26.2%) | 5,049 (78.9%) |
| 19 to 25 Years | 1,745 (14.7%) | 10,335 (87.4%) |
| 25 to 34 Years | 1,407 (13.1%) | 9,295 (86.7%) |
| 35 to 44 Years | 968 (11.8%) | 7,065 (86.3%) |
| 45 to 54 Years | 1,111 (18.1%) | 5,019 (81.7%) |
| 55 to 64 Years | 1,663 (22.6%) | 5,830 (79.2%) |
| 65 to 74 Years | 5,207 (89.4%) | 3,718 (63.8%) |
| 75 Years and over | 4,152 (98.0%) | 2,833 (66.8%) |
| Total | 19,061 (29.6%) | 51,816 (80.4%) |
Disability Status by Sex by Age in Waltham
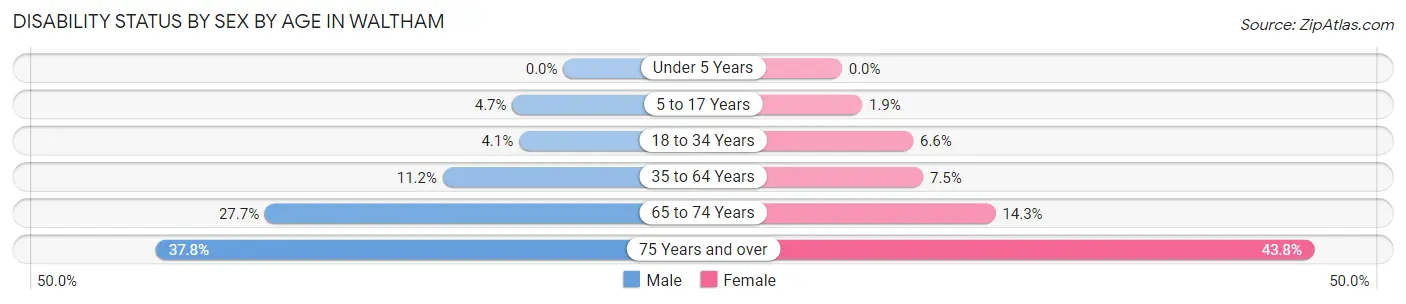
| Age Bracket | Male | Female |
| Under 5 Years | 0 (0.0%) | 0 (0.0%) |
| 5 to 17 Years | 115 (4.7%) | 55 (1.9%) |
| 18 to 34 Years | 510 (4.1%) | 771 (6.6%) |
| 35 to 64 Years | 1,280 (11.2%) | 773 (7.5%) |
| 65 to 74 Years | 658 (27.7%) | 492 (14.3%) |
| 75 Years and over | 643 (37.8%) | 1,112 (43.8%) |
Disability Class by Sex by Age in Waltham
Disability Class: Hearing Difficulty
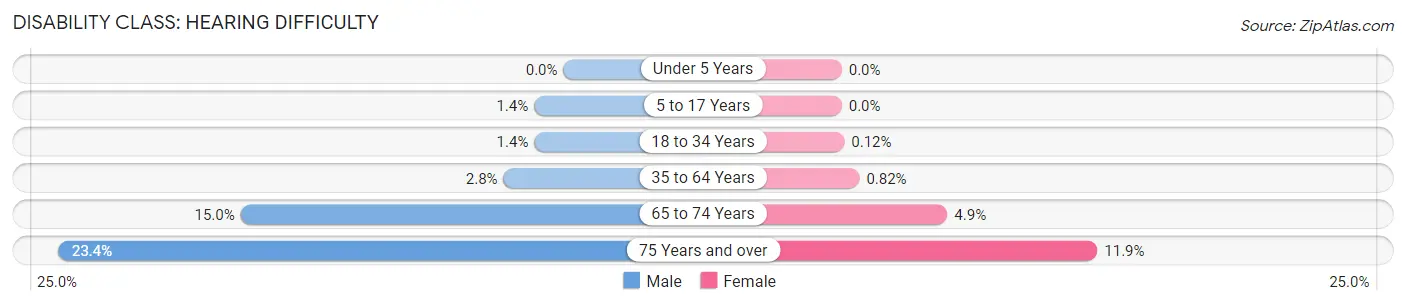
| Age Bracket | Male | Female |
| Under 5 Years | 0 (0.0%) | 0 (0.0%) |
| 5 to 17 Years | 33 (1.4%) | 0 (0.0%) |
| 18 to 34 Years | 167 (1.3%) | 14 (0.1%) |
| 35 to 64 Years | 318 (2.8%) | 84 (0.8%) |
| 65 to 74 Years | 356 (15.0%) | 169 (4.9%) |
| 75 Years and over | 398 (23.4%) | 301 (11.9%) |
Disability Class: Vision Difficulty
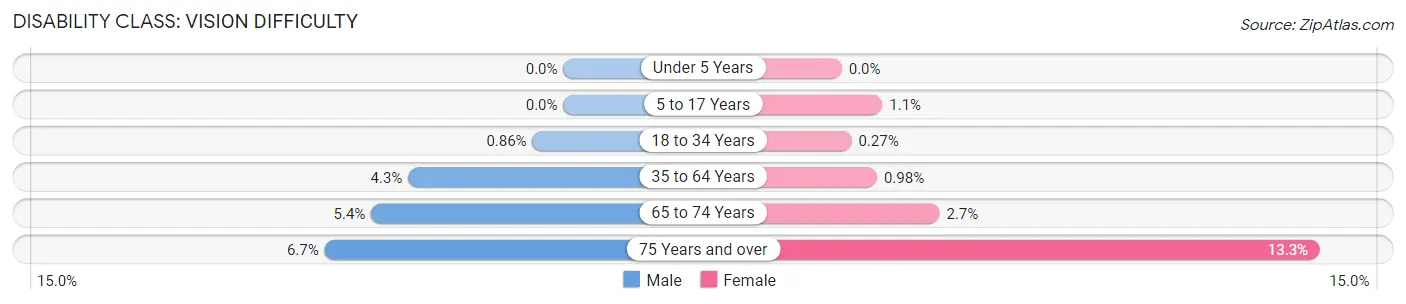
| Age Bracket | Male | Female |
| Under 5 Years | 0 (0.0%) | 0 (0.0%) |
| 5 to 17 Years | 0 (0.0%) | 33 (1.1%) |
| 18 to 34 Years | 107 (0.9%) | 32 (0.3%) |
| 35 to 64 Years | 494 (4.3%) | 101 (1.0%) |
| 65 to 74 Years | 127 (5.3%) | 94 (2.7%) |
| 75 Years and over | 113 (6.7%) | 338 (13.3%) |
Disability Class: Cognitive Difficulty
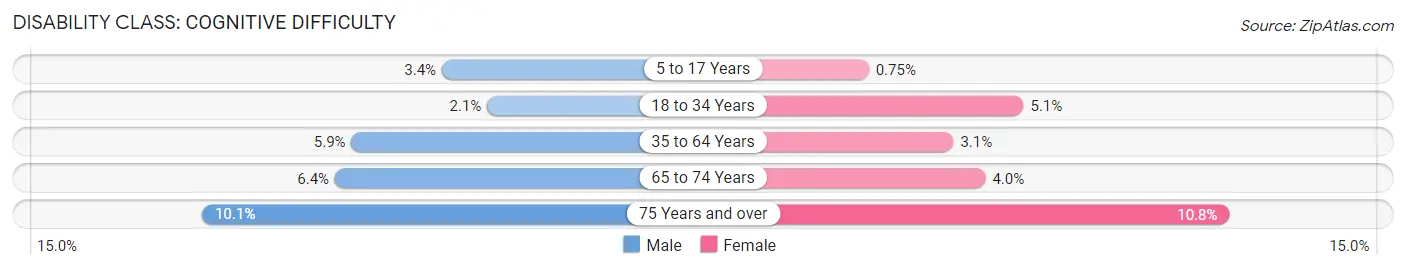
| Age Bracket | Male | Female |
| 5 to 17 Years | 82 (3.4%) | 22 (0.7%) |
| 18 to 34 Years | 263 (2.1%) | 590 (5.1%) |
| 35 to 64 Years | 675 (5.9%) | 319 (3.1%) |
| 65 to 74 Years | 151 (6.4%) | 138 (4.0%) |
| 75 Years and over | 171 (10.1%) | 274 (10.8%) |
Disability Class: Ambulatory Difficulty
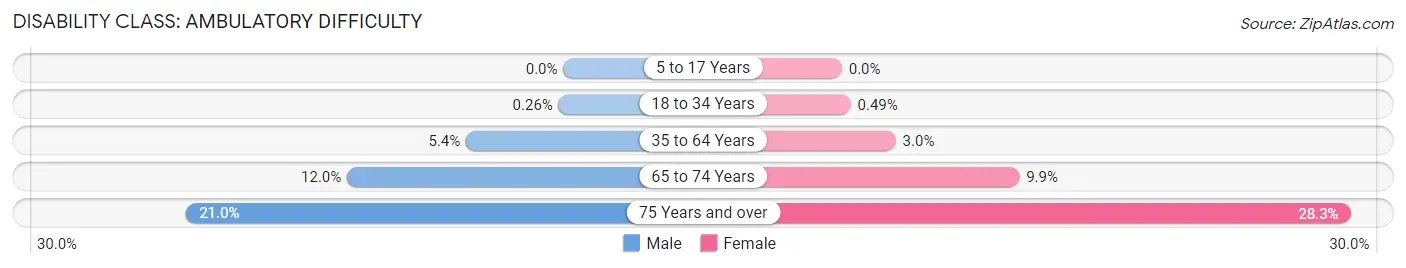
| Age Bracket | Male | Female |
| 5 to 17 Years | 0 (0.0%) | 0 (0.0%) |
| 18 to 34 Years | 32 (0.3%) | 57 (0.5%) |
| 35 to 64 Years | 620 (5.4%) | 308 (3.0%) |
| 65 to 74 Years | 286 (12.0%) | 341 (9.9%) |
| 75 Years and over | 357 (21.0%) | 719 (28.3%) |
Disability Class: Self-Care Difficulty
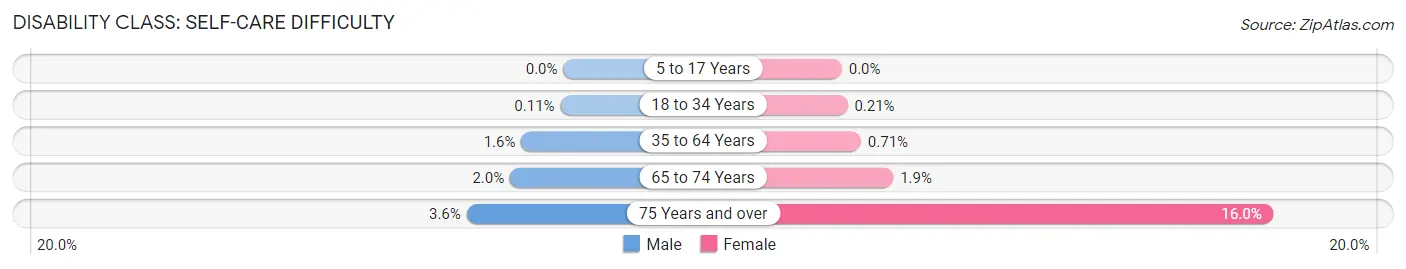
| Age Bracket | Male | Female |
| 5 to 17 Years | 0 (0.0%) | 0 (0.0%) |
| 18 to 34 Years | 14 (0.1%) | 24 (0.2%) |
| 35 to 64 Years | 178 (1.6%) | 73 (0.7%) |
| 65 to 74 Years | 47 (2.0%) | 66 (1.9%) |
| 75 Years and over | 61 (3.6%) | 407 (16.0%) |
Technology Access in Waltham
Computing Device Access in Waltham
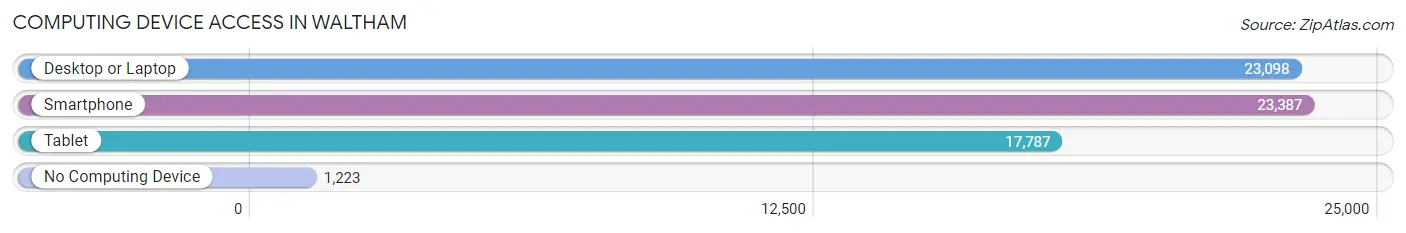
| Device Type | # Households | % Households |
| Desktop or Laptop | 23,098 | 88.4% |
| Smartphone | 23,387 | 89.5% |
| Tablet | 17,787 | 68.1% |
| No Computing Device | 1,223 | 4.7% |
| Total | 26,124 | 100.0% |
Internet Access in Waltham
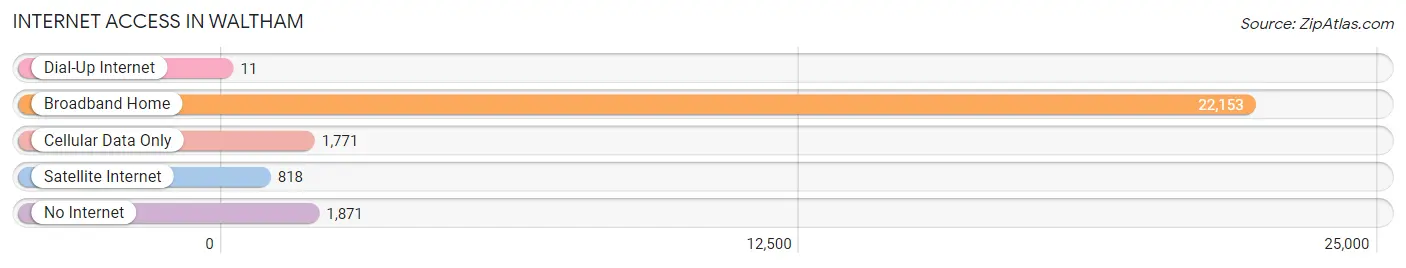
| Internet Type | # Households | % Households |
| Dial-Up Internet | 11 | 0.0% |
| Broadband Home | 22,153 | 84.8% |
| Cellular Data Only | 1,771 | 6.8% |
| Satellite Internet | 818 | 3.1% |
| No Internet | 1,871 | 7.2% |
| Total | 26,124 | 100.0% |
Waltham Summary
Waltham, MA is a city located in Middlesex County, Massachusetts, United States. It is located approximately 10 miles west of Boston and is part of the Greater Boston metropolitan area. The city has a population of approximately 62,000 people, making it the third-largest city in Middlesex County.
History
The area that is now Waltham was originally inhabited by the Massachusett tribe, who called the area “Pettequamscutt”, meaning “pleasant place”. The first European settlers arrived in 1634, and the area was officially incorporated as a town in 1738. The town was named after Waltham, England, and was initially an agricultural community.
In the 19th century, Waltham became an important industrial center, with the first factory in the United States producing interchangeable parts being built in the city in 1813. The city was also home to the first American watch factory, which was established in 1854. The city’s industrial growth continued into the 20th century, and Waltham was officially incorporated as a city in 1922.
Geography
Waltham is located in eastern Massachusetts, approximately 10 miles west of Boston. The city is situated on the Charles River, and is bordered by the towns of Watertown, Weston, Lincoln, and Lexington. The city has a total area of 13.6 square miles, of which 12.9 square miles is land and 0.7 square miles is water.
Economy
Waltham’s economy is largely based on the service industry, with the largest employers in the city being the Waltham Public Schools, the City of Waltham, and the Waltham Hospital. The city is also home to several technology companies, including Raytheon, EMC Corporation, and Oracle Corporation.
Demographics
As of the 2010 census, Waltham had a population of 60,632 people. The racial makeup of the city was 79.2% White, 8.3% African American, 0.3% Native American, 8.2% Asian, 0.1% Pacific Islander, 1.3% from other races, and 2.6% from two or more races. The median household income in Waltham was $63,837, and the median family income was $76,845. The per capita income in Waltham was $35,945.
Common Questions
What is Per Capita Income in Waltham?
Per Capita income in Waltham is $56,716.
What is the Median Family Income in Waltham?
Median Family Income in Waltham is $139,507.
What is the Median Household income in Waltham?
Median Household Income in Waltham is $113,443.
What is Income or Wage Gap in Waltham?
Income or Wage Gap in Waltham is 23.3%.
Women in Waltham earn 76.7 cents for every dollar earned by a man.
What is Family Income Deficit in Waltham?
Family Income Deficit in Waltham is $10,164.
Families that are below poverty line in Waltham earn $10,164 less on average than the poverty threshold level.
What is Inequality or Gini Index in Waltham?
Inequality or Gini Index in Waltham is 0.43.
What is the Total Population of Waltham?
Total Population of Waltham is 64,711.
What is the Total Male Population of Waltham?
Total Male Population of Waltham is 32,042.
What is the Total Female Population of Waltham?
Total Female Population of Waltham is 32,669.
What is the Ratio of Males per 100 Females in Waltham?
There are 98.08 Males per 100 Females in Waltham.
What is the Ratio of Females per 100 Males in Waltham?
There are 101.96 Females per 100 Males in Waltham.
What is the Median Population Age in Waltham?
Median Population Age in Waltham is 34.7 Years.
What is the Average Family Size in Waltham
Average Family Size in Waltham is 2.9 People.
What is the Average Household Size in Waltham
Average Household Size in Waltham is 2.2 People.
How Large is the Labor Force in Waltham?
There are 39,459 People in the Labor Forcein in Waltham.
What is the Percentage of People in the Labor Force in Waltham?
69.3% of People are in the Labor Force in Waltham.
What is the Unemployment Rate in Waltham?
Unemployment Rate in Waltham is 3.1%.