Zip Codes with the Highest Percentage of Population with a Degree in Liberal Arts and History in Covington, KY
RELATED REPORTS & OPTIONS
Liberal Arts and History
Covington
Compare Zip Codes
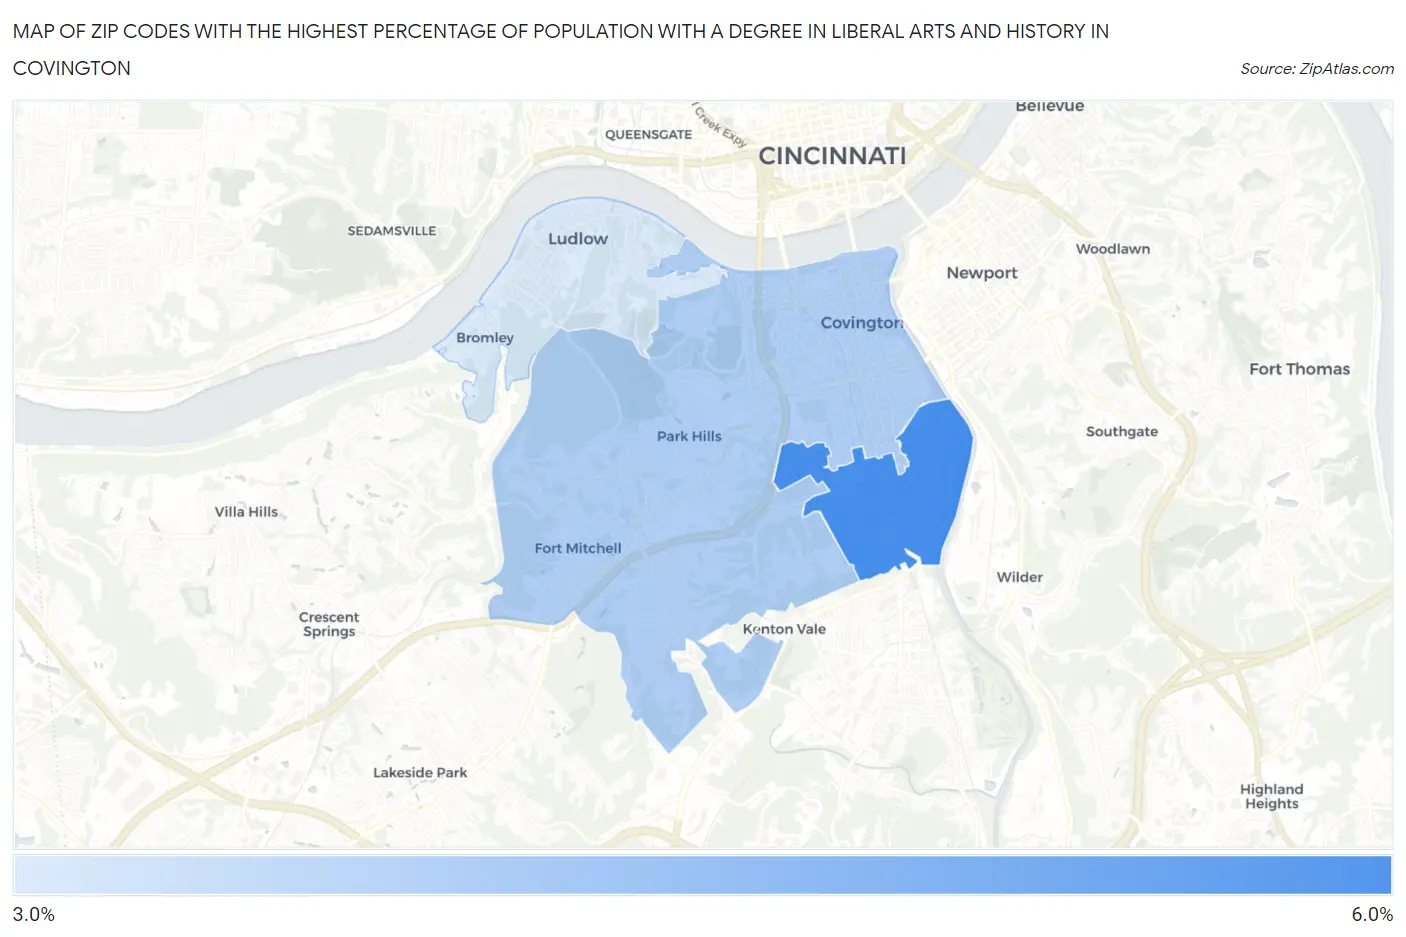
Map of Zip Codes with the Highest Percentage of Population with a Degree in Liberal Arts and History in Covington
3.3%
5.2%
Zip Codes with the Highest Percentage of Population with a Degree in Liberal Arts and History in Covington, KY
| Zip Code | % Graduates | vs State | vs National | |
| 1. | 41014 | 5.2% | 5.3%(-0.138)#215 | 4.9%(+0.320)#10,747 |
| 2. | 41011 | 3.9% | 5.3%(-1.47)#292 | 4.9%(-1.01)#15,289 |
| 3. | 41016 | 3.3% | 5.3%(-2.01)#311 | 4.9%(-1.55)#17,237 |
1
Common Questions
What are the Top Zip Codes with the Highest Percentage of Population with a Degree in Liberal Arts and History in Covington, KY?
Top Zip Codes with the Highest Percentage of Population with a Degree in Liberal Arts and History in Covington, KY are:
What zip code has the Highest Percentage of Population with a Degree in Liberal Arts and History in Covington, KY?
41014 has the Highest Percentage of Population with a Degree in Liberal Arts and History in Covington, KY with 5.2%.
What is the Percentage of Population with a Degree in Liberal Arts and History in Covington, KY?
Percentage of Population with a Degree in Liberal Arts and History in Covington is 5.5%.
What is the Percentage of Population with a Degree in Liberal Arts and History in Kentucky?
Percentage of Population with a Degree in Liberal Arts and History in Kentucky is 5.3%.
What is the Percentage of Population with a Degree in Liberal Arts and History in the United States?
Percentage of Population with a Degree in Liberal Arts and History in the United States is 4.9%.