Zip Codes with the Highest Percentage of Population with a Degree in Liberal Arts and History in Ashland, KY
RELATED REPORTS & OPTIONS
Liberal Arts and History
Ashland
Compare Zip Codes
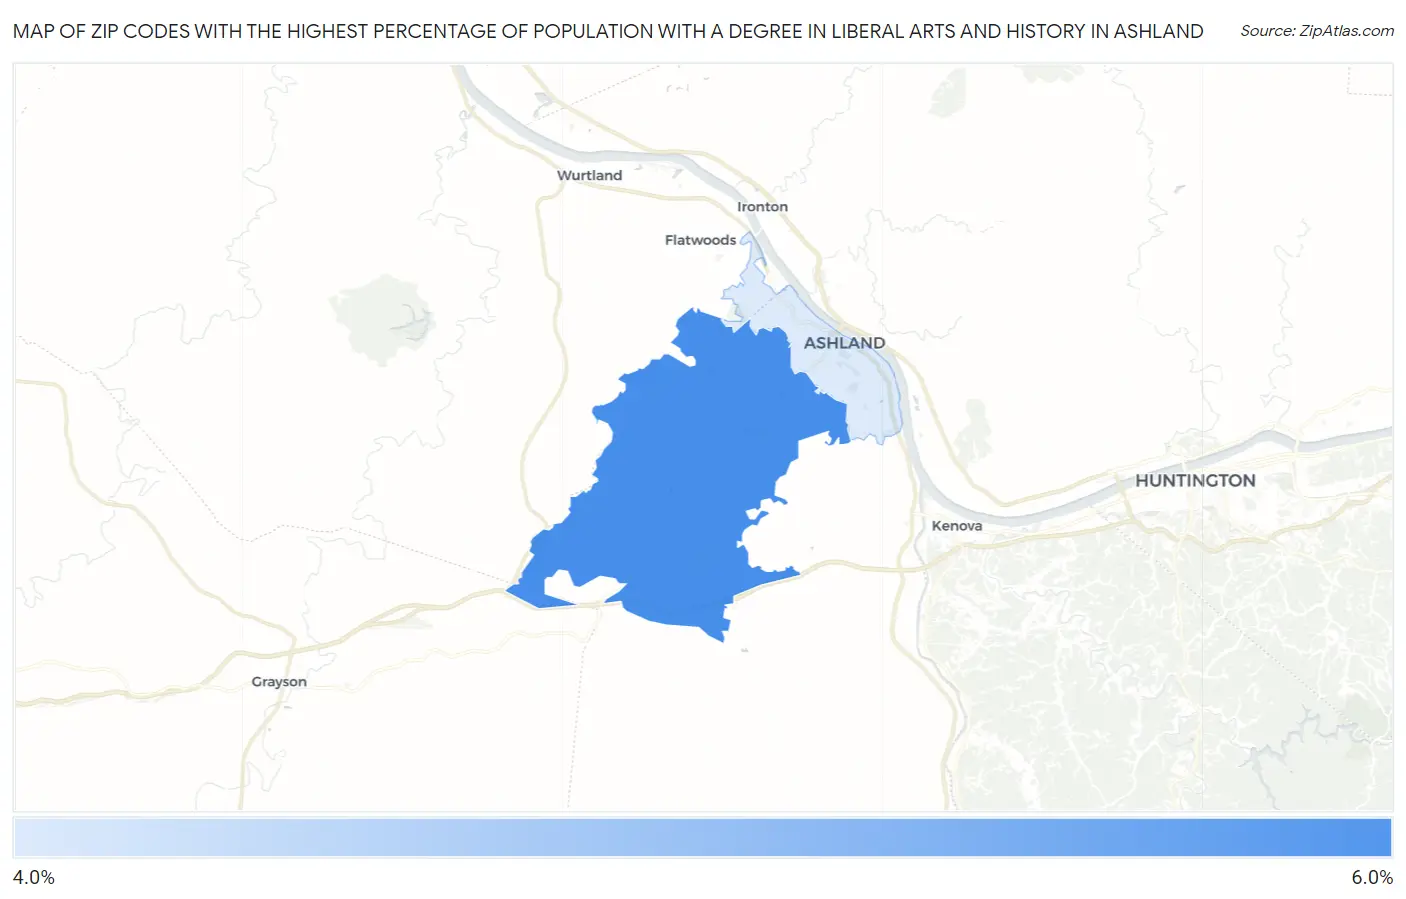
Map of Zip Codes with the Highest Percentage of Population with a Degree in Liberal Arts and History in Ashland
4.8%
5.7%
Zip Codes with the Highest Percentage of Population with a Degree in Liberal Arts and History in Ashland, KY
| Zip Code | % Graduates | vs State | vs National | |
| 1. | 41102 | 5.7% | 5.3%(+0.356)#196 | 4.9%(+0.813)#9,338 |
| 2. | 41101 | 4.8% | 5.3%(-0.577)#238 | 4.9%(-0.119)#12,152 |
1
Common Questions
What are the Top Zip Codes with the Highest Percentage of Population with a Degree in Liberal Arts and History in Ashland, KY?
Top Zip Codes with the Highest Percentage of Population with a Degree in Liberal Arts and History in Ashland, KY are:
What zip code has the Highest Percentage of Population with a Degree in Liberal Arts and History in Ashland, KY?
41102 has the Highest Percentage of Population with a Degree in Liberal Arts and History in Ashland, KY with 5.7%.
What is the Percentage of Population with a Degree in Liberal Arts and History in Ashland, KY?
Percentage of Population with a Degree in Liberal Arts and History in Ashland is 8.2%.
What is the Percentage of Population with a Degree in Liberal Arts and History in Kentucky?
Percentage of Population with a Degree in Liberal Arts and History in Kentucky is 5.3%.
What is the Percentage of Population with a Degree in Liberal Arts and History in the United States?
Percentage of Population with a Degree in Liberal Arts and History in the United States is 4.9%.