Zip Codes with the Highest Percentage of Population with a Degree in Liberal Arts and History in Louisville, KY
RELATED REPORTS & OPTIONS
Liberal Arts and History
Louisville
Compare Zip Codes
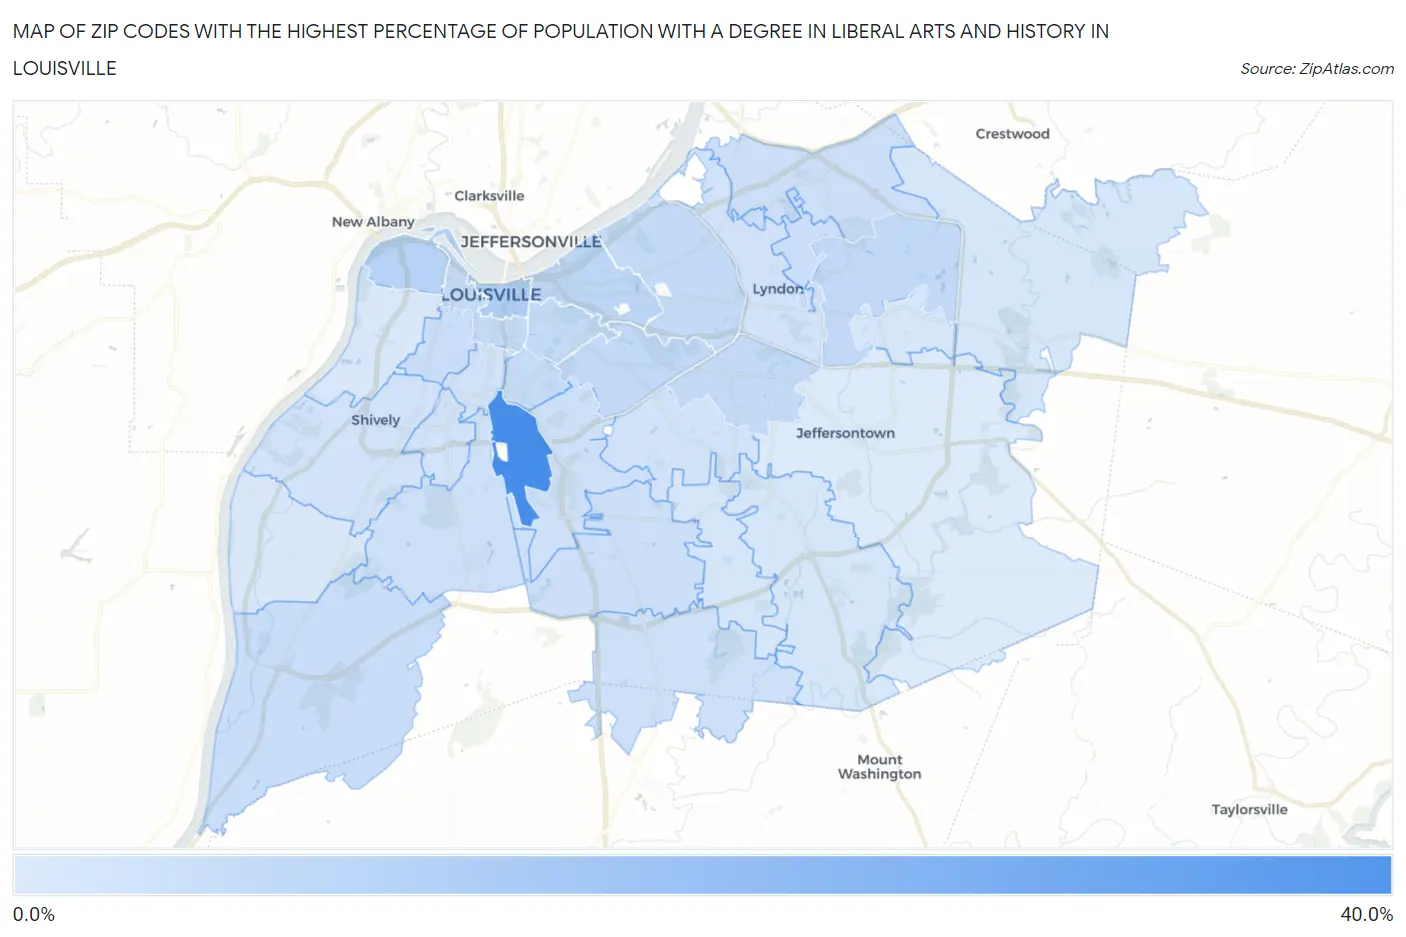
Map of Zip Codes with the Highest Percentage of Population with a Degree in Liberal Arts and History in Louisville
2.9%
31.6%
Zip Codes with the Highest Percentage of Population with a Degree in Liberal Arts and History in Louisville, KY
| Zip Code | % Graduates | vs State | vs National | |
| 1. | 40209 | 31.6% | 5.3%(+26.2)#16 | 4.9%(+26.7)#388 |
| 2. | 40202 | 10.7% | 5.3%(+5.37)#75 | 4.9%(+5.83)#2,696 |
| 3. | 40212 | 9.3% | 5.3%(+4.01)#99 | 4.9%(+4.46)#3,571 |
| 4. | 40206 | 8.5% | 5.3%(+3.19)#117 | 4.9%(+3.65)#4,318 |
| 5. | 40223 | 7.5% | 5.3%(+2.17)#129 | 4.9%(+2.63)#5,594 |
| 6. | 40205 | 7.5% | 5.3%(+2.15)#130 | 4.9%(+2.61)#5,617 |
| 7. | 40220 | 7.3% | 5.3%(+2.01)#131 | 4.9%(+2.47)#5,811 |
| 8. | 40203 | 7.3% | 5.3%(+2.00)#132 | 4.9%(+2.46)#5,833 |
| 9. | 40204 | 7.3% | 5.3%(+1.95)#134 | 4.9%(+2.41)#5,906 |
| 10. | 40207 | 7.2% | 5.3%(+1.89)#136 | 4.9%(+2.35)#6,015 |
| 11. | 40217 | 7.0% | 5.3%(+1.63)#151 | 4.9%(+2.08)#6,462 |
| 12. | 40272 | 6.3% | 5.3%(+0.967)#174 | 4.9%(+1.42)#7,802 |
| 13. | 40242 | 6.2% | 5.3%(+0.833)#177 | 4.9%(+1.29)#8,116 |
| 14. | 40210 | 5.9% | 5.3%(+0.581)#187 | 4.9%(+1.04)#8,747 |
| 15. | 40241 | 5.6% | 5.3%(+0.291)#198 | 4.9%(+0.749)#9,516 |
| 16. | 40219 | 5.5% | 5.3%(+0.145)#205 | 4.9%(+0.602)#9,936 |
| 17. | 40214 | 5.4% | 5.3%(+0.027)#209 | 4.9%(+0.484)#10,260 |
| 18. | 40213 | 5.2% | 5.3%(-0.151)#216 | 4.9%(+0.307)#10,783 |
| 19. | 40229 | 5.1% | 5.3%(-0.221)#221 | 4.9%(+0.237)#11,015 |
| 20. | 40215 | 5.0% | 5.3%(-0.354)#226 | 4.9%(+0.104)#11,416 |
| 21. | 40216 | 4.9% | 5.3%(-0.406)#230 | 4.9%(+0.051)#11,577 |
| 22. | 40208 | 4.9% | 5.3%(-0.447)#232 | 4.9%(+0.011)#11,692 |
| 23. | 40218 | 4.9% | 5.3%(-0.468)#234 | 4.9%(-0.010)#11,780 |
| 24. | 40222 | 4.7% | 5.3%(-0.600)#240 | 4.9%(-0.142)#12,223 |
| 25. | 40291 | 4.2% | 5.3%(-1.14)#263 | 4.9%(-0.678)#14,034 |
| 26. | 40243 | 4.1% | 5.3%(-1.25)#277 | 4.9%(-0.795)#14,487 |
| 27. | 40245 | 4.1% | 5.3%(-1.28)#280 | 4.9%(-0.822)#14,581 |
| 28. | 40228 | 4.0% | 5.3%(-1.29)#281 | 4.9%(-0.834)#14,636 |
| 29. | 40258 | 3.7% | 5.3%(-1.61)#299 | 4.9%(-1.15)#15,815 |
| 30. | 40211 | 3.6% | 5.3%(-1.73)#302 | 4.9%(-1.27)#16,251 |
| 31. | 40299 | 2.9% | 5.3%(-2.44)#324 | 4.9%(-1.98)#18,723 |
1
Common Questions
What are the Top 10 Zip Codes with the Highest Percentage of Population with a Degree in Liberal Arts and History in Louisville, KY?
Top 10 Zip Codes with the Highest Percentage of Population with a Degree in Liberal Arts and History in Louisville, KY are:
What zip code has the Highest Percentage of Population with a Degree in Liberal Arts and History in Louisville, KY?
40209 has the Highest Percentage of Population with a Degree in Liberal Arts and History in Louisville, KY with 31.6%.
What is the Percentage of Population with a Degree in Liberal Arts and History in Louisville, KY?
Percentage of Population with a Degree in Liberal Arts and History in Louisville is 5.6%.
What is the Percentage of Population with a Degree in Liberal Arts and History in Kentucky?
Percentage of Population with a Degree in Liberal Arts and History in Kentucky is 5.3%.
What is the Percentage of Population with a Degree in Liberal Arts and History in the United States?
Percentage of Population with a Degree in Liberal Arts and History in the United States is 4.9%.