Zip Codes with the Highest Percentage of Population with a Degree in Liberal Arts and History in Kentucky
RELATED REPORTS & OPTIONS
Liberal Arts and History
Kentucky
Compare Zip Codes
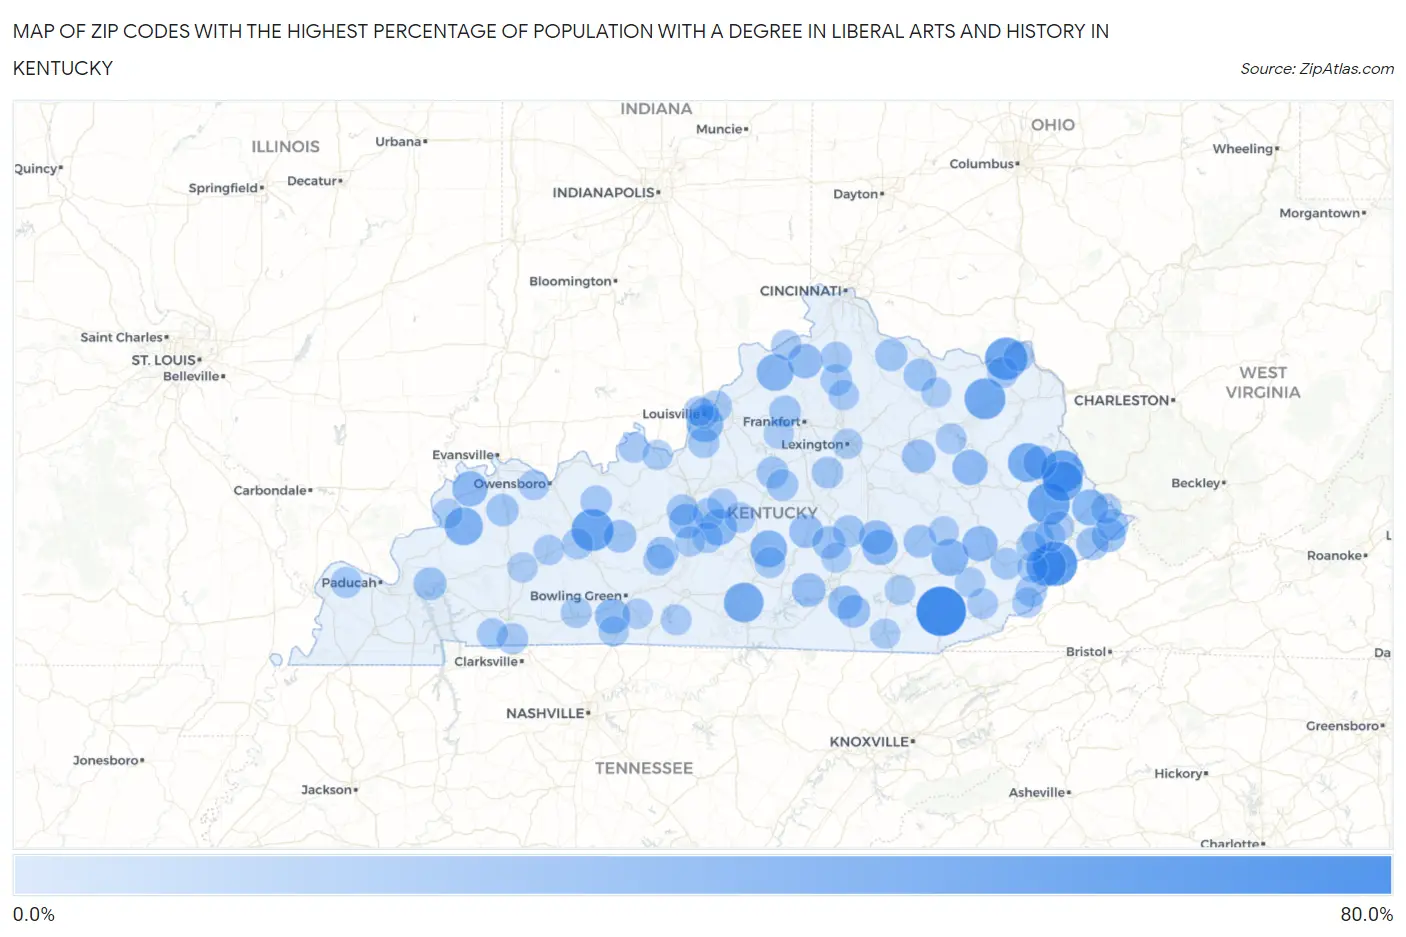
Map of Zip Codes with the Highest Percentage of Population with a Degree in Liberal Arts and History in Kentucky
0.0%
80.0%
Zip Codes with the Highest Percentage of Population with a Degree in Liberal Arts and History in Kentucky
| Zip Code | % Graduates | vs State | vs National | |
| 1. | 40997 | 76.9% | 5.3%(+71.6)#1 | 4.9%(+72.1)#64 |
| 2. | 41835 | 58.9% | 5.3%(+53.6)#2 | 4.9%(+54.1)#108 |
| 3. | 41166 | 51.3% | 5.3%(+46.0)#3 | 4.9%(+46.4)#137 |
| 4. | 41262 | 50.0% | 5.3%(+44.7)#4 | 4.9%(+45.1)#143 |
| 5. | 41621 | 50.0% | 5.3%(+44.7)#5 | 4.9%(+45.1)#157 |
| 6. | 42370 | 50.0% | 5.3%(+44.7)#6 | 4.9%(+45.1)#163 |
| 7. | 41135 | 45.9% | 5.3%(+40.6)#7 | 4.9%(+41.1)#193 |
| 8. | 41214 | 43.1% | 5.3%(+37.7)#8 | 4.9%(+38.2)#218 |
| 9. | 41838 | 41.9% | 5.3%(+36.6)#9 | 4.9%(+37.1)#233 |
| 10. | 42715 | 41.4% | 5.3%(+36.0)#10 | 4.9%(+36.5)#237 |
| 11. | 41219 | 39.8% | 5.3%(+34.5)#11 | 4.9%(+34.9)#250 |
| 12. | 42463 | 36.0% | 5.3%(+30.7)#12 | 4.9%(+31.1)#299 |
| 13. | 40972 | 32.1% | 5.3%(+26.7)#13 | 4.9%(+27.2)#377 |
| 14. | 40011 | 31.8% | 5.3%(+26.5)#14 | 4.9%(+26.9)#384 |
| 15. | 42733 | 31.7% | 5.3%(+26.4)#15 | 4.9%(+26.8)#385 |
| 16. | 40209 | 31.6% | 5.3%(+26.2)#16 | 4.9%(+26.7)#388 |
| 17. | 42716 | 29.7% | 5.3%(+24.3)#17 | 4.9%(+24.8)#425 |
| 18. | 41564 | 29.1% | 5.3%(+23.7)#18 | 4.9%(+24.2)#441 |
| 19. | 41727 | 27.1% | 5.3%(+21.8)#19 | 4.9%(+22.2)#495 |
| 20. | 41425 | 27.0% | 5.3%(+21.7)#20 | 4.9%(+22.1)#499 |
| 21. | 40445 | 26.8% | 5.3%(+21.4)#21 | 4.9%(+21.9)#507 |
| 22. | 42462 | 26.7% | 5.3%(+21.4)#22 | 4.9%(+21.9)#508 |
| 23. | 42170 | 26.2% | 5.3%(+20.9)#23 | 4.9%(+21.3)#527 |
| 24. | 42776 | 23.7% | 5.3%(+18.4)#24 | 4.9%(+18.9)#642 |
| 25. | 40355 | 23.5% | 5.3%(+18.2)#25 | 4.9%(+18.7)#653 |
| 26. | 40460 | 23.2% | 5.3%(+17.9)#26 | 4.9%(+18.3)#668 |
| 27. | 41566 | 22.2% | 5.3%(+16.9)#27 | 4.9%(+17.4)#719 |
| 28. | 40337 | 21.6% | 5.3%(+16.3)#28 | 4.9%(+16.7)#761 |
| 29. | 41257 | 21.4% | 5.3%(+16.1)#29 | 4.9%(+16.6)#770 |
| 30. | 40437 | 21.4% | 5.3%(+16.0)#30 | 4.9%(+16.5)#777 |
| 31. | 42544 | 21.1% | 5.3%(+15.8)#31 | 4.9%(+16.2)#792 |
| 32. | 42519 | 20.4% | 5.3%(+15.1)#32 | 4.9%(+15.5)#829 |
| 33. | 42055 | 18.5% | 5.3%(+13.2)#33 | 4.9%(+13.6)#979 |
| 34. | 42721 | 18.3% | 5.3%(+13.0)#34 | 4.9%(+13.5)#993 |
| 35. | 40486 | 18.2% | 5.3%(+12.9)#35 | 4.9%(+13.3)#1,003 |
| 36. | 41055 | 18.1% | 5.3%(+12.8)#36 | 4.9%(+13.2)#1,023 |
| 37. | 40489 | 18.1% | 5.3%(+12.8)#37 | 4.9%(+13.2)#1,026 |
| 38. | 42634 | 17.8% | 5.3%(+12.5)#38 | 4.9%(+12.9)#1,058 |
| 39. | 41513 | 17.6% | 5.3%(+12.3)#39 | 4.9%(+12.8)#1,072 |
| 40. | 41004 | 16.7% | 5.3%(+11.4)#40 | 4.9%(+11.8)#1,153 |
| 41. | 42455 | 16.6% | 5.3%(+11.2)#41 | 4.9%(+11.7)#1,184 |
| 42. | 40419 | 16.0% | 5.3%(+10.6)#42 | 4.9%(+11.1)#1,266 |
| 43. | 42729 | 15.6% | 5.3%(+10.2)#43 | 4.9%(+10.7)#1,319 |
| 44. | 41861 | 15.3% | 5.3%(+9.95)#44 | 4.9%(+10.4)#1,375 |
| 45. | 40078 | 14.8% | 5.3%(+9.46)#45 | 4.9%(+9.92)#1,466 |
| 46. | 40390 | 14.3% | 5.3%(+9.01)#46 | 4.9%(+9.46)#1,549 |
| 47. | 40040 | 14.1% | 5.3%(+8.77)#47 | 4.9%(+9.23)#1,614 |
| 48. | 40003 | 14.0% | 5.3%(+8.72)#48 | 4.9%(+9.18)#1,627 |
| 49. | 42343 | 14.0% | 5.3%(+8.69)#49 | 4.9%(+9.15)#1,633 |
| 50. | 41553 | 14.0% | 5.3%(+8.64)#50 | 4.9%(+9.10)#1,645 |
| 51. | 42748 | 14.0% | 5.3%(+8.62)#51 | 4.9%(+9.08)#1,650 |
| 52. | 41746 | 14.0% | 5.3%(+8.62)#52 | 4.9%(+9.08)#1,651 |
| 53. | 41010 | 13.6% | 5.3%(+8.29)#53 | 4.9%(+8.75)#1,735 |
| 54. | 40025 | 13.6% | 5.3%(+8.26)#54 | 4.9%(+8.72)#1,743 |
| 55. | 41097 | 13.4% | 5.3%(+8.12)#55 | 4.9%(+8.58)#1,784 |
| 56. | 42740 | 13.4% | 5.3%(+8.12)#56 | 4.9%(+8.57)#1,785 |
| 57. | 40862 | 13.4% | 5.3%(+8.10)#57 | 4.9%(+8.56)#1,792 |
| 58. | 42262 | 12.9% | 5.3%(+7.56)#58 | 4.9%(+8.02)#1,940 |
| 59. | 42320 | 12.4% | 5.3%(+7.10)#59 | 4.9%(+7.56)#2,070 |
| 60. | 41141 | 12.4% | 5.3%(+7.04)#60 | 4.9%(+7.50)#2,089 |
| 61. | 40109 | 12.4% | 5.3%(+7.03)#61 | 4.9%(+7.49)#2,092 |
| 62. | 42053 | 11.9% | 5.3%(+6.57)#62 | 4.9%(+7.03)#2,235 |
| 63. | 42236 | 11.7% | 5.3%(+6.40)#63 | 4.9%(+6.86)#2,287 |
| 64. | 42753 | 11.7% | 5.3%(+6.36)#64 | 4.9%(+6.82)#2,304 |
| 65. | 42259 | 11.6% | 5.3%(+6.30)#65 | 4.9%(+6.76)#2,318 |
| 66. | 42276 | 11.6% | 5.3%(+6.24)#66 | 4.9%(+6.69)#2,340 |
| 67. | 42757 | 11.4% | 5.3%(+6.10)#67 | 4.9%(+6.56)#2,380 |
| 68. | 40810 | 11.3% | 5.3%(+5.96)#68 | 4.9%(+6.42)#2,440 |
| 69. | 40371 | 11.2% | 5.3%(+5.90)#69 | 4.9%(+6.36)#2,460 |
| 70. | 40855 | 11.0% | 5.3%(+5.67)#70 | 4.9%(+6.13)#2,559 |
| 71. | 41636 | 10.9% | 5.3%(+5.54)#71 | 4.9%(+6.00)#2,614 |
| 72. | 42123 | 10.7% | 5.3%(+5.41)#72 | 4.9%(+5.87)#2,667 |
| 73. | 40370 | 10.7% | 5.3%(+5.40)#73 | 4.9%(+5.86)#2,672 |
| 74. | 41531 | 10.7% | 5.3%(+5.38)#74 | 4.9%(+5.84)#2,682 |
| 75. | 40202 | 10.7% | 5.3%(+5.37)#75 | 4.9%(+5.83)#2,696 |
| 76. | 40157 | 10.5% | 5.3%(+5.20)#76 | 4.9%(+5.65)#2,802 |
| 77. | 41824 | 10.4% | 5.3%(+5.10)#77 | 4.9%(+5.56)#2,844 |
| 78. | 40060 | 10.3% | 5.3%(+4.98)#78 | 4.9%(+5.44)#2,924 |
| 79. | 42301 | 10.3% | 5.3%(+4.95)#79 | 4.9%(+5.40)#2,947 |
| 80. | 41045 | 10.1% | 5.3%(+4.81)#80 | 4.9%(+5.27)#3,030 |
| 81. | 42330 | 10.1% | 5.3%(+4.81)#81 | 4.9%(+5.27)#3,035 |
| 82. | 42567 | 10.0% | 5.3%(+4.67)#82 | 4.9%(+5.13)#3,101 |
| 83. | 42122 | 9.9% | 5.3%(+4.53)#83 | 4.9%(+4.99)#3,187 |
| 84. | 41314 | 9.9% | 5.3%(+4.52)#84 | 4.9%(+4.98)#3,197 |
| 85. | 40051 | 9.8% | 5.3%(+4.50)#85 | 4.9%(+4.95)#3,220 |
| 86. | 41844 | 9.8% | 5.3%(+4.49)#86 | 4.9%(+4.95)#3,224 |
| 87. | 40740 | 9.8% | 5.3%(+4.45)#87 | 4.9%(+4.91)#3,245 |
| 88. | 42713 | 9.8% | 5.3%(+4.45)#88 | 4.9%(+4.91)#3,246 |
| 89. | 42464 | 9.7% | 5.3%(+4.38)#89 | 4.9%(+4.84)#3,298 |
| 90. | 40508 | 9.7% | 5.3%(+4.33)#90 | 4.9%(+4.79)#3,330 |
| 91. | 41175 | 9.6% | 5.3%(+4.27)#91 | 4.9%(+4.73)#3,372 |
| 92. | 40868 | 9.6% | 5.3%(+4.26)#92 | 4.9%(+4.72)#3,380 |
| 93. | 41041 | 9.6% | 5.3%(+4.26)#93 | 4.9%(+4.71)#3,381 |
| 94. | 42459 | 9.6% | 5.3%(+4.25)#94 | 4.9%(+4.71)#3,386 |
| 95. | 41635 | 9.6% | 5.3%(+4.24)#95 | 4.9%(+4.70)#3,397 |
| 96. | 40108 | 9.4% | 5.3%(+4.07)#96 | 4.9%(+4.53)#3,521 |
| 97. | 42134 | 9.4% | 5.3%(+4.04)#97 | 4.9%(+4.50)#3,538 |
| 98. | 40076 | 9.4% | 5.3%(+4.04)#98 | 4.9%(+4.50)#3,546 |
| 99. | 40212 | 9.3% | 5.3%(+4.01)#99 | 4.9%(+4.46)#3,571 |
| 100. | 40769 | 9.3% | 5.3%(+3.99)#100 | 4.9%(+4.44)#3,587 |
Common Questions
What are the Top 10 Zip Codes with the Highest Percentage of Population with a Degree in Liberal Arts and History in Kentucky?
Top 10 Zip Codes with the Highest Percentage of Population with a Degree in Liberal Arts and History in Kentucky are:
What zip code has the Highest Percentage of Population with a Degree in Liberal Arts and History in Kentucky?
40997 has the Highest Percentage of Population with a Degree in Liberal Arts and History in Kentucky with 76.9%.
What is the Percentage of Population with a Degree in Liberal Arts and History in the State of Kentucky?
Percentage of Population with a Degree in Liberal Arts and History in Kentucky is 5.3%.
What is the Percentage of Population with a Degree in Liberal Arts and History in the United States?
Percentage of Population with a Degree in Liberal Arts and History in the United States is 4.9%.