Shadeland, IN Map & Demographics
Shadeland Map
Shadeland Overview
$38,605
PER CAPITA INCOME
$99,583
AVG FAMILY INCOME
$76,250
AVG HOUSEHOLD INCOME
44.1%
WAGE / INCOME GAP [ % ]
55.9¢/ $1
WAGE / INCOME GAP [ $ ]
0.47
INEQUALITY / GINI INDEX
2,092
TOTAL POPULATION
1,075
MALE POPULATION
1,017
FEMALE POPULATION
105.70
MALES / 100 FEMALES
94.60
FEMALES / 100 MALES
38.6
MEDIAN AGE
3.2
AVG FAMILY SIZE
2.9
AVG HOUSEHOLD SIZE
1,002
LABOR FORCE [ PEOPLE ]
63.0%
PERCENT IN LABOR FORCE
2.1%
UNEMPLOYMENT RATE
Shadeland Area Codes
Income in Shadeland
Income Overview in Shadeland
Per Capita Income in Shadeland is $38,605, while median incomes of families and households are $99,583 and $76,250 respectively.
| Characteristic | Number | Measure |
| Per Capita Income | 2,092 | $38,605 |
| Median Family Income | 558 | $99,583 |
| Mean Family Income | 558 | $118,052 |
| Median Household Income | 732 | $76,250 |
| Mean Household Income | 732 | $106,305 |
| Income Deficit | 558 | $0 |
| Wage / Income Gap (%) | 2,092 | 44.08% |
| Wage / Income Gap ($) | 2,092 | 55.92¢ per $1 |
| Gini / Inequality Index | 2,092 | 0.47 |
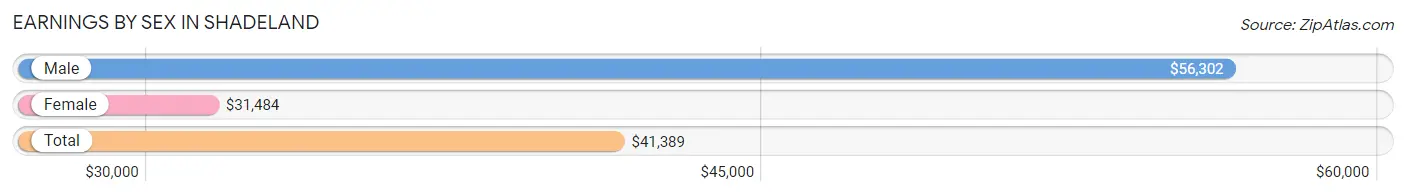
Earnings by Sex in Shadeland
Average Earnings in Shadeland are $41,389, $56,302 for men and $31,484 for women, a difference of 44.1%.
| Sex | Number | Average Earnings |
| Male | 565 (53.8%) | $56,302 |
| Female | 485 (46.2%) | $31,484 |
| Total | 1,050 (100.0%) | $41,389 |
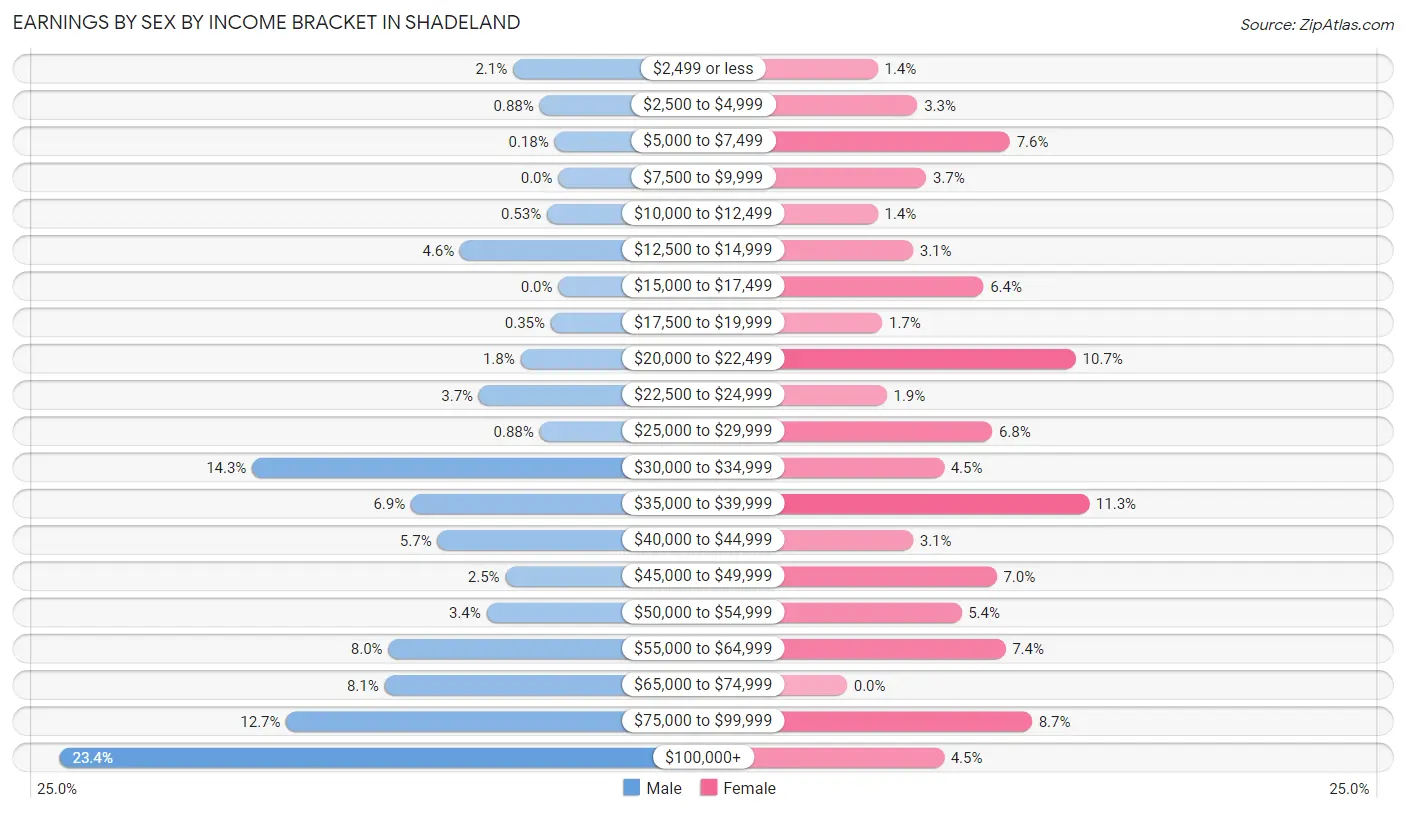
Earnings by Sex by Income Bracket in Shadeland
The most common earnings brackets in Shadeland are $100,000+ for men (132 | 23.4%) and $35,000 to $39,999 for women (55 | 11.3%).
| Income | Male | Female |
| $2,499 or less | 12 (2.1%) | 7 (1.4%) |
| $2,500 to $4,999 | 5 (0.9%) | 16 (3.3%) |
| $5,000 to $7,499 | 1 (0.2%) | 37 (7.6%) |
| $7,500 to $9,999 | 0 (0.0%) | 18 (3.7%) |
| $10,000 to $12,499 | 3 (0.5%) | 7 (1.4%) |
| $12,500 to $14,999 | 26 (4.6%) | 15 (3.1%) |
| $15,000 to $17,499 | 0 (0.0%) | 31 (6.4%) |
| $17,500 to $19,999 | 2 (0.4%) | 8 (1.7%) |
| $20,000 to $22,499 | 10 (1.8%) | 52 (10.7%) |
| $22,500 to $24,999 | 21 (3.7%) | 9 (1.9%) |
| $25,000 to $29,999 | 5 (0.9%) | 33 (6.8%) |
| $30,000 to $34,999 | 81 (14.3%) | 22 (4.5%) |
| $35,000 to $39,999 | 39 (6.9%) | 55 (11.3%) |
| $40,000 to $44,999 | 32 (5.7%) | 15 (3.1%) |
| $45,000 to $49,999 | 14 (2.5%) | 34 (7.0%) |
| $50,000 to $54,999 | 19 (3.4%) | 26 (5.4%) |
| $55,000 to $64,999 | 45 (8.0%) | 36 (7.4%) |
| $65,000 to $74,999 | 46 (8.1%) | 0 (0.0%) |
| $75,000 to $99,999 | 72 (12.7%) | 42 (8.7%) |
| $100,000+ | 132 (23.4%) | 22 (4.5%) |
| Total | 565 (100.0%) | 485 (100.0%) |
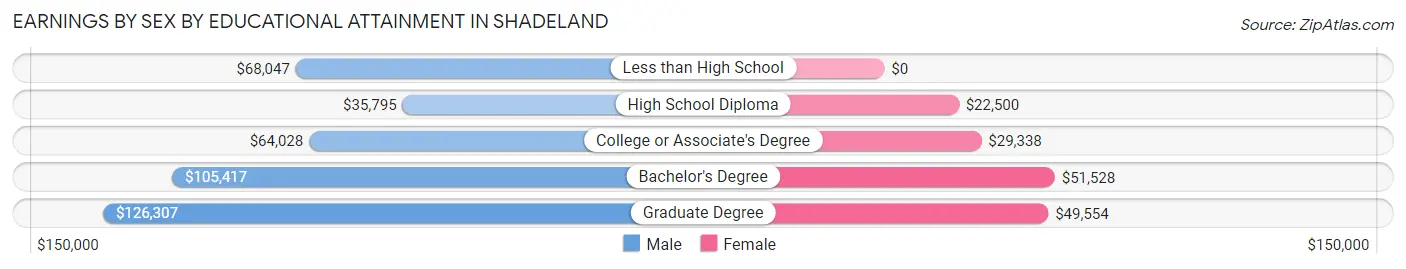
Earnings by Sex by Educational Attainment in Shadeland
Average earnings in Shadeland are $64,583 for men and $35,530 for women, a difference of 45.0%. Men with an educational attainment of graduate degree enjoy the highest average annual earnings of $126,307, while those with high school diploma education earn the least with $35,795. Women with an educational attainment of bachelor's degree earn the most with the average annual earnings of $51,528, while those with high school diploma education have the smallest earnings of $22,500.
| Educational Attainment | Male Income | Female Income |
| Less than High School | $68,047 | $0 |
| High School Diploma | $35,795 | $22,500 |
| College or Associate's Degree | $64,028 | $29,338 |
| Bachelor's Degree | $105,417 | $51,528 |
| Graduate Degree | $126,307 | $49,554 |
| Total | $64,583 | $35,530 |
Family Income in Shadeland
Family Income Brackets in Shadeland
According to the Shadeland family income data, there are 144 families falling into the $100,000 to $149,999 income range, which is the most common income bracket and makes up 25.8% of all families.
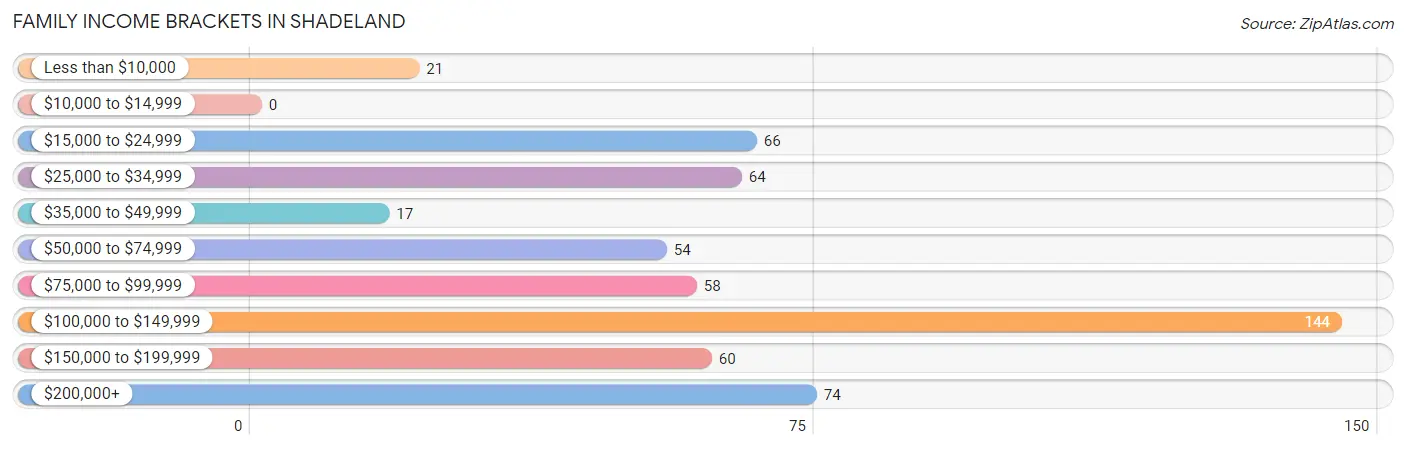
| Income Bracket | # Families | % Families |
| Less than $10,000 | 21 | 3.8% |
| $10,000 to $14,999 | 0 | 0.0% |
| $15,000 to $24,999 | 66 | 11.8% |
| $25,000 to $34,999 | 64 | 11.5% |
| $35,000 to $49,999 | 17 | 3.0% |
| $50,000 to $74,999 | 54 | 9.7% |
| $75,000 to $99,999 | 58 | 10.4% |
| $100,000 to $149,999 | 144 | 25.8% |
| $150,000 to $199,999 | 60 | 10.8% |
| $200,000+ | 74 | 13.3% |
Family Income by Famaliy Size in Shadeland
5-person families (46 | 8.2%) account for the highest median family income in Shadeland with $113,750 per family, while 2-person families (224 | 40.1%) have the highest median income of $41,875 per family member.
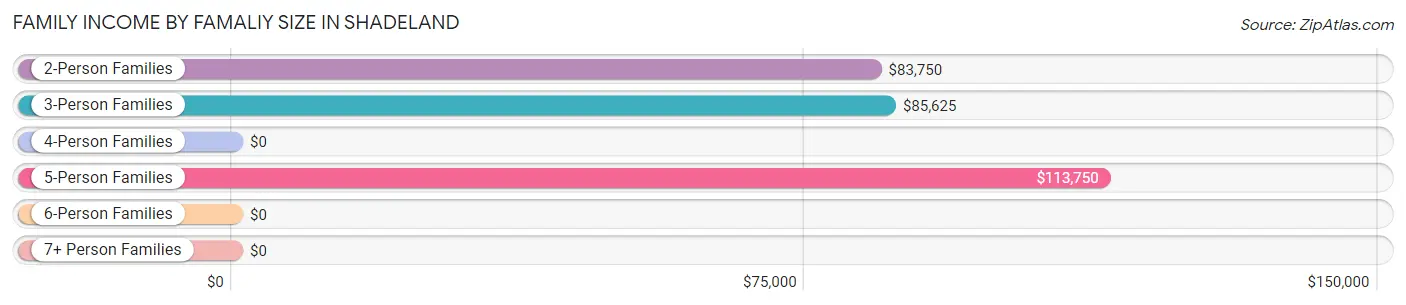
| Income Bracket | # Families | Median Income |
| 2-Person Families | 224 (40.1%) | $83,750 |
| 3-Person Families | 120 (21.5%) | $85,625 |
| 4-Person Families | 154 (27.6%) | $0 |
| 5-Person Families | 46 (8.2%) | $113,750 |
| 6-Person Families | 11 (2.0%) | $0 |
| 7+ Person Families | 3 (0.5%) | $0 |
| Total | 558 (100.0%) | $99,583 |
Family Income by Number of Earners in Shadeland
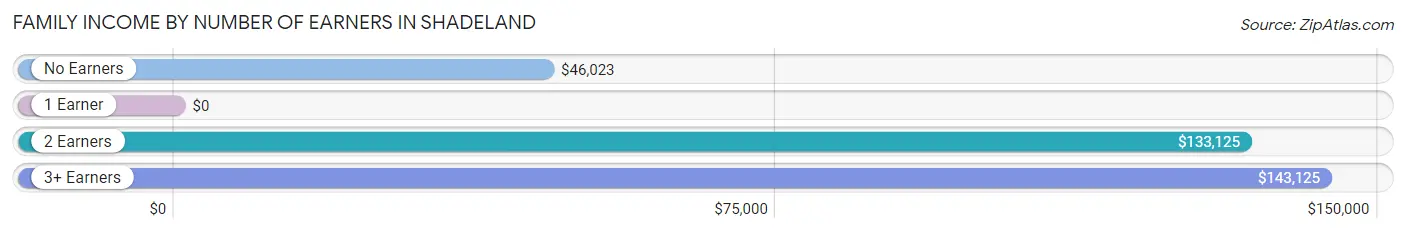
| Number of Earners | # Families | Median Income |
| No Earners | 91 (16.3%) | $46,023 |
| 1 Earner | 179 (32.1%) | $0 |
| 2 Earners | 233 (41.8%) | $133,125 |
| 3+ Earners | 55 (9.9%) | $143,125 |
| Total | 558 (100.0%) | $99,583 |
Household Income in Shadeland
Household Income Brackets in Shadeland
With 137 households falling in the category, the $100,000 to $149,999 income range is the most frequent in Shadeland, accounting for 18.7% of all households. In contrast, only 6 households (0.8%) fall into the $10,000 to $14,999 income bracket, making it the least populous group.
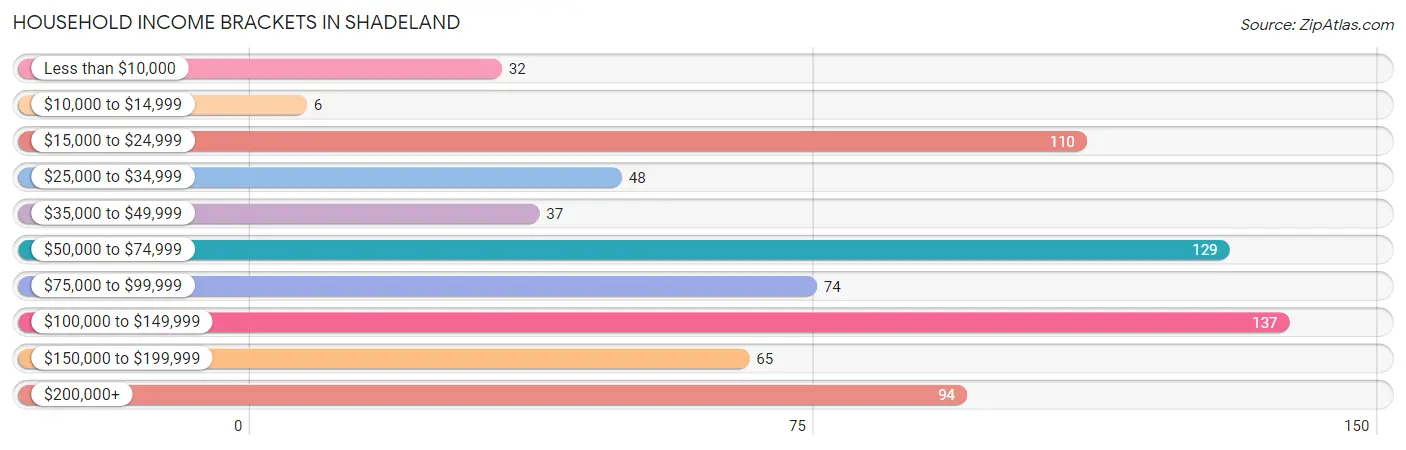
| Income Bracket | # Households | % Households |
| Less than $10,000 | 32 | 4.4% |
| $10,000 to $14,999 | 6 | 0.8% |
| $15,000 to $24,999 | 110 | 15.0% |
| $25,000 to $34,999 | 48 | 6.6% |
| $35,000 to $49,999 | 37 | 5.1% |
| $50,000 to $74,999 | 129 | 17.6% |
| $75,000 to $99,999 | 74 | 10.1% |
| $100,000 to $149,999 | 137 | 18.7% |
| $150,000 to $199,999 | 65 | 8.9% |
| $200,000+ | 94 | 12.8% |
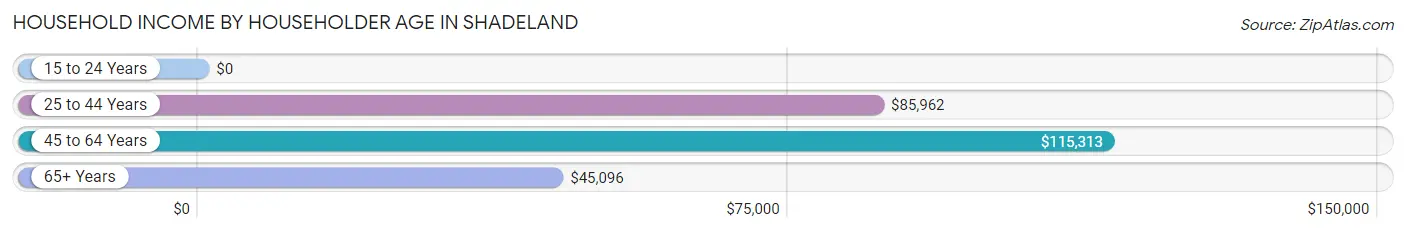
Household Income by Householder Age in Shadeland
The median household income in Shadeland is $76,250, with the highest median household income of $115,313 found in the 45 to 64 years age bracket for the primary householder. A total of 269 households (36.7%) fall into this category.
| Income Bracket | # Households | Median Income |
| 15 to 24 Years | 0 (0.0%) | $0 |
| 25 to 44 Years | 250 (34.2%) | $85,962 |
| 45 to 64 Years | 269 (36.7%) | $115,313 |
| 65+ Years | 213 (29.1%) | $45,096 |
| Total | 732 (100.0%) | $76,250 |
Poverty in Shadeland
Income Below Poverty by Sex and Age in Shadeland
With 14.3% poverty level for males and 20.5% for females among the residents of Shadeland, 15 year old males and 6 to 11 year old females are the most vulnerable to poverty, with 30 males (69.8%) and 72 females (55.0%) in their respective age groups living below the poverty level.
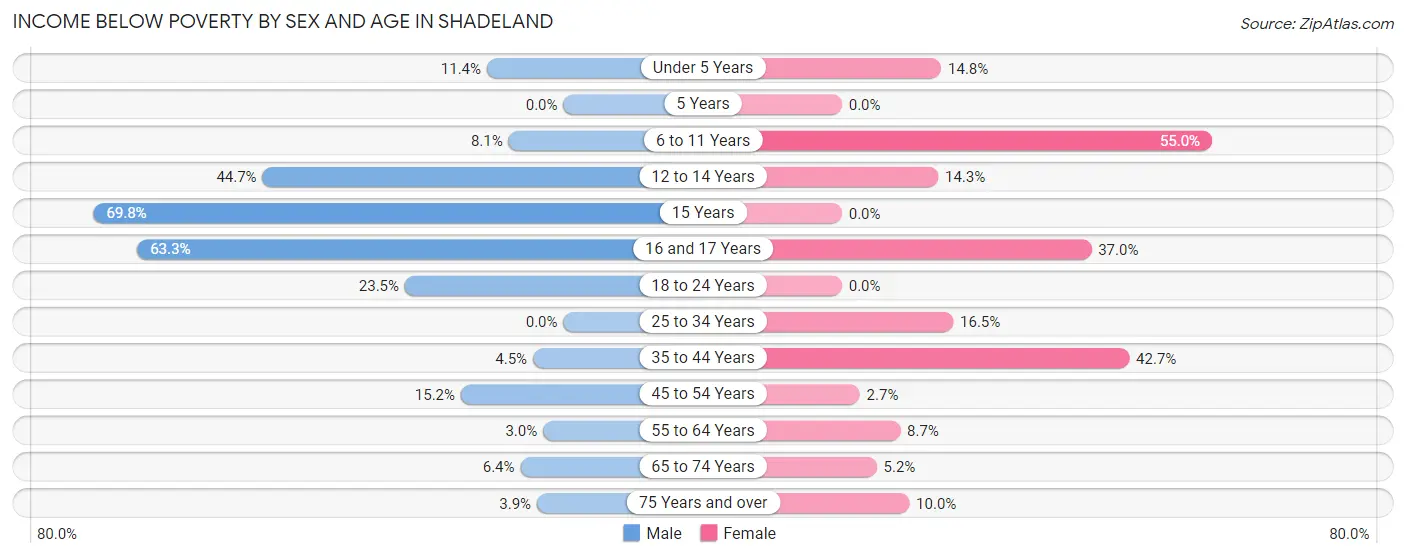
| Age Bracket | Male | Female |
| Under 5 Years | 5 (11.4%) | 9 (14.7%) |
| 5 Years | 0 (0.0%) | 0 (0.0%) |
| 6 to 11 Years | 7 (8.1%) | 72 (55.0%) |
| 12 to 14 Years | 21 (44.7%) | 8 (14.3%) |
| 15 Years | 30 (69.8%) | 0 (0.0%) |
| 16 and 17 Years | 31 (63.3%) | 10 (37.0%) |
| 18 to 24 Years | 24 (23.5%) | 0 (0.0%) |
| 25 to 34 Years | 0 (0.0%) | 20 (16.5%) |
| 35 to 44 Years | 9 (4.5%) | 64 (42.7%) |
| 45 to 54 Years | 14 (15.2%) | 3 (2.6%) |
| 55 to 64 Years | 5 (3.0%) | 11 (8.7%) |
| 65 to 74 Years | 6 (6.4%) | 6 (5.2%) |
| 75 Years and over | 2 (3.9%) | 5 (10.0%) |
| Total | 154 (14.3%) | 208 (20.5%) |
Income Above Poverty by Sex and Age in Shadeland
According to the poverty statistics in Shadeland, males aged 25 to 34 years and females aged 5 years are the age groups that are most secure financially, with 100.0% of males and 100.0% of females in these age groups living above the poverty line.
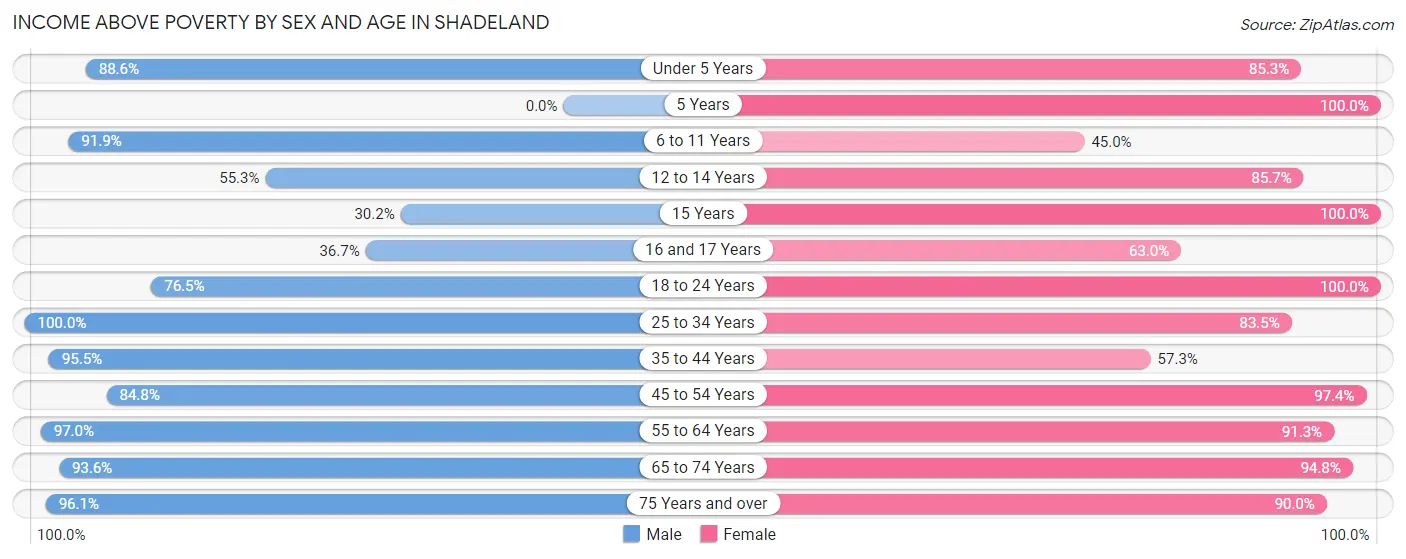
| Age Bracket | Male | Female |
| Under 5 Years | 39 (88.6%) | 52 (85.3%) |
| 5 Years | 0 (0.0%) | 14 (100.0%) |
| 6 to 11 Years | 79 (91.9%) | 59 (45.0%) |
| 12 to 14 Years | 26 (55.3%) | 48 (85.7%) |
| 15 Years | 13 (30.2%) | 16 (100.0%) |
| 16 and 17 Years | 18 (36.7%) | 17 (63.0%) |
| 18 to 24 Years | 78 (76.5%) | 31 (100.0%) |
| 25 to 34 Years | 102 (100.0%) | 101 (83.5%) |
| 35 to 44 Years | 190 (95.5%) | 86 (57.3%) |
| 45 to 54 Years | 78 (84.8%) | 110 (97.4%) |
| 55 to 64 Years | 161 (97.0%) | 116 (91.3%) |
| 65 to 74 Years | 88 (93.6%) | 110 (94.8%) |
| 75 Years and over | 49 (96.1%) | 45 (90.0%) |
| Total | 921 (85.7%) | 805 (79.5%) |
Income Below Poverty Among Married-Couple Families in Shadeland
The poverty statistics for married-couple families in Shadeland show that 0.7% or 3 of the total 417 families live below the poverty line. Families with 1 or 2 children have the highest poverty rate of 2.0%, comprising of 3 families. On the other hand, families with no children have the lowest poverty rate of 0.0%, which includes 0 families.
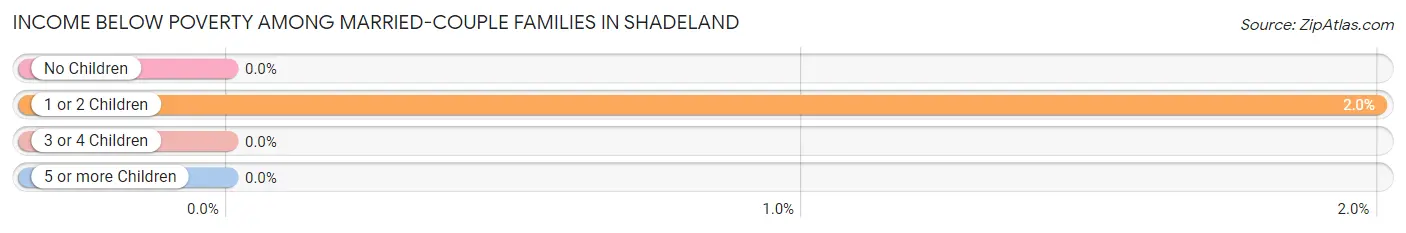
| Children | Above Poverty | Below Poverty |
| No Children | 224 (100.0%) | 0 (0.0%) |
| 1 or 2 Children | 147 (98.0%) | 3 (2.0%) |
| 3 or 4 Children | 43 (100.0%) | 0 (0.0%) |
| 5 or more Children | 0 (0.0%) | 0 (0.0%) |
| Total | 414 (99.3%) | 3 (0.7%) |
Income Below Poverty Among Single-Parent Households in Shadeland
According to the poverty data in Shadeland, 57.1% or 12 single-father households and 65.0% or 78 single-mother households are living below the poverty line. Among single-father households, those with 1 or 2 children have the highest poverty rate, with 12 households (57.1%) experiencing poverty. Likewise, among single-mother households, those with 3 or 4 children have the highest poverty rate, with 32 households (91.4%) falling below the poverty line.
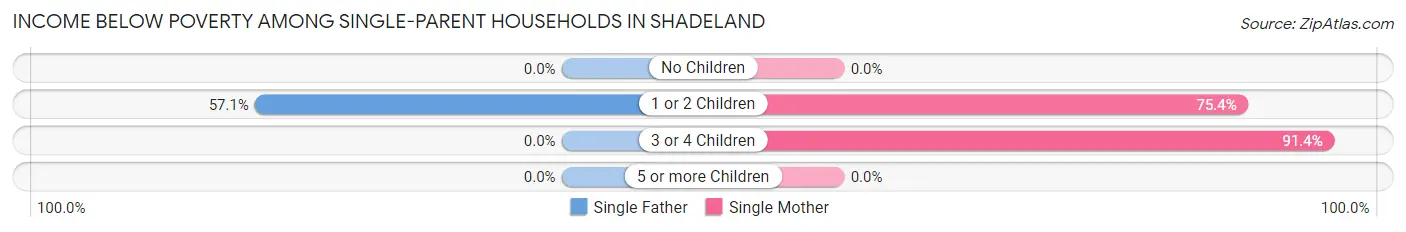
| Children | Single Father | Single Mother |
| No Children | 0 (0.0%) | 0 (0.0%) |
| 1 or 2 Children | 12 (57.1%) | 46 (75.4%) |
| 3 or 4 Children | 0 (0.0%) | 32 (91.4%) |
| 5 or more Children | 0 (0.0%) | 0 (0.0%) |
| Total | 12 (57.1%) | 78 (65.0%) |
Income Below Poverty Among Married-Couple vs Single-Parent Households in Shadeland
The poverty data for Shadeland shows that 3 of the married-couple family households (0.7%) and 90 of the single-parent households (63.8%) are living below the poverty level. Within the married-couple family households, those with 1 or 2 children have the highest poverty rate, with 3 households (2.0%) falling below the poverty line. Among the single-parent households, those with 3 or 4 children have the highest poverty rate, with 32 household (91.4%) living below poverty.
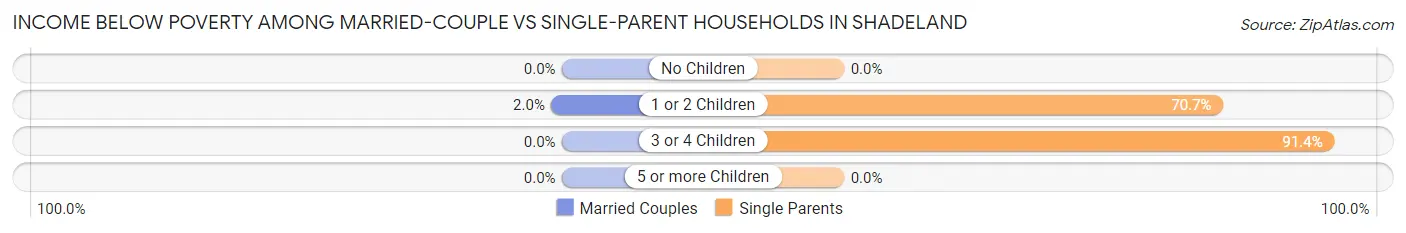
| Children | Married-Couple Families | Single-Parent Households |
| No Children | 0 (0.0%) | 0 (0.0%) |
| 1 or 2 Children | 3 (2.0%) | 58 (70.7%) |
| 3 or 4 Children | 0 (0.0%) | 32 (91.4%) |
| 5 or more Children | 0 (0.0%) | 0 (0.0%) |
| Total | 3 (0.7%) | 90 (63.8%) |
Race in Shadeland
The most populous races in Shadeland are White / Caucasian (1,966 | 94.0%), Two or more Races (79 | 3.8%), and Hispanic or Latino (37 | 1.8%).
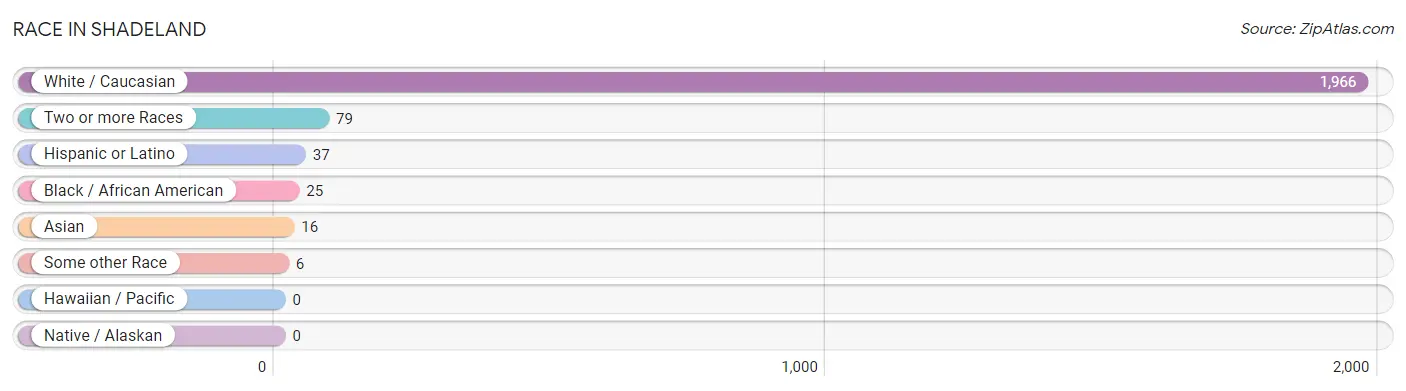
| Race | # Population | % Population |
| Asian | 16 | 0.8% |
| Black / African American | 25 | 1.2% |
| Hawaiian / Pacific | 0 | 0.0% |
| Hispanic or Latino | 37 | 1.8% |
| Native / Alaskan | 0 | 0.0% |
| White / Caucasian | 1,966 | 94.0% |
| Two or more Races | 79 | 3.8% |
| Some other Race | 6 | 0.3% |
| Total | 2,092 | 100.0% |
Ancestry in Shadeland
The most populous ancestries reported in Shadeland are German (446 | 21.3%), English (257 | 12.3%), Irish (215 | 10.3%), American (117 | 5.6%), and Dutch (102 | 4.9%), together accounting for 54.3% of all Shadeland residents.
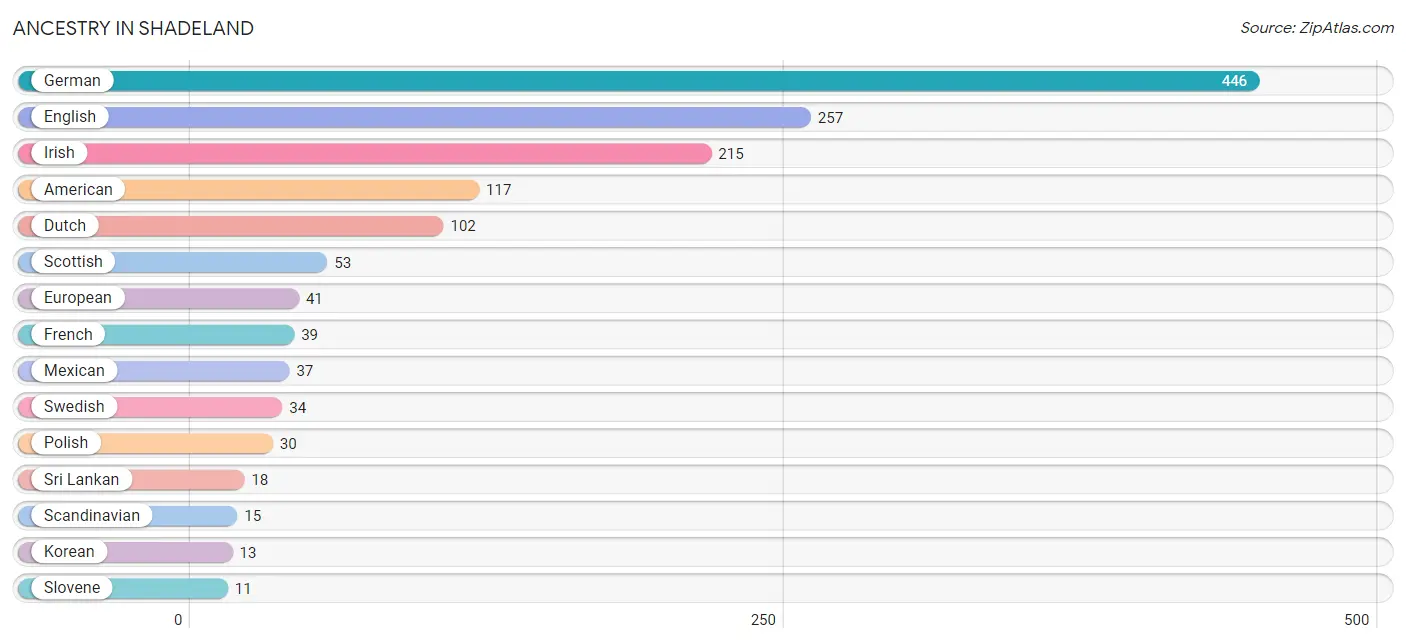
| Ancestry | # Population | % Population |
| American | 117 | 5.6% |
| Austrian | 7 | 0.3% |
| Belgian | 3 | 0.1% |
| Bhutanese | 7 | 0.3% |
| Cherokee | 1 | 0.1% |
| Czech | 3 | 0.1% |
| Danish | 2 | 0.1% |
| Dutch | 102 | 4.9% |
| English | 257 | 12.3% |
| European | 41 | 2.0% |
| Finnish | 4 | 0.2% |
| French | 39 | 1.9% |
| German | 446 | 21.3% |
| Greek | 2 | 0.1% |
| Hungarian | 2 | 0.1% |
| Indian (Asian) | 6 | 0.3% |
| Irish | 215 | 10.3% |
| Italian | 8 | 0.4% |
| Korean | 13 | 0.6% |
| Mexican | 37 | 1.8% |
| Northern European | 3 | 0.1% |
| Norwegian | 9 | 0.4% |
| Polish | 30 | 1.4% |
| Scandinavian | 15 | 0.7% |
| Scotch-Irish | 5 | 0.2% |
| Scottish | 53 | 2.5% |
| Slovene | 11 | 0.5% |
| Sri Lankan | 18 | 0.9% |
| Swedish | 34 | 1.6% |
| Welsh | 7 | 0.3% | View All 30 Rows |
Immigrants in Shadeland
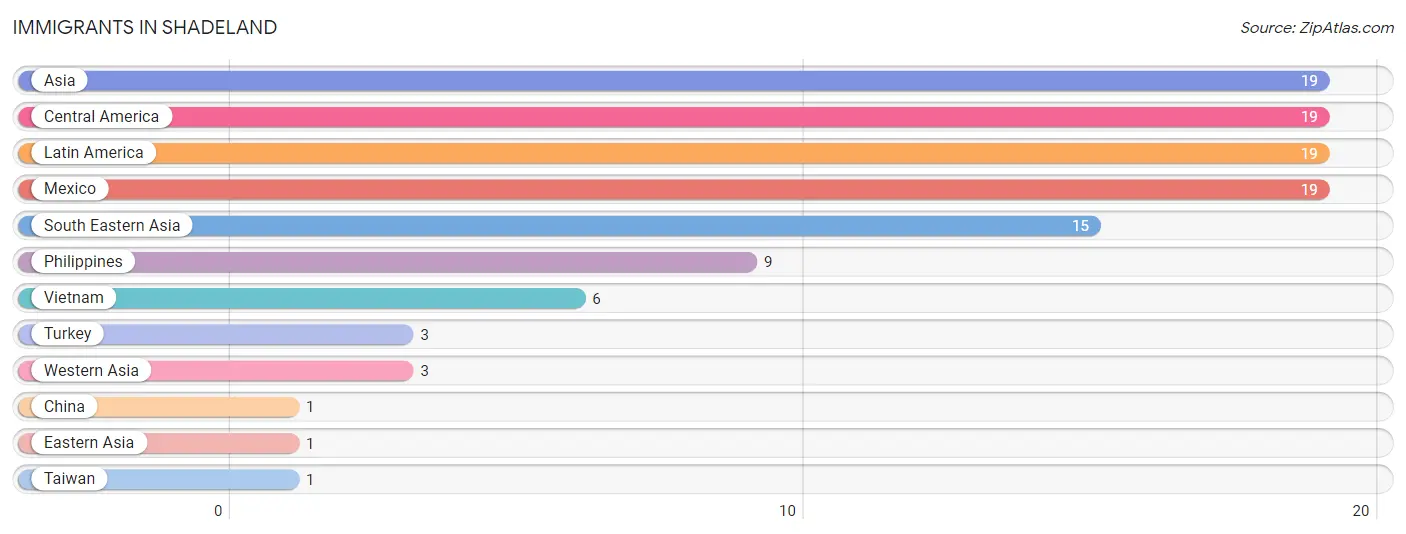
The most numerous immigrant groups reported in Shadeland came from Asia (19 | 0.9%), Central America (19 | 0.9%), Latin America (19 | 0.9%), Mexico (19 | 0.9%), and South Eastern Asia (15 | 0.7%), together accounting for 4.4% of all Shadeland residents.
| Immigration Origin | # Population | % Population |
| Asia | 19 | 0.9% |
| Central America | 19 | 0.9% |
| China | 1 | 0.1% |
| Eastern Asia | 1 | 0.1% |
| Latin America | 19 | 0.9% |
| Mexico | 19 | 0.9% |
| Philippines | 9 | 0.4% |
| South Eastern Asia | 15 | 0.7% |
| Taiwan | 1 | 0.1% |
| Turkey | 3 | 0.1% |
| Vietnam | 6 | 0.3% |
| Western Asia | 3 | 0.1% | View All 12 Rows |
Sex and Age in Shadeland
Sex and Age in Shadeland
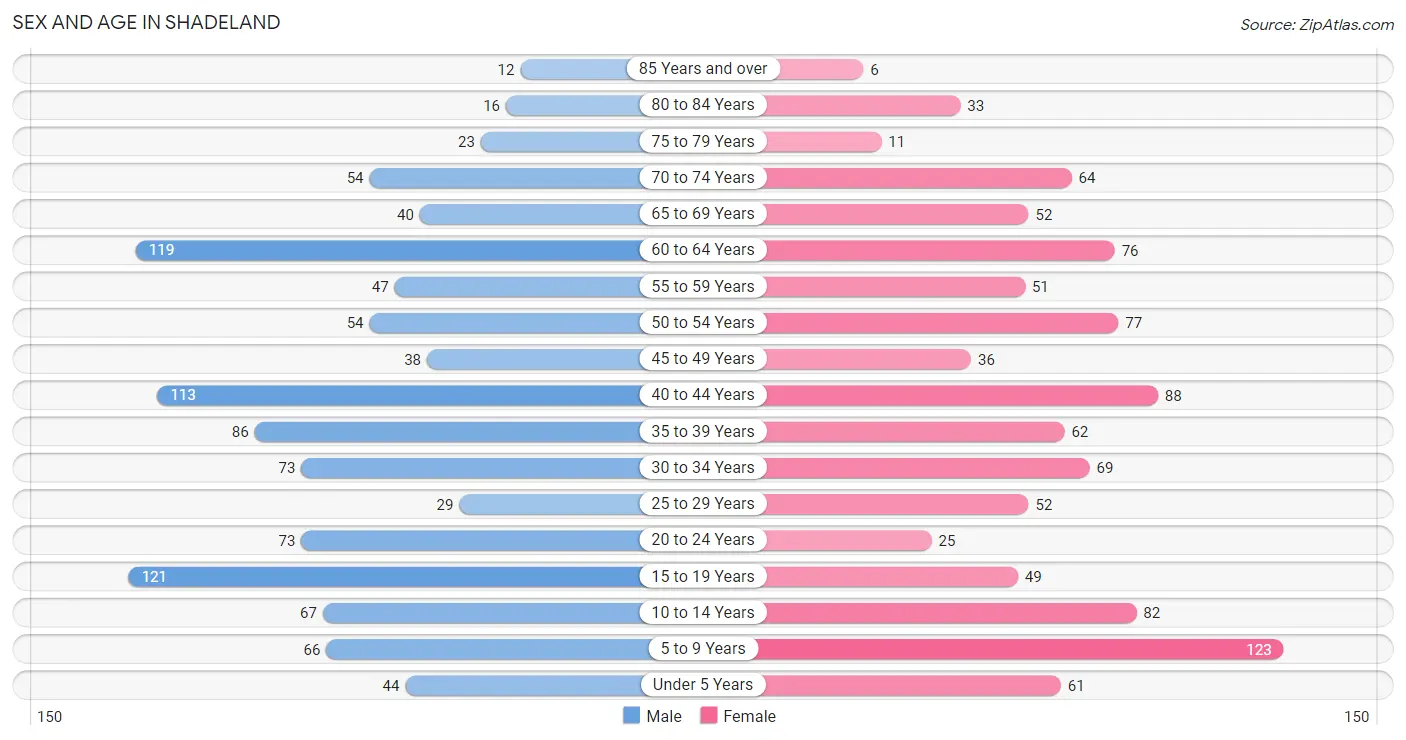
The most populous age groups in Shadeland are 15 to 19 Years (121 | 11.3%) for men and 5 to 9 Years (123 | 12.1%) for women.
| Age Bracket | Male | Female |
| Under 5 Years | 44 (4.1%) | 61 (6.0%) |
| 5 to 9 Years | 66 (6.1%) | 123 (12.1%) |
| 10 to 14 Years | 67 (6.2%) | 82 (8.1%) |
| 15 to 19 Years | 121 (11.3%) | 49 (4.8%) |
| 20 to 24 Years | 73 (6.8%) | 25 (2.5%) |
| 25 to 29 Years | 29 (2.7%) | 52 (5.1%) |
| 30 to 34 Years | 73 (6.8%) | 69 (6.8%) |
| 35 to 39 Years | 86 (8.0%) | 62 (6.1%) |
| 40 to 44 Years | 113 (10.5%) | 88 (8.6%) |
| 45 to 49 Years | 38 (3.5%) | 36 (3.5%) |
| 50 to 54 Years | 54 (5.0%) | 77 (7.6%) |
| 55 to 59 Years | 47 (4.4%) | 51 (5.0%) |
| 60 to 64 Years | 119 (11.1%) | 76 (7.5%) |
| 65 to 69 Years | 40 (3.7%) | 52 (5.1%) |
| 70 to 74 Years | 54 (5.0%) | 64 (6.3%) |
| 75 to 79 Years | 23 (2.1%) | 11 (1.1%) |
| 80 to 84 Years | 16 (1.5%) | 33 (3.2%) |
| 85 Years and over | 12 (1.1%) | 6 (0.6%) |
| Total | 1,075 (100.0%) | 1,017 (100.0%) |
Families and Households in Shadeland
Median Family Size in Shadeland
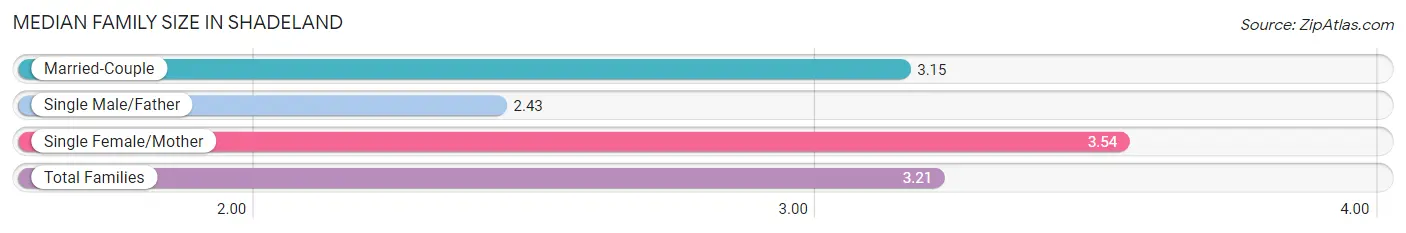
The median family size in Shadeland is 3.21 persons per family, with single female/mother families (120 | 21.5%) accounting for the largest median family size of 3.54 persons per family. On the other hand, single male/father families (21 | 3.8%) represent the smallest median family size with 2.43 persons per family.
| Family Type | # Families | Family Size |
| Married-Couple | 417 (74.7%) | 3.15 |
| Single Male/Father | 21 (3.8%) | 2.43 |
| Single Female/Mother | 120 (21.5%) | 3.54 |
| Total Families | 558 (100.0%) | 3.21 |
Median Household Size in Shadeland
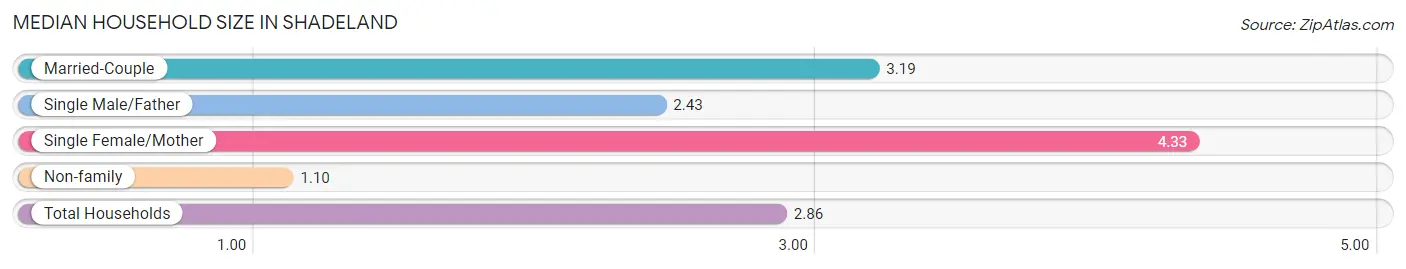
The median household size in Shadeland is 2.86 persons per household, with single female/mother households (120 | 16.4%) accounting for the largest median household size of 4.33 persons per household. non-family households (174 | 23.8%) represent the smallest median household size with 1.10 persons per household.
| Household Type | # Households | Household Size |
| Married-Couple | 417 (57.0%) | 3.19 |
| Single Male/Father | 21 (2.9%) | 2.43 |
| Single Female/Mother | 120 (16.4%) | 4.33 |
| Non-family | 174 (23.8%) | 1.10 |
| Total Households | 732 (100.0%) | 2.86 |
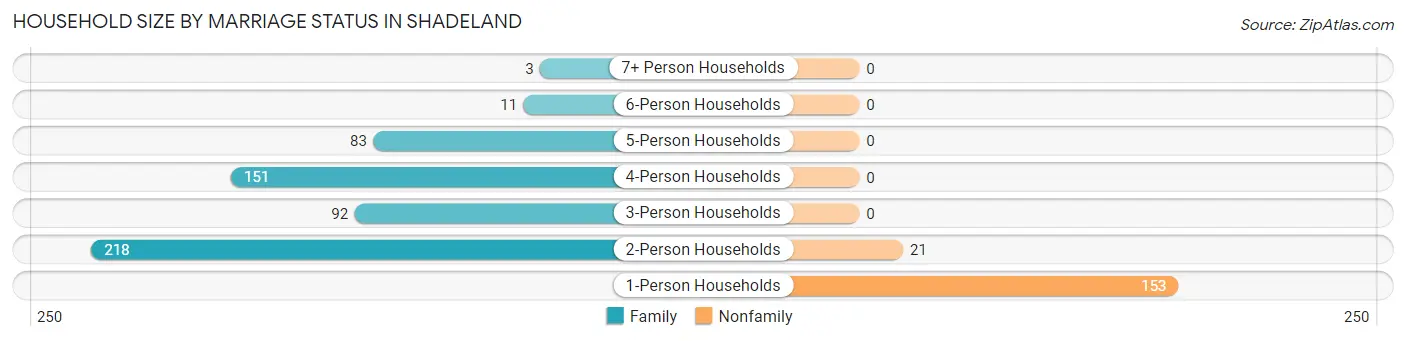
Household Size by Marriage Status in Shadeland
Out of a total of 732 households in Shadeland, 558 (76.2%) are family households, while 174 (23.8%) are nonfamily households. The most numerous type of family households are 2-person households, comprising 218, and the most common type of nonfamily households are 1-person households, comprising 153.
| Household Size | Family Households | Nonfamily Households |
| 1-Person Households | - | 153 (20.9%) |
| 2-Person Households | 218 (29.8%) | 21 (2.9%) |
| 3-Person Households | 92 (12.6%) | 0 (0.0%) |
| 4-Person Households | 151 (20.6%) | 0 (0.0%) |
| 5-Person Households | 83 (11.3%) | 0 (0.0%) |
| 6-Person Households | 11 (1.5%) | 0 (0.0%) |
| 7+ Person Households | 3 (0.4%) | 0 (0.0%) |
| Total | 558 (76.2%) | 174 (23.8%) |
Female Fertility in Shadeland
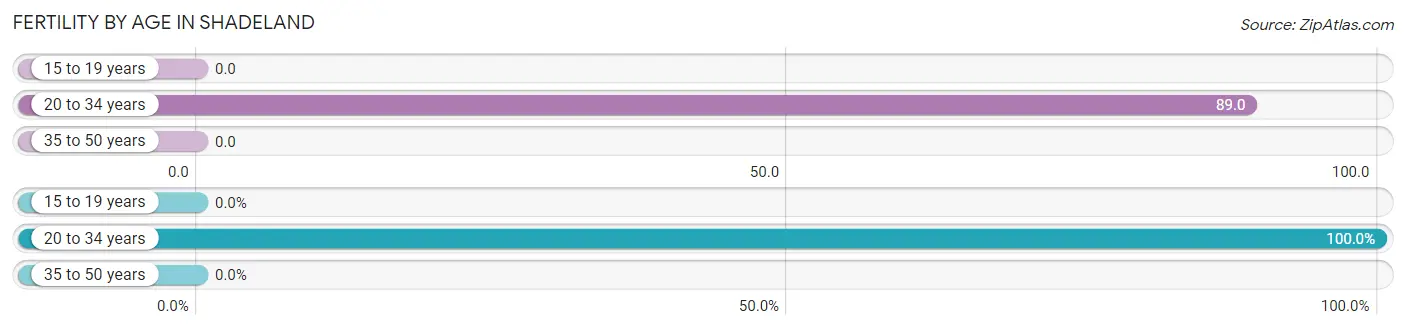
Fertility by Age in Shadeland
Average fertility rate in Shadeland is 33.0 births per 1,000 women. Women in the age bracket of 20 to 34 years have the highest fertility rate with 89.0 births per 1,000 women. Women in the age bracket of 20 to 34 years acount for 100.0% of all women with births.
| Age Bracket | Women with Births | Births / 1,000 Women |
| 15 to 19 years | 0 (0.0%) | 0.0 |
| 20 to 34 years | 13 (100.0%) | 89.0 |
| 35 to 50 years | 0 (0.0%) | 0.0 |
| Total | 13 (100.0%) | 33.0 |
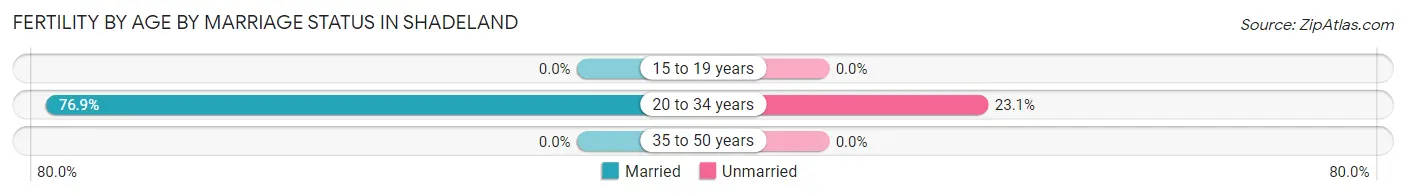
Fertility by Age by Marriage Status in Shadeland
76.9% of women with births (13) in Shadeland are married. The highest percentage of unmarried women with births falls into 20 to 34 years age bracket with 23.1% of them unmarried at the time of birth, while the lowest percentage of unmarried women with births belong to 20 to 34 years age bracket with 23.1% of them unmarried.
| Age Bracket | Married | Unmarried |
| 15 to 19 years | 0 (0.0%) | 0 (0.0%) |
| 20 to 34 years | 10 (76.9%) | 3 (23.1%) |
| 35 to 50 years | 0 (0.0%) | 0 (0.0%) |
| Total | 10 (76.9%) | 3 (23.1%) |
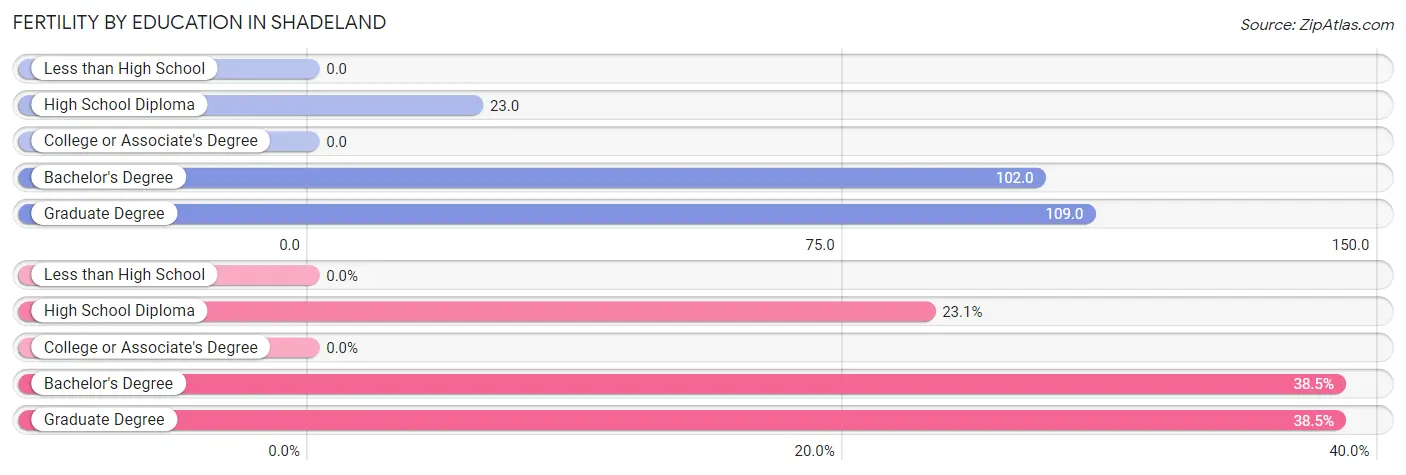
Fertility by Education in Shadeland
| Educational Attainment | Women with Births | Births / 1,000 Women |
| Less than High School | 0 (0.0%) | 0.0 |
| High School Diploma | 3 (23.1%) | 23.0 |
| College or Associate's Degree | 0 (0.0%) | 0.0 |
| Bachelor's Degree | 5 (38.5%) | 102.0 |
| Graduate Degree | 5 (38.5%) | 109.0 |
| Total | 13 (100.0%) | 33.0 |
Fertility by Education by Marriage Status in Shadeland
23.1% of women with births in Shadeland are unmarried. Women with the educational attainment of bachelor's degree are most likely to be married with 100.0% of them married at childbirth, while women with the educational attainment of high school diploma are least likely to be married with 100.0% of them unmarried at childbirth.
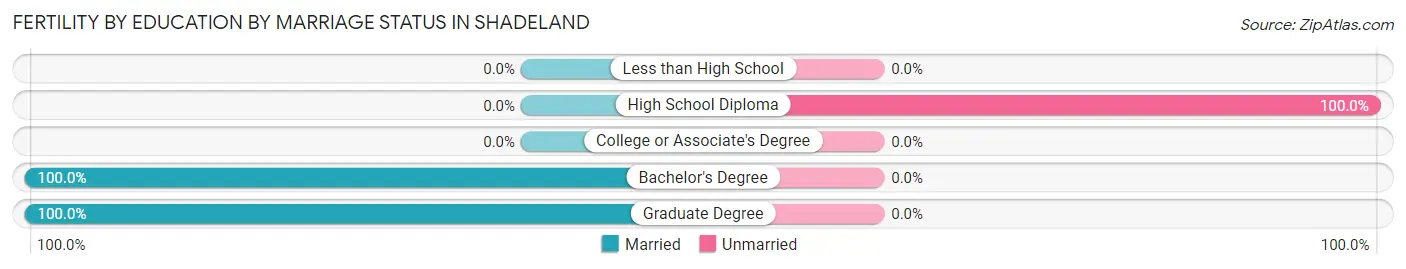
| Educational Attainment | Married | Unmarried |
| Less than High School | 0 (0.0%) | 0 (0.0%) |
| High School Diploma | 0 (0.0%) | 3 (100.0%) |
| College or Associate's Degree | 0 (0.0%) | 0 (0.0%) |
| Bachelor's Degree | 5 (100.0%) | 0 (0.0%) |
| Graduate Degree | 5 (100.0%) | 0 (0.0%) |
| Total | 10 (76.9%) | 3 (23.1%) |
Employment Characteristics in Shadeland
Employment by Class of Employer in Shadeland
Among the 957 employed individuals in Shadeland, private company employees (569 | 59.5%), state government employees (95 | 9.9%), and self-employed (incorporated) (72 | 7.5%) make up the most common classes of employment.
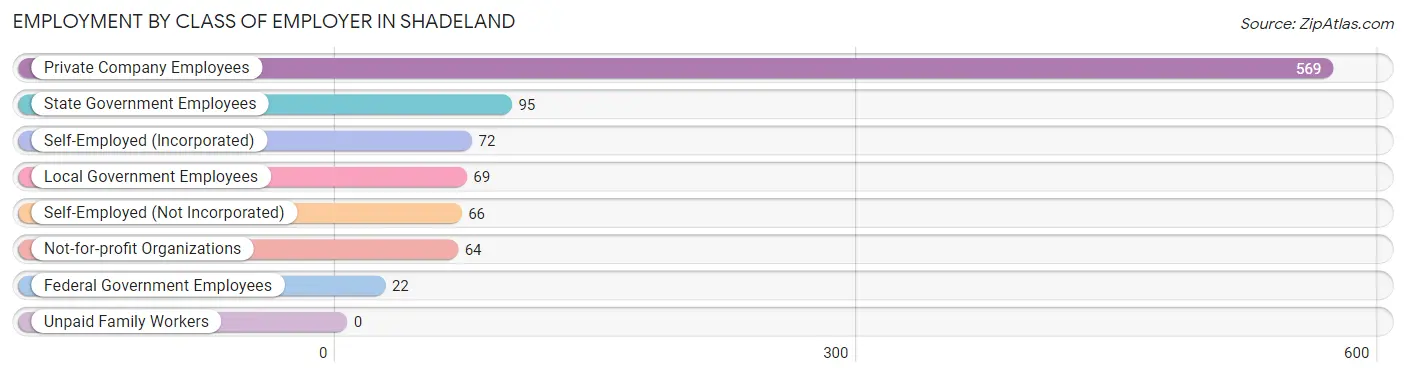
| Employer Class | # Employees | % Employees |
| Private Company Employees | 569 | 59.5% |
| Self-Employed (Incorporated) | 72 | 7.5% |
| Self-Employed (Not Incorporated) | 66 | 6.9% |
| Not-for-profit Organizations | 64 | 6.7% |
| Local Government Employees | 69 | 7.2% |
| State Government Employees | 95 | 9.9% |
| Federal Government Employees | 22 | 2.3% |
| Unpaid Family Workers | 0 | 0.0% |
| Total | 957 | 100.0% |
Employment Status by Age in Shadeland
According to the labor force statistics for Shadeland, out of the total population over 16 years of age (1,590), 63.0% or 1,002 individuals are in the labor force, with 2.1% or 21 of them unemployed. The age group with the highest labor force participation rate is 35 to 44 years, with 86.2% or 301 individuals in the labor force. Within the labor force, the 35 to 44 years age range has the highest percentage of unemployed individuals, with 5.3% or 16 of them being unemployed.
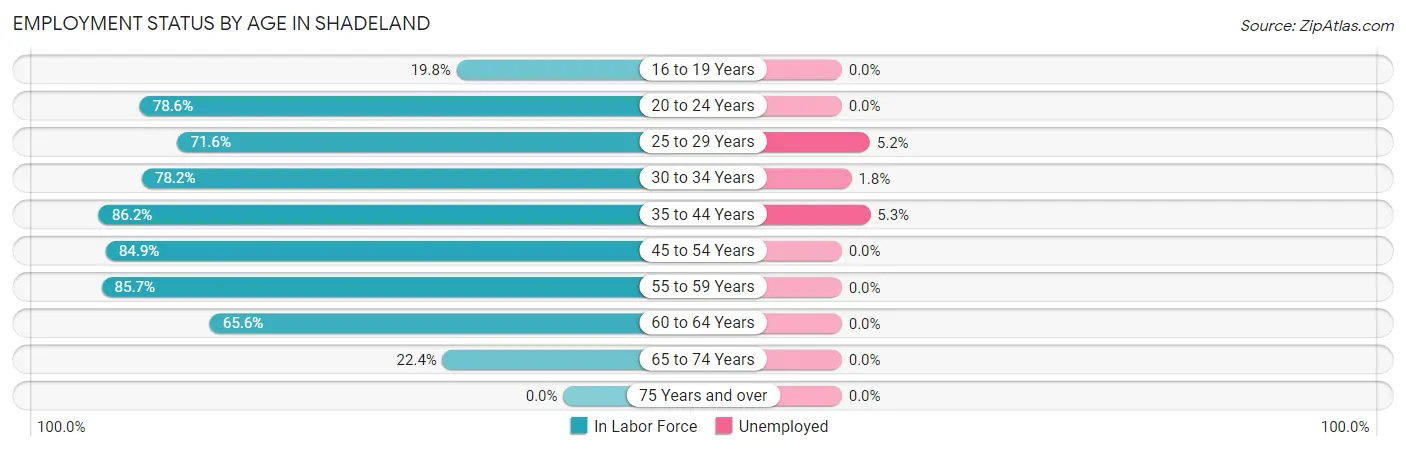
| Age Bracket | In Labor Force | Unemployed |
| 16 to 19 Years | 22 (19.8%) | 0 (0.0%) |
| 20 to 24 Years | 77 (78.6%) | 0 (0.0%) |
| 25 to 29 Years | 58 (71.6%) | 3 (5.2%) |
| 30 to 34 Years | 111 (78.2%) | 2 (1.8%) |
| 35 to 44 Years | 301 (86.2%) | 16 (5.3%) |
| 45 to 54 Years | 174 (84.9%) | 0 (0.0%) |
| 55 to 59 Years | 84 (85.7%) | 0 (0.0%) |
| 60 to 64 Years | 128 (65.6%) | 0 (0.0%) |
| 65 to 74 Years | 47 (22.4%) | 0 (0.0%) |
| 75 Years and over | 0 (0.0%) | 0 (0.0%) |
| Total | 1,002 (63.0%) | 21 (2.1%) |
Employment Status by Educational Attainment in Shadeland
According to labor force statistics for Shadeland, 80.0% of individuals (856) out of the total population between 25 and 64 years of age (1,070) are in the labor force, with 2.5% or 21 of them being unemployed. The group with the highest labor force participation rate are those with the educational attainment of bachelor's degree or higher, with 87.4% or 297 individuals in the labor force. Within the labor force, individuals with college / associate degree education have the highest percentage of unemployment, with 10.5% or 19 of them being unemployed.
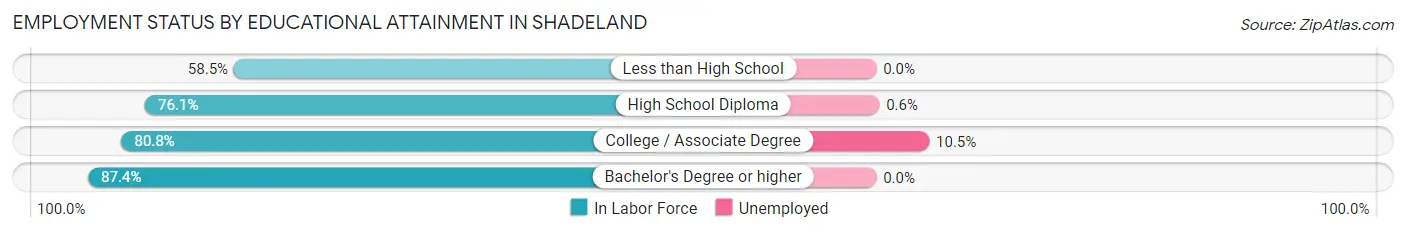
| Educational Attainment | In Labor Force | Unemployed |
| Less than High School | 24 (58.5%) | 0 (0.0%) |
| High School Diploma | 354 (76.1%) | 3 (0.6%) |
| College / Associate Degree | 181 (80.8%) | 24 (10.5%) |
| Bachelor's Degree or higher | 297 (87.4%) | 0 (0.0%) |
| Total | 856 (80.0%) | 27 (2.5%) |
Employment Occupations by Sex in Shadeland
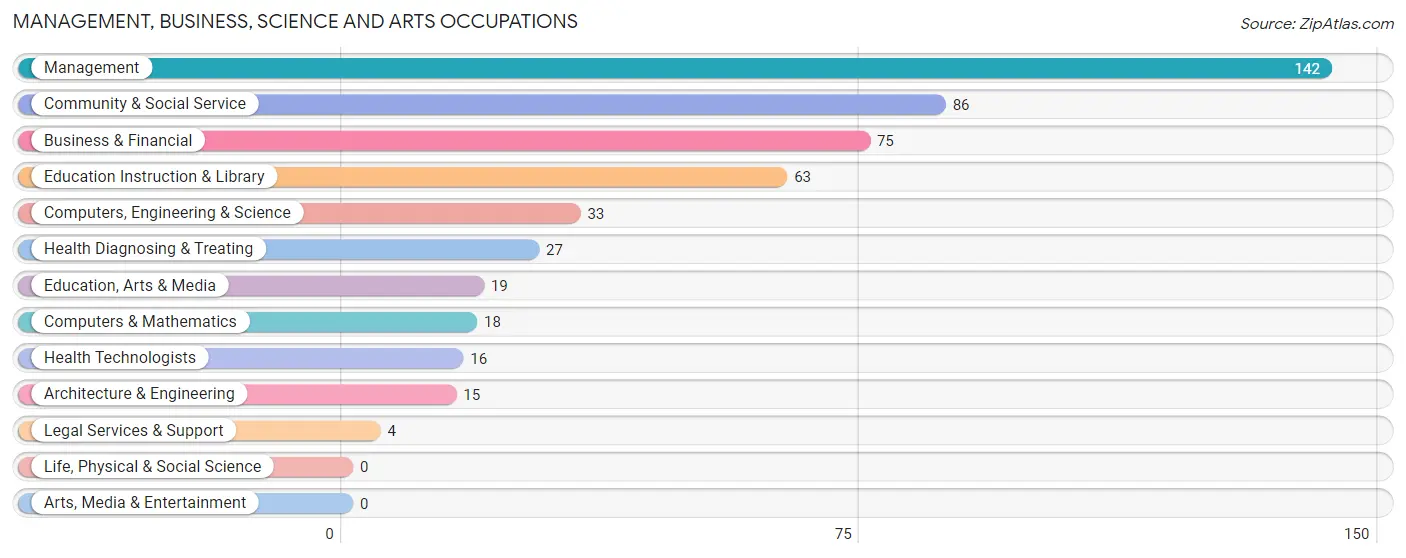
Management, Business, Science and Arts Occupations
The most common Management, Business, Science and Arts occupations in Shadeland are Management (142 | 14.5%), Community & Social Service (86 | 8.8%), Business & Financial (75 | 7.6%), Education Instruction & Library (63 | 6.4%), and Computers, Engineering & Science (33 | 3.4%).
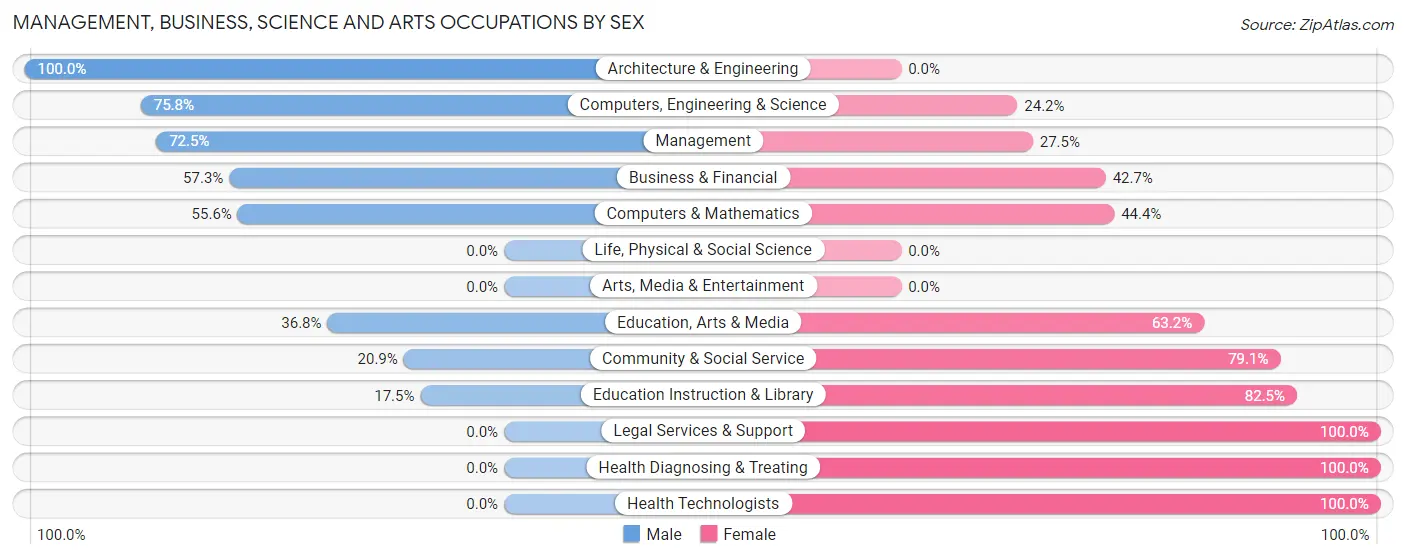
Management, Business, Science and Arts Occupations by Sex
Within the Management, Business, Science and Arts occupations in Shadeland, the most male-oriented occupations are Architecture & Engineering (100.0%), Computers, Engineering & Science (75.8%), and Management (72.5%), while the most female-oriented occupations are Legal Services & Support (100.0%), Health Diagnosing & Treating (100.0%), and Health Technologists (100.0%).
| Occupation | Male | Female |
| Management | 103 (72.5%) | 39 (27.5%) |
| Business & Financial | 43 (57.3%) | 32 (42.7%) |
| Computers, Engineering & Science | 25 (75.8%) | 8 (24.2%) |
| Computers & Mathematics | 10 (55.6%) | 8 (44.4%) |
| Architecture & Engineering | 15 (100.0%) | 0 (0.0%) |
| Life, Physical & Social Science | 0 (0.0%) | 0 (0.0%) |
| Community & Social Service | 18 (20.9%) | 68 (79.1%) |
| Education, Arts & Media | 7 (36.8%) | 12 (63.2%) |
| Legal Services & Support | 0 (0.0%) | 4 (100.0%) |
| Education Instruction & Library | 11 (17.5%) | 52 (82.5%) |
| Arts, Media & Entertainment | 0 (0.0%) | 0 (0.0%) |
| Health Diagnosing & Treating | 0 (0.0%) | 27 (100.0%) |
| Health Technologists | 0 (0.0%) | 16 (100.0%) |
| Total (Category) | 189 (52.1%) | 174 (47.9%) |
| Total (Overall) | 549 (56.0%) | 432 (44.0%) |
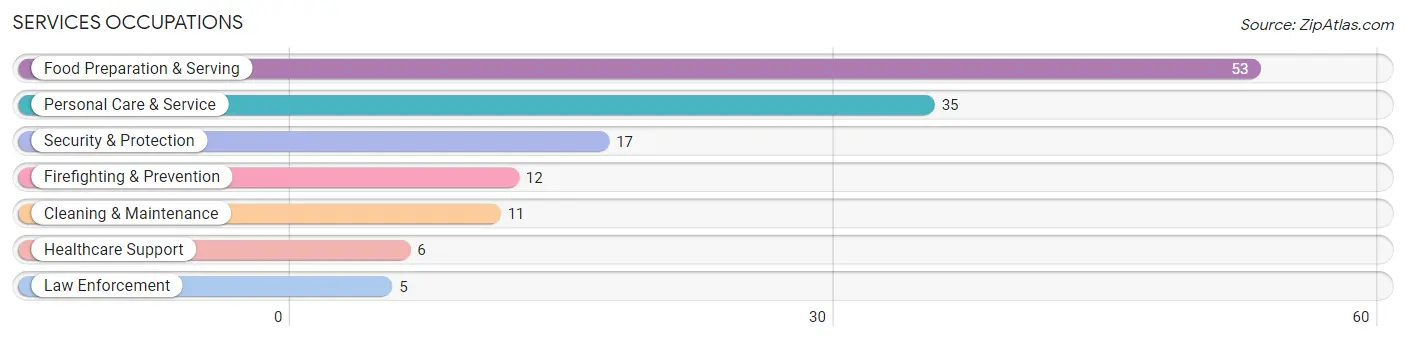
Services Occupations
The most common Services occupations in Shadeland are Food Preparation & Serving (53 | 5.4%), Personal Care & Service (35 | 3.6%), Security & Protection (17 | 1.7%), Firefighting & Prevention (12 | 1.2%), and Cleaning & Maintenance (11 | 1.1%).
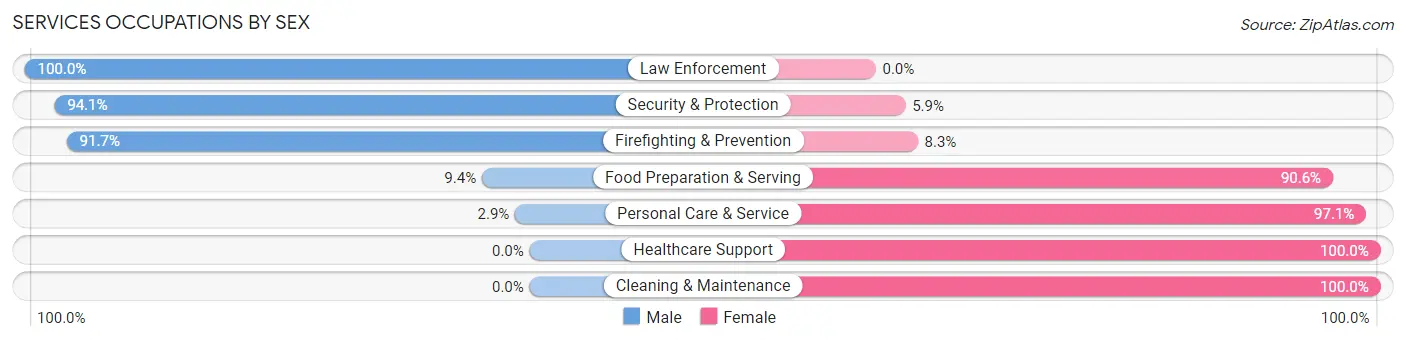
Services Occupations by Sex
Within the Services occupations in Shadeland, the most male-oriented occupations are Law Enforcement (100.0%), Security & Protection (94.1%), and Firefighting & Prevention (91.7%), while the most female-oriented occupations are Healthcare Support (100.0%), Cleaning & Maintenance (100.0%), and Personal Care & Service (97.1%).
| Occupation | Male | Female |
| Healthcare Support | 0 (0.0%) | 6 (100.0%) |
| Security & Protection | 16 (94.1%) | 1 (5.9%) |
| Firefighting & Prevention | 11 (91.7%) | 1 (8.3%) |
| Law Enforcement | 5 (100.0%) | 0 (0.0%) |
| Food Preparation & Serving | 5 (9.4%) | 48 (90.6%) |
| Cleaning & Maintenance | 0 (0.0%) | 11 (100.0%) |
| Personal Care & Service | 1 (2.9%) | 34 (97.1%) |
| Total (Category) | 22 (18.0%) | 100 (82.0%) |
| Total (Overall) | 549 (56.0%) | 432 (44.0%) |
Sales and Office Occupations
The most common Sales and Office occupations in Shadeland are Office & Administration (102 | 10.4%), and Sales & Related (70 | 7.1%).
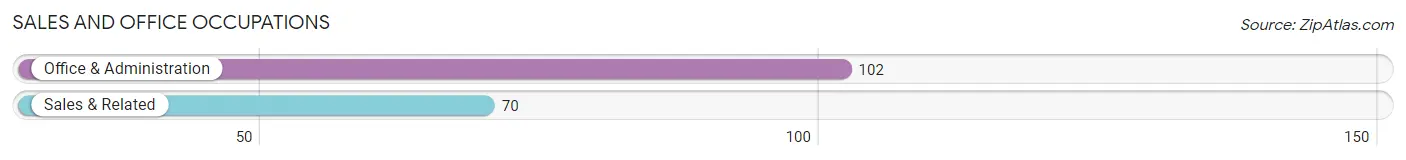
Sales and Office Occupations by Sex
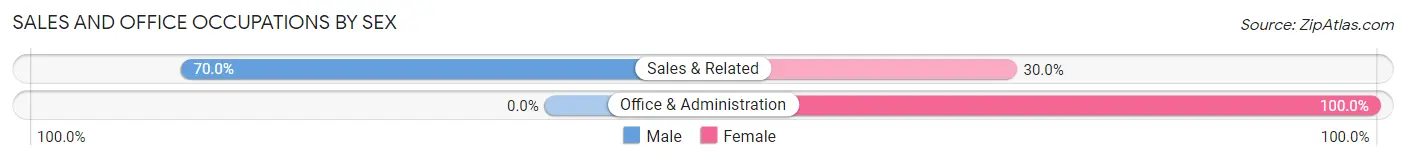
| Occupation | Male | Female |
| Sales & Related | 49 (70.0%) | 21 (30.0%) |
| Office & Administration | 0 (0.0%) | 102 (100.0%) |
| Total (Category) | 49 (28.5%) | 123 (71.5%) |
| Total (Overall) | 549 (56.0%) | 432 (44.0%) |
Natural Resources, Construction and Maintenance Occupations
The most common Natural Resources, Construction and Maintenance occupations in Shadeland are Construction & Extraction (50 | 5.1%), Installation, Maintenance & Repair (32 | 3.3%), and Farming, Fishing & Forestry (2 | 0.2%).
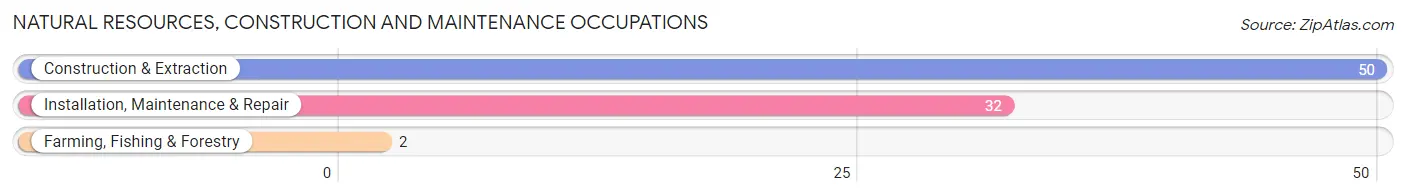
Natural Resources, Construction and Maintenance Occupations by Sex
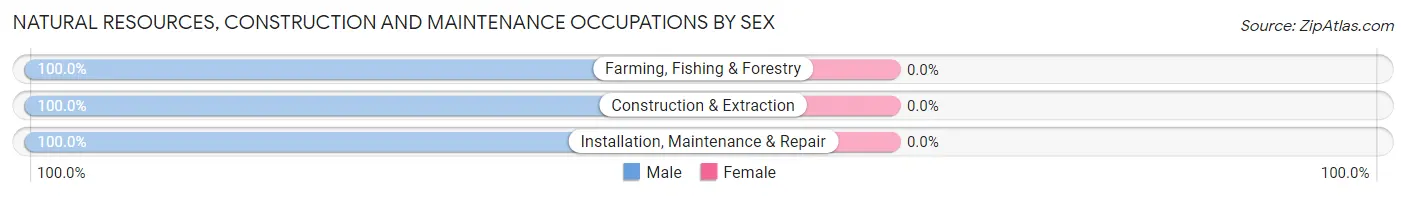
| Occupation | Male | Female |
| Farming, Fishing & Forestry | 2 (100.0%) | 0 (0.0%) |
| Construction & Extraction | 50 (100.0%) | 0 (0.0%) |
| Installation, Maintenance & Repair | 32 (100.0%) | 0 (0.0%) |
| Total (Category) | 84 (100.0%) | 0 (0.0%) |
| Total (Overall) | 549 (56.0%) | 432 (44.0%) |
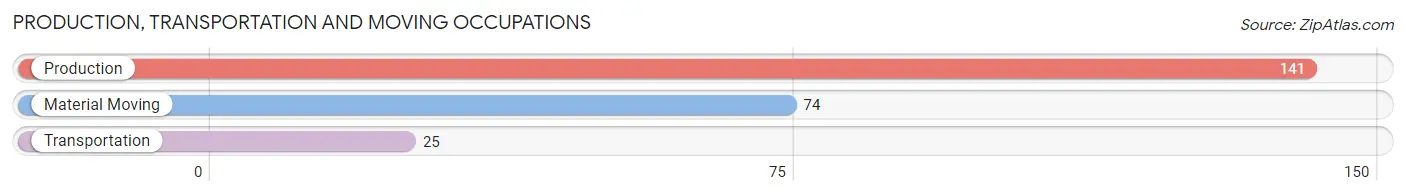
Production, Transportation and Moving Occupations
The most common Production, Transportation and Moving occupations in Shadeland are Production (141 | 14.4%), Material Moving (74 | 7.5%), and Transportation (25 | 2.5%).
Production, Transportation and Moving Occupations by Sex
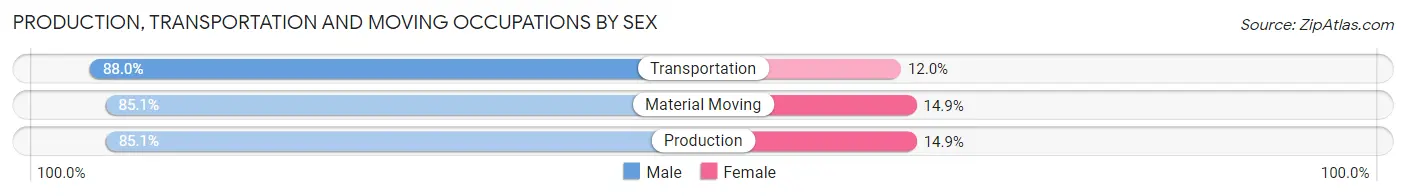
| Occupation | Male | Female |
| Production | 120 (85.1%) | 21 (14.9%) |
| Transportation | 22 (88.0%) | 3 (12.0%) |
| Material Moving | 63 (85.1%) | 11 (14.9%) |
| Total (Category) | 205 (85.4%) | 35 (14.6%) |
| Total (Overall) | 549 (56.0%) | 432 (44.0%) |
Employment Industries by Sex in Shadeland
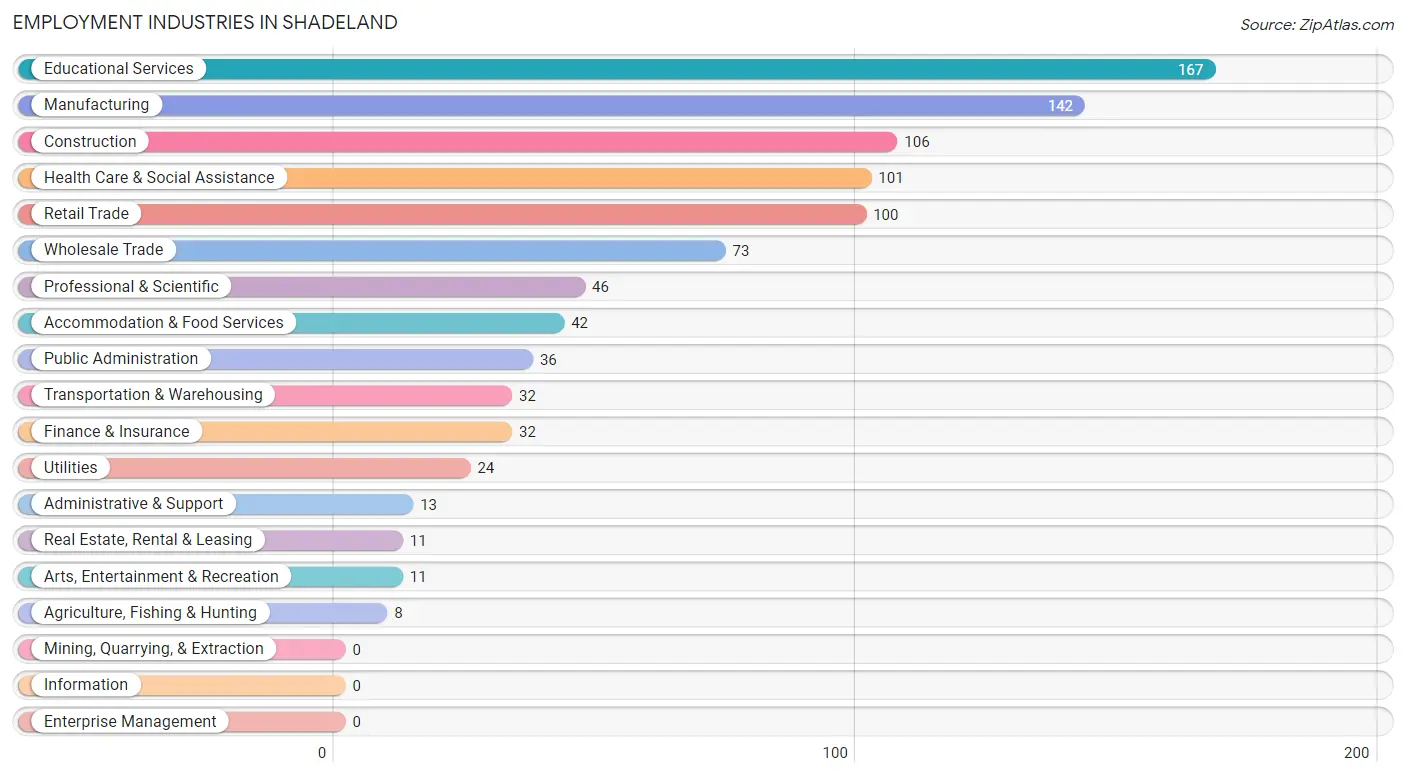
Employment Industries in Shadeland
The major employment industries in Shadeland include Educational Services (167 | 17.0%), Manufacturing (142 | 14.5%), Construction (106 | 10.8%), Health Care & Social Assistance (101 | 10.3%), and Retail Trade (100 | 10.2%).
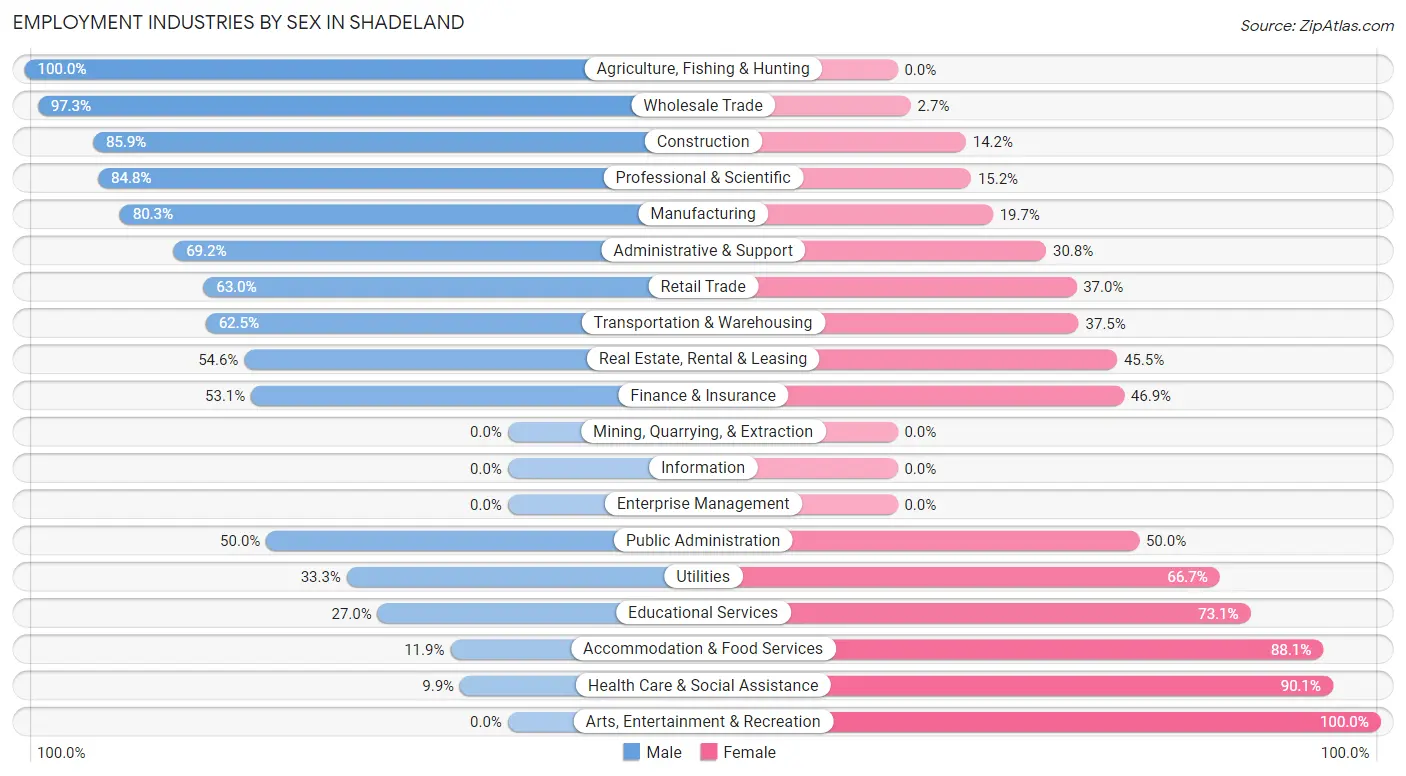
Employment Industries by Sex in Shadeland
The Shadeland industries that see more men than women are Agriculture, Fishing & Hunting (100.0%), Wholesale Trade (97.3%), and Construction (85.9%), whereas the industries that tend to have a higher number of women are Arts, Entertainment & Recreation (100.0%), Health Care & Social Assistance (90.1%), and Accommodation & Food Services (88.1%).
| Industry | Male | Female |
| Agriculture, Fishing & Hunting | 8 (100.0%) | 0 (0.0%) |
| Mining, Quarrying, & Extraction | 0 (0.0%) | 0 (0.0%) |
| Construction | 91 (85.9%) | 15 (14.1%) |
| Manufacturing | 114 (80.3%) | 28 (19.7%) |
| Wholesale Trade | 71 (97.3%) | 2 (2.7%) |
| Retail Trade | 63 (63.0%) | 37 (37.0%) |
| Transportation & Warehousing | 20 (62.5%) | 12 (37.5%) |
| Utilities | 8 (33.3%) | 16 (66.7%) |
| Information | 0 (0.0%) | 0 (0.0%) |
| Finance & Insurance | 17 (53.1%) | 15 (46.9%) |
| Real Estate, Rental & Leasing | 6 (54.5%) | 5 (45.5%) |
| Professional & Scientific | 39 (84.8%) | 7 (15.2%) |
| Enterprise Management | 0 (0.0%) | 0 (0.0%) |
| Administrative & Support | 9 (69.2%) | 4 (30.8%) |
| Educational Services | 45 (27.0%) | 122 (73.1%) |
| Health Care & Social Assistance | 10 (9.9%) | 91 (90.1%) |
| Arts, Entertainment & Recreation | 0 (0.0%) | 11 (100.0%) |
| Accommodation & Food Services | 5 (11.9%) | 37 (88.1%) |
| Public Administration | 18 (50.0%) | 18 (50.0%) |
| Total | 549 (56.0%) | 432 (44.0%) |
Education in Shadeland
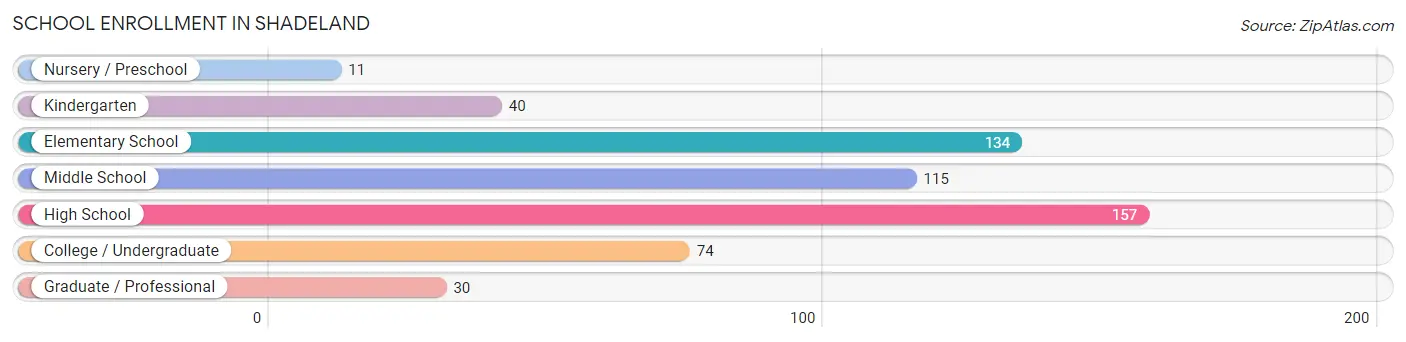
School Enrollment in Shadeland
The most common levels of schooling among the 561 students in Shadeland are high school (157 | 28.0%), elementary school (134 | 23.9%), and middle school (115 | 20.5%).
| School Level | # Students | % Students |
| Nursery / Preschool | 11 | 2.0% |
| Kindergarten | 40 | 7.1% |
| Elementary School | 134 | 23.9% |
| Middle School | 115 | 20.5% |
| High School | 157 | 28.0% |
| College / Undergraduate | 74 | 13.2% |
| Graduate / Professional | 30 | 5.3% |
| Total | 561 | 100.0% |
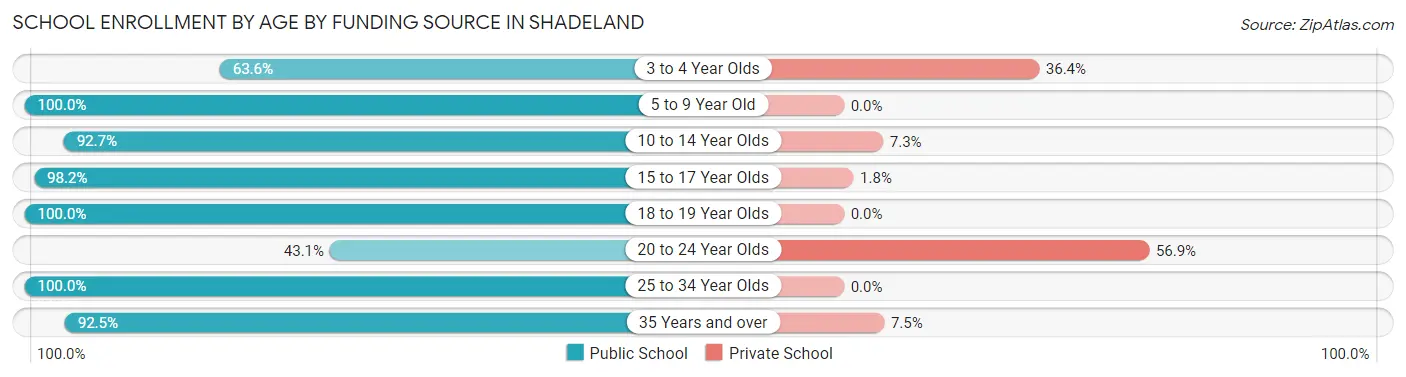
School Enrollment by Age by Funding Source in Shadeland
Out of a total of 561 students who are enrolled in schools in Shadeland, 48 (8.6%) attend a private institution, while the remaining 513 (91.4%) are enrolled in public schools. The age group of 20 to 24 year olds has the highest likelihood of being enrolled in private schools, with 29 (56.9% in the age bracket) enrolled. Conversely, the age group of 5 to 9 year old has the lowest likelihood of being enrolled in a private school, with 169 (100.0% in the age bracket) attending a public institution.
| Age Bracket | Public School | Private School |
| 3 to 4 Year Olds | 7 (63.6%) | 4 (36.4%) |
| 5 to 9 Year Old | 169 (100.0%) | 0 (0.0%) |
| 10 to 14 Year Olds | 127 (92.7%) | 10 (7.3%) |
| 15 to 17 Year Olds | 111 (98.2%) | 2 (1.8%) |
| 18 to 19 Year Olds | 33 (100.0%) | 0 (0.0%) |
| 20 to 24 Year Olds | 22 (43.1%) | 29 (56.9%) |
| 25 to 34 Year Olds | 7 (100.0%) | 0 (0.0%) |
| 35 Years and over | 37 (92.5%) | 3 (7.5%) |
| Total | 513 (91.4%) | 48 (8.6%) |
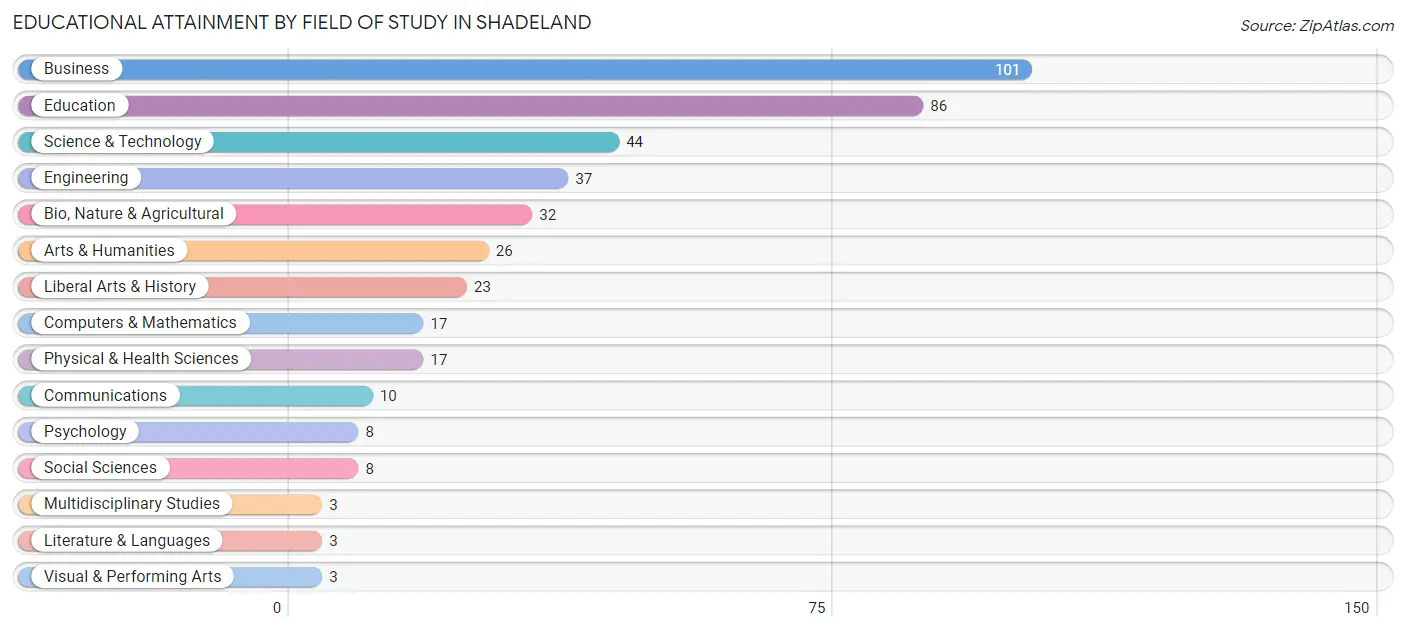
Educational Attainment by Field of Study in Shadeland
Business (101 | 24.2%), education (86 | 20.6%), science & technology (44 | 10.5%), engineering (37 | 8.8%), and bio, nature & agricultural (32 | 7.7%) are the most common fields of study among 418 individuals in Shadeland who have obtained a bachelor's degree or higher.
| Field of Study | # Graduates | % Graduates |
| Computers & Mathematics | 17 | 4.1% |
| Bio, Nature & Agricultural | 32 | 7.7% |
| Physical & Health Sciences | 17 | 4.1% |
| Psychology | 8 | 1.9% |
| Social Sciences | 8 | 1.9% |
| Engineering | 37 | 8.8% |
| Multidisciplinary Studies | 3 | 0.7% |
| Science & Technology | 44 | 10.5% |
| Business | 101 | 24.2% |
| Education | 86 | 20.6% |
| Literature & Languages | 3 | 0.7% |
| Liberal Arts & History | 23 | 5.5% |
| Visual & Performing Arts | 3 | 0.7% |
| Communications | 10 | 2.4% |
| Arts & Humanities | 26 | 6.2% |
| Total | 418 | 100.0% |
Transportation & Commute in Shadeland
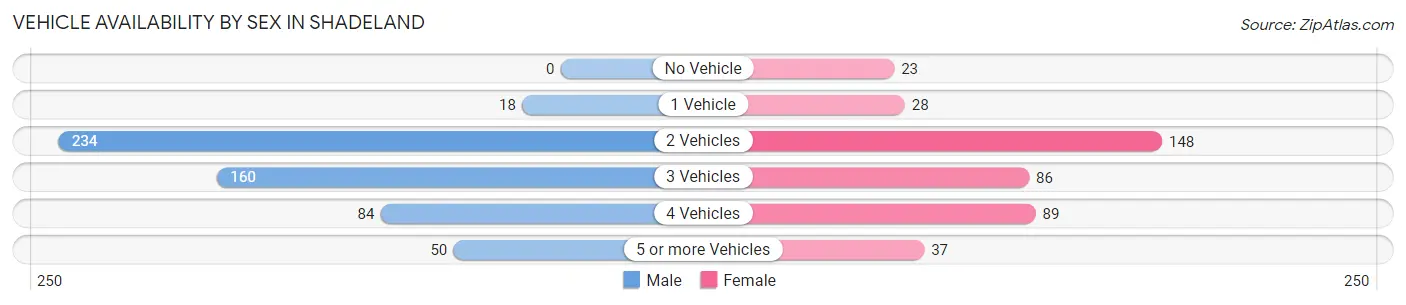
Vehicle Availability by Sex in Shadeland
The most prevalent vehicle ownership categories in Shadeland are males with 2 vehicles (234, accounting for 42.9%) and females with 2 vehicles (148, making up 56.9%).
| Vehicles Available | Male | Female |
| No Vehicle | 0 (0.0%) | 23 (5.6%) |
| 1 Vehicle | 18 (3.3%) | 28 (6.8%) |
| 2 Vehicles | 234 (42.9%) | 148 (36.0%) |
| 3 Vehicles | 160 (29.3%) | 86 (20.9%) |
| 4 Vehicles | 84 (15.4%) | 89 (21.6%) |
| 5 or more Vehicles | 50 (9.2%) | 37 (9.0%) |
| Total | 546 (100.0%) | 411 (100.0%) |
Commute Time in Shadeland
The most frequently occuring commute durations in Shadeland are 15 to 19 minutes (273 commuters, 33.8%), 10 to 14 minutes (156 commuters, 19.3%), and 20 to 24 minutes (155 commuters, 19.2%).
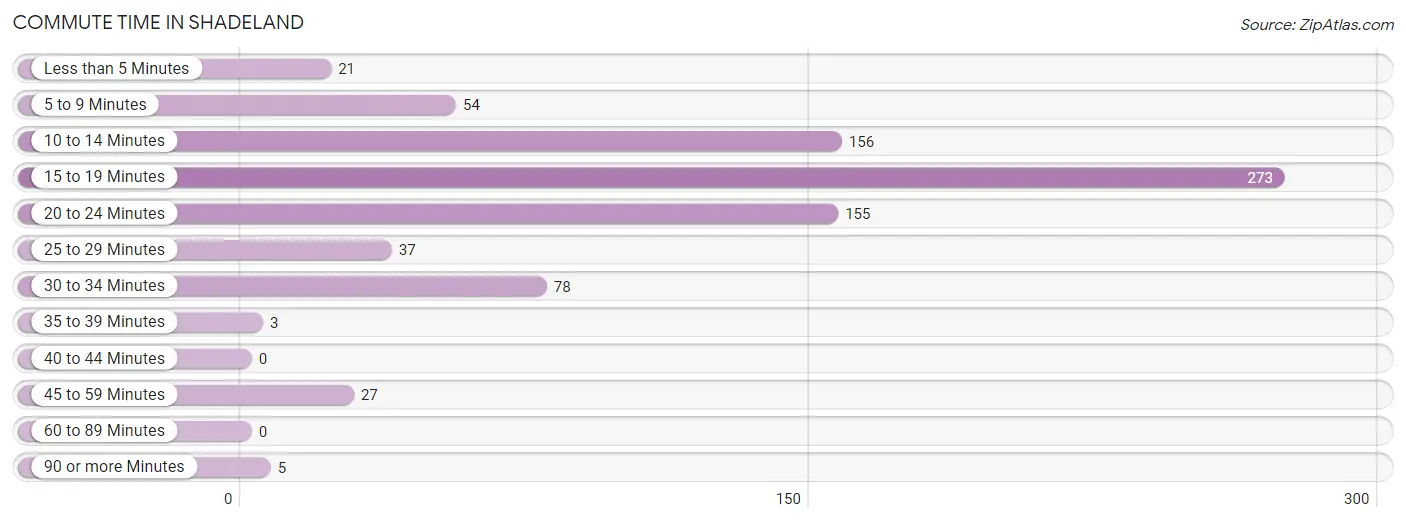
| Commute Time | # Commuters | % Commuters |
| Less than 5 Minutes | 21 | 2.6% |
| 5 to 9 Minutes | 54 | 6.7% |
| 10 to 14 Minutes | 156 | 19.3% |
| 15 to 19 Minutes | 273 | 33.8% |
| 20 to 24 Minutes | 155 | 19.2% |
| 25 to 29 Minutes | 37 | 4.6% |
| 30 to 34 Minutes | 78 | 9.6% |
| 35 to 39 Minutes | 3 | 0.4% |
| 40 to 44 Minutes | 0 | 0.0% |
| 45 to 59 Minutes | 27 | 3.3% |
| 60 to 89 Minutes | 0 | 0.0% |
| 90 or more Minutes | 5 | 0.6% |
Commute Time by Sex in Shadeland
The most common commute times in Shadeland are 15 to 19 minutes (153 commuters, 32.0%) for males and 15 to 19 minutes (120 commuters, 36.2%) for females.
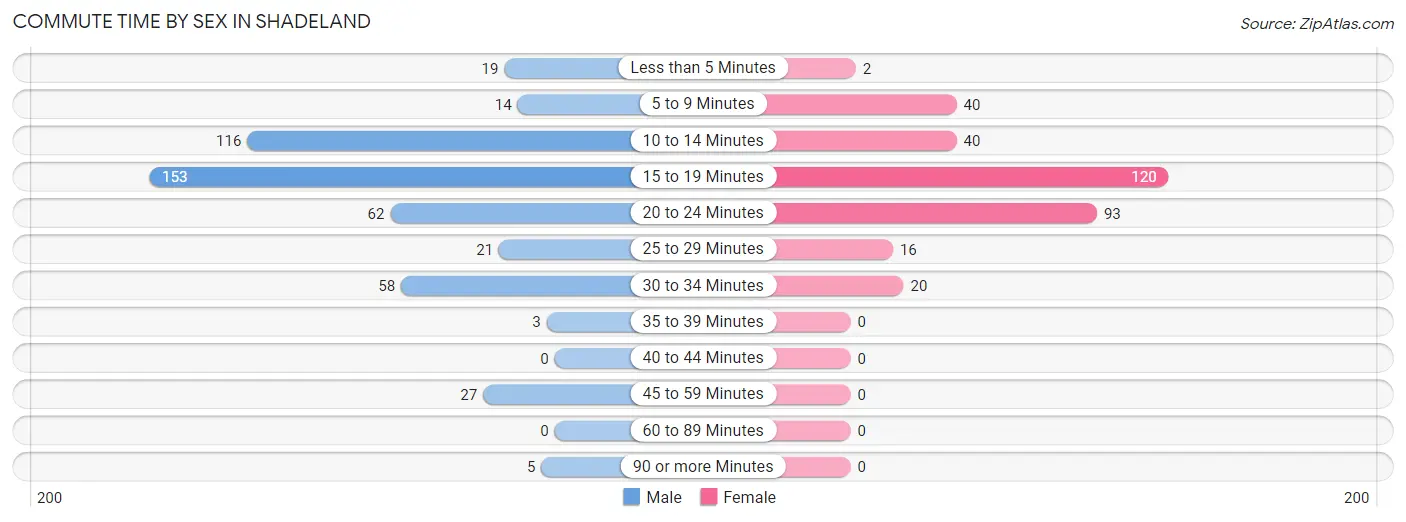
| Commute Time | Male | Female |
| Less than 5 Minutes | 19 (4.0%) | 2 (0.6%) |
| 5 to 9 Minutes | 14 (2.9%) | 40 (12.1%) |
| 10 to 14 Minutes | 116 (24.3%) | 40 (12.1%) |
| 15 to 19 Minutes | 153 (32.0%) | 120 (36.2%) |
| 20 to 24 Minutes | 62 (13.0%) | 93 (28.1%) |
| 25 to 29 Minutes | 21 (4.4%) | 16 (4.8%) |
| 30 to 34 Minutes | 58 (12.1%) | 20 (6.0%) |
| 35 to 39 Minutes | 3 (0.6%) | 0 (0.0%) |
| 40 to 44 Minutes | 0 (0.0%) | 0 (0.0%) |
| 45 to 59 Minutes | 27 (5.7%) | 0 (0.0%) |
| 60 to 89 Minutes | 0 (0.0%) | 0 (0.0%) |
| 90 or more Minutes | 5 (1.1%) | 0 (0.0%) |
Time of Departure to Work by Sex in Shadeland
The most frequent times of departure to work in Shadeland are 6:00 AM to 6:29 AM (106, 22.2%) for males and 8:00 AM to 8:29 AM (61, 18.4%) for females.
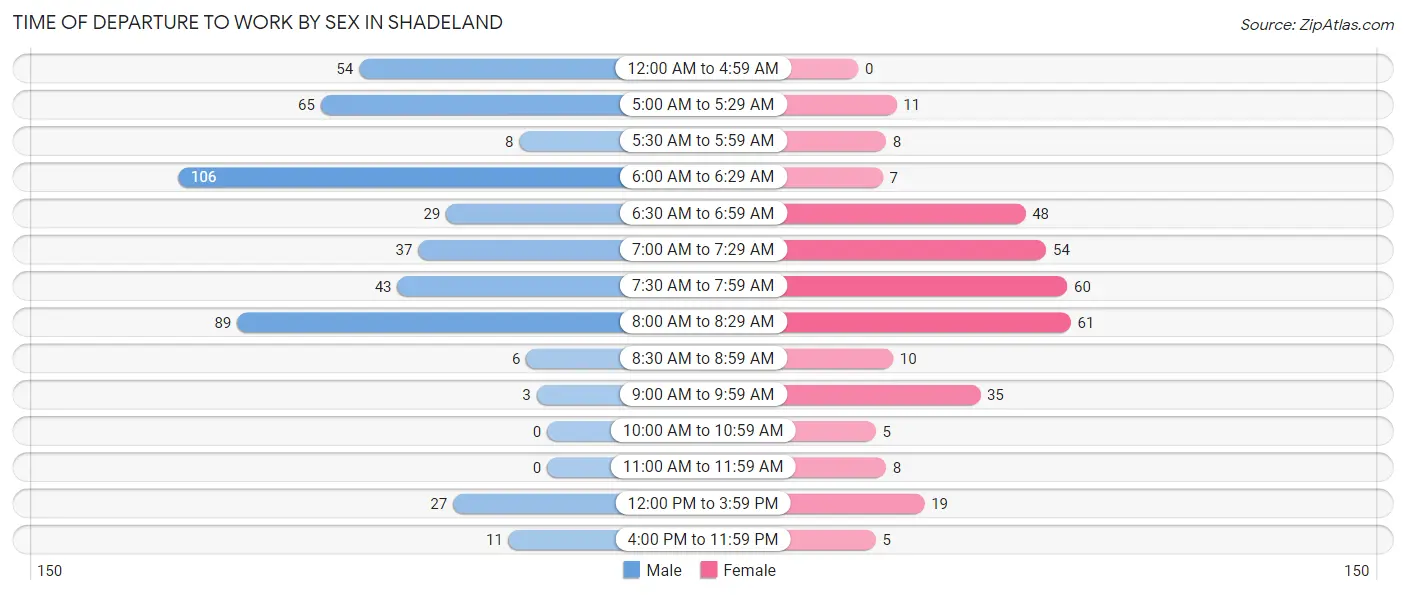
| Time of Departure | Male | Female |
| 12:00 AM to 4:59 AM | 54 (11.3%) | 0 (0.0%) |
| 5:00 AM to 5:29 AM | 65 (13.6%) | 11 (3.3%) |
| 5:30 AM to 5:59 AM | 8 (1.7%) | 8 (2.4%) |
| 6:00 AM to 6:29 AM | 106 (22.2%) | 7 (2.1%) |
| 6:30 AM to 6:59 AM | 29 (6.1%) | 48 (14.5%) |
| 7:00 AM to 7:29 AM | 37 (7.7%) | 54 (16.3%) |
| 7:30 AM to 7:59 AM | 43 (9.0%) | 60 (18.1%) |
| 8:00 AM to 8:29 AM | 89 (18.6%) | 61 (18.4%) |
| 8:30 AM to 8:59 AM | 6 (1.3%) | 10 (3.0%) |
| 9:00 AM to 9:59 AM | 3 (0.6%) | 35 (10.6%) |
| 10:00 AM to 10:59 AM | 0 (0.0%) | 5 (1.5%) |
| 11:00 AM to 11:59 AM | 0 (0.0%) | 8 (2.4%) |
| 12:00 PM to 3:59 PM | 27 (5.7%) | 19 (5.7%) |
| 4:00 PM to 11:59 PM | 11 (2.3%) | 5 (1.5%) |
| Total | 478 (100.0%) | 331 (100.0%) |
Housing Occupancy in Shadeland
Occupancy by Ownership in Shadeland
Of the total 732 dwellings in Shadeland, owner-occupied units account for 567 (77.5%), while renter-occupied units make up 165 (22.5%).
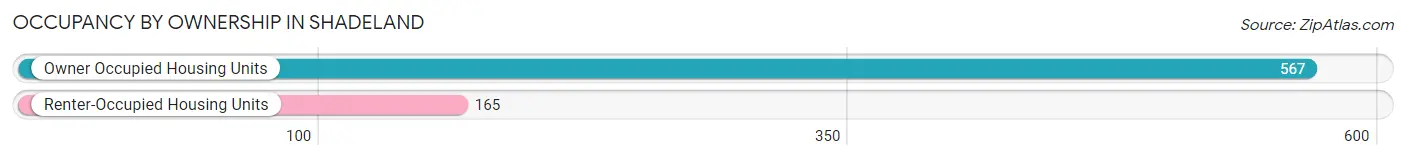
| Occupancy | # Housing Units | % Housing Units |
| Owner Occupied Housing Units | 567 | 77.5% |
| Renter-Occupied Housing Units | 165 | 22.5% |
| Total Occupied Housing Units | 732 | 100.0% |
Occupancy by Household Size in Shadeland
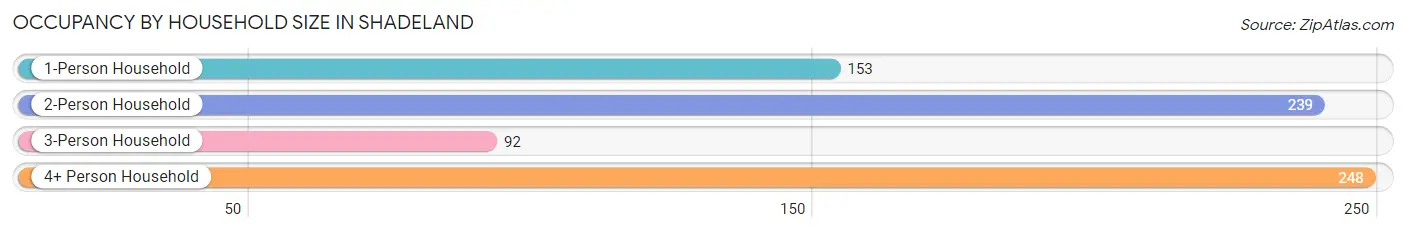
| Household Size | # Housing Units | % Housing Units |
| 1-Person Household | 153 | 20.9% |
| 2-Person Household | 239 | 32.7% |
| 3-Person Household | 92 | 12.6% |
| 4+ Person Household | 248 | 33.9% |
| Total Housing Units | 732 | 100.0% |
Occupancy by Ownership by Household Size in Shadeland
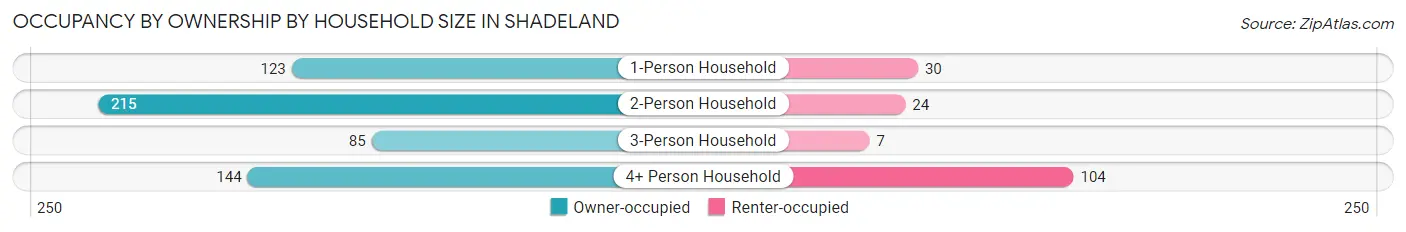
| Household Size | Owner-occupied | Renter-occupied |
| 1-Person Household | 123 (80.4%) | 30 (19.6%) |
| 2-Person Household | 215 (90.0%) | 24 (10.0%) |
| 3-Person Household | 85 (92.4%) | 7 (7.6%) |
| 4+ Person Household | 144 (58.1%) | 104 (41.9%) |
| Total Housing Units | 567 (77.5%) | 165 (22.5%) |
Occupancy by Educational Attainment in Shadeland
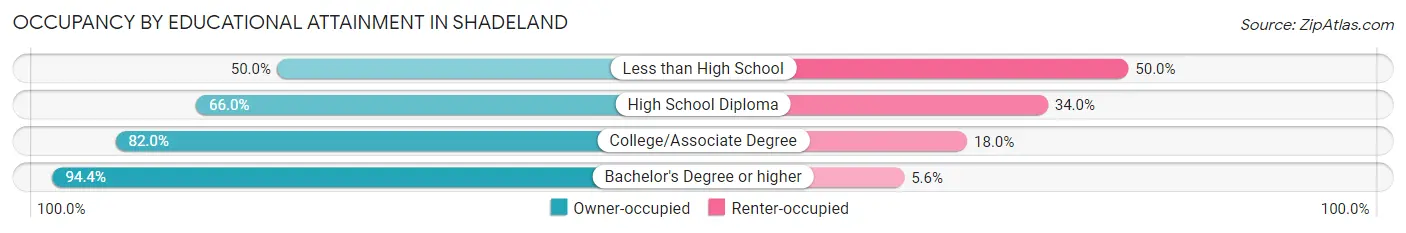
| Household Size | Owner-occupied | Renter-occupied |
| Less than High School | 5 (50.0%) | 5 (50.0%) |
| High School Diploma | 225 (66.0%) | 116 (34.0%) |
| College/Associate Degree | 150 (82.0%) | 33 (18.0%) |
| Bachelor's Degree or higher | 187 (94.4%) | 11 (5.6%) |
Occupancy by Age of Householder in Shadeland
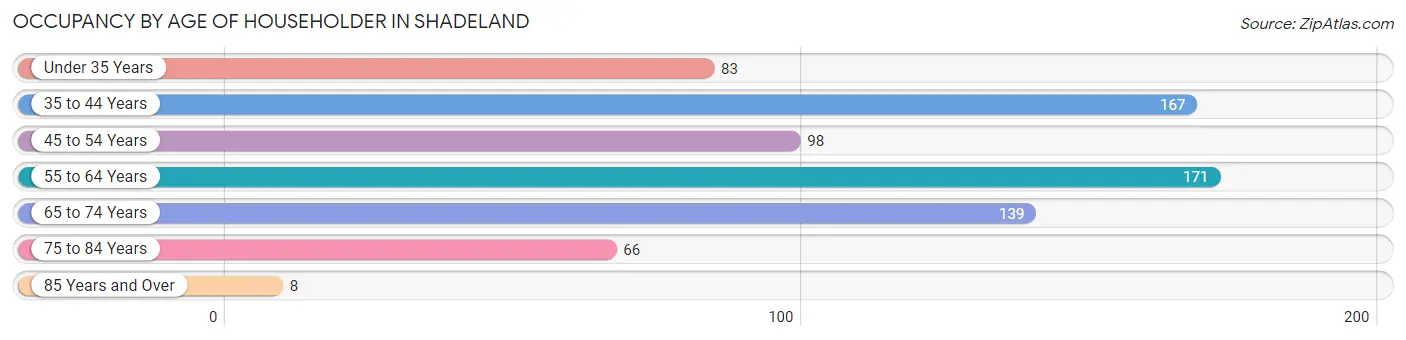
| Age Bracket | # Households | % Households |
| Under 35 Years | 83 | 11.3% |
| 35 to 44 Years | 167 | 22.8% |
| 45 to 54 Years | 98 | 13.4% |
| 55 to 64 Years | 171 | 23.4% |
| 65 to 74 Years | 139 | 19.0% |
| 75 to 84 Years | 66 | 9.0% |
| 85 Years and Over | 8 | 1.1% |
| Total | 732 | 100.0% |
Housing Finances in Shadeland
Median Income by Occupancy in Shadeland
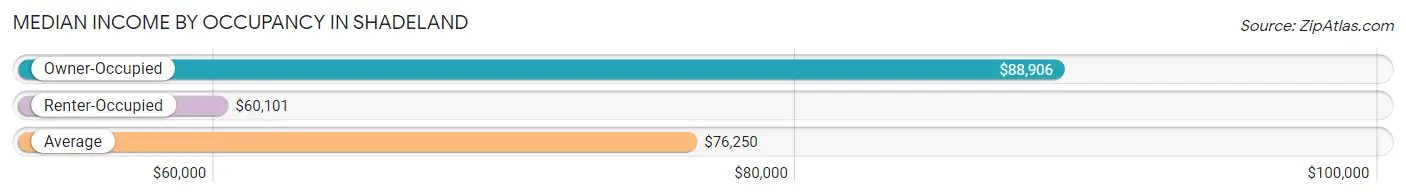
| Occupancy Type | # Households | Median Income |
| Owner-Occupied | 567 (77.5%) | $88,906 |
| Renter-Occupied | 165 (22.5%) | $60,101 |
| Average | 732 (100.0%) | $76,250 |
Occupancy by Householder Income Bracket in Shadeland
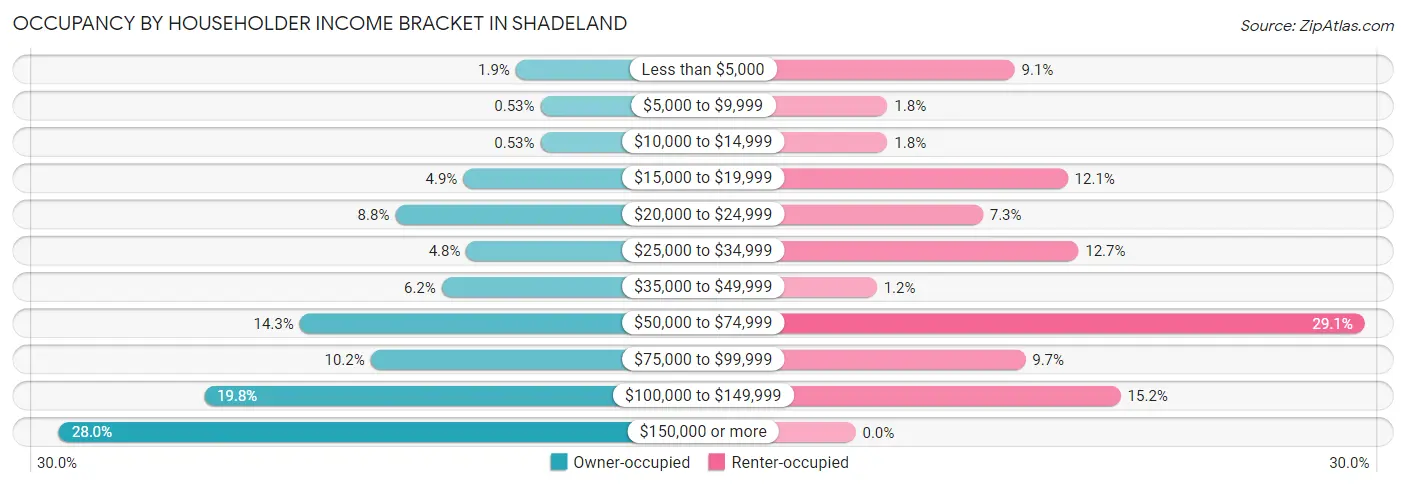
| Income Bracket | Owner-occupied | Renter-occupied |
| Less than $5,000 | 11 (1.9%) | 15 (9.1%) |
| $5,000 to $9,999 | 3 (0.5%) | 3 (1.8%) |
| $10,000 to $14,999 | 3 (0.5%) | 3 (1.8%) |
| $15,000 to $19,999 | 28 (4.9%) | 20 (12.1%) |
| $20,000 to $24,999 | 50 (8.8%) | 12 (7.3%) |
| $25,000 to $34,999 | 27 (4.8%) | 21 (12.7%) |
| $35,000 to $49,999 | 35 (6.2%) | 2 (1.2%) |
| $50,000 to $74,999 | 81 (14.3%) | 48 (29.1%) |
| $75,000 to $99,999 | 58 (10.2%) | 16 (9.7%) |
| $100,000 to $149,999 | 112 (19.8%) | 25 (15.1%) |
| $150,000 or more | 159 (28.0%) | 0 (0.0%) |
| Total | 567 (100.0%) | 165 (100.0%) |
Monthly Housing Cost Tiers in Shadeland
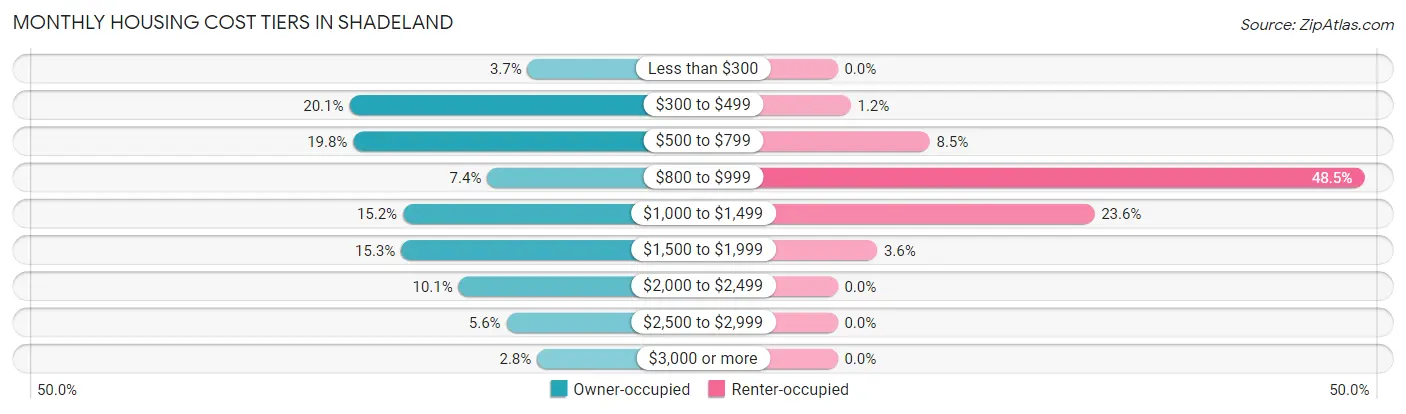
| Monthly Cost | Owner-occupied | Renter-occupied |
| Less than $300 | 21 (3.7%) | 0 (0.0%) |
| $300 to $499 | 114 (20.1%) | 2 (1.2%) |
| $500 to $799 | 112 (19.8%) | 14 (8.5%) |
| $800 to $999 | 42 (7.4%) | 80 (48.5%) |
| $1,000 to $1,499 | 86 (15.2%) | 39 (23.6%) |
| $1,500 to $1,999 | 87 (15.3%) | 6 (3.6%) |
| $2,000 to $2,499 | 57 (10.1%) | 0 (0.0%) |
| $2,500 to $2,999 | 32 (5.6%) | 0 (0.0%) |
| $3,000 or more | 16 (2.8%) | 0 (0.0%) |
| Total | 567 (100.0%) | 165 (100.0%) |
Physical Housing Characteristics in Shadeland
Housing Structures in Shadeland
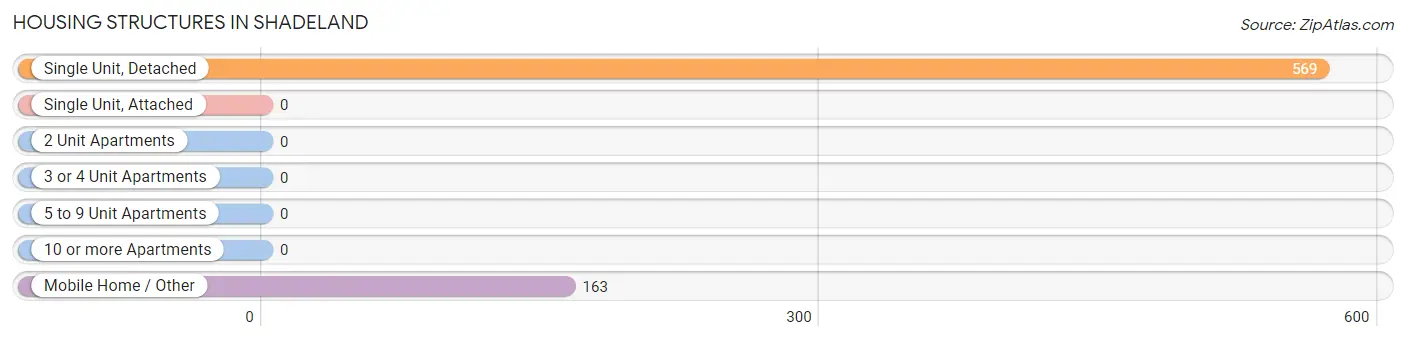
| Structure Type | # Housing Units | % Housing Units |
| Single Unit, Detached | 569 | 77.7% |
| Single Unit, Attached | 0 | 0.0% |
| 2 Unit Apartments | 0 | 0.0% |
| 3 or 4 Unit Apartments | 0 | 0.0% |
| 5 to 9 Unit Apartments | 0 | 0.0% |
| 10 or more Apartments | 0 | 0.0% |
| Mobile Home / Other | 163 | 22.3% |
| Total | 732 | 100.0% |
Housing Structures by Occupancy in Shadeland
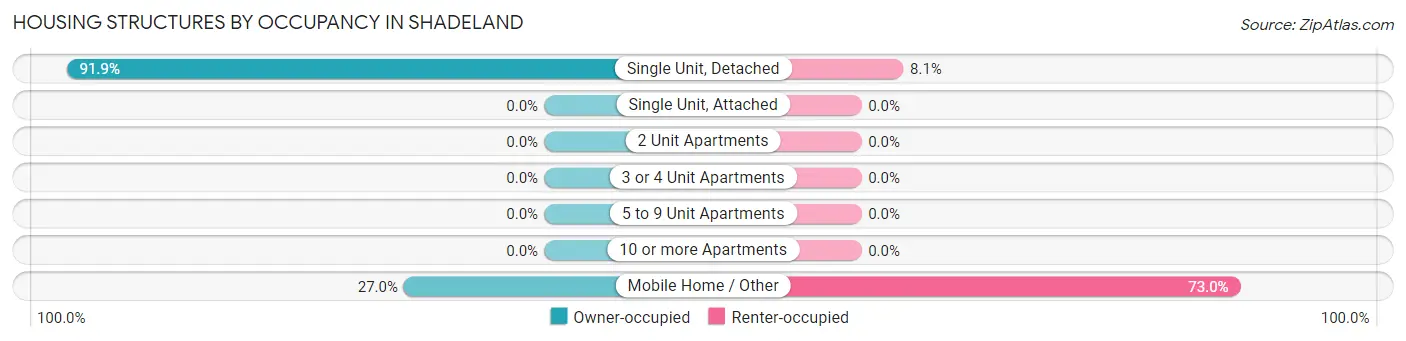
| Structure Type | Owner-occupied | Renter-occupied |
| Single Unit, Detached | 523 (91.9%) | 46 (8.1%) |
| Single Unit, Attached | 0 (0.0%) | 0 (0.0%) |
| 2 Unit Apartments | 0 (0.0%) | 0 (0.0%) |
| 3 or 4 Unit Apartments | 0 (0.0%) | 0 (0.0%) |
| 5 to 9 Unit Apartments | 0 (0.0%) | 0 (0.0%) |
| 10 or more Apartments | 0 (0.0%) | 0 (0.0%) |
| Mobile Home / Other | 44 (27.0%) | 119 (73.0%) |
| Total | 567 (77.5%) | 165 (22.5%) |
Housing Structures by Number of Rooms in Shadeland
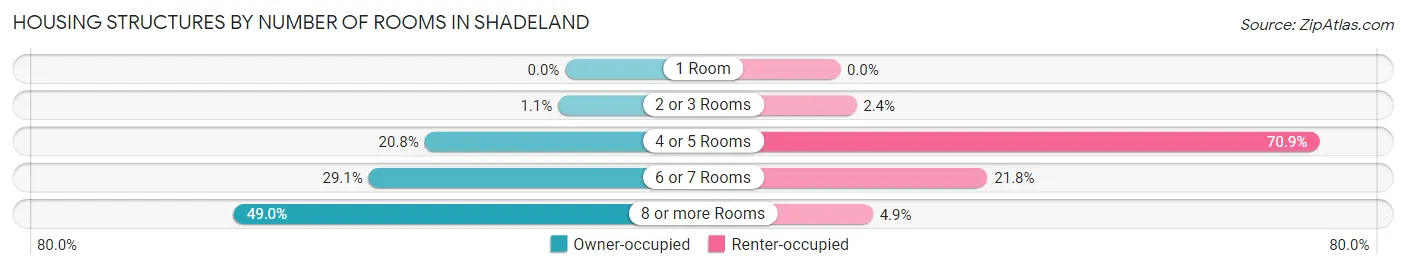
| Number of Rooms | Owner-occupied | Renter-occupied |
| 1 Room | 0 (0.0%) | 0 (0.0%) |
| 2 or 3 Rooms | 6 (1.1%) | 4 (2.4%) |
| 4 or 5 Rooms | 118 (20.8%) | 117 (70.9%) |
| 6 or 7 Rooms | 165 (29.1%) | 36 (21.8%) |
| 8 or more Rooms | 278 (49.0%) | 8 (4.9%) |
| Total | 567 (100.0%) | 165 (100.0%) |
Housing Structure by Heating Type in Shadeland
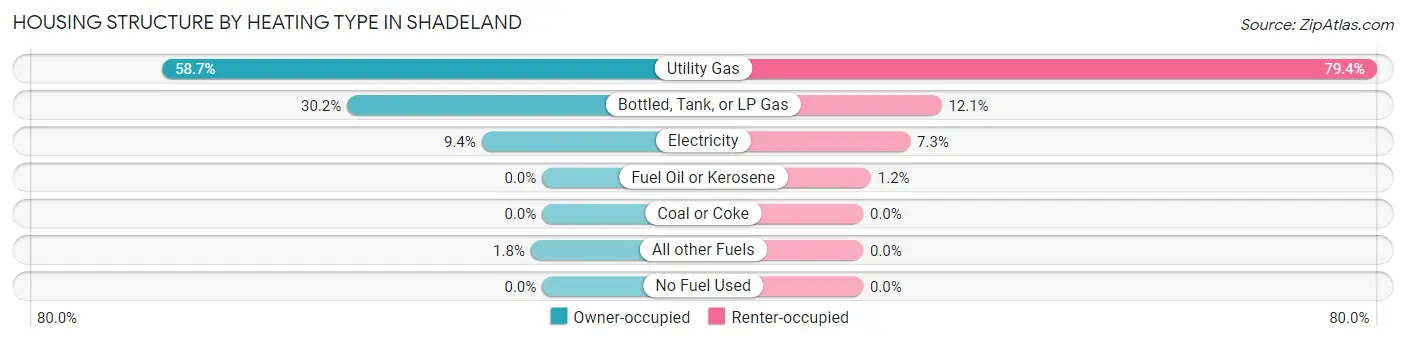
| Heating Type | Owner-occupied | Renter-occupied |
| Utility Gas | 333 (58.7%) | 131 (79.4%) |
| Bottled, Tank, or LP Gas | 171 (30.2%) | 20 (12.1%) |
| Electricity | 53 (9.3%) | 12 (7.3%) |
| Fuel Oil or Kerosene | 0 (0.0%) | 2 (1.2%) |
| Coal or Coke | 0 (0.0%) | 0 (0.0%) |
| All other Fuels | 10 (1.8%) | 0 (0.0%) |
| No Fuel Used | 0 (0.0%) | 0 (0.0%) |
| Total | 567 (100.0%) | 165 (100.0%) |
Household Vehicle Usage in Shadeland
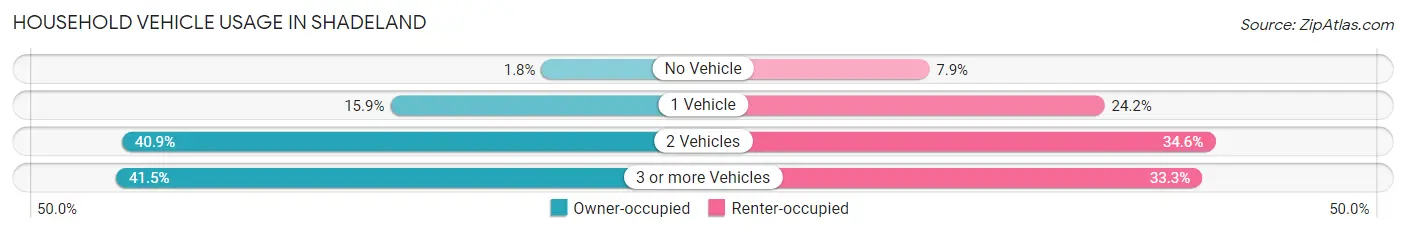
| Vehicles per Household | Owner-occupied | Renter-occupied |
| No Vehicle | 10 (1.8%) | 13 (7.9%) |
| 1 Vehicle | 90 (15.9%) | 40 (24.2%) |
| 2 Vehicles | 232 (40.9%) | 57 (34.5%) |
| 3 or more Vehicles | 235 (41.4%) | 55 (33.3%) |
| Total | 567 (100.0%) | 165 (100.0%) |
Real Estate & Mortgages in Shadeland
Real Estate and Mortgage Overview in Shadeland
| Characteristic | Without Mortgage | With Mortgage |
| Housing Units | 241 | 326 |
| Median Property Value | $168,800 | $298,000 |
| Median Household Income | $66,607 | $110 |
| Monthly Housing Costs | $487 | $16 |
| Real Estate Taxes | $1,058 | $7 |
Property Value by Mortgage Status in Shadeland
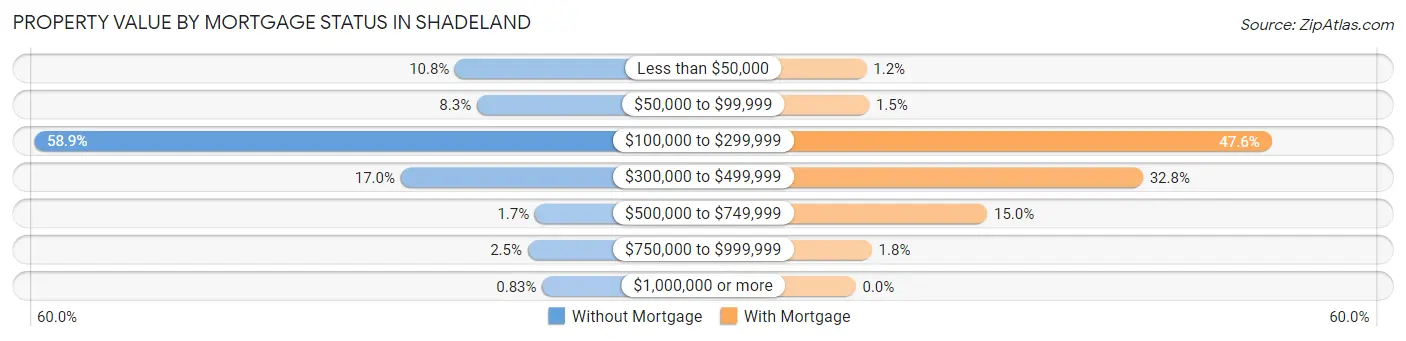
| Property Value | Without Mortgage | With Mortgage |
| Less than $50,000 | 26 (10.8%) | 4 (1.2%) |
| $50,000 to $99,999 | 20 (8.3%) | 5 (1.5%) |
| $100,000 to $299,999 | 142 (58.9%) | 155 (47.5%) |
| $300,000 to $499,999 | 41 (17.0%) | 107 (32.8%) |
| $500,000 to $749,999 | 4 (1.7%) | 49 (15.0%) |
| $750,000 to $999,999 | 6 (2.5%) | 6 (1.8%) |
| $1,000,000 or more | 2 (0.8%) | 0 (0.0%) |
| Total | 241 (100.0%) | 326 (100.0%) |
Household Income by Mortgage Status in Shadeland
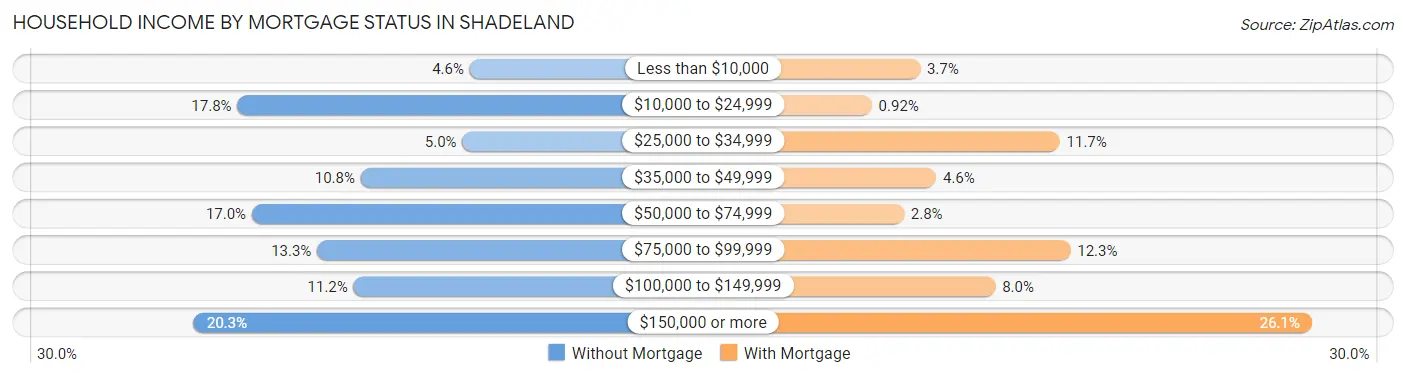
| Household Income | Without Mortgage | With Mortgage |
| Less than $10,000 | 11 (4.6%) | 12 (3.7%) |
| $10,000 to $24,999 | 43 (17.8%) | 3 (0.9%) |
| $25,000 to $34,999 | 12 (5.0%) | 38 (11.7%) |
| $35,000 to $49,999 | 26 (10.8%) | 15 (4.6%) |
| $50,000 to $74,999 | 41 (17.0%) | 9 (2.8%) |
| $75,000 to $99,999 | 32 (13.3%) | 40 (12.3%) |
| $100,000 to $149,999 | 27 (11.2%) | 26 (8.0%) |
| $150,000 or more | 49 (20.3%) | 85 (26.1%) |
| Total | 241 (100.0%) | 326 (100.0%) |
Property Value to Household Income Ratio in Shadeland
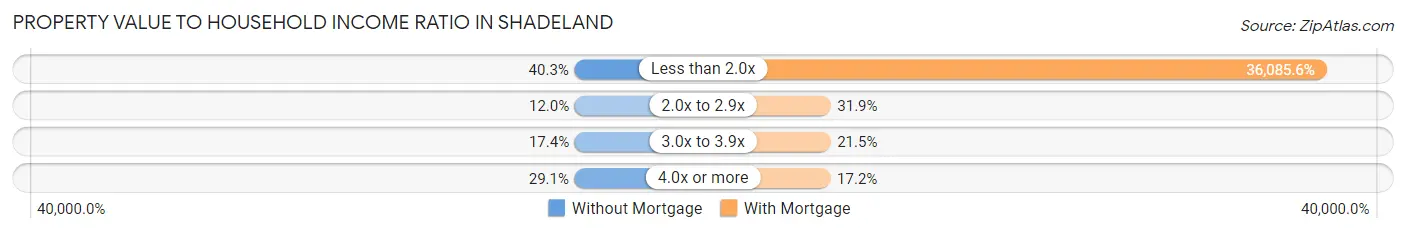
| Value-to-Income Ratio | Without Mortgage | With Mortgage |
| Less than 2.0x | 97 (40.3%) | 117,639 (36,085.6%) |
| 2.0x to 2.9x | 29 (12.0%) | 104 (31.9%) |
| 3.0x to 3.9x | 42 (17.4%) | 70 (21.5%) |
| 4.0x or more | 70 (29.0%) | 56 (17.2%) |
| Total | 241 (100.0%) | 326 (100.0%) |
Real Estate Taxes by Mortgage Status in Shadeland
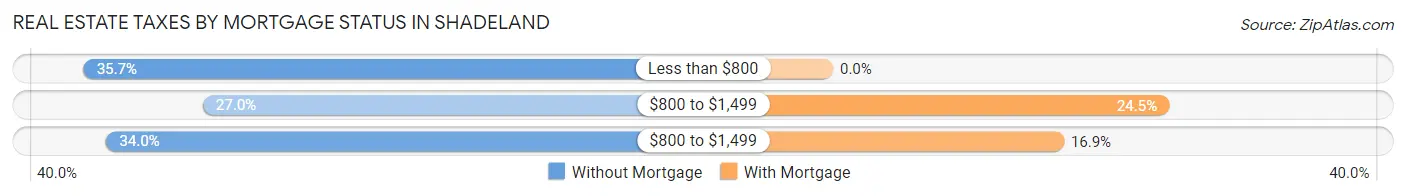
| Property Taxes | Without Mortgage | With Mortgage |
| Less than $800 | 86 (35.7%) | 0 (0.0%) |
| $800 to $1,499 | 65 (27.0%) | 80 (24.5%) |
| $800 to $1,499 | 82 (34.0%) | 55 (16.9%) |
| Total | 241 (100.0%) | 326 (100.0%) |
Health & Disability in Shadeland
Health Insurance Coverage by Age in Shadeland
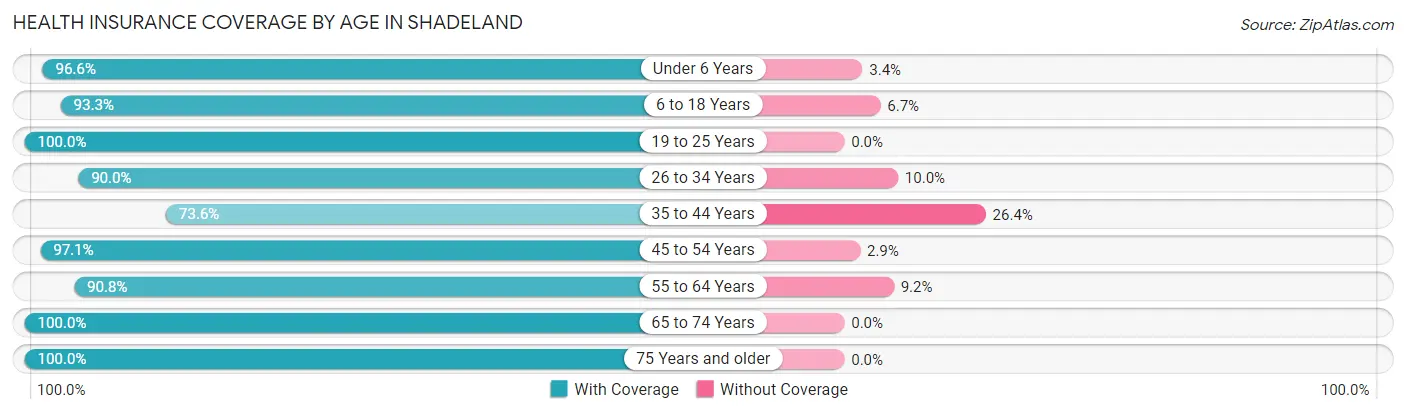
| Age Bracket | With Coverage | Without Coverage |
| Under 6 Years | 115 (96.6%) | 4 (3.4%) |
| 6 to 18 Years | 457 (93.3%) | 33 (6.7%) |
| 19 to 25 Years | 125 (100.0%) | 0 (0.0%) |
| 26 to 34 Years | 180 (90.0%) | 20 (10.0%) |
| 35 to 44 Years | 257 (73.6%) | 92 (26.4%) |
| 45 to 54 Years | 199 (97.1%) | 6 (2.9%) |
| 55 to 64 Years | 266 (90.8%) | 27 (9.2%) |
| 65 to 74 Years | 210 (100.0%) | 0 (0.0%) |
| 75 Years and older | 101 (100.0%) | 0 (0.0%) |
| Total | 1,910 (91.3%) | 182 (8.7%) |
Health Insurance Coverage by Citizenship Status in Shadeland
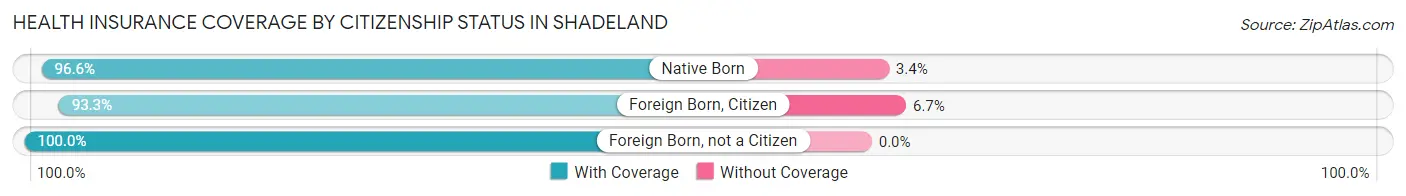
| Citizenship Status | With Coverage | Without Coverage |
| Native Born | 115 (96.6%) | 4 (3.4%) |
| Foreign Born, Citizen | 457 (93.3%) | 33 (6.7%) |
| Foreign Born, not a Citizen | 125 (100.0%) | 0 (0.0%) |
Health Insurance Coverage by Household Income in Shadeland
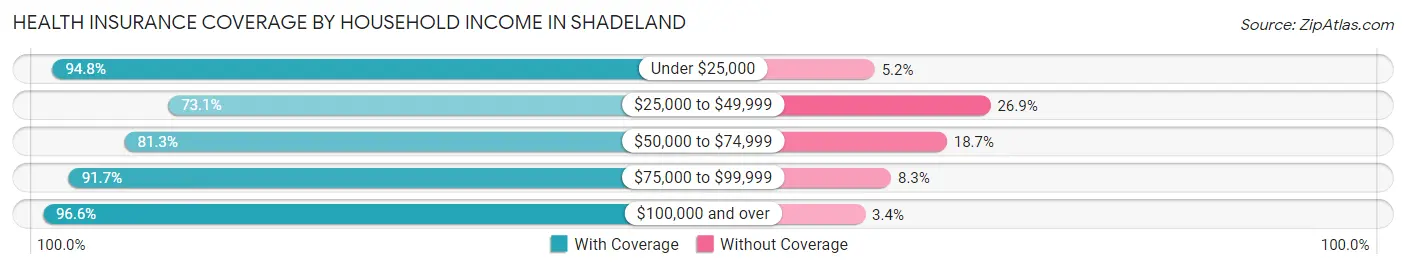
| Household Income | With Coverage | Without Coverage |
| Under $25,000 | 290 (94.8%) | 16 (5.2%) |
| $25,000 to $49,999 | 114 (73.1%) | 42 (26.9%) |
| $50,000 to $74,999 | 308 (81.3%) | 71 (18.7%) |
| $75,000 to $99,999 | 188 (91.7%) | 17 (8.3%) |
| $100,000 and over | 1,010 (96.6%) | 36 (3.4%) |
Public vs Private Health Insurance Coverage by Age in Shadeland
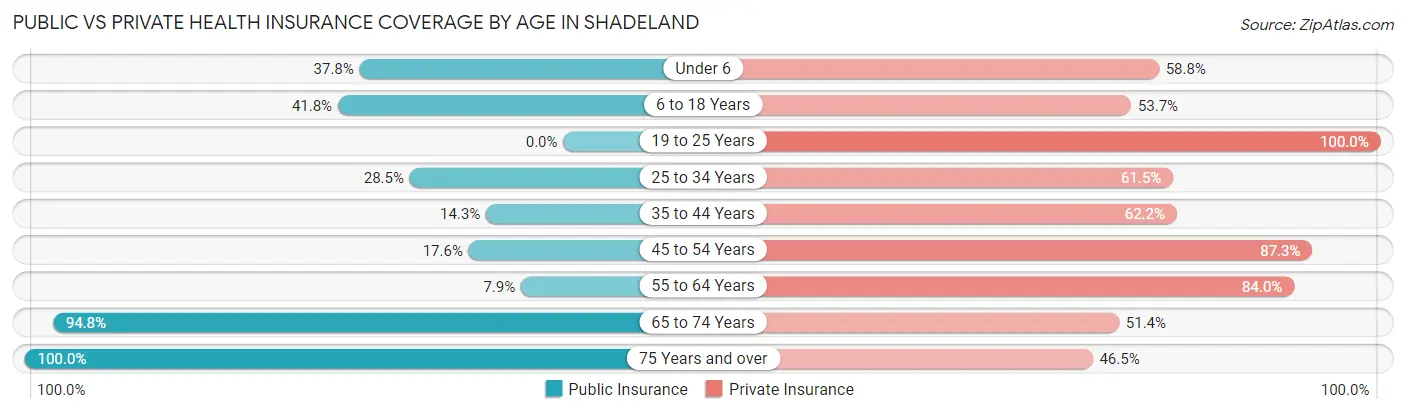
| Age Bracket | Public Insurance | Private Insurance |
| Under 6 | 45 (37.8%) | 70 (58.8%) |
| 6 to 18 Years | 205 (41.8%) | 263 (53.7%) |
| 19 to 25 Years | 0 (0.0%) | 125 (100.0%) |
| 25 to 34 Years | 57 (28.5%) | 123 (61.5%) |
| 35 to 44 Years | 50 (14.3%) | 217 (62.2%) |
| 45 to 54 Years | 36 (17.6%) | 179 (87.3%) |
| 55 to 64 Years | 23 (7.9%) | 246 (84.0%) |
| 65 to 74 Years | 199 (94.8%) | 108 (51.4%) |
| 75 Years and over | 101 (100.0%) | 47 (46.5%) |
| Total | 716 (34.2%) | 1,378 (65.9%) |
Disability Status by Sex by Age in Shadeland
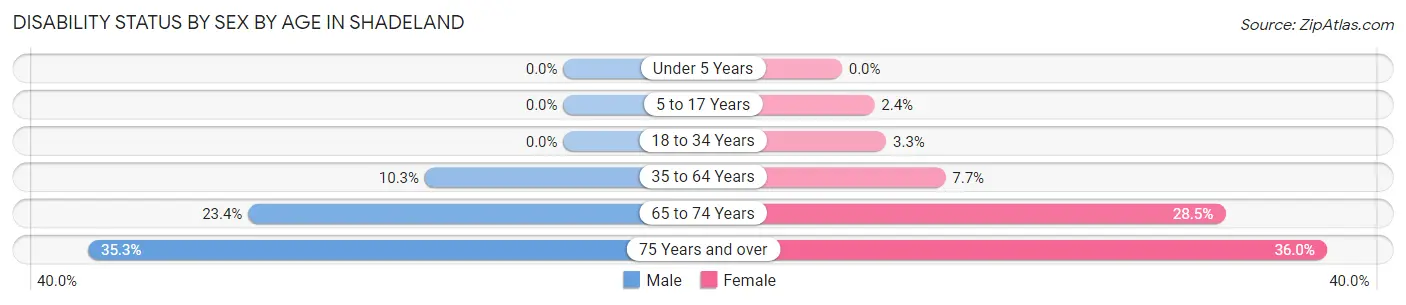
| Age Bracket | Male | Female |
| Under 5 Years | 0 (0.0%) | 0 (0.0%) |
| 5 to 17 Years | 0 (0.0%) | 6 (2.4%) |
| 18 to 34 Years | 0 (0.0%) | 5 (3.3%) |
| 35 to 64 Years | 47 (10.3%) | 30 (7.7%) |
| 65 to 74 Years | 22 (23.4%) | 33 (28.4%) |
| 75 Years and over | 18 (35.3%) | 18 (36.0%) |
Disability Class by Sex by Age in Shadeland
Disability Class: Hearing Difficulty
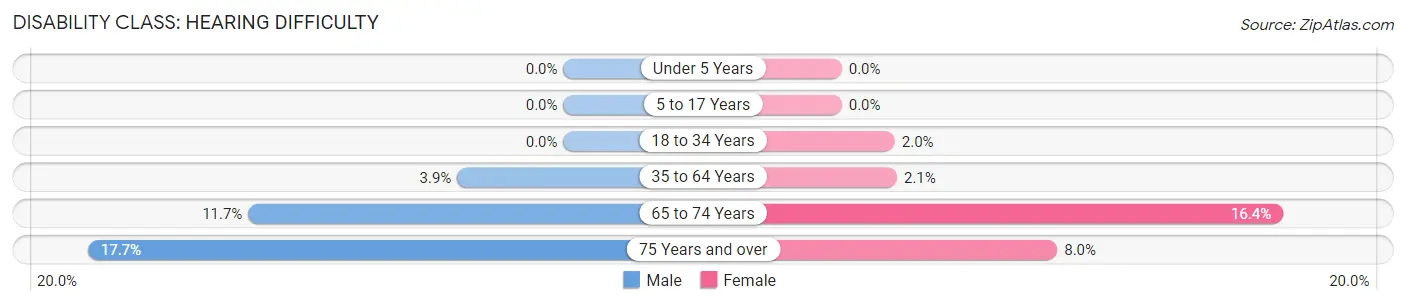
| Age Bracket | Male | Female |
| Under 5 Years | 0 (0.0%) | 0 (0.0%) |
| 5 to 17 Years | 0 (0.0%) | 0 (0.0%) |
| 18 to 34 Years | 0 (0.0%) | 3 (2.0%) |
| 35 to 64 Years | 18 (3.9%) | 8 (2.1%) |
| 65 to 74 Years | 11 (11.7%) | 19 (16.4%) |
| 75 Years and over | 9 (17.6%) | 4 (8.0%) |
Disability Class: Vision Difficulty
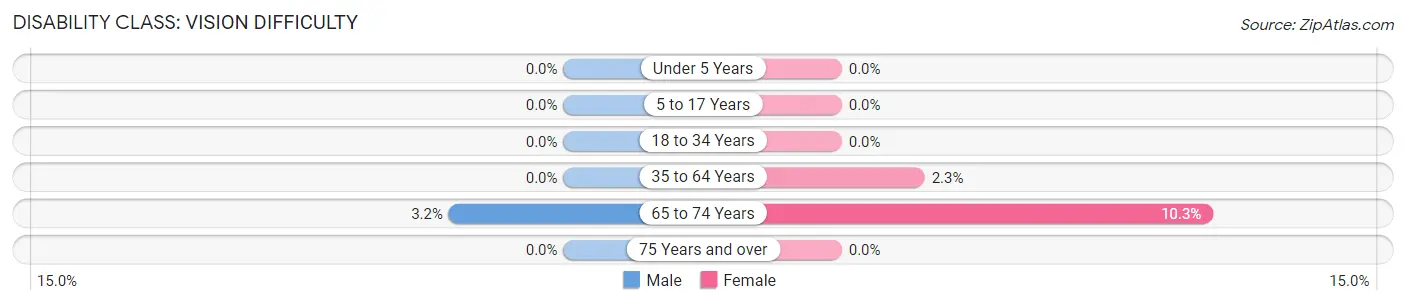
| Age Bracket | Male | Female |
| Under 5 Years | 0 (0.0%) | 0 (0.0%) |
| 5 to 17 Years | 0 (0.0%) | 0 (0.0%) |
| 18 to 34 Years | 0 (0.0%) | 0 (0.0%) |
| 35 to 64 Years | 0 (0.0%) | 9 (2.3%) |
| 65 to 74 Years | 3 (3.2%) | 12 (10.3%) |
| 75 Years and over | 0 (0.0%) | 0 (0.0%) |
Disability Class: Cognitive Difficulty
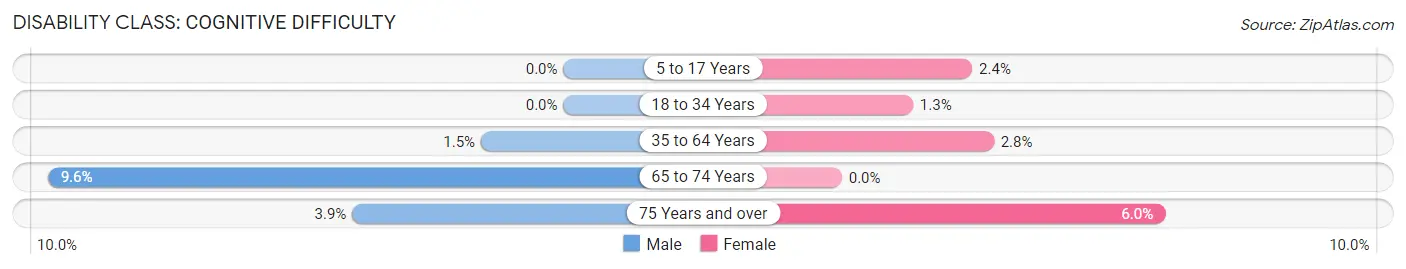
| Age Bracket | Male | Female |
| 5 to 17 Years | 0 (0.0%) | 6 (2.4%) |
| 18 to 34 Years | 0 (0.0%) | 2 (1.3%) |
| 35 to 64 Years | 7 (1.5%) | 11 (2.8%) |
| 65 to 74 Years | 9 (9.6%) | 0 (0.0%) |
| 75 Years and over | 2 (3.9%) | 3 (6.0%) |
Disability Class: Ambulatory Difficulty
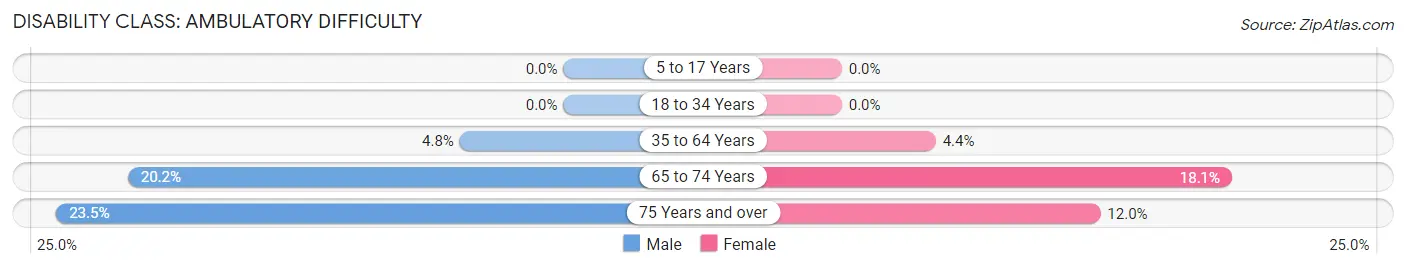
| Age Bracket | Male | Female |
| 5 to 17 Years | 0 (0.0%) | 0 (0.0%) |
| 18 to 34 Years | 0 (0.0%) | 0 (0.0%) |
| 35 to 64 Years | 22 (4.8%) | 17 (4.4%) |
| 65 to 74 Years | 19 (20.2%) | 21 (18.1%) |
| 75 Years and over | 12 (23.5%) | 6 (12.0%) |
Disability Class: Self-Care Difficulty
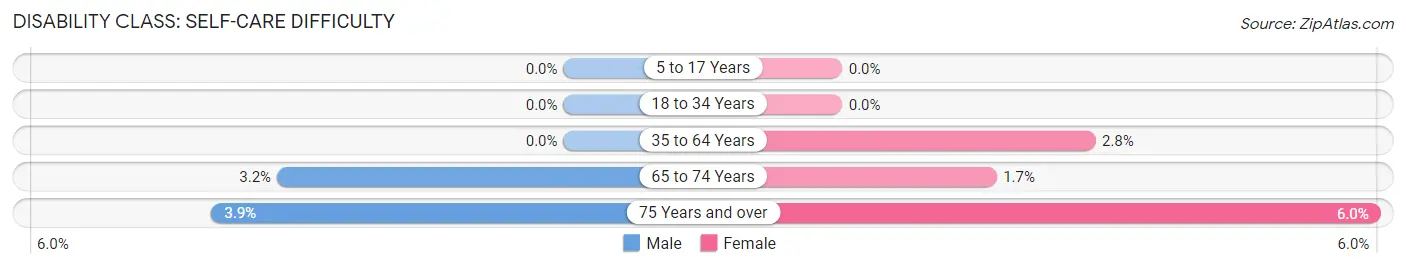
| Age Bracket | Male | Female |
| 5 to 17 Years | 0 (0.0%) | 0 (0.0%) |
| 18 to 34 Years | 0 (0.0%) | 0 (0.0%) |
| 35 to 64 Years | 0 (0.0%) | 11 (2.8%) |
| 65 to 74 Years | 3 (3.2%) | 2 (1.7%) |
| 75 Years and over | 2 (3.9%) | 3 (6.0%) |
Technology Access in Shadeland
Computing Device Access in Shadeland
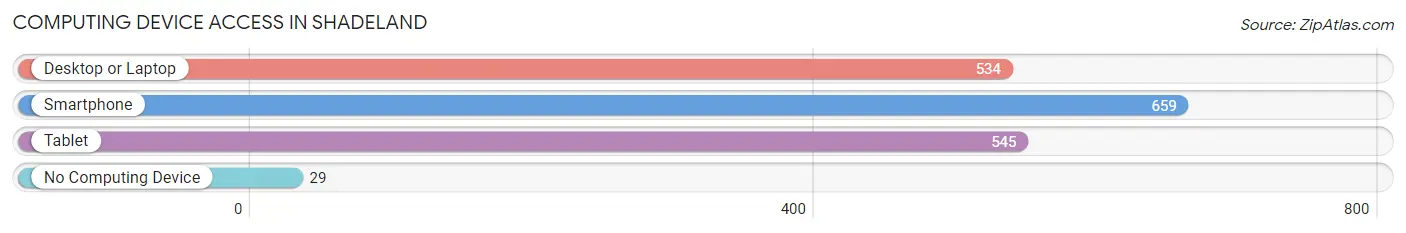
| Device Type | # Households | % Households |
| Desktop or Laptop | 534 | 73.0% |
| Smartphone | 659 | 90.0% |
| Tablet | 545 | 74.5% |
| No Computing Device | 29 | 4.0% |
| Total | 732 | 100.0% |
Internet Access in Shadeland
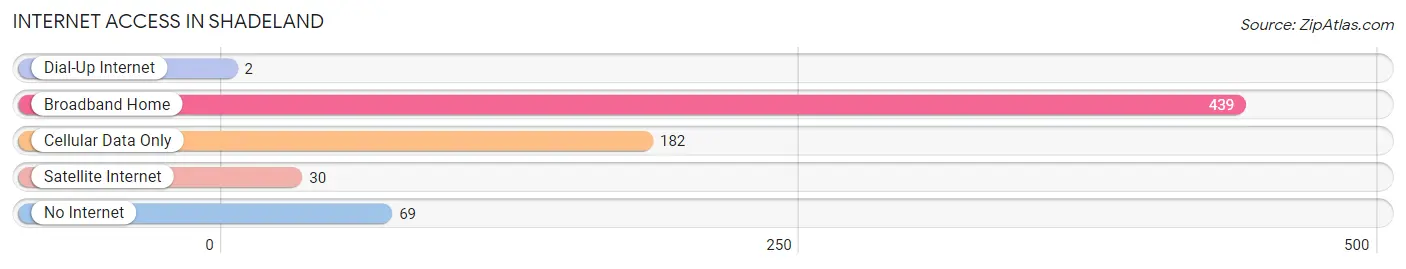
| Internet Type | # Households | % Households |
| Dial-Up Internet | 2 | 0.3% |
| Broadband Home | 439 | 60.0% |
| Cellular Data Only | 182 | 24.9% |
| Satellite Internet | 30 | 4.1% |
| No Internet | 69 | 9.4% |
| Total | 732 | 100.0% |
Shadeland Summary
Shadeland is a small town located in Tippecanoe County, Indiana. It is situated in the northwest corner of the state, just south of the Wabash River. The town was founded in 1837 and has a population of approximately 1,000 people.
Geography
Shadeland is located in the northwest corner of Tippecanoe County, Indiana. It is situated on the Wabash River, which forms the border between Indiana and Illinois. The town is located in the Tippecanoe River Valley, which is a fertile agricultural region. The town is surrounded by rolling hills and wooded areas. The climate in Shadeland is humid continental, with hot summers and cold winters.
Economy
The economy of Shadeland is largely based on agriculture. The town is home to several farms, which produce corn, soybeans, wheat, and other crops. The town also has a few small businesses, including a grocery store, a hardware store, and a few restaurants. The town is also home to a few manufacturing companies, which produce furniture, clothing, and other products.
Demographics
As of the 2010 census, the population of Shadeland was 1,000 people. The racial makeup of the town was 97.2% White, 0.7% African American, 0.3% Native American, 0.2% Asian, and 1.6% from other races. The median household income was $41,250, and the median family income was $50,000. The per capita income was $20,000.
History
Shadeland was founded in 1837 by a group of settlers from Ohio. The town was named after the nearby Shadeland Creek, which was named after a local Native American chief. The town grew slowly over the years, and by the late 19th century, it had become a thriving agricultural community. The town was home to several churches, a school, and a few businesses.
In the early 20th century, the town began to decline as many of its residents moved away in search of better economic opportunities. The town was hit hard by the Great Depression, and many of its businesses closed. In the 1950s, the town began to experience a resurgence as new businesses opened and the population began to grow again.
Today, Shadeland is a small but vibrant community. The town is home to several churches, a school, and a few businesses. The town is also home to a few manufacturing companies, which produce furniture, clothing, and other products. The town is also home to a few farms, which produce corn, soybeans, wheat, and other crops. The town is also home to a few restaurants and a grocery store.
Common Questions
What is Per Capita Income in Shadeland?
Per Capita income in Shadeland is $38,605.
What is the Median Family Income in Shadeland?
Median Family Income in Shadeland is $99,583.
What is the Median Household income in Shadeland?
Median Household Income in Shadeland is $76,250.
What is Income or Wage Gap in Shadeland?
Income or Wage Gap in Shadeland is 44.1%.
Women in Shadeland earn 55.9 cents for every dollar earned by a man.
What is Inequality or Gini Index in Shadeland?
Inequality or Gini Index in Shadeland is 0.47.
What is the Total Population of Shadeland?
Total Population of Shadeland is 2,092.
What is the Total Male Population of Shadeland?
Total Male Population of Shadeland is 1,075.
What is the Total Female Population of Shadeland?
Total Female Population of Shadeland is 1,017.
What is the Ratio of Males per 100 Females in Shadeland?
There are 105.70 Males per 100 Females in Shadeland.
What is the Ratio of Females per 100 Males in Shadeland?
There are 94.60 Females per 100 Males in Shadeland.
What is the Median Population Age in Shadeland?
Median Population Age in Shadeland is 38.6 Years.
What is the Average Family Size in Shadeland
Average Family Size in Shadeland is 3.2 People.
What is the Average Household Size in Shadeland
Average Household Size in Shadeland is 2.9 People.
How Large is the Labor Force in Shadeland?
There are 1,002 People in the Labor Forcein in Shadeland.
What is the Percentage of People in the Labor Force in Shadeland?
63.0% of People are in the Labor Force in Shadeland.
What is the Unemployment Rate in Shadeland?
Unemployment Rate in Shadeland is 2.1%.