Zip Codes with the Highest Percentage of Families with Income Above $200,000 in Indiana
RELATED REPORTS & OPTIONS
Family Income | $200k+
Indiana
Compare Zip Codes
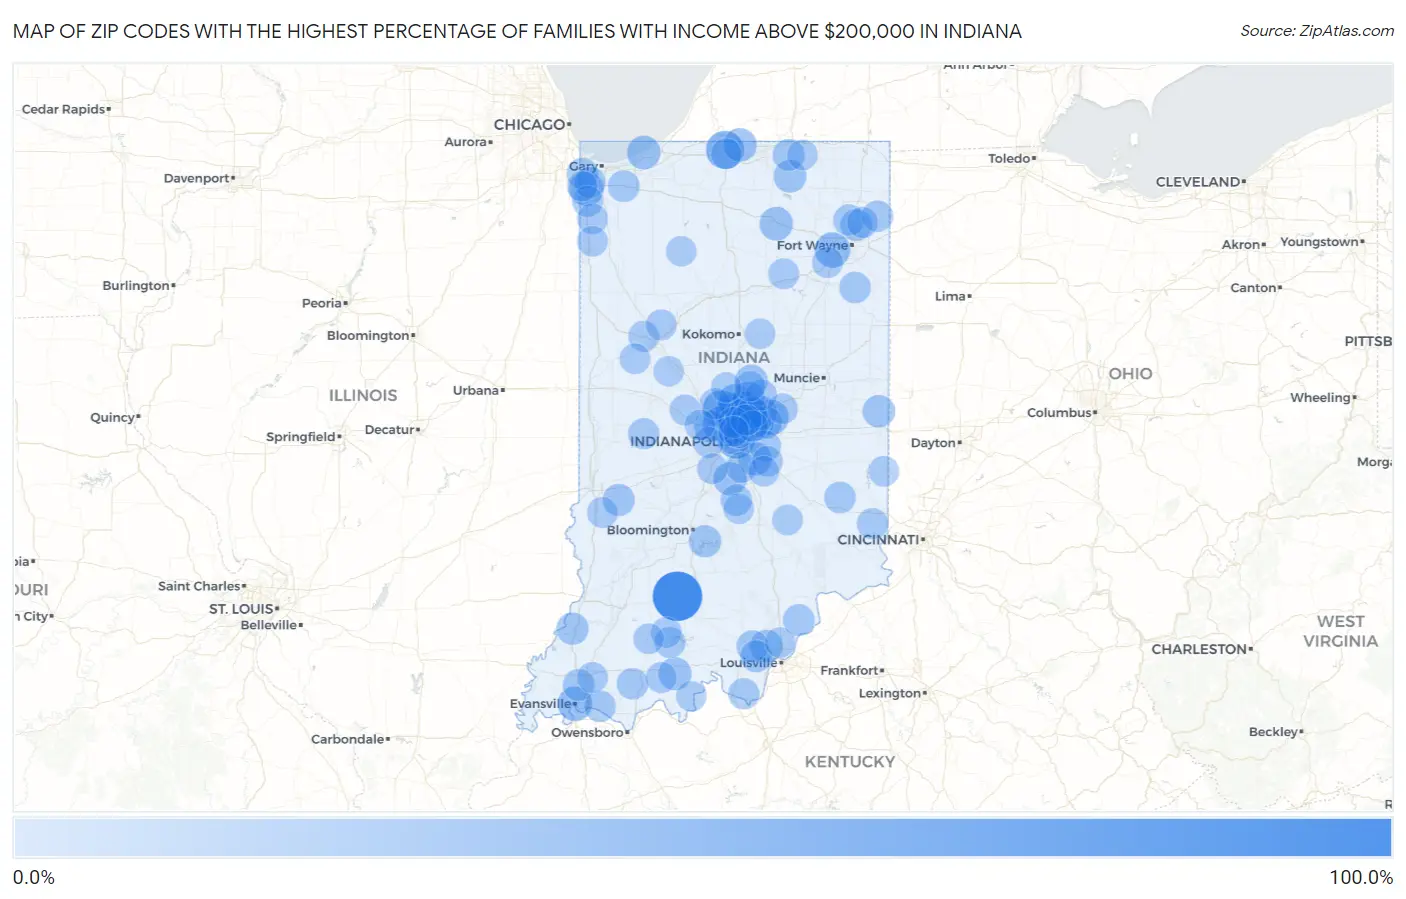
Map of Zip Codes with the Highest Percentage of Families with Income Above $200,000 in Indiana
0.0%
100.0%
Zip Codes with the Highest Percentage of Families with Income Above $200,000 in Indiana
| Zip Code | Families with Income > $200k | vs State | vs National | |
| 1. | 47437 | 100.0% | 9.3%(+90.7)#1 | 14.8%(+85.2)#24 |
| 2. | 46624 | 46.7% | 9.3%(+37.4)#2 | 14.8%(+31.9)#834 |
| 3. | 46290 | 46.2% | 9.3%(+36.9)#3 | 14.8%(+31.4)#859 |
| 4. | 46204 | 43.4% | 9.3%(+34.1)#4 | 14.8%(+28.6)#1,031 |
| 5. | 46077 | 42.4% | 9.3%(+33.1)#5 | 14.8%(+27.6)#1,105 |
| 6. | 46033 | 41.6% | 9.3%(+32.3)#6 | 14.8%(+26.8)#1,176 |
| 7. | 46032 | 40.7% | 9.3%(+31.4)#7 | 14.8%(+25.9)#1,251 |
| 8. | 46814 | 34.7% | 9.3%(+25.4)#8 | 14.8%(+19.9)#1,877 |
| 9. | 46040 | 33.0% | 9.3%(+23.7)#9 | 14.8%(+18.2)#2,105 |
| 10. | 46278 | 31.8% | 9.3%(+22.5)#10 | 14.8%(+17.0)#2,260 |
| 11. | 46373 | 31.3% | 9.3%(+22.0)#11 | 14.8%(+16.5)#2,326 |
| 12. | 47708 | 31.0% | 9.3%(+21.7)#12 | 14.8%(+16.2)#2,379 |
| 13. | 46074 | 29.8% | 9.3%(+20.5)#13 | 14.8%(+15.0)#2,536 |
| 14. | 46037 | 29.1% | 9.3%(+19.8)#14 | 14.8%(+14.3)#2,642 |
| 15. | 46259 | 26.8% | 9.3%(+17.5)#15 | 14.8%(+12.0)#3,086 |
| 16. | 46301 | 26.8% | 9.3%(+17.5)#16 | 14.8%(+12.0)#3,097 |
| 17. | 46590 | 26.7% | 9.3%(+17.4)#17 | 14.8%(+11.9)#3,111 |
| 18. | 46106 | 26.1% | 9.3%(+16.8)#18 | 14.8%(+11.3)#3,223 |
| 19. | 46530 | 25.7% | 9.3%(+16.4)#19 | 14.8%(+10.9)#3,297 |
| 20. | 46030 | 24.4% | 9.3%(+15.1)#20 | 14.8%(+9.60)#3,631 |
| 21. | 47515 | 24.2% | 9.3%(+14.9)#21 | 14.8%(+9.40)#3,669 |
| 22. | 46240 | 23.2% | 9.3%(+13.9)#22 | 14.8%(+8.40)#3,895 |
| 23. | 47119 | 22.9% | 9.3%(+13.6)#23 | 14.8%(+8.10)#3,972 |
| 24. | 46543 | 22.8% | 9.3%(+13.5)#24 | 14.8%(+8.00)#3,997 |
| 25. | 46220 | 22.7% | 9.3%(+13.4)#25 | 14.8%(+7.90)#4,010 |
| 26. | 46236 | 21.8% | 9.3%(+12.5)#26 | 14.8%(+7.00)#4,268 |
| 27. | 47341 | 21.5% | 9.3%(+12.2)#27 | 14.8%(+6.70)#4,364 |
| 28. | 46202 | 21.2% | 9.3%(+11.9)#28 | 14.8%(+6.40)#4,444 |
| 29. | 46280 | 21.1% | 9.3%(+11.8)#29 | 14.8%(+6.30)#4,478 |
| 30. | 46062 | 20.8% | 9.3%(+11.5)#30 | 14.8%(+6.00)#4,559 |
| 31. | 47524 | 20.7% | 9.3%(+11.4)#31 | 14.8%(+5.90)#4,613 |
| 32. | 47846 | 20.6% | 9.3%(+11.3)#32 | 14.8%(+5.80)#4,646 |
| 33. | 47401 | 20.4% | 9.3%(+11.1)#33 | 14.8%(+5.60)#4,672 |
| 34. | 46055 | 20.1% | 9.3%(+10.8)#34 | 14.8%(+5.30)#4,784 |
| 35. | 46256 | 19.5% | 9.3%(+10.2)#35 | 14.8%(+4.70)#4,968 |
| 36. | 47124 | 19.4% | 9.3%(+10.1)#36 | 14.8%(+4.60)#5,016 |
| 37. | 46540 | 19.3% | 9.3%(+10.00)#37 | 14.8%(+4.50)#5,050 |
| 38. | 47122 | 19.2% | 9.3%(+9.90)#38 | 14.8%(+4.40)#5,085 |
| 39. | 46038 | 19.1% | 9.3%(+9.80)#39 | 14.8%(+4.30)#5,100 |
| 40. | 46845 | 19.0% | 9.3%(+9.70)#40 | 14.8%(+4.20)#5,142 |
| 41. | 47725 | 19.0% | 9.3%(+9.70)#41 | 14.8%(+4.20)#5,149 |
| 42. | 46112 | 18.7% | 9.3%(+9.40)#42 | 14.8%(+3.90)#5,275 |
| 43. | 46163 | 18.4% | 9.3%(+9.10)#43 | 14.8%(+3.60)#5,420 |
| 44. | 46385 | 18.0% | 9.3%(+8.70)#44 | 14.8%(+3.20)#5,562 |
| 45. | 47141 | 18.0% | 9.3%(+8.70)#45 | 14.8%(+3.20)#5,594 |
| 46. | 47036 | 18.0% | 9.3%(+8.70)#46 | 14.8%(+3.20)#5,596 |
| 47. | 46321 | 17.5% | 9.3%(+8.20)#47 | 14.8%(+2.70)#5,768 |
| 48. | 46731 | 17.5% | 9.3%(+8.20)#48 | 14.8%(+2.70)#5,793 |
| 49. | 47630 | 17.4% | 9.3%(+8.10)#49 | 14.8%(+2.60)#5,803 |
| 50. | 47537 | 17.4% | 9.3%(+8.10)#50 | 14.8%(+2.60)#5,840 |
| 51. | 46375 | 17.1% | 9.3%(+7.80)#51 | 14.8%(+2.30)#5,938 |
| 52. | 46181 | 17.0% | 9.3%(+7.70)#52 | 14.8%(+2.20)#6,004 |
| 53. | 46205 | 16.8% | 9.3%(+7.50)#53 | 14.8%(+2.00)#6,072 |
| 54. | 46748 | 16.5% | 9.3%(+7.20)#54 | 14.8%(+1.70)#6,222 |
| 55. | 46060 | 16.3% | 9.3%(+7.00)#55 | 14.8%(+1.50)#6,286 |
| 56. | 46788 | 16.3% | 9.3%(+7.00)#56 | 14.8%(+1.50)#6,313 |
| 57. | 47022 | 16.3% | 9.3%(+7.00)#57 | 14.8%(+1.50)#6,315 |
| 58. | 46260 | 16.1% | 9.3%(+6.80)#58 | 14.8%(+1.30)#6,394 |
| 59. | 46216 | 16.0% | 9.3%(+6.70)#59 | 14.8%(+1.20)#6,466 |
| 60. | 46175 | 16.0% | 9.3%(+6.70)#60 | 14.8%(+1.20)#6,478 |
| 61. | 46765 | 15.6% | 9.3%(+6.30)#61 | 14.8%(+0.800)#6,651 |
| 62. | 46250 | 15.3% | 9.3%(+6.00)#62 | 14.8%(+0.500)#6,801 |
| 63. | 47521 | 15.3% | 9.3%(+6.00)#63 | 14.8%(+0.500)#6,825 |
| 64. | 46303 | 15.2% | 9.3%(+5.90)#64 | 14.8%(+0.400)#6,857 |
| 65. | 47135 | 15.2% | 9.3%(+5.90)#65 | 14.8%(+0.400)#6,891 |
| 66. | 47906 | 15.1% | 9.3%(+5.80)#66 | 14.8%(+0.300)#6,904 |
| 67. | 46075 | 15.1% | 9.3%(+5.80)#67 | 14.8%(+0.300)#6,937 |
| 68. | 47577 | 14.9% | 9.3%(+5.60)#68 | 14.8%(+0.100)#7,062 |
| 69. | 46123 | 14.8% | 9.3%(+5.50)#69 | 14.8%(=0.000)#7,078 |
| 70. | 46783 | 14.8% | 9.3%(+5.50)#70 | 14.8%(=0.000)#7,100 |
| 71. | 46147 | 14.7% | 9.3%(+5.40)#71 | 14.8%(-0.100)#7,185 |
| 72. | 47866 | 14.7% | 9.3%(+5.40)#72 | 14.8%(-0.100)#7,196 |
| 73. | 47920 | 14.6% | 9.3%(+5.30)#73 | 14.8%(-0.200)#7,230 |
| 74. | 46990 | 14.6% | 9.3%(+5.30)#74 | 14.8%(-0.200)#7,247 |
| 75. | 46143 | 14.3% | 9.3%(+5.00)#75 | 14.8%(-0.500)#7,363 |
| 76. | 46167 | 14.3% | 9.3%(+5.00)#76 | 14.8%(-0.500)#7,392 |
| 77. | 47244 | 14.2% | 9.3%(+4.90)#77 | 14.8%(-0.600)#7,470 |
| 78. | 46208 | 14.1% | 9.3%(+4.80)#78 | 14.8%(-0.700)#7,480 |
| 79. | 47613 | 14.1% | 9.3%(+4.80)#79 | 14.8%(-0.700)#7,498 |
| 80. | 46356 | 14.0% | 9.3%(+4.70)#80 | 14.8%(-0.800)#7,539 |
| 81. | 46064 | 14.0% | 9.3%(+4.70)#81 | 14.8%(-0.800)#7,541 |
| 82. | 46617 | 14.0% | 9.3%(+4.70)#82 | 14.8%(-0.800)#7,546 |
| 83. | 47527 | 14.0% | 9.3%(+4.70)#83 | 14.8%(-0.800)#7,561 |
| 84. | 46126 | 13.9% | 9.3%(+4.60)#84 | 14.8%(-0.900)#7,616 |
| 85. | 46110 | 13.9% | 9.3%(+4.60)#85 | 14.8%(-0.900)#7,634 |
| 86. | 46158 | 13.7% | 9.3%(+4.40)#86 | 14.8%(-1.10)#7,733 |
| 87. | 47546 | 13.7% | 9.3%(+4.40)#87 | 14.8%(-1.10)#7,736 |
| 88. | 46349 | 13.7% | 9.3%(+4.40)#88 | 14.8%(-1.10)#7,769 |
| 89. | 47992 | 13.6% | 9.3%(+4.30)#89 | 14.8%(-1.20)#7,833 |
| 90. | 46034 | 13.4% | 9.3%(+4.10)#90 | 14.8%(-1.40)#7,938 |
| 91. | 46936 | 13.3% | 9.3%(+4.00)#91 | 14.8%(-1.50)#8,011 |
| 92. | 47003 | 13.2% | 9.3%(+3.90)#92 | 14.8%(-1.60)#8,111 |
| 93. | 46069 | 13.0% | 9.3%(+3.70)#93 | 14.8%(-1.80)#8,229 |
| 94. | 46164 | 13.0% | 9.3%(+3.70)#94 | 14.8%(-1.80)#8,239 |
| 95. | 46311 | 12.9% | 9.3%(+3.60)#95 | 14.8%(-1.90)#8,291 |
| 96. | 46565 | 12.8% | 9.3%(+3.50)#96 | 14.8%(-2.00)#8,377 |
| 97. | 47930 | 12.8% | 9.3%(+3.50)#97 | 14.8%(-2.00)#8,401 |
| 98. | 47172 | 12.6% | 9.3%(+3.30)#98 | 14.8%(-2.20)#8,498 |
| 99. | 47525 | 12.6% | 9.3%(+3.30)#99 | 14.8%(-2.20)#8,550 |
| 100. | 46996 | 12.5% | 9.3%(+3.20)#100 | 14.8%(-2.30)#8,589 |
Common Questions
What are the Top 10 Zip Codes with the Highest Percentage of Families with Income Above $200,000 in Indiana?
Top 10 Zip Codes with the Highest Percentage of Families with Income Above $200,000 in Indiana are:
What zip code has the Highest Percentage of Families with Income Above $200,000 in Indiana?
47437 has the Highest Percentage of Families with Income Above $200,000 in Indiana with 100.0%.
What is the Percentage of Families with Income Above $200,000 in the State of Indiana?
Percentage of Families with Income Above $200,000 in Indiana is 9.3%.
What is the Percentage of Families with Income Above $200,000 in the United States?
Percentage of Families with Income Above $200,000 in the United States is 14.8%.