Dubois, IN Map & Demographics
Dubois Map
Dubois Overview
$39,047
PER CAPITA INCOME
$82,891
AVG FAMILY INCOME
45.6%
WAGE / INCOME GAP [ % ]
54.4¢/ $1
WAGE / INCOME GAP [ $ ]
0.54
INEQUALITY / GINI INDEX
407
TOTAL POPULATION
269
MALE POPULATION
138
FEMALE POPULATION
194.93
MALES / 100 FEMALES
51.30
FEMALES / 100 MALES
46.1
MEDIAN AGE
3.3
AVG FAMILY SIZE
2.1
AVG HOUSEHOLD SIZE
285
LABOR FORCE [ PEOPLE ]
85.6%
PERCENT IN LABOR FORCE
Dubois Zip Codes
Dubois Area Codes
Income in Dubois
Income Overview in Dubois
| Characteristic | Number | Measure |
| Per Capita Income | 407 | $39,047 |
| Median Family Income | 93 | $82,891 |
| Mean Family Income | 93 | $121,889 |
| Median Household Income | 195 | $0 |
| Mean Household Income | 195 | $72,503 |
| Income Deficit | 93 | $0 |
| Wage / Income Gap (%) | 407 | 45.61% |
| Wage / Income Gap ($) | 407 | 54.39¢ per $1 |
| Gini / Inequality Index | 407 | 0.54 |
Earnings by Sex in Dubois
Average Earnings in Dubois are $47,924, $49,152 for men and $26,733 for women, a difference of 45.6%.
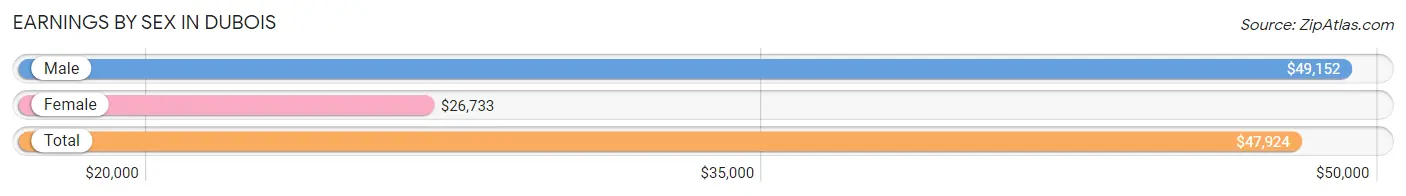
| Sex | Number | Average Earnings |
| Male | 192 (67.4%) | $49,152 |
| Female | 93 (32.6%) | $26,733 |
| Total | 285 (100.0%) | $47,924 |
Earnings by Sex by Income Bracket in Dubois
The most common earnings brackets in Dubois are $5,000 to $7,499 for men (59 | 30.7%) and $25,000 to $29,999 for women (44 | 47.3%).
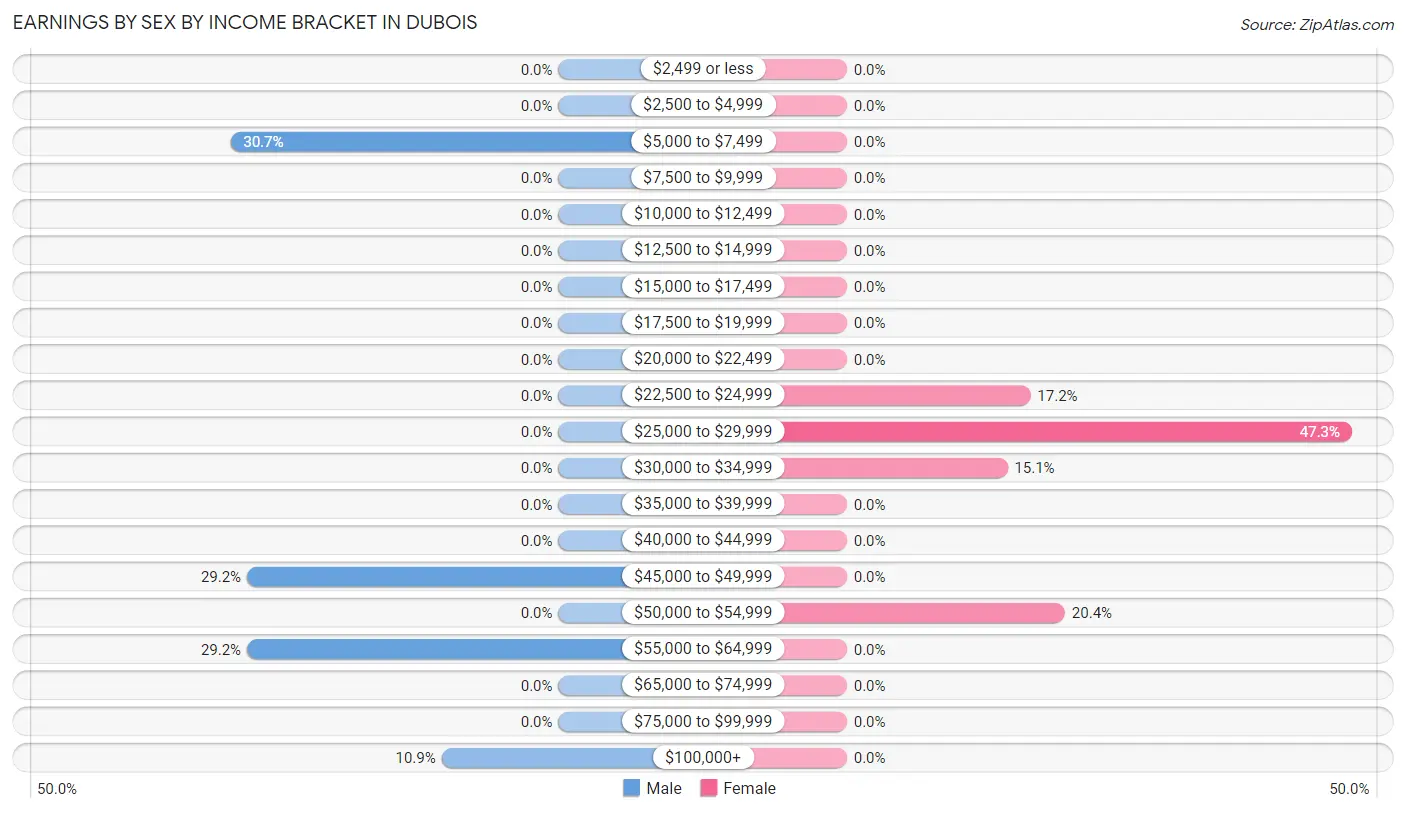
| Income | Male | Female |
| $2,499 or less | 0 (0.0%) | 0 (0.0%) |
| $2,500 to $4,999 | 0 (0.0%) | 0 (0.0%) |
| $5,000 to $7,499 | 59 (30.7%) | 0 (0.0%) |
| $7,500 to $9,999 | 0 (0.0%) | 0 (0.0%) |
| $10,000 to $12,499 | 0 (0.0%) | 0 (0.0%) |
| $12,500 to $14,999 | 0 (0.0%) | 0 (0.0%) |
| $15,000 to $17,499 | 0 (0.0%) | 0 (0.0%) |
| $17,500 to $19,999 | 0 (0.0%) | 0 (0.0%) |
| $20,000 to $22,499 | 0 (0.0%) | 0 (0.0%) |
| $22,500 to $24,999 | 0 (0.0%) | 16 (17.2%) |
| $25,000 to $29,999 | 0 (0.0%) | 44 (47.3%) |
| $30,000 to $34,999 | 0 (0.0%) | 14 (15.0%) |
| $35,000 to $39,999 | 0 (0.0%) | 0 (0.0%) |
| $40,000 to $44,999 | 0 (0.0%) | 0 (0.0%) |
| $45,000 to $49,999 | 56 (29.2%) | 0 (0.0%) |
| $50,000 to $54,999 | 0 (0.0%) | 19 (20.4%) |
| $55,000 to $64,999 | 56 (29.2%) | 0 (0.0%) |
| $65,000 to $74,999 | 0 (0.0%) | 0 (0.0%) |
| $75,000 to $99,999 | 0 (0.0%) | 0 (0.0%) |
| $100,000+ | 21 (10.9%) | 0 (0.0%) |
| Total | 192 (100.0%) | 93 (100.0%) |
Earnings by Sex by Educational Attainment in Dubois
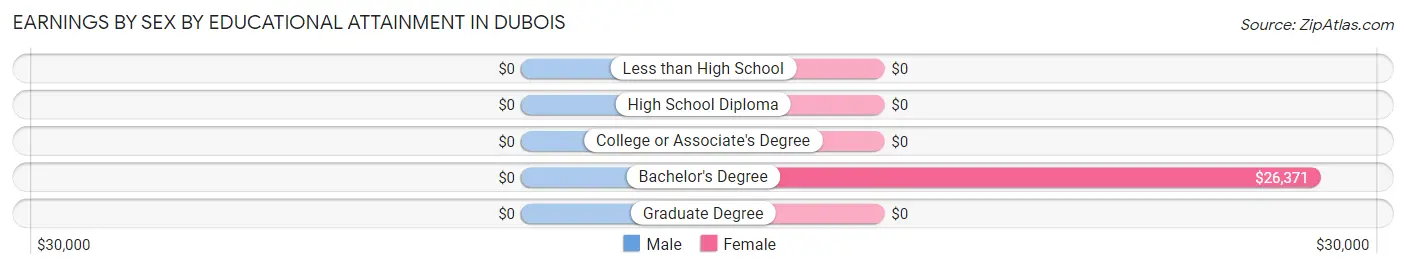
| Educational Attainment | Male Income | Female Income |
| Less than High School | - | - |
| High School Diploma | - | - |
| College or Associate's Degree | - | - |
| Bachelor's Degree | - | - |
| Graduate Degree | - | - |
| Total | $49,152 | $26,733 |
Family Income in Dubois
Family Income Brackets in Dubois
According to the Dubois family income data, there are 61 families falling into the $75,000 to $99,999 income range, which is the most common income bracket and makes up 65.6% of all families.
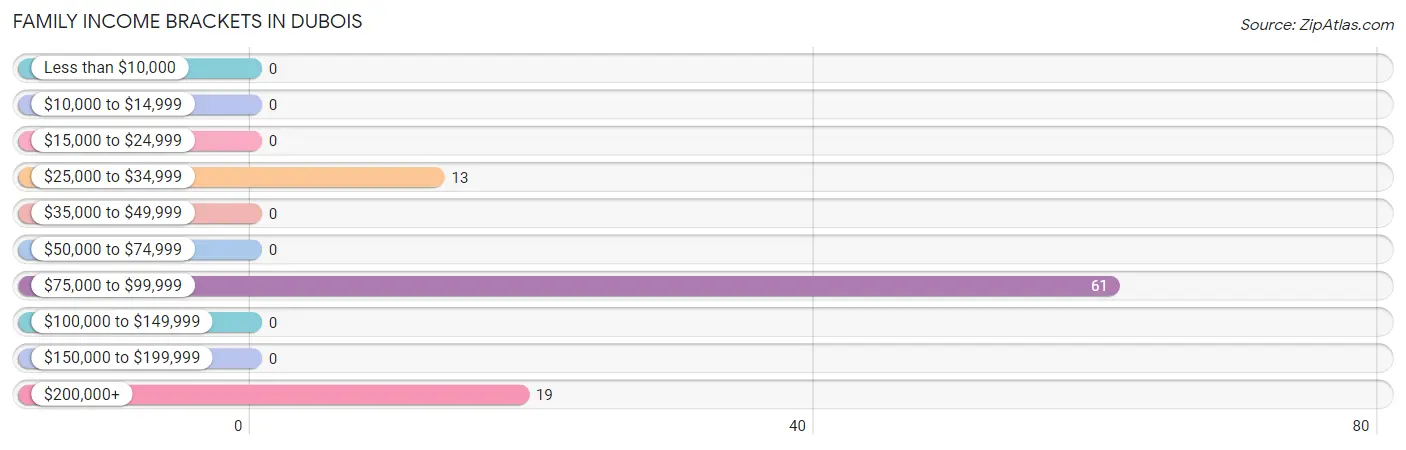
| Income Bracket | # Families | % Families |
| Less than $10,000 | 0 | 0.0% |
| $10,000 to $14,999 | 0 | 0.0% |
| $15,000 to $24,999 | 0 | 0.0% |
| $25,000 to $34,999 | 13 | 14.0% |
| $35,000 to $49,999 | 0 | 0.0% |
| $50,000 to $74,999 | 0 | 0.0% |
| $75,000 to $99,999 | 61 | 65.6% |
| $100,000 to $149,999 | 0 | 0.0% |
| $150,000 to $199,999 | 0 | 0.0% |
| $200,000+ | 19 | 20.4% |
Family Income by Famaliy Size in Dubois
| Income Bracket | # Families | Median Income |
| 2-Person Families | 47 (50.5%) | $0 |
| 3-Person Families | 14 (15.0%) | $0 |
| 4-Person Families | 32 (34.4%) | $0 |
| 5-Person Families | 0 (0.0%) | $0 |
| 6-Person Families | 0 (0.0%) | $0 |
| 7+ Person Families | 0 (0.0%) | $0 |
| Total | 93 (100.0%) | $82,891 |
Family Income by Number of Earners in Dubois
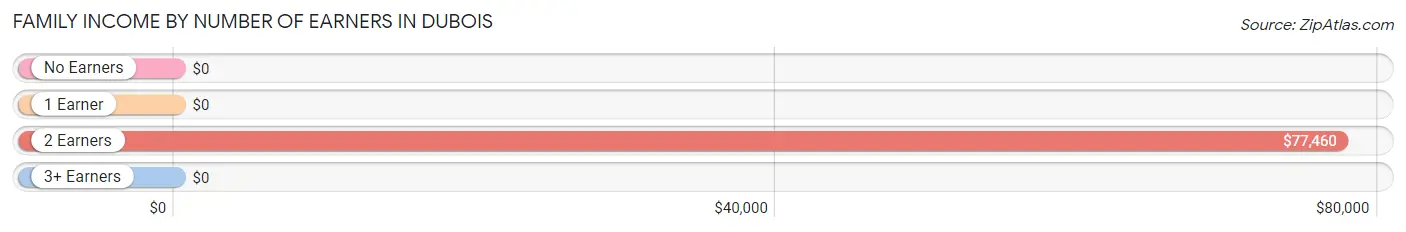
| Number of Earners | # Families | Median Income |
| No Earners | 13 (14.0%) | $0 |
| 1 Earner | 0 (0.0%) | $0 |
| 2 Earners | 61 (65.6%) | $77,460 |
| 3+ Earners | 19 (20.4%) | $0 |
| Total | 93 (100.0%) | $82,891 |
Household Income in Dubois
Household Income Brackets in Dubois
With 70 households falling in the category, the $75,000 to $99,999 income range is the most frequent in Dubois, accounting for 35.9% of all households.
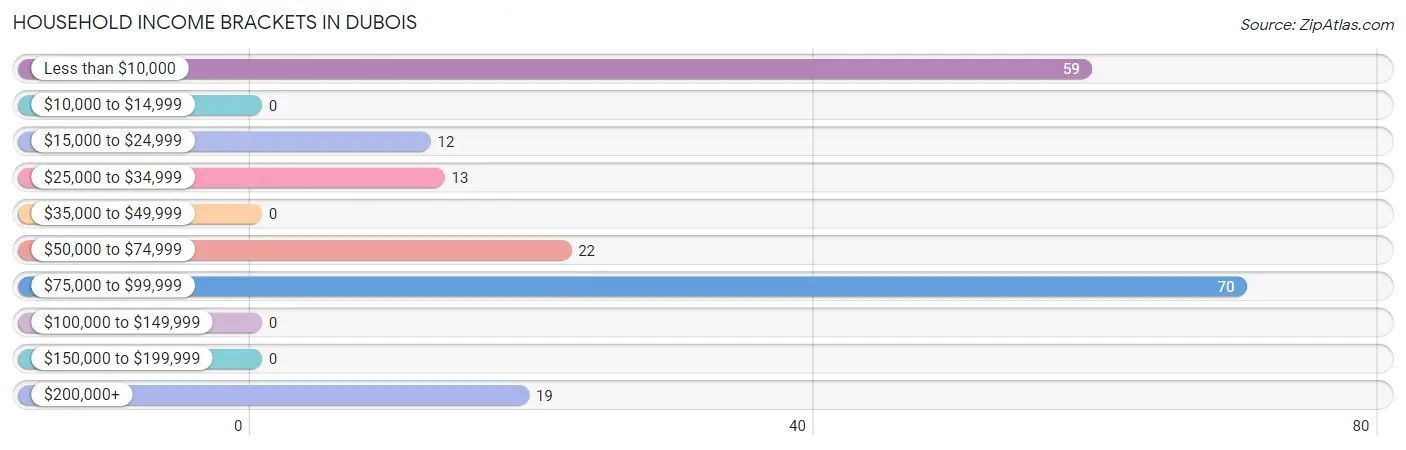
| Income Bracket | # Households | % Households |
| Less than $10,000 | 59 | 30.3% |
| $10,000 to $14,999 | 0 | 0.0% |
| $15,000 to $24,999 | 12 | 6.2% |
| $25,000 to $34,999 | 13 | 6.7% |
| $35,000 to $49,999 | 0 | 0.0% |
| $50,000 to $74,999 | 22 | 11.3% |
| $75,000 to $99,999 | 70 | 35.9% |
| $100,000 to $149,999 | 0 | 0.0% |
| $150,000 to $199,999 | 0 | 0.0% |
| $200,000+ | 19 | 9.7% |
Household Income by Householder Age in Dubois
| Income Bracket | # Households | Median Income |
| 15 to 24 Years | 0 (0.0%) | $0 |
| 25 to 44 Years | 36 (18.5%) | $0 |
| 45 to 64 Years | 125 (64.1%) | $0 |
| 65+ Years | 34 (17.4%) | $0 |
| Total | 195 (100.0%) | $0 |
Poverty in Dubois
Income Below Poverty by Sex and Age in Dubois
With 32.7% poverty level for males and 23.9% for females among the residents of Dubois, 55 to 64 year old males and 12 to 14 year old females are the most vulnerable to poverty, with 59 males (61.5%) and 20 females (100.0%) in their respective age groups living below the poverty level.
| Age Bracket | Male | Female |
| Under 5 Years | 0 (0.0%) | 0 (0.0%) |
| 5 Years | 0 (0.0%) | 0 (0.0%) |
| 6 to 11 Years | 15 (46.9%) | 0 (0.0%) |
| 12 to 14 Years | 0 (0.0%) | 20 (100.0%) |
| 15 Years | 0 (0.0%) | 0 (0.0%) |
| 16 and 17 Years | 0 (0.0%) | 0 (0.0%) |
| 18 to 24 Years | 0 (0.0%) | 0 (0.0%) |
| 25 to 34 Years | 0 (0.0%) | 0 (0.0%) |
| 35 to 44 Years | 0 (0.0%) | 0 (0.0%) |
| 45 to 54 Years | 0 (0.0%) | 0 (0.0%) |
| 55 to 64 Years | 59 (61.5%) | 0 (0.0%) |
| 65 to 74 Years | 0 (0.0%) | 0 (0.0%) |
| 75 Years and over | 14 (60.9%) | 13 (52.0%) |
| Total | 88 (32.7%) | 33 (23.9%) |
Income Above Poverty by Sex and Age in Dubois
According to the poverty statistics in Dubois, males aged under 5 years and females aged 25 to 34 years are the age groups that are most secure financially, with 100.0% of males and 100.0% of females in these age groups living above the poverty line.
| Age Bracket | Male | Female |
| Under 5 Years | 22 (100.0%) | 0 (0.0%) |
| 5 Years | 0 (0.0%) | 0 (0.0%) |
| 6 to 11 Years | 17 (53.1%) | 0 (0.0%) |
| 12 to 14 Years | 0 (0.0%) | 0 (0.0%) |
| 15 Years | 0 (0.0%) | 0 (0.0%) |
| 16 and 17 Years | 0 (0.0%) | 0 (0.0%) |
| 18 to 24 Years | 0 (0.0%) | 0 (0.0%) |
| 25 to 34 Years | 22 (100.0%) | 30 (100.0%) |
| 35 to 44 Years | 74 (100.0%) | 0 (0.0%) |
| 45 to 54 Years | 0 (0.0%) | 44 (100.0%) |
| 55 to 64 Years | 37 (38.5%) | 19 (100.0%) |
| 65 to 74 Years | 0 (0.0%) | 0 (0.0%) |
| 75 Years and over | 9 (39.1%) | 12 (48.0%) |
| Total | 181 (67.3%) | 105 (76.1%) |
Income Below Poverty Among Married-Couple Families in Dubois
The poverty statistics for married-couple families in Dubois show that 14.0% or 13 of the total 93 families live below the poverty line. Families with 1 or 2 children have the highest poverty rate of 28.3%, comprising of 13 families. On the other hand, families with no children have the lowest poverty rate of 0.0%, which includes 0 families.
| Children | Above Poverty | Below Poverty |
| No Children | 47 (100.0%) | 0 (0.0%) |
| 1 or 2 Children | 33 (71.7%) | 13 (28.3%) |
| 3 or 4 Children | 0 (0.0%) | 0 (0.0%) |
| 5 or more Children | 0 (0.0%) | 0 (0.0%) |
| Total | 80 (86.0%) | 13 (14.0%) |
Income Below Poverty Among Single-Parent Households in Dubois
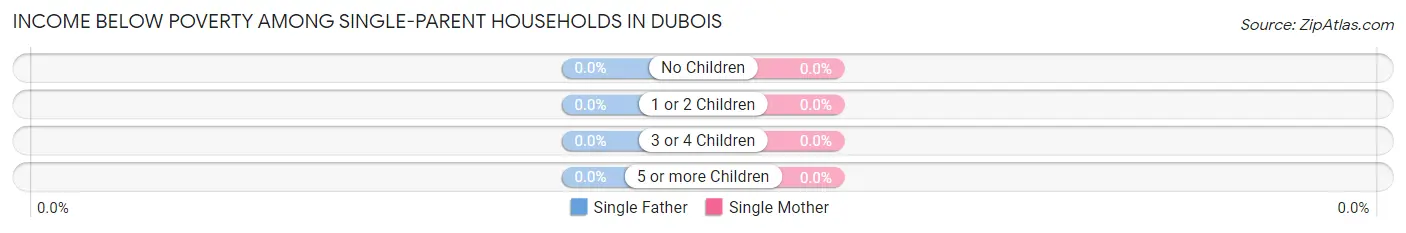
| Children | Single Father | Single Mother |
| No Children | 0 (0.0%) | 0 (0.0%) |
| 1 or 2 Children | 0 (0.0%) | 0 (0.0%) |
| 3 or 4 Children | 0 (0.0%) | 0 (0.0%) |
| 5 or more Children | 0 (0.0%) | 0 (0.0%) |
| Total | 0 (0.0%) | 0 (0.0%) |
Income Below Poverty Among Married-Couple vs Single-Parent Households in Dubois
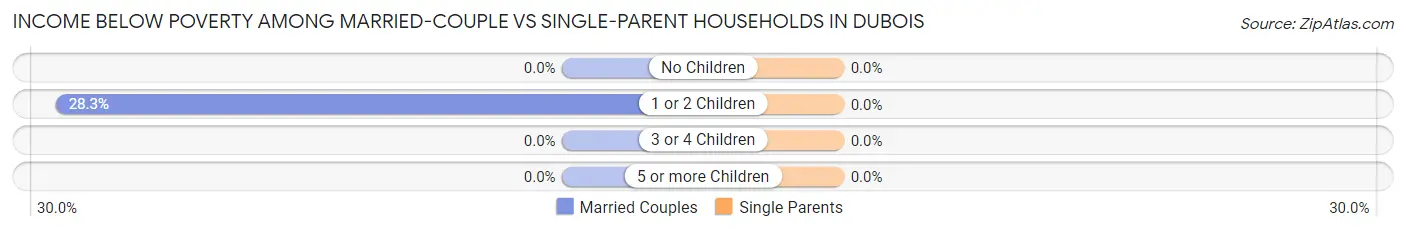
| Children | Married-Couple Families | Single-Parent Households |
| No Children | 0 (0.0%) | 0 (0.0%) |
| 1 or 2 Children | 13 (28.3%) | 0 (0.0%) |
| 3 or 4 Children | 0 (0.0%) | 0 (0.0%) |
| 5 or more Children | 0 (0.0%) | 0 (0.0%) |
| Total | 13 (14.0%) | 0 (0.0%) |
Race in Dubois
The most populous races in Dubois are White / Caucasian (292 | 71.7%), Black / African American (59 | 14.5%), and Hispanic or Latino (56 | 13.8%).
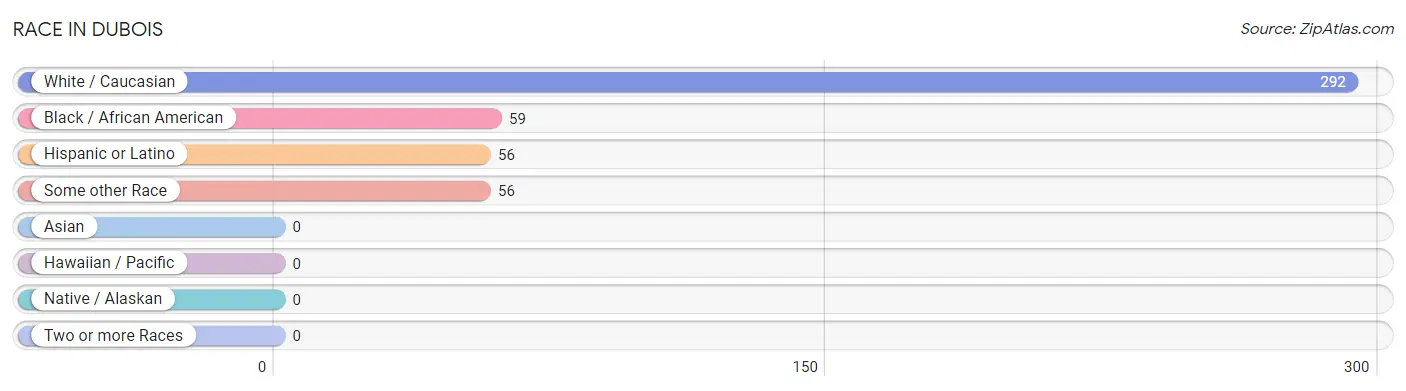
| Race | # Population | % Population |
| Asian | 0 | 0.0% |
| Black / African American | 59 | 14.5% |
| Hawaiian / Pacific | 0 | 0.0% |
| Hispanic or Latino | 56 | 13.8% |
| Native / Alaskan | 0 | 0.0% |
| White / Caucasian | 292 | 71.7% |
| Two or more Races | 0 | 0.0% |
| Some other Race | 56 | 13.8% |
| Total | 407 | 100.0% |
Ancestry in Dubois
The most populous ancestries reported in Dubois are Mexican (56 | 13.8%), American (53 | 13.0%), German (29 | 7.1%), Irish (13 | 3.2%), and Northern European (9 | 2.2%), together accounting for 39.3% of all Dubois residents.
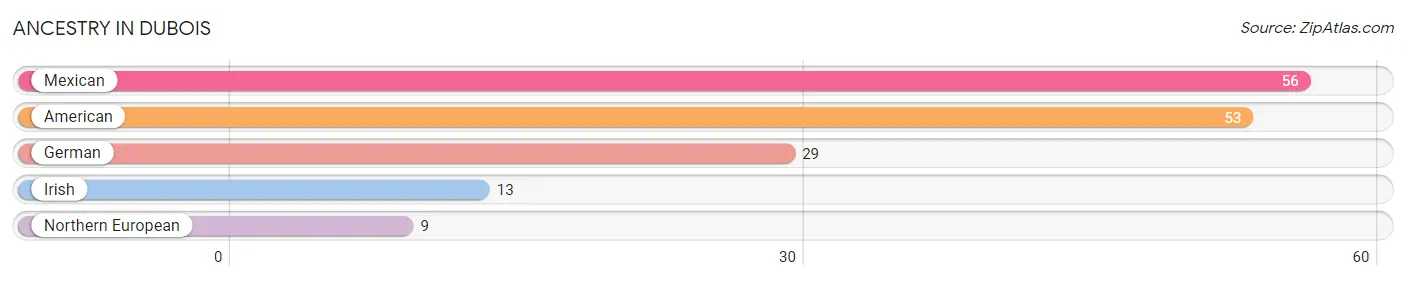
| Ancestry | # Population | % Population |
| American | 53 | 13.0% |
| German | 29 | 7.1% |
| Irish | 13 | 3.2% |
| Mexican | 56 | 13.8% |
| Northern European | 9 | 2.2% | View All 5 Rows |
Immigrants in Dubois
The most numerous immigrant groups reported in Dubois came from Central America (56 | 13.8%), Latin America (56 | 13.8%), and Mexico (56 | 13.8%), together accounting for 41.3% of all Dubois residents.
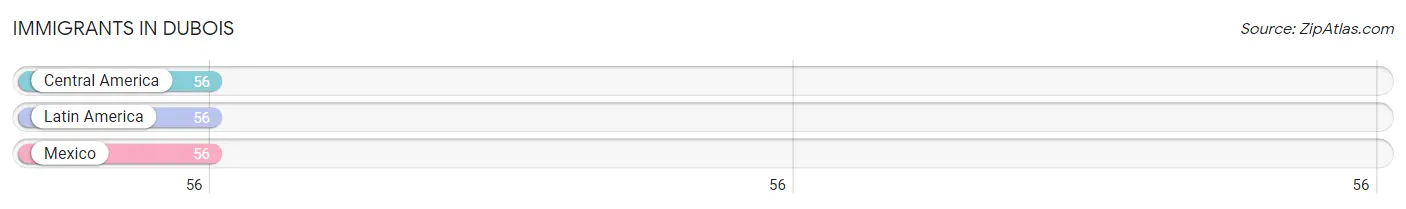
| Immigration Origin | # Population | % Population |
| Central America | 56 | 13.8% |
| Latin America | 56 | 13.8% |
| Mexico | 56 | 13.8% | View All 3 Rows |
Sex and Age in Dubois
Sex and Age in Dubois
The most populous age groups in Dubois are 60 to 64 Years (80 | 29.7%) for men and 45 to 49 Years (44 | 31.9%) for women.
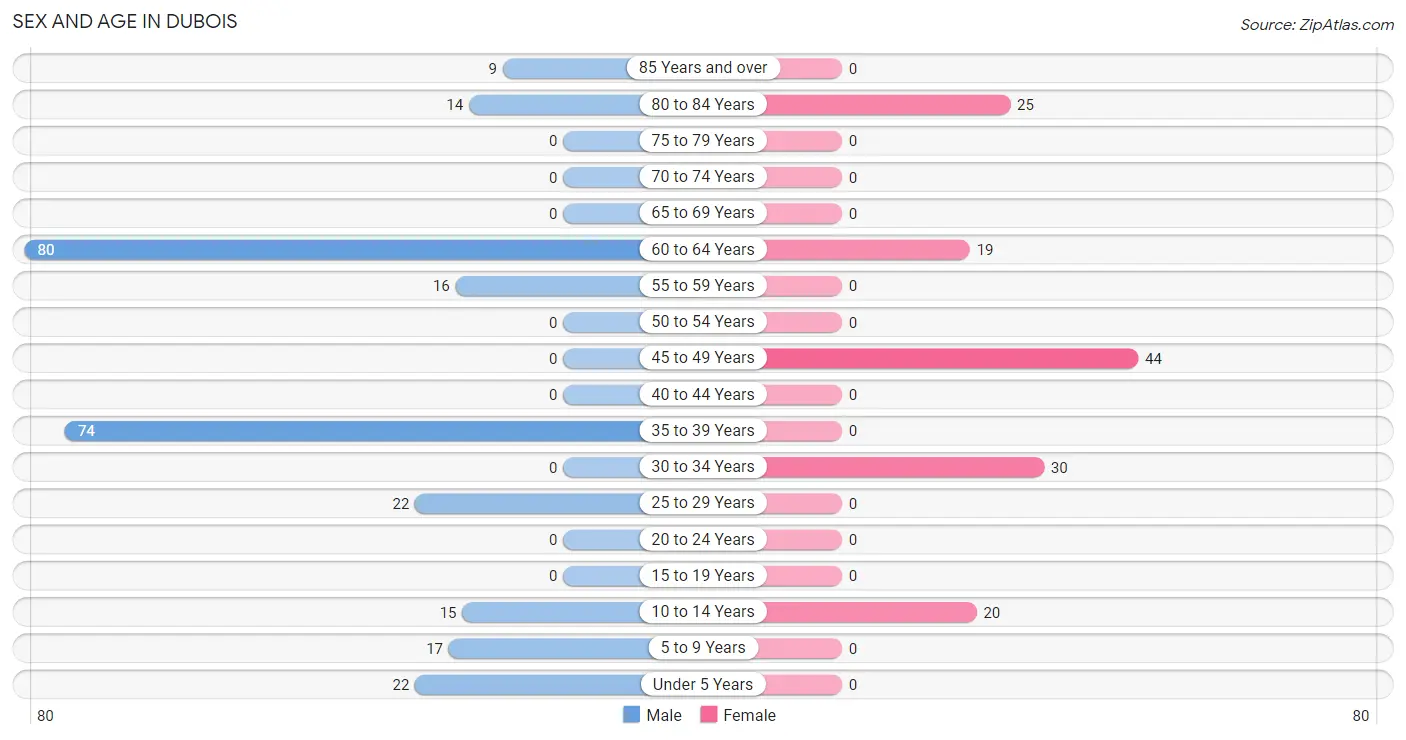
| Age Bracket | Male | Female |
| Under 5 Years | 22 (8.2%) | 0 (0.0%) |
| 5 to 9 Years | 17 (6.3%) | 0 (0.0%) |
| 10 to 14 Years | 15 (5.6%) | 20 (14.5%) |
| 15 to 19 Years | 0 (0.0%) | 0 (0.0%) |
| 20 to 24 Years | 0 (0.0%) | 0 (0.0%) |
| 25 to 29 Years | 22 (8.2%) | 0 (0.0%) |
| 30 to 34 Years | 0 (0.0%) | 30 (21.7%) |
| 35 to 39 Years | 74 (27.5%) | 0 (0.0%) |
| 40 to 44 Years | 0 (0.0%) | 0 (0.0%) |
| 45 to 49 Years | 0 (0.0%) | 44 (31.9%) |
| 50 to 54 Years | 0 (0.0%) | 0 (0.0%) |
| 55 to 59 Years | 16 (5.9%) | 0 (0.0%) |
| 60 to 64 Years | 80 (29.7%) | 19 (13.8%) |
| 65 to 69 Years | 0 (0.0%) | 0 (0.0%) |
| 70 to 74 Years | 0 (0.0%) | 0 (0.0%) |
| 75 to 79 Years | 0 (0.0%) | 0 (0.0%) |
| 80 to 84 Years | 14 (5.2%) | 25 (18.1%) |
| 85 Years and over | 9 (3.4%) | 0 (0.0%) |
| Total | 269 (100.0%) | 138 (100.0%) |
Families and Households in Dubois
Median Family Size in Dubois
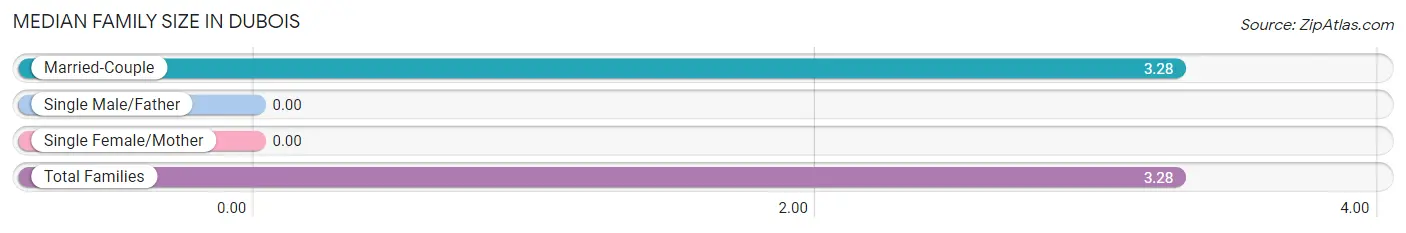
| Family Type | # Families | Family Size |
| Married-Couple | 93 (100.0%) | 3.28 |
| Single Male/Father | 0 (0.0%) | - |
| Single Female/Mother | 0 (0.0%) | - |
| Total Families | 93 (100.0%) | 3.28 |
Median Household Size in Dubois
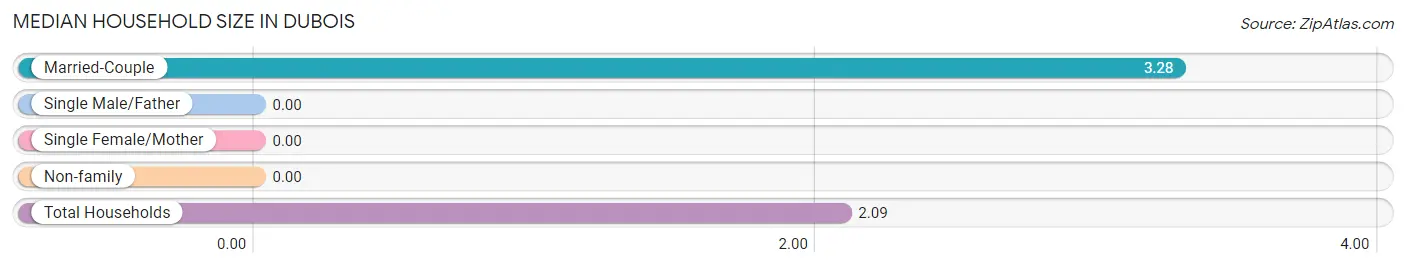
| Household Type | # Households | Household Size |
| Married-Couple | 93 (47.7%) | 3.28 |
| Single Male/Father | 0 (0.0%) | - |
| Single Female/Mother | 0 (0.0%) | - |
| Non-family | 102 (52.3%) | - |
| Total Households | 195 (100.0%) | 2.09 |
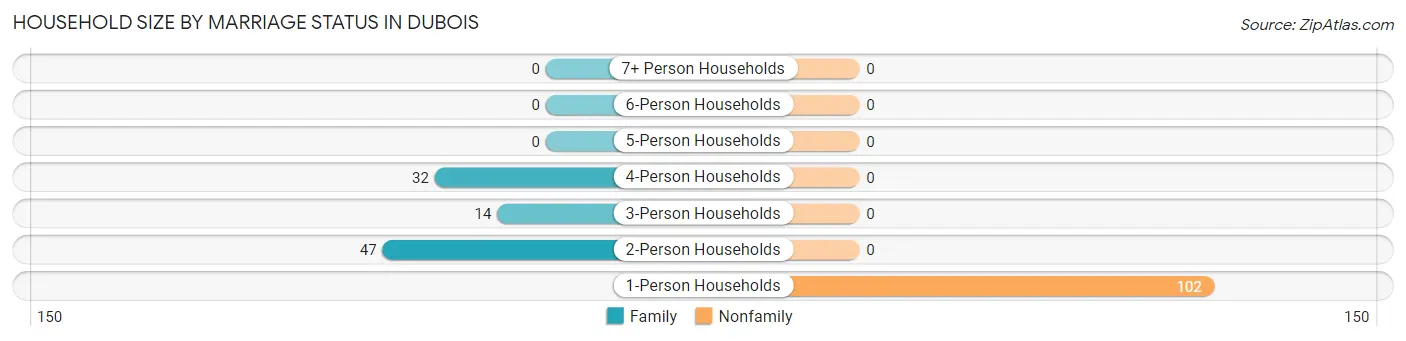
Household Size by Marriage Status in Dubois
Out of a total of 195 households in Dubois, 93 (47.7%) are family households, while 102 (52.3%) are nonfamily households. The most numerous type of family households are 2-person households, comprising 47, and the most common type of nonfamily households are 1-person households, comprising 102.
| Household Size | Family Households | Nonfamily Households |
| 1-Person Households | - | 102 (52.3%) |
| 2-Person Households | 47 (24.1%) | 0 (0.0%) |
| 3-Person Households | 14 (7.2%) | 0 (0.0%) |
| 4-Person Households | 32 (16.4%) | 0 (0.0%) |
| 5-Person Households | 0 (0.0%) | 0 (0.0%) |
| 6-Person Households | 0 (0.0%) | 0 (0.0%) |
| 7+ Person Households | 0 (0.0%) | 0 (0.0%) |
| Total | 93 (47.7%) | 102 (52.3%) |
Female Fertility in Dubois
Fertility by Age in Dubois
Average fertility rate in Dubois is 189.0 births per 1,000 women. Women in the age bracket of 20 to 34 years have the highest fertility rate with 467.0 births per 1,000 women. Women in the age bracket of 20 to 34 years acount for 100.0% of all women with births.
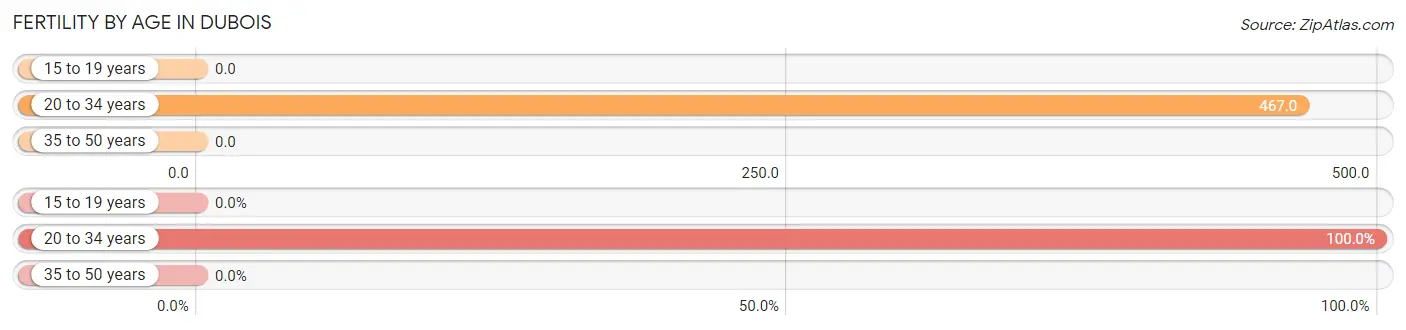
| Age Bracket | Women with Births | Births / 1,000 Women |
| 15 to 19 years | 0 (0.0%) | 0.0 |
| 20 to 34 years | 14 (100.0%) | 467.0 |
| 35 to 50 years | 0 (0.0%) | 0.0 |
| Total | 14 (100.0%) | 189.0 |
Fertility by Age by Marriage Status in Dubois
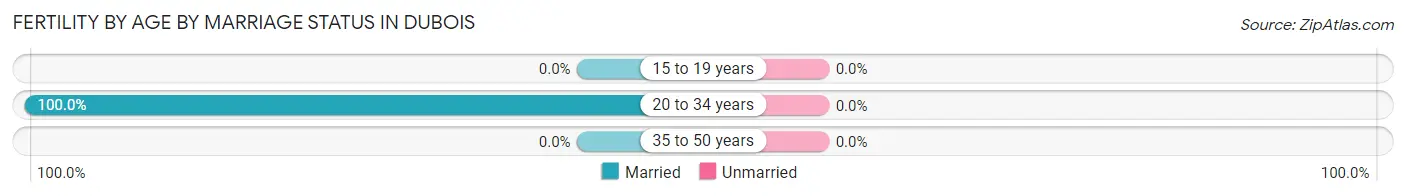
| Age Bracket | Married | Unmarried |
| 15 to 19 years | 0 (0.0%) | 0 (0.0%) |
| 20 to 34 years | 14 (100.0%) | 0 (0.0%) |
| 35 to 50 years | 0 (0.0%) | 0 (0.0%) |
| Total | 14 (100.0%) | 0 (0.0%) |
Fertility by Education in Dubois
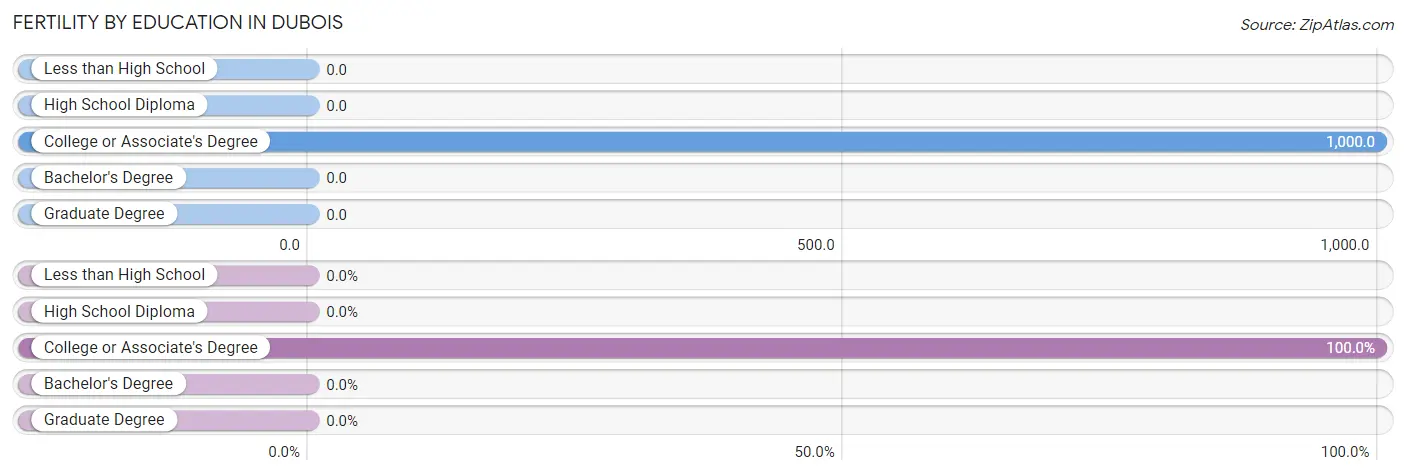
| Educational Attainment | Women with Births | Births / 1,000 Women |
| Less than High School | 0 (0.0%) | 0.0 |
| High School Diploma | 0 (0.0%) | 0.0 |
| College or Associate's Degree | 14 (100.0%) | 1,000.0 |
| Bachelor's Degree | 0 (0.0%) | 0.0 |
| Graduate Degree | 0 (0.0%) | 0.0 |
| Total | 14 (100.0%) | 189.0 |
Fertility by Education by Marriage Status in Dubois
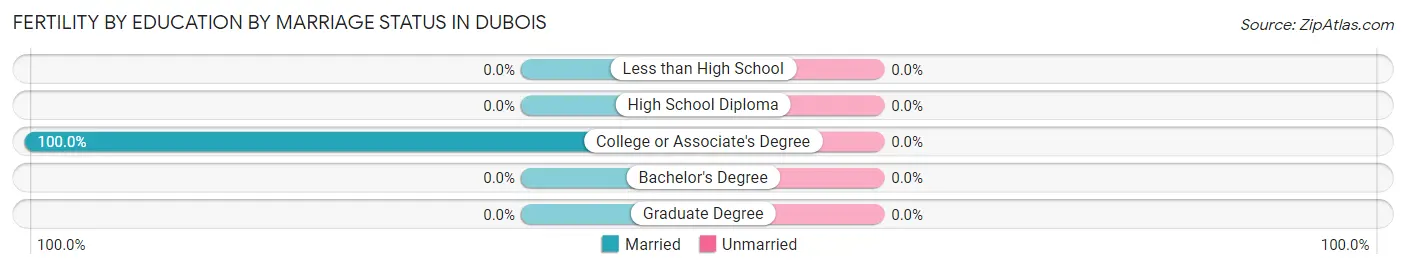
| Educational Attainment | Married | Unmarried |
| Less than High School | 0 (0.0%) | 0 (0.0%) |
| High School Diploma | 0 (0.0%) | 0 (0.0%) |
| College or Associate's Degree | 14 (100.0%) | 0 (0.0%) |
| Bachelor's Degree | 0 (0.0%) | 0 (0.0%) |
| Graduate Degree | 0 (0.0%) | 0 (0.0%) |
| Total | 14 (100.0%) | 0 (0.0%) |
Employment Characteristics in Dubois
Employment by Class of Employer in Dubois
Among the 285 employed individuals in Dubois, private company employees (229 | 80.3%), self-employed (incorporated) (40 | 14.0%), and not-for-profit organizations (16 | 5.6%) make up the most common classes of employment.
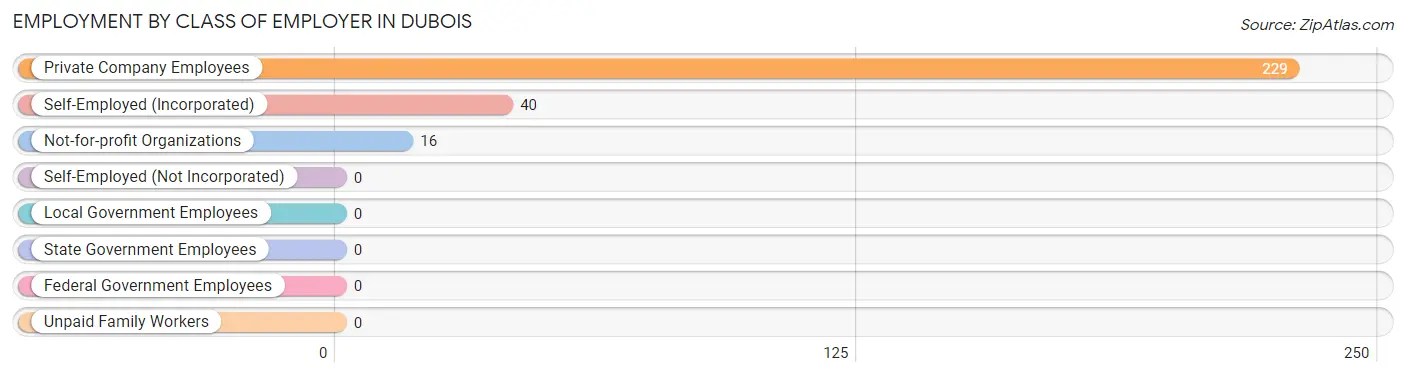
| Employer Class | # Employees | % Employees |
| Private Company Employees | 229 | 80.3% |
| Self-Employed (Incorporated) | 40 | 14.0% |
| Self-Employed (Not Incorporated) | 0 | 0.0% |
| Not-for-profit Organizations | 16 | 5.6% |
| Local Government Employees | 0 | 0.0% |
| State Government Employees | 0 | 0.0% |
| Federal Government Employees | 0 | 0.0% |
| Unpaid Family Workers | 0 | 0.0% |
| Total | 285 | 100.0% |
Employment Status by Age in Dubois
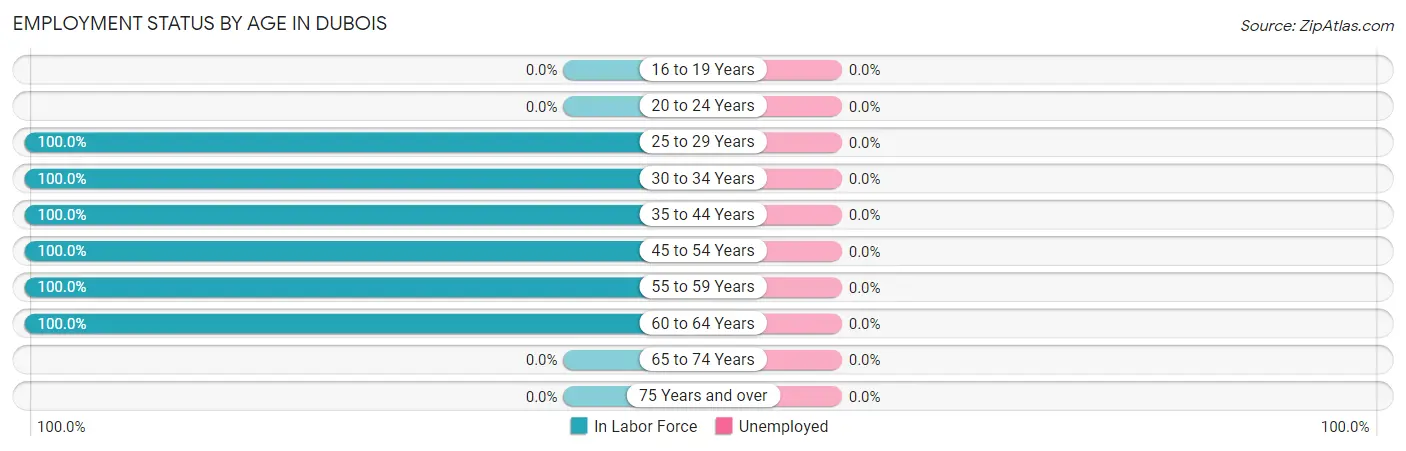
| Age Bracket | In Labor Force | Unemployed |
| 16 to 19 Years | 0 (0.0%) | 0 (0.0%) |
| 20 to 24 Years | 0 (0.0%) | 0 (0.0%) |
| 25 to 29 Years | 22 (100.0%) | 0 (0.0%) |
| 30 to 34 Years | 30 (100.0%) | 0 (0.0%) |
| 35 to 44 Years | 74 (100.0%) | 0 (0.0%) |
| 45 to 54 Years | 44 (100.0%) | 0 (0.0%) |
| 55 to 59 Years | 16 (100.0%) | 0 (0.0%) |
| 60 to 64 Years | 99 (100.0%) | 0 (0.0%) |
| 65 to 74 Years | 0 (0.0%) | 0 (0.0%) |
| 75 Years and over | 0 (0.0%) | 0 (0.0%) |
| Total | 285 (85.6%) | 0 (0.0%) |
Employment Status by Educational Attainment in Dubois
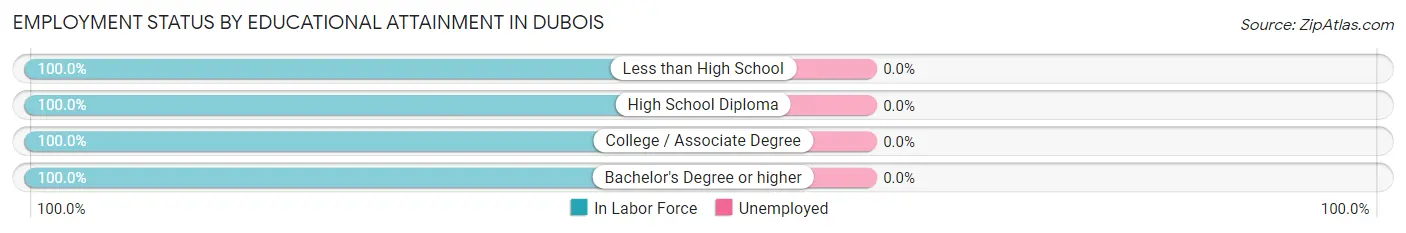
| Educational Attainment | In Labor Force | Unemployed |
| Less than High School | 56 (100.0%) | 0 (0.0%) |
| High School Diploma | 128 (100.0%) | 0 (0.0%) |
| College / Associate Degree | 35 (100.0%) | 0 (0.0%) |
| Bachelor's Degree or higher | 66 (100.0%) | 0 (0.0%) |
| Total | 285 (100.0%) | 0 (0.0%) |
Employment Occupations by Sex in Dubois
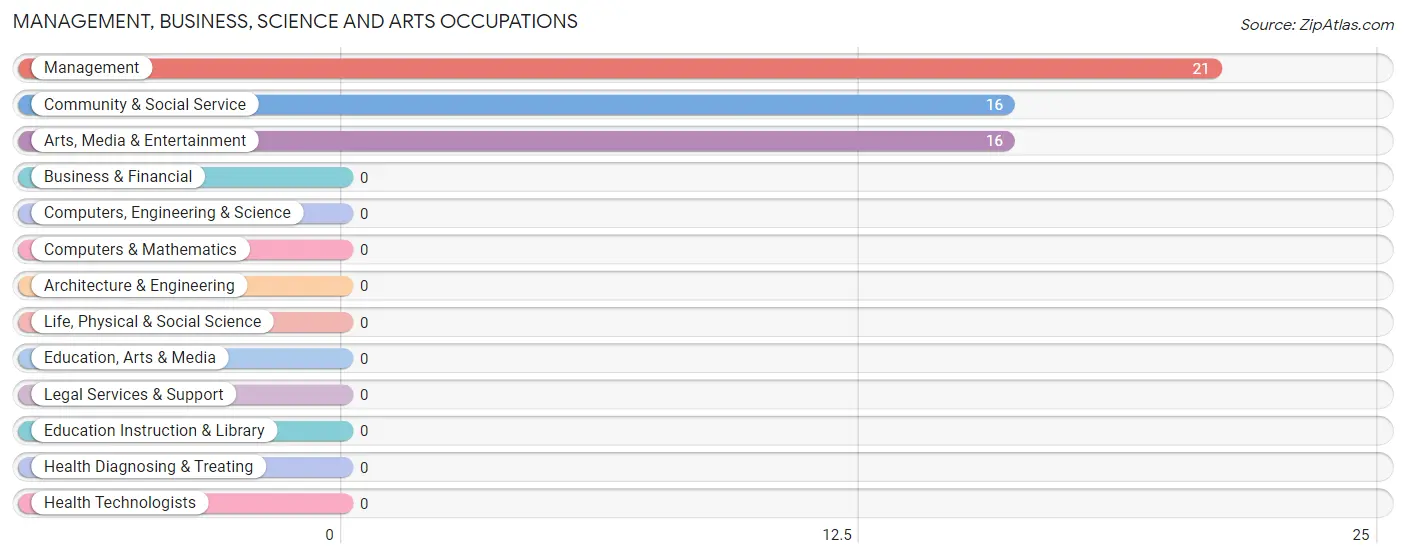
Management, Business, Science and Arts Occupations
The most common Management, Business, Science and Arts occupations in Dubois are Management (21 | 7.4%), Community & Social Service (16 | 5.6%), and Arts, Media & Entertainment (16 | 5.6%).
Management, Business, Science and Arts Occupations by Sex
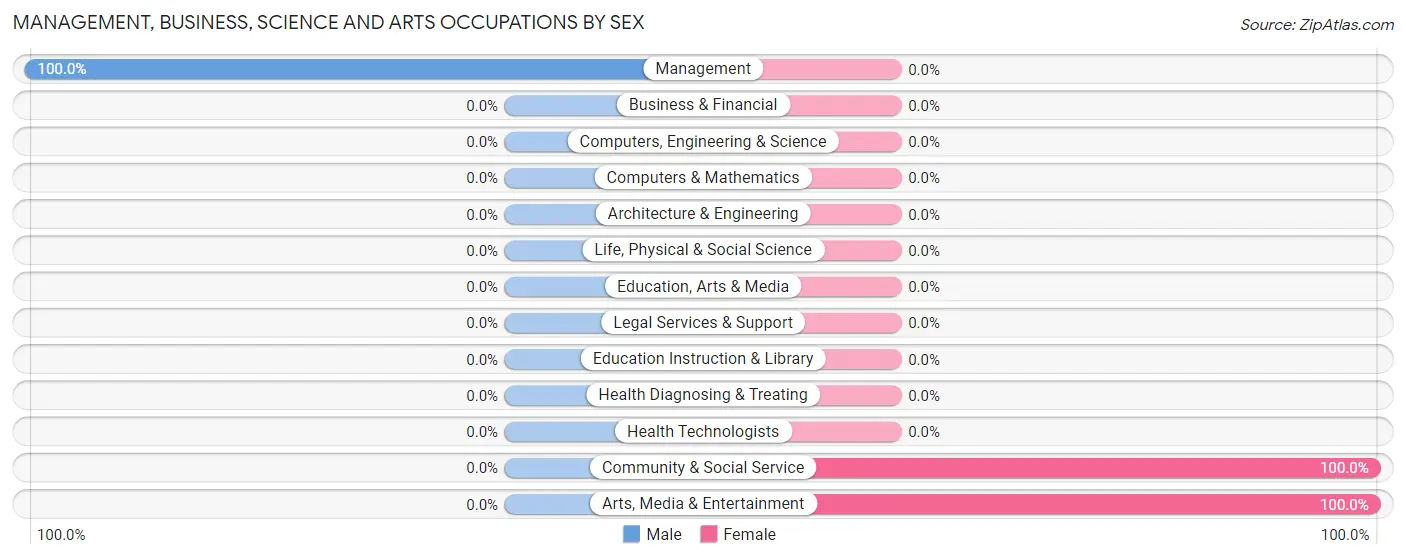
| Occupation | Male | Female |
| Management | 21 (100.0%) | 0 (0.0%) |
| Business & Financial | 0 (0.0%) | 0 (0.0%) |
| Computers, Engineering & Science | 0 (0.0%) | 0 (0.0%) |
| Computers & Mathematics | 0 (0.0%) | 0 (0.0%) |
| Architecture & Engineering | 0 (0.0%) | 0 (0.0%) |
| Life, Physical & Social Science | 0 (0.0%) | 0 (0.0%) |
| Community & Social Service | 0 (0.0%) | 16 (100.0%) |
| Education, Arts & Media | 0 (0.0%) | 0 (0.0%) |
| Legal Services & Support | 0 (0.0%) | 0 (0.0%) |
| Education Instruction & Library | 0 (0.0%) | 0 (0.0%) |
| Arts, Media & Entertainment | 0 (0.0%) | 16 (100.0%) |
| Health Diagnosing & Treating | 0 (0.0%) | 0 (0.0%) |
| Health Technologists | 0 (0.0%) | 0 (0.0%) |
| Total (Category) | 21 (56.8%) | 16 (43.2%) |
| Total (Overall) | 192 (67.4%) | 93 (32.6%) |
Services Occupations
Services Occupations by Sex
| Occupation | Male | Female |
| Healthcare Support | 0 (0.0%) | 0 (0.0%) |
| Security & Protection | 0 (0.0%) | 0 (0.0%) |
| Firefighting & Prevention | 0 (0.0%) | 0 (0.0%) |
| Law Enforcement | 0 (0.0%) | 0 (0.0%) |
| Food Preparation & Serving | 0 (0.0%) | 0 (0.0%) |
| Cleaning & Maintenance | 0 (0.0%) | 0 (0.0%) |
| Personal Care & Service | 0 (0.0%) | 0 (0.0%) |
| Total (Category) | 0 (0.0%) | 0 (0.0%) |
| Total (Overall) | 192 (67.4%) | 93 (32.6%) |
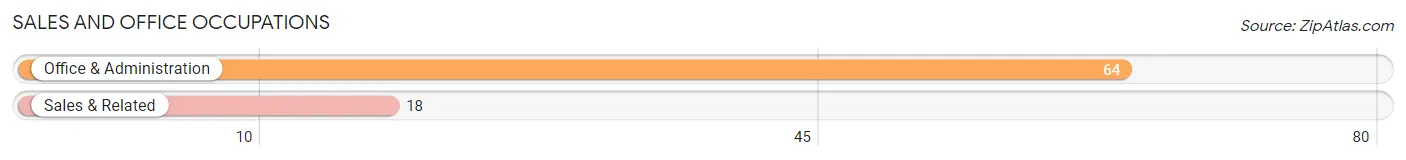
Sales and Office Occupations
The most common Sales and Office occupations in Dubois are Office & Administration (64 | 22.5%), and Sales & Related (18 | 6.3%).
Sales and Office Occupations by Sex
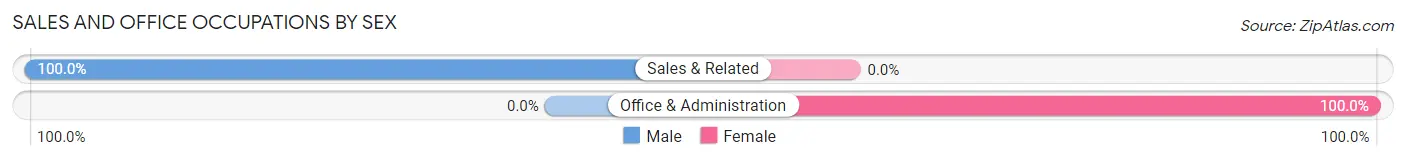
| Occupation | Male | Female |
| Sales & Related | 18 (100.0%) | 0 (0.0%) |
| Office & Administration | 0 (0.0%) | 64 (100.0%) |
| Total (Category) | 18 (22.0%) | 64 (78.0%) |
| Total (Overall) | 192 (67.4%) | 93 (32.6%) |
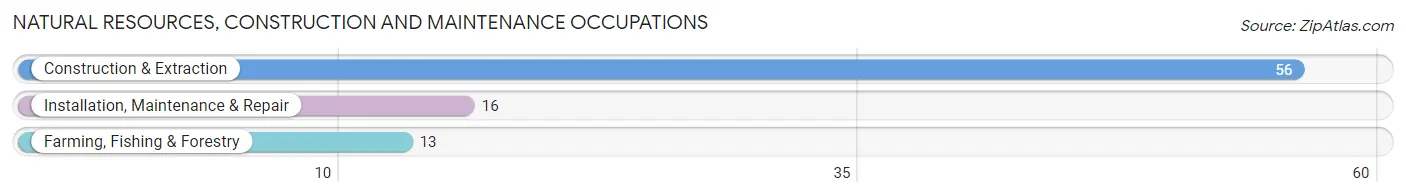
Natural Resources, Construction and Maintenance Occupations
The most common Natural Resources, Construction and Maintenance occupations in Dubois are Construction & Extraction (56 | 19.7%), Installation, Maintenance & Repair (16 | 5.6%), and Farming, Fishing & Forestry (13 | 4.6%).
Natural Resources, Construction and Maintenance Occupations by Sex
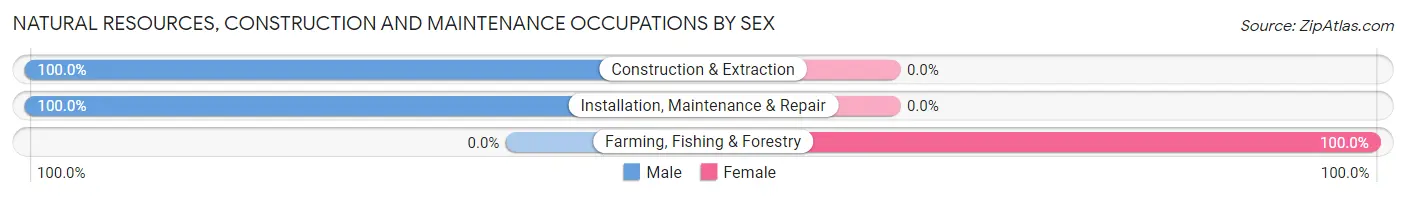
| Occupation | Male | Female |
| Farming, Fishing & Forestry | 0 (0.0%) | 13 (100.0%) |
| Construction & Extraction | 56 (100.0%) | 0 (0.0%) |
| Installation, Maintenance & Repair | 16 (100.0%) | 0 (0.0%) |
| Total (Category) | 72 (84.7%) | 13 (15.3%) |
| Total (Overall) | 192 (67.4%) | 93 (32.6%) |
Production, Transportation and Moving Occupations
The most common Production, Transportation and Moving occupations in Dubois are Transportation (59 | 20.7%), and Production (22 | 7.7%).
Production, Transportation and Moving Occupations by Sex
| Occupation | Male | Female |
| Production | 22 (100.0%) | 0 (0.0%) |
| Transportation | 59 (100.0%) | 0 (0.0%) |
| Material Moving | 0 (0.0%) | 0 (0.0%) |
| Total (Category) | 81 (100.0%) | 0 (0.0%) |
| Total (Overall) | 192 (67.4%) | 93 (32.6%) |
Employment Industries by Sex in Dubois
Employment Industries in Dubois
The major employment industries in Dubois include Health Care & Social Assistance (61 | 21.4%), Transportation & Warehousing (59 | 20.7%), Construction (56 | 19.7%), Manufacturing (56 | 19.7%), and Wholesale Trade (37 | 13.0%).
Employment Industries by Sex in Dubois
The Dubois industries that see more men than women are Construction (100.0%), Transportation & Warehousing (100.0%), and Manufacturing (76.8%), whereas the industries that tend to have a higher number of women are Accommodation & Food Services (100.0%), Health Care & Social Assistance (73.8%), and Wholesale Trade (51.3%).
| Industry | Male | Female |
| Agriculture, Fishing & Hunting | 0 (0.0%) | 0 (0.0%) |
| Mining, Quarrying, & Extraction | 0 (0.0%) | 0 (0.0%) |
| Construction | 56 (100.0%) | 0 (0.0%) |
| Manufacturing | 43 (76.8%) | 13 (23.2%) |
| Wholesale Trade | 18 (48.6%) | 19 (51.3%) |
| Retail Trade | 0 (0.0%) | 0 (0.0%) |
| Transportation & Warehousing | 59 (100.0%) | 0 (0.0%) |
| Utilities | 0 (0.0%) | 0 (0.0%) |
| Information | 0 (0.0%) | 0 (0.0%) |
| Finance & Insurance | 0 (0.0%) | 0 (0.0%) |
| Real Estate, Rental & Leasing | 0 (0.0%) | 0 (0.0%) |
| Professional & Scientific | 0 (0.0%) | 0 (0.0%) |
| Enterprise Management | 0 (0.0%) | 0 (0.0%) |
| Administrative & Support | 0 (0.0%) | 0 (0.0%) |
| Educational Services | 0 (0.0%) | 0 (0.0%) |
| Health Care & Social Assistance | 16 (26.2%) | 45 (73.8%) |
| Arts, Entertainment & Recreation | 0 (0.0%) | 0 (0.0%) |
| Accommodation & Food Services | 0 (0.0%) | 16 (100.0%) |
| Public Administration | 0 (0.0%) | 0 (0.0%) |
| Total | 192 (67.4%) | 93 (32.6%) |
Education in Dubois
School Enrollment in Dubois
The most common levels of schooling among the 52 students in Dubois are elementary school (32 | 61.5%), and middle school (20 | 38.5%).
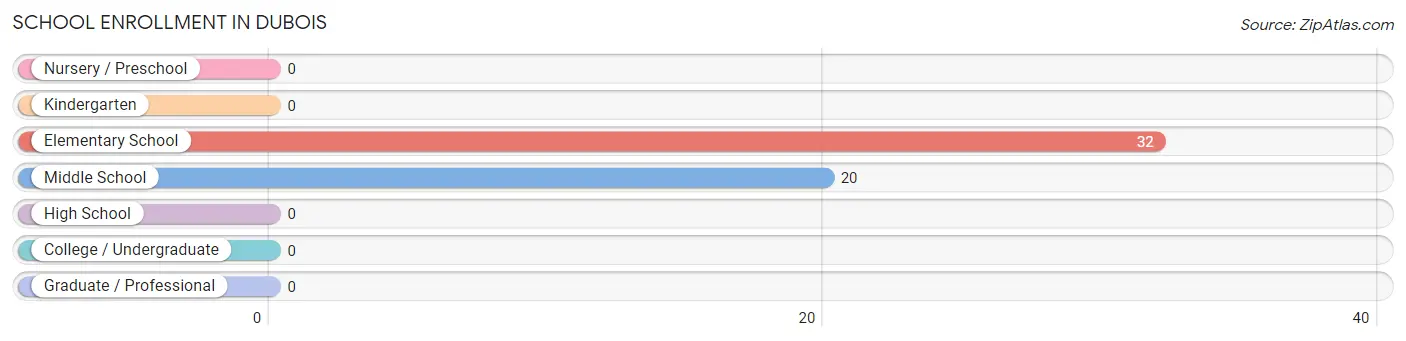
| School Level | # Students | % Students |
| Nursery / Preschool | 0 | 0.0% |
| Kindergarten | 0 | 0.0% |
| Elementary School | 32 | 61.5% |
| Middle School | 20 | 38.5% |
| High School | 0 | 0.0% |
| College / Undergraduate | 0 | 0.0% |
| Graduate / Professional | 0 | 0.0% |
| Total | 52 | 100.0% |
School Enrollment by Age by Funding Source in Dubois
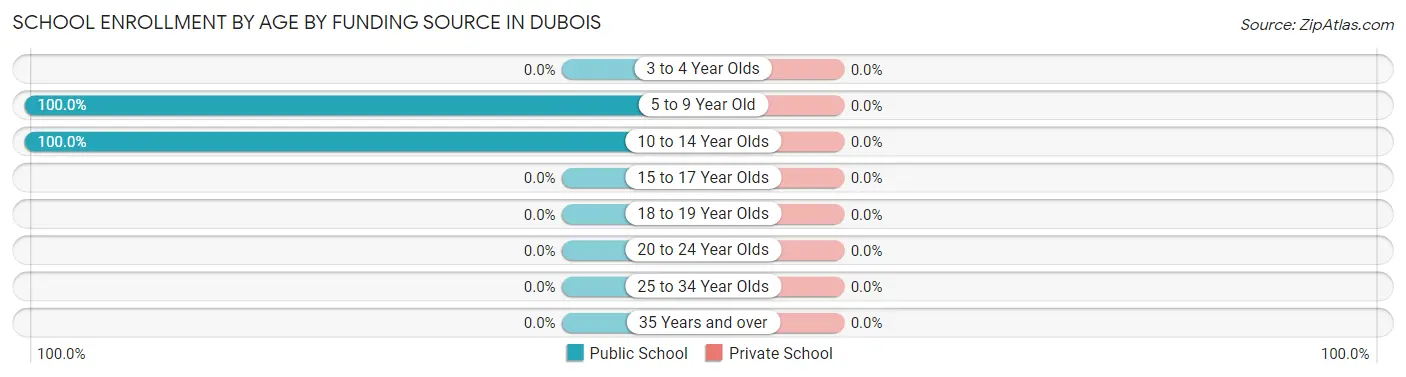
| Age Bracket | Public School | Private School |
| 3 to 4 Year Olds | 0 (0.0%) | 0 (0.0%) |
| 5 to 9 Year Old | 17 (100.0%) | 0 (0.0%) |
| 10 to 14 Year Olds | 35 (100.0%) | 0 (0.0%) |
| 15 to 17 Year Olds | 0 (0.0%) | 0 (0.0%) |
| 18 to 19 Year Olds | 0 (0.0%) | 0 (0.0%) |
| 20 to 24 Year Olds | 0 (0.0%) | 0 (0.0%) |
| 25 to 34 Year Olds | 0 (0.0%) | 0 (0.0%) |
| 35 Years and over | 0 (0.0%) | 0 (0.0%) |
| Total | 52 (100.0%) | 0 (0.0%) |
Educational Attainment by Field of Study in Dubois
Science & technology (31 | 39.7%), business (19 | 24.4%), education (16 | 20.5%), and psychology (12 | 15.4%) are the most common fields of study among 78 individuals in Dubois who have obtained a bachelor's degree or higher.
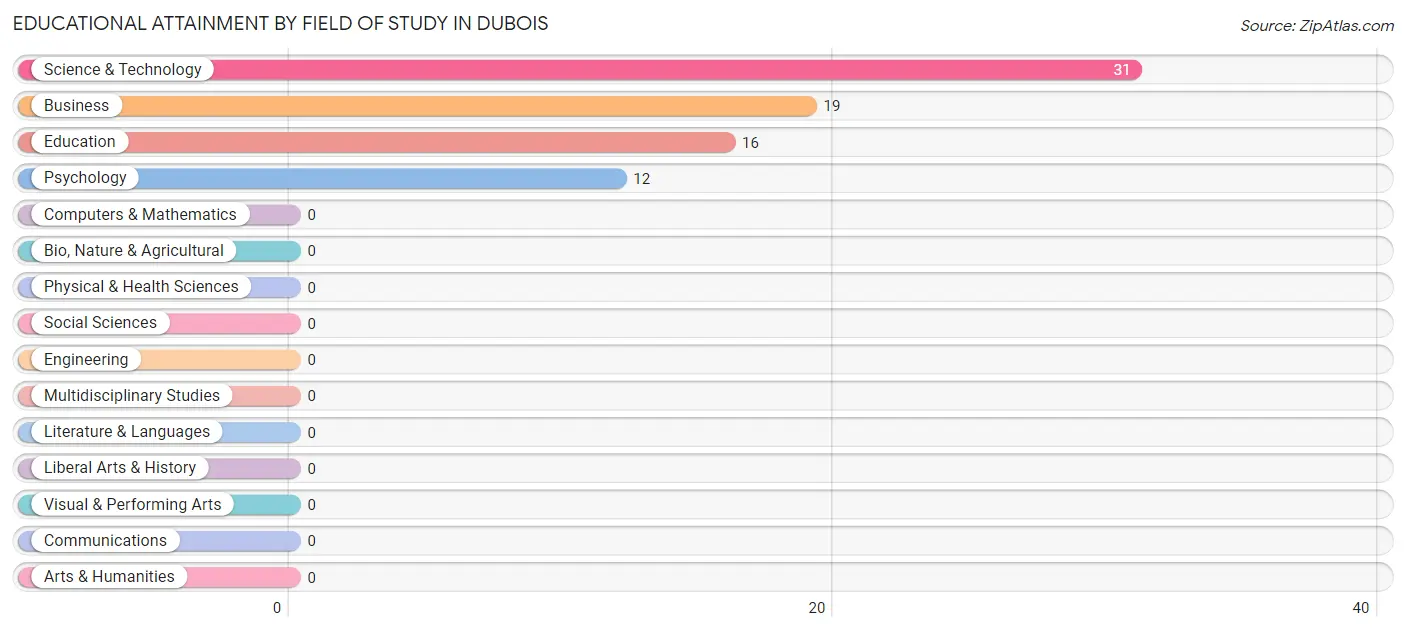
| Field of Study | # Graduates | % Graduates |
| Computers & Mathematics | 0 | 0.0% |
| Bio, Nature & Agricultural | 0 | 0.0% |
| Physical & Health Sciences | 0 | 0.0% |
| Psychology | 12 | 15.4% |
| Social Sciences | 0 | 0.0% |
| Engineering | 0 | 0.0% |
| Multidisciplinary Studies | 0 | 0.0% |
| Science & Technology | 31 | 39.7% |
| Business | 19 | 24.4% |
| Education | 16 | 20.5% |
| Literature & Languages | 0 | 0.0% |
| Liberal Arts & History | 0 | 0.0% |
| Visual & Performing Arts | 0 | 0.0% |
| Communications | 0 | 0.0% |
| Arts & Humanities | 0 | 0.0% |
| Total | 78 | 100.0% |
Transportation & Commute in Dubois
Vehicle Availability by Sex in Dubois
The most prevalent vehicle ownership categories in Dubois are males with 4 vehicles (59, accounting for 30.7%) and females with 4 vehicles (0, making up 63.4%).
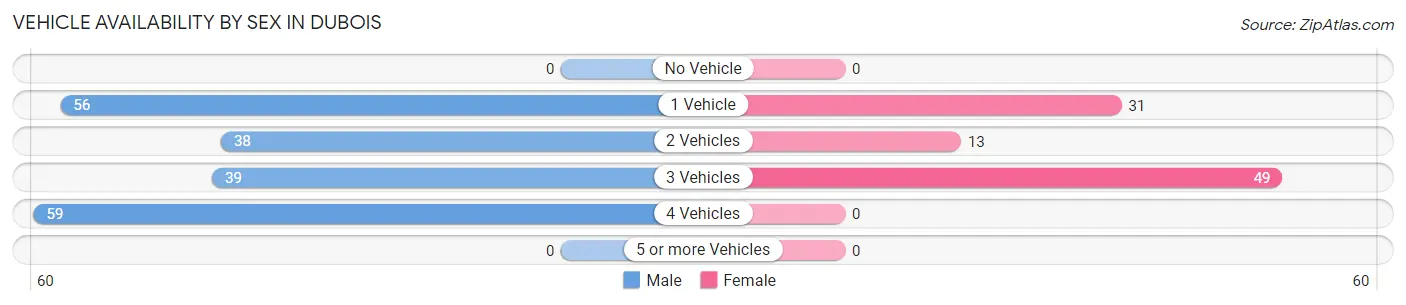
| Vehicles Available | Male | Female |
| No Vehicle | 0 (0.0%) | 0 (0.0%) |
| 1 Vehicle | 56 (29.2%) | 31 (33.3%) |
| 2 Vehicles | 38 (19.8%) | 13 (14.0%) |
| 3 Vehicles | 39 (20.3%) | 49 (52.7%) |
| 4 Vehicles | 59 (30.7%) | 0 (0.0%) |
| 5 or more Vehicles | 0 (0.0%) | 0 (0.0%) |
| Total | 192 (100.0%) | 93 (100.0%) |
Commute Time in Dubois
The most frequently occuring commute durations in Dubois are 15 to 19 minutes (109 commuters, 38.3%), 45 to 59 minutes (59 commuters, 20.7%), and 20 to 24 minutes (46 commuters, 16.1%).
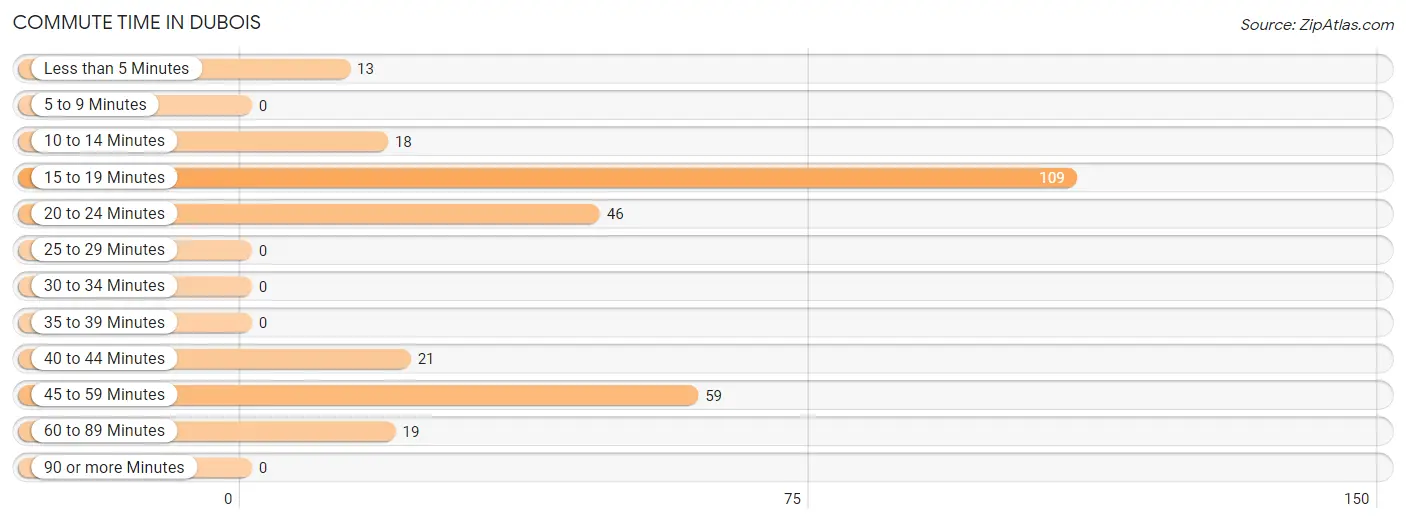
| Commute Time | # Commuters | % Commuters |
| Less than 5 Minutes | 13 | 4.6% |
| 5 to 9 Minutes | 0 | 0.0% |
| 10 to 14 Minutes | 18 | 6.3% |
| 15 to 19 Minutes | 109 | 38.3% |
| 20 to 24 Minutes | 46 | 16.1% |
| 25 to 29 Minutes | 0 | 0.0% |
| 30 to 34 Minutes | 0 | 0.0% |
| 35 to 39 Minutes | 0 | 0.0% |
| 40 to 44 Minutes | 21 | 7.4% |
| 45 to 59 Minutes | 59 | 20.7% |
| 60 to 89 Minutes | 19 | 6.7% |
| 90 or more Minutes | 0 | 0.0% |
Commute Time by Sex in Dubois
The most common commute times in Dubois are 15 to 19 minutes (78 commuters, 40.6%) for males and 15 to 19 minutes (31 commuters, 33.3%) for females.
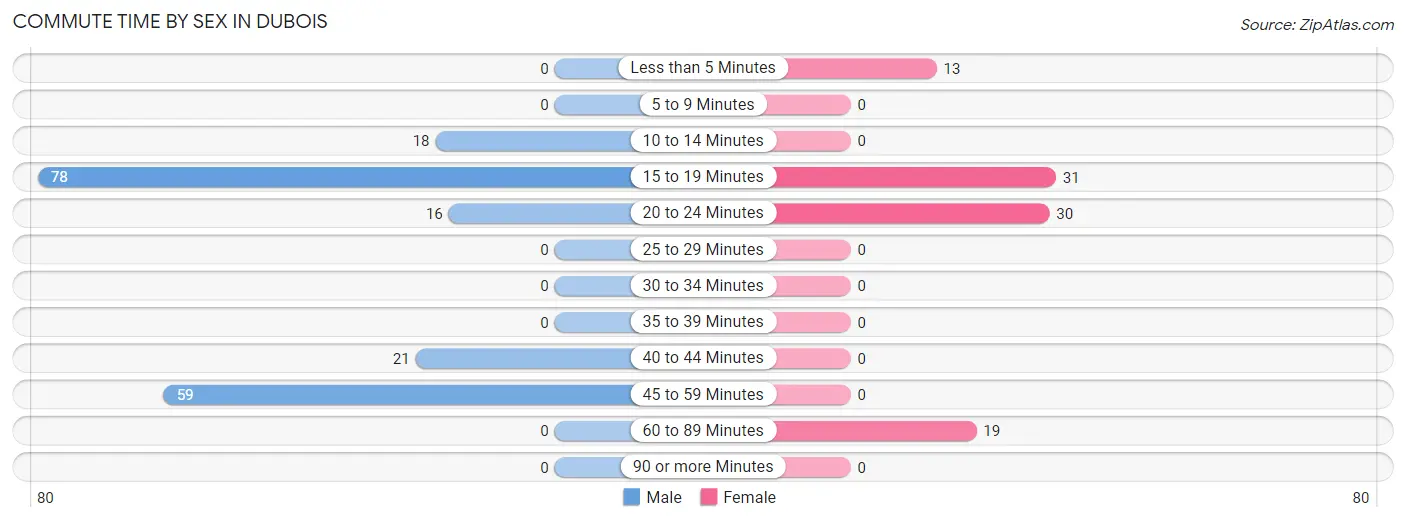
| Commute Time | Male | Female |
| Less than 5 Minutes | 0 (0.0%) | 13 (14.0%) |
| 5 to 9 Minutes | 0 (0.0%) | 0 (0.0%) |
| 10 to 14 Minutes | 18 (9.4%) | 0 (0.0%) |
| 15 to 19 Minutes | 78 (40.6%) | 31 (33.3%) |
| 20 to 24 Minutes | 16 (8.3%) | 30 (32.3%) |
| 25 to 29 Minutes | 0 (0.0%) | 0 (0.0%) |
| 30 to 34 Minutes | 0 (0.0%) | 0 (0.0%) |
| 35 to 39 Minutes | 0 (0.0%) | 0 (0.0%) |
| 40 to 44 Minutes | 21 (10.9%) | 0 (0.0%) |
| 45 to 59 Minutes | 59 (30.7%) | 0 (0.0%) |
| 60 to 89 Minutes | 0 (0.0%) | 19 (20.4%) |
| 90 or more Minutes | 0 (0.0%) | 0 (0.0%) |
Time of Departure to Work by Sex in Dubois
The most frequent times of departure to work in Dubois are 6:00 AM to 6:29 AM (59, 30.7%) for males and 4:00 PM to 11:59 PM (31, 33.3%) for females.
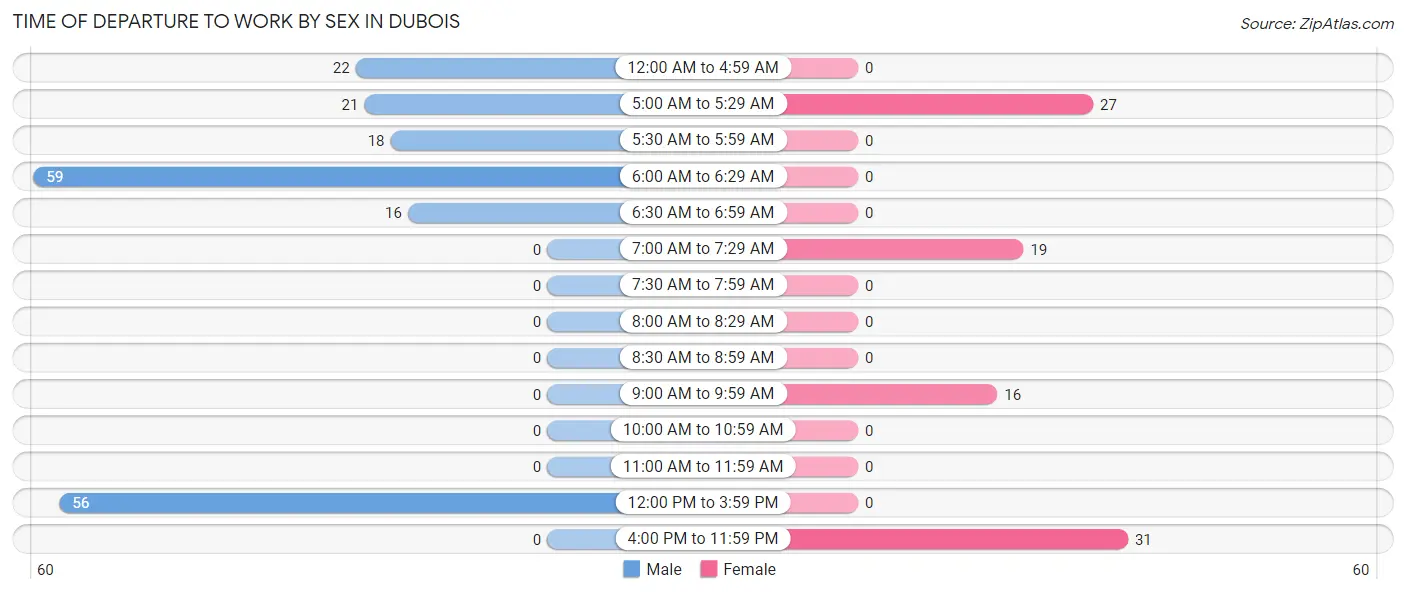
| Time of Departure | Male | Female |
| 12:00 AM to 4:59 AM | 22 (11.5%) | 0 (0.0%) |
| 5:00 AM to 5:29 AM | 21 (10.9%) | 27 (29.0%) |
| 5:30 AM to 5:59 AM | 18 (9.4%) | 0 (0.0%) |
| 6:00 AM to 6:29 AM | 59 (30.7%) | 0 (0.0%) |
| 6:30 AM to 6:59 AM | 16 (8.3%) | 0 (0.0%) |
| 7:00 AM to 7:29 AM | 0 (0.0%) | 19 (20.4%) |
| 7:30 AM to 7:59 AM | 0 (0.0%) | 0 (0.0%) |
| 8:00 AM to 8:29 AM | 0 (0.0%) | 0 (0.0%) |
| 8:30 AM to 8:59 AM | 0 (0.0%) | 0 (0.0%) |
| 9:00 AM to 9:59 AM | 0 (0.0%) | 16 (17.2%) |
| 10:00 AM to 10:59 AM | 0 (0.0%) | 0 (0.0%) |
| 11:00 AM to 11:59 AM | 0 (0.0%) | 0 (0.0%) |
| 12:00 PM to 3:59 PM | 56 (29.2%) | 0 (0.0%) |
| 4:00 PM to 11:59 PM | 0 (0.0%) | 31 (33.3%) |
| Total | 192 (100.0%) | 93 (100.0%) |
Housing Occupancy in Dubois
Occupancy by Ownership in Dubois
Of the total 195 dwellings in Dubois, owner-occupied units account for 105 (53.8%), while renter-occupied units make up 90 (46.2%).
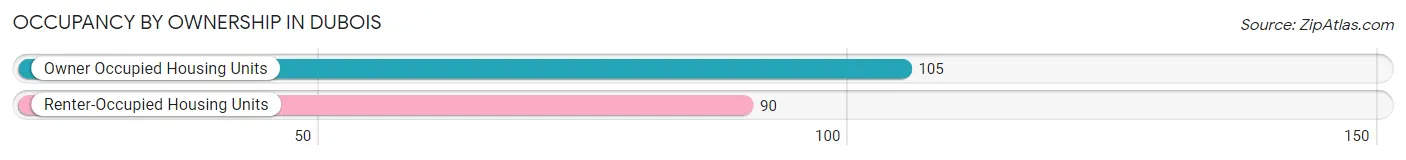
| Occupancy | # Housing Units | % Housing Units |
| Owner Occupied Housing Units | 105 | 53.8% |
| Renter-Occupied Housing Units | 90 | 46.2% |
| Total Occupied Housing Units | 195 | 100.0% |
Occupancy by Household Size in Dubois
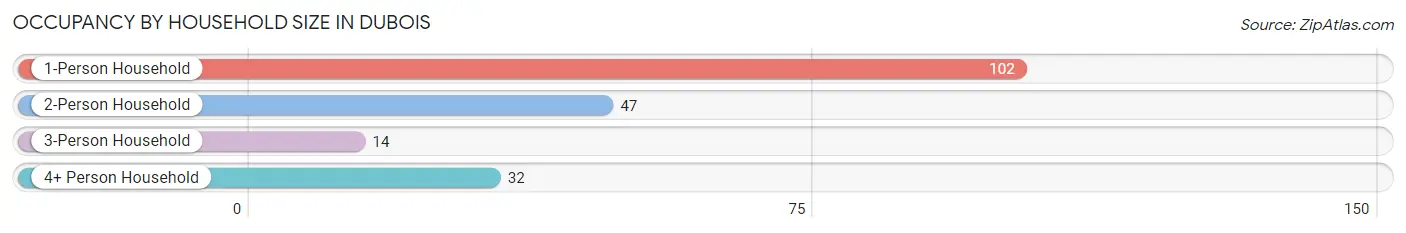
| Household Size | # Housing Units | % Housing Units |
| 1-Person Household | 102 | 52.3% |
| 2-Person Household | 47 | 24.1% |
| 3-Person Household | 14 | 7.2% |
| 4+ Person Household | 32 | 16.4% |
| Total Housing Units | 195 | 100.0% |
Occupancy by Ownership by Household Size in Dubois
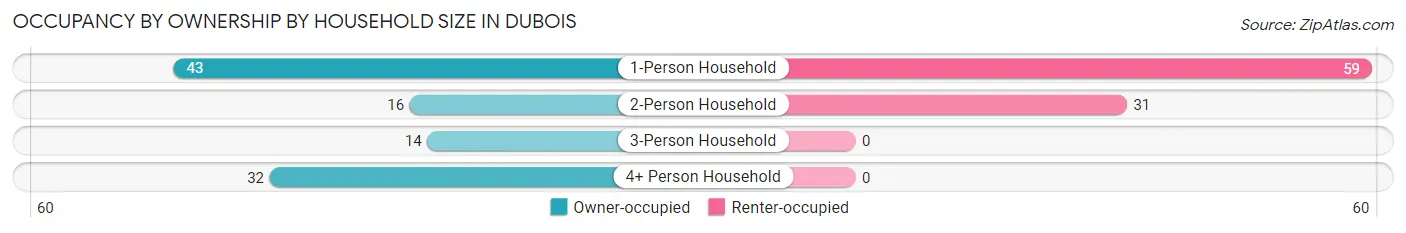
| Household Size | Owner-occupied | Renter-occupied |
| 1-Person Household | 43 (42.2%) | 59 (57.8%) |
| 2-Person Household | 16 (34.0%) | 31 (66.0%) |
| 3-Person Household | 14 (100.0%) | 0 (0.0%) |
| 4+ Person Household | 32 (100.0%) | 0 (0.0%) |
| Total Housing Units | 105 (53.8%) | 90 (46.2%) |
Occupancy by Educational Attainment in Dubois
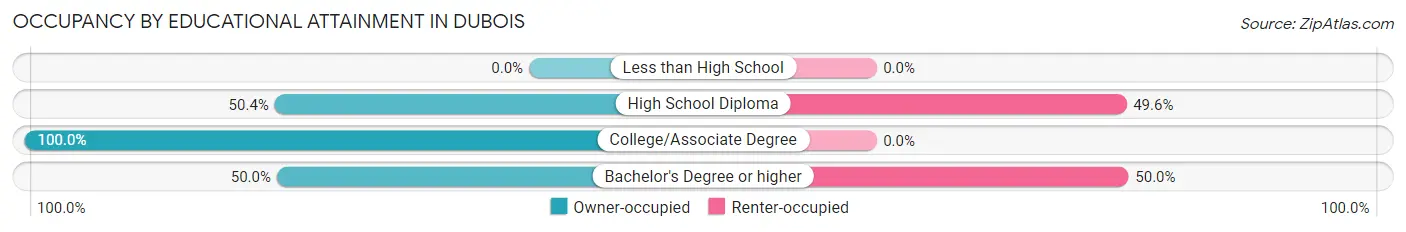
| Household Size | Owner-occupied | Renter-occupied |
| Less than High School | 0 (0.0%) | 0 (0.0%) |
| High School Diploma | 60 (50.4%) | 59 (49.6%) |
| College/Associate Degree | 14 (100.0%) | 0 (0.0%) |
| Bachelor's Degree or higher | 31 (50.0%) | 31 (50.0%) |
Occupancy by Age of Householder in Dubois
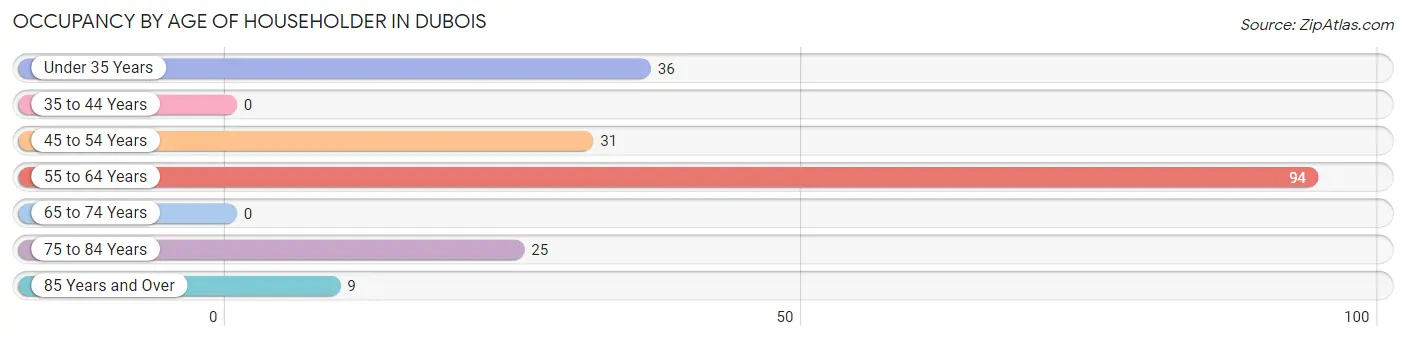
| Age Bracket | # Households | % Households |
| Under 35 Years | 36 | 18.5% |
| 35 to 44 Years | 0 | 0.0% |
| 45 to 54 Years | 31 | 15.9% |
| 55 to 64 Years | 94 | 48.2% |
| 65 to 74 Years | 0 | 0.0% |
| 75 to 84 Years | 25 | 12.8% |
| 85 Years and Over | 9 | 4.6% |
| Total | 195 | 100.0% |
Housing Finances in Dubois
Median Income by Occupancy in Dubois
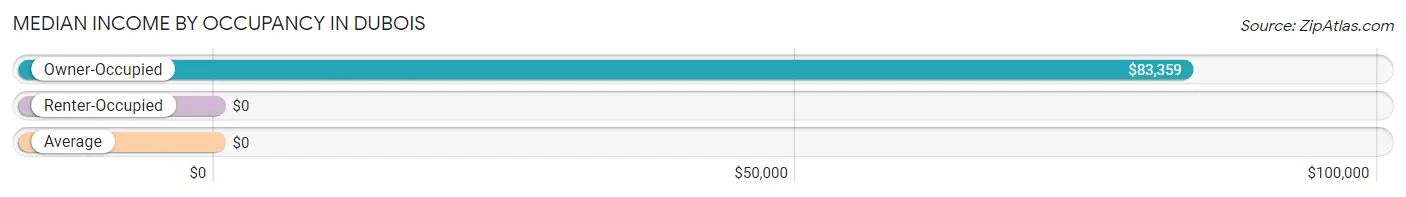
| Occupancy Type | # Households | Median Income |
| Owner-Occupied | 105 (53.8%) | $83,359 |
| Renter-Occupied | 90 (46.2%) | $0 |
| Average | 195 (100.0%) | $0 |
Occupancy by Householder Income Bracket in Dubois
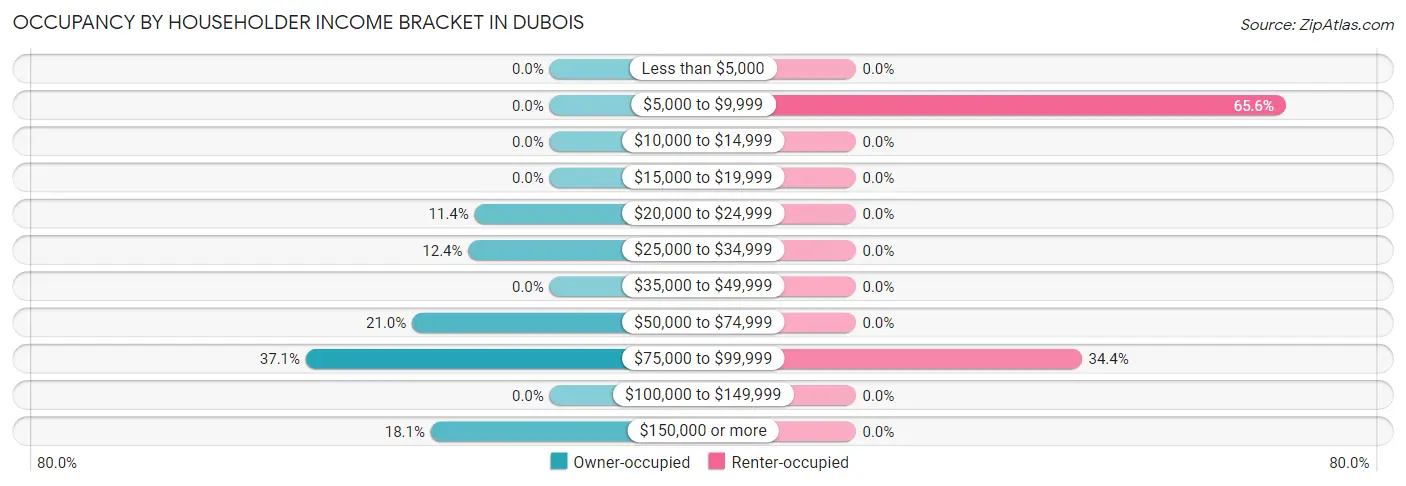
| Income Bracket | Owner-occupied | Renter-occupied |
| Less than $5,000 | 0 (0.0%) | 0 (0.0%) |
| $5,000 to $9,999 | 0 (0.0%) | 59 (65.6%) |
| $10,000 to $14,999 | 0 (0.0%) | 0 (0.0%) |
| $15,000 to $19,999 | 0 (0.0%) | 0 (0.0%) |
| $20,000 to $24,999 | 12 (11.4%) | 0 (0.0%) |
| $25,000 to $34,999 | 13 (12.4%) | 0 (0.0%) |
| $35,000 to $49,999 | 0 (0.0%) | 0 (0.0%) |
| $50,000 to $74,999 | 22 (20.9%) | 0 (0.0%) |
| $75,000 to $99,999 | 39 (37.1%) | 31 (34.4%) |
| $100,000 to $149,999 | 0 (0.0%) | 0 (0.0%) |
| $150,000 or more | 19 (18.1%) | 0 (0.0%) |
| Total | 105 (100.0%) | 90 (100.0%) |
Monthly Housing Cost Tiers in Dubois
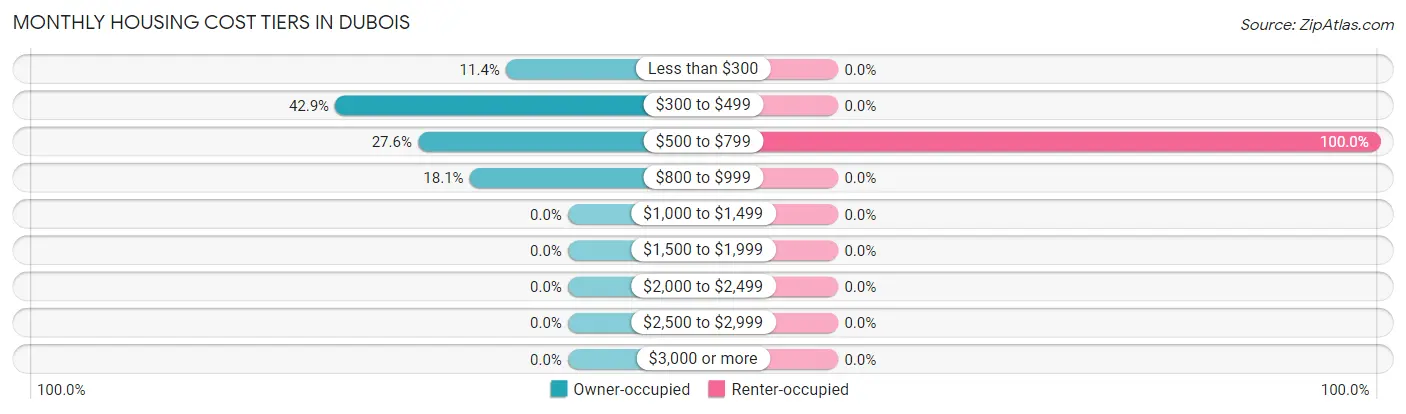
| Monthly Cost | Owner-occupied | Renter-occupied |
| Less than $300 | 12 (11.4%) | 0 (0.0%) |
| $300 to $499 | 45 (42.9%) | 0 (0.0%) |
| $500 to $799 | 29 (27.6%) | 90 (100.0%) |
| $800 to $999 | 19 (18.1%) | 0 (0.0%) |
| $1,000 to $1,499 | 0 (0.0%) | 0 (0.0%) |
| $1,500 to $1,999 | 0 (0.0%) | 0 (0.0%) |
| $2,000 to $2,499 | 0 (0.0%) | 0 (0.0%) |
| $2,500 to $2,999 | 0 (0.0%) | 0 (0.0%) |
| $3,000 or more | 0 (0.0%) | 0 (0.0%) |
| Total | 105 (100.0%) | 90 (100.0%) |
Physical Housing Characteristics in Dubois
Housing Structures in Dubois
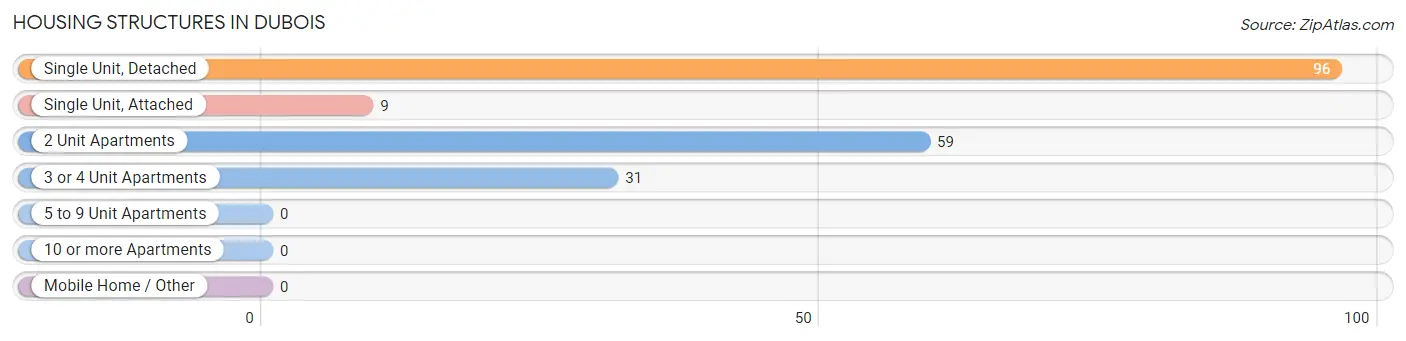
| Structure Type | # Housing Units | % Housing Units |
| Single Unit, Detached | 96 | 49.2% |
| Single Unit, Attached | 9 | 4.6% |
| 2 Unit Apartments | 59 | 30.3% |
| 3 or 4 Unit Apartments | 31 | 15.9% |
| 5 to 9 Unit Apartments | 0 | 0.0% |
| 10 or more Apartments | 0 | 0.0% |
| Mobile Home / Other | 0 | 0.0% |
| Total | 195 | 100.0% |
Housing Structures by Occupancy in Dubois
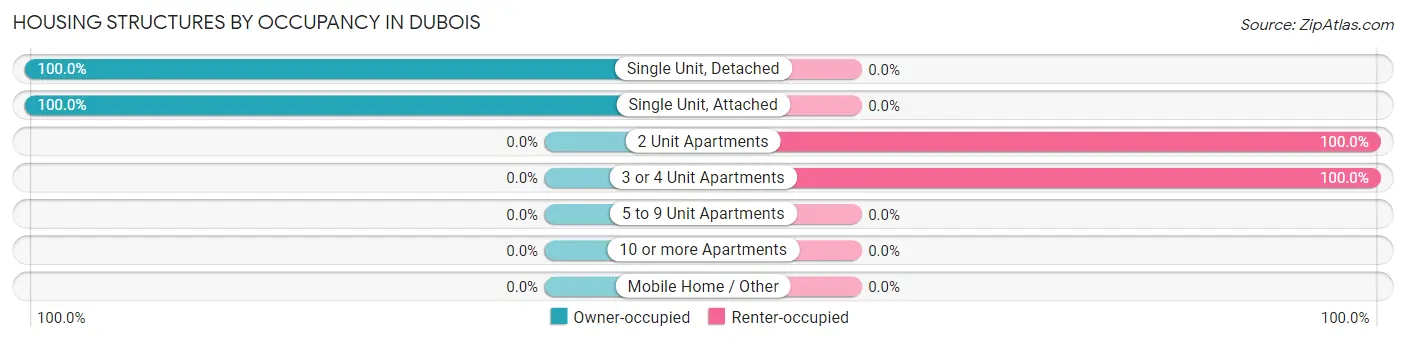
| Structure Type | Owner-occupied | Renter-occupied |
| Single Unit, Detached | 96 (100.0%) | 0 (0.0%) |
| Single Unit, Attached | 9 (100.0%) | 0 (0.0%) |
| 2 Unit Apartments | 0 (0.0%) | 59 (100.0%) |
| 3 or 4 Unit Apartments | 0 (0.0%) | 31 (100.0%) |
| 5 to 9 Unit Apartments | 0 (0.0%) | 0 (0.0%) |
| 10 or more Apartments | 0 (0.0%) | 0 (0.0%) |
| Mobile Home / Other | 0 (0.0%) | 0 (0.0%) |
| Total | 105 (53.8%) | 90 (46.2%) |
Housing Structures by Number of Rooms in Dubois
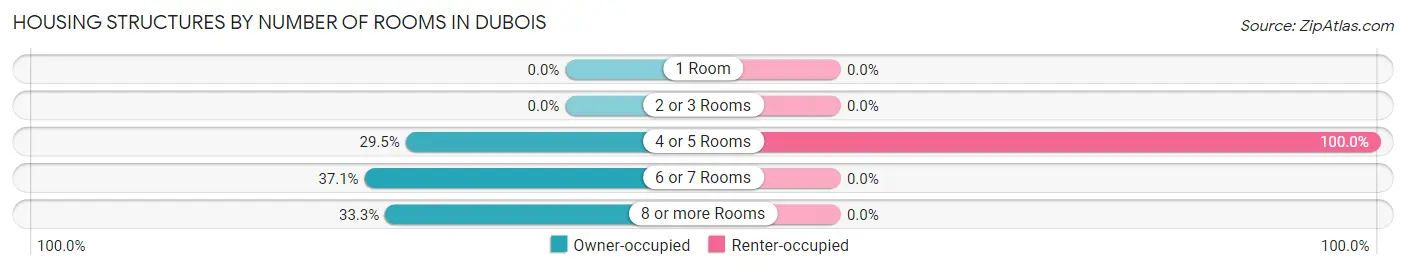
| Number of Rooms | Owner-occupied | Renter-occupied |
| 1 Room | 0 (0.0%) | 0 (0.0%) |
| 2 or 3 Rooms | 0 (0.0%) | 0 (0.0%) |
| 4 or 5 Rooms | 31 (29.5%) | 90 (100.0%) |
| 6 or 7 Rooms | 39 (37.1%) | 0 (0.0%) |
| 8 or more Rooms | 35 (33.3%) | 0 (0.0%) |
| Total | 105 (100.0%) | 90 (100.0%) |
Housing Structure by Heating Type in Dubois
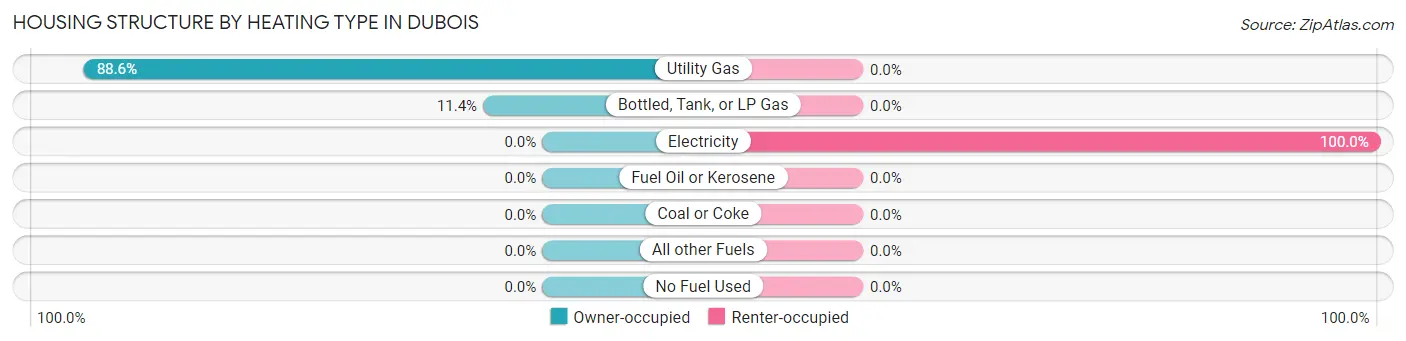
| Heating Type | Owner-occupied | Renter-occupied |
| Utility Gas | 93 (88.6%) | 0 (0.0%) |
| Bottled, Tank, or LP Gas | 12 (11.4%) | 0 (0.0%) |
| Electricity | 0 (0.0%) | 90 (100.0%) |
| Fuel Oil or Kerosene | 0 (0.0%) | 0 (0.0%) |
| Coal or Coke | 0 (0.0%) | 0 (0.0%) |
| All other Fuels | 0 (0.0%) | 0 (0.0%) |
| No Fuel Used | 0 (0.0%) | 0 (0.0%) |
| Total | 105 (100.0%) | 90 (100.0%) |
Household Vehicle Usage in Dubois
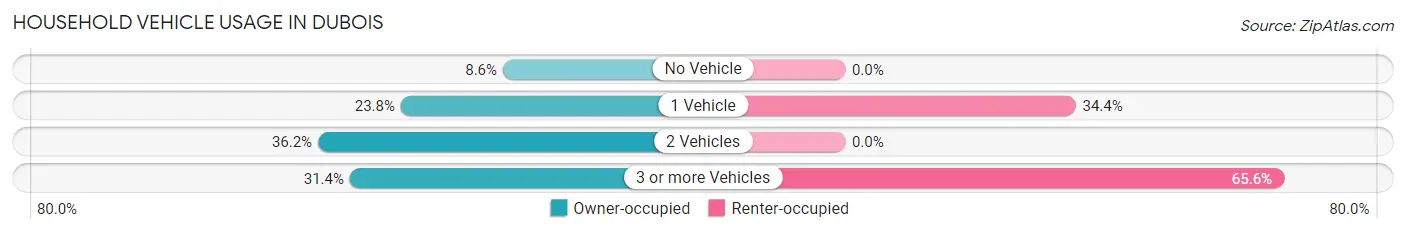
| Vehicles per Household | Owner-occupied | Renter-occupied |
| No Vehicle | 9 (8.6%) | 0 (0.0%) |
| 1 Vehicle | 25 (23.8%) | 31 (34.4%) |
| 2 Vehicles | 38 (36.2%) | 0 (0.0%) |
| 3 or more Vehicles | 33 (31.4%) | 59 (65.6%) |
| Total | 105 (100.0%) | 90 (100.0%) |
Real Estate & Mortgages in Dubois
Real Estate and Mortgage Overview in Dubois
| Characteristic | Without Mortgage | With Mortgage |
| Housing Units | 75 | 30 |
| Median Property Value | - | - |
| Median Household Income | $58,920 | $0 |
| Monthly Housing Costs | $439 | $0 |
| Real Estate Taxes | - | - |
Property Value by Mortgage Status in Dubois
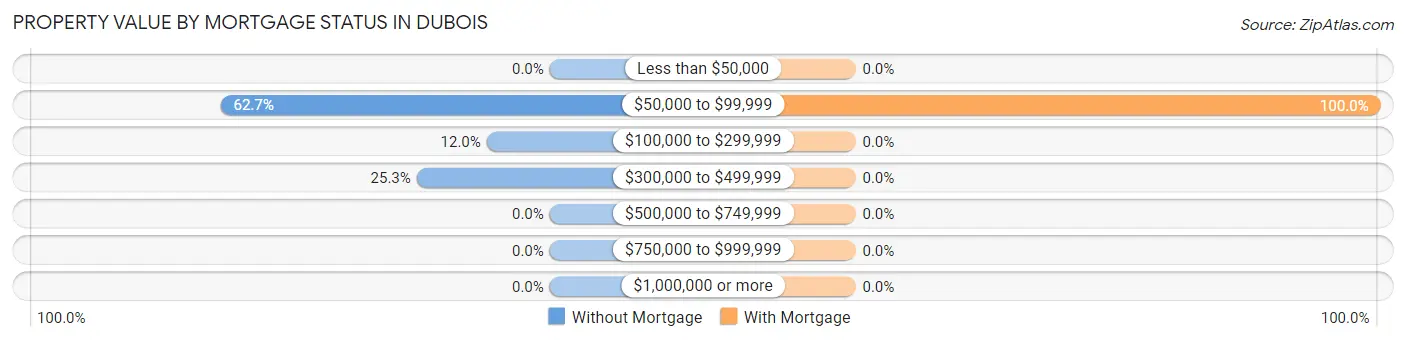
| Property Value | Without Mortgage | With Mortgage |
| Less than $50,000 | 0 (0.0%) | 0 (0.0%) |
| $50,000 to $99,999 | 47 (62.7%) | 30 (100.0%) |
| $100,000 to $299,999 | 9 (12.0%) | 0 (0.0%) |
| $300,000 to $499,999 | 19 (25.3%) | 0 (0.0%) |
| $500,000 to $749,999 | 0 (0.0%) | 0 (0.0%) |
| $750,000 to $999,999 | 0 (0.0%) | 0 (0.0%) |
| $1,000,000 or more | 0 (0.0%) | 0 (0.0%) |
| Total | 75 (100.0%) | 30 (100.0%) |
Household Income by Mortgage Status in Dubois
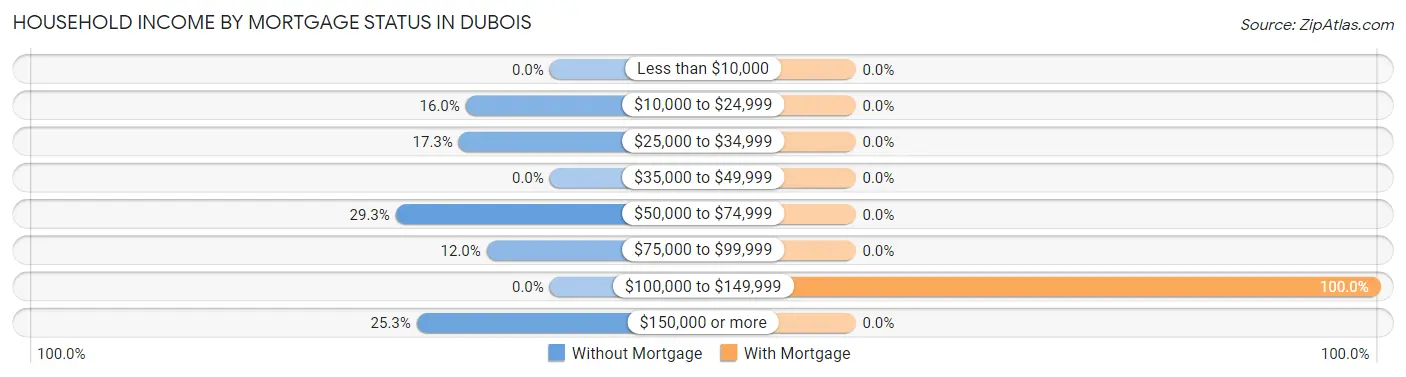
| Household Income | Without Mortgage | With Mortgage |
| Less than $10,000 | 0 (0.0%) | 0 (0.0%) |
| $10,000 to $24,999 | 12 (16.0%) | 0 (0.0%) |
| $25,000 to $34,999 | 13 (17.3%) | 0 (0.0%) |
| $35,000 to $49,999 | 0 (0.0%) | 0 (0.0%) |
| $50,000 to $74,999 | 22 (29.3%) | 0 (0.0%) |
| $75,000 to $99,999 | 9 (12.0%) | 0 (0.0%) |
| $100,000 to $149,999 | 0 (0.0%) | 30 (100.0%) |
| $150,000 or more | 19 (25.3%) | 0 (0.0%) |
| Total | 75 (100.0%) | 30 (100.0%) |
Property Value to Household Income Ratio in Dubois
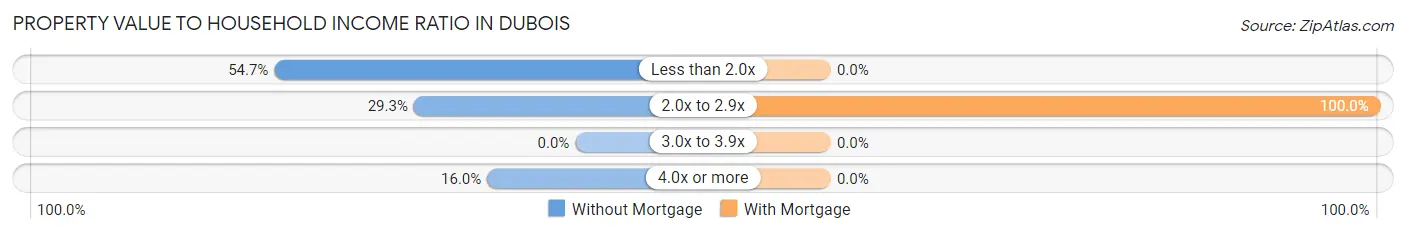
| Value-to-Income Ratio | Without Mortgage | With Mortgage |
| Less than 2.0x | 41 (54.7%) | 0 (0.0%) |
| 2.0x to 2.9x | 22 (29.3%) | 30 (100.0%) |
| 3.0x to 3.9x | 0 (0.0%) | 0 (0.0%) |
| 4.0x or more | 12 (16.0%) | 0 (0.0%) |
| Total | 75 (100.0%) | 30 (100.0%) |
Real Estate Taxes by Mortgage Status in Dubois
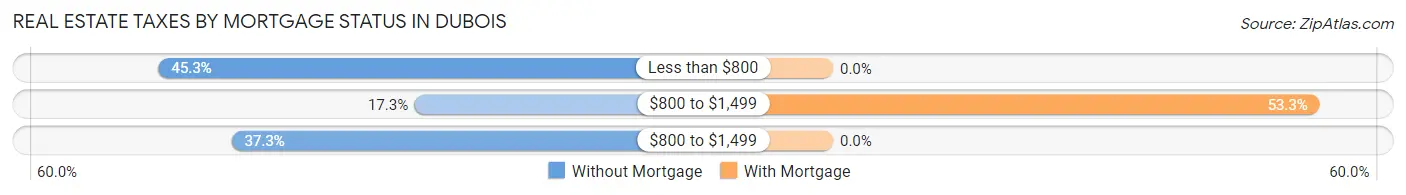
| Property Taxes | Without Mortgage | With Mortgage |
| Less than $800 | 34 (45.3%) | 0 (0.0%) |
| $800 to $1,499 | 13 (17.3%) | 16 (53.3%) |
| $800 to $1,499 | 28 (37.3%) | 0 (0.0%) |
| Total | 75 (100.0%) | 30 (100.0%) |
Health & Disability in Dubois
Health Insurance Coverage by Age in Dubois
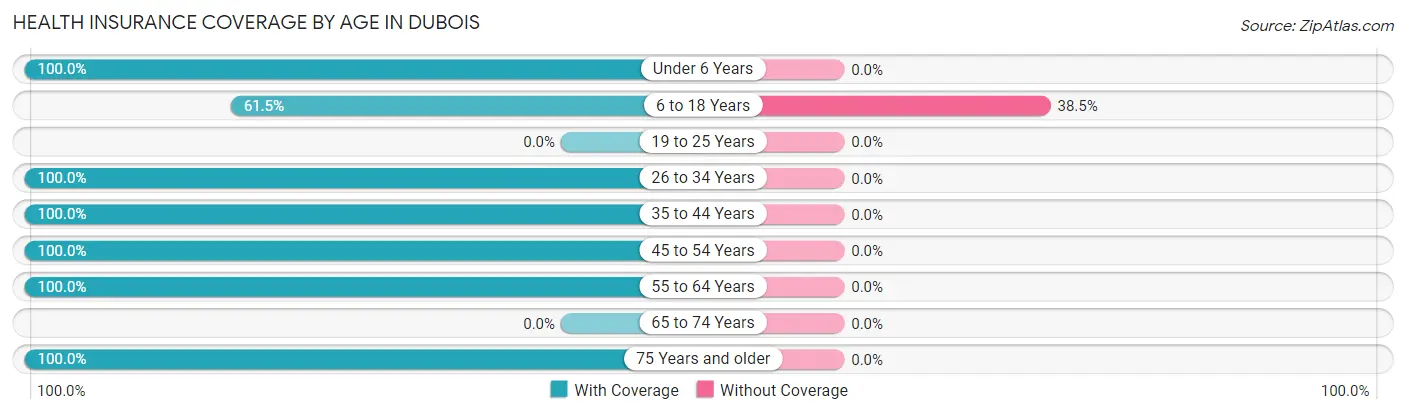
| Age Bracket | With Coverage | Without Coverage |
| Under 6 Years | 22 (100.0%) | 0 (0.0%) |
| 6 to 18 Years | 32 (61.5%) | 20 (38.5%) |
| 19 to 25 Years | 0 (0.0%) | 0 (0.0%) |
| 26 to 34 Years | 52 (100.0%) | 0 (0.0%) |
| 35 to 44 Years | 74 (100.0%) | 0 (0.0%) |
| 45 to 54 Years | 44 (100.0%) | 0 (0.0%) |
| 55 to 64 Years | 115 (100.0%) | 0 (0.0%) |
| 65 to 74 Years | 0 (0.0%) | 0 (0.0%) |
| 75 Years and older | 48 (100.0%) | 0 (0.0%) |
| Total | 387 (95.1%) | 20 (4.9%) |
Health Insurance Coverage by Citizenship Status in Dubois
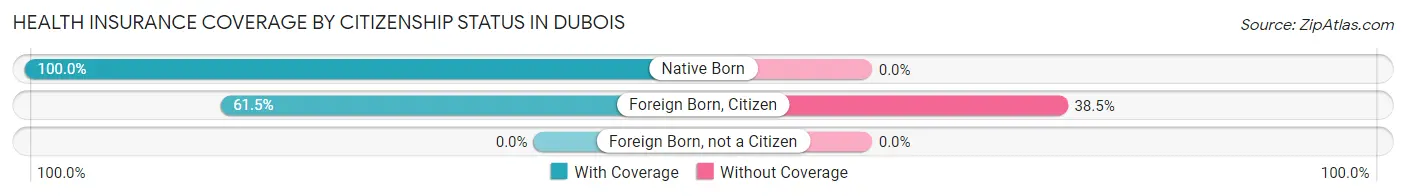
| Citizenship Status | With Coverage | Without Coverage |
| Native Born | 22 (100.0%) | 0 (0.0%) |
| Foreign Born, Citizen | 32 (61.5%) | 20 (38.5%) |
| Foreign Born, not a Citizen | 0 (0.0%) | 0 (0.0%) |
Health Insurance Coverage by Household Income in Dubois
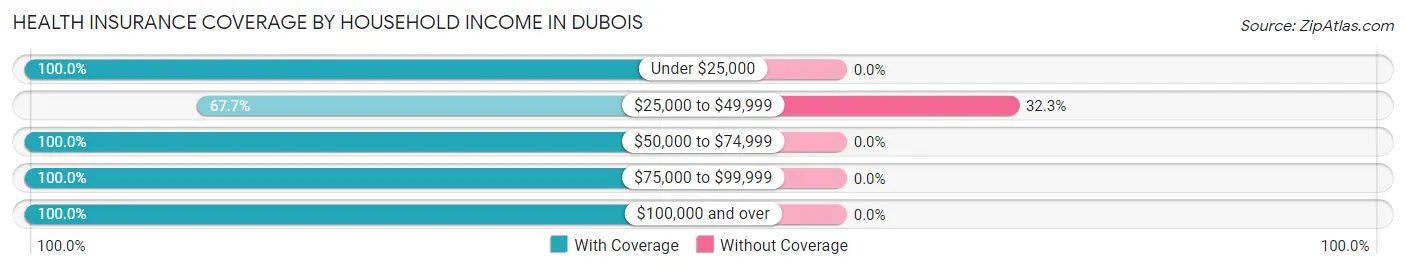
| Household Income | With Coverage | Without Coverage |
| Under $25,000 | 71 (100.0%) | 0 (0.0%) |
| $25,000 to $49,999 | 42 (67.7%) | 20 (32.3%) |
| $50,000 to $74,999 | 22 (100.0%) | 0 (0.0%) |
| $75,000 to $99,999 | 179 (100.0%) | 0 (0.0%) |
| $100,000 and over | 73 (100.0%) | 0 (0.0%) |
Public vs Private Health Insurance Coverage by Age in Dubois
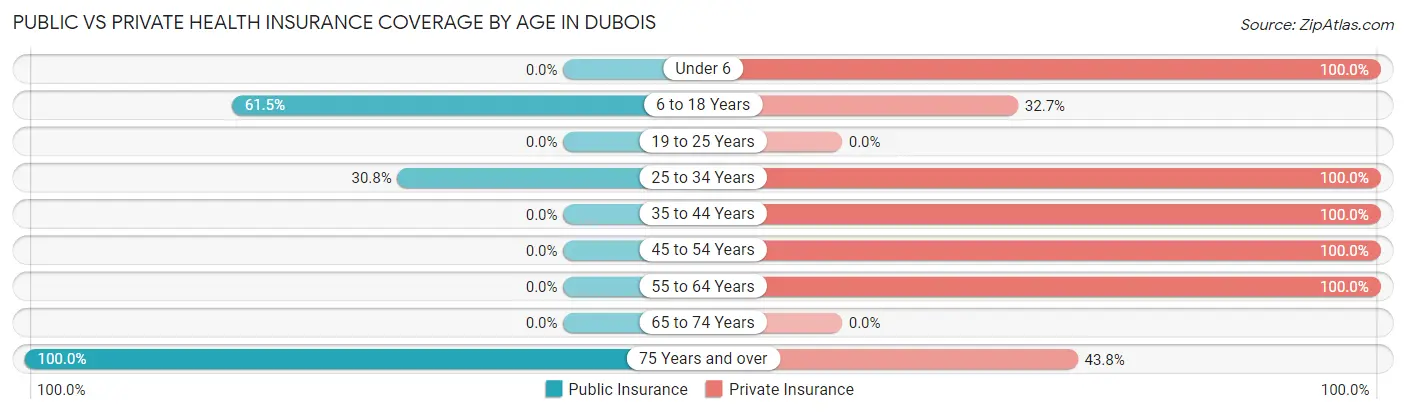
| Age Bracket | Public Insurance | Private Insurance |
| Under 6 | 0 (0.0%) | 22 (100.0%) |
| 6 to 18 Years | 32 (61.5%) | 17 (32.7%) |
| 19 to 25 Years | 0 (0.0%) | 0 (0.0%) |
| 25 to 34 Years | 16 (30.8%) | 52 (100.0%) |
| 35 to 44 Years | 0 (0.0%) | 74 (100.0%) |
| 45 to 54 Years | 0 (0.0%) | 44 (100.0%) |
| 55 to 64 Years | 0 (0.0%) | 115 (100.0%) |
| 65 to 74 Years | 0 (0.0%) | 0 (0.0%) |
| 75 Years and over | 48 (100.0%) | 21 (43.8%) |
| Total | 96 (23.6%) | 345 (84.8%) |
Disability Status by Sex by Age in Dubois
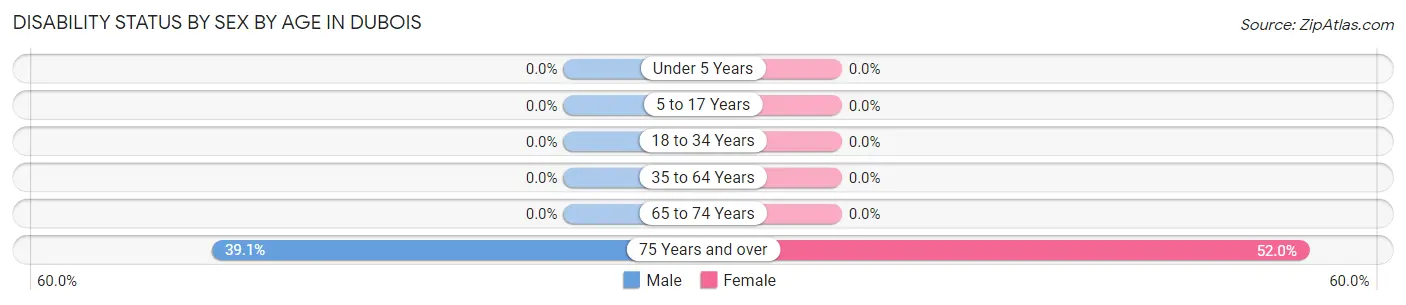
| Age Bracket | Male | Female |
| Under 5 Years | 0 (0.0%) | 0 (0.0%) |
| 5 to 17 Years | 0 (0.0%) | 0 (0.0%) |
| 18 to 34 Years | 0 (0.0%) | 0 (0.0%) |
| 35 to 64 Years | 0 (0.0%) | 0 (0.0%) |
| 65 to 74 Years | 0 (0.0%) | 0 (0.0%) |
| 75 Years and over | 9 (39.1%) | 13 (52.0%) |
Disability Class by Sex by Age in Dubois
Disability Class: Hearing Difficulty
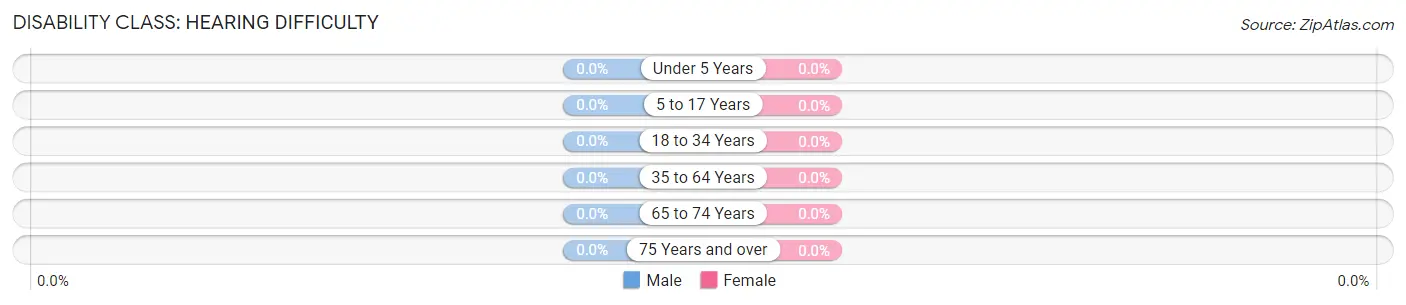
| Age Bracket | Male | Female |
| Under 5 Years | 0 (0.0%) | 0 (0.0%) |
| 5 to 17 Years | 0 (0.0%) | 0 (0.0%) |
| 18 to 34 Years | 0 (0.0%) | 0 (0.0%) |
| 35 to 64 Years | 0 (0.0%) | 0 (0.0%) |
| 65 to 74 Years | 0 (0.0%) | 0 (0.0%) |
| 75 Years and over | 0 (0.0%) | 0 (0.0%) |
Disability Class: Vision Difficulty
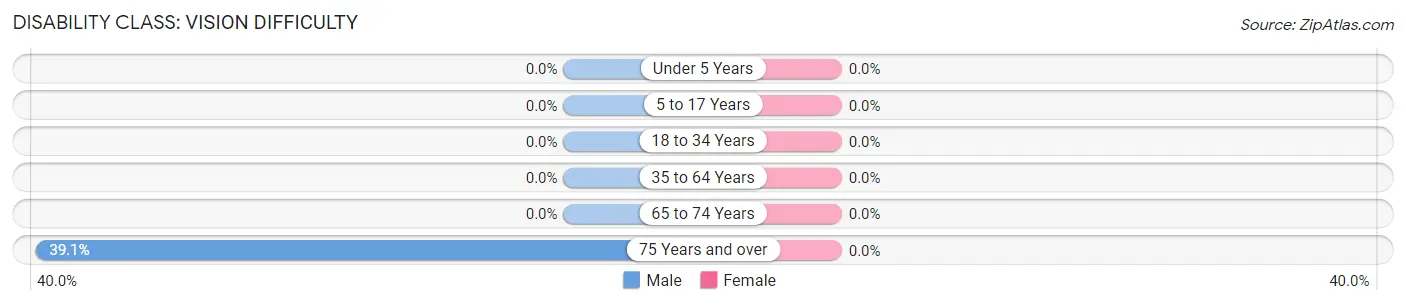
| Age Bracket | Male | Female |
| Under 5 Years | 0 (0.0%) | 0 (0.0%) |
| 5 to 17 Years | 0 (0.0%) | 0 (0.0%) |
| 18 to 34 Years | 0 (0.0%) | 0 (0.0%) |
| 35 to 64 Years | 0 (0.0%) | 0 (0.0%) |
| 65 to 74 Years | 0 (0.0%) | 0 (0.0%) |
| 75 Years and over | 9 (39.1%) | 0 (0.0%) |
Disability Class: Cognitive Difficulty
| Age Bracket | Male | Female |
| 5 to 17 Years | 0 (0.0%) | 0 (0.0%) |
| 18 to 34 Years | 0 (0.0%) | 0 (0.0%) |
| 35 to 64 Years | 0 (0.0%) | 0 (0.0%) |
| 65 to 74 Years | 0 (0.0%) | 0 (0.0%) |
| 75 Years and over | 0 (0.0%) | 0 (0.0%) |
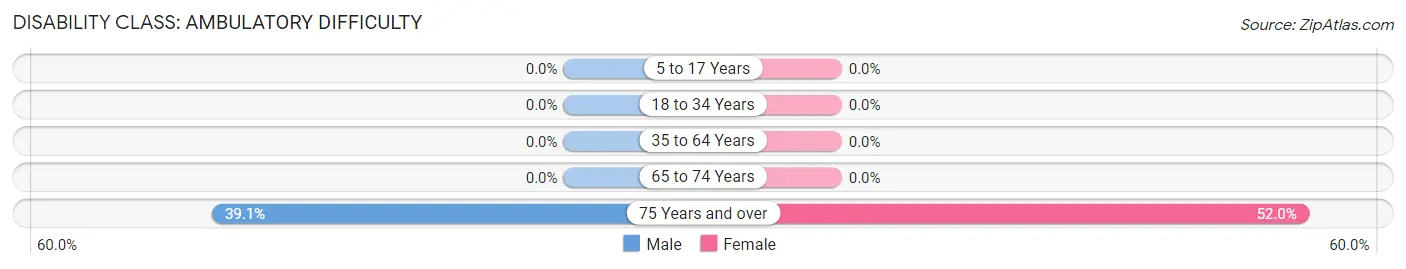
Disability Class: Ambulatory Difficulty
| Age Bracket | Male | Female |
| 5 to 17 Years | 0 (0.0%) | 0 (0.0%) |
| 18 to 34 Years | 0 (0.0%) | 0 (0.0%) |
| 35 to 64 Years | 0 (0.0%) | 0 (0.0%) |
| 65 to 74 Years | 0 (0.0%) | 0 (0.0%) |
| 75 Years and over | 9 (39.1%) | 13 (52.0%) |
Disability Class: Self-Care Difficulty
| Age Bracket | Male | Female |
| 5 to 17 Years | 0 (0.0%) | 0 (0.0%) |
| 18 to 34 Years | 0 (0.0%) | 0 (0.0%) |
| 35 to 64 Years | 0 (0.0%) | 0 (0.0%) |
| 65 to 74 Years | 0 (0.0%) | 0 (0.0%) |
| 75 Years and over | 0 (0.0%) | 0 (0.0%) |
Technology Access in Dubois
Computing Device Access in Dubois
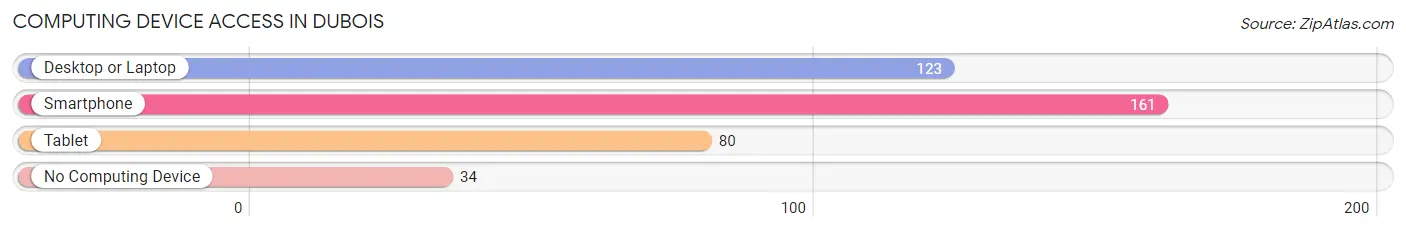
| Device Type | # Households | % Households |
| Desktop or Laptop | 123 | 63.1% |
| Smartphone | 161 | 82.6% |
| Tablet | 80 | 41.0% |
| No Computing Device | 34 | 17.4% |
| Total | 195 | 100.0% |
Internet Access in Dubois
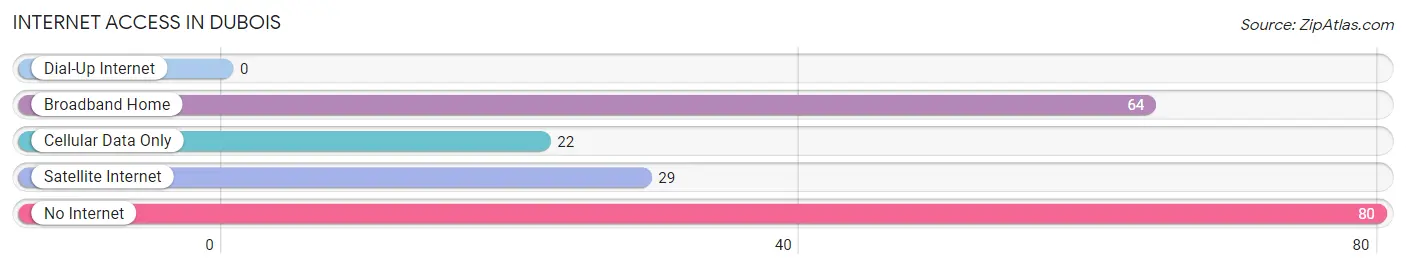
| Internet Type | # Households | % Households |
| Dial-Up Internet | 0 | 0.0% |
| Broadband Home | 64 | 32.8% |
| Cellular Data Only | 22 | 11.3% |
| Satellite Internet | 29 | 14.9% |
| No Internet | 80 | 41.0% |
| Total | 195 | 100.0% |
Dubois Summary
History
DuBois, Indiana is a small town located in the southwestern corner of the state, in the county of Dubois. It was founded in 1818 by a group of settlers from Kentucky, led by William DuBois. The town was named after him, and it has been a part of the state ever since.
The town was originally a farming community, and it was known for its production of corn, wheat, and other grains. In the late 19th century, the town began to grow and develop, and it became a center for industry. The first industry to come to the town was a sawmill, which was built in 1876. This was followed by a flour mill, a brickyard, and a furniture factory.
The town continued to grow and develop throughout the 20th century, and it became a popular tourist destination. The town is home to several historic sites, including the Dubois County Courthouse, the Dubois County Museum, and the Dubois County Historical Society.
Geography
DuBois is located in the southwestern corner of Indiana, in the county of Dubois. It is situated on the banks of the Patoka River, and it is surrounded by rolling hills and farmland. The town is located about 30 miles from the city of Evansville, and it is about an hour and a half drive from Indianapolis.
The town has a total area of 1.3 square miles, and it has a population of approximately 1,500 people. The town is served by two major highways, US 231 and US 50.
Economy
The economy of DuBois is largely based on agriculture and tourism. The town is home to several farms, and it is known for its production of corn, wheat, and other grains. The town is also home to several small businesses, including restaurants, shops, and other services.
The town is also a popular tourist destination, and it is home to several historic sites, including the Dubois County Courthouse, the Dubois County Museum, and the Dubois County Historical Society. The town is also home to several festivals and events throughout the year, including the Dubois County Fair and the Dubois County Music Festival.
Demographics
As of the 2010 census, the population of DuBois was 1,500 people. The racial makeup of the town was 97.3% White, 0.7% African American, 0.3% Native American, 0.3% Asian, and 1.3% from other races. The median household income was $37,500, and the median family income was $45,000. The per capita income was $18,000.
Conclusion
DuBois, Indiana is a small town located in the southwestern corner of the state, in the county of Dubois. It was founded in 1818 by a group of settlers from Kentucky, and it has been a part of the state ever since. The town is known for its production of corn, wheat, and other grains, and it is also a popular tourist destination. The town has a population of approximately 1,500 people, and the median household income is $37,500. The town is served by two major highways, US 231 and US 50, and it is home to several historic sites, including the Dubois County Courthouse, the Dubois County Museum, and the Dubois County Historical Society.
Common Questions
What is Per Capita Income in Dubois?
Per Capita income in Dubois is $39,047.
What is the Median Family Income in Dubois?
Median Family Income in Dubois is $82,891.
What is Income or Wage Gap in Dubois?
Income or Wage Gap in Dubois is 45.6%.
Women in Dubois earn 54.4 cents for every dollar earned by a man.
What is Inequality or Gini Index in Dubois?
Inequality or Gini Index in Dubois is 0.54.
What is the Total Population of Dubois?
Total Population of Dubois is 407.
What is the Total Male Population of Dubois?
Total Male Population of Dubois is 269.
What is the Total Female Population of Dubois?
Total Female Population of Dubois is 138.
What is the Ratio of Males per 100 Females in Dubois?
There are 194.93 Males per 100 Females in Dubois.
What is the Ratio of Females per 100 Males in Dubois?
There are 51.30 Females per 100 Males in Dubois.
What is the Median Population Age in Dubois?
Median Population Age in Dubois is 46.1 Years.
What is the Average Family Size in Dubois
Average Family Size in Dubois is 3.3 People.
What is the Average Household Size in Dubois
Average Household Size in Dubois is 2.1 People.
How Large is the Labor Force in Dubois?
There are 285 People in the Labor Forcein in Dubois.
What is the Percentage of People in the Labor Force in Dubois?
85.6% of People are in the Labor Force in Dubois.