St Leon, IN Map & Demographics
St Leon Map
St Leon Overview
$31,241
PER CAPITA INCOME
$85,625
AVG FAMILY INCOME
$77,917
AVG HOUSEHOLD INCOME
24.2%
WAGE / INCOME GAP [ % ]
75.8¢/ $1
WAGE / INCOME GAP [ $ ]
0.45
INEQUALITY / GINI INDEX
1,079
TOTAL POPULATION
531
MALE POPULATION
548
FEMALE POPULATION
96.90
MALES / 100 FEMALES
103.20
FEMALES / 100 MALES
29.2
MEDIAN AGE
3.9
AVG FAMILY SIZE
3.4
AVG HOUSEHOLD SIZE
464
LABOR FORCE [ PEOPLE ]
55.9%
PERCENT IN LABOR FORCE
0.4%
UNEMPLOYMENT RATE
Income in St Leon
Income Overview in St Leon
Per Capita Income in St Leon is $31,241, while median incomes of families and households are $85,625 and $77,917 respectively.
| Characteristic | Number | Measure |
| Per Capita Income | 1,079 | $31,241 |
| Median Family Income | 252 | $85,625 |
| Mean Family Income | 252 | $118,310 |
| Median Household Income | 319 | $77,917 |
| Mean Household Income | 319 | $106,915 |
| Income Deficit | 252 | $0 |
| Wage / Income Gap (%) | 1,079 | 24.15% |
| Wage / Income Gap ($) | 1,079 | 75.85¢ per $1 |
| Gini / Inequality Index | 1,079 | 0.45 |
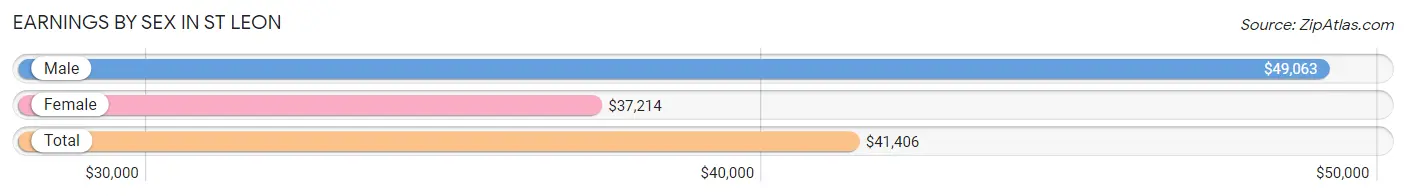
Earnings by Sex in St Leon
Average Earnings in St Leon are $41,406, $49,063 for men and $37,214 for women, a difference of 24.1%.
| Sex | Number | Average Earnings |
| Male | 259 (47.3%) | $49,063 |
| Female | 288 (52.6%) | $37,214 |
| Total | 547 (100.0%) | $41,406 |
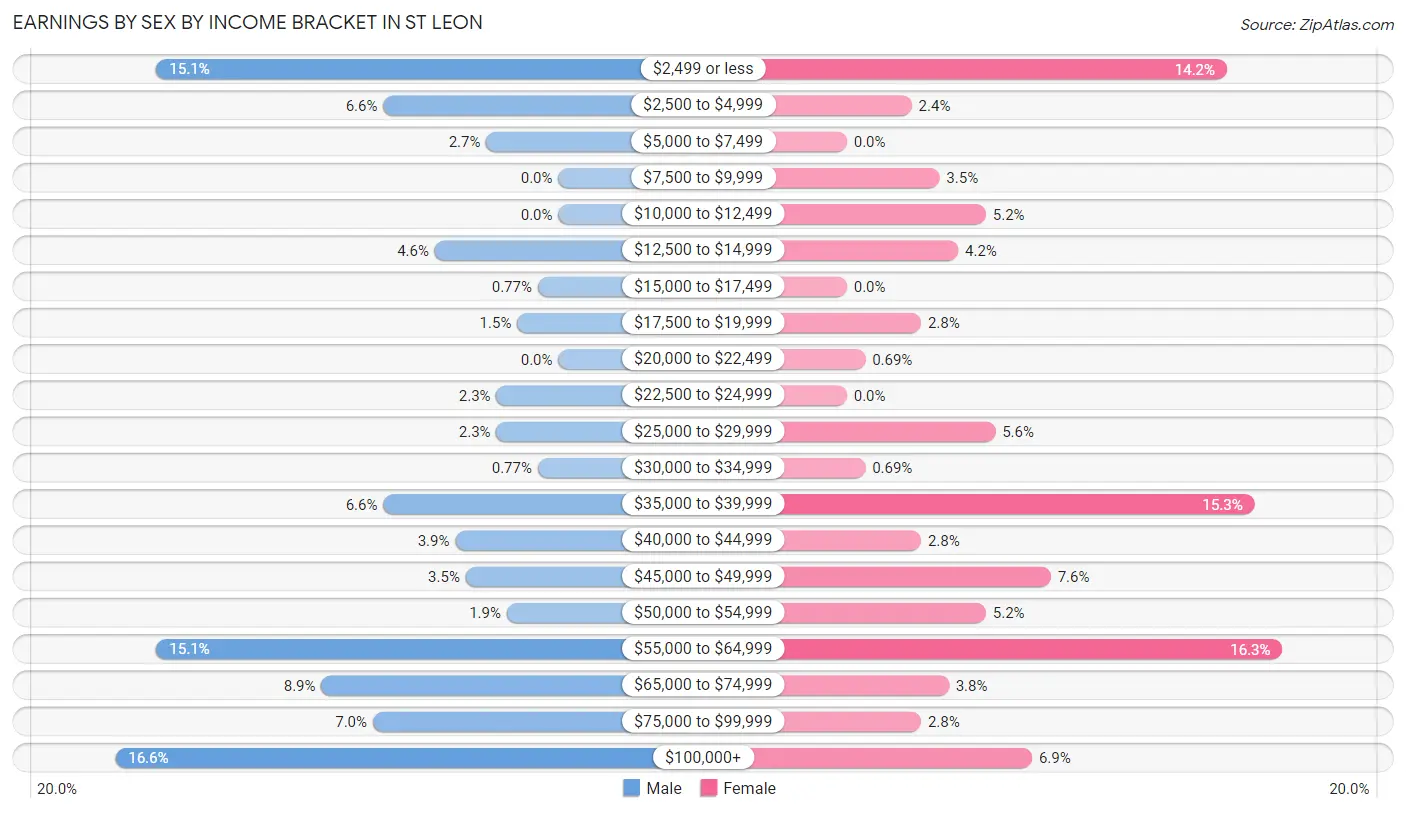
Earnings by Sex by Income Bracket in St Leon
The most common earnings brackets in St Leon are $100,000+ for men (43 | 16.6%) and $55,000 to $64,999 for women (47 | 16.3%).
| Income | Male | Female |
| $2,499 or less | 39 (15.1%) | 41 (14.2%) |
| $2,500 to $4,999 | 17 (6.6%) | 7 (2.4%) |
| $5,000 to $7,499 | 7 (2.7%) | 0 (0.0%) |
| $7,500 to $9,999 | 0 (0.0%) | 10 (3.5%) |
| $10,000 to $12,499 | 0 (0.0%) | 15 (5.2%) |
| $12,500 to $14,999 | 12 (4.6%) | 12 (4.2%) |
| $15,000 to $17,499 | 2 (0.8%) | 0 (0.0%) |
| $17,500 to $19,999 | 4 (1.5%) | 8 (2.8%) |
| $20,000 to $22,499 | 0 (0.0%) | 2 (0.7%) |
| $22,500 to $24,999 | 6 (2.3%) | 0 (0.0%) |
| $25,000 to $29,999 | 6 (2.3%) | 16 (5.6%) |
| $30,000 to $34,999 | 2 (0.8%) | 2 (0.7%) |
| $35,000 to $39,999 | 17 (6.6%) | 44 (15.3%) |
| $40,000 to $44,999 | 10 (3.9%) | 8 (2.8%) |
| $45,000 to $49,999 | 9 (3.5%) | 22 (7.6%) |
| $50,000 to $54,999 | 5 (1.9%) | 15 (5.2%) |
| $55,000 to $64,999 | 39 (15.1%) | 47 (16.3%) |
| $65,000 to $74,999 | 23 (8.9%) | 11 (3.8%) |
| $75,000 to $99,999 | 18 (7.0%) | 8 (2.8%) |
| $100,000+ | 43 (16.6%) | 20 (6.9%) |
| Total | 259 (100.0%) | 288 (100.0%) |
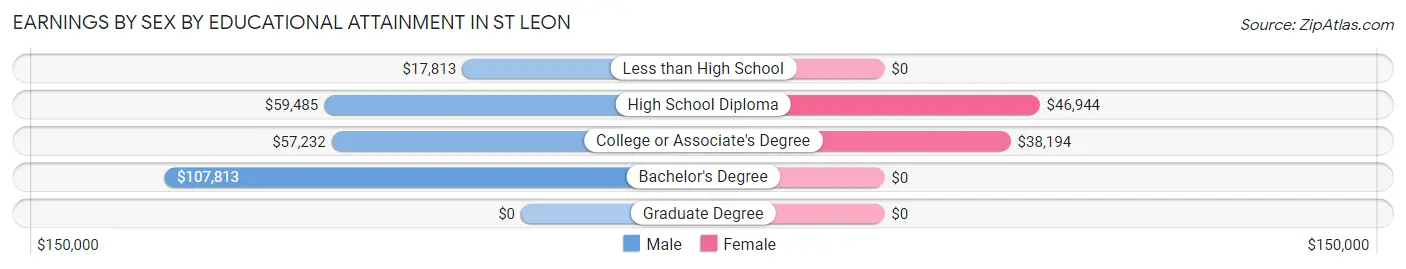
Earnings by Sex by Educational Attainment in St Leon
Average earnings in St Leon are $59,688 for men and $49,583 for women, a difference of 16.9%. Men with an educational attainment of bachelor's degree enjoy the highest average annual earnings of $107,813, while those with less than high school education earn the least with $17,813. Women with an educational attainment of high school diploma earn the most with the average annual earnings of $46,944, while those with college or associate's degree education have the smallest earnings of $38,194.
| Educational Attainment | Male Income | Female Income |
| Less than High School | $17,813 | $0 |
| High School Diploma | $59,485 | $46,944 |
| College or Associate's Degree | $57,232 | $38,194 |
| Bachelor's Degree | $107,813 | $0 |
| Graduate Degree | - | - |
| Total | $59,688 | $49,583 |
Family Income in St Leon
Family Income Brackets in St Leon
According to the St Leon family income data, there are 54 families falling into the $100,000 to $149,999 income range, which is the most common income bracket and makes up 21.4% of all families. Conversely, the $10,000 to $14,999 income bracket is the least frequent group with only 5 families (2.0%) belonging to this category.
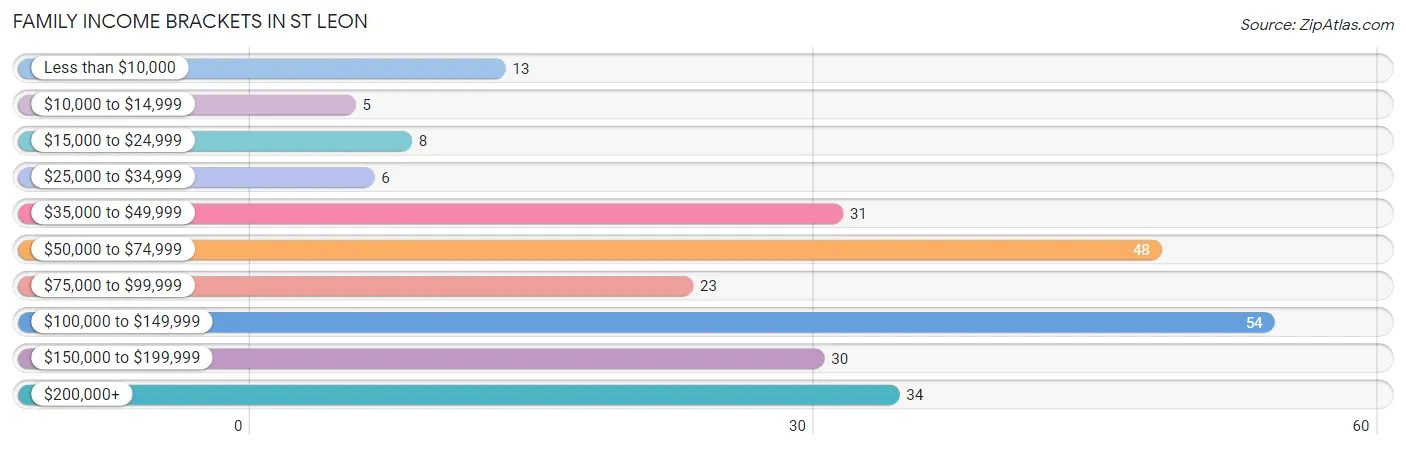
| Income Bracket | # Families | % Families |
| Less than $10,000 | 13 | 5.2% |
| $10,000 to $14,999 | 5 | 2.0% |
| $15,000 to $24,999 | 8 | 3.2% |
| $25,000 to $34,999 | 6 | 2.4% |
| $35,000 to $49,999 | 31 | 12.3% |
| $50,000 to $74,999 | 48 | 19.0% |
| $75,000 to $99,999 | 23 | 9.1% |
| $100,000 to $149,999 | 54 | 21.4% |
| $150,000 to $199,999 | 30 | 11.9% |
| $200,000+ | 34 | 13.5% |
Family Income by Famaliy Size in St Leon
5-person families (46 | 18.2%) account for the highest median family income in St Leon with $153,125 per family, while 4-person families (43 | 17.1%) have the highest median income of $34,453 per family member.
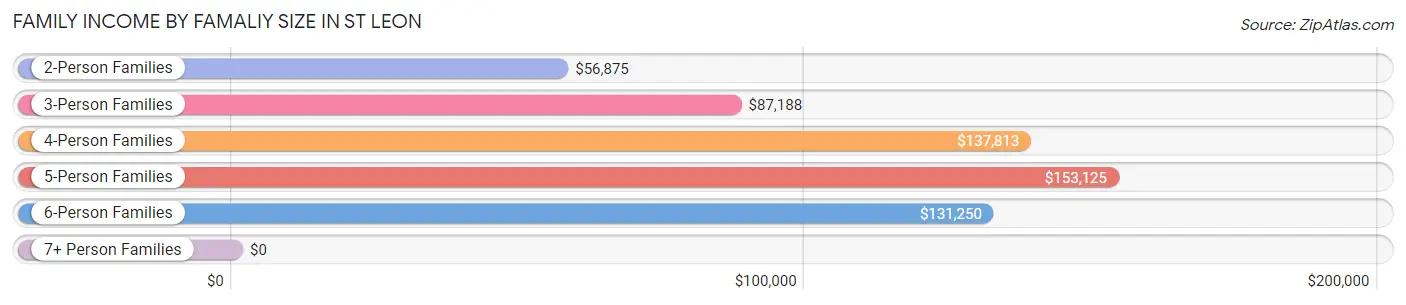
| Income Bracket | # Families | Median Income |
| 2-Person Families | 89 (35.3%) | $56,875 |
| 3-Person Families | 36 (14.3%) | $87,188 |
| 4-Person Families | 43 (17.1%) | $137,813 |
| 5-Person Families | 46 (18.2%) | $153,125 |
| 6-Person Families | 30 (11.9%) | $131,250 |
| 7+ Person Families | 8 (3.2%) | $0 |
| Total | 252 (100.0%) | $85,625 |
Family Income by Number of Earners in St Leon
The median family income in St Leon is $85,625, with families comprising 3+ earners (71) having the highest median family income of $154,844, while families with no earners (32) have the lowest median family income of $47,500, accounting for 28.2% and 12.7% of families, respectively.
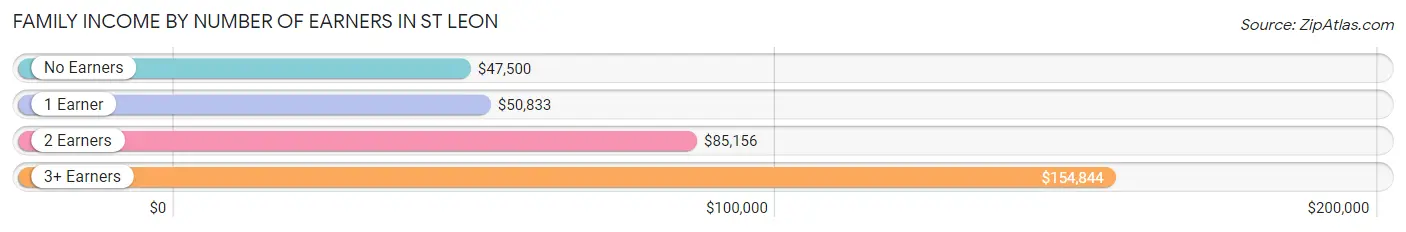
| Number of Earners | # Families | Median Income |
| No Earners | 32 (12.7%) | $47,500 |
| 1 Earner | 52 (20.6%) | $50,833 |
| 2 Earners | 97 (38.5%) | $85,156 |
| 3+ Earners | 71 (28.2%) | $154,844 |
| Total | 252 (100.0%) | $85,625 |
Household Income in St Leon
Household Income Brackets in St Leon
With 67 households falling in the category, the $100,000 to $149,999 income range is the most frequent in St Leon, accounting for 21.0% of all households. In contrast, only 7 households (2.2%) fall into the $10,000 to $14,999 income bracket, making it the least populous group.
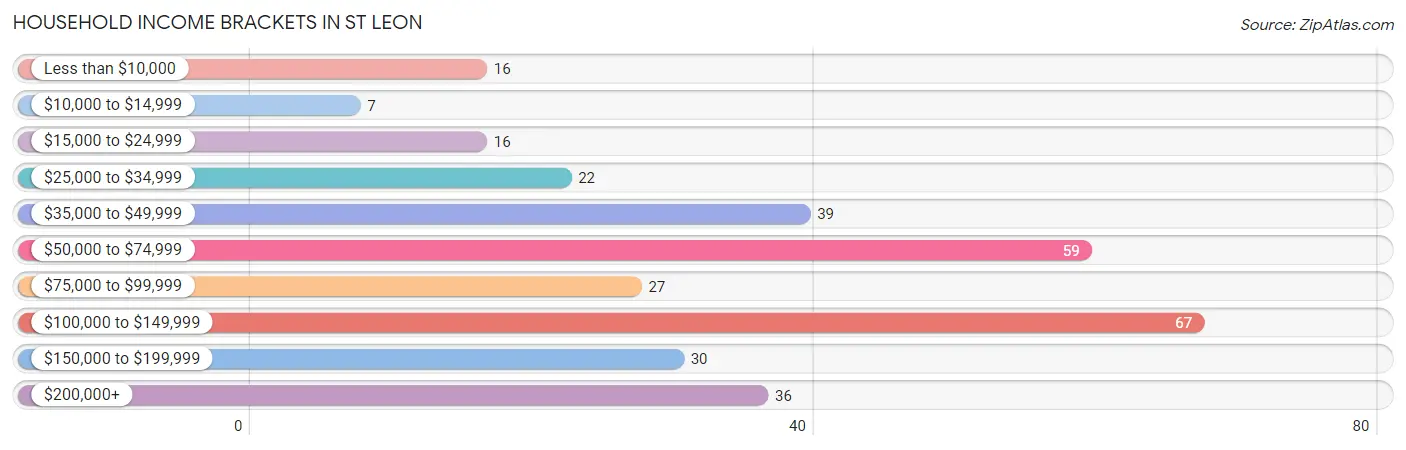
| Income Bracket | # Households | % Households |
| Less than $10,000 | 16 | 5.0% |
| $10,000 to $14,999 | 7 | 2.2% |
| $15,000 to $24,999 | 16 | 5.0% |
| $25,000 to $34,999 | 22 | 6.9% |
| $35,000 to $49,999 | 39 | 12.2% |
| $50,000 to $74,999 | 59 | 18.5% |
| $75,000 to $99,999 | 27 | 8.5% |
| $100,000 to $149,999 | 67 | 21.0% |
| $150,000 to $199,999 | 30 | 9.4% |
| $200,000+ | 36 | 11.3% |
Household Income by Householder Age in St Leon
The median household income in St Leon is $77,917, with the highest median household income of $130,625 found in the 45 to 64 years age bracket for the primary householder. A total of 169 households (53.0%) fall into this category. Meanwhile, the 65+ years age bracket for the primary householder has the lowest median household income of $32,396, with 61 households (19.1%) in this group.
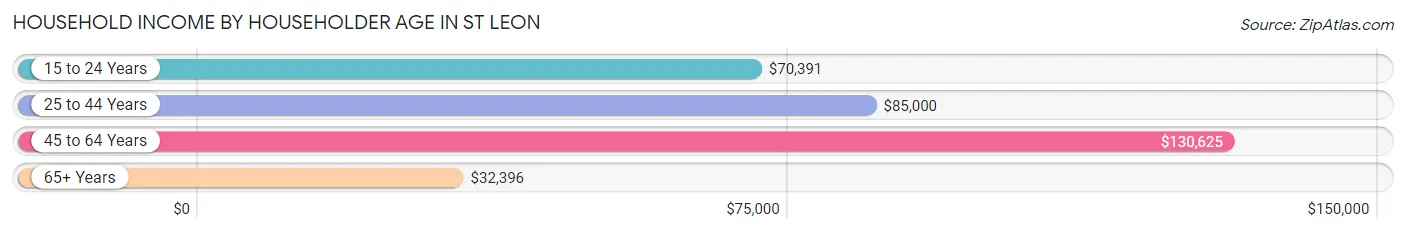
| Income Bracket | # Households | Median Income |
| 15 to 24 Years | 27 (8.5%) | $70,391 |
| 25 to 44 Years | 62 (19.4%) | $85,000 |
| 45 to 64 Years | 169 (53.0%) | $130,625 |
| 65+ Years | 61 (19.1%) | $32,396 |
| Total | 319 (100.0%) | $77,917 |
Poverty in St Leon
Income Below Poverty by Sex and Age in St Leon
With 14.7% poverty level for males and 9.5% for females among the residents of St Leon, 5 year old males and 6 to 11 year old females are the most vulnerable to poverty, with 5 males (100.0%) and 8 females (34.8%) in their respective age groups living below the poverty level.
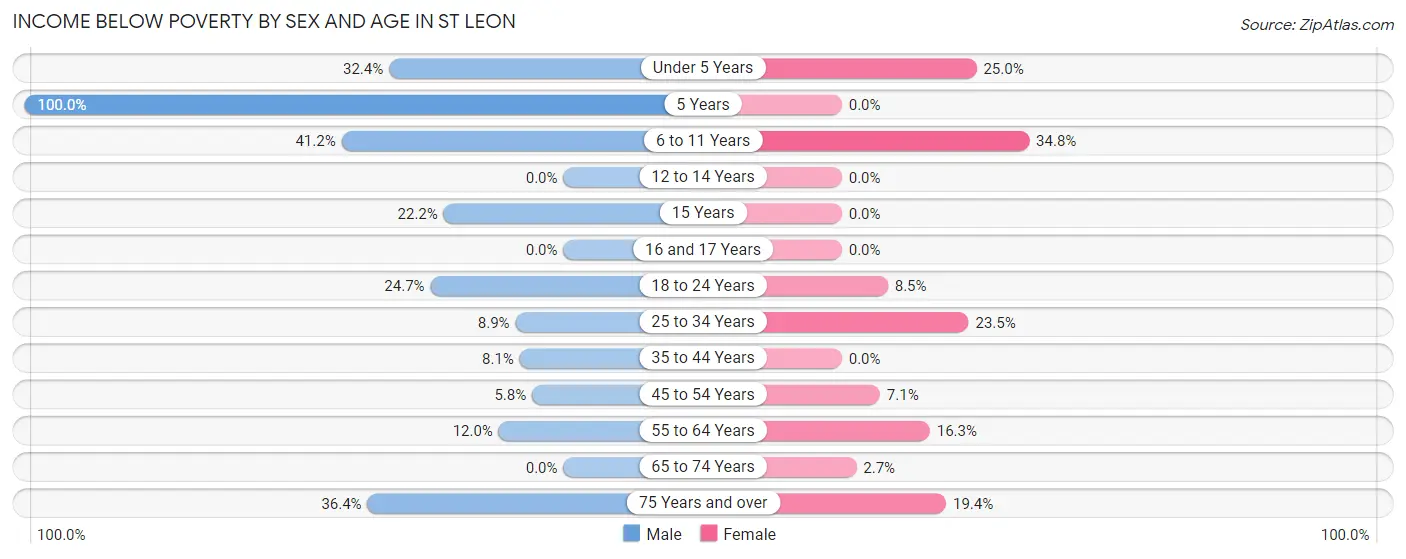
| Age Bracket | Male | Female |
| Under 5 Years | 11 (32.4%) | 3 (25.0%) |
| 5 Years | 5 (100.0%) | 0 (0.0%) |
| 6 to 11 Years | 14 (41.2%) | 8 (34.8%) |
| 12 to 14 Years | 0 (0.0%) | 0 (0.0%) |
| 15 Years | 4 (22.2%) | 0 (0.0%) |
| 16 and 17 Years | 0 (0.0%) | 0 (0.0%) |
| 18 to 24 Years | 19 (24.7%) | 7 (8.5%) |
| 25 to 34 Years | 4 (8.9%) | 12 (23.5%) |
| 35 to 44 Years | 3 (8.1%) | 0 (0.0%) |
| 45 to 54 Years | 5 (5.8%) | 7 (7.1%) |
| 55 to 64 Years | 9 (12.0%) | 8 (16.3%) |
| 65 to 74 Years | 0 (0.0%) | 1 (2.7%) |
| 75 Years and over | 4 (36.4%) | 6 (19.4%) |
| Total | 78 (14.7%) | 52 (9.5%) |
Income Above Poverty by Sex and Age in St Leon
According to the poverty statistics in St Leon, males aged 12 to 14 years and females aged 5 years are the age groups that are most secure financially, with 100.0% of males and 100.0% of females in these age groups living above the poverty line.
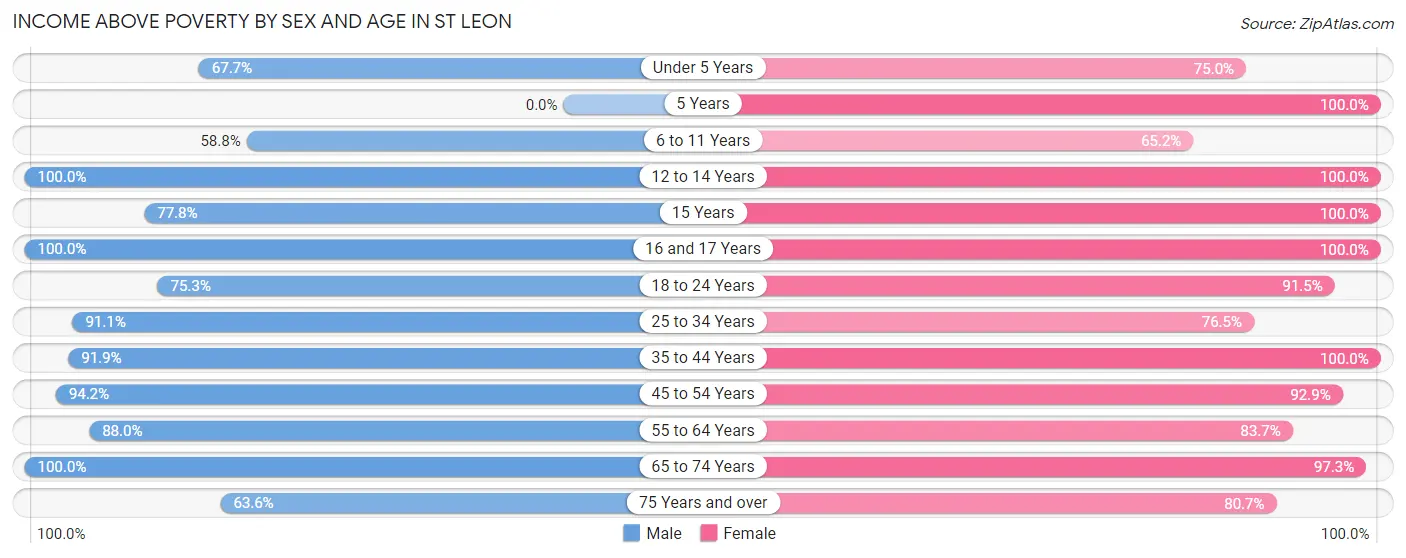
| Age Bracket | Male | Female |
| Under 5 Years | 23 (67.6%) | 9 (75.0%) |
| 5 Years | 0 (0.0%) | 3 (100.0%) |
| 6 to 11 Years | 20 (58.8%) | 15 (65.2%) |
| 12 to 14 Years | 8 (100.0%) | 66 (100.0%) |
| 15 Years | 14 (77.8%) | 46 (100.0%) |
| 16 and 17 Years | 70 (100.0%) | 23 (100.0%) |
| 18 to 24 Years | 58 (75.3%) | 75 (91.5%) |
| 25 to 34 Years | 41 (91.1%) | 39 (76.5%) |
| 35 to 44 Years | 34 (91.9%) | 26 (100.0%) |
| 45 to 54 Years | 81 (94.2%) | 92 (92.9%) |
| 55 to 64 Years | 66 (88.0%) | 41 (83.7%) |
| 65 to 74 Years | 31 (100.0%) | 36 (97.3%) |
| 75 Years and over | 7 (63.6%) | 25 (80.6%) |
| Total | 453 (85.3%) | 496 (90.5%) |
Income Below Poverty Among Married-Couple Families in St Leon
The poverty statistics for married-couple families in St Leon show that 10.4% or 21 of the total 202 families live below the poverty line. Families with 3 or 4 children have the highest poverty rate of 34.5%, comprising of 10 families. On the other hand, families with 1 or 2 children have the lowest poverty rate of 0.0%, which includes 0 families.
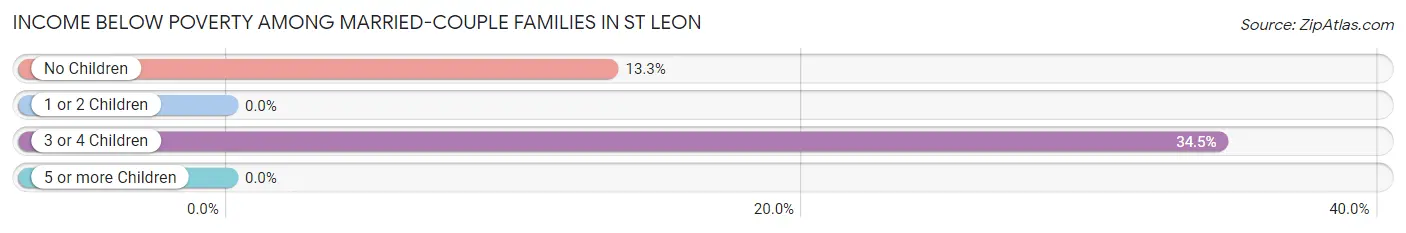
| Children | Above Poverty | Below Poverty |
| No Children | 72 (86.8%) | 11 (13.3%) |
| 1 or 2 Children | 90 (100.0%) | 0 (0.0%) |
| 3 or 4 Children | 19 (65.5%) | 10 (34.5%) |
| 5 or more Children | 0 (0.0%) | 0 (0.0%) |
| Total | 181 (89.6%) | 21 (10.4%) |
Income Below Poverty Among Single-Parent Households in St Leon
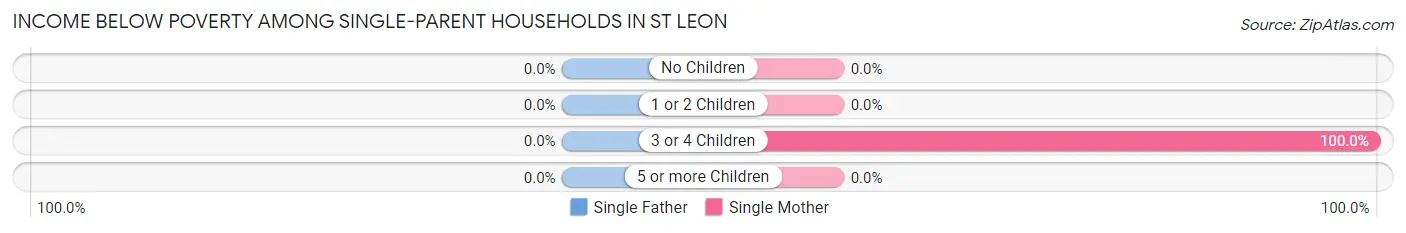
| Children | Single Father | Single Mother |
| No Children | 0 (0.0%) | 0 (0.0%) |
| 1 or 2 Children | 0 (0.0%) | 0 (0.0%) |
| 3 or 4 Children | 0 (0.0%) | 7 (100.0%) |
| 5 or more Children | 0 (0.0%) | 0 (0.0%) |
| Total | 0 (0.0%) | 7 (20.6%) |
Income Below Poverty Among Married-Couple vs Single-Parent Households in St Leon
The poverty data for St Leon shows that 21 of the married-couple family households (10.4%) and 7 of the single-parent households (14.0%) are living below the poverty level. Within the married-couple family households, those with 3 or 4 children have the highest poverty rate, with 10 households (34.5%) falling below the poverty line. Among the single-parent households, those with 3 or 4 children have the highest poverty rate, with 7 household (63.6%) living below poverty.
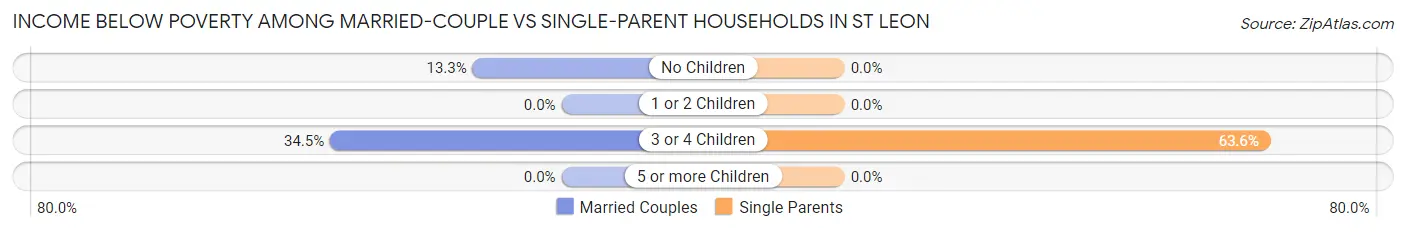
| Children | Married-Couple Families | Single-Parent Households |
| No Children | 11 (13.3%) | 0 (0.0%) |
| 1 or 2 Children | 0 (0.0%) | 0 (0.0%) |
| 3 or 4 Children | 10 (34.5%) | 7 (63.6%) |
| 5 or more Children | 0 (0.0%) | 0 (0.0%) |
| Total | 21 (10.4%) | 7 (14.0%) |
Race in St Leon
The most populous races in St Leon are White / Caucasian (1,018 | 94.4%), and Two or more Races (61 | 5.7%).
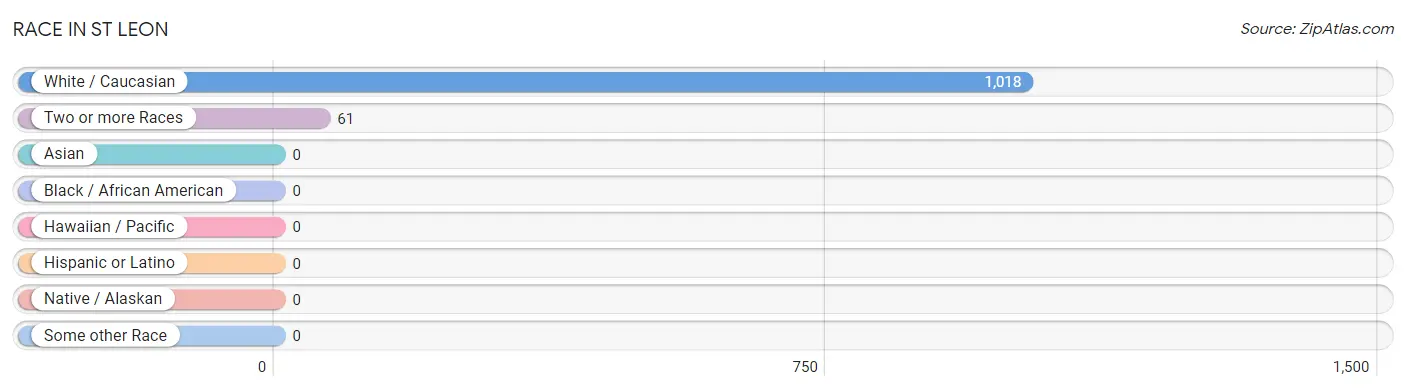
| Race | # Population | % Population |
| Asian | 0 | 0.0% |
| Black / African American | 0 | 0.0% |
| Hawaiian / Pacific | 0 | 0.0% |
| Hispanic or Latino | 0 | 0.0% |
| Native / Alaskan | 0 | 0.0% |
| White / Caucasian | 1,018 | 94.4% |
| Two or more Races | 61 | 5.7% |
| Some other Race | 0 | 0.0% |
| Total | 1,079 | 100.0% |
Ancestry in St Leon
The most populous ancestries reported in St Leon are German (582 | 53.9%), Irish (150 | 13.9%), English (82 | 7.6%), Eastern European (30 | 2.8%), and American (29 | 2.7%), together accounting for 80.9% of all St Leon residents.
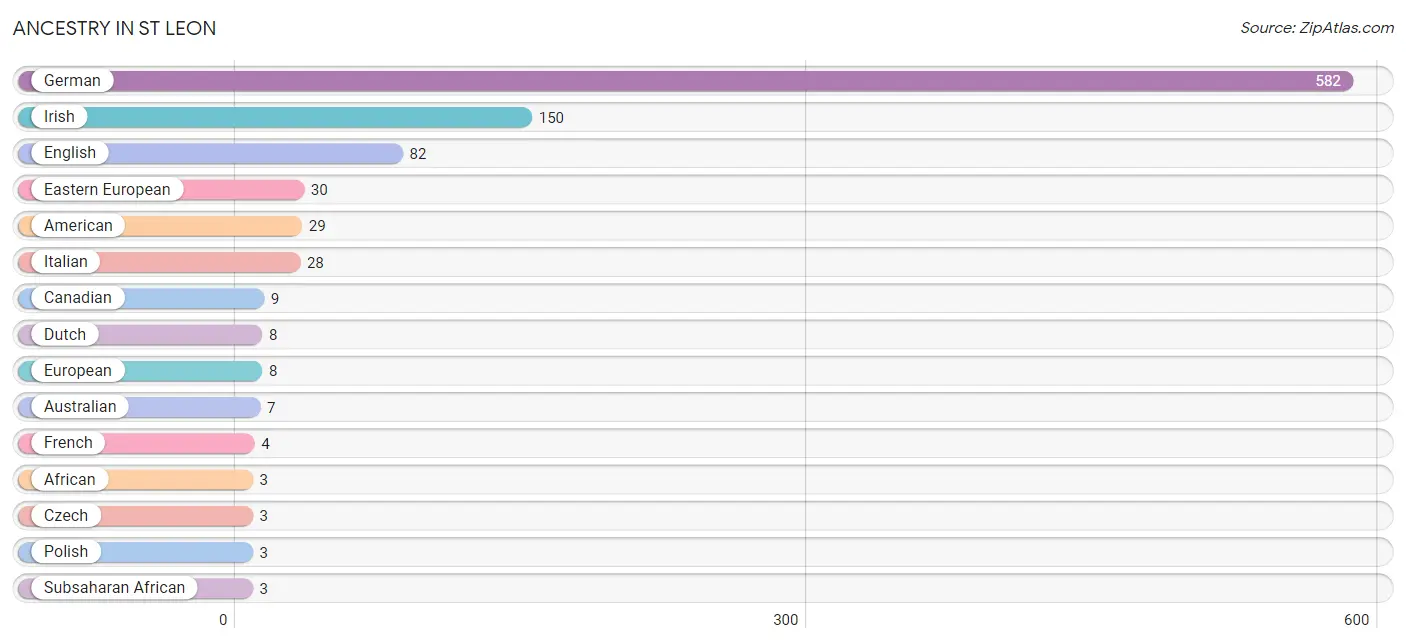
| Ancestry | # Population | % Population |
| African | 3 | 0.3% |
| American | 29 | 2.7% |
| Australian | 7 | 0.6% |
| Canadian | 9 | 0.8% |
| Cherokee | 1 | 0.1% |
| Czech | 3 | 0.3% |
| Danish | 2 | 0.2% |
| Dutch | 8 | 0.7% |
| Eastern European | 30 | 2.8% |
| English | 82 | 7.6% |
| European | 8 | 0.7% |
| French | 4 | 0.4% |
| German | 582 | 53.9% |
| Irish | 150 | 13.9% |
| Italian | 28 | 2.6% |
| Polish | 3 | 0.3% |
| Subsaharan African | 3 | 0.3% | View All 17 Rows |
Immigrants in St Leon
The most numerous immigrant groups reported in St Leon came from , and Canada (9 | 0.8%), together accounting for 0.8% of all St Leon residents.

| Immigration Origin | # Population | % Population |
| Canada | 9 | 0.8% | View All 1 Rows |
Sex and Age in St Leon
Sex and Age in St Leon
The most populous age groups in St Leon are 15 to 19 Years (123 | 23.2%) for men and 15 to 19 Years (104 | 19.0%) for women.
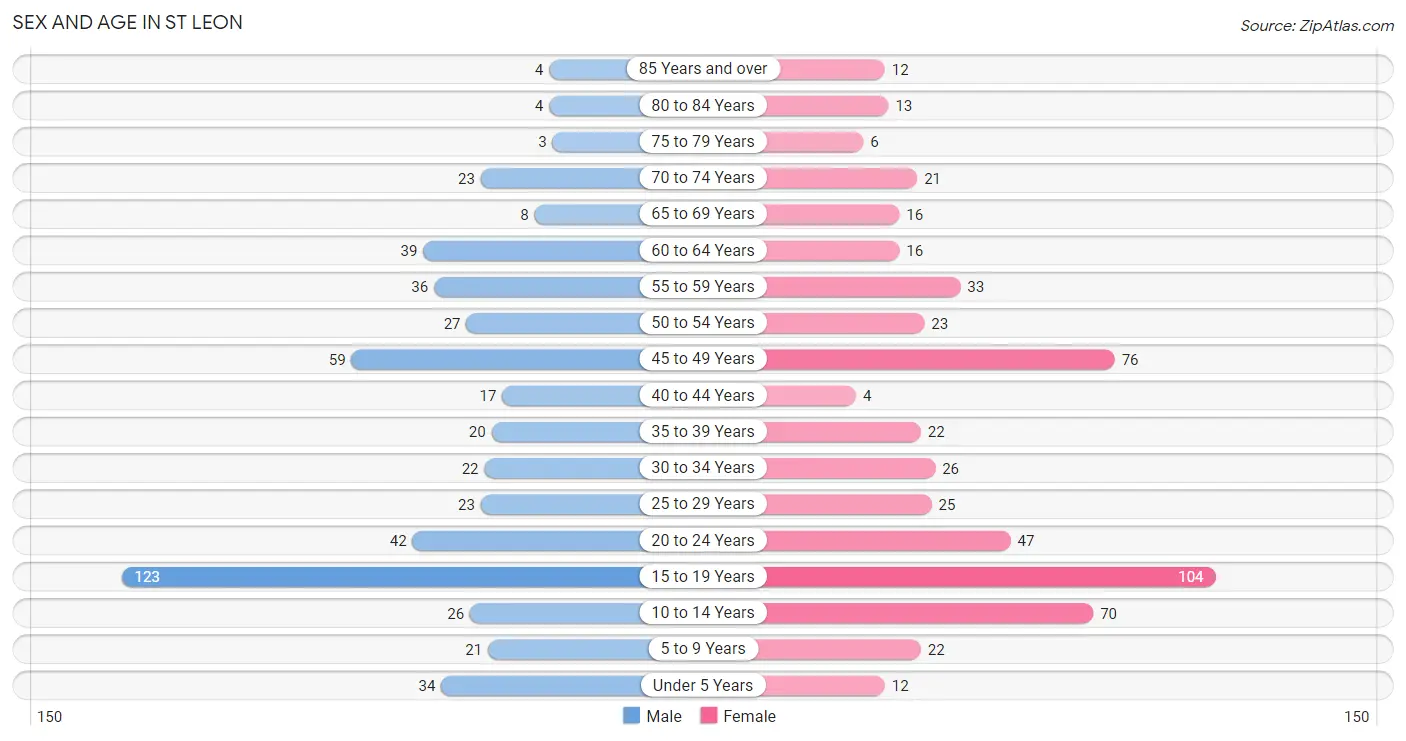
| Age Bracket | Male | Female |
| Under 5 Years | 34 (6.4%) | 12 (2.2%) |
| 5 to 9 Years | 21 (4.0%) | 22 (4.0%) |
| 10 to 14 Years | 26 (4.9%) | 70 (12.8%) |
| 15 to 19 Years | 123 (23.2%) | 104 (19.0%) |
| 20 to 24 Years | 42 (7.9%) | 47 (8.6%) |
| 25 to 29 Years | 23 (4.3%) | 25 (4.6%) |
| 30 to 34 Years | 22 (4.1%) | 26 (4.7%) |
| 35 to 39 Years | 20 (3.8%) | 22 (4.0%) |
| 40 to 44 Years | 17 (3.2%) | 4 (0.7%) |
| 45 to 49 Years | 59 (11.1%) | 76 (13.9%) |
| 50 to 54 Years | 27 (5.1%) | 23 (4.2%) |
| 55 to 59 Years | 36 (6.8%) | 33 (6.0%) |
| 60 to 64 Years | 39 (7.3%) | 16 (2.9%) |
| 65 to 69 Years | 8 (1.5%) | 16 (2.9%) |
| 70 to 74 Years | 23 (4.3%) | 21 (3.8%) |
| 75 to 79 Years | 3 (0.6%) | 6 (1.1%) |
| 80 to 84 Years | 4 (0.7%) | 13 (2.4%) |
| 85 Years and over | 4 (0.7%) | 12 (2.2%) |
| Total | 531 (100.0%) | 548 (100.0%) |
Families and Households in St Leon
Median Family Size in St Leon
The median family size in St Leon is 3.89 persons per family, with married-couple families (202 | 80.2%) accounting for the largest median family size of 4.19 persons per family. On the other hand, single female/mother families (34 | 13.5%) represent the smallest median family size with 2.29 persons per family.
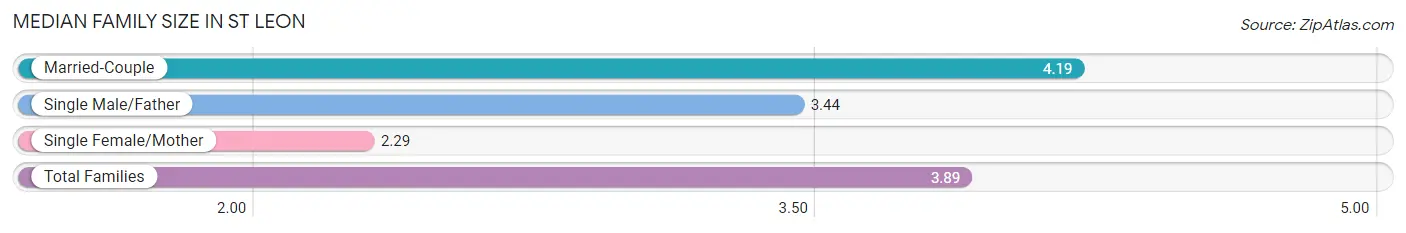
| Family Type | # Families | Family Size |
| Married-Couple | 202 (80.2%) | 4.19 |
| Single Male/Father | 16 (6.4%) | 3.44 |
| Single Female/Mother | 34 (13.5%) | 2.29 |
| Total Families | 252 (100.0%) | 3.89 |
Median Household Size in St Leon
The median household size in St Leon is 3.38 persons per household, with married-couple households (202 | 63.3%) accounting for the largest median household size of 4.21 persons per household. non-family households (67 | 21.0%) represent the smallest median household size with 1.42 persons per household.
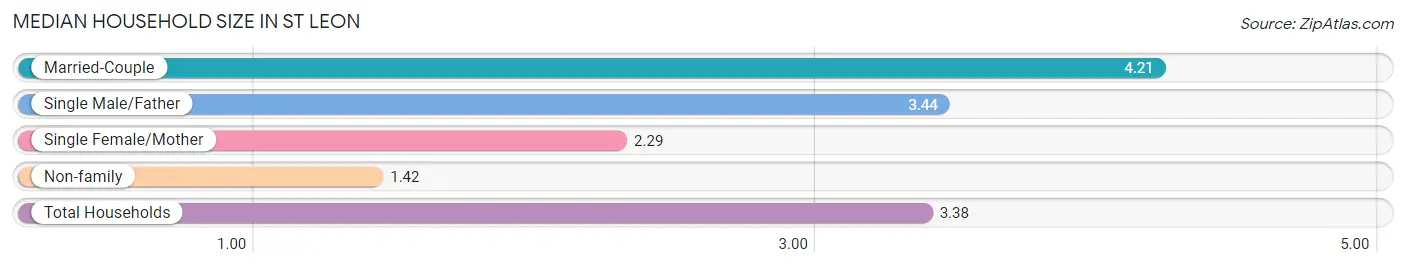
| Household Type | # Households | Household Size |
| Married-Couple | 202 (63.3%) | 4.21 |
| Single Male/Father | 16 (5.0%) | 3.44 |
| Single Female/Mother | 34 (10.7%) | 2.29 |
| Non-family | 67 (21.0%) | 1.42 |
| Total Households | 319 (100.0%) | 3.38 |
Household Size by Marriage Status in St Leon
Out of a total of 319 households in St Leon, 252 (79.0%) are family households, while 67 (21.0%) are nonfamily households. The most numerous type of family households are 2-person households, comprising 89, and the most common type of nonfamily households are 1-person households, comprising 45.
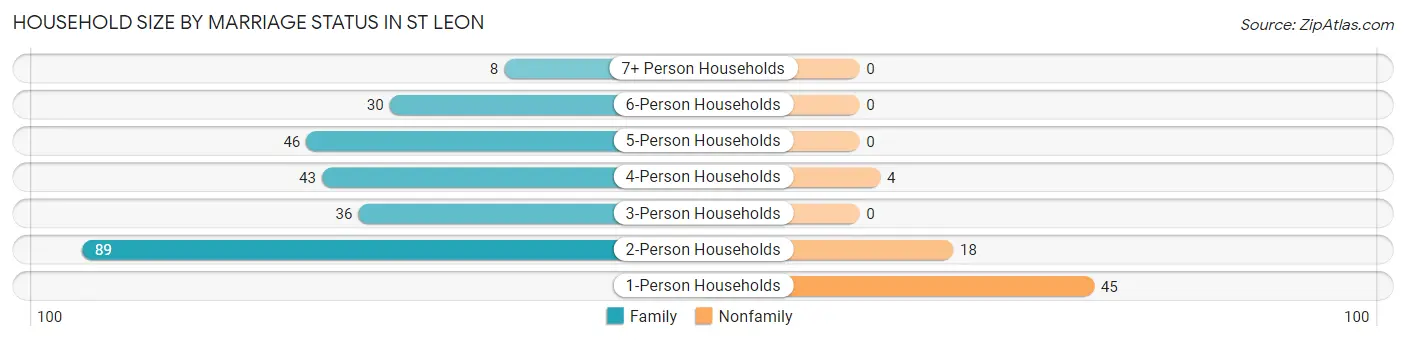
| Household Size | Family Households | Nonfamily Households |
| 1-Person Households | - | 45 (14.1%) |
| 2-Person Households | 89 (27.9%) | 18 (5.6%) |
| 3-Person Households | 36 (11.3%) | 0 (0.0%) |
| 4-Person Households | 43 (13.5%) | 4 (1.3%) |
| 5-Person Households | 46 (14.4%) | 0 (0.0%) |
| 6-Person Households | 30 (9.4%) | 0 (0.0%) |
| 7+ Person Households | 8 (2.5%) | 0 (0.0%) |
| Total | 252 (79.0%) | 67 (21.0%) |
Female Fertility in St Leon
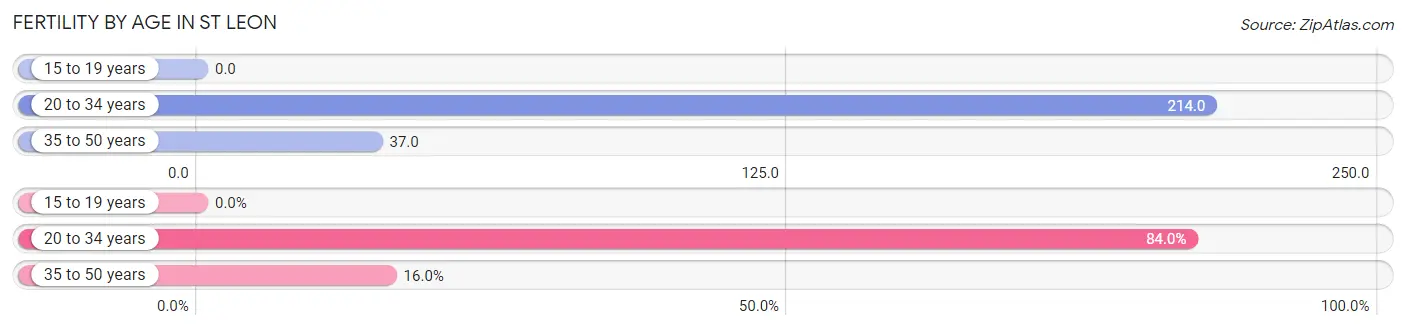
Fertility by Age in St Leon
Average fertility rate in St Leon is 80.0 births per 1,000 women. Women in the age bracket of 20 to 34 years have the highest fertility rate with 214.0 births per 1,000 women. Women in the age bracket of 20 to 34 years acount for 84.0% of all women with births.
| Age Bracket | Women with Births | Births / 1,000 Women |
| 15 to 19 years | 0 (0.0%) | 0.0 |
| 20 to 34 years | 21 (84.0%) | 214.0 |
| 35 to 50 years | 4 (16.0%) | 37.0 |
| Total | 25 (100.0%) | 80.0 |
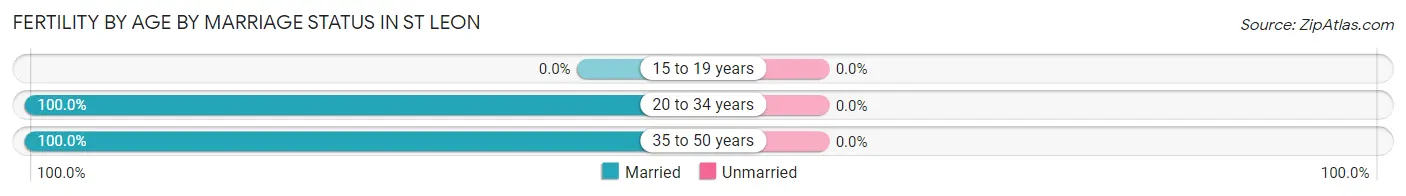
Fertility by Age by Marriage Status in St Leon
| Age Bracket | Married | Unmarried |
| 15 to 19 years | 0 (0.0%) | 0 (0.0%) |
| 20 to 34 years | 21 (100.0%) | 0 (0.0%) |
| 35 to 50 years | 4 (100.0%) | 0 (0.0%) |
| Total | 25 (100.0%) | 0 (0.0%) |
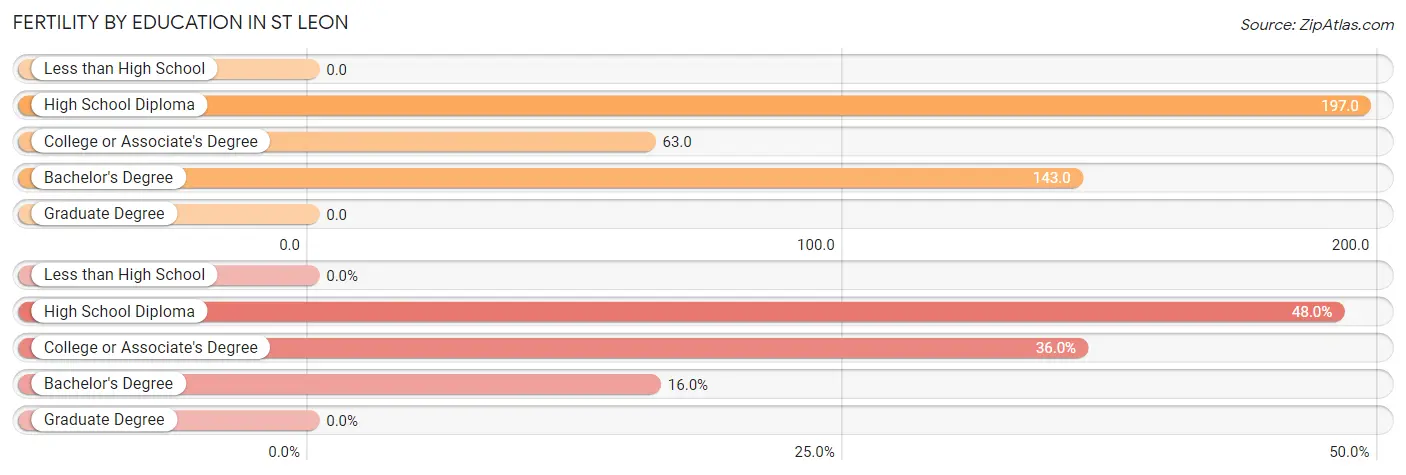
Fertility by Education in St Leon
| Educational Attainment | Women with Births | Births / 1,000 Women |
| Less than High School | 0 (0.0%) | 0.0 |
| High School Diploma | 12 (48.0%) | 197.0 |
| College or Associate's Degree | 9 (36.0%) | 63.0 |
| Bachelor's Degree | 4 (16.0%) | 143.0 |
| Graduate Degree | 0 (0.0%) | 0.0 |
| Total | 25 (100.0%) | 80.0 |
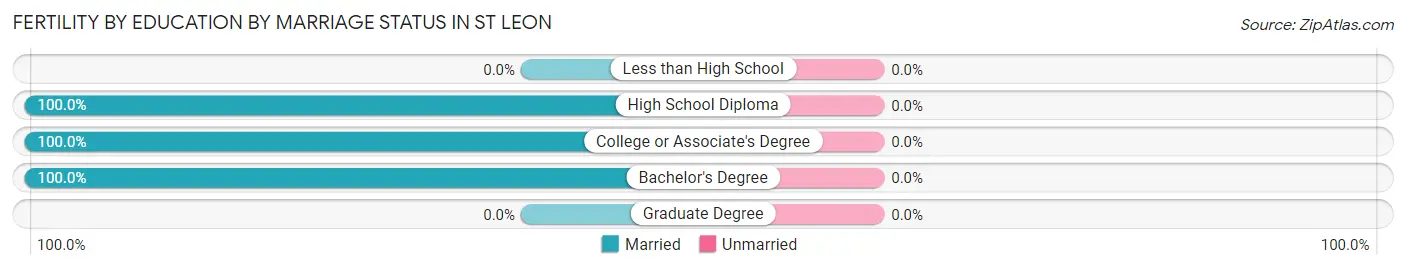
Fertility by Education by Marriage Status in St Leon
| Educational Attainment | Married | Unmarried |
| Less than High School | 0 (0.0%) | 0 (0.0%) |
| High School Diploma | 12 (100.0%) | 0 (0.0%) |
| College or Associate's Degree | 9 (100.0%) | 0 (0.0%) |
| Bachelor's Degree | 4 (100.0%) | 0 (0.0%) |
| Graduate Degree | 0 (0.0%) | 0 (0.0%) |
| Total | 25 (100.0%) | 0 (0.0%) |
Employment Characteristics in St Leon
Employment by Class of Employer in St Leon
Among the 448 employed individuals in St Leon, private company employees (300 | 67.0%), not-for-profit organizations (51 | 11.4%), and local government employees (46 | 10.3%) make up the most common classes of employment.
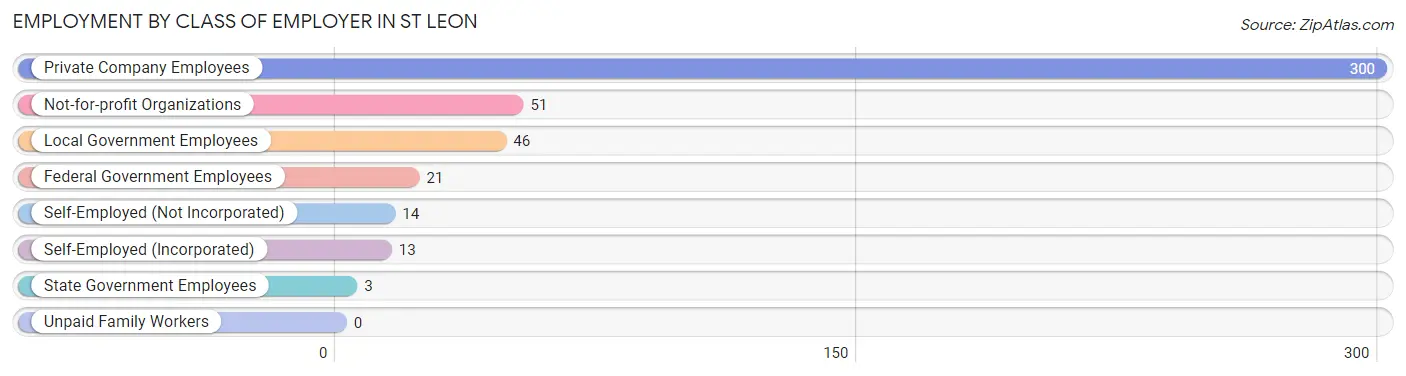
| Employer Class | # Employees | % Employees |
| Private Company Employees | 300 | 67.0% |
| Self-Employed (Incorporated) | 13 | 2.9% |
| Self-Employed (Not Incorporated) | 14 | 3.1% |
| Not-for-profit Organizations | 51 | 11.4% |
| Local Government Employees | 46 | 10.3% |
| State Government Employees | 3 | 0.7% |
| Federal Government Employees | 21 | 4.7% |
| Unpaid Family Workers | 0 | 0.0% |
| Total | 448 | 100.0% |
Employment Status by Age in St Leon
According to the labor force statistics for St Leon, out of the total population over 16 years of age (830), 55.9% or 464 individuals are in the labor force, with 0.4% or 2 of them unemployed. The age group with the highest labor force participation rate is 30 to 34 years, with 93.8% or 45 individuals in the labor force. Within the labor force, the 25 to 29 years age range has the highest percentage of unemployed individuals, with 4.5% or 2 of them being unemployed.
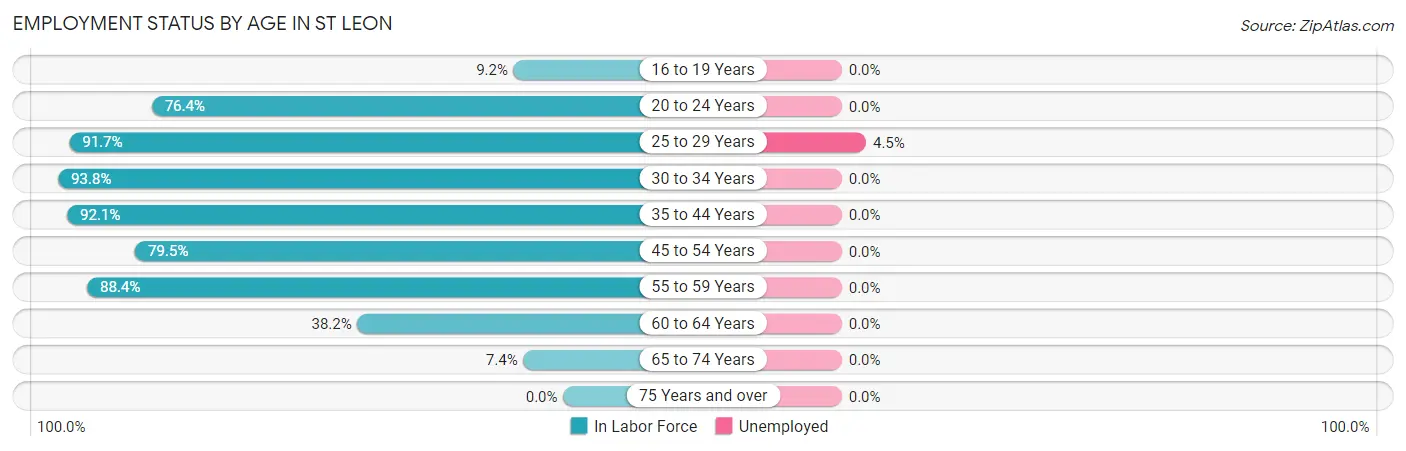
| Age Bracket | In Labor Force | Unemployed |
| 16 to 19 Years | 15 (9.2%) | 0 (0.0%) |
| 20 to 24 Years | 68 (76.4%) | 0 (0.0%) |
| 25 to 29 Years | 44 (91.7%) | 2 (4.5%) |
| 30 to 34 Years | 45 (93.8%) | 0 (0.0%) |
| 35 to 44 Years | 58 (92.1%) | 0 (0.0%) |
| 45 to 54 Years | 147 (79.5%) | 0 (0.0%) |
| 55 to 59 Years | 61 (88.4%) | 0 (0.0%) |
| 60 to 64 Years | 21 (38.2%) | 0 (0.0%) |
| 65 to 74 Years | 5 (7.4%) | 0 (0.0%) |
| 75 Years and over | 0 (0.0%) | 0 (0.0%) |
| Total | 464 (55.9%) | 2 (0.4%) |
Employment Status by Educational Attainment in St Leon
According to labor force statistics for St Leon, 80.3% of individuals (376) out of the total population between 25 and 64 years of age (468) are in the labor force, with 0.5% or 2 of them being unemployed. The group with the highest labor force participation rate are those with the educational attainment of bachelor's degree or higher, with 96.0% or 96 individuals in the labor force. Within the labor force, individuals with high school diploma education have the highest percentage of unemployment, with 1.3% or 2 of them being unemployed.
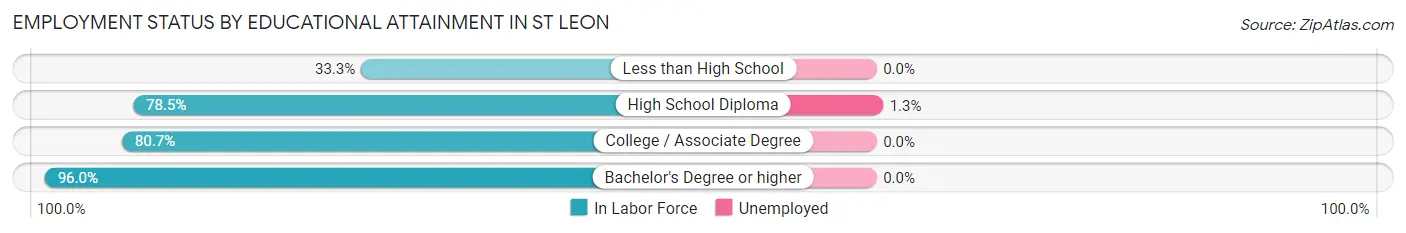
| Educational Attainment | In Labor Force | Unemployed |
| Less than High School | 9 (33.3%) | 0 (0.0%) |
| High School Diploma | 150 (78.5%) | 2 (1.3%) |
| College / Associate Degree | 121 (80.7%) | 0 (0.0%) |
| Bachelor's Degree or higher | 96 (96.0%) | 0 (0.0%) |
| Total | 376 (80.3%) | 2 (0.5%) |
Employment Occupations by Sex in St Leon
Management, Business, Science and Arts Occupations
The most common Management, Business, Science and Arts occupations in St Leon are Management (100 | 21.6%), Health Diagnosing & Treating (46 | 10.0%), Health Technologists (27 | 5.8%), Community & Social Service (24 | 5.2%), and Education Instruction & Library (14 | 3.0%).
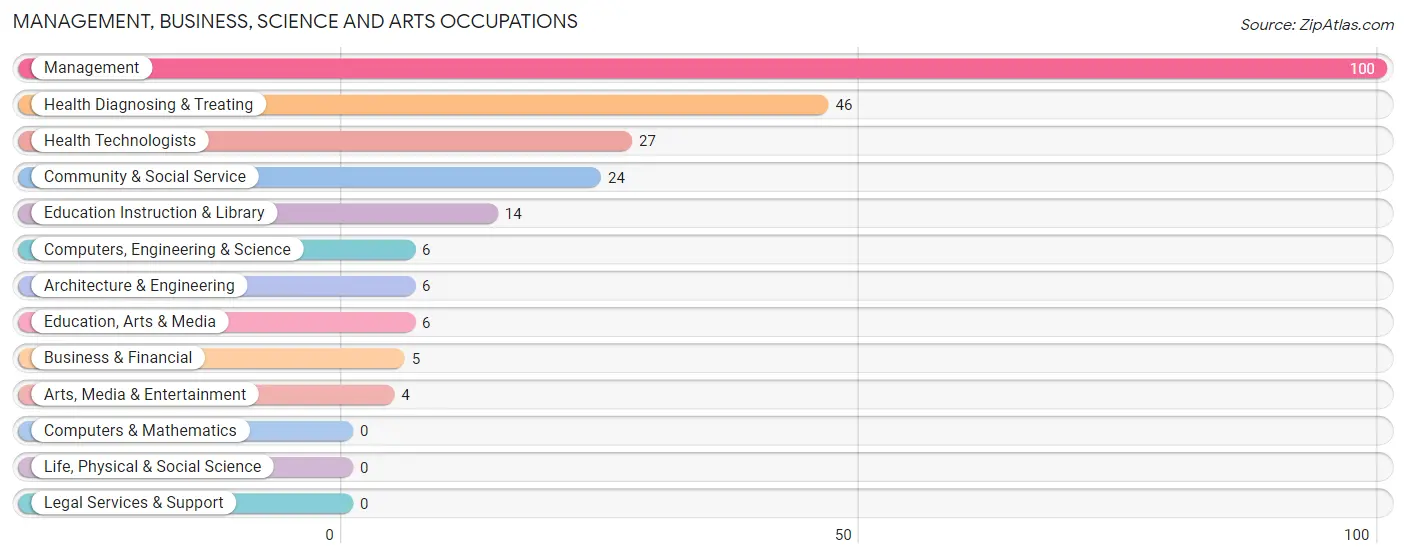
Management, Business, Science and Arts Occupations by Sex
Within the Management, Business, Science and Arts occupations in St Leon, the most male-oriented occupations are Business & Financial (100.0%), Computers, Engineering & Science (100.0%), and Architecture & Engineering (100.0%), while the most female-oriented occupations are Arts, Media & Entertainment (100.0%), Health Diagnosing & Treating (100.0%), and Health Technologists (100.0%).
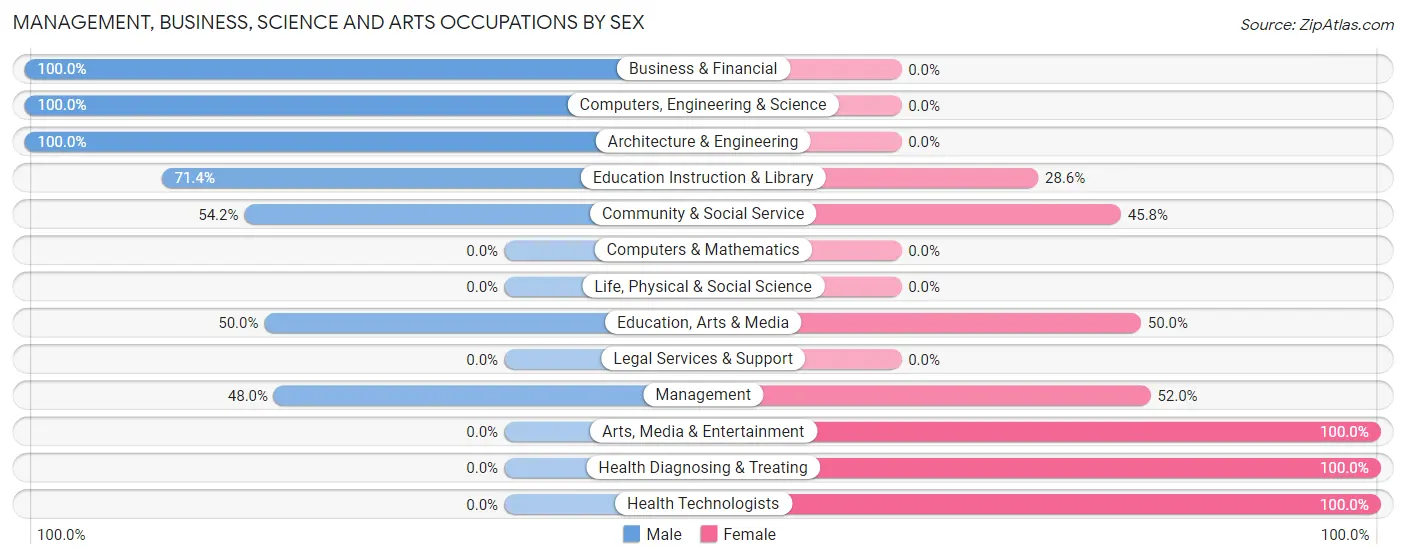
| Occupation | Male | Female |
| Management | 48 (48.0%) | 52 (52.0%) |
| Business & Financial | 5 (100.0%) | 0 (0.0%) |
| Computers, Engineering & Science | 6 (100.0%) | 0 (0.0%) |
| Computers & Mathematics | 0 (0.0%) | 0 (0.0%) |
| Architecture & Engineering | 6 (100.0%) | 0 (0.0%) |
| Life, Physical & Social Science | 0 (0.0%) | 0 (0.0%) |
| Community & Social Service | 13 (54.2%) | 11 (45.8%) |
| Education, Arts & Media | 3 (50.0%) | 3 (50.0%) |
| Legal Services & Support | 0 (0.0%) | 0 (0.0%) |
| Education Instruction & Library | 10 (71.4%) | 4 (28.6%) |
| Arts, Media & Entertainment | 0 (0.0%) | 4 (100.0%) |
| Health Diagnosing & Treating | 0 (0.0%) | 46 (100.0%) |
| Health Technologists | 0 (0.0%) | 27 (100.0%) |
| Total (Category) | 72 (39.8%) | 109 (60.2%) |
| Total (Overall) | 204 (44.2%) | 258 (55.8%) |
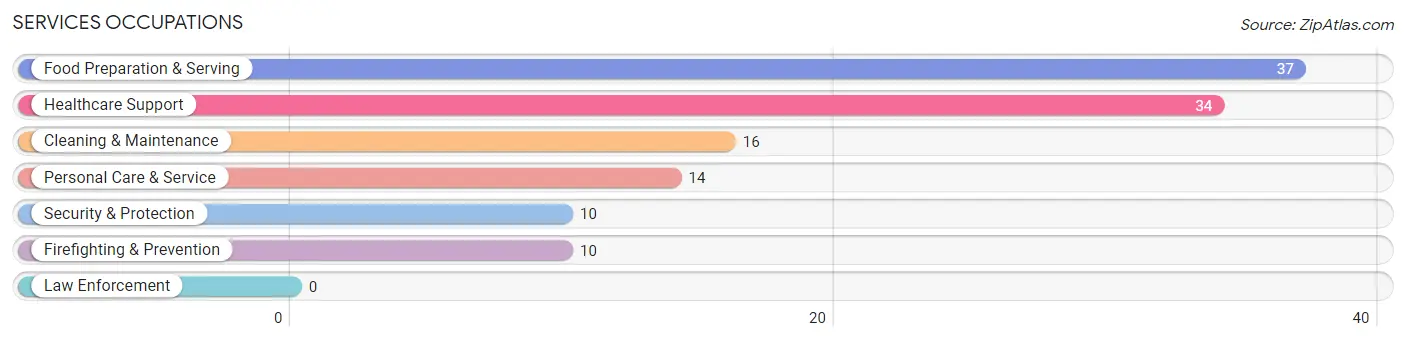
Services Occupations
The most common Services occupations in St Leon are Food Preparation & Serving (37 | 8.0%), Healthcare Support (34 | 7.4%), Cleaning & Maintenance (16 | 3.5%), Personal Care & Service (14 | 3.0%), and Security & Protection (10 | 2.2%).
Services Occupations by Sex
Within the Services occupations in St Leon, the most male-oriented occupations are Cleaning & Maintenance (81.2%), Security & Protection (30.0%), and Firefighting & Prevention (30.0%), while the most female-oriented occupations are Personal Care & Service (100.0%), Healthcare Support (82.4%), and Food Preparation & Serving (78.4%).
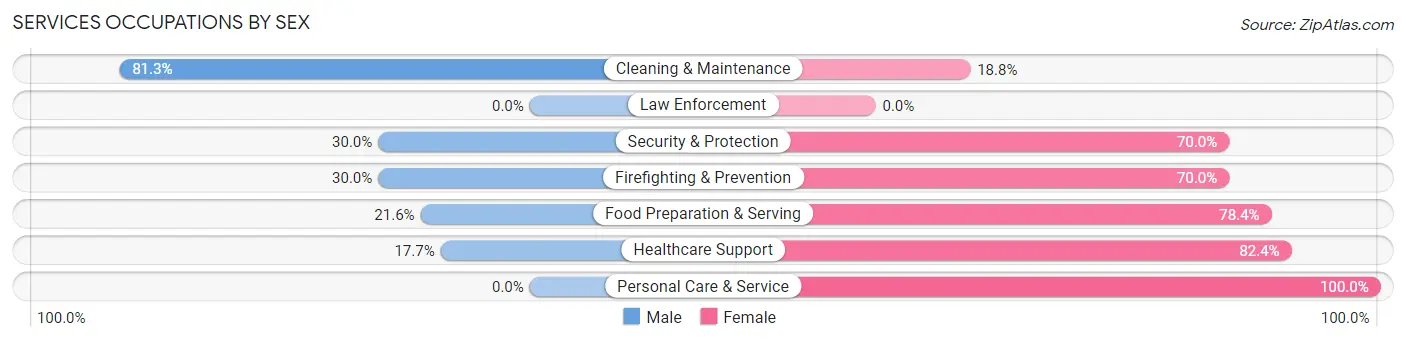
| Occupation | Male | Female |
| Healthcare Support | 6 (17.6%) | 28 (82.4%) |
| Security & Protection | 3 (30.0%) | 7 (70.0%) |
| Firefighting & Prevention | 3 (30.0%) | 7 (70.0%) |
| Law Enforcement | 0 (0.0%) | 0 (0.0%) |
| Food Preparation & Serving | 8 (21.6%) | 29 (78.4%) |
| Cleaning & Maintenance | 13 (81.2%) | 3 (18.8%) |
| Personal Care & Service | 0 (0.0%) | 14 (100.0%) |
| Total (Category) | 30 (27.0%) | 81 (73.0%) |
| Total (Overall) | 204 (44.2%) | 258 (55.8%) |
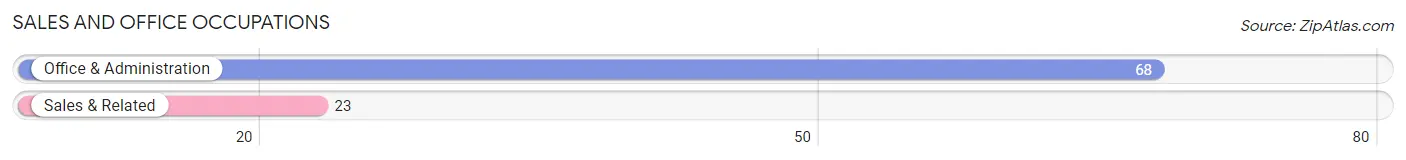
Sales and Office Occupations
The most common Sales and Office occupations in St Leon are Office & Administration (68 | 14.7%), and Sales & Related (23 | 5.0%).
Sales and Office Occupations by Sex
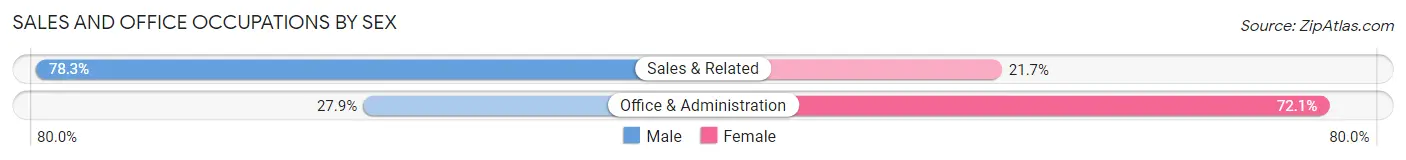
| Occupation | Male | Female |
| Sales & Related | 18 (78.3%) | 5 (21.7%) |
| Office & Administration | 19 (27.9%) | 49 (72.1%) |
| Total (Category) | 37 (40.7%) | 54 (59.3%) |
| Total (Overall) | 204 (44.2%) | 258 (55.8%) |
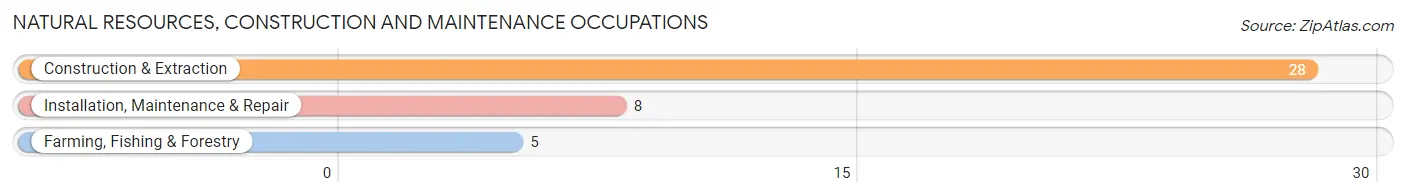
Natural Resources, Construction and Maintenance Occupations
The most common Natural Resources, Construction and Maintenance occupations in St Leon are Construction & Extraction (28 | 6.1%), Installation, Maintenance & Repair (8 | 1.7%), and Farming, Fishing & Forestry (5 | 1.1%).
Natural Resources, Construction and Maintenance Occupations by Sex
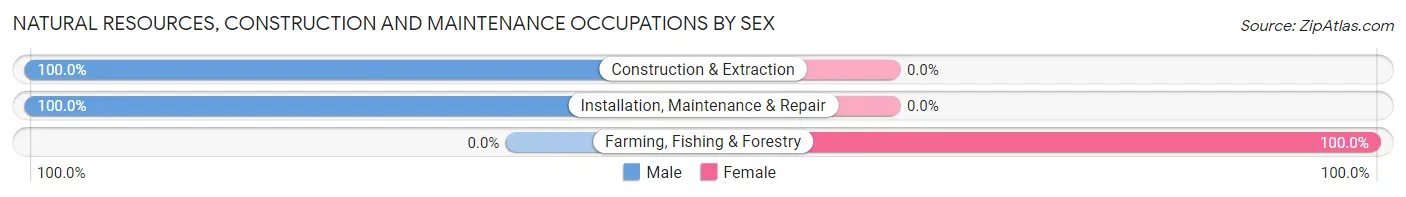
| Occupation | Male | Female |
| Farming, Fishing & Forestry | 0 (0.0%) | 5 (100.0%) |
| Construction & Extraction | 28 (100.0%) | 0 (0.0%) |
| Installation, Maintenance & Repair | 8 (100.0%) | 0 (0.0%) |
| Total (Category) | 36 (87.8%) | 5 (12.2%) |
| Total (Overall) | 204 (44.2%) | 258 (55.8%) |
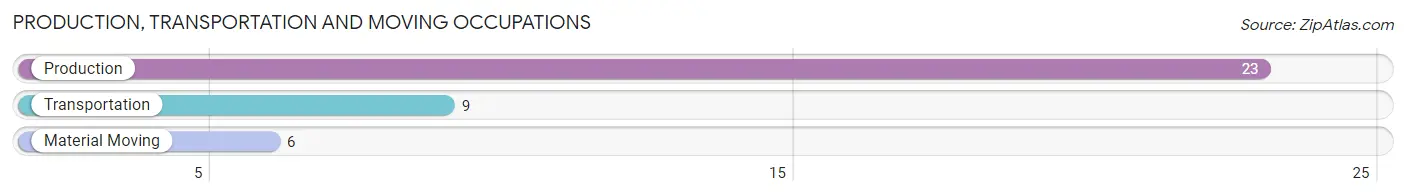
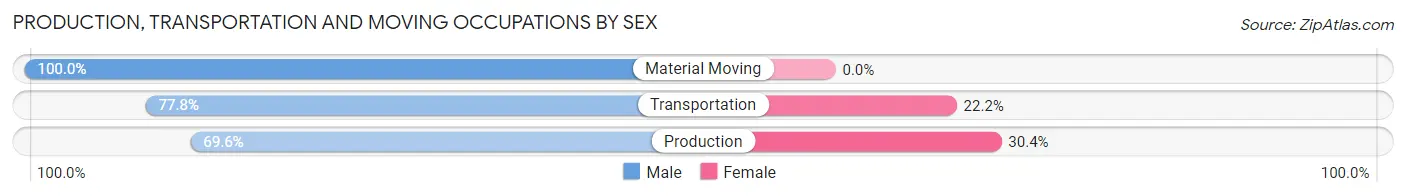
Production, Transportation and Moving Occupations
The most common Production, Transportation and Moving occupations in St Leon are Production (23 | 5.0%), Transportation (9 | 1.9%), and Material Moving (6 | 1.3%).
Production, Transportation and Moving Occupations by Sex
| Occupation | Male | Female |
| Production | 16 (69.6%) | 7 (30.4%) |
| Transportation | 7 (77.8%) | 2 (22.2%) |
| Material Moving | 6 (100.0%) | 0 (0.0%) |
| Total (Category) | 29 (76.3%) | 9 (23.7%) |
| Total (Overall) | 204 (44.2%) | 258 (55.8%) |
Employment Industries by Sex in St Leon
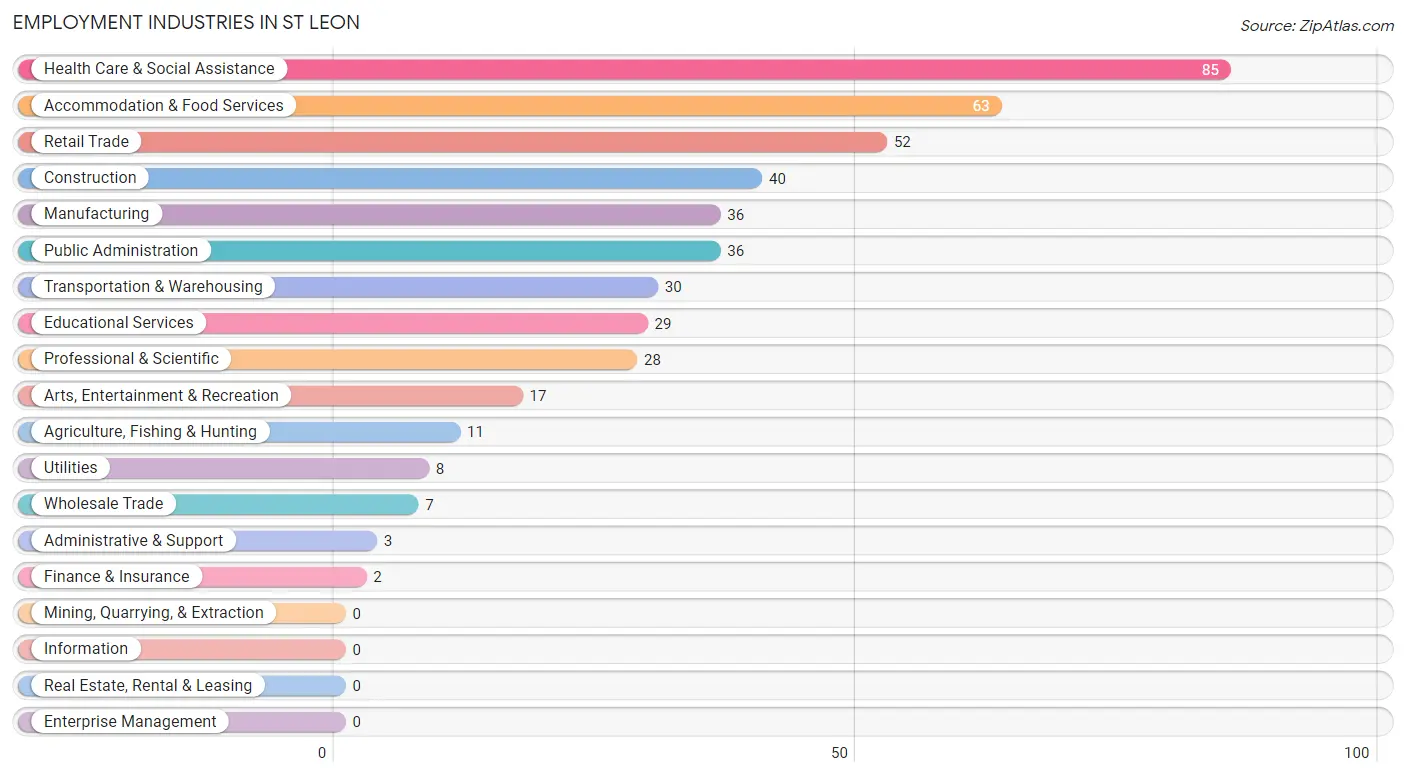
Employment Industries in St Leon
The major employment industries in St Leon include Health Care & Social Assistance (85 | 18.4%), Accommodation & Food Services (63 | 13.6%), Retail Trade (52 | 11.3%), Construction (40 | 8.7%), and Manufacturing (36 | 7.8%).
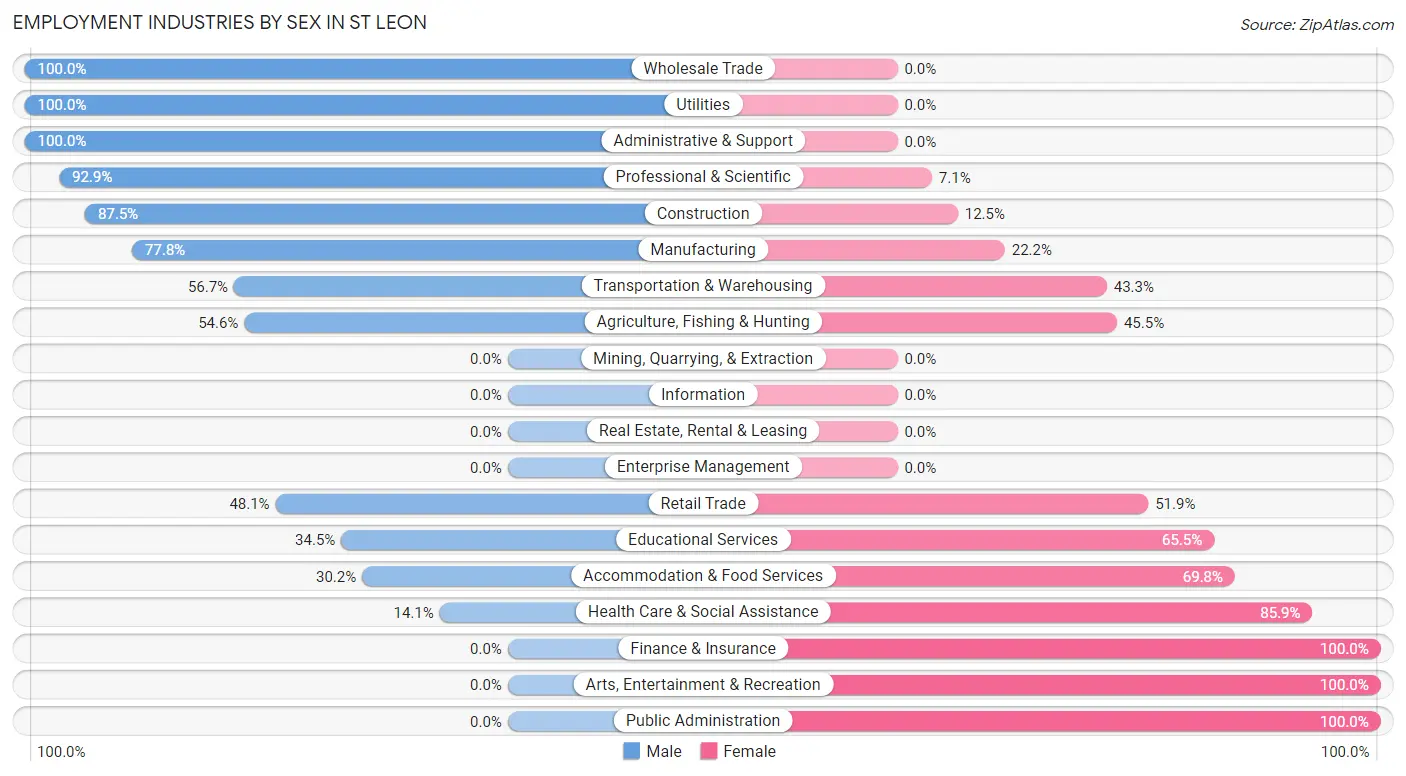
Employment Industries by Sex in St Leon
The St Leon industries that see more men than women are Wholesale Trade (100.0%), Utilities (100.0%), and Administrative & Support (100.0%), whereas the industries that tend to have a higher number of women are Finance & Insurance (100.0%), Arts, Entertainment & Recreation (100.0%), and Public Administration (100.0%).
| Industry | Male | Female |
| Agriculture, Fishing & Hunting | 6 (54.5%) | 5 (45.5%) |
| Mining, Quarrying, & Extraction | 0 (0.0%) | 0 (0.0%) |
| Construction | 35 (87.5%) | 5 (12.5%) |
| Manufacturing | 28 (77.8%) | 8 (22.2%) |
| Wholesale Trade | 7 (100.0%) | 0 (0.0%) |
| Retail Trade | 25 (48.1%) | 27 (51.9%) |
| Transportation & Warehousing | 17 (56.7%) | 13 (43.3%) |
| Utilities | 8 (100.0%) | 0 (0.0%) |
| Information | 0 (0.0%) | 0 (0.0%) |
| Finance & Insurance | 0 (0.0%) | 2 (100.0%) |
| Real Estate, Rental & Leasing | 0 (0.0%) | 0 (0.0%) |
| Professional & Scientific | 26 (92.9%) | 2 (7.1%) |
| Enterprise Management | 0 (0.0%) | 0 (0.0%) |
| Administrative & Support | 3 (100.0%) | 0 (0.0%) |
| Educational Services | 10 (34.5%) | 19 (65.5%) |
| Health Care & Social Assistance | 12 (14.1%) | 73 (85.9%) |
| Arts, Entertainment & Recreation | 0 (0.0%) | 17 (100.0%) |
| Accommodation & Food Services | 19 (30.2%) | 44 (69.8%) |
| Public Administration | 0 (0.0%) | 36 (100.0%) |
| Total | 204 (44.2%) | 258 (55.8%) |
Education in St Leon
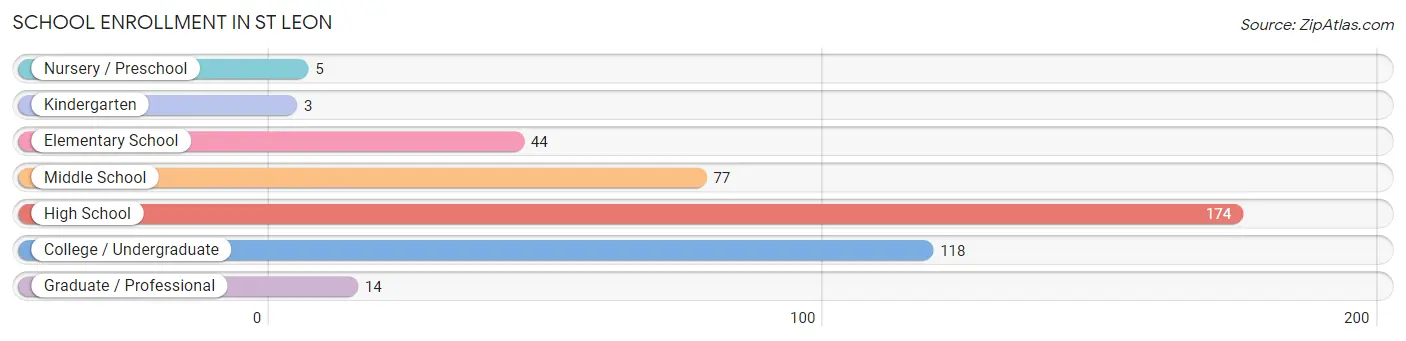
School Enrollment in St Leon
The most common levels of schooling among the 435 students in St Leon are high school (174 | 40.0%), college / undergraduate (118 | 27.1%), and middle school (77 | 17.7%).
| School Level | # Students | % Students |
| Nursery / Preschool | 5 | 1.1% |
| Kindergarten | 3 | 0.7% |
| Elementary School | 44 | 10.1% |
| Middle School | 77 | 17.7% |
| High School | 174 | 40.0% |
| College / Undergraduate | 118 | 27.1% |
| Graduate / Professional | 14 | 3.2% |
| Total | 435 | 100.0% |
School Enrollment by Age by Funding Source in St Leon
Out of a total of 435 students who are enrolled in schools in St Leon, 53 (12.2%) attend a private institution, while the remaining 382 (87.8%) are enrolled in public schools. The age group of 35 years and over has the highest likelihood of being enrolled in private schools, with 10 (43.5% in the age bracket) enrolled. Conversely, the age group of 18 to 19 year olds has the lowest likelihood of being enrolled in a private school, with 65 (100.0% in the age bracket) attending a public institution.
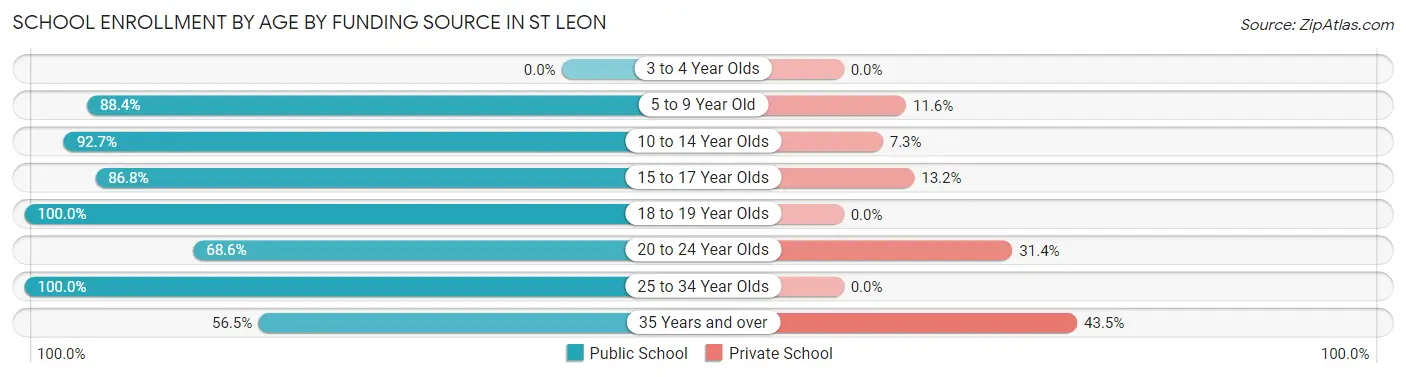
| Age Bracket | Public School | Private School |
| 3 to 4 Year Olds | 0 (0.0%) | 0 (0.0%) |
| 5 to 9 Year Old | 38 (88.4%) | 5 (11.6%) |
| 10 to 14 Year Olds | 89 (92.7%) | 7 (7.3%) |
| 15 to 17 Year Olds | 132 (86.8%) | 20 (13.2%) |
| 18 to 19 Year Olds | 65 (100.0%) | 0 (0.0%) |
| 20 to 24 Year Olds | 24 (68.6%) | 11 (31.4%) |
| 25 to 34 Year Olds | 21 (100.0%) | 0 (0.0%) |
| 35 Years and over | 13 (56.5%) | 10 (43.5%) |
| Total | 382 (87.8%) | 53 (12.2%) |
Educational Attainment by Field of Study in St Leon
Engineering (29 | 24.0%), science & technology (28 | 23.1%), business (16 | 13.2%), social sciences (12 | 9.9%), and education (10 | 8.3%) are the most common fields of study among 121 individuals in St Leon who have obtained a bachelor's degree or higher.
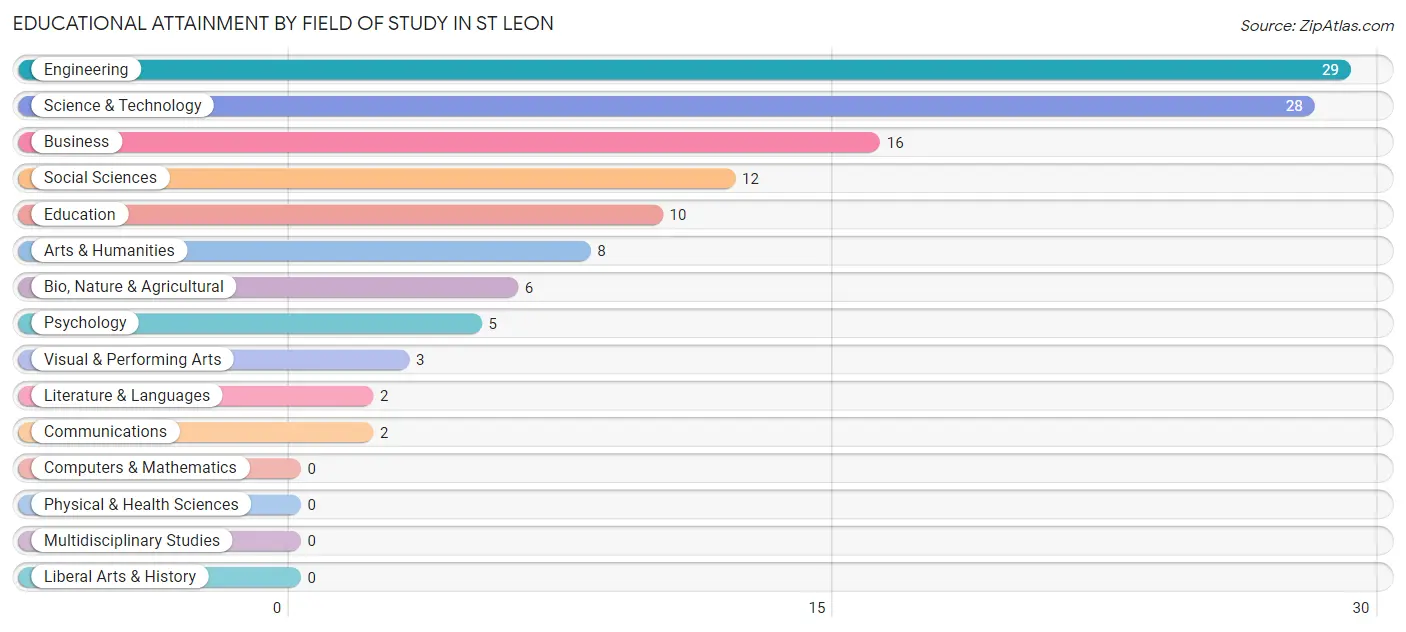
| Field of Study | # Graduates | % Graduates |
| Computers & Mathematics | 0 | 0.0% |
| Bio, Nature & Agricultural | 6 | 5.0% |
| Physical & Health Sciences | 0 | 0.0% |
| Psychology | 5 | 4.1% |
| Social Sciences | 12 | 9.9% |
| Engineering | 29 | 24.0% |
| Multidisciplinary Studies | 0 | 0.0% |
| Science & Technology | 28 | 23.1% |
| Business | 16 | 13.2% |
| Education | 10 | 8.3% |
| Literature & Languages | 2 | 1.7% |
| Liberal Arts & History | 0 | 0.0% |
| Visual & Performing Arts | 3 | 2.5% |
| Communications | 2 | 1.7% |
| Arts & Humanities | 8 | 6.6% |
| Total | 121 | 100.0% |
Transportation & Commute in St Leon
Vehicle Availability by Sex in St Leon
The most prevalent vehicle ownership categories in St Leon are males with 3 vehicles (55, accounting for 28.9%) and females with 3 vehicles (63, making up 21.3%).
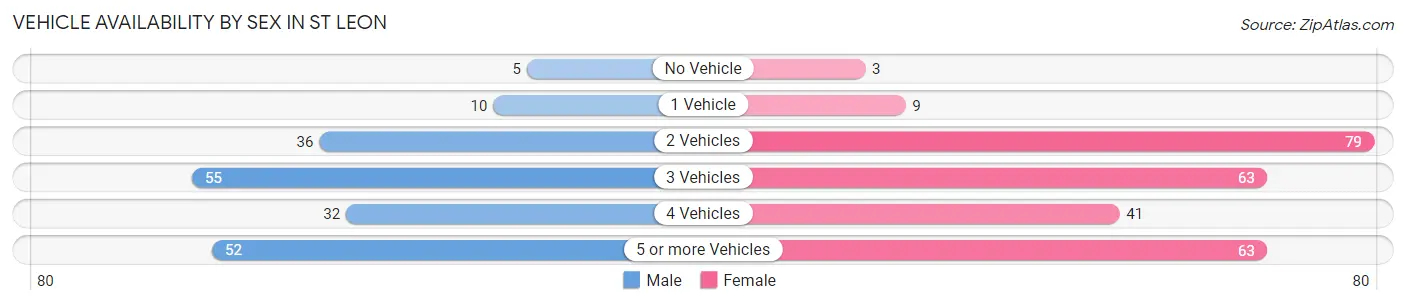
| Vehicles Available | Male | Female |
| No Vehicle | 5 (2.6%) | 3 (1.2%) |
| 1 Vehicle | 10 (5.3%) | 9 (3.5%) |
| 2 Vehicles | 36 (19.0%) | 79 (30.6%) |
| 3 Vehicles | 55 (28.9%) | 63 (24.4%) |
| 4 Vehicles | 32 (16.8%) | 41 (15.9%) |
| 5 or more Vehicles | 52 (27.4%) | 63 (24.4%) |
| Total | 190 (100.0%) | 258 (100.0%) |
Commute Time in St Leon
The most frequently occuring commute durations in St Leon are 45 to 59 minutes (73 commuters, 16.4%), 30 to 34 minutes (65 commuters, 14.6%), and 15 to 19 minutes (53 commuters, 11.9%).
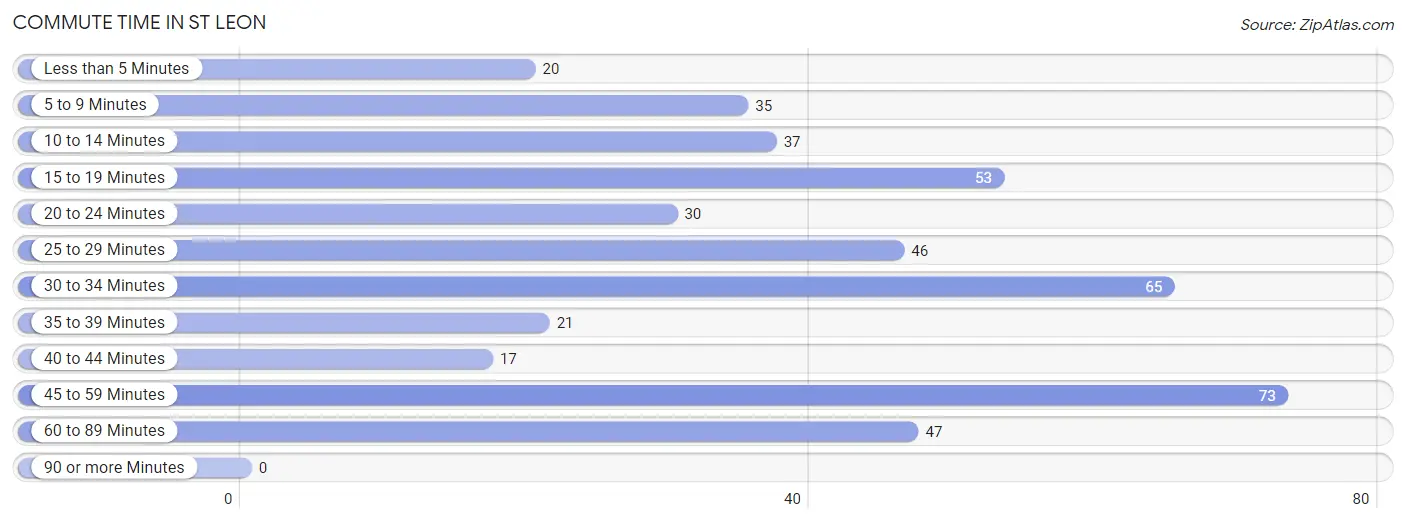
| Commute Time | # Commuters | % Commuters |
| Less than 5 Minutes | 20 | 4.5% |
| 5 to 9 Minutes | 35 | 7.9% |
| 10 to 14 Minutes | 37 | 8.3% |
| 15 to 19 Minutes | 53 | 11.9% |
| 20 to 24 Minutes | 30 | 6.8% |
| 25 to 29 Minutes | 46 | 10.4% |
| 30 to 34 Minutes | 65 | 14.6% |
| 35 to 39 Minutes | 21 | 4.7% |
| 40 to 44 Minutes | 17 | 3.8% |
| 45 to 59 Minutes | 73 | 16.4% |
| 60 to 89 Minutes | 47 | 10.6% |
| 90 or more Minutes | 0 | 0.0% |
Commute Time by Sex in St Leon
The most common commute times in St Leon are 10 to 14 minutes (30 commuters, 16.1%) for males and 45 to 59 minutes (45 commuters, 17.4%) for females.
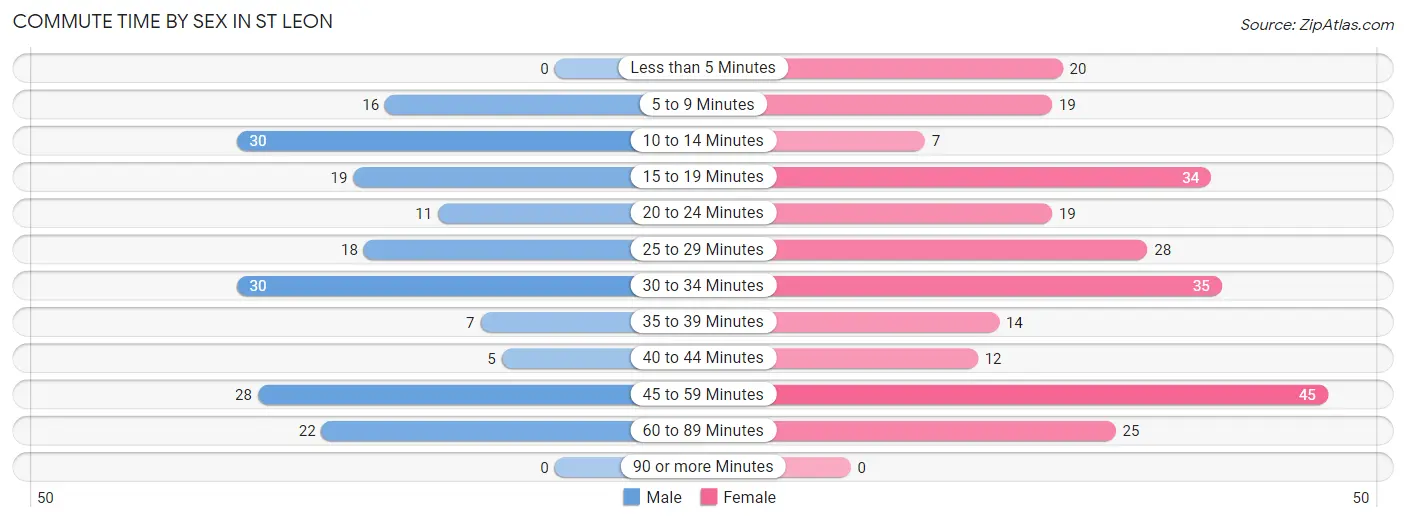
| Commute Time | Male | Female |
| Less than 5 Minutes | 0 (0.0%) | 20 (7.7%) |
| 5 to 9 Minutes | 16 (8.6%) | 19 (7.4%) |
| 10 to 14 Minutes | 30 (16.1%) | 7 (2.7%) |
| 15 to 19 Minutes | 19 (10.2%) | 34 (13.2%) |
| 20 to 24 Minutes | 11 (5.9%) | 19 (7.4%) |
| 25 to 29 Minutes | 18 (9.7%) | 28 (10.8%) |
| 30 to 34 Minutes | 30 (16.1%) | 35 (13.6%) |
| 35 to 39 Minutes | 7 (3.8%) | 14 (5.4%) |
| 40 to 44 Minutes | 5 (2.7%) | 12 (4.6%) |
| 45 to 59 Minutes | 28 (15.0%) | 45 (17.4%) |
| 60 to 89 Minutes | 22 (11.8%) | 25 (9.7%) |
| 90 or more Minutes | 0 (0.0%) | 0 (0.0%) |
Time of Departure to Work by Sex in St Leon
The most frequent times of departure to work in St Leon are 8:00 AM to 8:29 AM (37, 19.9%) for males and 7:00 AM to 7:29 AM (51, 19.8%) for females.
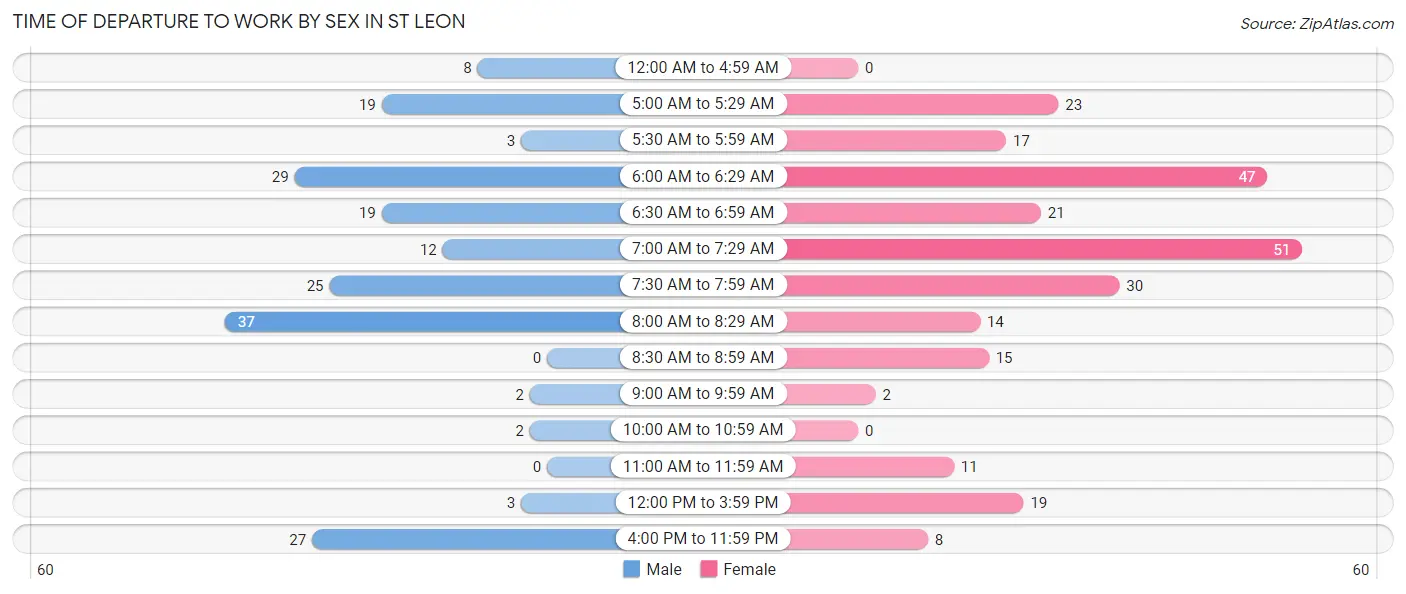
| Time of Departure | Male | Female |
| 12:00 AM to 4:59 AM | 8 (4.3%) | 0 (0.0%) |
| 5:00 AM to 5:29 AM | 19 (10.2%) | 23 (8.9%) |
| 5:30 AM to 5:59 AM | 3 (1.6%) | 17 (6.6%) |
| 6:00 AM to 6:29 AM | 29 (15.6%) | 47 (18.2%) |
| 6:30 AM to 6:59 AM | 19 (10.2%) | 21 (8.1%) |
| 7:00 AM to 7:29 AM | 12 (6.5%) | 51 (19.8%) |
| 7:30 AM to 7:59 AM | 25 (13.4%) | 30 (11.6%) |
| 8:00 AM to 8:29 AM | 37 (19.9%) | 14 (5.4%) |
| 8:30 AM to 8:59 AM | 0 (0.0%) | 15 (5.8%) |
| 9:00 AM to 9:59 AM | 2 (1.1%) | 2 (0.8%) |
| 10:00 AM to 10:59 AM | 2 (1.1%) | 0 (0.0%) |
| 11:00 AM to 11:59 AM | 0 (0.0%) | 11 (4.3%) |
| 12:00 PM to 3:59 PM | 3 (1.6%) | 19 (7.4%) |
| 4:00 PM to 11:59 PM | 27 (14.5%) | 8 (3.1%) |
| Total | 186 (100.0%) | 258 (100.0%) |
Housing Occupancy in St Leon
Occupancy by Ownership in St Leon
Of the total 319 dwellings in St Leon, owner-occupied units account for 223 (69.9%), while renter-occupied units make up 96 (30.1%).
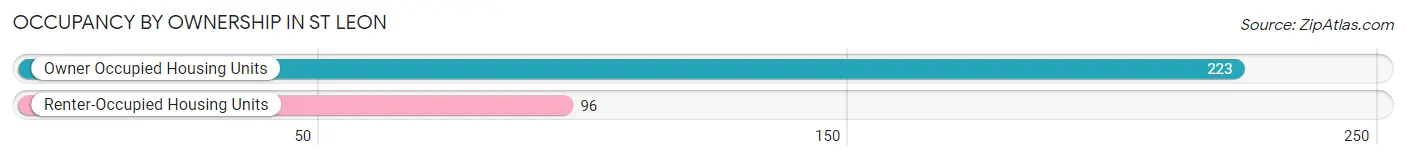
| Occupancy | # Housing Units | % Housing Units |
| Owner Occupied Housing Units | 223 | 69.9% |
| Renter-Occupied Housing Units | 96 | 30.1% |
| Total Occupied Housing Units | 319 | 100.0% |
Occupancy by Household Size in St Leon
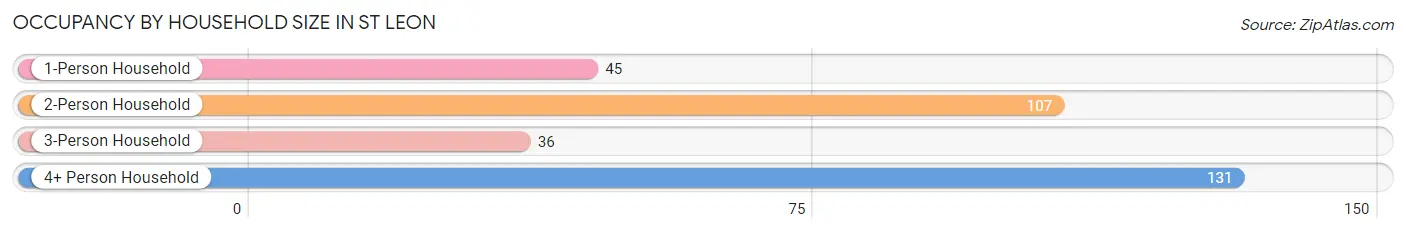
| Household Size | # Housing Units | % Housing Units |
| 1-Person Household | 45 | 14.1% |
| 2-Person Household | 107 | 33.5% |
| 3-Person Household | 36 | 11.3% |
| 4+ Person Household | 131 | 41.1% |
| Total Housing Units | 319 | 100.0% |
Occupancy by Ownership by Household Size in St Leon
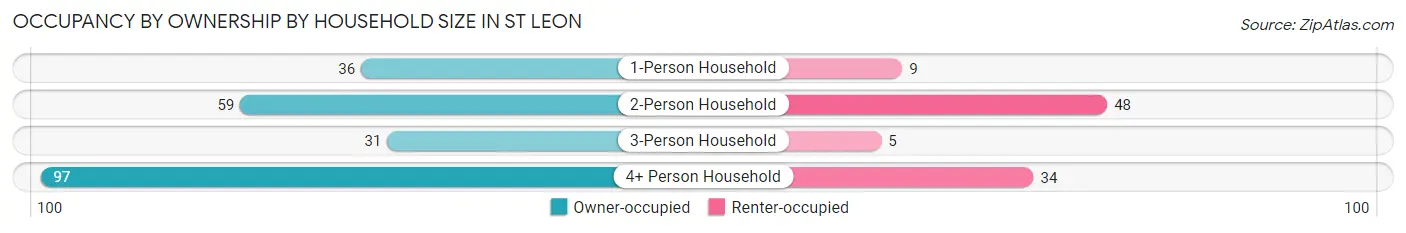
| Household Size | Owner-occupied | Renter-occupied |
| 1-Person Household | 36 (80.0%) | 9 (20.0%) |
| 2-Person Household | 59 (55.1%) | 48 (44.9%) |
| 3-Person Household | 31 (86.1%) | 5 (13.9%) |
| 4+ Person Household | 97 (74.1%) | 34 (26.0%) |
| Total Housing Units | 223 (69.9%) | 96 (30.1%) |
Occupancy by Educational Attainment in St Leon
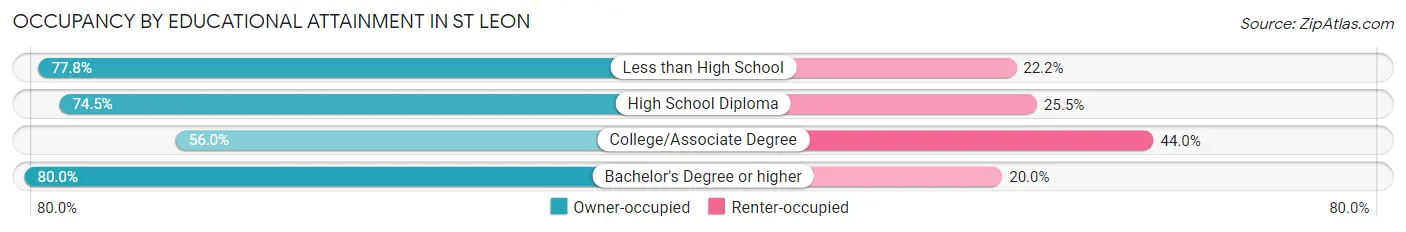
| Household Size | Owner-occupied | Renter-occupied |
| Less than High School | 14 (77.8%) | 4 (22.2%) |
| High School Diploma | 105 (74.5%) | 36 (25.5%) |
| College/Associate Degree | 56 (56.0%) | 44 (44.0%) |
| Bachelor's Degree or higher | 48 (80.0%) | 12 (20.0%) |
Occupancy by Age of Householder in St Leon
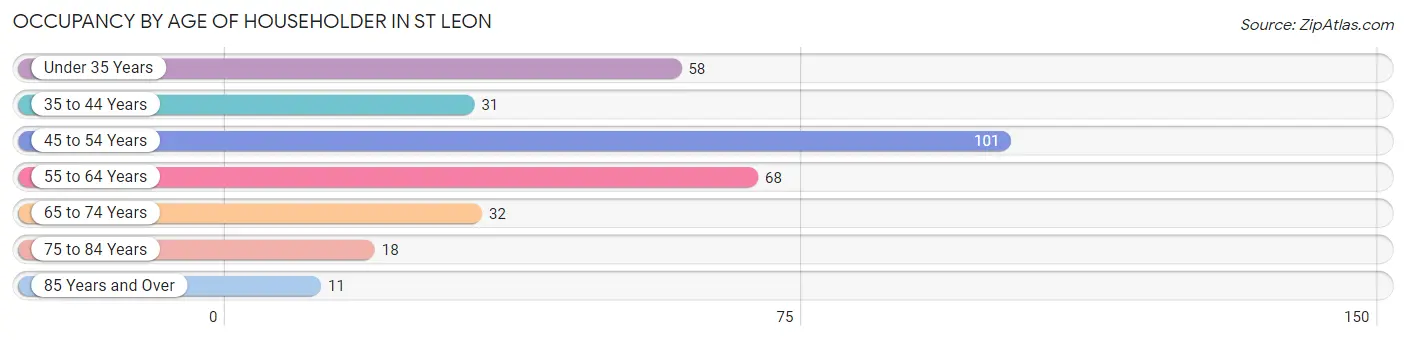
| Age Bracket | # Households | % Households |
| Under 35 Years | 58 | 18.2% |
| 35 to 44 Years | 31 | 9.7% |
| 45 to 54 Years | 101 | 31.7% |
| 55 to 64 Years | 68 | 21.3% |
| 65 to 74 Years | 32 | 10.0% |
| 75 to 84 Years | 18 | 5.6% |
| 85 Years and Over | 11 | 3.5% |
| Total | 319 | 100.0% |
Housing Finances in St Leon
Median Income by Occupancy in St Leon
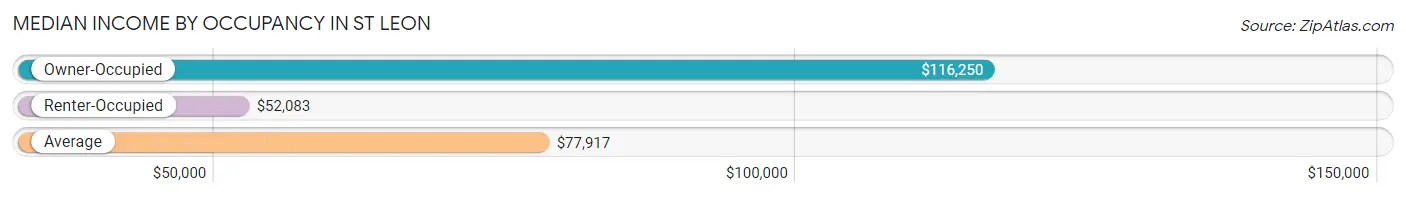
| Occupancy Type | # Households | Median Income |
| Owner-Occupied | 223 (69.9%) | $116,250 |
| Renter-Occupied | 96 (30.1%) | $52,083 |
| Average | 319 (100.0%) | $77,917 |
Occupancy by Householder Income Bracket in St Leon
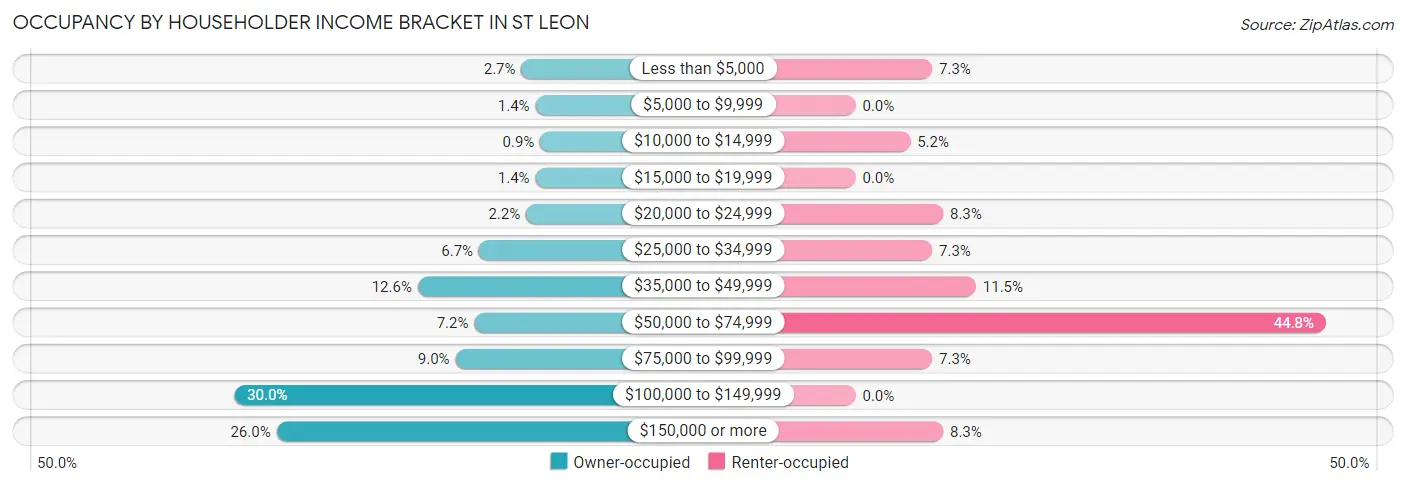
| Income Bracket | Owner-occupied | Renter-occupied |
| Less than $5,000 | 6 (2.7%) | 7 (7.3%) |
| $5,000 to $9,999 | 3 (1.3%) | 0 (0.0%) |
| $10,000 to $14,999 | 2 (0.9%) | 5 (5.2%) |
| $15,000 to $19,999 | 3 (1.3%) | 0 (0.0%) |
| $20,000 to $24,999 | 5 (2.2%) | 8 (8.3%) |
| $25,000 to $34,999 | 15 (6.7%) | 7 (7.3%) |
| $35,000 to $49,999 | 28 (12.6%) | 11 (11.5%) |
| $50,000 to $74,999 | 16 (7.2%) | 43 (44.8%) |
| $75,000 to $99,999 | 20 (9.0%) | 7 (7.3%) |
| $100,000 to $149,999 | 67 (30.0%) | 0 (0.0%) |
| $150,000 or more | 58 (26.0%) | 8 (8.3%) |
| Total | 223 (100.0%) | 96 (100.0%) |
Monthly Housing Cost Tiers in St Leon
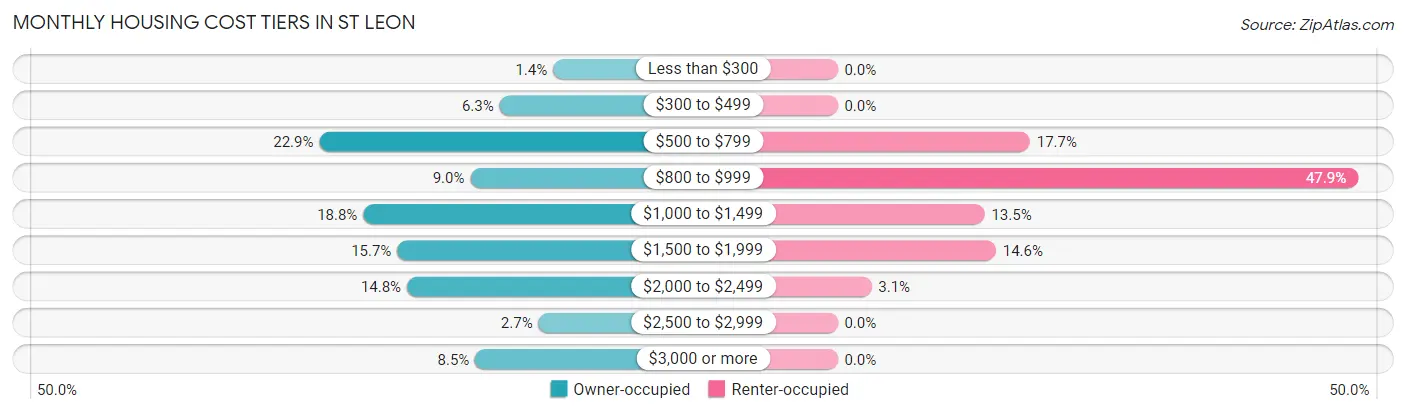
| Monthly Cost | Owner-occupied | Renter-occupied |
| Less than $300 | 3 (1.3%) | 0 (0.0%) |
| $300 to $499 | 14 (6.3%) | 0 (0.0%) |
| $500 to $799 | 51 (22.9%) | 17 (17.7%) |
| $800 to $999 | 20 (9.0%) | 46 (47.9%) |
| $1,000 to $1,499 | 42 (18.8%) | 13 (13.5%) |
| $1,500 to $1,999 | 35 (15.7%) | 14 (14.6%) |
| $2,000 to $2,499 | 33 (14.8%) | 3 (3.1%) |
| $2,500 to $2,999 | 6 (2.7%) | 0 (0.0%) |
| $3,000 or more | 19 (8.5%) | 0 (0.0%) |
| Total | 223 (100.0%) | 96 (100.0%) |
Physical Housing Characteristics in St Leon
Housing Structures in St Leon
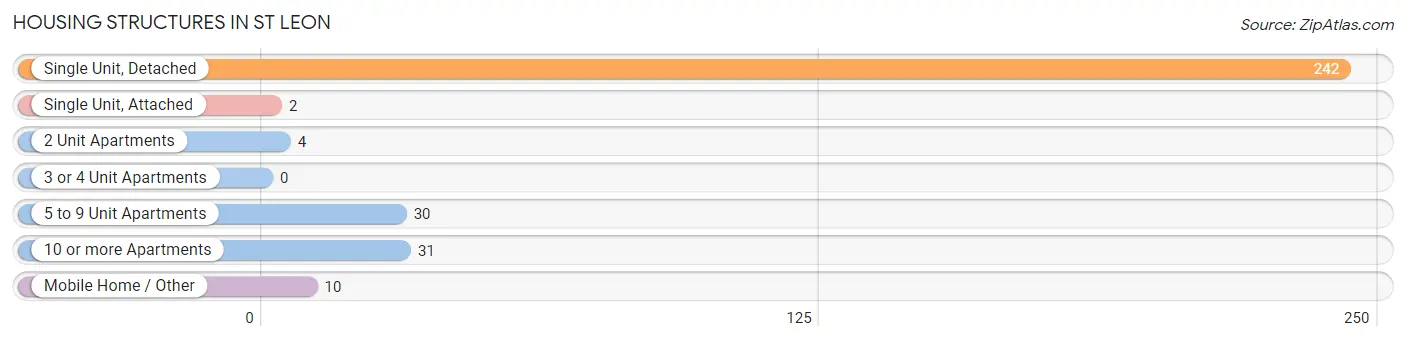
| Structure Type | # Housing Units | % Housing Units |
| Single Unit, Detached | 242 | 75.9% |
| Single Unit, Attached | 2 | 0.6% |
| 2 Unit Apartments | 4 | 1.3% |
| 3 or 4 Unit Apartments | 0 | 0.0% |
| 5 to 9 Unit Apartments | 30 | 9.4% |
| 10 or more Apartments | 31 | 9.7% |
| Mobile Home / Other | 10 | 3.1% |
| Total | 319 | 100.0% |
Housing Structures by Occupancy in St Leon
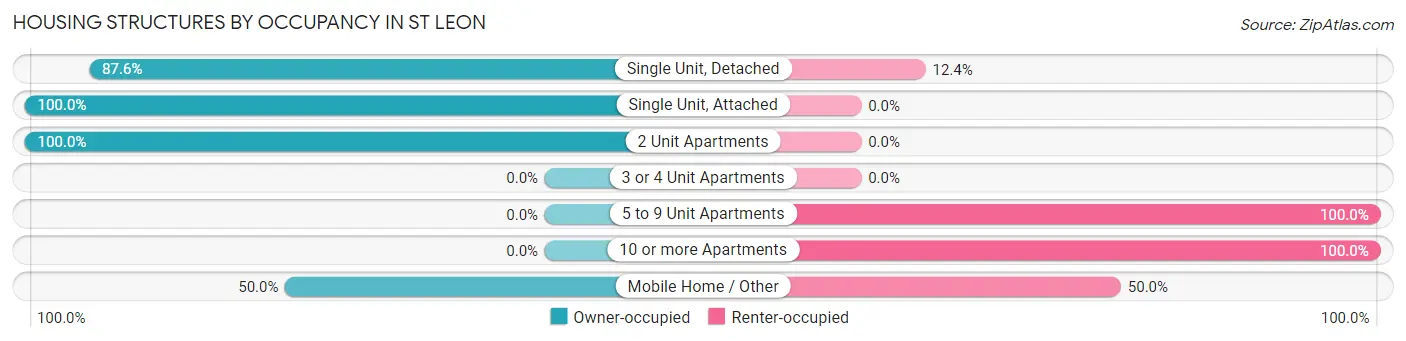
| Structure Type | Owner-occupied | Renter-occupied |
| Single Unit, Detached | 212 (87.6%) | 30 (12.4%) |
| Single Unit, Attached | 2 (100.0%) | 0 (0.0%) |
| 2 Unit Apartments | 4 (100.0%) | 0 (0.0%) |
| 3 or 4 Unit Apartments | 0 (0.0%) | 0 (0.0%) |
| 5 to 9 Unit Apartments | 0 (0.0%) | 30 (100.0%) |
| 10 or more Apartments | 0 (0.0%) | 31 (100.0%) |
| Mobile Home / Other | 5 (50.0%) | 5 (50.0%) |
| Total | 223 (69.9%) | 96 (30.1%) |
Housing Structures by Number of Rooms in St Leon
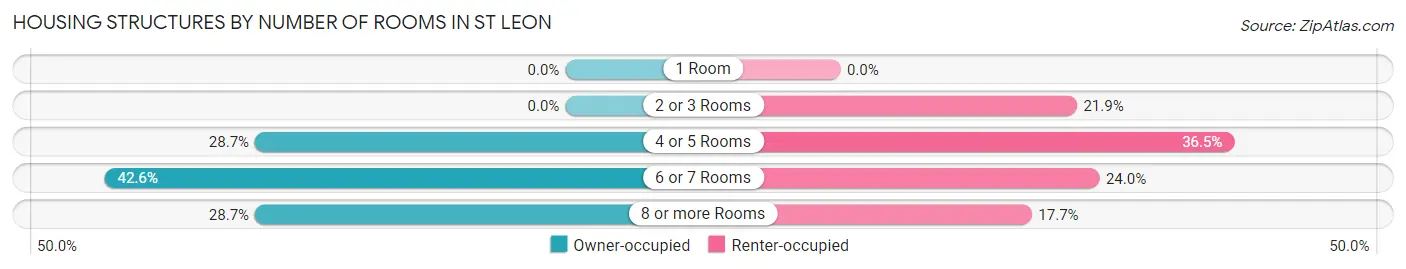
| Number of Rooms | Owner-occupied | Renter-occupied |
| 1 Room | 0 (0.0%) | 0 (0.0%) |
| 2 or 3 Rooms | 0 (0.0%) | 21 (21.9%) |
| 4 or 5 Rooms | 64 (28.7%) | 35 (36.5%) |
| 6 or 7 Rooms | 95 (42.6%) | 23 (24.0%) |
| 8 or more Rooms | 64 (28.7%) | 17 (17.7%) |
| Total | 223 (100.0%) | 96 (100.0%) |
Housing Structure by Heating Type in St Leon
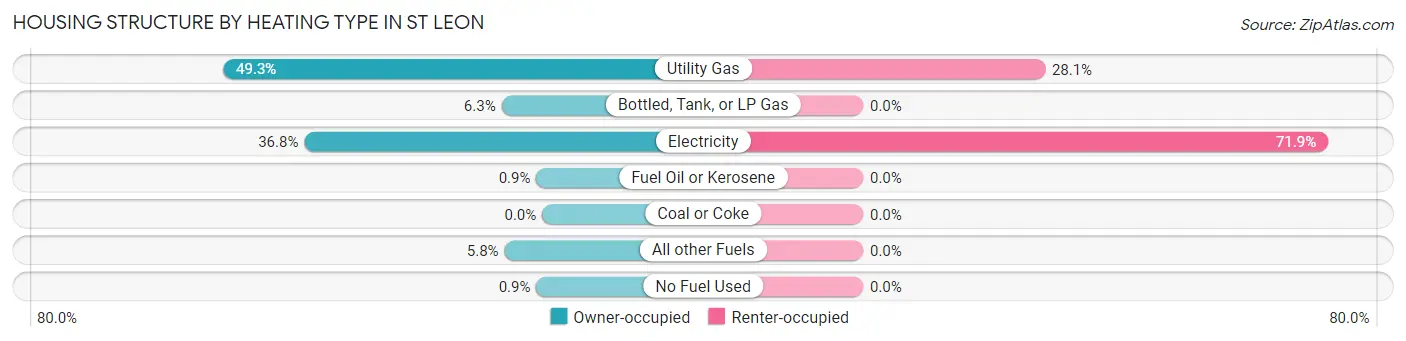
| Heating Type | Owner-occupied | Renter-occupied |
| Utility Gas | 110 (49.3%) | 27 (28.1%) |
| Bottled, Tank, or LP Gas | 14 (6.3%) | 0 (0.0%) |
| Electricity | 82 (36.8%) | 69 (71.9%) |
| Fuel Oil or Kerosene | 2 (0.9%) | 0 (0.0%) |
| Coal or Coke | 0 (0.0%) | 0 (0.0%) |
| All other Fuels | 13 (5.8%) | 0 (0.0%) |
| No Fuel Used | 2 (0.9%) | 0 (0.0%) |
| Total | 223 (100.0%) | 96 (100.0%) |
Household Vehicle Usage in St Leon
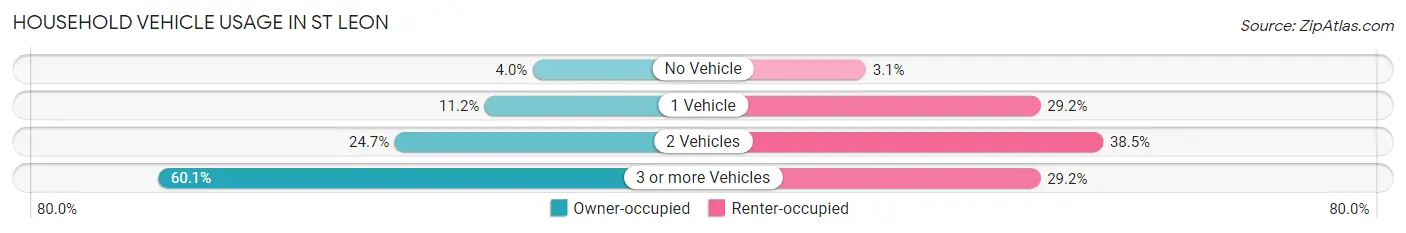
| Vehicles per Household | Owner-occupied | Renter-occupied |
| No Vehicle | 9 (4.0%) | 3 (3.1%) |
| 1 Vehicle | 25 (11.2%) | 28 (29.2%) |
| 2 Vehicles | 55 (24.7%) | 37 (38.5%) |
| 3 or more Vehicles | 134 (60.1%) | 28 (29.2%) |
| Total | 223 (100.0%) | 96 (100.0%) |
Real Estate & Mortgages in St Leon
Real Estate and Mortgage Overview in St Leon
| Characteristic | Without Mortgage | With Mortgage |
| Housing Units | 74 | 149 |
| Median Property Value | $229,600 | $269,400 |
| Median Household Income | $46,000 | $46 |
| Monthly Housing Costs | $600 | $19 |
| Real Estate Taxes | $2,208 | $3 |
Property Value by Mortgage Status in St Leon
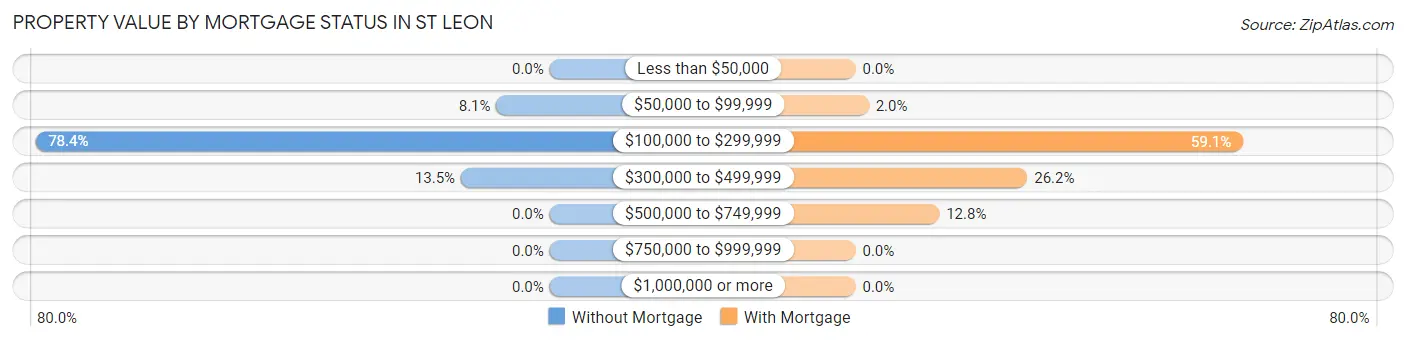
| Property Value | Without Mortgage | With Mortgage |
| Less than $50,000 | 0 (0.0%) | 0 (0.0%) |
| $50,000 to $99,999 | 6 (8.1%) | 3 (2.0%) |
| $100,000 to $299,999 | 58 (78.4%) | 88 (59.1%) |
| $300,000 to $499,999 | 10 (13.5%) | 39 (26.2%) |
| $500,000 to $749,999 | 0 (0.0%) | 19 (12.8%) |
| $750,000 to $999,999 | 0 (0.0%) | 0 (0.0%) |
| $1,000,000 or more | 0 (0.0%) | 0 (0.0%) |
| Total | 74 (100.0%) | 149 (100.0%) |
Household Income by Mortgage Status in St Leon
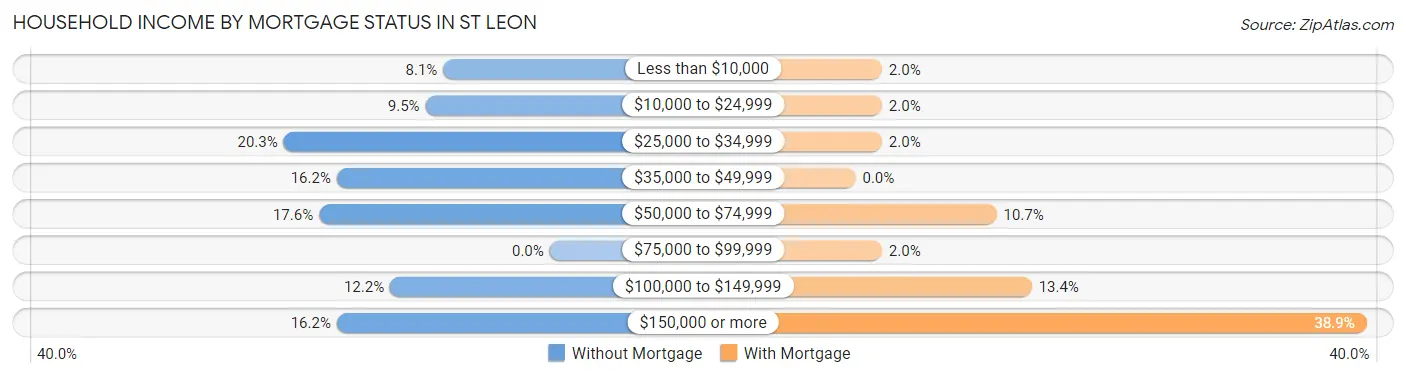
| Household Income | Without Mortgage | With Mortgage |
| Less than $10,000 | 6 (8.1%) | 3 (2.0%) |
| $10,000 to $24,999 | 7 (9.5%) | 3 (2.0%) |
| $25,000 to $34,999 | 15 (20.3%) | 3 (2.0%) |
| $35,000 to $49,999 | 12 (16.2%) | 0 (0.0%) |
| $50,000 to $74,999 | 13 (17.6%) | 16 (10.7%) |
| $75,000 to $99,999 | 0 (0.0%) | 3 (2.0%) |
| $100,000 to $149,999 | 9 (12.2%) | 20 (13.4%) |
| $150,000 or more | 12 (16.2%) | 58 (38.9%) |
| Total | 74 (100.0%) | 149 (100.0%) |
Property Value to Household Income Ratio in St Leon
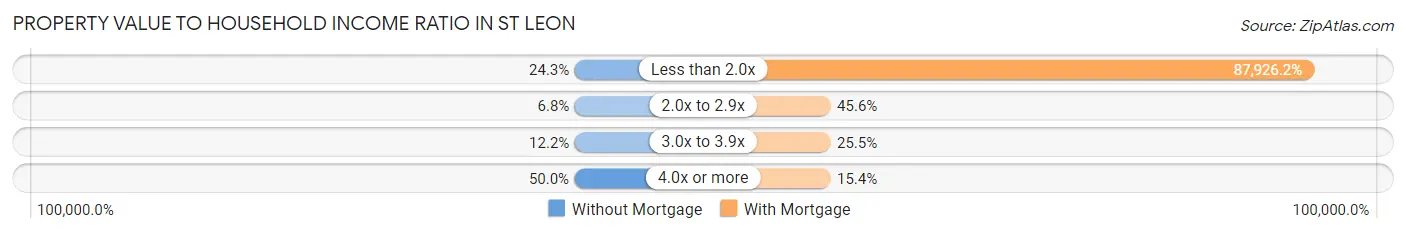
| Value-to-Income Ratio | Without Mortgage | With Mortgage |
| Less than 2.0x | 18 (24.3%) | 131,010 (87,926.2%) |
| 2.0x to 2.9x | 5 (6.8%) | 68 (45.6%) |
| 3.0x to 3.9x | 9 (12.2%) | 38 (25.5%) |
| 4.0x or more | 37 (50.0%) | 23 (15.4%) |
| Total | 74 (100.0%) | 149 (100.0%) |
Real Estate Taxes by Mortgage Status in St Leon
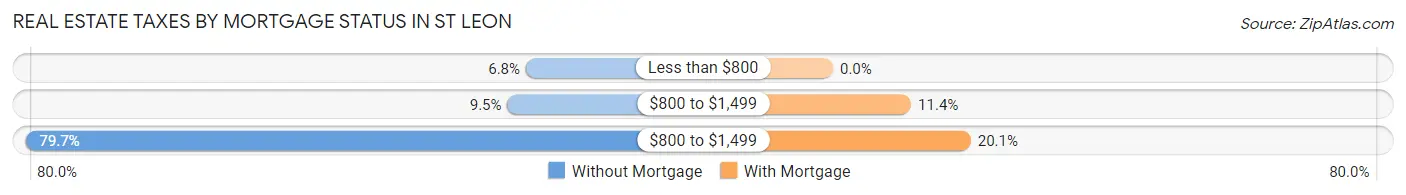
| Property Taxes | Without Mortgage | With Mortgage |
| Less than $800 | 5 (6.8%) | 0 (0.0%) |
| $800 to $1,499 | 7 (9.5%) | 17 (11.4%) |
| $800 to $1,499 | 59 (79.7%) | 30 (20.1%) |
| Total | 74 (100.0%) | 149 (100.0%) |
Health & Disability in St Leon
Health Insurance Coverage by Age in St Leon
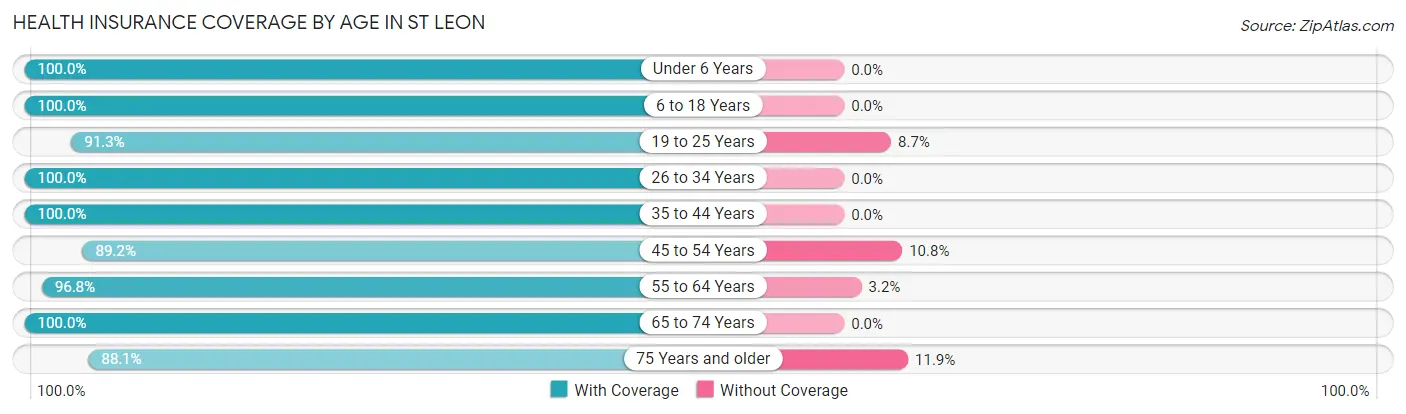
| Age Bracket | With Coverage | Without Coverage |
| Under 6 Years | 54 (100.0%) | 0 (0.0%) |
| 6 to 18 Years | 300 (100.0%) | 0 (0.0%) |
| 19 to 25 Years | 157 (91.3%) | 15 (8.7%) |
| 26 to 34 Years | 71 (100.0%) | 0 (0.0%) |
| 35 to 44 Years | 63 (100.0%) | 0 (0.0%) |
| 45 to 54 Years | 165 (89.2%) | 20 (10.8%) |
| 55 to 64 Years | 120 (96.8%) | 4 (3.2%) |
| 65 to 74 Years | 68 (100.0%) | 0 (0.0%) |
| 75 Years and older | 37 (88.1%) | 5 (11.9%) |
| Total | 1,035 (95.9%) | 44 (4.1%) |
Health Insurance Coverage by Citizenship Status in St Leon
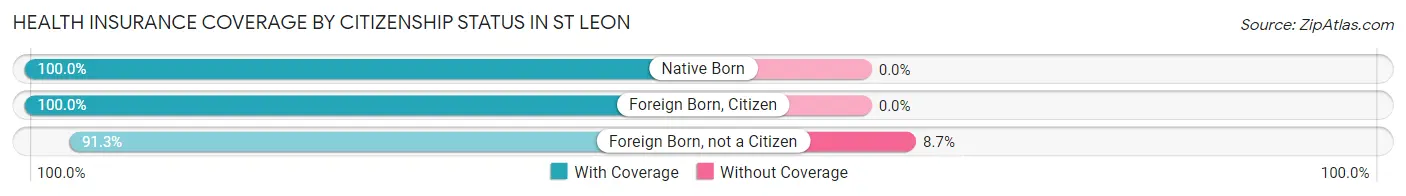
| Citizenship Status | With Coverage | Without Coverage |
| Native Born | 54 (100.0%) | 0 (0.0%) |
| Foreign Born, Citizen | 300 (100.0%) | 0 (0.0%) |
| Foreign Born, not a Citizen | 157 (91.3%) | 15 (8.7%) |
Health Insurance Coverage by Household Income in St Leon
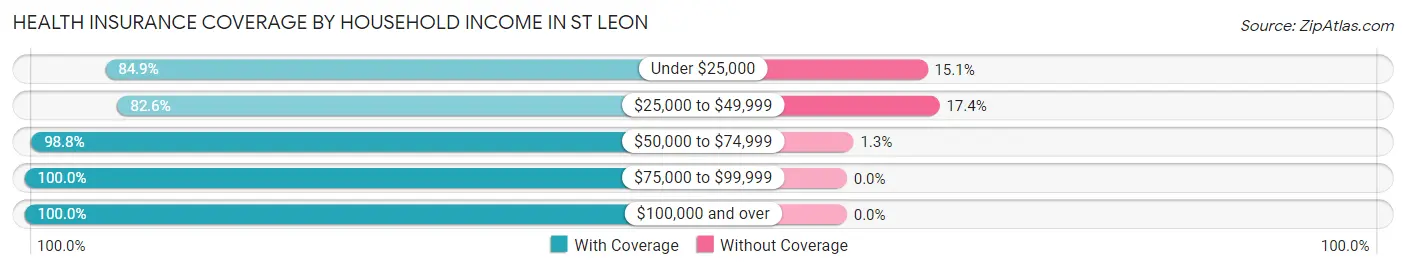
| Household Income | With Coverage | Without Coverage |
| Under $25,000 | 73 (84.9%) | 13 (15.1%) |
| $25,000 to $49,999 | 138 (82.6%) | 29 (17.4%) |
| $50,000 to $74,999 | 158 (98.8%) | 2 (1.3%) |
| $75,000 to $99,999 | 77 (100.0%) | 0 (0.0%) |
| $100,000 and over | 589 (100.0%) | 0 (0.0%) |
Public vs Private Health Insurance Coverage by Age in St Leon
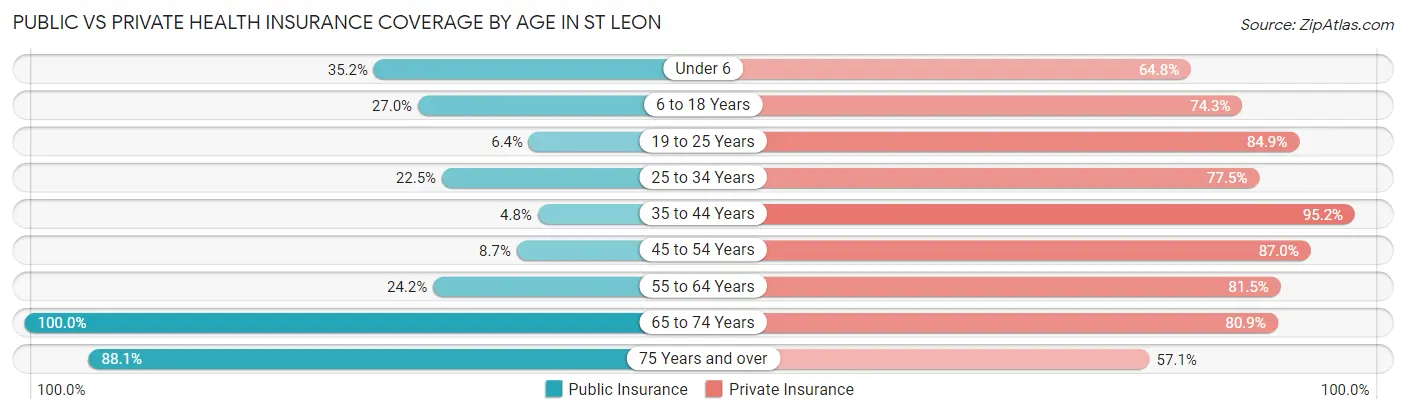
| Age Bracket | Public Insurance | Private Insurance |
| Under 6 | 19 (35.2%) | 35 (64.8%) |
| 6 to 18 Years | 81 (27.0%) | 223 (74.3%) |
| 19 to 25 Years | 11 (6.4%) | 146 (84.9%) |
| 25 to 34 Years | 16 (22.5%) | 55 (77.5%) |
| 35 to 44 Years | 3 (4.8%) | 60 (95.2%) |
| 45 to 54 Years | 16 (8.6%) | 161 (87.0%) |
| 55 to 64 Years | 30 (24.2%) | 101 (81.5%) |
| 65 to 74 Years | 68 (100.0%) | 55 (80.9%) |
| 75 Years and over | 37 (88.1%) | 24 (57.1%) |
| Total | 281 (26.0%) | 860 (79.7%) |
Disability Status by Sex by Age in St Leon
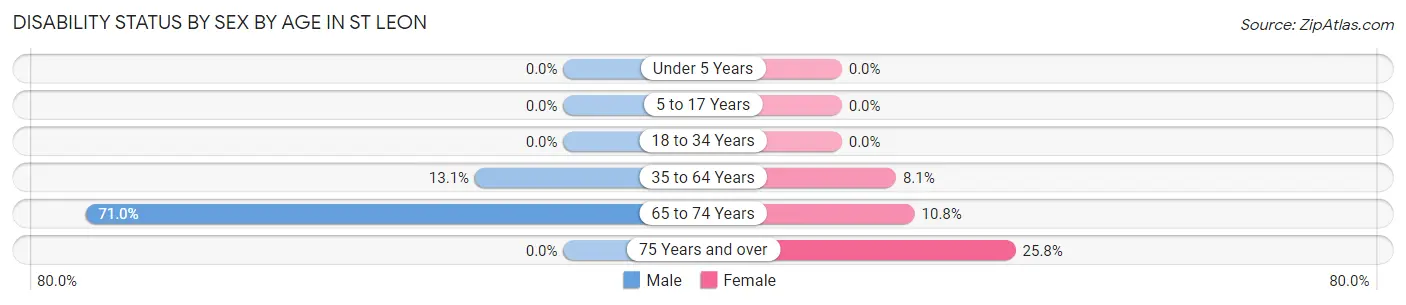
| Age Bracket | Male | Female |
| Under 5 Years | 0 (0.0%) | 0 (0.0%) |
| 5 to 17 Years | 0 (0.0%) | 0 (0.0%) |
| 18 to 34 Years | 0 (0.0%) | 0 (0.0%) |
| 35 to 64 Years | 26 (13.1%) | 14 (8.1%) |
| 65 to 74 Years | 22 (71.0%) | 4 (10.8%) |
| 75 Years and over | 0 (0.0%) | 8 (25.8%) |
Disability Class by Sex by Age in St Leon
Disability Class: Hearing Difficulty
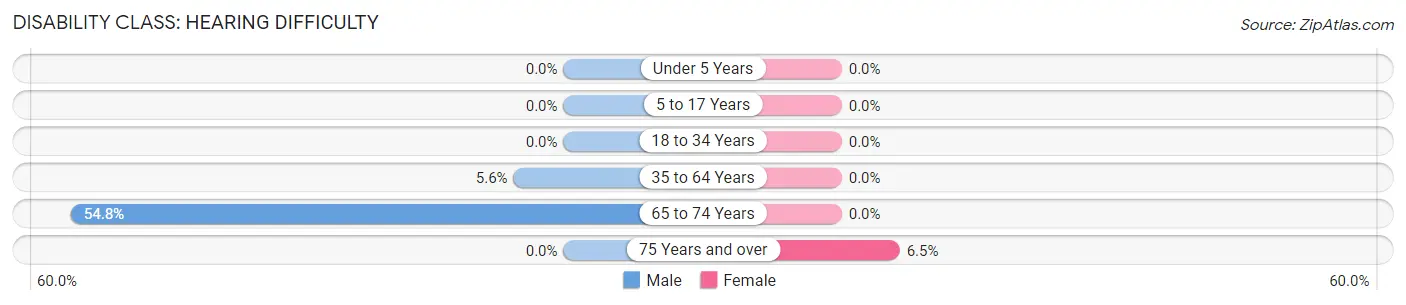
| Age Bracket | Male | Female |
| Under 5 Years | 0 (0.0%) | 0 (0.0%) |
| 5 to 17 Years | 0 (0.0%) | 0 (0.0%) |
| 18 to 34 Years | 0 (0.0%) | 0 (0.0%) |
| 35 to 64 Years | 11 (5.6%) | 0 (0.0%) |
| 65 to 74 Years | 17 (54.8%) | 0 (0.0%) |
| 75 Years and over | 0 (0.0%) | 2 (6.5%) |
Disability Class: Vision Difficulty
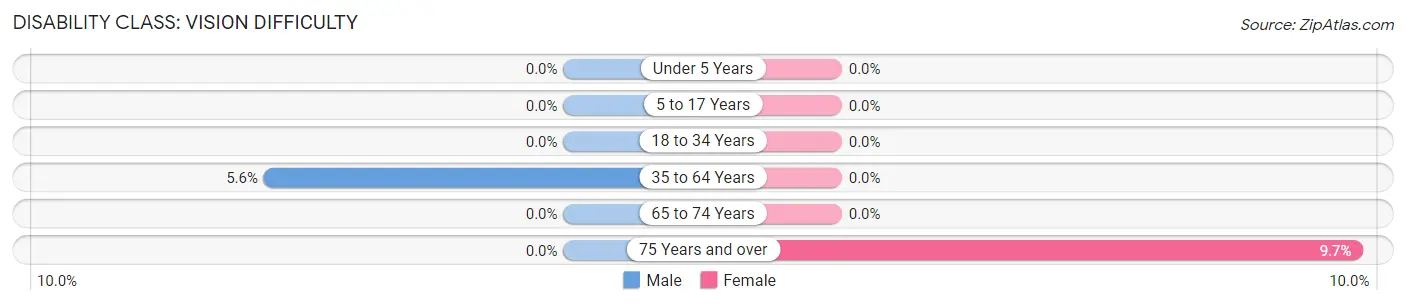
| Age Bracket | Male | Female |
| Under 5 Years | 0 (0.0%) | 0 (0.0%) |
| 5 to 17 Years | 0 (0.0%) | 0 (0.0%) |
| 18 to 34 Years | 0 (0.0%) | 0 (0.0%) |
| 35 to 64 Years | 11 (5.6%) | 0 (0.0%) |
| 65 to 74 Years | 0 (0.0%) | 0 (0.0%) |
| 75 Years and over | 0 (0.0%) | 3 (9.7%) |
Disability Class: Cognitive Difficulty
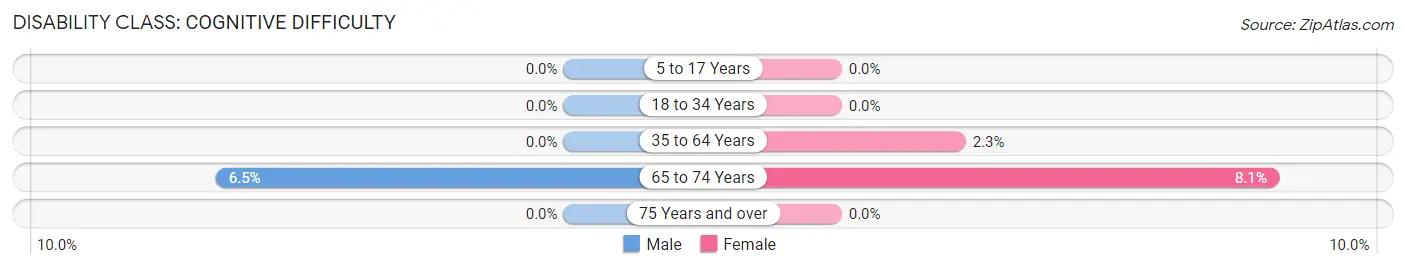
| Age Bracket | Male | Female |
| 5 to 17 Years | 0 (0.0%) | 0 (0.0%) |
| 18 to 34 Years | 0 (0.0%) | 0 (0.0%) |
| 35 to 64 Years | 0 (0.0%) | 4 (2.3%) |
| 65 to 74 Years | 2 (6.5%) | 3 (8.1%) |
| 75 Years and over | 0 (0.0%) | 0 (0.0%) |
Disability Class: Ambulatory Difficulty
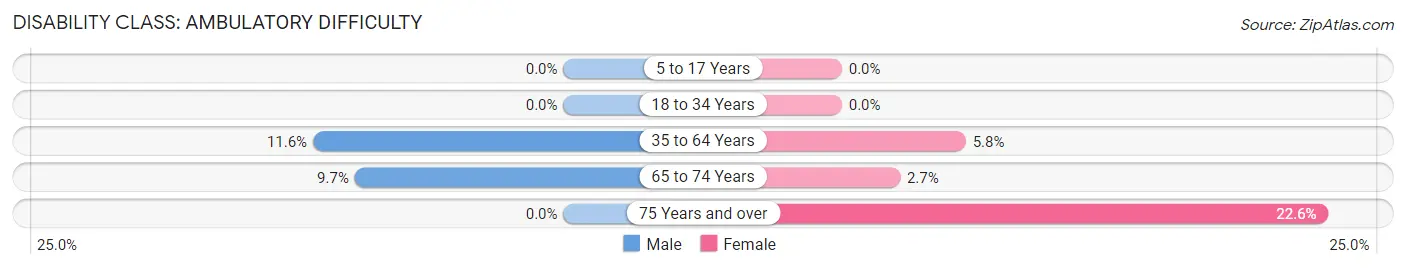
| Age Bracket | Male | Female |
| 5 to 17 Years | 0 (0.0%) | 0 (0.0%) |
| 18 to 34 Years | 0 (0.0%) | 0 (0.0%) |
| 35 to 64 Years | 23 (11.6%) | 10 (5.8%) |
| 65 to 74 Years | 3 (9.7%) | 1 (2.7%) |
| 75 Years and over | 0 (0.0%) | 7 (22.6%) |
Disability Class: Self-Care Difficulty
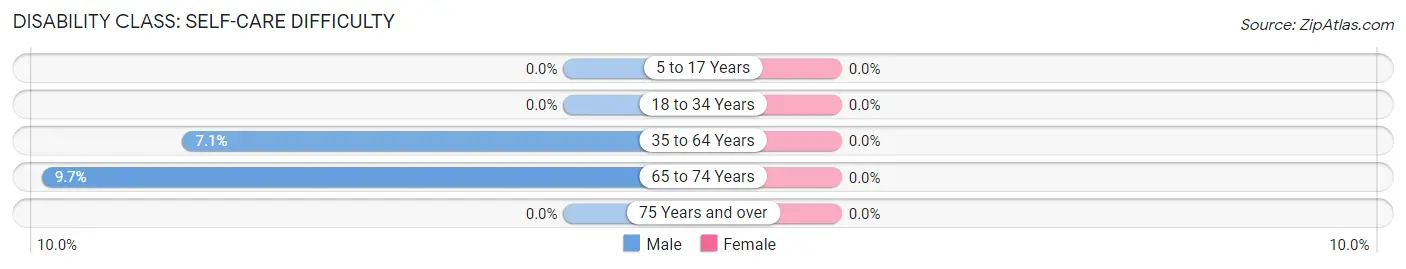
| Age Bracket | Male | Female |
| 5 to 17 Years | 0 (0.0%) | 0 (0.0%) |
| 18 to 34 Years | 0 (0.0%) | 0 (0.0%) |
| 35 to 64 Years | 14 (7.1%) | 0 (0.0%) |
| 65 to 74 Years | 3 (9.7%) | 0 (0.0%) |
| 75 Years and over | 0 (0.0%) | 0 (0.0%) |
Technology Access in St Leon
Computing Device Access in St Leon
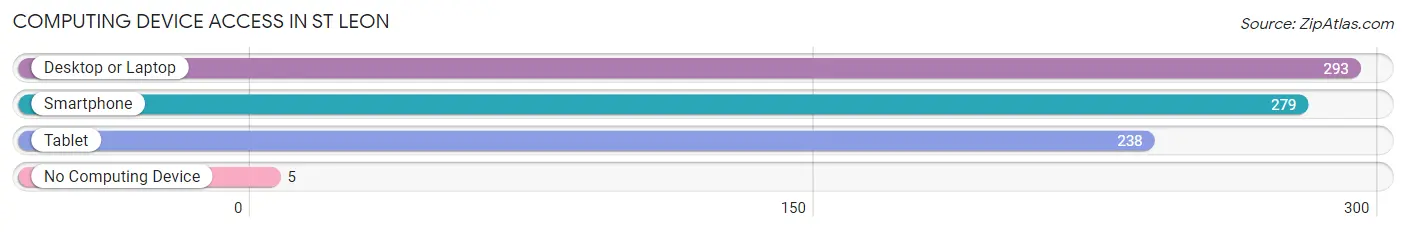
| Device Type | # Households | % Households |
| Desktop or Laptop | 293 | 91.8% |
| Smartphone | 279 | 87.5% |
| Tablet | 238 | 74.6% |
| No Computing Device | 5 | 1.6% |
| Total | 319 | 100.0% |
Internet Access in St Leon
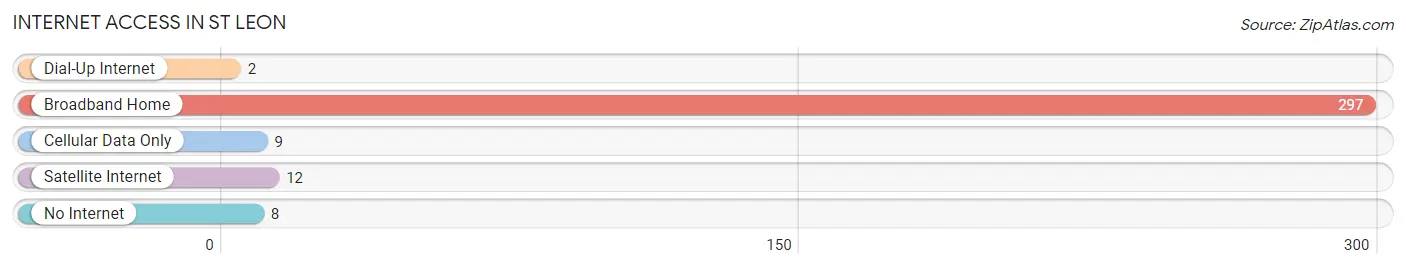
| Internet Type | # Households | % Households |
| Dial-Up Internet | 2 | 0.6% |
| Broadband Home | 297 | 93.1% |
| Cellular Data Only | 9 | 2.8% |
| Satellite Internet | 12 | 3.8% |
| No Internet | 8 | 2.5% |
| Total | 319 | 100.0% |
St Leon Summary
St Leon is a small town located in the southeastern corner of Indiana, in the United States. It is situated in the county of Dearborn, and is part of the Cincinnati metropolitan area. The town has a population of approximately 1,000 people, and is known for its rural charm and small-town atmosphere.
History
St Leon was founded in 1817 by a group of German immigrants who had settled in the area. The town was named after St. Leonhard, a patron saint of the German immigrants. The town was originally a farming community, and the settlers grew a variety of crops, including corn, wheat, and tobacco.
In the late 19th century, the town began to grow and develop. The railroad was extended to St Leon in 1881, and the town became a stop on the Cincinnati, Hamilton, and Dayton Railroad. This allowed the town to become a shipping point for agricultural products, and the town began to grow and prosper.
In the early 20th century, St Leon began to attract more industry. The town was home to several factories, including a furniture factory, a canning factory, and a brickyard. These industries provided employment for many of the town’s residents, and helped to further the town’s growth.
Geography
St Leon is located in the southeastern corner of Indiana, in the county of Dearborn. The town is situated on the banks of the Ohio River, and is part of the Cincinnati metropolitan area. The town is located approximately 25 miles west of Cincinnati, and is approximately 50 miles east of Indianapolis.
The town is situated in a rural area, and is surrounded by rolling hills and farmland. The town is located in a temperate climate, and experiences four distinct seasons. The average temperature in the summer is around 80 degrees Fahrenheit, and the average temperature in the winter is around 30 degrees Fahrenheit.
Economy
St Leon’s economy is largely based on agriculture and manufacturing. The town is home to several factories, including a furniture factory, a canning factory, and a brickyard. These industries provide employment for many of the town’s residents, and help to support the local economy.
The town is also home to several small businesses, including restaurants, shops, and other services. These businesses provide employment for many of the town’s residents, and help to support the local economy.
Demographics
As of the 2010 census, St Leon had a population of 1,000 people. The town is predominantly white, with approximately 95% of the population being white. The town also has a small Hispanic population, with approximately 4% of the population being Hispanic. The town also has a small African American population, with approximately 1% of the population being African American.
The median household income in St Leon is approximately $45,000, and the median home value is approximately $150,000. The town has a low unemployment rate, and the majority of the town’s residents are employed in either agriculture or manufacturing.
Conclusion
St Leon is a small town located in the southeastern corner of Indiana, in the United States. The town has a population of approximately 1,000 people, and is known for its rural charm and small-town atmosphere. The town’s economy is largely based on agriculture and manufacturing, and the town is home to several small businesses. The town is predominantly white, with a small Hispanic and African American population. The median household income in St Leon is approximately $45,000, and the median home value is approximately $150,000.
Common Questions
What is Per Capita Income in St Leon?
Per Capita income in St Leon is $31,241.
What is the Median Family Income in St Leon?
Median Family Income in St Leon is $85,625.
What is the Median Household income in St Leon?
Median Household Income in St Leon is $77,917.
What is Income or Wage Gap in St Leon?
Income or Wage Gap in St Leon is 24.2%.
Women in St Leon earn 75.8 cents for every dollar earned by a man.
What is Inequality or Gini Index in St Leon?
Inequality or Gini Index in St Leon is 0.45.
What is the Total Population of St Leon?
Total Population of St Leon is 1,079.
What is the Total Male Population of St Leon?
Total Male Population of St Leon is 531.
What is the Total Female Population of St Leon?
Total Female Population of St Leon is 548.
What is the Ratio of Males per 100 Females in St Leon?
There are 96.90 Males per 100 Females in St Leon.
What is the Ratio of Females per 100 Males in St Leon?
There are 103.20 Females per 100 Males in St Leon.
What is the Median Population Age in St Leon?
Median Population Age in St Leon is 29.2 Years.
What is the Average Family Size in St Leon
Average Family Size in St Leon is 3.9 People.
What is the Average Household Size in St Leon
Average Household Size in St Leon is 3.4 People.
How Large is the Labor Force in St Leon?
There are 464 People in the Labor Forcein in St Leon.
What is the Percentage of People in the Labor Force in St Leon?
55.9% of People are in the Labor Force in St Leon.
What is the Unemployment Rate in St Leon?
Unemployment Rate in St Leon is 0.4%.