Zip Codes with the Highest Percentage of Population Employed in Security & Protection in Evansville, IN
RELATED REPORTS & OPTIONS
Security & Protection
Evansville
Compare Zip Codes
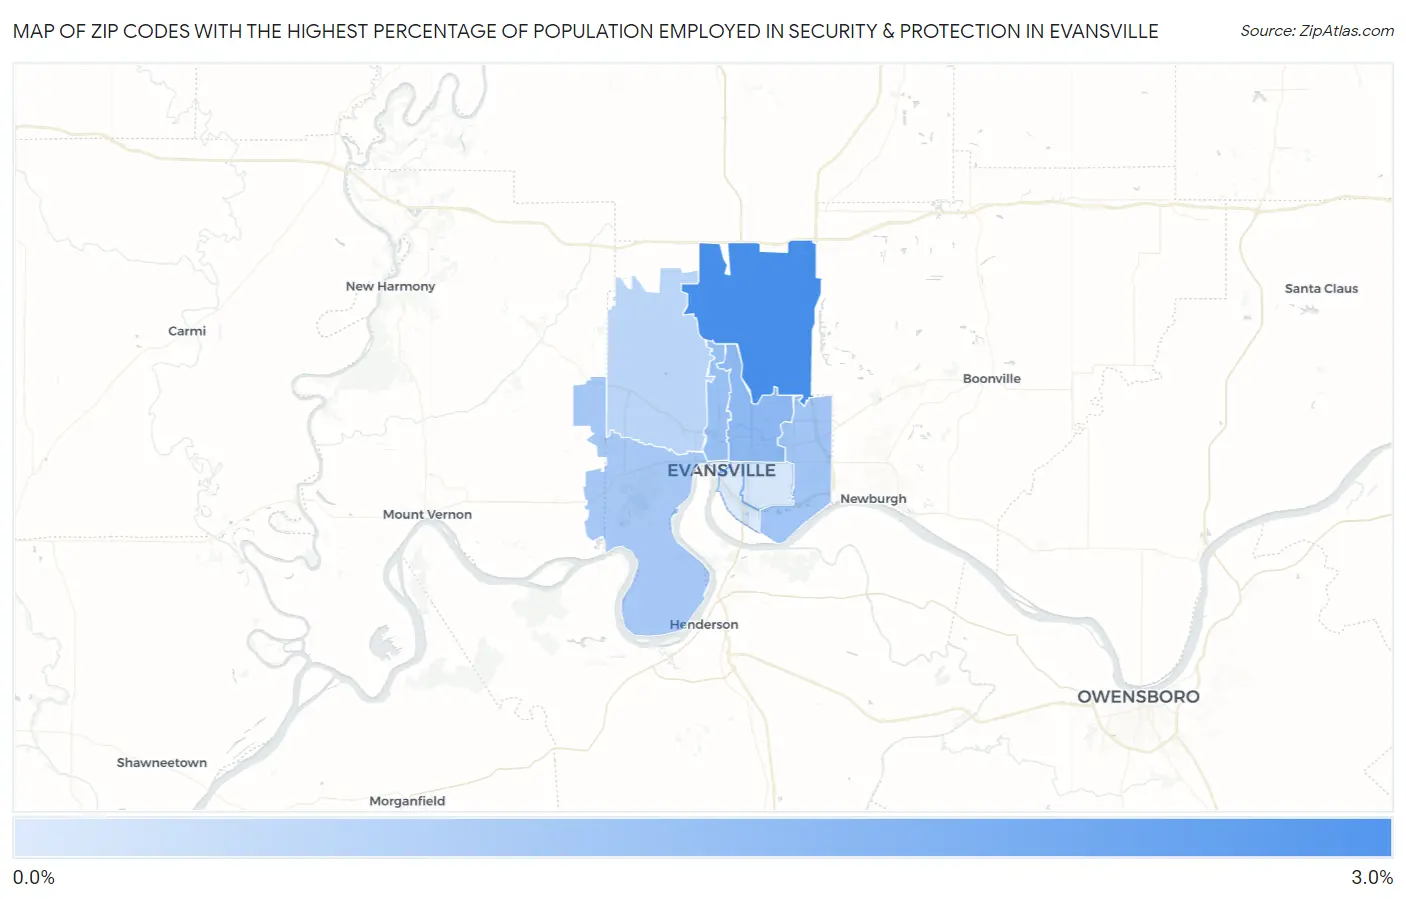
Map of Zip Codes with the Highest Percentage of Population Employed in Security & Protection in Evansville
0.97%
3.0%
Zip Codes with the Highest Percentage of Population Employed in Security & Protection in Evansville, IN
| Zip Code | % Employed | vs State | vs National | |
| 1. | 47725 | 3.0% | 1.8%(+1.20)#123 | 2.1%(+0.825)#7,328 |
| 2. | 47711 | 2.0% | 1.8%(+0.262)#247 | 2.1%(-0.112)#12,335 |
| 3. | 47710 | 1.9% | 1.8%(+0.109)#273 | 2.1%(-0.265)#13,352 |
| 4. | 47715 | 1.8% | 1.8%(+0.001)#302 | 2.1%(-0.373)#14,117 |
| 5. | 47712 | 1.7% | 1.8%(-0.082)#317 | 2.1%(-0.456)#14,735 |
| 6. | 47720 | 1.4% | 1.8%(-0.344)#372 | 2.1%(-0.718)#16,731 |
| 7. | 47714 | 1.1% | 1.8%(-0.716)#452 | 2.1%(-1.09)#19,595 |
| 8. | 47713 | 0.97% | 1.8%(-0.806)#476 | 2.1%(-1.18)#20,306 |
1
Common Questions
What are the Top 5 Zip Codes with the Highest Percentage of Population Employed in Security & Protection in Evansville, IN?
Top 5 Zip Codes with the Highest Percentage of Population Employed in Security & Protection in Evansville, IN are:
What zip code has the Highest Percentage of Population Employed in Security & Protection in Evansville, IN?
47725 has the Highest Percentage of Population Employed in Security & Protection in Evansville, IN with 3.0%.
What is the Percentage of Population Employed in Security & Protection in Evansville, IN?
Percentage of Population Employed in Security & Protection in Evansville is 1.4%.
What is the Percentage of Population Employed in Security & Protection in Indiana?
Percentage of Population Employed in Security & Protection in Indiana is 1.8%.
What is the Percentage of Population Employed in Security & Protection in the United States?
Percentage of Population Employed in Security & Protection in the United States is 2.1%.