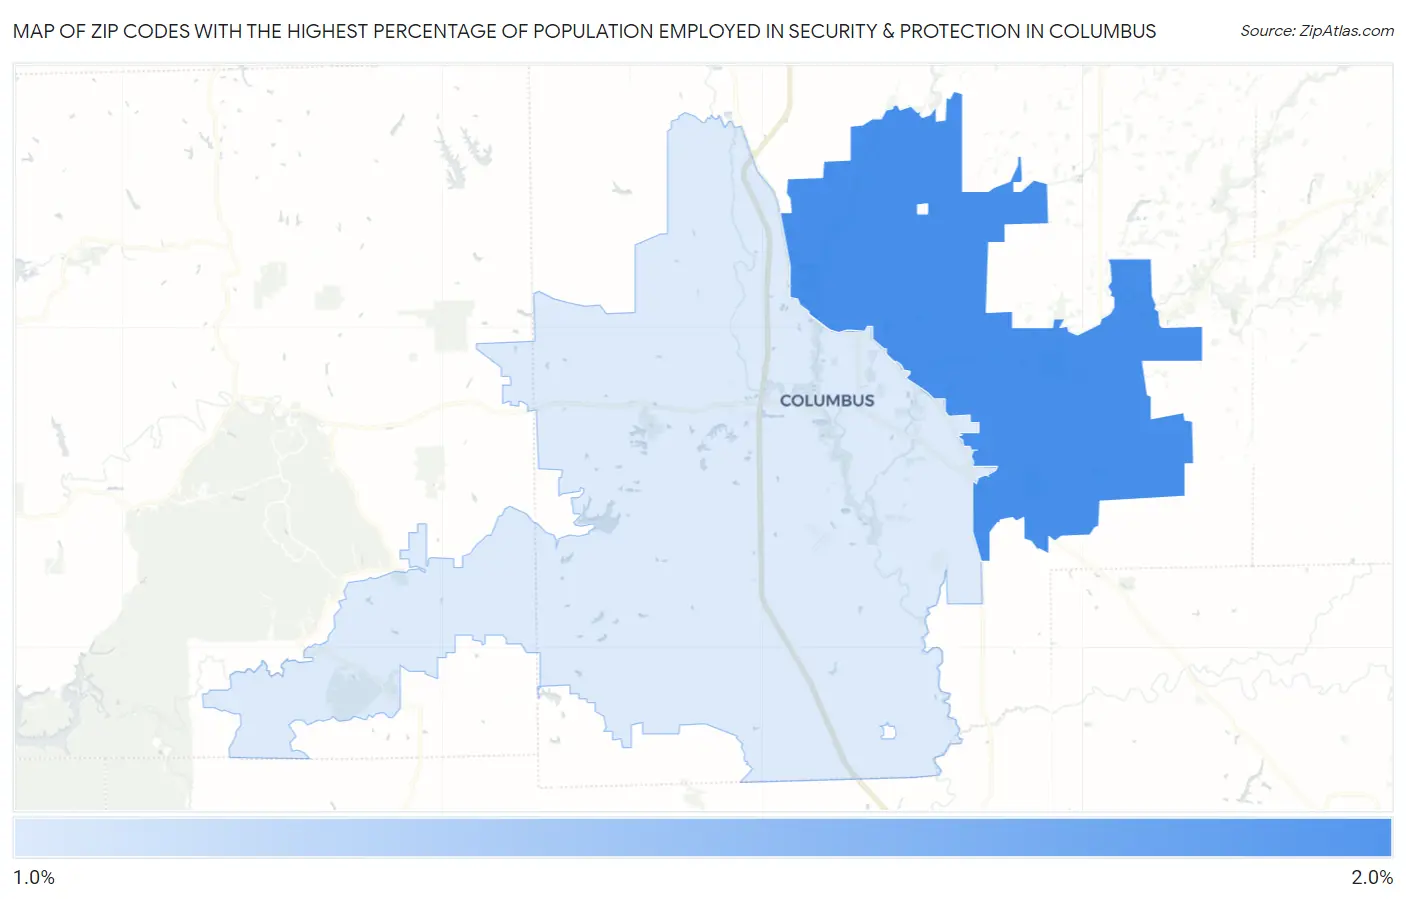
Zip Codes with the Highest Percentage of Population Employed in Security & Protection in Columbus, IN
RELATED REPORTS & OPTIONS
Security & Protection
Columbus
Compare Zip Codes
Map of Zip Codes with the Highest Percentage of Population Employed in Security & Protection in Columbus
1.5%
1.9%
Zip Codes with the Highest Percentage of Population Employed in Security & Protection in Columbus, IN
| Zip Code | % Employed | vs State | vs National | |
| 1. | 47203 | 1.9% | 1.8%(+0.125)#270 | 2.1%(-0.249)#13,224 |
| 2. | 47201 | 1.5% | 1.8%(-0.254)#357 | 2.1%(-0.627)#16,027 |
1
Common Questions
What are the Top Zip Codes with the Highest Percentage of Population Employed in Security & Protection in Columbus, IN?
Top Zip Codes with the Highest Percentage of Population Employed in Security & Protection in Columbus, IN are:
What zip code has the Highest Percentage of Population Employed in Security & Protection in Columbus, IN?
47203 has the Highest Percentage of Population Employed in Security & Protection in Columbus, IN with 1.9%.
What is the Percentage of Population Employed in Security & Protection in Columbus, IN?
Percentage of Population Employed in Security & Protection in Columbus is 1.5%.
What is the Percentage of Population Employed in Security & Protection in Indiana?
Percentage of Population Employed in Security & Protection in Indiana is 1.8%.
What is the Percentage of Population Employed in Security & Protection in the United States?
Percentage of Population Employed in Security & Protection in the United States is 2.1%.