Zip Codes with the Highest Percentage of Population Employed in Security & Protection in Hammond, IN
RELATED REPORTS & OPTIONS
Security & Protection
Hammond
Compare Zip Codes
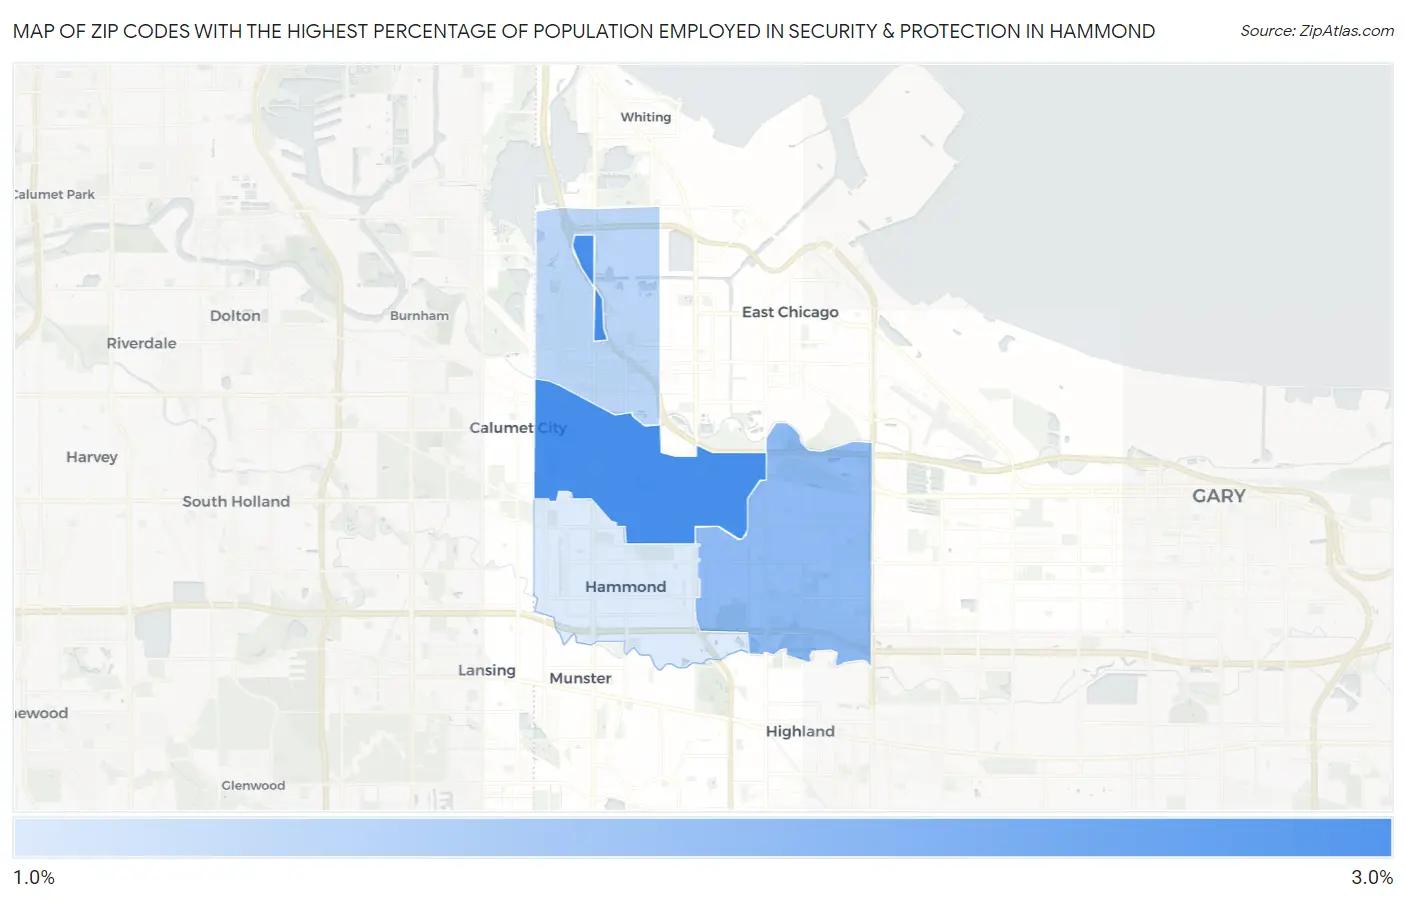
Map of Zip Codes with the Highest Percentage of Population Employed in Security & Protection in Hammond
1.4%
2.7%
Zip Codes with the Highest Percentage of Population Employed in Security & Protection in Hammond, IN
| Zip Code | % Employed | vs State | vs National | |
| 1. | 46320 | 2.7% | 1.8%(+0.901)#155 | 2.1%(+0.527)#8,653 |
| 2. | 46323 | 2.1% | 1.8%(+0.280)#243 | 2.1%(-0.094)#12,216 |
| 3. | 46327 | 1.7% | 1.8%(-0.104)#320 | 2.1%(-0.478)#14,900 |
| 4. | 46324 | 1.4% | 1.8%(-0.417)#397 | 2.1%(-0.791)#17,278 |
1
Common Questions
What are the Top 3 Zip Codes with the Highest Percentage of Population Employed in Security & Protection in Hammond, IN?
Top 3 Zip Codes with the Highest Percentage of Population Employed in Security & Protection in Hammond, IN are:
What zip code has the Highest Percentage of Population Employed in Security & Protection in Hammond, IN?
46320 has the Highest Percentage of Population Employed in Security & Protection in Hammond, IN with 2.7%.
What is the Percentage of Population Employed in Security & Protection in Hammond, IN?
Percentage of Population Employed in Security & Protection in Hammond is 1.9%.
What is the Percentage of Population Employed in Security & Protection in Indiana?
Percentage of Population Employed in Security & Protection in Indiana is 1.8%.
What is the Percentage of Population Employed in Security & Protection in the United States?
Percentage of Population Employed in Security & Protection in the United States is 2.1%.