Kingsbury, IN Map & Demographics
Kingsbury Map
Kingsbury Overview
$29,319
PER CAPITA INCOME
$52,708
AVG FAMILY INCOME
$51,250
AVG HOUSEHOLD INCOME
0.41
INEQUALITY / GINI INDEX
227
TOTAL POPULATION
140
MALE POPULATION
87
FEMALE POPULATION
160.92
MALES / 100 FEMALES
62.14
FEMALES / 100 MALES
50.0
MEDIAN AGE
2.6
AVG FAMILY SIZE
2.1
AVG HOUSEHOLD SIZE
112
LABOR FORCE [ PEOPLE ]
52.6%
PERCENT IN LABOR FORCE
6.3%
UNEMPLOYMENT RATE
Kingsbury Zip Codes
Kingsbury Area Codes
Income in Kingsbury
Income Overview in Kingsbury
Per Capita Income in Kingsbury is $29,319, while median incomes of families and households are $52,708 and $51,250 respectively.
| Characteristic | Number | Measure |
| Per Capita Income | 227 | $29,319 |
| Median Family Income | 73 | $52,708 |
| Mean Family Income | 73 | $66,960 |
| Median Household Income | 106 | $51,250 |
| Mean Household Income | 106 | $62,859 |
| Income Deficit | 73 | $0 |
| Wage / Income Gap (%) | 227 | 0.00% |
| Wage / Income Gap ($) | 227 | 100.00¢ per $1 |
| Gini / Inequality Index | 227 | 0.41 |
Earnings by Sex in Kingsbury
| Sex | Number | Average Earnings |
| Male | 83 (64.3%) | $0 |
| Female | 46 (35.7%) | $0 |
| Total | 129 (100.0%) | $0 |
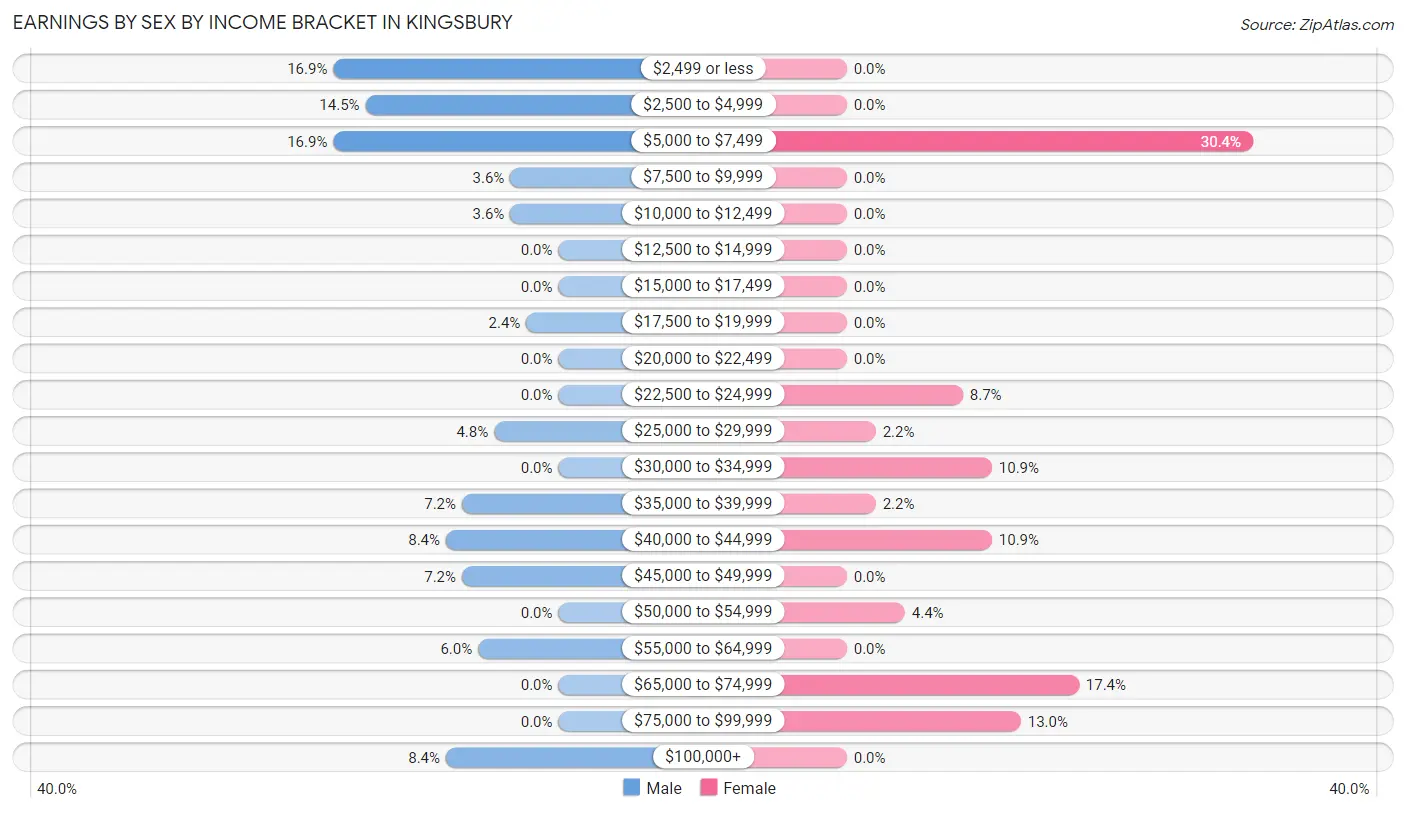
Earnings by Sex by Income Bracket in Kingsbury
The most common earnings brackets in Kingsbury are $2,499 or less for men (14 | 16.9%) and $5,000 to $7,499 for women (14 | 30.4%).
| Income | Male | Female |
| $2,499 or less | 14 (16.9%) | 0 (0.0%) |
| $2,500 to $4,999 | 12 (14.5%) | 0 (0.0%) |
| $5,000 to $7,499 | 14 (16.9%) | 14 (30.4%) |
| $7,500 to $9,999 | 3 (3.6%) | 0 (0.0%) |
| $10,000 to $12,499 | 3 (3.6%) | 0 (0.0%) |
| $12,500 to $14,999 | 0 (0.0%) | 0 (0.0%) |
| $15,000 to $17,499 | 0 (0.0%) | 0 (0.0%) |
| $17,500 to $19,999 | 2 (2.4%) | 0 (0.0%) |
| $20,000 to $22,499 | 0 (0.0%) | 0 (0.0%) |
| $22,500 to $24,999 | 0 (0.0%) | 4 (8.7%) |
| $25,000 to $29,999 | 4 (4.8%) | 1 (2.2%) |
| $30,000 to $34,999 | 0 (0.0%) | 5 (10.9%) |
| $35,000 to $39,999 | 6 (7.2%) | 1 (2.2%) |
| $40,000 to $44,999 | 7 (8.4%) | 5 (10.9%) |
| $45,000 to $49,999 | 6 (7.2%) | 0 (0.0%) |
| $50,000 to $54,999 | 0 (0.0%) | 2 (4.3%) |
| $55,000 to $64,999 | 5 (6.0%) | 0 (0.0%) |
| $65,000 to $74,999 | 0 (0.0%) | 8 (17.4%) |
| $75,000 to $99,999 | 0 (0.0%) | 6 (13.0%) |
| $100,000+ | 7 (8.4%) | 0 (0.0%) |
| Total | 83 (100.0%) | 46 (100.0%) |
Earnings by Sex by Educational Attainment in Kingsbury
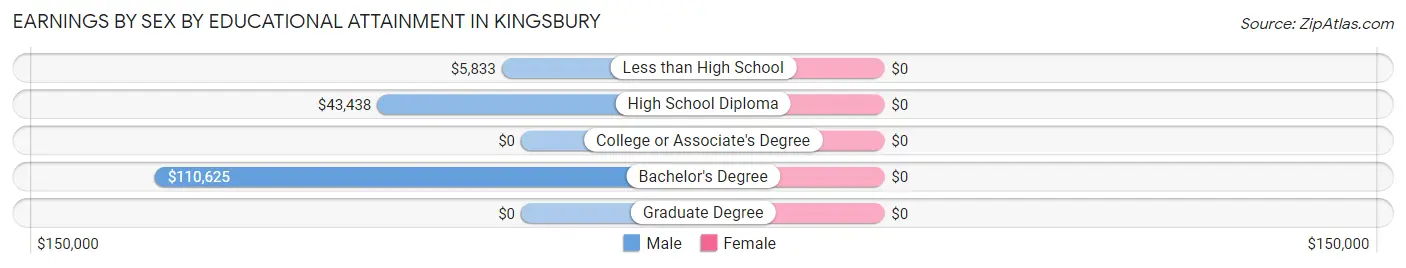
| Educational Attainment | Male Income | Female Income |
| Less than High School | $5,833 | $0 |
| High School Diploma | $43,438 | $0 |
| College or Associate's Degree | - | - |
| Bachelor's Degree | $110,625 | $0 |
| Graduate Degree | - | - |
| Total | - | - |
Family Income in Kingsbury
Family Income Brackets in Kingsbury
According to the Kingsbury family income data, there are 15 families falling into the $100,000 to $149,999 income range, which is the most common income bracket and makes up 20.5% of all families.
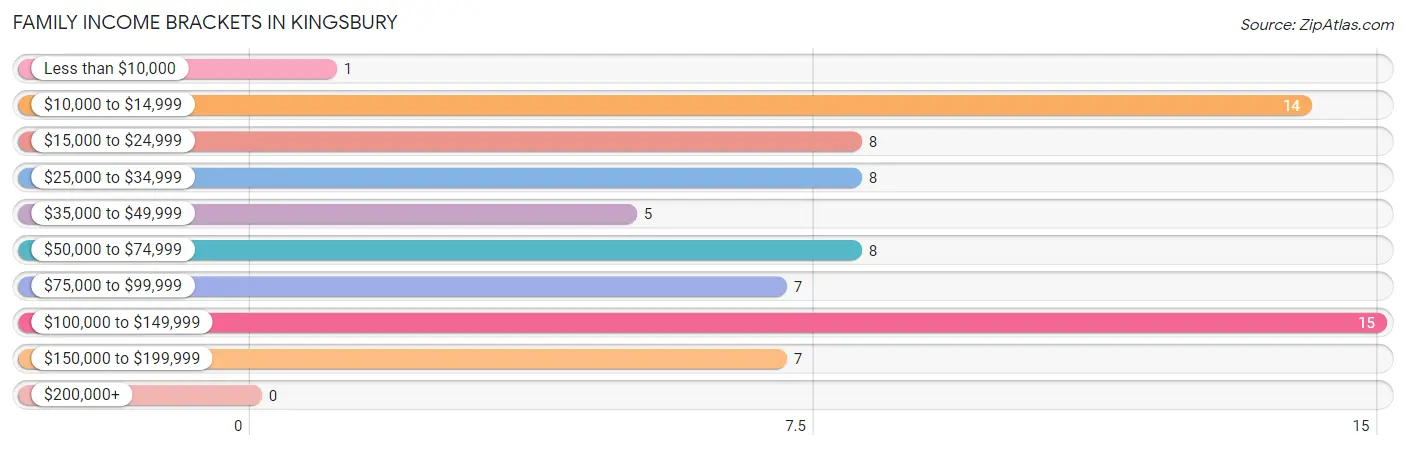
| Income Bracket | # Families | % Families |
| Less than $10,000 | 1 | 1.4% |
| $10,000 to $14,999 | 14 | 19.2% |
| $15,000 to $24,999 | 8 | 11.0% |
| $25,000 to $34,999 | 8 | 11.0% |
| $35,000 to $49,999 | 5 | 6.8% |
| $50,000 to $74,999 | 8 | 11.0% |
| $75,000 to $99,999 | 7 | 9.6% |
| $100,000 to $149,999 | 15 | 20.5% |
| $150,000 to $199,999 | 7 | 9.6% |
| $200,000+ | 0 | 0.0% |
Family Income by Famaliy Size in Kingsbury
3-person families (11 | 15.1%) account for the highest median family income in Kingsbury with $94,375 per family, while 3-person families (11 | 15.1%) have the highest median income of $31,458 per family member.
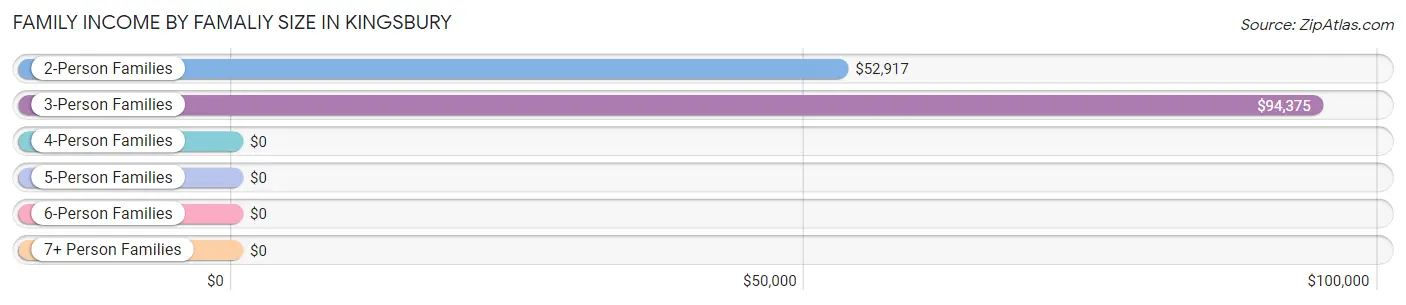
| Income Bracket | # Families | Median Income |
| 2-Person Families | 42 (57.5%) | $52,917 |
| 3-Person Families | 11 (15.1%) | $94,375 |
| 4-Person Families | 20 (27.4%) | $0 |
| 5-Person Families | 0 (0.0%) | $0 |
| 6-Person Families | 0 (0.0%) | $0 |
| 7+ Person Families | 0 (0.0%) | $0 |
| Total | 73 (100.0%) | $52,708 |
Family Income by Number of Earners in Kingsbury
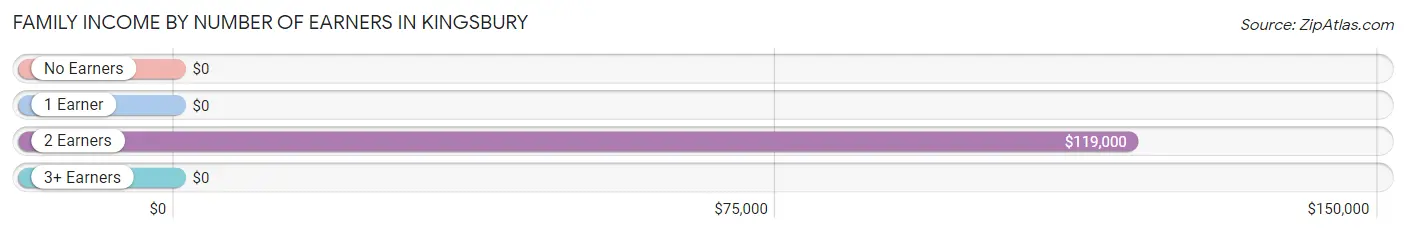
| Number of Earners | # Families | Median Income |
| No Earners | 17 (23.3%) | $0 |
| 1 Earner | 19 (26.0%) | $0 |
| 2 Earners | 20 (27.4%) | $119,000 |
| 3+ Earners | 17 (23.3%) | $0 |
| Total | 73 (100.0%) | $52,708 |
Household Income in Kingsbury
Household Income Brackets in Kingsbury
With 17 households falling in the category, the $15,000 to $24,999 income range is the most frequent in Kingsbury, accounting for 16.0% of all households.
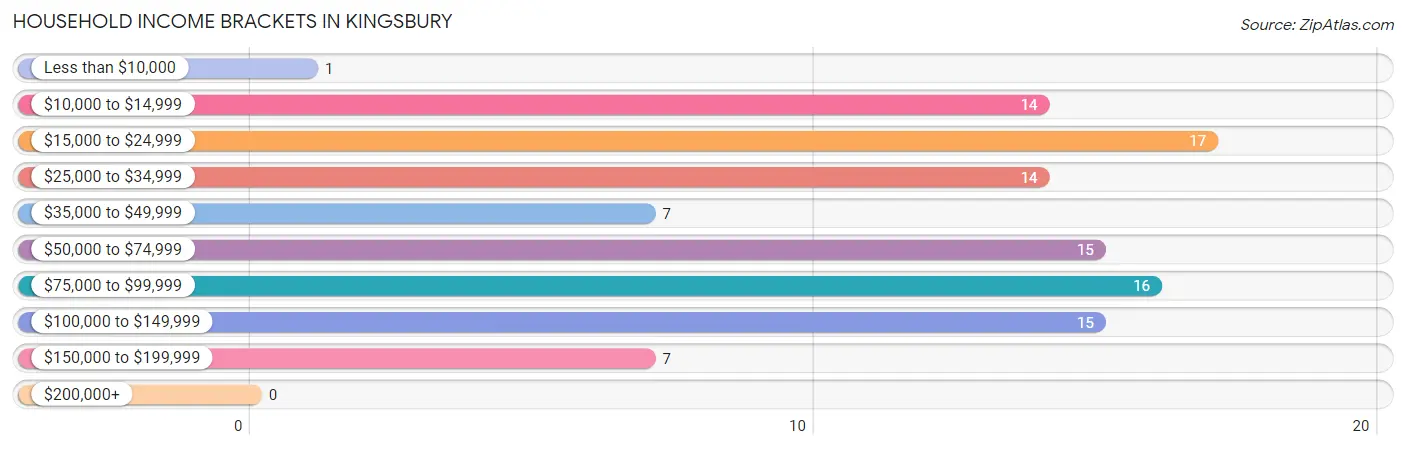
| Income Bracket | # Households | % Households |
| Less than $10,000 | 1 | 0.9% |
| $10,000 to $14,999 | 14 | 13.2% |
| $15,000 to $24,999 | 17 | 16.0% |
| $25,000 to $34,999 | 14 | 13.2% |
| $35,000 to $49,999 | 7 | 6.6% |
| $50,000 to $74,999 | 15 | 14.2% |
| $75,000 to $99,999 | 16 | 15.1% |
| $100,000 to $149,999 | 15 | 14.2% |
| $150,000 to $199,999 | 7 | 6.6% |
| $200,000+ | 0 | 0.0% |
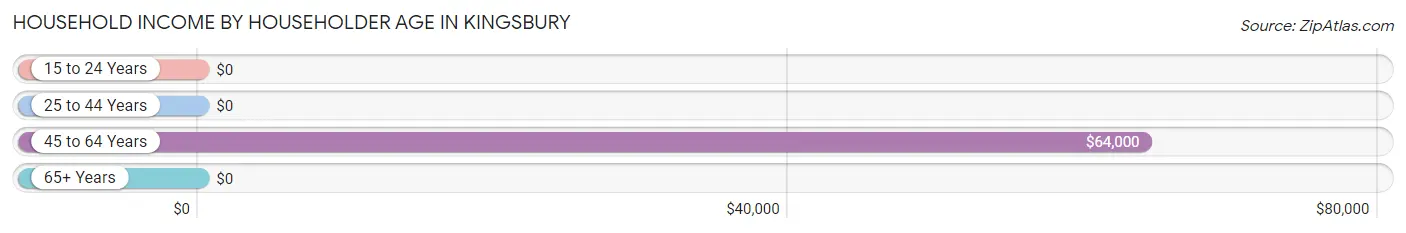
Household Income by Householder Age in Kingsbury
The median household income in Kingsbury is $51,250, with the highest median household income of $64,000 found in the 45 to 64 years age bracket for the primary householder. A total of 34 households (32.1%) fall into this category. Meanwhile, the 15 to 24 years age bracket for the primary householder has the lowest median household income of $0, with 1 households (0.9%) in this group.
| Income Bracket | # Households | Median Income |
| 15 to 24 Years | 1 (0.9%) | $0 |
| 25 to 44 Years | 23 (21.7%) | $0 |
| 45 to 64 Years | 34 (32.1%) | $64,000 |
| 65+ Years | 48 (45.3%) | $0 |
| Total | 106 (100.0%) | $51,250 |
Poverty in Kingsbury
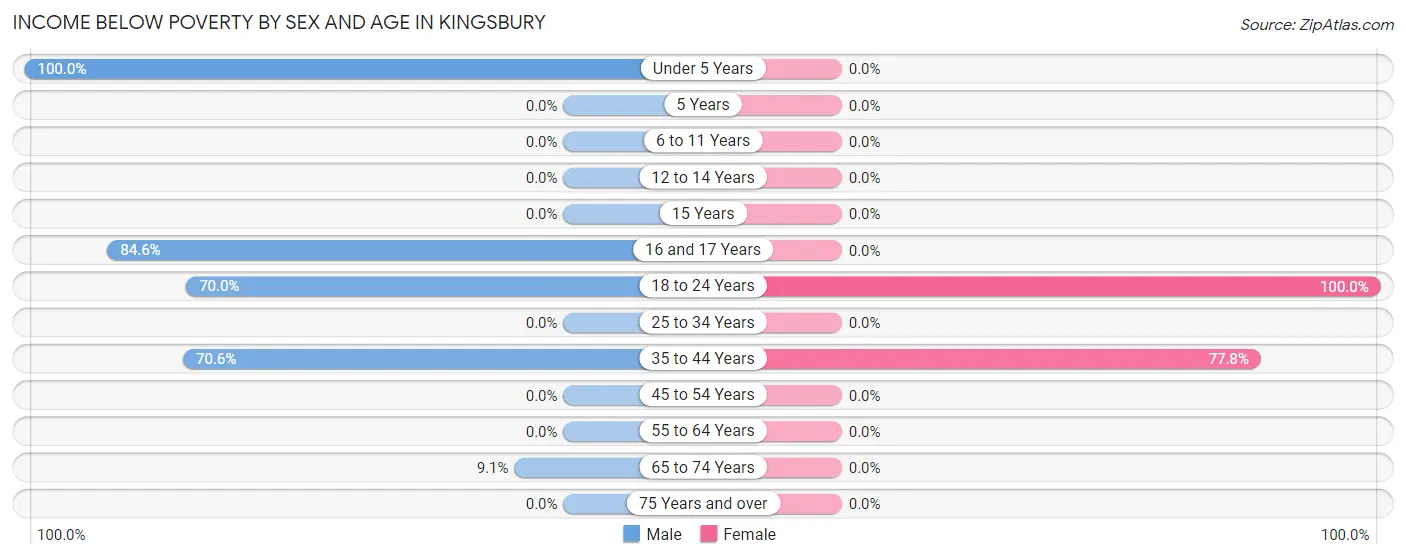
Income Below Poverty by Sex and Age in Kingsbury
With 27.9% poverty level for males and 17.2% for females among the residents of Kingsbury, under 5 year old males and 18 to 24 year old females are the most vulnerable to poverty, with 1 males (100.0%) and 1 females (100.0%) in their respective age groups living below the poverty level.
| Age Bracket | Male | Female |
| Under 5 Years | 1 (100.0%) | 0 (0.0%) |
| 5 Years | 0 (0.0%) | 0 (0.0%) |
| 6 to 11 Years | 0 (0.0%) | 0 (0.0%) |
| 12 to 14 Years | 0 (0.0%) | 0 (0.0%) |
| 15 Years | 0 (0.0%) | 0 (0.0%) |
| 16 and 17 Years | 11 (84.6%) | 0 (0.0%) |
| 18 to 24 Years | 14 (70.0%) | 1 (100.0%) |
| 25 to 34 Years | 0 (0.0%) | 0 (0.0%) |
| 35 to 44 Years | 12 (70.6%) | 14 (77.8%) |
| 45 to 54 Years | 0 (0.0%) | 0 (0.0%) |
| 55 to 64 Years | 0 (0.0%) | 0 (0.0%) |
| 65 to 74 Years | 1 (9.1%) | 0 (0.0%) |
| 75 Years and over | 0 (0.0%) | 0 (0.0%) |
| Total | 39 (27.9%) | 15 (17.2%) |
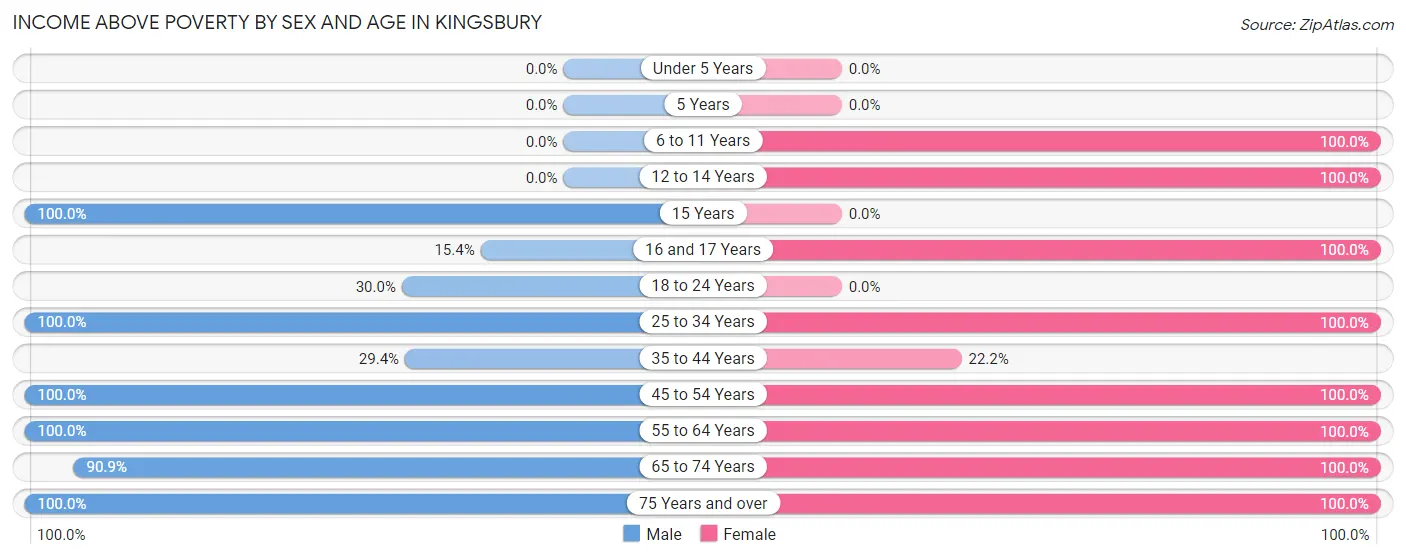
Income Above Poverty by Sex and Age in Kingsbury
According to the poverty statistics in Kingsbury, males aged 15 years and females aged 6 to 11 years are the age groups that are most secure financially, with 100.0% of males and 100.0% of females in these age groups living above the poverty line.
| Age Bracket | Male | Female |
| Under 5 Years | 0 (0.0%) | 0 (0.0%) |
| 5 Years | 0 (0.0%) | 0 (0.0%) |
| 6 to 11 Years | 0 (0.0%) | 2 (100.0%) |
| 12 to 14 Years | 0 (0.0%) | 9 (100.0%) |
| 15 Years | 2 (100.0%) | 0 (0.0%) |
| 16 and 17 Years | 2 (15.4%) | 1 (100.0%) |
| 18 to 24 Years | 6 (30.0%) | 0 (0.0%) |
| 25 to 34 Years | 3 (100.0%) | 6 (100.0%) |
| 35 to 44 Years | 5 (29.4%) | 4 (22.2%) |
| 45 to 54 Years | 29 (100.0%) | 15 (100.0%) |
| 55 to 64 Years | 16 (100.0%) | 7 (100.0%) |
| 65 to 74 Years | 10 (90.9%) | 19 (100.0%) |
| 75 Years and over | 28 (100.0%) | 9 (100.0%) |
| Total | 101 (72.1%) | 72 (82.8%) |
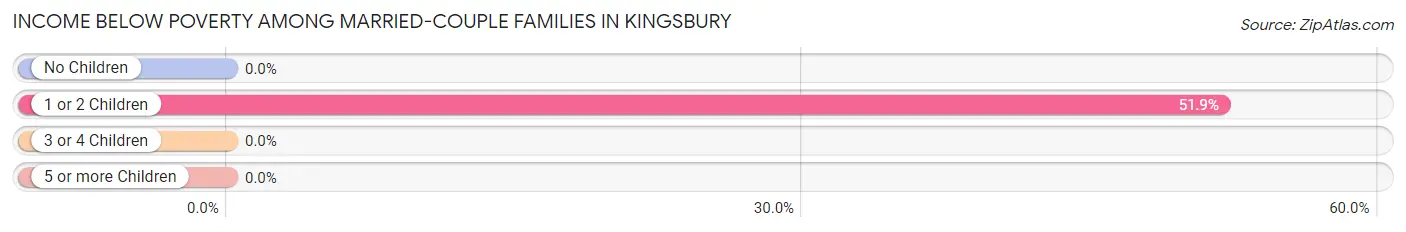
Income Below Poverty Among Married-Couple Families in Kingsbury
The poverty statistics for married-couple families in Kingsbury show that 23.0% or 14 of the total 61 families live below the poverty line. Families with 1 or 2 children have the highest poverty rate of 51.8%, comprising of 14 families. On the other hand, families with no children have the lowest poverty rate of 0.0%, which includes 0 families.
| Children | Above Poverty | Below Poverty |
| No Children | 34 (100.0%) | 0 (0.0%) |
| 1 or 2 Children | 13 (48.1%) | 14 (51.8%) |
| 3 or 4 Children | 0 (0.0%) | 0 (0.0%) |
| 5 or more Children | 0 (0.0%) | 0 (0.0%) |
| Total | 47 (77.0%) | 14 (23.0%) |
Income Below Poverty Among Single-Parent Households in Kingsbury
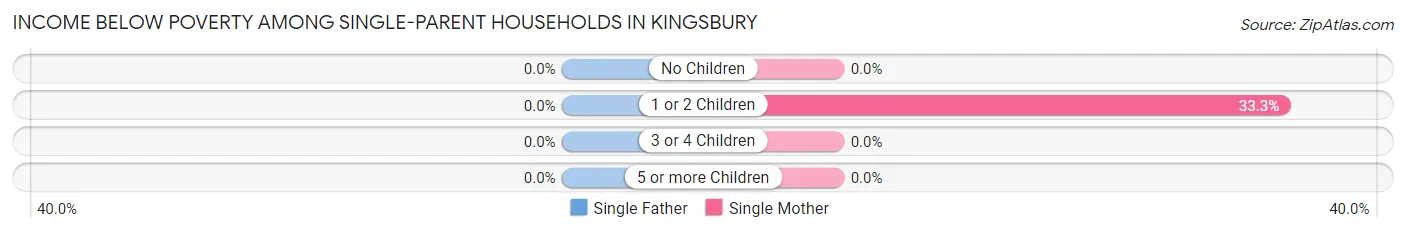
| Children | Single Father | Single Mother |
| No Children | 0 (0.0%) | 0 (0.0%) |
| 1 or 2 Children | 0 (0.0%) | 1 (33.3%) |
| 3 or 4 Children | 0 (0.0%) | 0 (0.0%) |
| 5 or more Children | 0 (0.0%) | 0 (0.0%) |
| Total | 0 (0.0%) | 1 (14.3%) |
Income Below Poverty Among Married-Couple vs Single-Parent Households in Kingsbury
The poverty data for Kingsbury shows that 14 of the married-couple family households (23.0%) and 1 of the single-parent households (8.3%) are living below the poverty level. Within the married-couple family households, those with 1 or 2 children have the highest poverty rate, with 14 households (51.8%) falling below the poverty line. Among the single-parent households, those with 1 or 2 children have the highest poverty rate, with 1 household (33.3%) living below poverty.
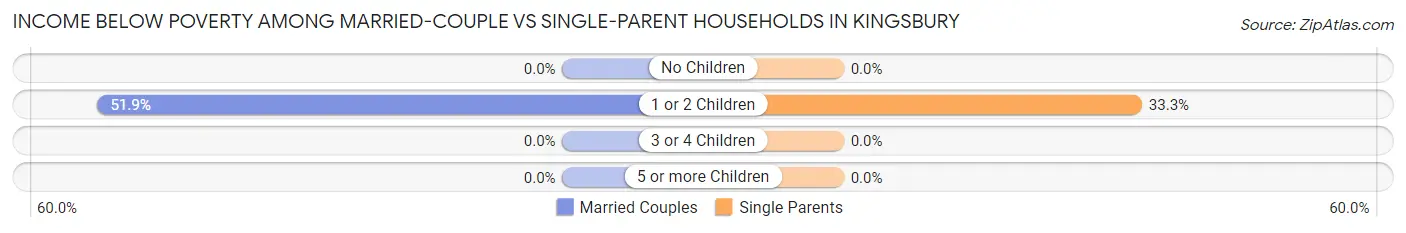
| Children | Married-Couple Families | Single-Parent Households |
| No Children | 0 (0.0%) | 0 (0.0%) |
| 1 or 2 Children | 14 (51.8%) | 1 (33.3%) |
| 3 or 4 Children | 0 (0.0%) | 0 (0.0%) |
| 5 or more Children | 0 (0.0%) | 0 (0.0%) |
| Total | 14 (23.0%) | 1 (8.3%) |
Race in Kingsbury
The most populous races in Kingsbury are White / Caucasian (209 | 92.1%), Hispanic or Latino (72 | 31.7%), and Two or more Races (18 | 7.9%).
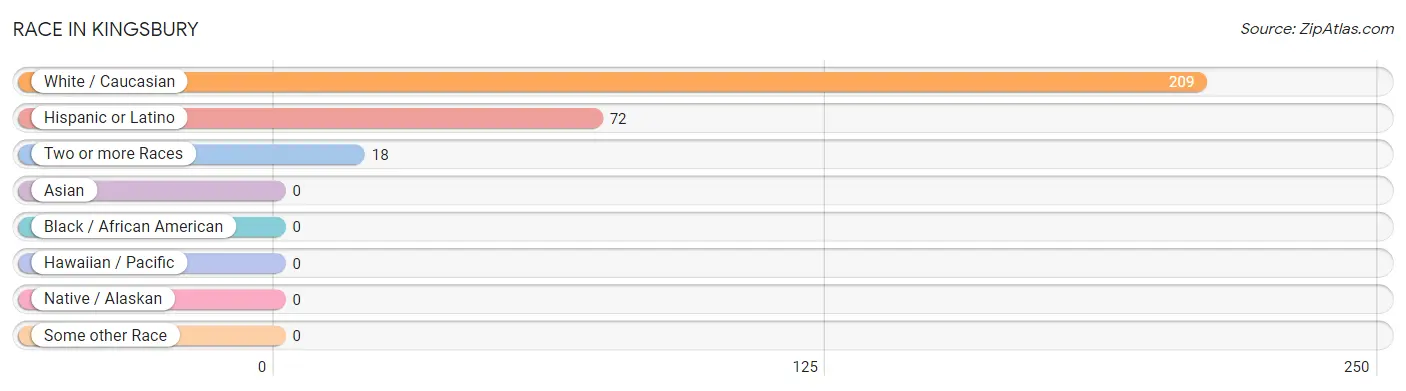
| Race | # Population | % Population |
| Asian | 0 | 0.0% |
| Black / African American | 0 | 0.0% |
| Hawaiian / Pacific | 0 | 0.0% |
| Hispanic or Latino | 72 | 31.7% |
| Native / Alaskan | 0 | 0.0% |
| White / Caucasian | 209 | 92.1% |
| Two or more Races | 18 | 7.9% |
| Some other Race | 0 | 0.0% |
| Total | 227 | 100.0% |
Ancestry in Kingsbury
The most populous ancestries reported in Kingsbury are Mexican (66 | 29.1%), German (54 | 23.8%), Irish (30 | 13.2%), English (18 | 7.9%), and Polish (17 | 7.5%), together accounting for 81.5% of all Kingsbury residents.
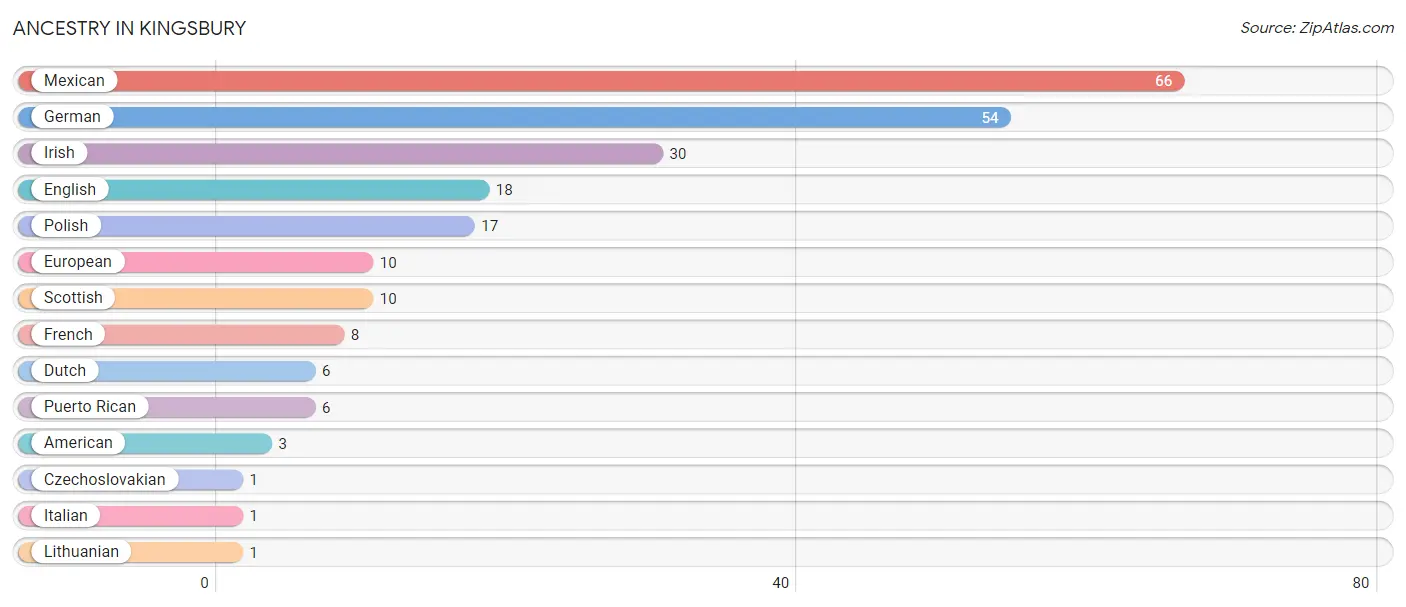
| Ancestry | # Population | % Population |
| American | 3 | 1.3% |
| Czechoslovakian | 1 | 0.4% |
| Dutch | 6 | 2.6% |
| English | 18 | 7.9% |
| European | 10 | 4.4% |
| French | 8 | 3.5% |
| German | 54 | 23.8% |
| Irish | 30 | 13.2% |
| Italian | 1 | 0.4% |
| Lithuanian | 1 | 0.4% |
| Mexican | 66 | 29.1% |
| Polish | 17 | 7.5% |
| Puerto Rican | 6 | 2.6% |
| Scottish | 10 | 4.4% | View All 14 Rows |
Immigrants in Kingsbury
The most numerous immigrant groups reported in Kingsbury came from Central America (31 | 13.7%), Latin America (31 | 13.7%), Mexico (31 | 13.7%), Europe (6 | 2.6%), and Eastern Europe (5 | 2.2%), together accounting for 45.8% of all Kingsbury residents.
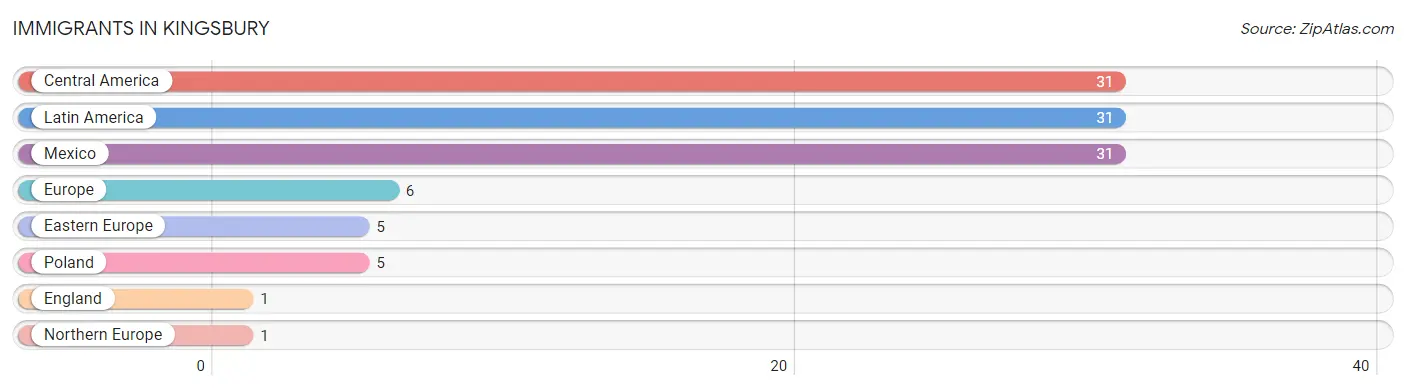
| Immigration Origin | # Population | % Population |
| Central America | 31 | 13.7% |
| Eastern Europe | 5 | 2.2% |
| England | 1 | 0.4% |
| Europe | 6 | 2.6% |
| Latin America | 31 | 13.7% |
| Mexico | 31 | 13.7% |
| Northern Europe | 1 | 0.4% |
| Poland | 5 | 2.2% | View All 8 Rows |
Sex and Age in Kingsbury
Sex and Age in Kingsbury
The most populous age groups in Kingsbury are 15 to 19 Years (32 | 22.9%) for men and 40 to 44 Years (18 | 20.7%) for women.
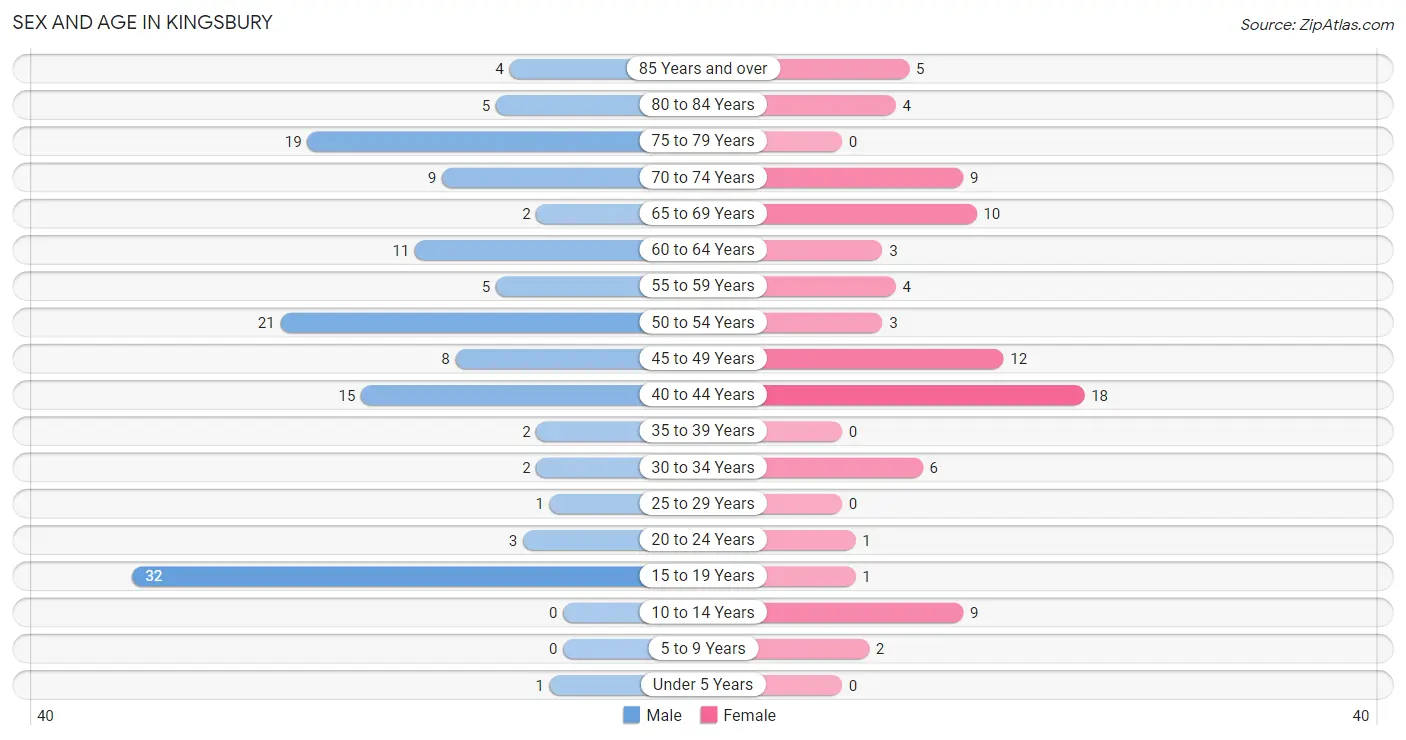
| Age Bracket | Male | Female |
| Under 5 Years | 1 (0.7%) | 0 (0.0%) |
| 5 to 9 Years | 0 (0.0%) | 2 (2.3%) |
| 10 to 14 Years | 0 (0.0%) | 9 (10.3%) |
| 15 to 19 Years | 32 (22.9%) | 1 (1.1%) |
| 20 to 24 Years | 3 (2.1%) | 1 (1.1%) |
| 25 to 29 Years | 1 (0.7%) | 0 (0.0%) |
| 30 to 34 Years | 2 (1.4%) | 6 (6.9%) |
| 35 to 39 Years | 2 (1.4%) | 0 (0.0%) |
| 40 to 44 Years | 15 (10.7%) | 18 (20.7%) |
| 45 to 49 Years | 8 (5.7%) | 12 (13.8%) |
| 50 to 54 Years | 21 (15.0%) | 3 (3.5%) |
| 55 to 59 Years | 5 (3.6%) | 4 (4.6%) |
| 60 to 64 Years | 11 (7.9%) | 3 (3.5%) |
| 65 to 69 Years | 2 (1.4%) | 10 (11.5%) |
| 70 to 74 Years | 9 (6.4%) | 9 (10.3%) |
| 75 to 79 Years | 19 (13.6%) | 0 (0.0%) |
| 80 to 84 Years | 5 (3.6%) | 4 (4.6%) |
| 85 Years and over | 4 (2.9%) | 5 (5.8%) |
| Total | 140 (100.0%) | 87 (100.0%) |
Families and Households in Kingsbury
Median Family Size in Kingsbury
The median family size in Kingsbury is 2.62 persons per family, with married-couple families (61 | 83.6%) accounting for the largest median family size of 2.75 persons per family. On the other hand, single male/father families (5 | 6.9%) represent the smallest median family size with 1.80 persons per family.
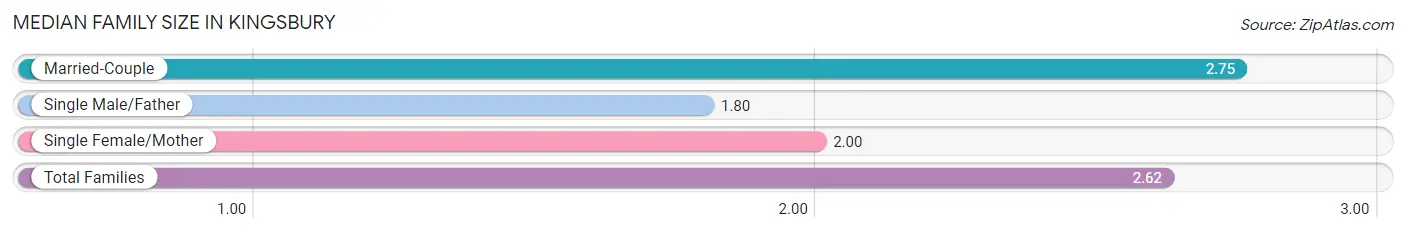
| Family Type | # Families | Family Size |
| Married-Couple | 61 (83.6%) | 2.75 |
| Single Male/Father | 5 (6.9%) | 1.80 |
| Single Female/Mother | 7 (9.6%) | 2.00 |
| Total Families | 73 (100.0%) | 2.62 |
Median Household Size in Kingsbury
The median household size in Kingsbury is 2.14 persons per household, with married-couple households (61 | 57.6%) accounting for the largest median household size of 2.75 persons per household. non-family households (33 | 31.1%) represent the smallest median household size with 1.06 persons per household.
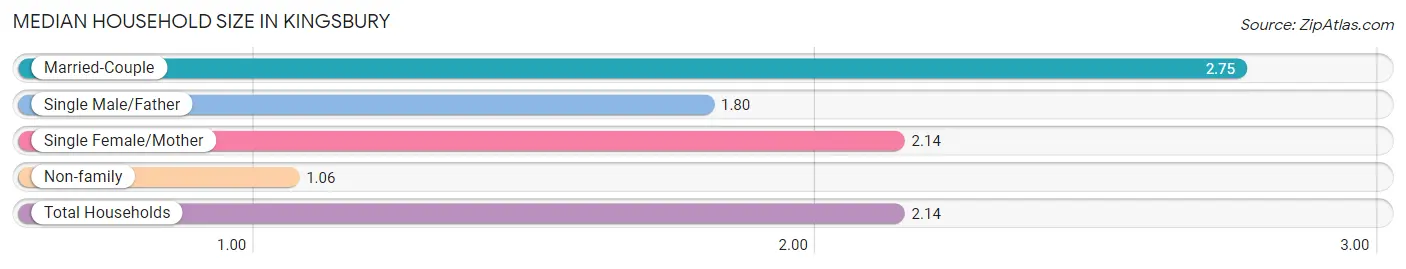
| Household Type | # Households | Household Size |
| Married-Couple | 61 (57.6%) | 2.75 |
| Single Male/Father | 5 (4.7%) | 1.80 |
| Single Female/Mother | 7 (6.6%) | 2.14 |
| Non-family | 33 (31.1%) | 1.06 |
| Total Households | 106 (100.0%) | 2.14 |
Household Size by Marriage Status in Kingsbury
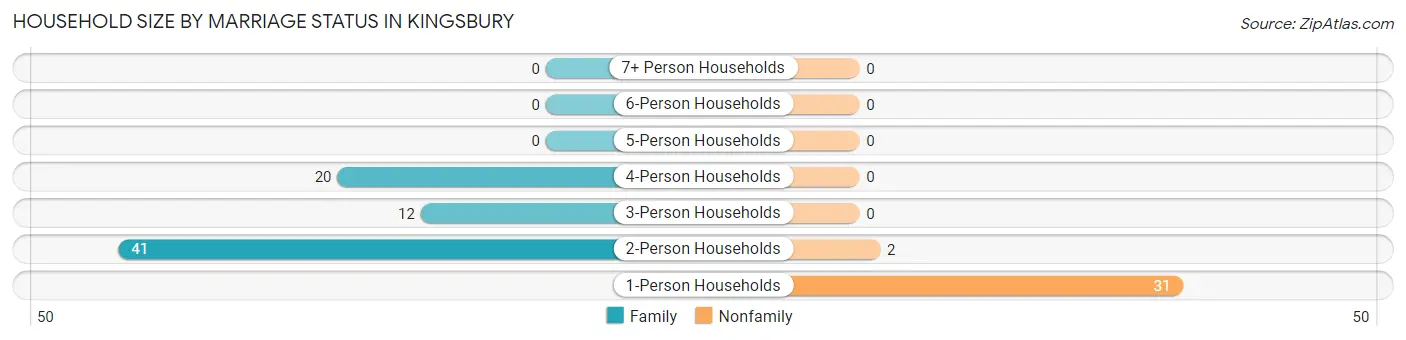
Out of a total of 106 households in Kingsbury, 73 (68.9%) are family households, while 33 (31.1%) are nonfamily households. The most numerous type of family households are 2-person households, comprising 41, and the most common type of nonfamily households are 1-person households, comprising 31.
| Household Size | Family Households | Nonfamily Households |
| 1-Person Households | - | 31 (29.2%) |
| 2-Person Households | 41 (38.7%) | 2 (1.9%) |
| 3-Person Households | 12 (11.3%) | 0 (0.0%) |
| 4-Person Households | 20 (18.9%) | 0 (0.0%) |
| 5-Person Households | 0 (0.0%) | 0 (0.0%) |
| 6-Person Households | 0 (0.0%) | 0 (0.0%) |
| 7+ Person Households | 0 (0.0%) | 0 (0.0%) |
| Total | 73 (68.9%) | 33 (31.1%) |
Female Fertility in Kingsbury
Fertility by Age in Kingsbury
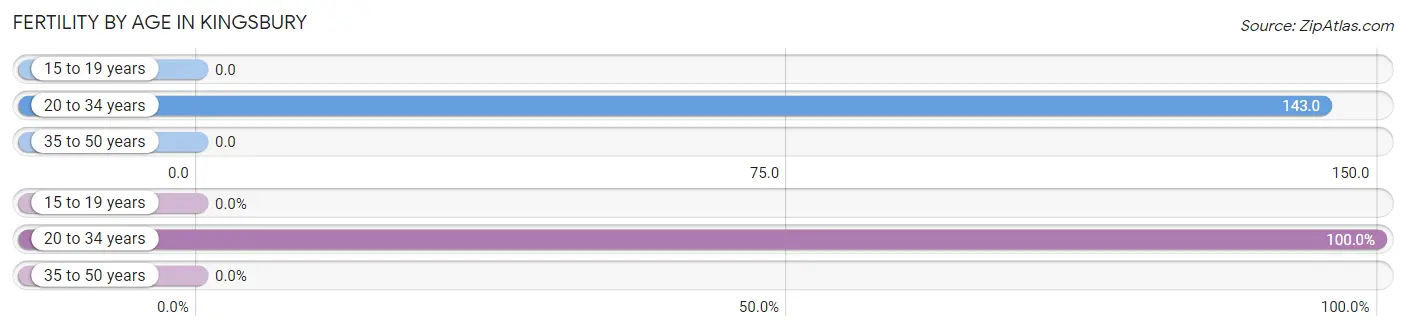
Average fertility rate in Kingsbury is 25.0 births per 1,000 women. Women in the age bracket of 20 to 34 years have the highest fertility rate with 143.0 births per 1,000 women. Women in the age bracket of 20 to 34 years acount for 100.0% of all women with births.
| Age Bracket | Women with Births | Births / 1,000 Women |
| 15 to 19 years | 0 (0.0%) | 0.0 |
| 20 to 34 years | 1 (100.0%) | 143.0 |
| 35 to 50 years | 0 (0.0%) | 0.0 |
| Total | 1 (100.0%) | 25.0 |
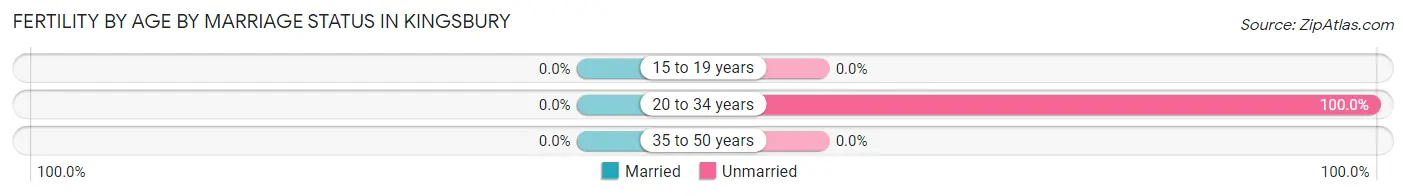
Fertility by Age by Marriage Status in Kingsbury
| Age Bracket | Married | Unmarried |
| 15 to 19 years | 0 (0.0%) | 0 (0.0%) |
| 20 to 34 years | 0 (0.0%) | 1 (100.0%) |
| 35 to 50 years | 0 (0.0%) | 0 (0.0%) |
| Total | 0 (0.0%) | 1 (100.0%) |
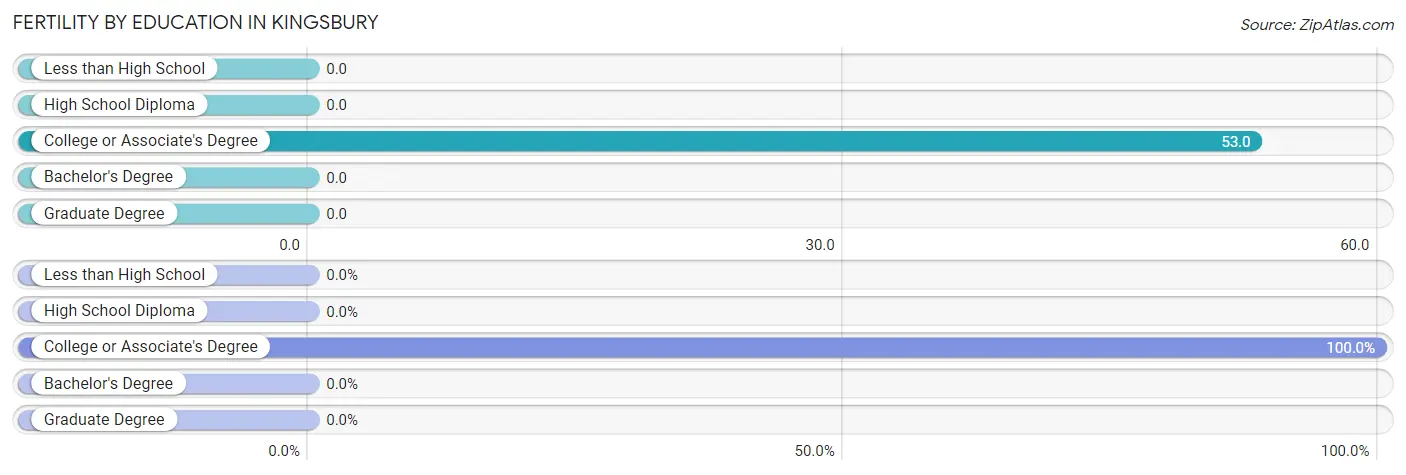
Fertility by Education in Kingsbury
| Educational Attainment | Women with Births | Births / 1,000 Women |
| Less than High School | 0 (0.0%) | 0.0 |
| High School Diploma | 0 (0.0%) | 0.0 |
| College or Associate's Degree | 1 (100.0%) | 53.0 |
| Bachelor's Degree | 0 (0.0%) | 0.0 |
| Graduate Degree | 0 (0.0%) | 0.0 |
| Total | 1 (100.0%) | 25.0 |
Fertility by Education by Marriage Status in Kingsbury
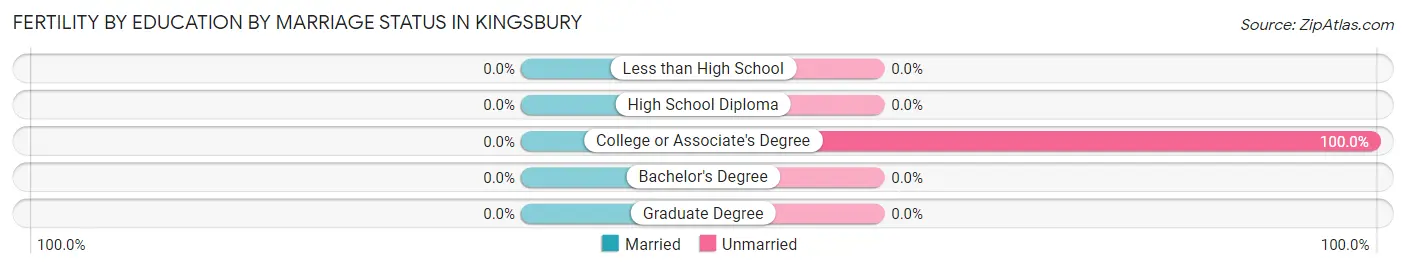
| Educational Attainment | Married | Unmarried |
| Less than High School | 0 (0.0%) | 0 (0.0%) |
| High School Diploma | 0 (0.0%) | 0 (0.0%) |
| College or Associate's Degree | 0 (0.0%) | 1 (100.0%) |
| Bachelor's Degree | 0 (0.0%) | 0 (0.0%) |
| Graduate Degree | 0 (0.0%) | 0 (0.0%) |
| Total | 0 (0.0%) | 1 (100.0%) |
Employment Characteristics in Kingsbury
Employment by Class of Employer in Kingsbury
Among the 105 employed individuals in Kingsbury, private company employees (85 | 80.9%), not-for-profit organizations (8 | 7.6%), and state government employees (6 | 5.7%) make up the most common classes of employment.
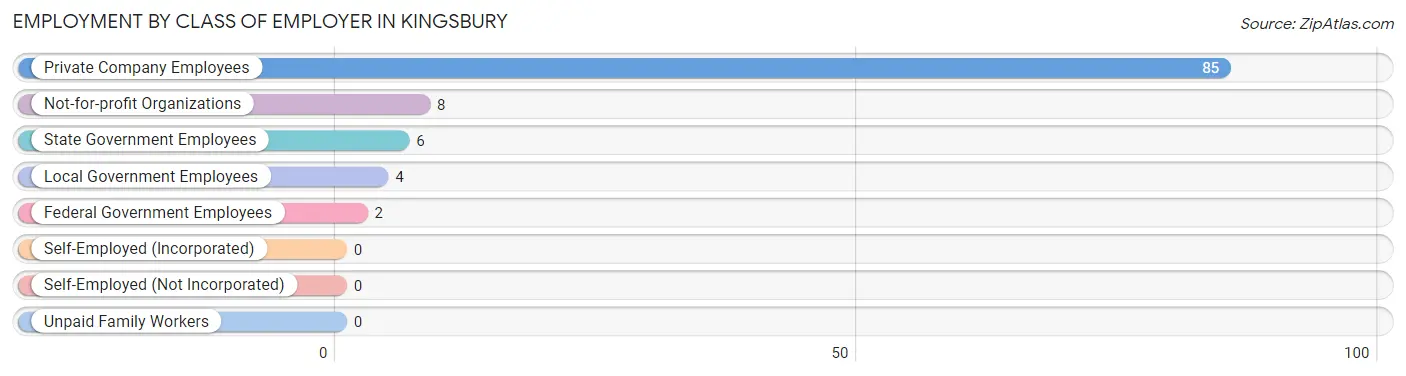
| Employer Class | # Employees | % Employees |
| Private Company Employees | 85 | 80.9% |
| Self-Employed (Incorporated) | 0 | 0.0% |
| Self-Employed (Not Incorporated) | 0 | 0.0% |
| Not-for-profit Organizations | 8 | 7.6% |
| Local Government Employees | 4 | 3.8% |
| State Government Employees | 6 | 5.7% |
| Federal Government Employees | 2 | 1.9% |
| Unpaid Family Workers | 0 | 0.0% |
| Total | 105 | 100.0% |
Employment Status by Age in Kingsbury
According to the labor force statistics for Kingsbury, out of the total population over 16 years of age (213), 52.6% or 112 individuals are in the labor force, with 6.3% or 7 of them unemployed. The age group with the highest labor force participation rate is 25 to 29 years, with 100.0% or 1 individuals in the labor force. Within the labor force, the 45 to 54 years age range has the highest percentage of unemployed individuals, with 12.8% or 5 of them being unemployed.
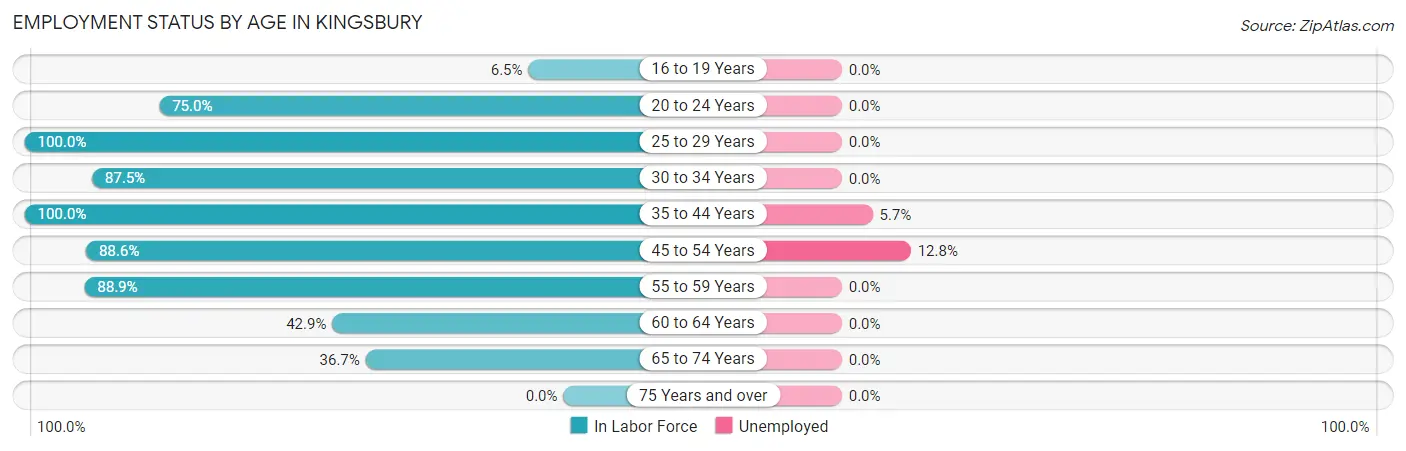
| Age Bracket | In Labor Force | Unemployed |
| 16 to 19 Years | 2 (6.5%) | 0 (0.0%) |
| 20 to 24 Years | 3 (75.0%) | 0 (0.0%) |
| 25 to 29 Years | 1 (100.0%) | 0 (0.0%) |
| 30 to 34 Years | 7 (87.5%) | 0 (0.0%) |
| 35 to 44 Years | 35 (100.0%) | 2 (5.7%) |
| 45 to 54 Years | 39 (88.6%) | 5 (12.8%) |
| 55 to 59 Years | 8 (88.9%) | 0 (0.0%) |
| 60 to 64 Years | 6 (42.9%) | 0 (0.0%) |
| 65 to 74 Years | 11 (36.7%) | 0 (0.0%) |
| 75 Years and over | 0 (0.0%) | 0 (0.0%) |
| Total | 112 (52.6%) | 7 (6.3%) |
Employment Status by Educational Attainment in Kingsbury
According to labor force statistics for Kingsbury, 86.5% of individuals (96) out of the total population between 25 and 64 years of age (111) are in the labor force, with 7.3% or 7 of them being unemployed. The group with the highest labor force participation rate are those with the educational attainment of less than high school, with 100.0% or 16 individuals in the labor force. Within the labor force, individuals with high school diploma education have the highest percentage of unemployment, with 15.6% or 7 of them being unemployed.
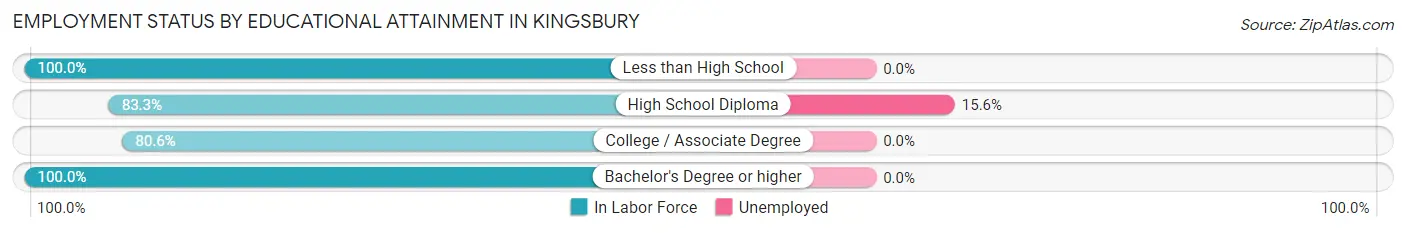
| Educational Attainment | In Labor Force | Unemployed |
| Less than High School | 16 (100.0%) | 0 (0.0%) |
| High School Diploma | 45 (83.3%) | 8 (15.6%) |
| College / Associate Degree | 25 (80.6%) | 0 (0.0%) |
| Bachelor's Degree or higher | 10 (100.0%) | 0 (0.0%) |
| Total | 96 (86.5%) | 8 (7.3%) |
Employment Occupations by Sex in Kingsbury
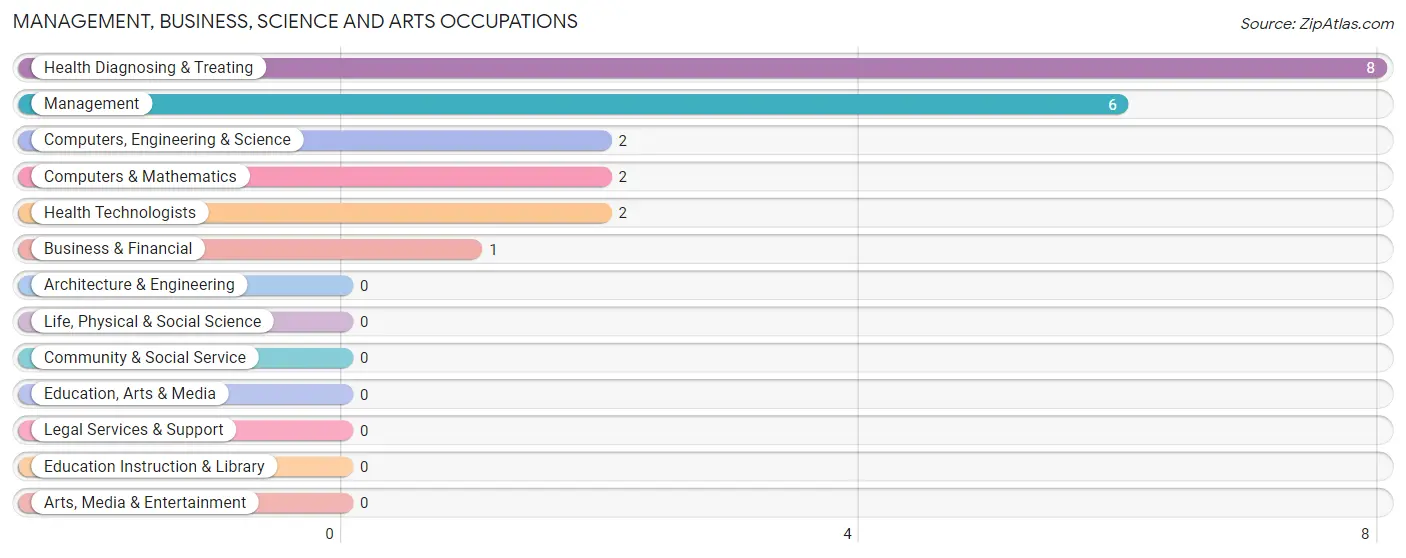
Management, Business, Science and Arts Occupations
The most common Management, Business, Science and Arts occupations in Kingsbury are Health Diagnosing & Treating (8 | 7.6%), Management (6 | 5.7%), Computers, Engineering & Science (2 | 1.9%), Computers & Mathematics (2 | 1.9%), and Health Technologists (2 | 1.9%).
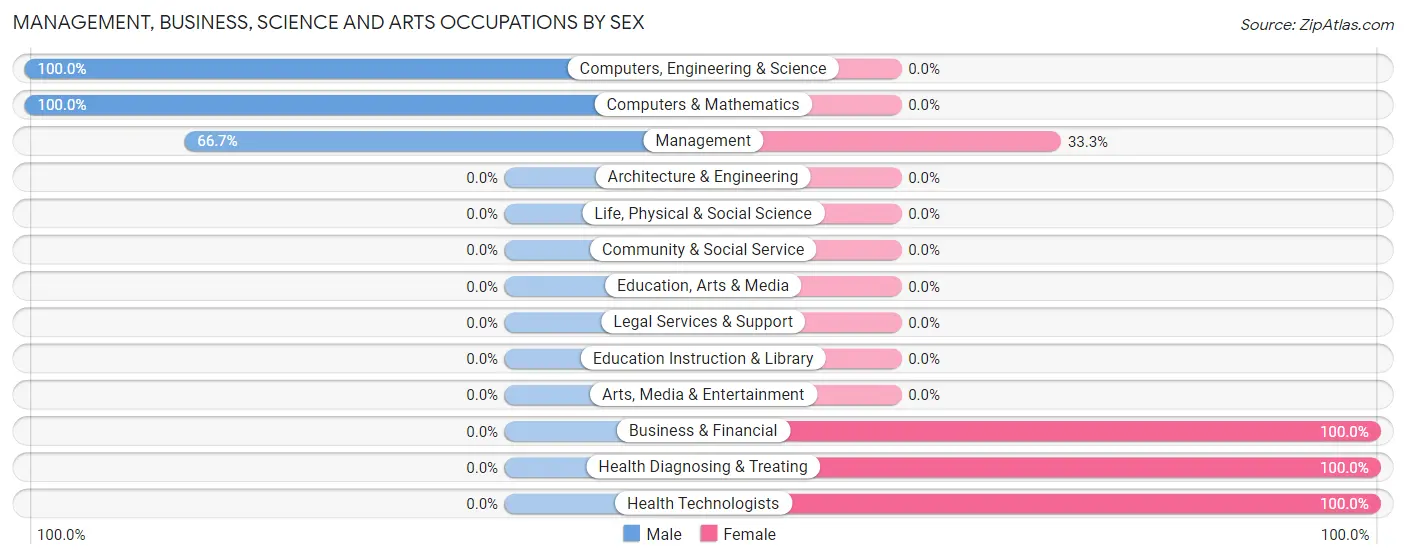
Management, Business, Science and Arts Occupations by Sex
Within the Management, Business, Science and Arts occupations in Kingsbury, the most male-oriented occupations are Computers, Engineering & Science (100.0%), Computers & Mathematics (100.0%), and Management (66.7%), while the most female-oriented occupations are Business & Financial (100.0%), Health Diagnosing & Treating (100.0%), and Health Technologists (100.0%).
| Occupation | Male | Female |
| Management | 4 (66.7%) | 2 (33.3%) |
| Business & Financial | 0 (0.0%) | 1 (100.0%) |
| Computers, Engineering & Science | 2 (100.0%) | 0 (0.0%) |
| Computers & Mathematics | 2 (100.0%) | 0 (0.0%) |
| Architecture & Engineering | 0 (0.0%) | 0 (0.0%) |
| Life, Physical & Social Science | 0 (0.0%) | 0 (0.0%) |
| Community & Social Service | 0 (0.0%) | 0 (0.0%) |
| Education, Arts & Media | 0 (0.0%) | 0 (0.0%) |
| Legal Services & Support | 0 (0.0%) | 0 (0.0%) |
| Education Instruction & Library | 0 (0.0%) | 0 (0.0%) |
| Arts, Media & Entertainment | 0 (0.0%) | 0 (0.0%) |
| Health Diagnosing & Treating | 0 (0.0%) | 8 (100.0%) |
| Health Technologists | 0 (0.0%) | 2 (100.0%) |
| Total (Category) | 6 (35.3%) | 11 (64.7%) |
| Total (Overall) | 59 (56.2%) | 46 (43.8%) |
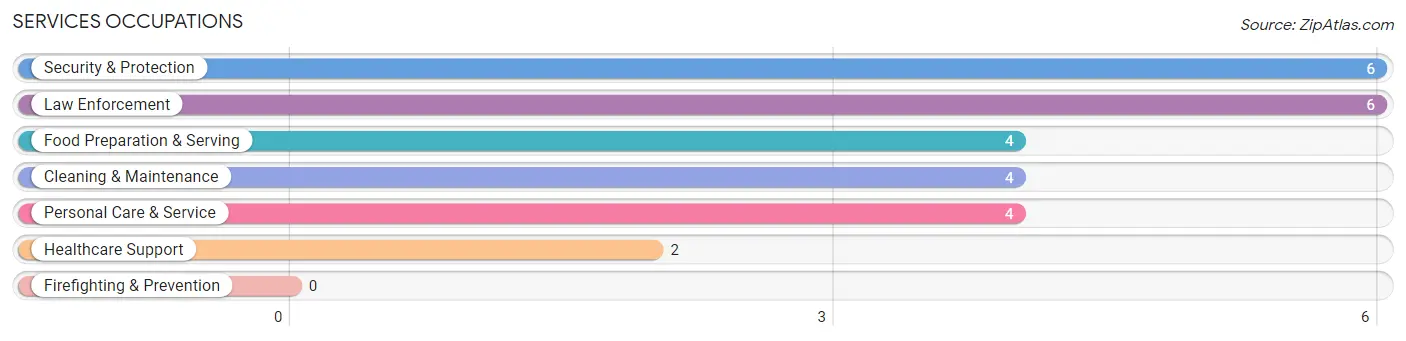
Services Occupations
The most common Services occupations in Kingsbury are Security & Protection (6 | 5.7%), Law Enforcement (6 | 5.7%), Food Preparation & Serving (4 | 3.8%), Cleaning & Maintenance (4 | 3.8%), and Personal Care & Service (4 | 3.8%).
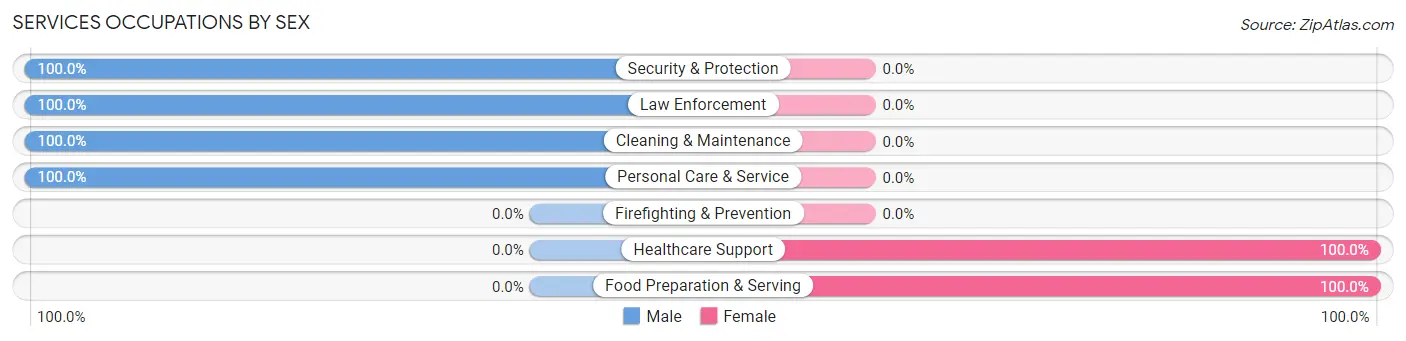
Services Occupations by Sex
Within the Services occupations in Kingsbury, the most male-oriented occupations are Security & Protection (100.0%), Law Enforcement (100.0%), and Cleaning & Maintenance (100.0%), while the most female-oriented occupations are Healthcare Support (100.0%), and Food Preparation & Serving (100.0%).
| Occupation | Male | Female |
| Healthcare Support | 0 (0.0%) | 2 (100.0%) |
| Security & Protection | 6 (100.0%) | 0 (0.0%) |
| Firefighting & Prevention | 0 (0.0%) | 0 (0.0%) |
| Law Enforcement | 6 (100.0%) | 0 (0.0%) |
| Food Preparation & Serving | 0 (0.0%) | 4 (100.0%) |
| Cleaning & Maintenance | 4 (100.0%) | 0 (0.0%) |
| Personal Care & Service | 4 (100.0%) | 0 (0.0%) |
| Total (Category) | 14 (70.0%) | 6 (30.0%) |
| Total (Overall) | 59 (56.2%) | 46 (43.8%) |
Sales and Office Occupations
The most common Sales and Office occupations in Kingsbury are Sales & Related (5 | 4.8%), and Office & Administration (4 | 3.8%).
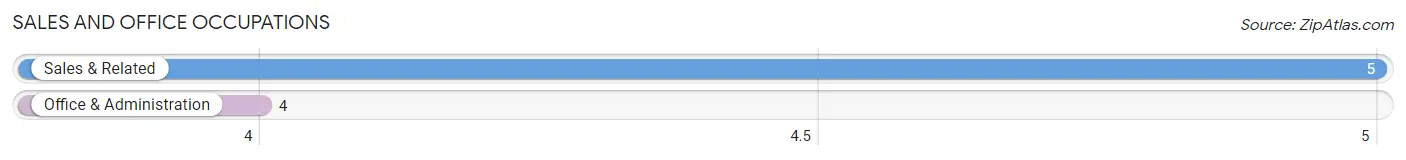
Sales and Office Occupations by Sex
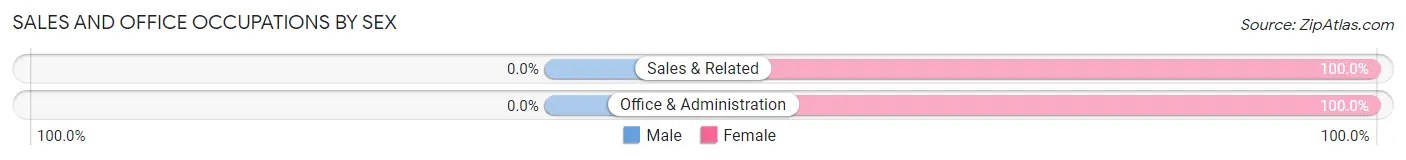
| Occupation | Male | Female |
| Sales & Related | 0 (0.0%) | 5 (100.0%) |
| Office & Administration | 0 (0.0%) | 4 (100.0%) |
| Total (Category) | 0 (0.0%) | 9 (100.0%) |
| Total (Overall) | 59 (56.2%) | 46 (43.8%) |
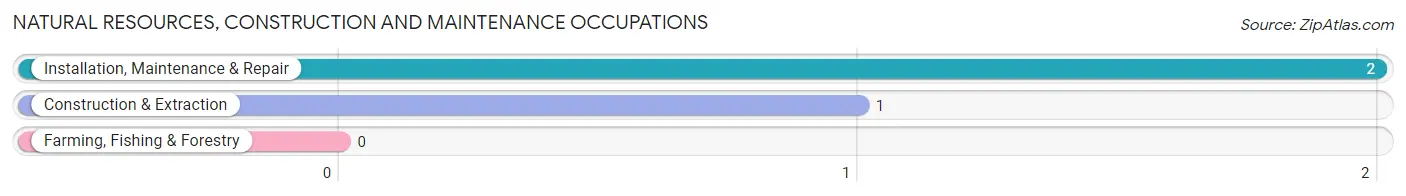
Natural Resources, Construction and Maintenance Occupations
The most common Natural Resources, Construction and Maintenance occupations in Kingsbury are Installation, Maintenance & Repair (2 | 1.9%), and Construction & Extraction (1 | 0.9%).
Natural Resources, Construction and Maintenance Occupations by Sex
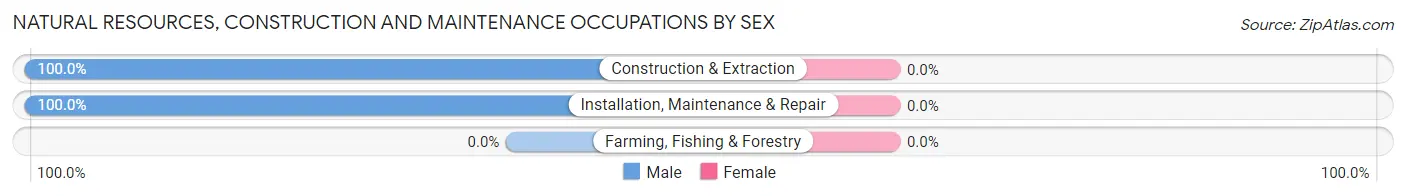
| Occupation | Male | Female |
| Farming, Fishing & Forestry | 0 (0.0%) | 0 (0.0%) |
| Construction & Extraction | 1 (100.0%) | 0 (0.0%) |
| Installation, Maintenance & Repair | 2 (100.0%) | 0 (0.0%) |
| Total (Category) | 3 (100.0%) | 0 (0.0%) |
| Total (Overall) | 59 (56.2%) | 46 (43.8%) |
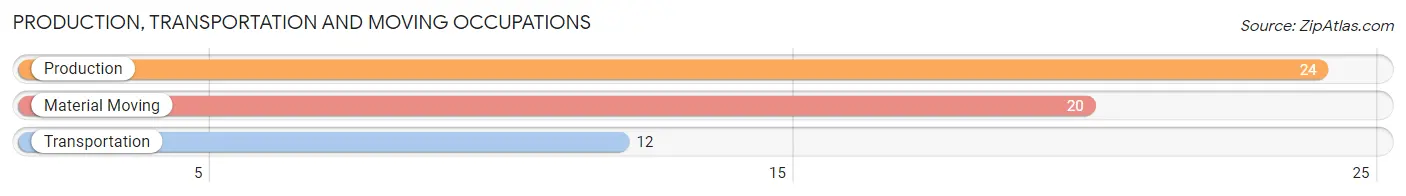
Production, Transportation and Moving Occupations
The most common Production, Transportation and Moving occupations in Kingsbury are Production (24 | 22.9%), Material Moving (20 | 19.1%), and Transportation (12 | 11.4%).
Production, Transportation and Moving Occupations by Sex
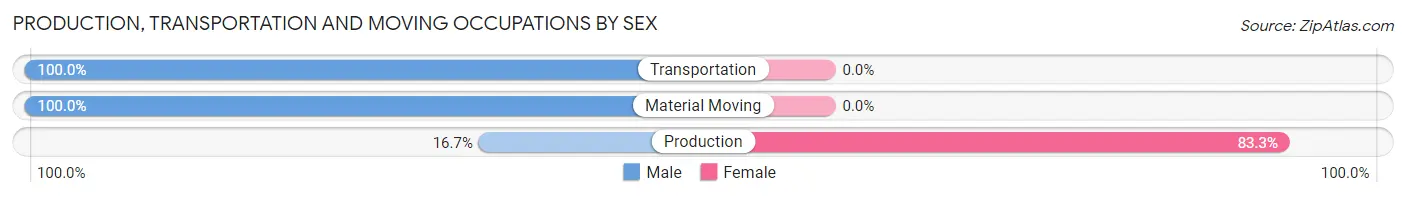
| Occupation | Male | Female |
| Production | 4 (16.7%) | 20 (83.3%) |
| Transportation | 12 (100.0%) | 0 (0.0%) |
| Material Moving | 20 (100.0%) | 0 (0.0%) |
| Total (Category) | 36 (64.3%) | 20 (35.7%) |
| Total (Overall) | 59 (56.2%) | 46 (43.8%) |
Employment Industries by Sex in Kingsbury
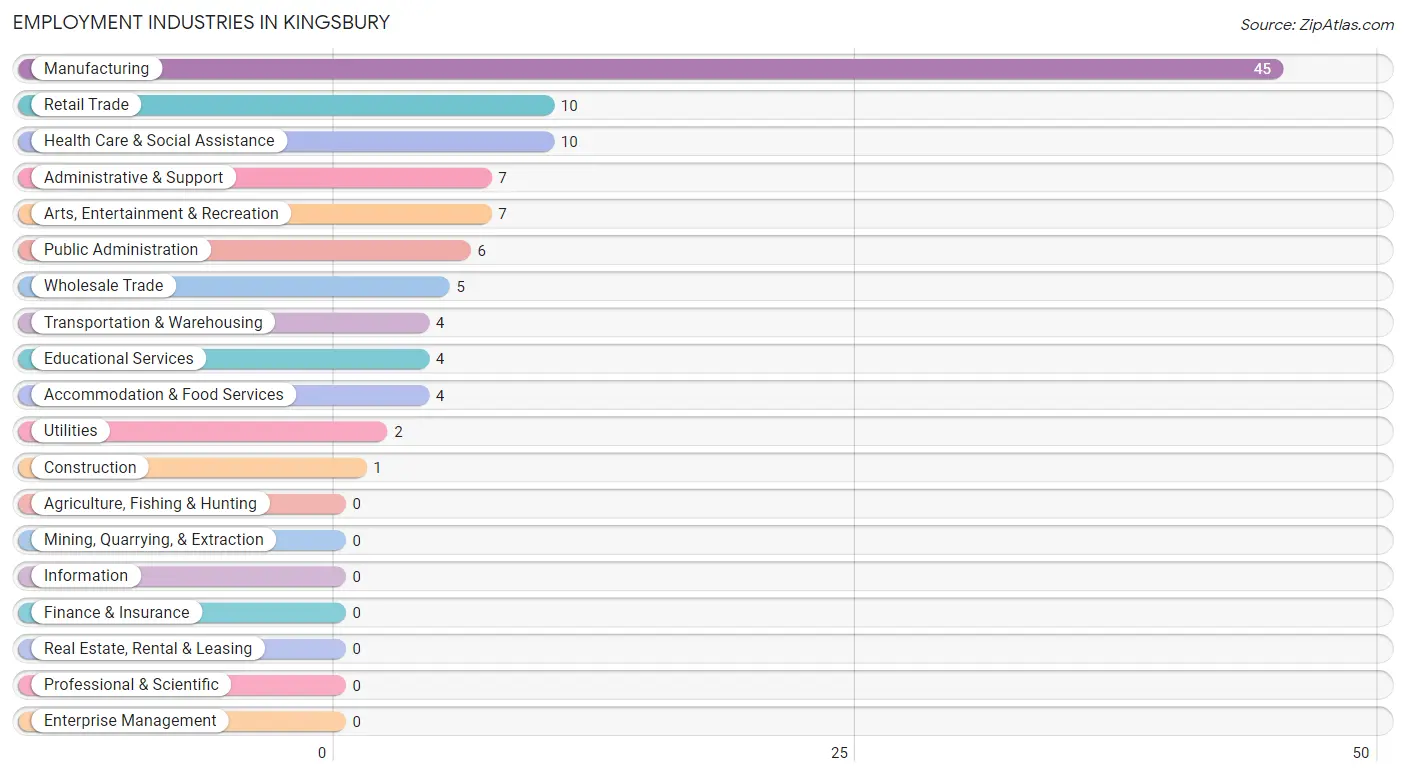
Employment Industries in Kingsbury
The major employment industries in Kingsbury include Manufacturing (45 | 42.9%), Retail Trade (10 | 9.5%), Health Care & Social Assistance (10 | 9.5%), Administrative & Support (7 | 6.7%), and Arts, Entertainment & Recreation (7 | 6.7%).
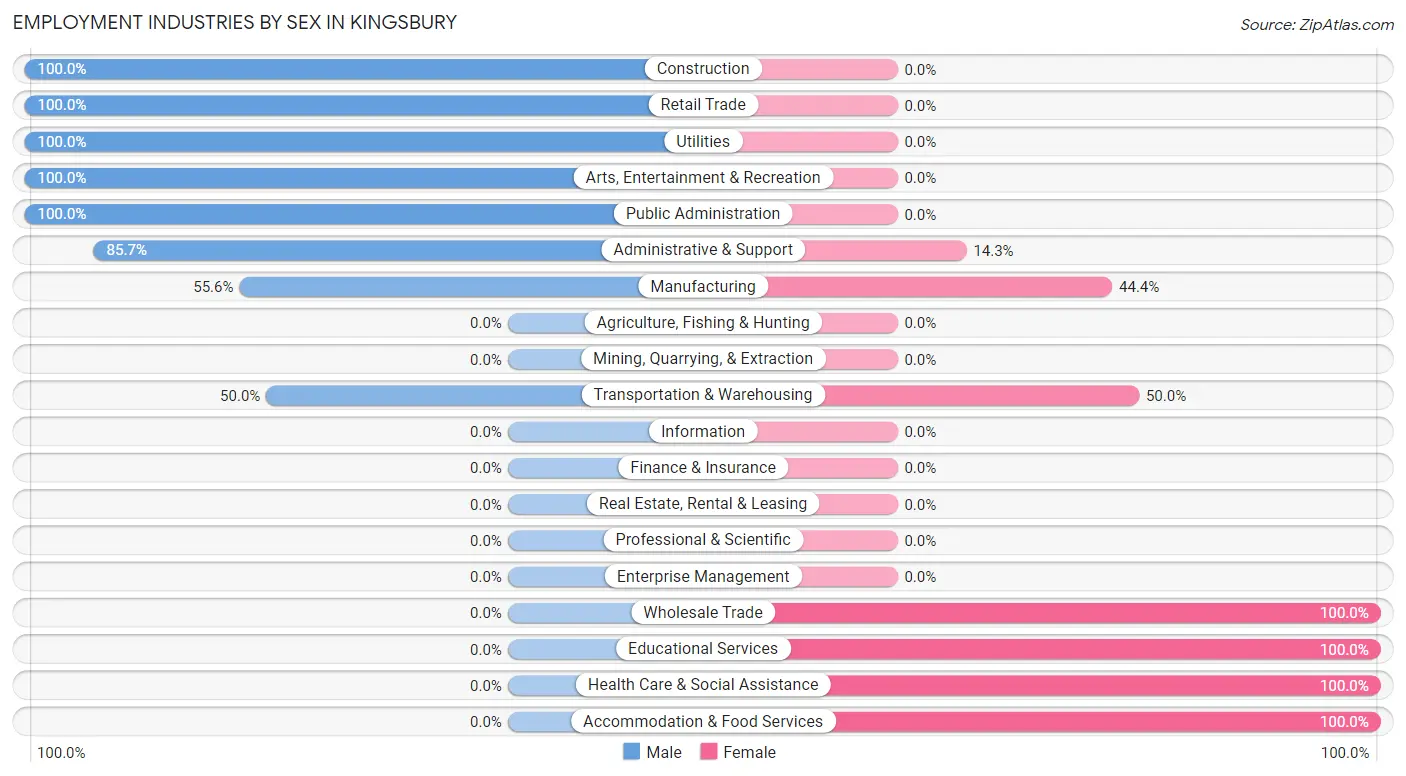
Employment Industries by Sex in Kingsbury
The Kingsbury industries that see more men than women are Construction (100.0%), Retail Trade (100.0%), and Utilities (100.0%), whereas the industries that tend to have a higher number of women are Wholesale Trade (100.0%), Educational Services (100.0%), and Health Care & Social Assistance (100.0%).
| Industry | Male | Female |
| Agriculture, Fishing & Hunting | 0 (0.0%) | 0 (0.0%) |
| Mining, Quarrying, & Extraction | 0 (0.0%) | 0 (0.0%) |
| Construction | 1 (100.0%) | 0 (0.0%) |
| Manufacturing | 25 (55.6%) | 20 (44.4%) |
| Wholesale Trade | 0 (0.0%) | 5 (100.0%) |
| Retail Trade | 10 (100.0%) | 0 (0.0%) |
| Transportation & Warehousing | 2 (50.0%) | 2 (50.0%) |
| Utilities | 2 (100.0%) | 0 (0.0%) |
| Information | 0 (0.0%) | 0 (0.0%) |
| Finance & Insurance | 0 (0.0%) | 0 (0.0%) |
| Real Estate, Rental & Leasing | 0 (0.0%) | 0 (0.0%) |
| Professional & Scientific | 0 (0.0%) | 0 (0.0%) |
| Enterprise Management | 0 (0.0%) | 0 (0.0%) |
| Administrative & Support | 6 (85.7%) | 1 (14.3%) |
| Educational Services | 0 (0.0%) | 4 (100.0%) |
| Health Care & Social Assistance | 0 (0.0%) | 10 (100.0%) |
| Arts, Entertainment & Recreation | 7 (100.0%) | 0 (0.0%) |
| Accommodation & Food Services | 0 (0.0%) | 4 (100.0%) |
| Public Administration | 6 (100.0%) | 0 (0.0%) |
| Total | 59 (56.2%) | 46 (43.8%) |
Education in Kingsbury
School Enrollment in Kingsbury
The most common levels of schooling among the 44 students in Kingsbury are high school (16 | 36.4%), college / undergraduate (16 | 36.4%), and middle school (10 | 22.7%).
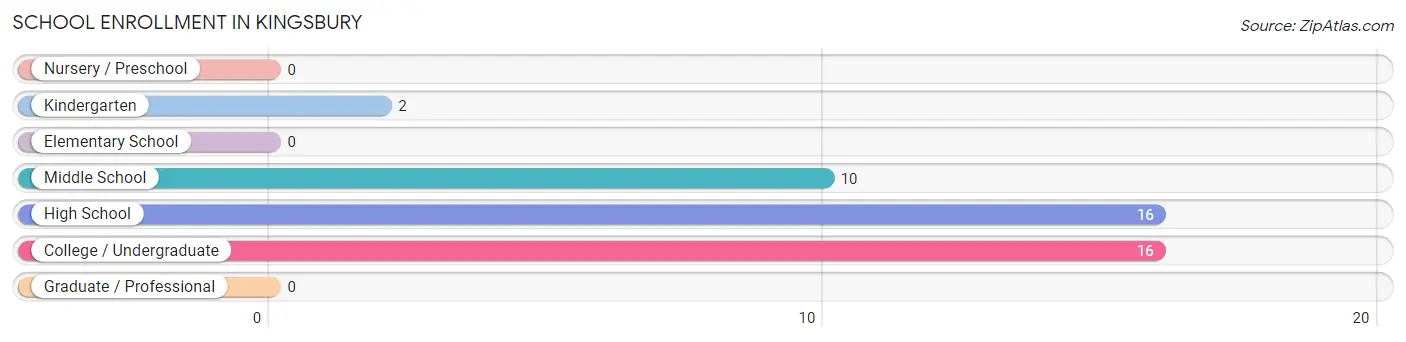
| School Level | # Students | % Students |
| Nursery / Preschool | 0 | 0.0% |
| Kindergarten | 2 | 4.5% |
| Elementary School | 0 | 0.0% |
| Middle School | 10 | 22.7% |
| High School | 16 | 36.4% |
| College / Undergraduate | 16 | 36.4% |
| Graduate / Professional | 0 | 0.0% |
| Total | 44 | 100.0% |
School Enrollment by Age by Funding Source in Kingsbury
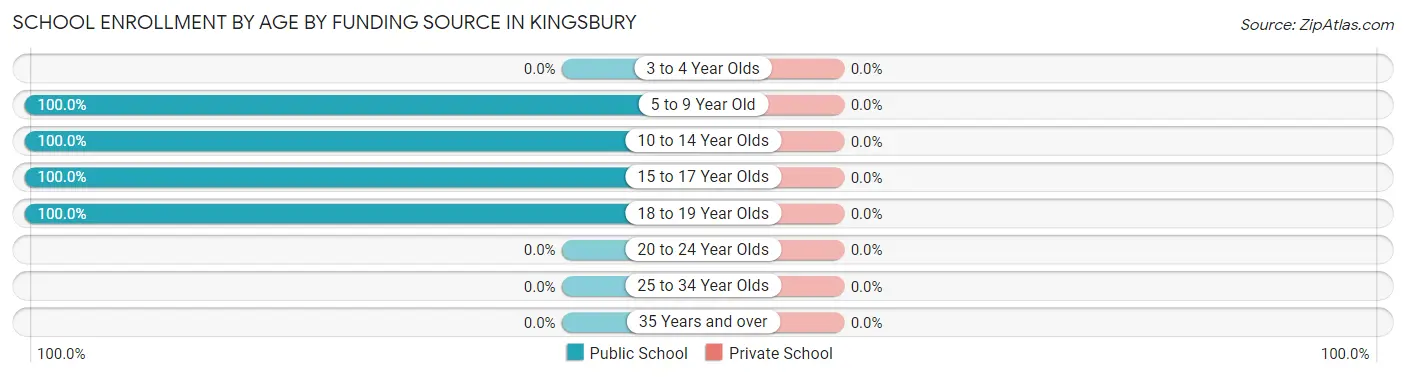
| Age Bracket | Public School | Private School |
| 3 to 4 Year Olds | 0 (0.0%) | 0 (0.0%) |
| 5 to 9 Year Old | 2 (100.0%) | 0 (0.0%) |
| 10 to 14 Year Olds | 9 (100.0%) | 0 (0.0%) |
| 15 to 17 Year Olds | 16 (100.0%) | 0 (0.0%) |
| 18 to 19 Year Olds | 17 (100.0%) | 0 (0.0%) |
| 20 to 24 Year Olds | 0 (0.0%) | 0 (0.0%) |
| 25 to 34 Year Olds | 0 (0.0%) | 0 (0.0%) |
| 35 Years and over | 0 (0.0%) | 0 (0.0%) |
| Total | 44 (100.0%) | 0 (0.0%) |
Educational Attainment by Field of Study in Kingsbury
Bio, nature & agricultural (4 | 26.7%), visual & performing arts (3 | 20.0%), physical & health sciences (2 | 13.3%), business (2 | 13.3%), and arts & humanities (2 | 13.3%) are the most common fields of study among 15 individuals in Kingsbury who have obtained a bachelor's degree or higher.
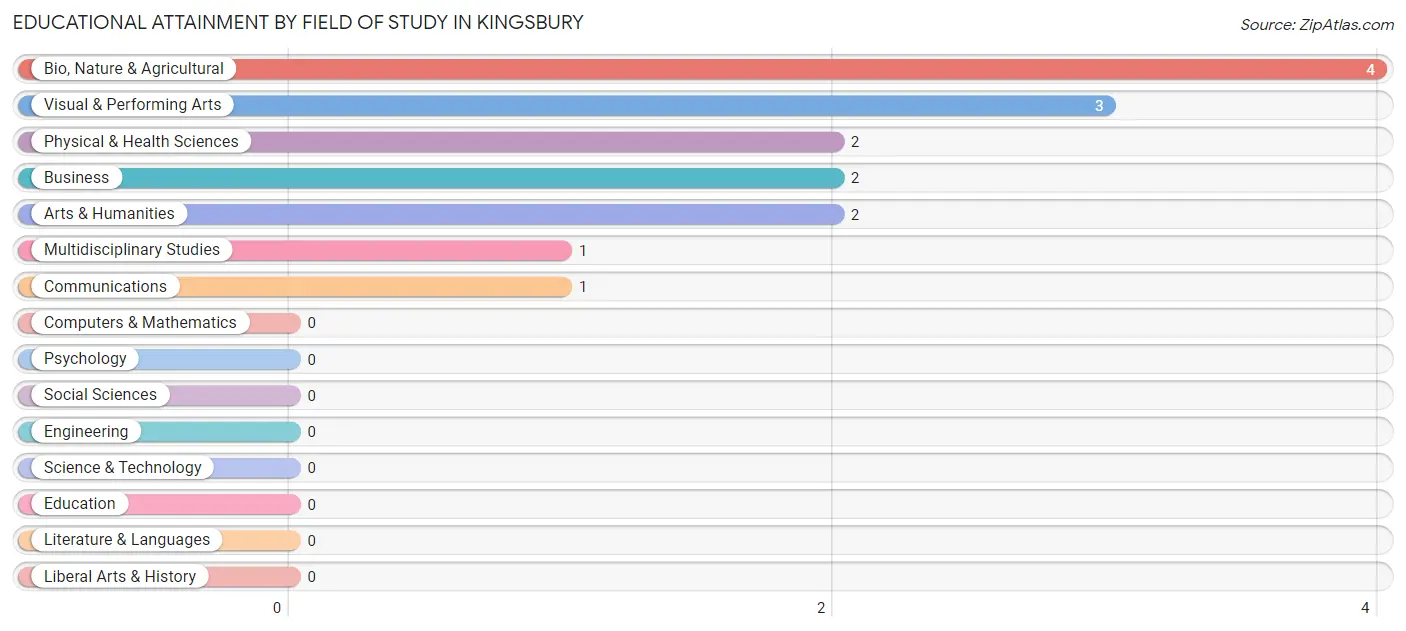
| Field of Study | # Graduates | % Graduates |
| Computers & Mathematics | 0 | 0.0% |
| Bio, Nature & Agricultural | 4 | 26.7% |
| Physical & Health Sciences | 2 | 13.3% |
| Psychology | 0 | 0.0% |
| Social Sciences | 0 | 0.0% |
| Engineering | 0 | 0.0% |
| Multidisciplinary Studies | 1 | 6.7% |
| Science & Technology | 0 | 0.0% |
| Business | 2 | 13.3% |
| Education | 0 | 0.0% |
| Literature & Languages | 0 | 0.0% |
| Liberal Arts & History | 0 | 0.0% |
| Visual & Performing Arts | 3 | 20.0% |
| Communications | 1 | 6.7% |
| Arts & Humanities | 2 | 13.3% |
| Total | 15 | 100.0% |
Transportation & Commute in Kingsbury
Vehicle Availability by Sex in Kingsbury
The most prevalent vehicle ownership categories in Kingsbury are males with 2 vehicles (29, accounting for 49.1%) and females with 2 vehicles (25, making up 63.0%).
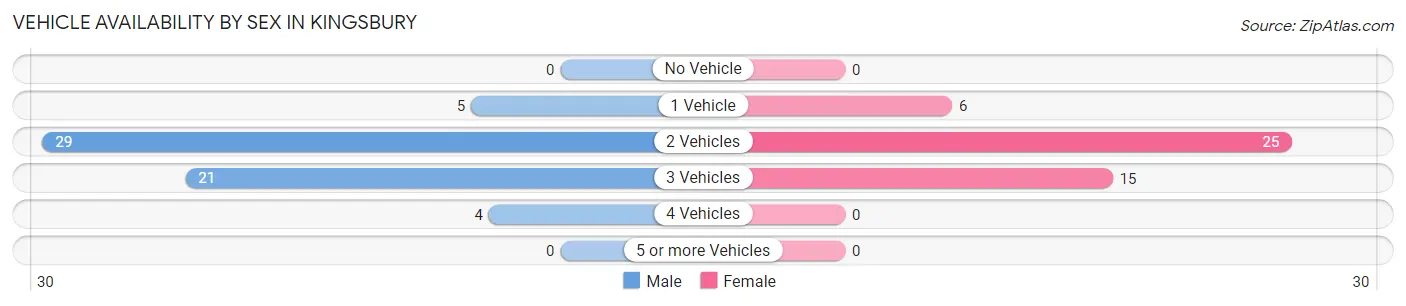
| Vehicles Available | Male | Female |
| No Vehicle | 0 (0.0%) | 0 (0.0%) |
| 1 Vehicle | 5 (8.5%) | 6 (13.0%) |
| 2 Vehicles | 29 (49.1%) | 25 (54.3%) |
| 3 Vehicles | 21 (35.6%) | 15 (32.6%) |
| 4 Vehicles | 4 (6.8%) | 0 (0.0%) |
| 5 or more Vehicles | 0 (0.0%) | 0 (0.0%) |
| Total | 59 (100.0%) | 46 (100.0%) |
Commute Time in Kingsbury
The most frequently occuring commute durations in Kingsbury are 15 to 19 minutes (43 commuters, 40.9%), 45 to 59 minutes (17 commuters, 16.2%), and 20 to 24 minutes (15 commuters, 14.3%).
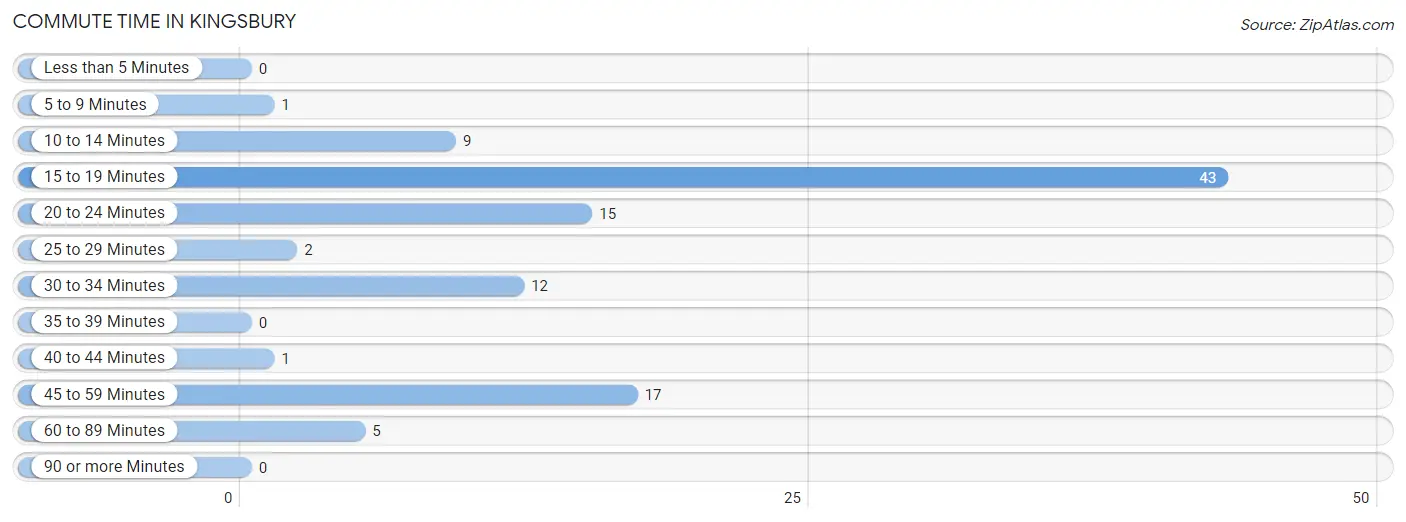
| Commute Time | # Commuters | % Commuters |
| Less than 5 Minutes | 0 | 0.0% |
| 5 to 9 Minutes | 1 | 0.9% |
| 10 to 14 Minutes | 9 | 8.6% |
| 15 to 19 Minutes | 43 | 40.9% |
| 20 to 24 Minutes | 15 | 14.3% |
| 25 to 29 Minutes | 2 | 1.9% |
| 30 to 34 Minutes | 12 | 11.4% |
| 35 to 39 Minutes | 0 | 0.0% |
| 40 to 44 Minutes | 1 | 0.9% |
| 45 to 59 Minutes | 17 | 16.2% |
| 60 to 89 Minutes | 5 | 4.8% |
| 90 or more Minutes | 0 | 0.0% |
Commute Time by Sex in Kingsbury
The most common commute times in Kingsbury are 45 to 59 minutes (17 commuters, 28.8%) for males and 15 to 19 minutes (27 commuters, 58.7%) for females.
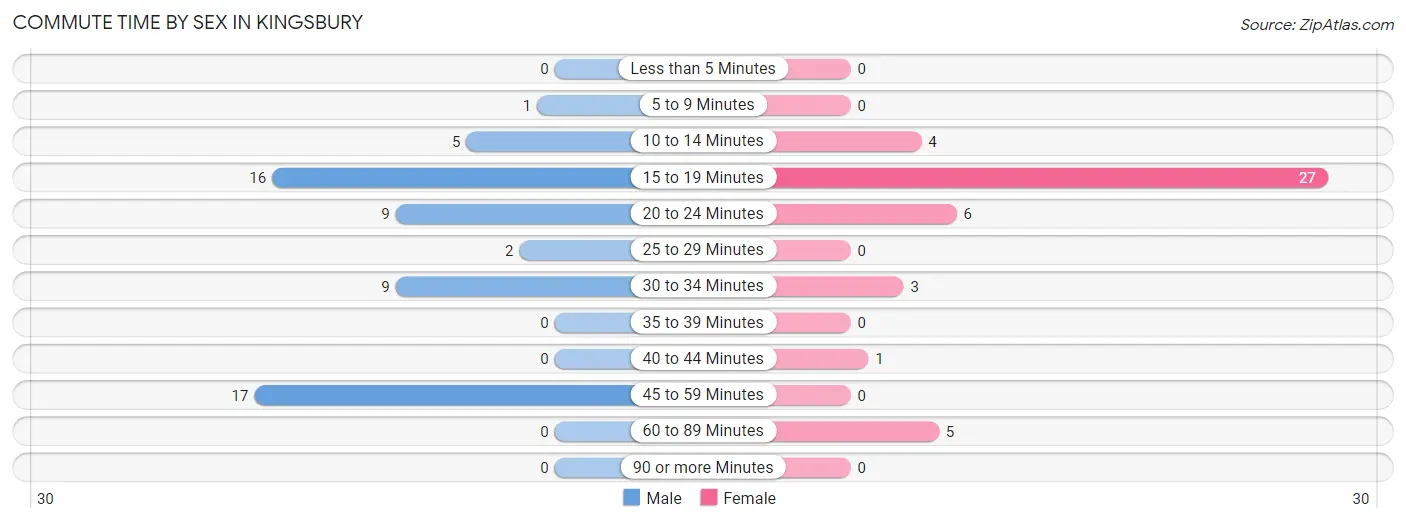
| Commute Time | Male | Female |
| Less than 5 Minutes | 0 (0.0%) | 0 (0.0%) |
| 5 to 9 Minutes | 1 (1.7%) | 0 (0.0%) |
| 10 to 14 Minutes | 5 (8.5%) | 4 (8.7%) |
| 15 to 19 Minutes | 16 (27.1%) | 27 (58.7%) |
| 20 to 24 Minutes | 9 (15.2%) | 6 (13.0%) |
| 25 to 29 Minutes | 2 (3.4%) | 0 (0.0%) |
| 30 to 34 Minutes | 9 (15.2%) | 3 (6.5%) |
| 35 to 39 Minutes | 0 (0.0%) | 0 (0.0%) |
| 40 to 44 Minutes | 0 (0.0%) | 1 (2.2%) |
| 45 to 59 Minutes | 17 (28.8%) | 0 (0.0%) |
| 60 to 89 Minutes | 0 (0.0%) | 5 (10.9%) |
| 90 or more Minutes | 0 (0.0%) | 0 (0.0%) |
Time of Departure to Work by Sex in Kingsbury
The most frequent times of departure to work in Kingsbury are 6:00 AM to 6:29 AM (17, 28.8%) for males and 6:00 AM to 6:29 AM (18, 39.1%) for females.
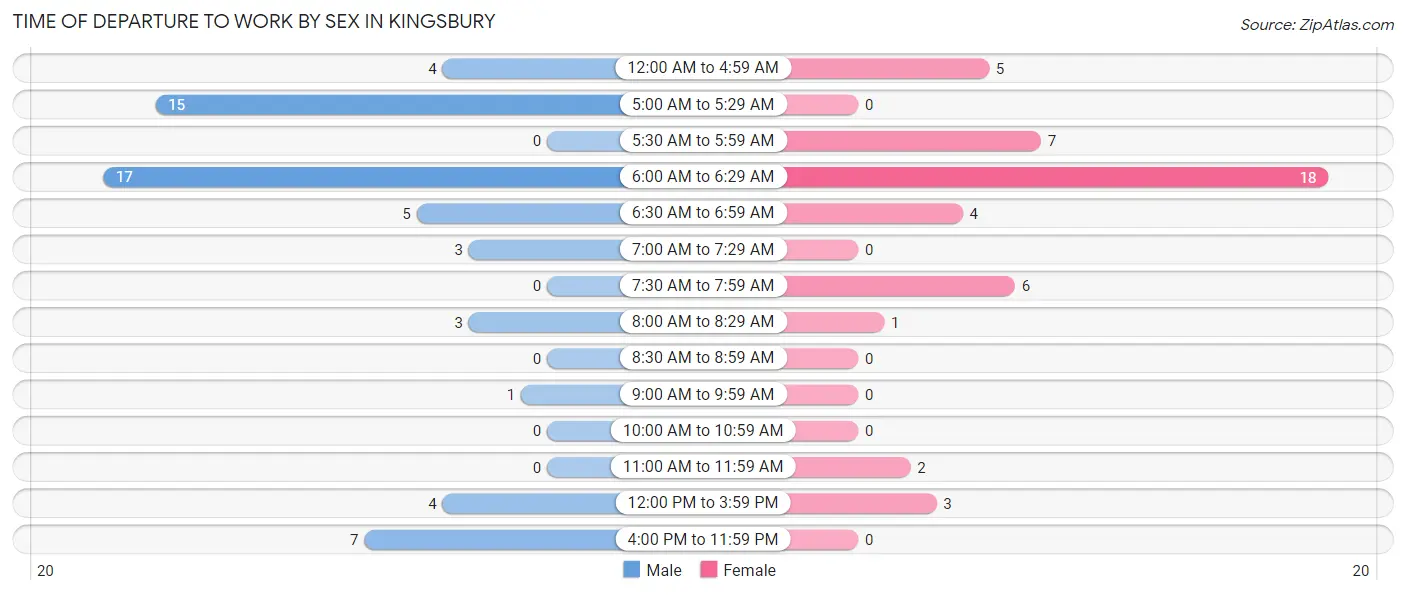
| Time of Departure | Male | Female |
| 12:00 AM to 4:59 AM | 4 (6.8%) | 5 (10.9%) |
| 5:00 AM to 5:29 AM | 15 (25.4%) | 0 (0.0%) |
| 5:30 AM to 5:59 AM | 0 (0.0%) | 7 (15.2%) |
| 6:00 AM to 6:29 AM | 17 (28.8%) | 18 (39.1%) |
| 6:30 AM to 6:59 AM | 5 (8.5%) | 4 (8.7%) |
| 7:00 AM to 7:29 AM | 3 (5.1%) | 0 (0.0%) |
| 7:30 AM to 7:59 AM | 0 (0.0%) | 6 (13.0%) |
| 8:00 AM to 8:29 AM | 3 (5.1%) | 1 (2.2%) |
| 8:30 AM to 8:59 AM | 0 (0.0%) | 0 (0.0%) |
| 9:00 AM to 9:59 AM | 1 (1.7%) | 0 (0.0%) |
| 10:00 AM to 10:59 AM | 0 (0.0%) | 0 (0.0%) |
| 11:00 AM to 11:59 AM | 0 (0.0%) | 2 (4.3%) |
| 12:00 PM to 3:59 PM | 4 (6.8%) | 3 (6.5%) |
| 4:00 PM to 11:59 PM | 7 (11.9%) | 0 (0.0%) |
| Total | 59 (100.0%) | 46 (100.0%) |
Housing Occupancy in Kingsbury
Occupancy by Ownership in Kingsbury
Of the total 106 dwellings in Kingsbury, owner-occupied units account for 89 (84.0%), while renter-occupied units make up 17 (16.0%).
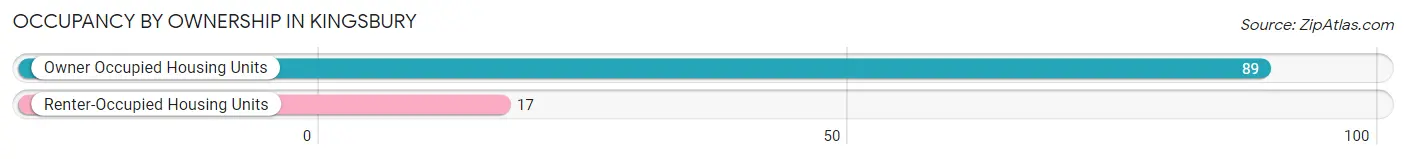
| Occupancy | # Housing Units | % Housing Units |
| Owner Occupied Housing Units | 89 | 84.0% |
| Renter-Occupied Housing Units | 17 | 16.0% |
| Total Occupied Housing Units | 106 | 100.0% |
Occupancy by Household Size in Kingsbury
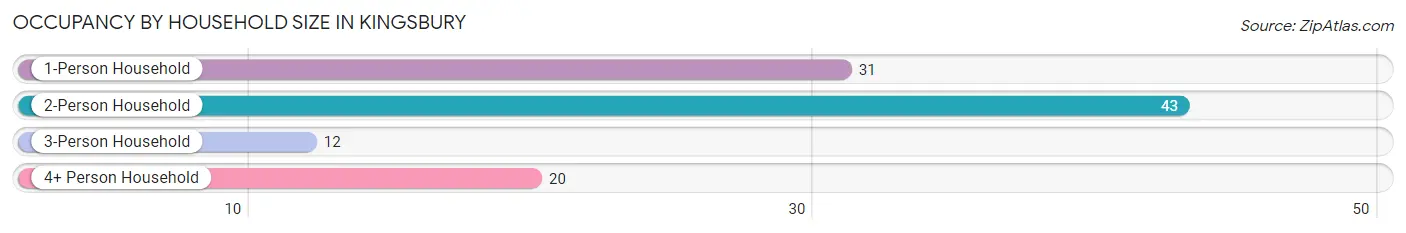
| Household Size | # Housing Units | % Housing Units |
| 1-Person Household | 31 | 29.2% |
| 2-Person Household | 43 | 40.6% |
| 3-Person Household | 12 | 11.3% |
| 4+ Person Household | 20 | 18.9% |
| Total Housing Units | 106 | 100.0% |
Occupancy by Ownership by Household Size in Kingsbury
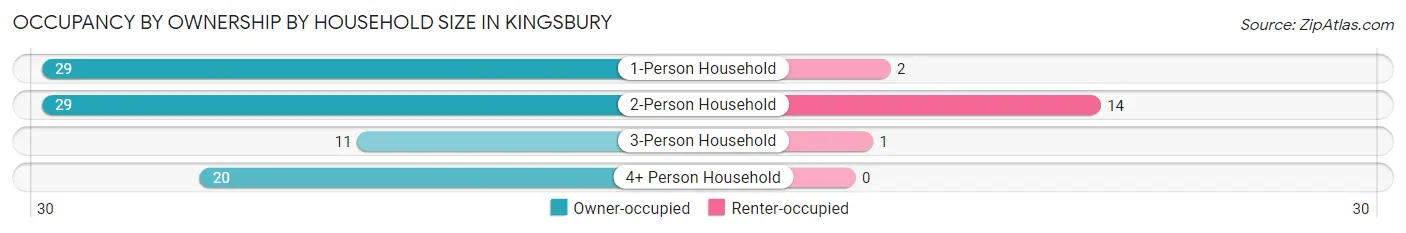
| Household Size | Owner-occupied | Renter-occupied |
| 1-Person Household | 29 (93.5%) | 2 (6.5%) |
| 2-Person Household | 29 (67.4%) | 14 (32.6%) |
| 3-Person Household | 11 (91.7%) | 1 (8.3%) |
| 4+ Person Household | 20 (100.0%) | 0 (0.0%) |
| Total Housing Units | 89 (84.0%) | 17 (16.0%) |
Occupancy by Educational Attainment in Kingsbury
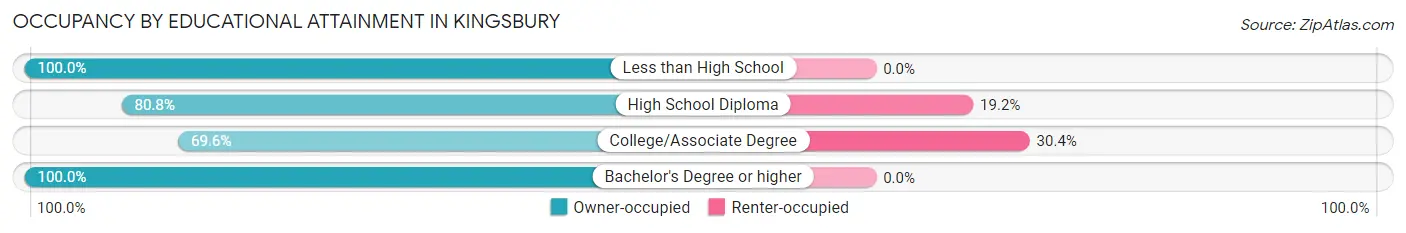
| Household Size | Owner-occupied | Renter-occupied |
| Less than High School | 24 (100.0%) | 0 (0.0%) |
| High School Diploma | 42 (80.8%) | 10 (19.2%) |
| College/Associate Degree | 16 (69.6%) | 7 (30.4%) |
| Bachelor's Degree or higher | 7 (100.0%) | 0 (0.0%) |
Occupancy by Age of Householder in Kingsbury
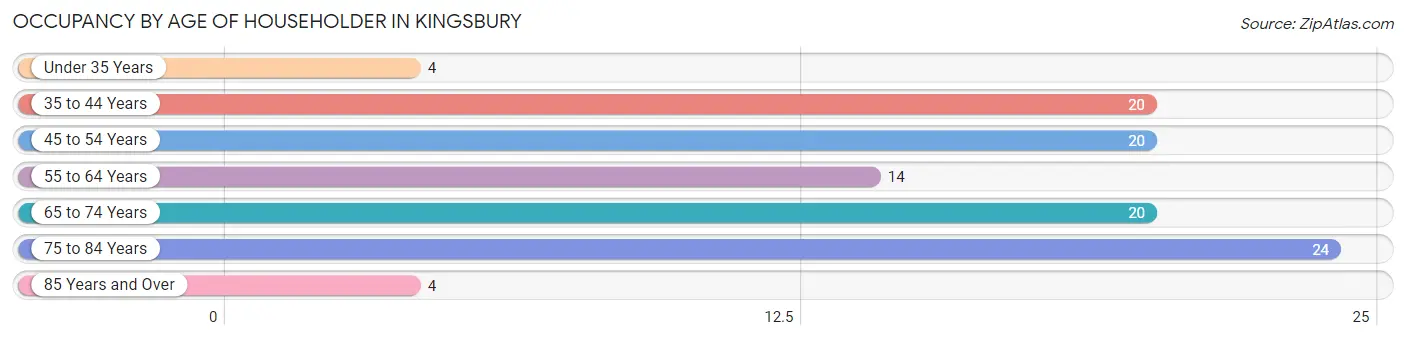
| Age Bracket | # Households | % Households |
| Under 35 Years | 4 | 3.8% |
| 35 to 44 Years | 20 | 18.9% |
| 45 to 54 Years | 20 | 18.9% |
| 55 to 64 Years | 14 | 13.2% |
| 65 to 74 Years | 20 | 18.9% |
| 75 to 84 Years | 24 | 22.6% |
| 85 Years and Over | 4 | 3.8% |
| Total | 106 | 100.0% |
Housing Finances in Kingsbury
Median Income by Occupancy in Kingsbury
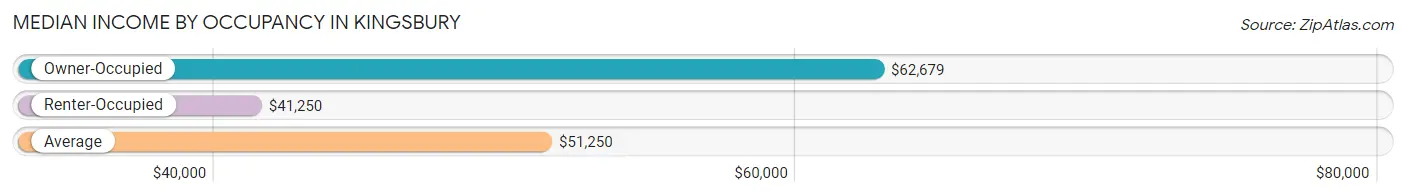
| Occupancy Type | # Households | Median Income |
| Owner-Occupied | 89 (84.0%) | $62,679 |
| Renter-Occupied | 17 (16.0%) | $41,250 |
| Average | 106 (100.0%) | $51,250 |
Occupancy by Householder Income Bracket in Kingsbury
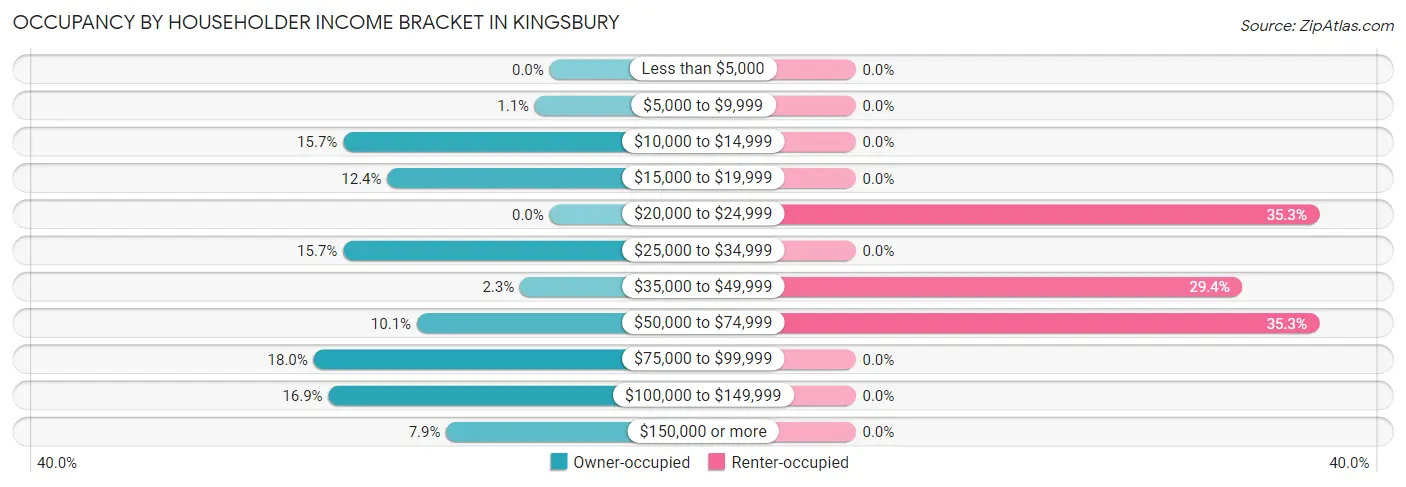
| Income Bracket | Owner-occupied | Renter-occupied |
| Less than $5,000 | 0 (0.0%) | 0 (0.0%) |
| $5,000 to $9,999 | 1 (1.1%) | 0 (0.0%) |
| $10,000 to $14,999 | 14 (15.7%) | 0 (0.0%) |
| $15,000 to $19,999 | 11 (12.4%) | 0 (0.0%) |
| $20,000 to $24,999 | 0 (0.0%) | 6 (35.3%) |
| $25,000 to $34,999 | 14 (15.7%) | 0 (0.0%) |
| $35,000 to $49,999 | 2 (2.2%) | 5 (29.4%) |
| $50,000 to $74,999 | 9 (10.1%) | 6 (35.3%) |
| $75,000 to $99,999 | 16 (18.0%) | 0 (0.0%) |
| $100,000 to $149,999 | 15 (16.9%) | 0 (0.0%) |
| $150,000 or more | 7 (7.9%) | 0 (0.0%) |
| Total | 89 (100.0%) | 17 (100.0%) |
Monthly Housing Cost Tiers in Kingsbury
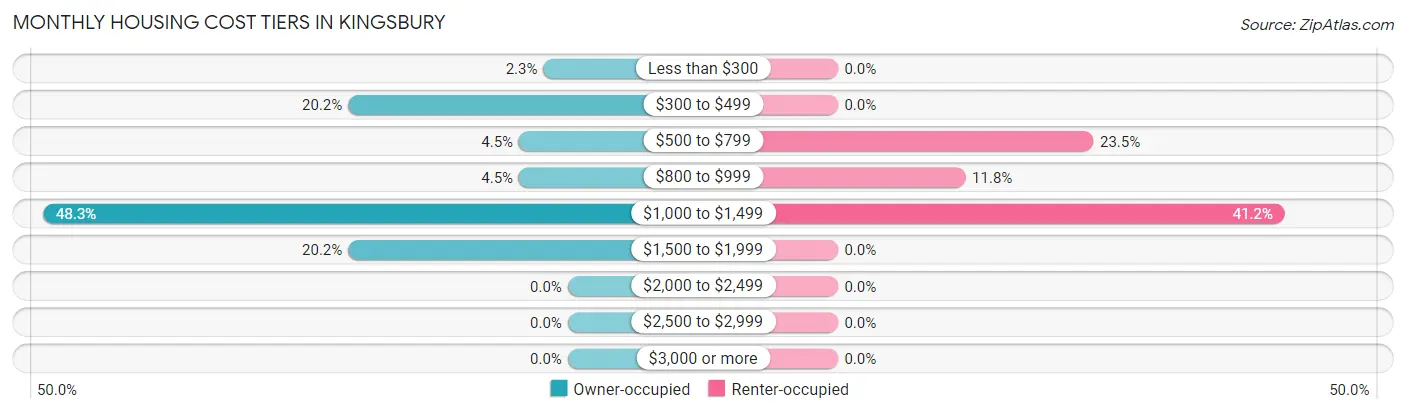
| Monthly Cost | Owner-occupied | Renter-occupied |
| Less than $300 | 2 (2.2%) | 0 (0.0%) |
| $300 to $499 | 18 (20.2%) | 0 (0.0%) |
| $500 to $799 | 4 (4.5%) | 4 (23.5%) |
| $800 to $999 | 4 (4.5%) | 2 (11.8%) |
| $1,000 to $1,499 | 43 (48.3%) | 7 (41.2%) |
| $1,500 to $1,999 | 18 (20.2%) | 0 (0.0%) |
| $2,000 to $2,499 | 0 (0.0%) | 0 (0.0%) |
| $2,500 to $2,999 | 0 (0.0%) | 0 (0.0%) |
| $3,000 or more | 0 (0.0%) | 0 (0.0%) |
| Total | 89 (100.0%) | 17 (100.0%) |
Physical Housing Characteristics in Kingsbury
Housing Structures in Kingsbury
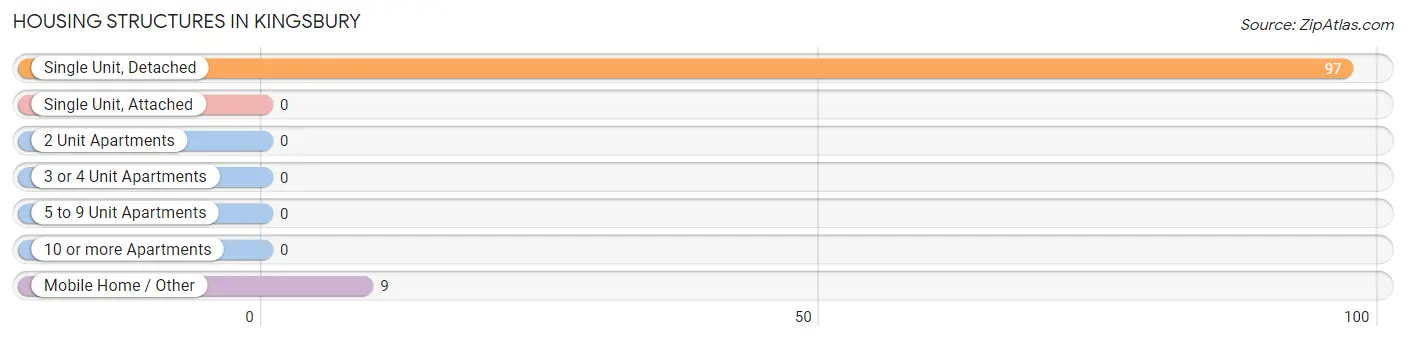
| Structure Type | # Housing Units | % Housing Units |
| Single Unit, Detached | 97 | 91.5% |
| Single Unit, Attached | 0 | 0.0% |
| 2 Unit Apartments | 0 | 0.0% |
| 3 or 4 Unit Apartments | 0 | 0.0% |
| 5 to 9 Unit Apartments | 0 | 0.0% |
| 10 or more Apartments | 0 | 0.0% |
| Mobile Home / Other | 9 | 8.5% |
| Total | 106 | 100.0% |
Housing Structures by Occupancy in Kingsbury
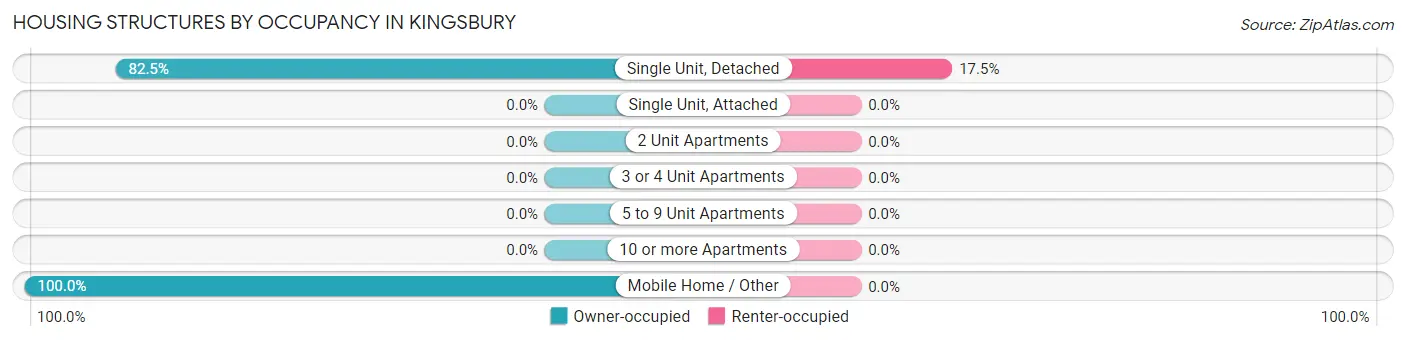
| Structure Type | Owner-occupied | Renter-occupied |
| Single Unit, Detached | 80 (82.5%) | 17 (17.5%) |
| Single Unit, Attached | 0 (0.0%) | 0 (0.0%) |
| 2 Unit Apartments | 0 (0.0%) | 0 (0.0%) |
| 3 or 4 Unit Apartments | 0 (0.0%) | 0 (0.0%) |
| 5 to 9 Unit Apartments | 0 (0.0%) | 0 (0.0%) |
| 10 or more Apartments | 0 (0.0%) | 0 (0.0%) |
| Mobile Home / Other | 9 (100.0%) | 0 (0.0%) |
| Total | 89 (84.0%) | 17 (16.0%) |
Housing Structures by Number of Rooms in Kingsbury
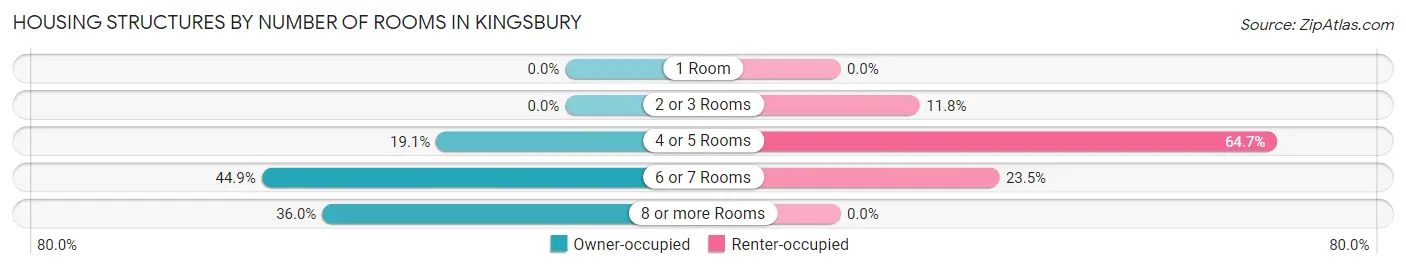
| Number of Rooms | Owner-occupied | Renter-occupied |
| 1 Room | 0 (0.0%) | 0 (0.0%) |
| 2 or 3 Rooms | 0 (0.0%) | 2 (11.8%) |
| 4 or 5 Rooms | 17 (19.1%) | 11 (64.7%) |
| 6 or 7 Rooms | 40 (44.9%) | 4 (23.5%) |
| 8 or more Rooms | 32 (36.0%) | 0 (0.0%) |
| Total | 89 (100.0%) | 17 (100.0%) |
Housing Structure by Heating Type in Kingsbury
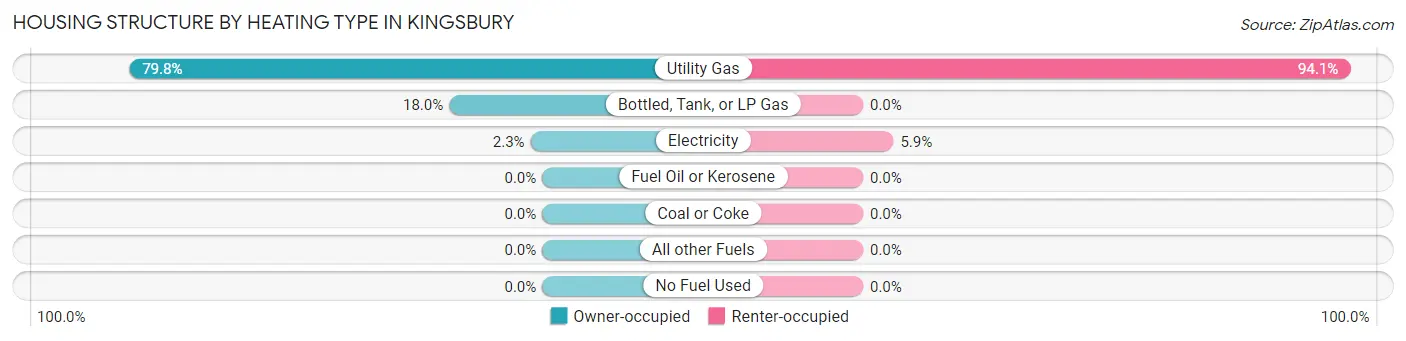
| Heating Type | Owner-occupied | Renter-occupied |
| Utility Gas | 71 (79.8%) | 16 (94.1%) |
| Bottled, Tank, or LP Gas | 16 (18.0%) | 0 (0.0%) |
| Electricity | 2 (2.2%) | 1 (5.9%) |
| Fuel Oil or Kerosene | 0 (0.0%) | 0 (0.0%) |
| Coal or Coke | 0 (0.0%) | 0 (0.0%) |
| All other Fuels | 0 (0.0%) | 0 (0.0%) |
| No Fuel Used | 0 (0.0%) | 0 (0.0%) |
| Total | 89 (100.0%) | 17 (100.0%) |
Household Vehicle Usage in Kingsbury
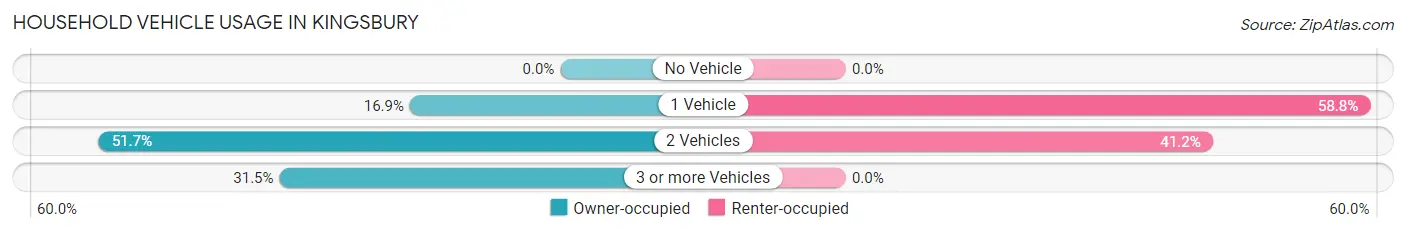
| Vehicles per Household | Owner-occupied | Renter-occupied |
| No Vehicle | 0 (0.0%) | 0 (0.0%) |
| 1 Vehicle | 15 (16.9%) | 10 (58.8%) |
| 2 Vehicles | 46 (51.7%) | 7 (41.2%) |
| 3 or more Vehicles | 28 (31.5%) | 0 (0.0%) |
| Total | 89 (100.0%) | 17 (100.0%) |
Real Estate & Mortgages in Kingsbury
Real Estate and Mortgage Overview in Kingsbury
| Characteristic | Without Mortgage | With Mortgage |
| Housing Units | 23 | 66 |
| Median Property Value | $97,200 | $162,500 |
| Median Household Income | $33,250 | $7 |
| Monthly Housing Costs | $358 | $0 |
| Real Estate Taxes | $1,156 | $1 |
Property Value by Mortgage Status in Kingsbury
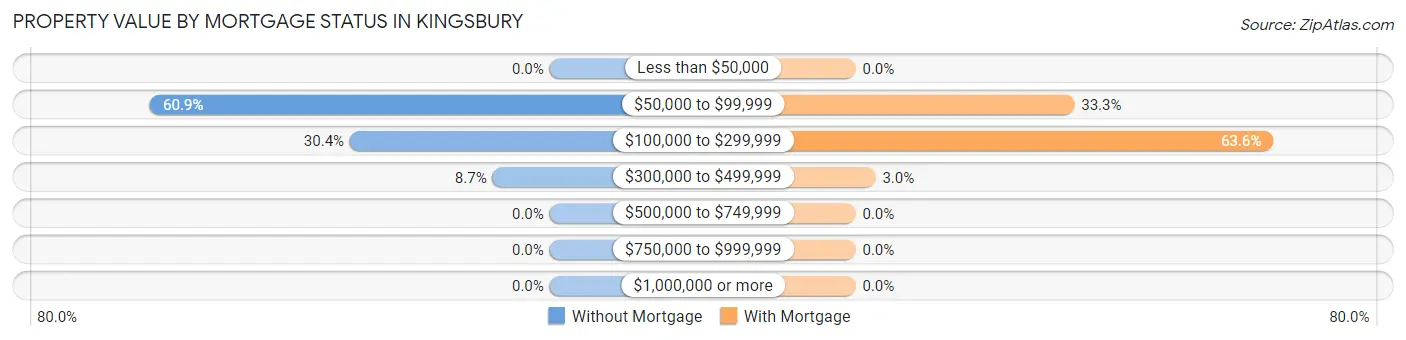
| Property Value | Without Mortgage | With Mortgage |
| Less than $50,000 | 0 (0.0%) | 0 (0.0%) |
| $50,000 to $99,999 | 14 (60.9%) | 22 (33.3%) |
| $100,000 to $299,999 | 7 (30.4%) | 42 (63.6%) |
| $300,000 to $499,999 | 2 (8.7%) | 2 (3.0%) |
| $500,000 to $749,999 | 0 (0.0%) | 0 (0.0%) |
| $750,000 to $999,999 | 0 (0.0%) | 0 (0.0%) |
| $1,000,000 or more | 0 (0.0%) | 0 (0.0%) |
| Total | 23 (100.0%) | 66 (100.0%) |
Household Income by Mortgage Status in Kingsbury
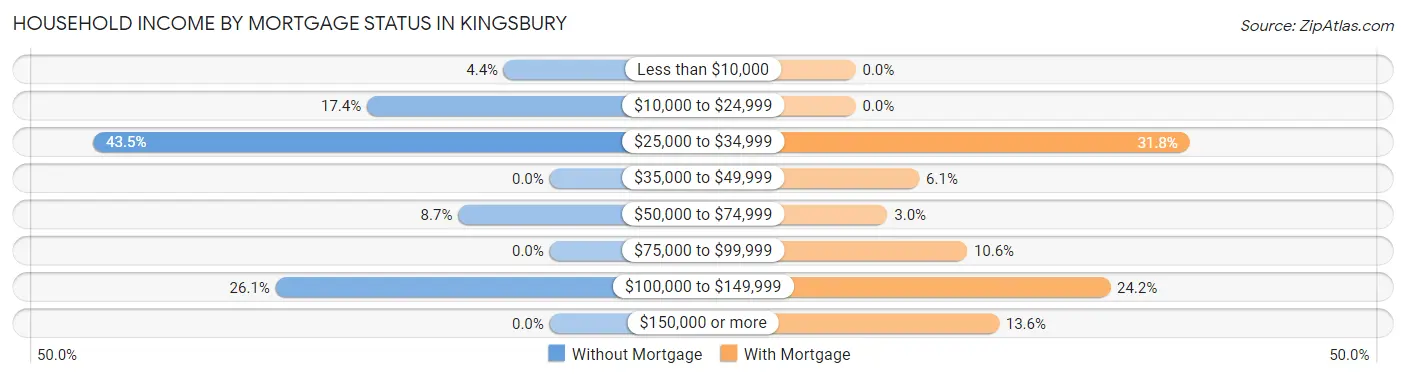
| Household Income | Without Mortgage | With Mortgage |
| Less than $10,000 | 1 (4.3%) | 0 (0.0%) |
| $10,000 to $24,999 | 4 (17.4%) | 0 (0.0%) |
| $25,000 to $34,999 | 10 (43.5%) | 21 (31.8%) |
| $35,000 to $49,999 | 0 (0.0%) | 4 (6.1%) |
| $50,000 to $74,999 | 2 (8.7%) | 2 (3.0%) |
| $75,000 to $99,999 | 0 (0.0%) | 7 (10.6%) |
| $100,000 to $149,999 | 6 (26.1%) | 16 (24.2%) |
| $150,000 or more | 0 (0.0%) | 9 (13.6%) |
| Total | 23 (100.0%) | 66 (100.0%) |
Property Value to Household Income Ratio in Kingsbury
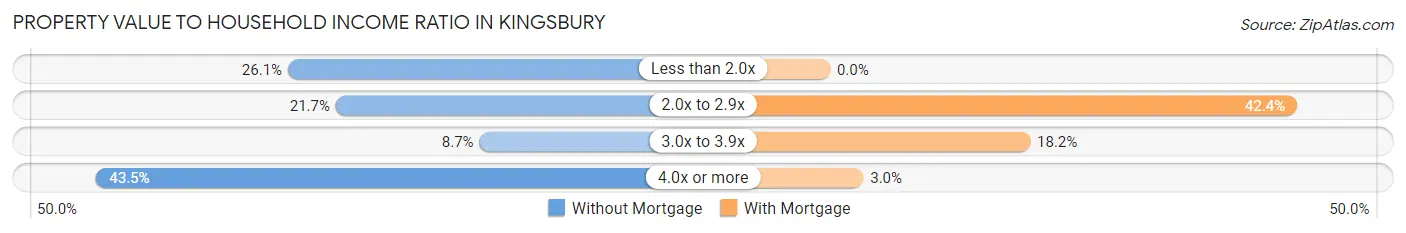
| Value-to-Income Ratio | Without Mortgage | With Mortgage |
| Less than 2.0x | 6 (26.1%) | 0 (0.0%) |
| 2.0x to 2.9x | 5 (21.7%) | 28 (42.4%) |
| 3.0x to 3.9x | 2 (8.7%) | 12 (18.2%) |
| 4.0x or more | 10 (43.5%) | 2 (3.0%) |
| Total | 23 (100.0%) | 66 (100.0%) |
Real Estate Taxes by Mortgage Status in Kingsbury
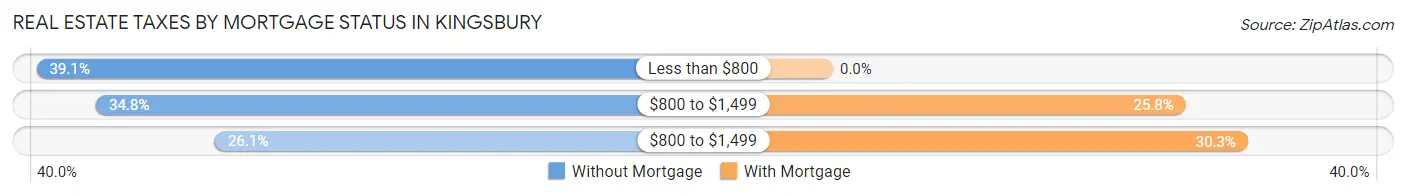
| Property Taxes | Without Mortgage | With Mortgage |
| Less than $800 | 9 (39.1%) | 0 (0.0%) |
| $800 to $1,499 | 8 (34.8%) | 17 (25.8%) |
| $800 to $1,499 | 6 (26.1%) | 20 (30.3%) |
| Total | 23 (100.0%) | 66 (100.0%) |
Health & Disability in Kingsbury
Health Insurance Coverage by Age in Kingsbury
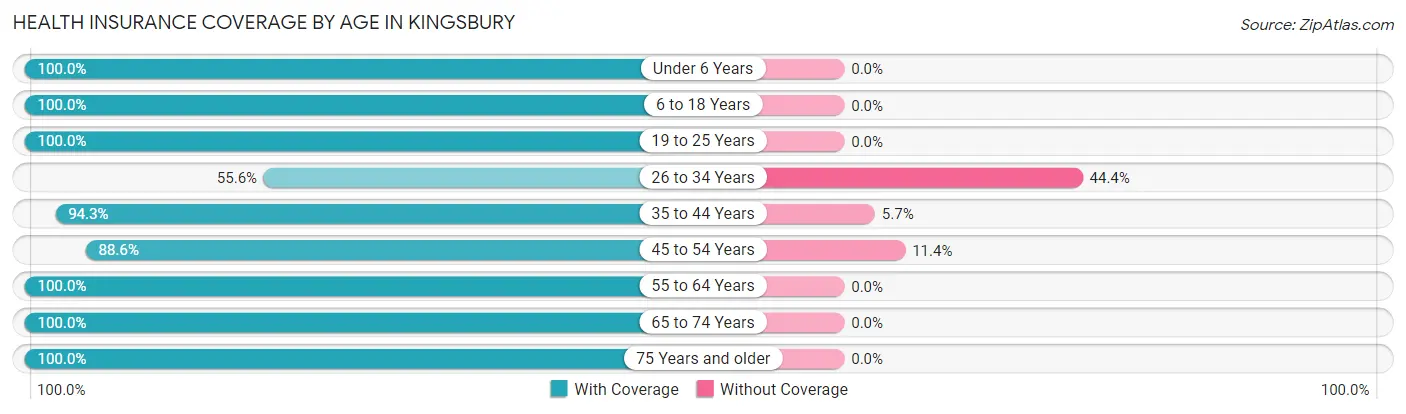
| Age Bracket | With Coverage | Without Coverage |
| Under 6 Years | 1 (100.0%) | 0 (0.0%) |
| 6 to 18 Years | 28 (100.0%) | 0 (0.0%) |
| 19 to 25 Years | 20 (100.0%) | 0 (0.0%) |
| 26 to 34 Years | 5 (55.6%) | 4 (44.4%) |
| 35 to 44 Years | 33 (94.3%) | 2 (5.7%) |
| 45 to 54 Years | 39 (88.6%) | 5 (11.4%) |
| 55 to 64 Years | 23 (100.0%) | 0 (0.0%) |
| 65 to 74 Years | 30 (100.0%) | 0 (0.0%) |
| 75 Years and older | 37 (100.0%) | 0 (0.0%) |
| Total | 216 (95.2%) | 11 (4.9%) |
Health Insurance Coverage by Citizenship Status in Kingsbury
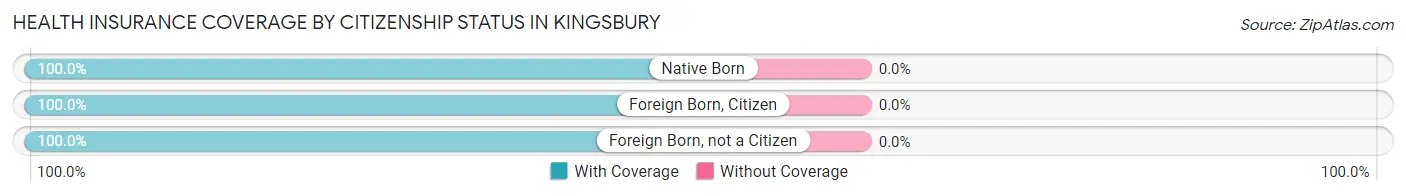
| Citizenship Status | With Coverage | Without Coverage |
| Native Born | 1 (100.0%) | 0 (0.0%) |
| Foreign Born, Citizen | 28 (100.0%) | 0 (0.0%) |
| Foreign Born, not a Citizen | 20 (100.0%) | 0 (0.0%) |
Health Insurance Coverage by Household Income in Kingsbury
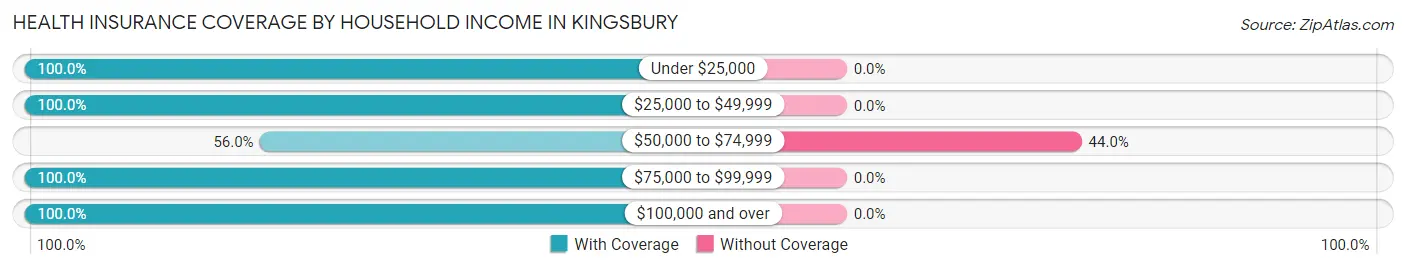
| Household Income | With Coverage | Without Coverage |
| Under $25,000 | 78 (100.0%) | 0 (0.0%) |
| $25,000 to $49,999 | 37 (100.0%) | 0 (0.0%) |
| $50,000 to $74,999 | 14 (56.0%) | 11 (44.0%) |
| $75,000 to $99,999 | 32 (100.0%) | 0 (0.0%) |
| $100,000 and over | 55 (100.0%) | 0 (0.0%) |
Public vs Private Health Insurance Coverage by Age in Kingsbury
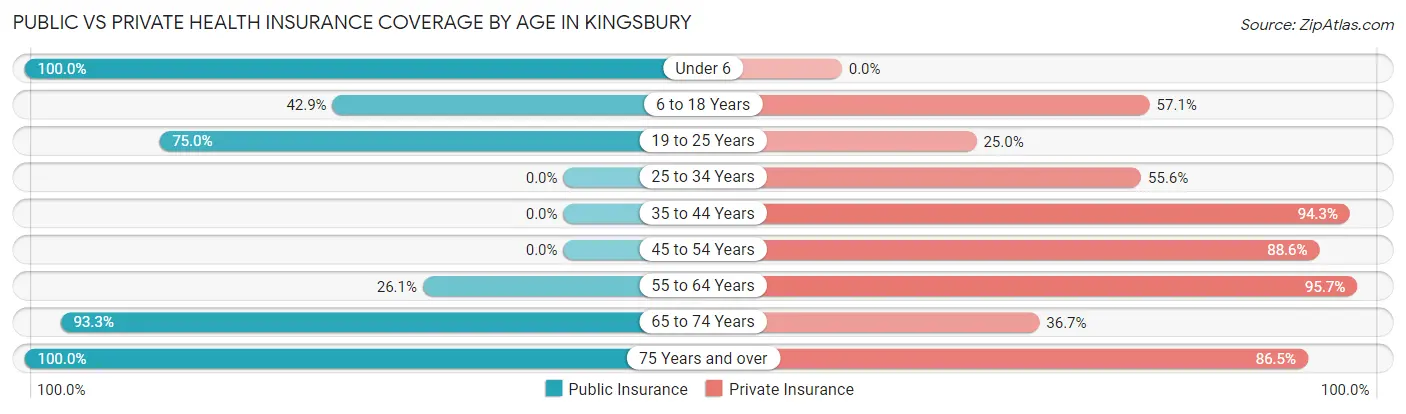
| Age Bracket | Public Insurance | Private Insurance |
| Under 6 | 1 (100.0%) | 0 (0.0%) |
| 6 to 18 Years | 12 (42.9%) | 16 (57.1%) |
| 19 to 25 Years | 15 (75.0%) | 5 (25.0%) |
| 25 to 34 Years | 0 (0.0%) | 5 (55.6%) |
| 35 to 44 Years | 0 (0.0%) | 33 (94.3%) |
| 45 to 54 Years | 0 (0.0%) | 39 (88.6%) |
| 55 to 64 Years | 6 (26.1%) | 22 (95.7%) |
| 65 to 74 Years | 28 (93.3%) | 11 (36.7%) |
| 75 Years and over | 37 (100.0%) | 32 (86.5%) |
| Total | 99 (43.6%) | 163 (71.8%) |
Disability Status by Sex by Age in Kingsbury
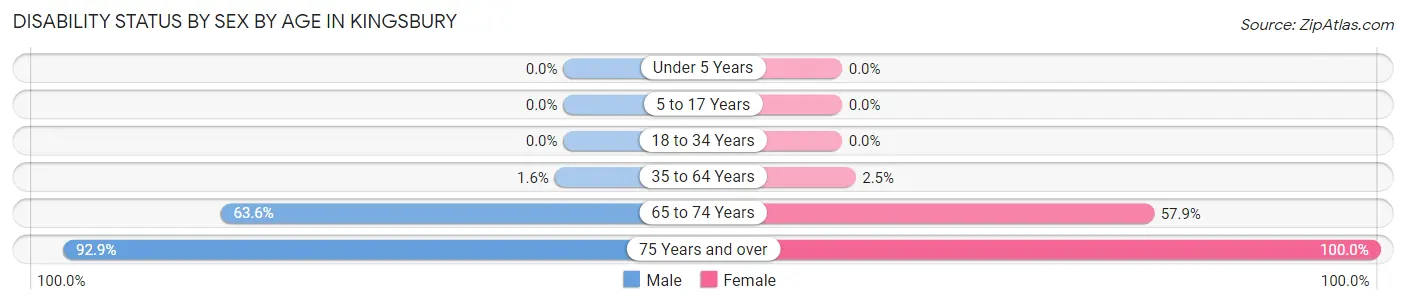
| Age Bracket | Male | Female |
| Under 5 Years | 0 (0.0%) | 0 (0.0%) |
| 5 to 17 Years | 0 (0.0%) | 0 (0.0%) |
| 18 to 34 Years | 0 (0.0%) | 0 (0.0%) |
| 35 to 64 Years | 1 (1.6%) | 1 (2.5%) |
| 65 to 74 Years | 7 (63.6%) | 11 (57.9%) |
| 75 Years and over | 26 (92.9%) | 9 (100.0%) |
Disability Class by Sex by Age in Kingsbury
Disability Class: Hearing Difficulty
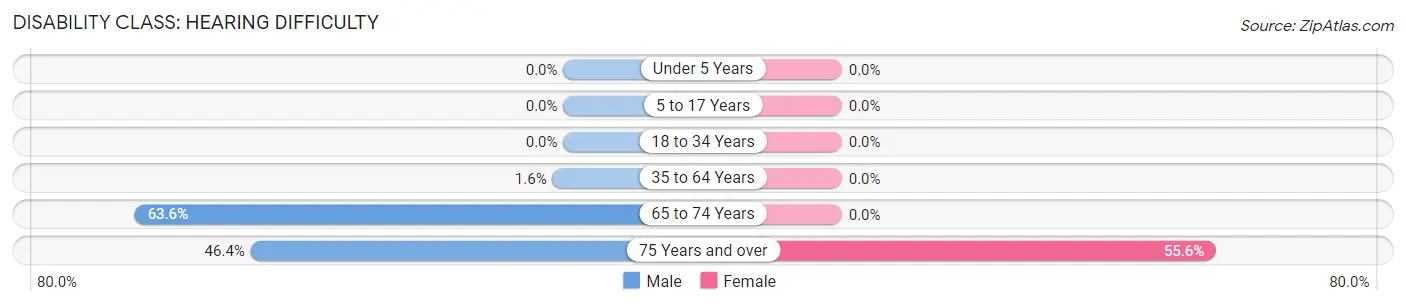
| Age Bracket | Male | Female |
| Under 5 Years | 0 (0.0%) | 0 (0.0%) |
| 5 to 17 Years | 0 (0.0%) | 0 (0.0%) |
| 18 to 34 Years | 0 (0.0%) | 0 (0.0%) |
| 35 to 64 Years | 1 (1.6%) | 0 (0.0%) |
| 65 to 74 Years | 7 (63.6%) | 0 (0.0%) |
| 75 Years and over | 13 (46.4%) | 5 (55.6%) |
Disability Class: Vision Difficulty
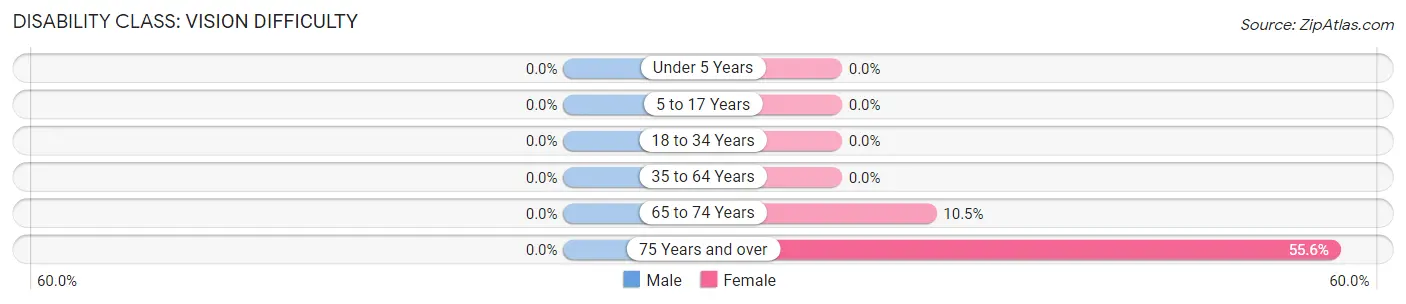
| Age Bracket | Male | Female |
| Under 5 Years | 0 (0.0%) | 0 (0.0%) |
| 5 to 17 Years | 0 (0.0%) | 0 (0.0%) |
| 18 to 34 Years | 0 (0.0%) | 0 (0.0%) |
| 35 to 64 Years | 0 (0.0%) | 0 (0.0%) |
| 65 to 74 Years | 0 (0.0%) | 2 (10.5%) |
| 75 Years and over | 0 (0.0%) | 5 (55.6%) |
Disability Class: Cognitive Difficulty
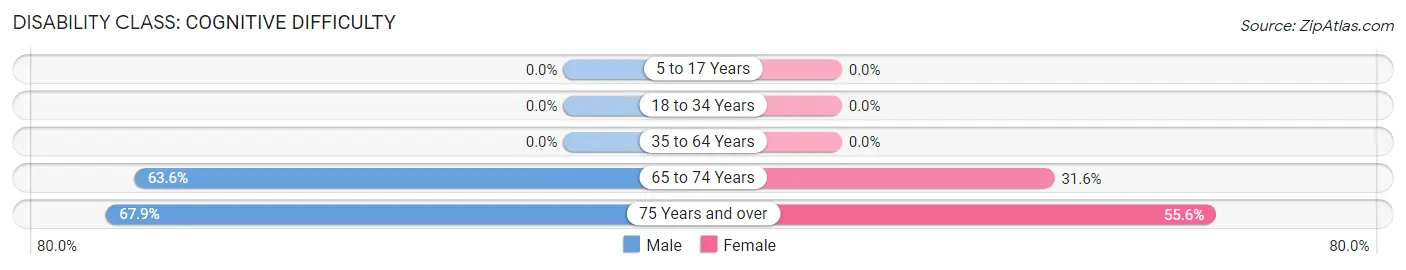
| Age Bracket | Male | Female |
| 5 to 17 Years | 0 (0.0%) | 0 (0.0%) |
| 18 to 34 Years | 0 (0.0%) | 0 (0.0%) |
| 35 to 64 Years | 0 (0.0%) | 0 (0.0%) |
| 65 to 74 Years | 7 (63.6%) | 6 (31.6%) |
| 75 Years and over | 19 (67.9%) | 5 (55.6%) |
Disability Class: Ambulatory Difficulty
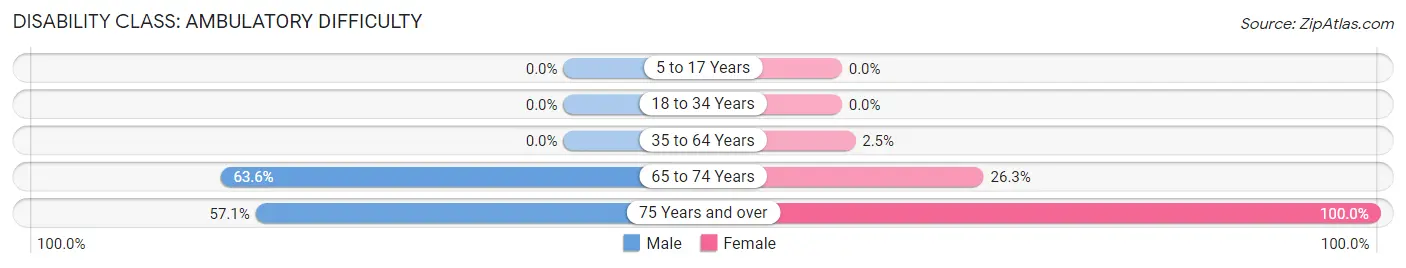
| Age Bracket | Male | Female |
| 5 to 17 Years | 0 (0.0%) | 0 (0.0%) |
| 18 to 34 Years | 0 (0.0%) | 0 (0.0%) |
| 35 to 64 Years | 0 (0.0%) | 1 (2.5%) |
| 65 to 74 Years | 7 (63.6%) | 5 (26.3%) |
| 75 Years and over | 16 (57.1%) | 9 (100.0%) |
Disability Class: Self-Care Difficulty
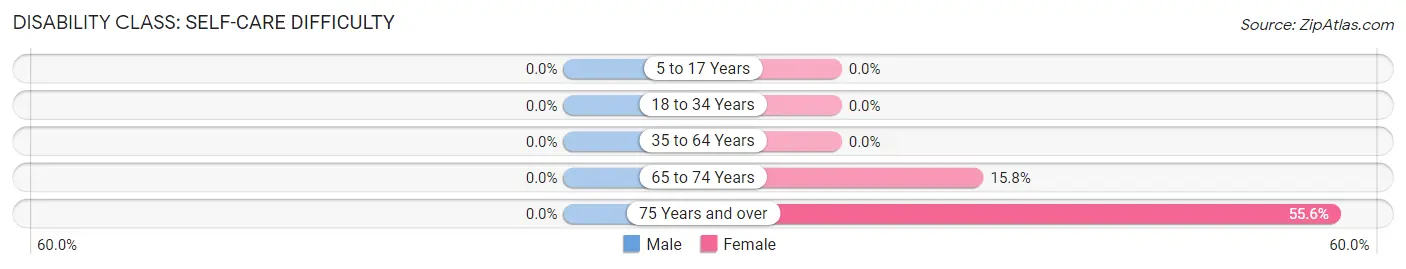
| Age Bracket | Male | Female |
| 5 to 17 Years | 0 (0.0%) | 0 (0.0%) |
| 18 to 34 Years | 0 (0.0%) | 0 (0.0%) |
| 35 to 64 Years | 0 (0.0%) | 0 (0.0%) |
| 65 to 74 Years | 0 (0.0%) | 3 (15.8%) |
| 75 Years and over | 0 (0.0%) | 5 (55.6%) |
Technology Access in Kingsbury
Computing Device Access in Kingsbury
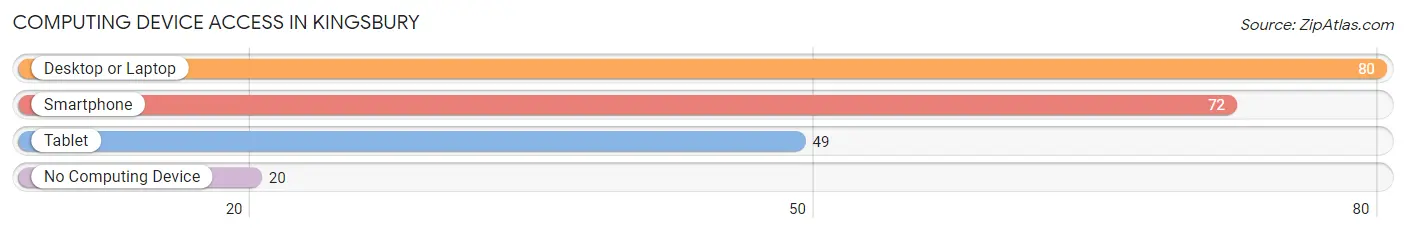
| Device Type | # Households | % Households |
| Desktop or Laptop | 80 | 75.5% |
| Smartphone | 72 | 67.9% |
| Tablet | 49 | 46.2% |
| No Computing Device | 20 | 18.9% |
| Total | 106 | 100.0% |
Internet Access in Kingsbury
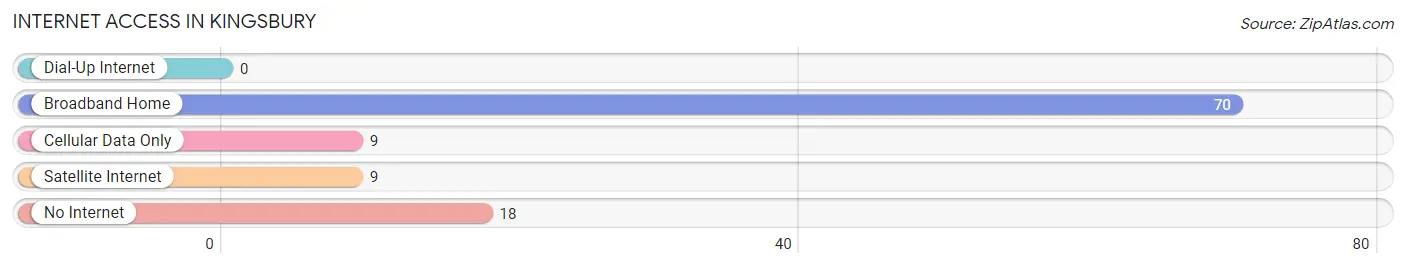
| Internet Type | # Households | % Households |
| Dial-Up Internet | 0 | 0.0% |
| Broadband Home | 70 | 66.0% |
| Cellular Data Only | 9 | 8.5% |
| Satellite Internet | 9 | 8.5% |
| No Internet | 18 | 17.0% |
| Total | 106 | 100.0% |
Kingsbury Summary
History
Kingsbury is a small town located in LaPorte County, Indiana. It was founded in 1836 by William Kingsbury, a settler from New York. The town was originally known as Kingsbury’s Station, and was a stop on the Michigan Central Railroad. The town was officially incorporated in 1871.
Kingsbury has a rich history of industry and agriculture. In the late 1800s, the town was home to several factories, including a sawmill, a grist mill, a brickyard, and a furniture factory. The town also had a thriving agricultural industry, with farmers growing corn, wheat, oats, and hay.
In the early 1900s, Kingsbury experienced a period of growth and prosperity. The town was home to several businesses, including a bank, a hotel, a movie theater, and a variety of stores. The town also had a thriving school system, with several elementary and high schools.
In the mid-1900s, Kingsbury experienced a period of decline. Many of the factories and businesses closed, and the population began to decline. In the late 1900s, the town began to experience a resurgence, with new businesses and industries moving into the area.
Geography
Kingsbury is located in LaPorte County, Indiana. It is situated on the banks of the Kankakee River, and is surrounded by rolling hills and farmland. The town is located approximately 25 miles south of South Bend, and is about an hour’s drive from Chicago.
The town has a total area of 1.2 square miles, all of which is land. The town has a humid continental climate, with hot summers and cold winters. The average annual temperature is around 50 degrees Fahrenheit.
Economy
Kingsbury’s economy is largely based on agriculture and manufacturing. The town is home to several farms, which produce corn, wheat, oats, and hay. The town also has several factories, which produce a variety of products, including furniture, clothing, and automotive parts.
The town also has a thriving tourism industry. The town is home to several attractions, including the Kingsbury State Park, the Kingsbury Aquarium, and the Kingsbury Historical Museum. The town also hosts several festivals and events throughout the year, including the Kingsbury County Fair and the Kingsbury Music Festival.
Demographics
As of the 2010 census, the population of Kingsbury was 1,845. The town has a population density of 1,521 people per square mile. The median age of the population is 43.7 years, and the median household income is $45,945.
The town is predominantly white, with 92.3% of the population identifying as white. The town also has a small Hispanic population, with 4.2% of the population identifying as Hispanic or Latino. The town also has a small African American population, with 1.2% of the population identifying as African American.
Conclusion
Kingsbury is a small town located in LaPorte County, Indiana. The town has a rich history of industry and agriculture, and is home to several businesses and attractions. The town has a population of 1,845, and has a median household income of $45,945. Kingsbury is predominantly white, with 92.3% of the population identifying as white. The town also has a small Hispanic and African American population.
Common Questions
What is Per Capita Income in Kingsbury?
Per Capita income in Kingsbury is $29,319.
What is the Median Family Income in Kingsbury?
Median Family Income in Kingsbury is $52,708.
What is the Median Household income in Kingsbury?
Median Household Income in Kingsbury is $51,250.
What is Inequality or Gini Index in Kingsbury?
Inequality or Gini Index in Kingsbury is 0.41.
What is the Total Population of Kingsbury?
Total Population of Kingsbury is 227.
What is the Total Male Population of Kingsbury?
Total Male Population of Kingsbury is 140.
What is the Total Female Population of Kingsbury?
Total Female Population of Kingsbury is 87.
What is the Ratio of Males per 100 Females in Kingsbury?
There are 160.92 Males per 100 Females in Kingsbury.
What is the Ratio of Females per 100 Males in Kingsbury?
There are 62.14 Females per 100 Males in Kingsbury.
What is the Median Population Age in Kingsbury?
Median Population Age in Kingsbury is 50.0 Years.
What is the Average Family Size in Kingsbury
Average Family Size in Kingsbury is 2.6 People.
What is the Average Household Size in Kingsbury
Average Household Size in Kingsbury is 2.1 People.
How Large is the Labor Force in Kingsbury?
There are 112 People in the Labor Forcein in Kingsbury.
What is the Percentage of People in the Labor Force in Kingsbury?
52.6% of People are in the Labor Force in Kingsbury.
What is the Unemployment Rate in Kingsbury?
Unemployment Rate in Kingsbury is 6.3%.