Mount Carmel, IN Map & Demographics
Mount Carmel Map
Mount Carmel Overview
$40,726
PER CAPITA INCOME
$96,042
AVG FAMILY INCOME
$80,625
AVG HOUSEHOLD INCOME
38.1%
WAGE / INCOME GAP [ % ]
61.9¢/ $1
WAGE / INCOME GAP [ $ ]
0.24
INEQUALITY / GINI INDEX
31
TOTAL POPULATION
14
MALE POPULATION
17
FEMALE POPULATION
82.35
MALES / 100 FEMALES
121.43
FEMALES / 100 MALES
57.1
MEDIAN AGE
2.2
AVG FAMILY SIZE
1.6
AVG HOUSEHOLD SIZE
22
LABOR FORCE [ PEOPLE ]
71.0%
PERCENT IN LABOR FORCE
Income in Mount Carmel
Income Overview in Mount Carmel
Per Capita Income in Mount Carmel is $40,726, while median incomes of families and households are $96,042 and $80,625 respectively.
| Characteristic | Number | Measure |
| Per Capita Income | 31 | $40,726 |
| Median Family Income | 9 | $96,042 |
| Mean Family Income | 9 | $96,156 |
| Median Household Income | 19 | $80,625 |
| Mean Household Income | 19 | $71,053 |
| Income Deficit | 9 | $0 |
| Wage / Income Gap (%) | 31 | 38.13% |
| Wage / Income Gap ($) | 31 | 61.87¢ per $1 |
| Gini / Inequality Index | 31 | 0.24 |
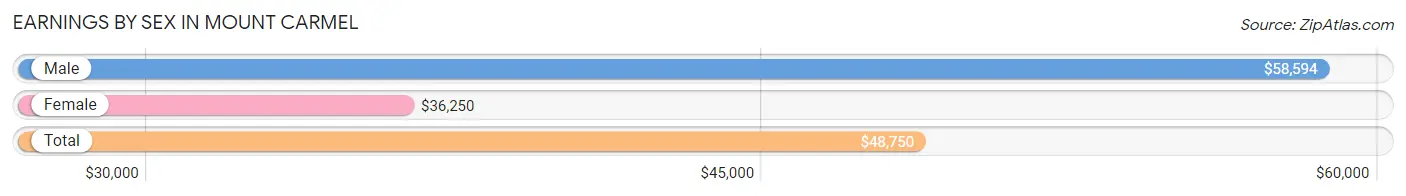
Earnings by Sex in Mount Carmel
Average Earnings in Mount Carmel are $48,750, $58,594 for men and $36,250 for women, a difference of 38.1%.
| Sex | Number | Average Earnings |
| Male | 11 (45.8%) | $58,594 |
| Female | 13 (54.2%) | $36,250 |
| Total | 24 (100.0%) | $48,750 |
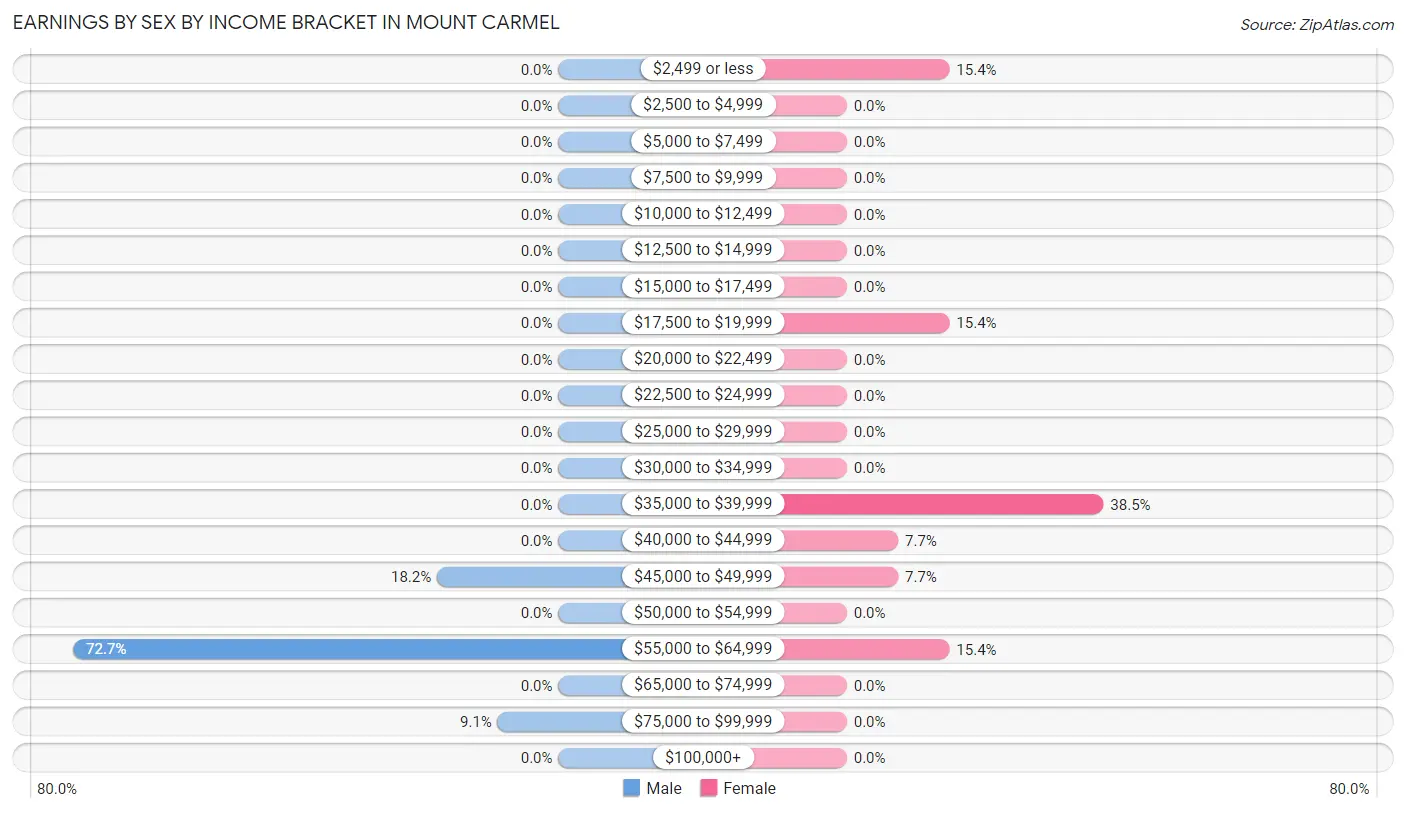
Earnings by Sex by Income Bracket in Mount Carmel
The most common earnings brackets in Mount Carmel are $55,000 to $64,999 for men (8 | 72.7%) and $35,000 to $39,999 for women (5 | 38.5%).
| Income | Male | Female |
| $2,499 or less | 0 (0.0%) | 2 (15.4%) |
| $2,500 to $4,999 | 0 (0.0%) | 0 (0.0%) |
| $5,000 to $7,499 | 0 (0.0%) | 0 (0.0%) |
| $7,500 to $9,999 | 0 (0.0%) | 0 (0.0%) |
| $10,000 to $12,499 | 0 (0.0%) | 0 (0.0%) |
| $12,500 to $14,999 | 0 (0.0%) | 0 (0.0%) |
| $15,000 to $17,499 | 0 (0.0%) | 0 (0.0%) |
| $17,500 to $19,999 | 0 (0.0%) | 2 (15.4%) |
| $20,000 to $22,499 | 0 (0.0%) | 0 (0.0%) |
| $22,500 to $24,999 | 0 (0.0%) | 0 (0.0%) |
| $25,000 to $29,999 | 0 (0.0%) | 0 (0.0%) |
| $30,000 to $34,999 | 0 (0.0%) | 0 (0.0%) |
| $35,000 to $39,999 | 0 (0.0%) | 5 (38.5%) |
| $40,000 to $44,999 | 0 (0.0%) | 1 (7.7%) |
| $45,000 to $49,999 | 2 (18.2%) | 1 (7.7%) |
| $50,000 to $54,999 | 0 (0.0%) | 0 (0.0%) |
| $55,000 to $64,999 | 8 (72.7%) | 2 (15.4%) |
| $65,000 to $74,999 | 0 (0.0%) | 0 (0.0%) |
| $75,000 to $99,999 | 1 (9.1%) | 0 (0.0%) |
| $100,000+ | 0 (0.0%) | 0 (0.0%) |
| Total | 11 (100.0%) | 13 (100.0%) |
Earnings by Sex by Educational Attainment in Mount Carmel
| Educational Attainment | Male Income | Female Income |
| Less than High School | - | - |
| High School Diploma | - | - |
| College or Associate's Degree | - | - |
| Bachelor's Degree | - | - |
| Graduate Degree | - | - |
| Total | $58,594 | $36,750 |
Family Income in Mount Carmel
Family Income Brackets in Mount Carmel
According to the Mount Carmel family income data, there are 8 families falling into the $75,000 to $99,999 income range, which is the most common income bracket and makes up 88.9% of all families.
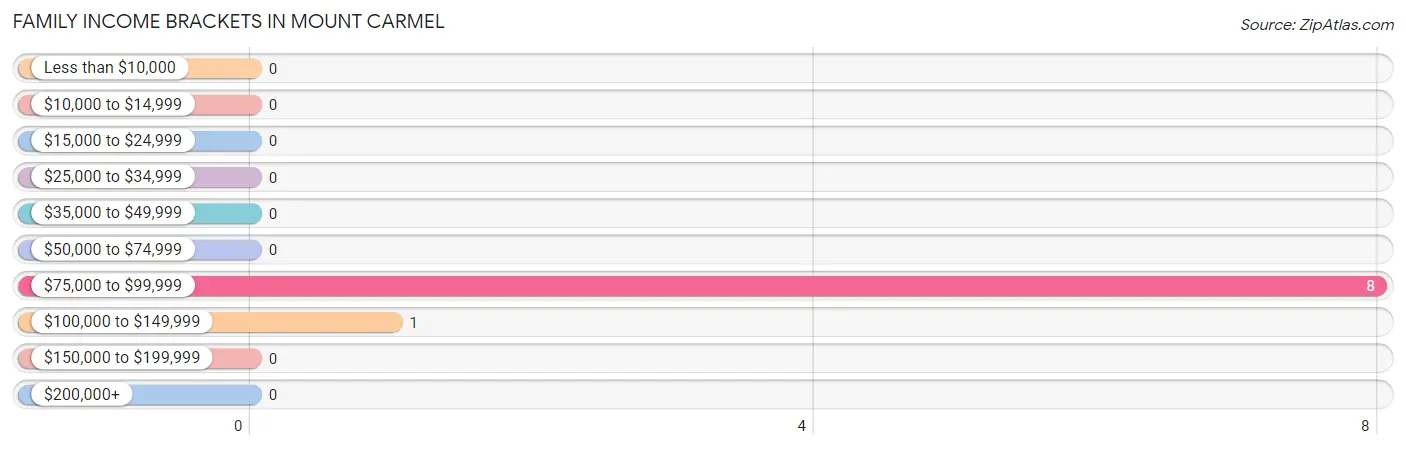
| Income Bracket | # Families | % Families |
| Less than $10,000 | 0 | 0.0% |
| $10,000 to $14,999 | 0 | 0.0% |
| $15,000 to $24,999 | 0 | 0.0% |
| $25,000 to $34,999 | 0 | 0.0% |
| $35,000 to $49,999 | 0 | 0.0% |
| $50,000 to $74,999 | 0 | 0.0% |
| $75,000 to $99,999 | 8 | 88.9% |
| $100,000 to $149,999 | 1 | 11.1% |
| $150,000 to $199,999 | 0 | 0.0% |
| $200,000+ | 0 | 0.0% |
Family Income by Famaliy Size in Mount Carmel
| Income Bracket | # Families | Median Income |
| 2-Person Families | 6 (66.7%) | $0 |
| 3-Person Families | 3 (33.3%) | $0 |
| 4-Person Families | 0 (0.0%) | $0 |
| 5-Person Families | 0 (0.0%) | $0 |
| 6-Person Families | 0 (0.0%) | $0 |
| 7+ Person Families | 0 (0.0%) | $0 |
| Total | 9 (100.0%) | $96,042 |
Family Income by Number of Earners in Mount Carmel
| Number of Earners | # Families | Median Income |
| No Earners | 0 (0.0%) | $0 |
| 1 Earner | 0 (0.0%) | $0 |
| 2 Earners | 8 (88.9%) | $0 |
| 3+ Earners | 1 (11.1%) | $0 |
| Total | 9 (100.0%) | $96,042 |
Household Income in Mount Carmel
Household Income Brackets in Mount Carmel
With 8 households falling in the category, the $75,000 to $99,999 income range is the most frequent in Mount Carmel, accounting for 42.1% of all households.
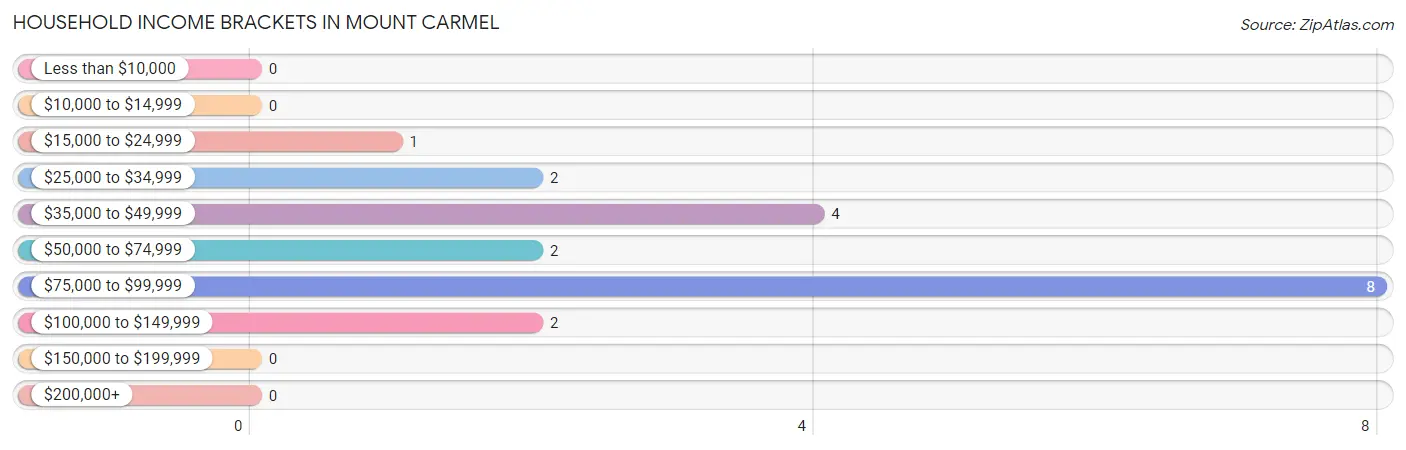
| Income Bracket | # Households | % Households |
| Less than $10,000 | 0 | 0.0% |
| $10,000 to $14,999 | 0 | 0.0% |
| $15,000 to $24,999 | 1 | 5.3% |
| $25,000 to $34,999 | 2 | 10.5% |
| $35,000 to $49,999 | 4 | 21.1% |
| $50,000 to $74,999 | 2 | 10.5% |
| $75,000 to $99,999 | 8 | 42.1% |
| $100,000 to $149,999 | 2 | 10.5% |
| $150,000 to $199,999 | 0 | 0.0% |
| $200,000+ | 0 | 0.0% |
Household Income by Householder Age in Mount Carmel
| Income Bracket | # Households | Median Income |
| 15 to 24 Years | 0 (0.0%) | $0 |
| 25 to 44 Years | 2 (10.5%) | $0 |
| 45 to 64 Years | 13 (68.4%) | $0 |
| 65+ Years | 4 (21.0%) | $0 |
| Total | 19 (100.0%) | $80,625 |
Poverty in Mount Carmel
Income Below Poverty by Sex and Age in Mount Carmel
| Age Bracket | Male | Female |
| Under 5 Years | 0 (0.0%) | 0 (0.0%) |
| 5 Years | 0 (0.0%) | 0 (0.0%) |
| 6 to 11 Years | 0 (0.0%) | 0 (0.0%) |
| 12 to 14 Years | 0 (0.0%) | 0 (0.0%) |
| 15 Years | 0 (0.0%) | 0 (0.0%) |
| 16 and 17 Years | 0 (0.0%) | 0 (0.0%) |
| 18 to 24 Years | 0 (0.0%) | 0 (0.0%) |
| 25 to 34 Years | 0 (0.0%) | 0 (0.0%) |
| 35 to 44 Years | 0 (0.0%) | 0 (0.0%) |
| 45 to 54 Years | 0 (0.0%) | 0 (0.0%) |
| 55 to 64 Years | 0 (0.0%) | 0 (0.0%) |
| 65 to 74 Years | 0 (0.0%) | 0 (0.0%) |
| 75 Years and over | 0 (0.0%) | 0 (0.0%) |
| Total | 0 (0.0%) | 0 (0.0%) |
Income Above Poverty by Sex and Age in Mount Carmel
According to the poverty statistics in Mount Carmel, males aged 25 to 34 years and females aged 16 and 17 years are the age groups that are most secure financially, with 100.0% of males and 100.0% of females in these age groups living above the poverty line.
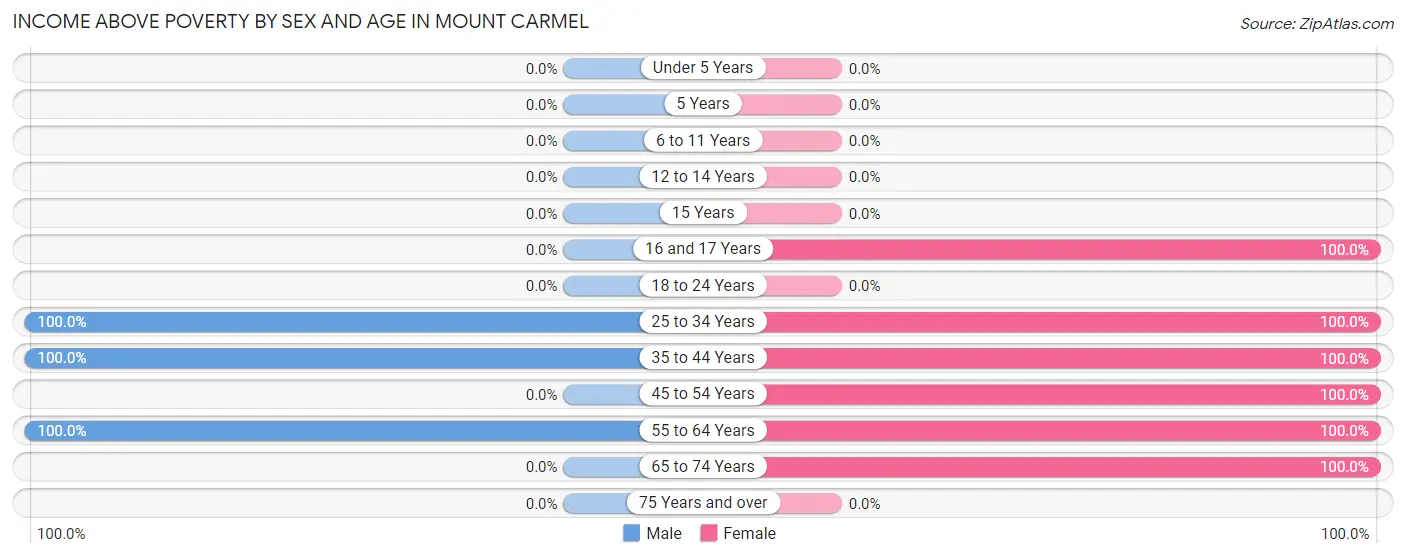
| Age Bracket | Male | Female |
| Under 5 Years | 0 (0.0%) | 0 (0.0%) |
| 5 Years | 0 (0.0%) | 0 (0.0%) |
| 6 to 11 Years | 0 (0.0%) | 0 (0.0%) |
| 12 to 14 Years | 0 (0.0%) | 0 (0.0%) |
| 15 Years | 0 (0.0%) | 0 (0.0%) |
| 16 and 17 Years | 0 (0.0%) | 2 (100.0%) |
| 18 to 24 Years | 0 (0.0%) | 0 (0.0%) |
| 25 to 34 Years | 1 (100.0%) | 1 (100.0%) |
| 35 to 44 Years | 3 (100.0%) | 1 (100.0%) |
| 45 to 54 Years | 0 (0.0%) | 7 (100.0%) |
| 55 to 64 Years | 10 (100.0%) | 2 (100.0%) |
| 65 to 74 Years | 0 (0.0%) | 4 (100.0%) |
| 75 Years and over | 0 (0.0%) | 0 (0.0%) |
| Total | 14 (100.0%) | 17 (100.0%) |
Income Below Poverty Among Married-Couple Families in Mount Carmel
| Children | Above Poverty | Below Poverty |
| No Children | 8 (100.0%) | 0 (0.0%) |
| 1 or 2 Children | 1 (100.0%) | 0 (0.0%) |
| 3 or 4 Children | 0 (0.0%) | 0 (0.0%) |
| 5 or more Children | 0 (0.0%) | 0 (0.0%) |
| Total | 9 (100.0%) | 0 (0.0%) |
Income Below Poverty Among Single-Parent Households in Mount Carmel
| Children | Single Father | Single Mother |
| No Children | 0 (0.0%) | 0 (0.0%) |
| 1 or 2 Children | 0 (0.0%) | 0 (0.0%) |
| 3 or 4 Children | 0 (0.0%) | 0 (0.0%) |
| 5 or more Children | 0 (0.0%) | 0 (0.0%) |
| Total | 0 (0.0%) | 0 (0.0%) |
Income Below Poverty Among Married-Couple vs Single-Parent Households in Mount Carmel
| Children | Married-Couple Families | Single-Parent Households |
| No Children | 0 (0.0%) | 0 (0.0%) |
| 1 or 2 Children | 0 (0.0%) | 0 (0.0%) |
| 3 or 4 Children | 0 (0.0%) | 0 (0.0%) |
| 5 or more Children | 0 (0.0%) | 0 (0.0%) |
| Total | 0 (0.0%) | 0 (0.0%) |
Race in Mount Carmel
The most populous races in Mount Carmel are White / Caucasian (29 | 93.5%), and Black / African American (2 | 6.5%).

| Race | # Population | % Population |
| Asian | 0 | 0.0% |
| Black / African American | 2 | 6.5% |
| Hawaiian / Pacific | 0 | 0.0% |
| Hispanic or Latino | 0 | 0.0% |
| Native / Alaskan | 0 | 0.0% |
| White / Caucasian | 29 | 93.5% |
| Two or more Races | 0 | 0.0% |
| Some other Race | 0 | 0.0% |
| Total | 31 | 100.0% |
Ancestry in Mount Carmel
The most populous ancestries reported in Mount Carmel are English (10 | 32.3%), German (8 | 25.8%), Irish (5 | 16.1%), French (2 | 6.5%), and Scottish (2 | 6.5%), together accounting for 87.1% of all Mount Carmel residents.
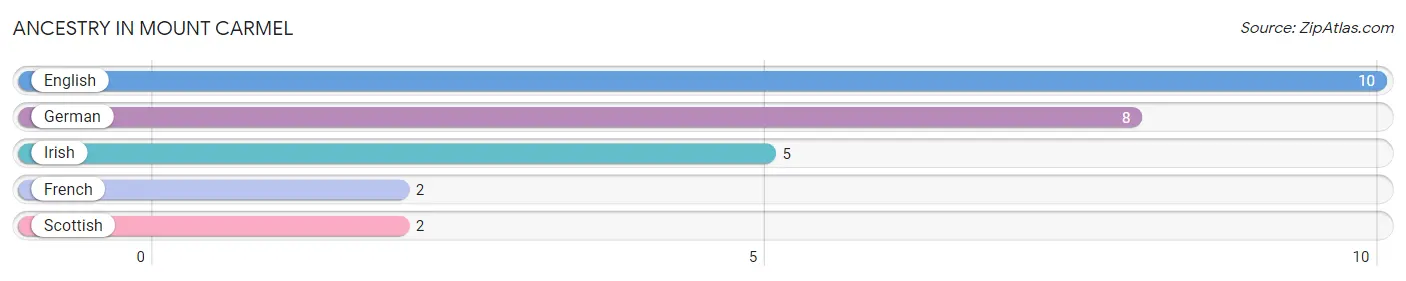
| Ancestry | # Population | % Population |
| English | 10 | 32.3% |
| French | 2 | 6.5% |
| German | 8 | 25.8% |
| Irish | 5 | 16.1% |
| Scottish | 2 | 6.5% | View All 5 Rows |
Immigrants in Mount Carmel
The most numerous immigrant groups reported in Mount Carmel came from Eastern Europe (1 | 3.2%), Europe (1 | 3.2%), and Russia (1 | 3.2%), together accounting for 9.7% of all Mount Carmel residents.
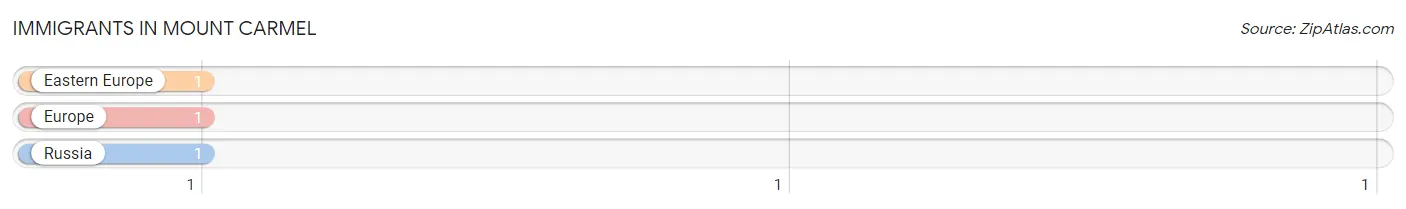
| Immigration Origin | # Population | % Population |
| Eastern Europe | 1 | 3.2% |
| Europe | 1 | 3.2% |
| Russia | 1 | 3.2% | View All 3 Rows |
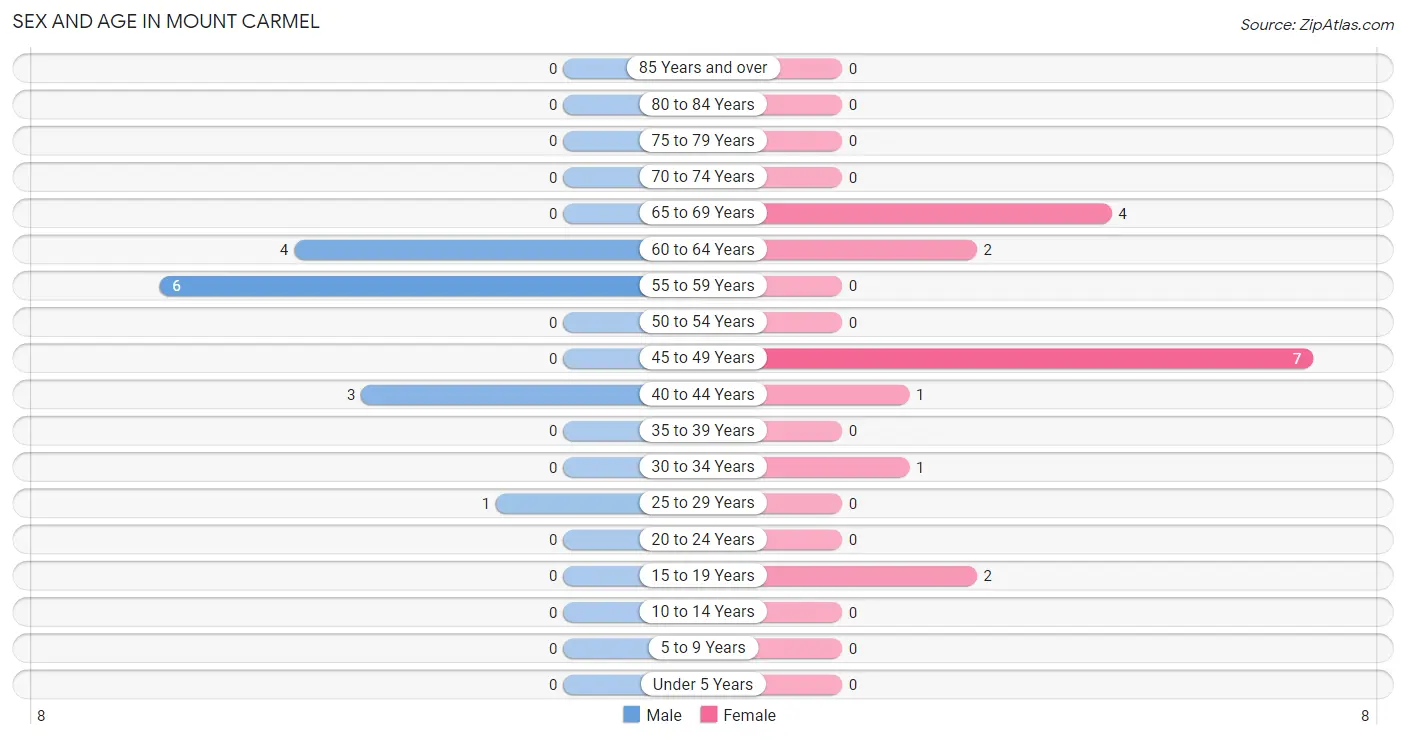
Sex and Age in Mount Carmel
Sex and Age in Mount Carmel
The most populous age groups in Mount Carmel are 55 to 59 Years (6 | 42.9%) for men and 45 to 49 Years (7 | 41.2%) for women.
| Age Bracket | Male | Female |
| Under 5 Years | 0 (0.0%) | 0 (0.0%) |
| 5 to 9 Years | 0 (0.0%) | 0 (0.0%) |
| 10 to 14 Years | 0 (0.0%) | 0 (0.0%) |
| 15 to 19 Years | 0 (0.0%) | 2 (11.8%) |
| 20 to 24 Years | 0 (0.0%) | 0 (0.0%) |
| 25 to 29 Years | 1 (7.1%) | 0 (0.0%) |
| 30 to 34 Years | 0 (0.0%) | 1 (5.9%) |
| 35 to 39 Years | 0 (0.0%) | 0 (0.0%) |
| 40 to 44 Years | 3 (21.4%) | 1 (5.9%) |
| 45 to 49 Years | 0 (0.0%) | 7 (41.2%) |
| 50 to 54 Years | 0 (0.0%) | 0 (0.0%) |
| 55 to 59 Years | 6 (42.9%) | 0 (0.0%) |
| 60 to 64 Years | 4 (28.6%) | 2 (11.8%) |
| 65 to 69 Years | 0 (0.0%) | 4 (23.5%) |
| 70 to 74 Years | 0 (0.0%) | 0 (0.0%) |
| 75 to 79 Years | 0 (0.0%) | 0 (0.0%) |
| 80 to 84 Years | 0 (0.0%) | 0 (0.0%) |
| 85 Years and over | 0 (0.0%) | 0 (0.0%) |
| Total | 14 (100.0%) | 17 (100.0%) |
Families and Households in Mount Carmel
Median Family Size in Mount Carmel
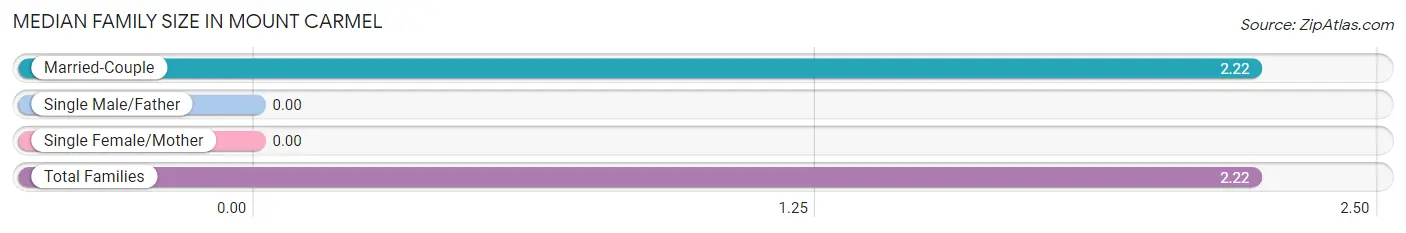
| Family Type | # Families | Family Size |
| Married-Couple | 9 (100.0%) | 2.22 |
| Single Male/Father | 0 (0.0%) | - |
| Single Female/Mother | 0 (0.0%) | - |
| Total Families | 9 (100.0%) | 2.22 |
Median Household Size in Mount Carmel
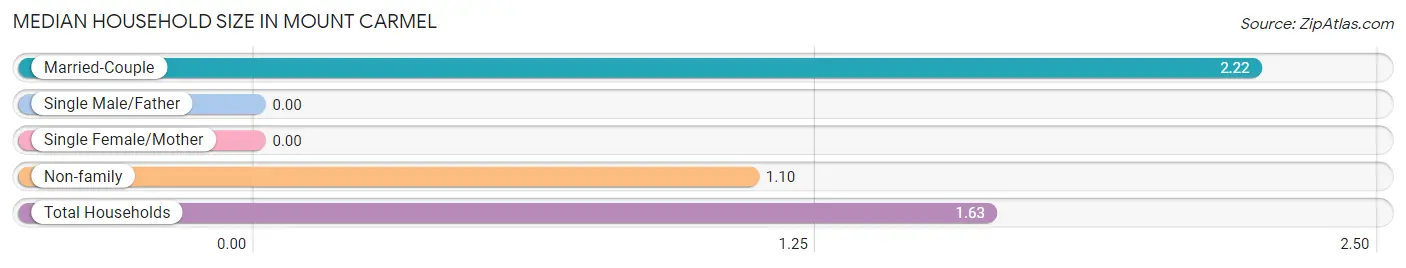
| Household Type | # Households | Household Size |
| Married-Couple | 9 (47.4%) | 2.22 |
| Single Male/Father | 0 (0.0%) | - |
| Single Female/Mother | 0 (0.0%) | - |
| Non-family | 10 (52.6%) | 1.10 |
| Total Households | 19 (100.0%) | 1.63 |
Household Size by Marriage Status in Mount Carmel
Out of a total of 19 households in Mount Carmel, 9 (47.4%) are family households, while 10 (52.6%) are nonfamily households. The most numerous type of family households are 2-person households, comprising 6, and the most common type of nonfamily households are 1-person households, comprising 9.
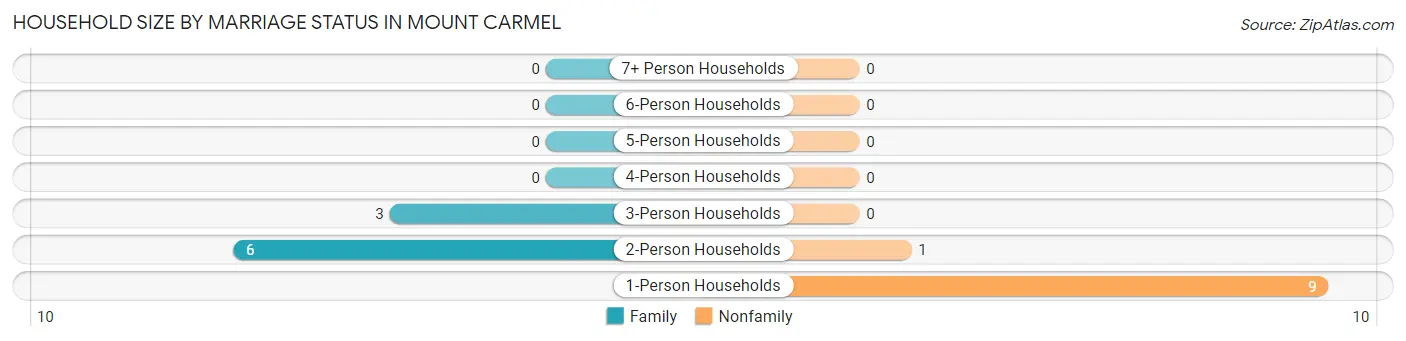
| Household Size | Family Households | Nonfamily Households |
| 1-Person Households | - | 9 (47.4%) |
| 2-Person Households | 6 (31.6%) | 1 (5.3%) |
| 3-Person Households | 3 (15.8%) | 0 (0.0%) |
| 4-Person Households | 0 (0.0%) | 0 (0.0%) |
| 5-Person Households | 0 (0.0%) | 0 (0.0%) |
| 6-Person Households | 0 (0.0%) | 0 (0.0%) |
| 7+ Person Households | 0 (0.0%) | 0 (0.0%) |
| Total | 9 (47.4%) | 10 (52.6%) |
Female Fertility in Mount Carmel
Fertility by Age in Mount Carmel
| Age Bracket | Women with Births | Births / 1,000 Women |
| 15 to 19 years | 0 (0.0%) | 0.0 |
| 20 to 34 years | 0 (0.0%) | 0.0 |
| 35 to 50 years | 0 (0.0%) | 0.0 |
| Total | 0 (0.0%) | 0.0 |
Fertility by Age by Marriage Status in Mount Carmel
| Age Bracket | Married | Unmarried |
| 15 to 19 years | 0 (0.0%) | 0 (0.0%) |
| 20 to 34 years | 0 (0.0%) | 0 (0.0%) |
| 35 to 50 years | 0 (0.0%) | 0 (0.0%) |
| Total | 0 (0.0%) | 0 (0.0%) |
Fertility by Education in Mount Carmel
| Educational Attainment | Women with Births | Births / 1,000 Women |
| Less than High School | 0 (0.0%) | 0.0 |
| High School Diploma | 0 (0.0%) | 0.0 |
| College or Associate's Degree | 0 (0.0%) | 0.0 |
| Bachelor's Degree | 0 (0.0%) | 0.0 |
| Graduate Degree | 0 (0.0%) | 0.0 |
| Total | 0 (0.0%) | 0.0 |
Fertility by Education by Marriage Status in Mount Carmel
| Educational Attainment | Married | Unmarried |
| Less than High School | 0 (0.0%) | 0 (0.0%) |
| High School Diploma | 0 (0.0%) | 0 (0.0%) |
| College or Associate's Degree | 0 (0.0%) | 0 (0.0%) |
| Bachelor's Degree | 0 (0.0%) | 0 (0.0%) |
| Graduate Degree | 0 (0.0%) | 0 (0.0%) |
| Total | 0 (0.0%) | 0 (0.0%) |
Employment Characteristics in Mount Carmel
Employment by Class of Employer in Mount Carmel
Among the 22 employed individuals in Mount Carmel, private company employees (19 | 86.4%), not-for-profit organizations (1 | 4.5%), and local government employees (1 | 4.5%) make up the most common classes of employment.
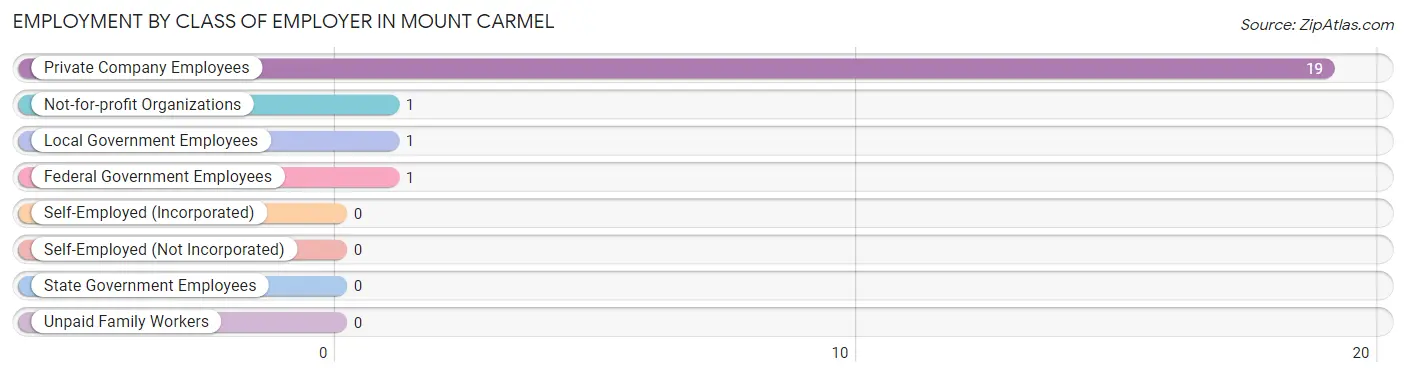
| Employer Class | # Employees | % Employees |
| Private Company Employees | 19 | 86.4% |
| Self-Employed (Incorporated) | 0 | 0.0% |
| Self-Employed (Not Incorporated) | 0 | 0.0% |
| Not-for-profit Organizations | 1 | 4.5% |
| Local Government Employees | 1 | 4.5% |
| State Government Employees | 0 | 0.0% |
| Federal Government Employees | 1 | 4.5% |
| Unpaid Family Workers | 0 | 0.0% |
| Total | 22 | 100.0% |
Employment Status by Age in Mount Carmel
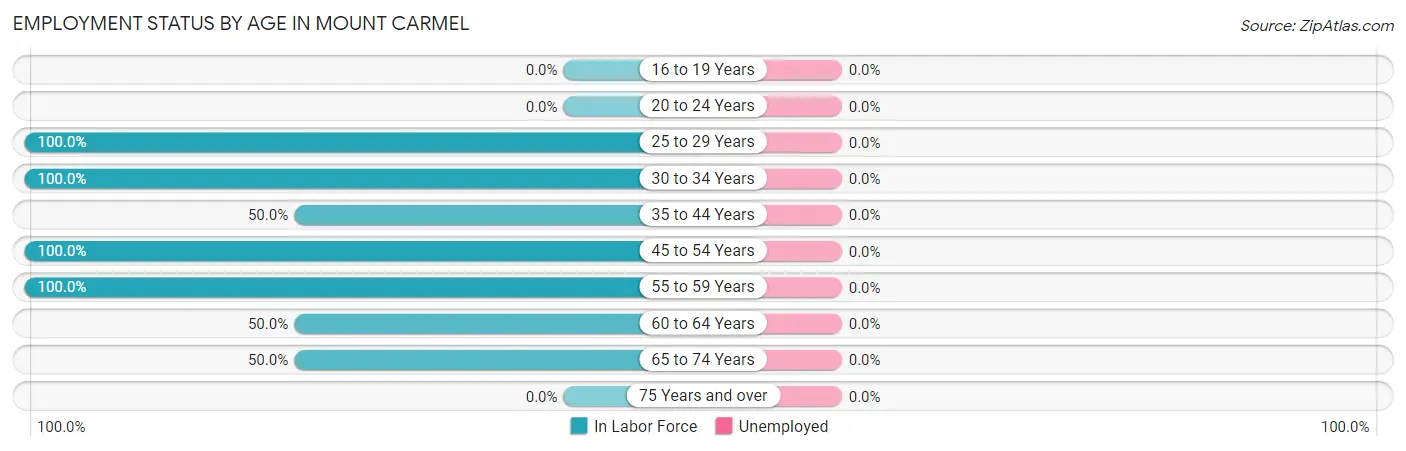
| Age Bracket | In Labor Force | Unemployed |
| 16 to 19 Years | 0 (0.0%) | 0 (0.0%) |
| 20 to 24 Years | 0 (0.0%) | 0 (0.0%) |
| 25 to 29 Years | 1 (100.0%) | 0 (0.0%) |
| 30 to 34 Years | 1 (100.0%) | 0 (0.0%) |
| 35 to 44 Years | 2 (50.0%) | 0 (0.0%) |
| 45 to 54 Years | 7 (100.0%) | 0 (0.0%) |
| 55 to 59 Years | 6 (100.0%) | 0 (0.0%) |
| 60 to 64 Years | 3 (50.0%) | 0 (0.0%) |
| 65 to 74 Years | 2 (50.0%) | 0 (0.0%) |
| 75 Years and over | 0 (0.0%) | 0 (0.0%) |
| Total | 22 (71.0%) | 0 (0.0%) |
Employment Status by Educational Attainment in Mount Carmel
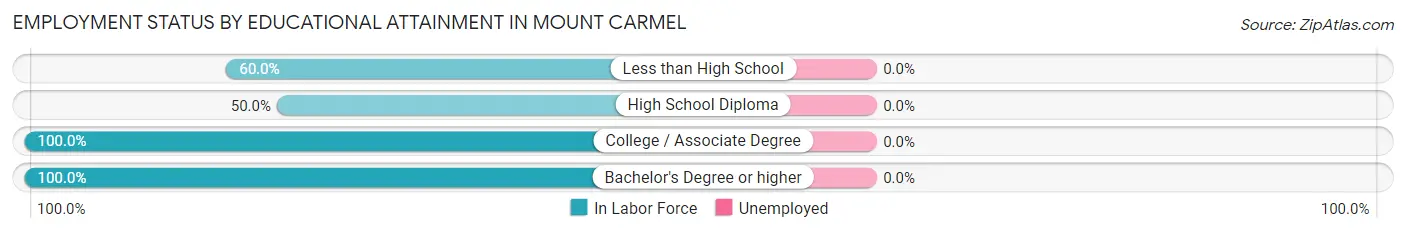
| Educational Attainment | In Labor Force | Unemployed |
| Less than High School | 3 (60.0%) | 0 (0.0%) |
| High School Diploma | 3 (50.0%) | 0 (0.0%) |
| College / Associate Degree | 2 (100.0%) | 0 (0.0%) |
| Bachelor's Degree or higher | 12 (100.0%) | 0 (0.0%) |
| Total | 20 (80.0%) | 0 (0.0%) |
Employment Occupations by Sex in Mount Carmel
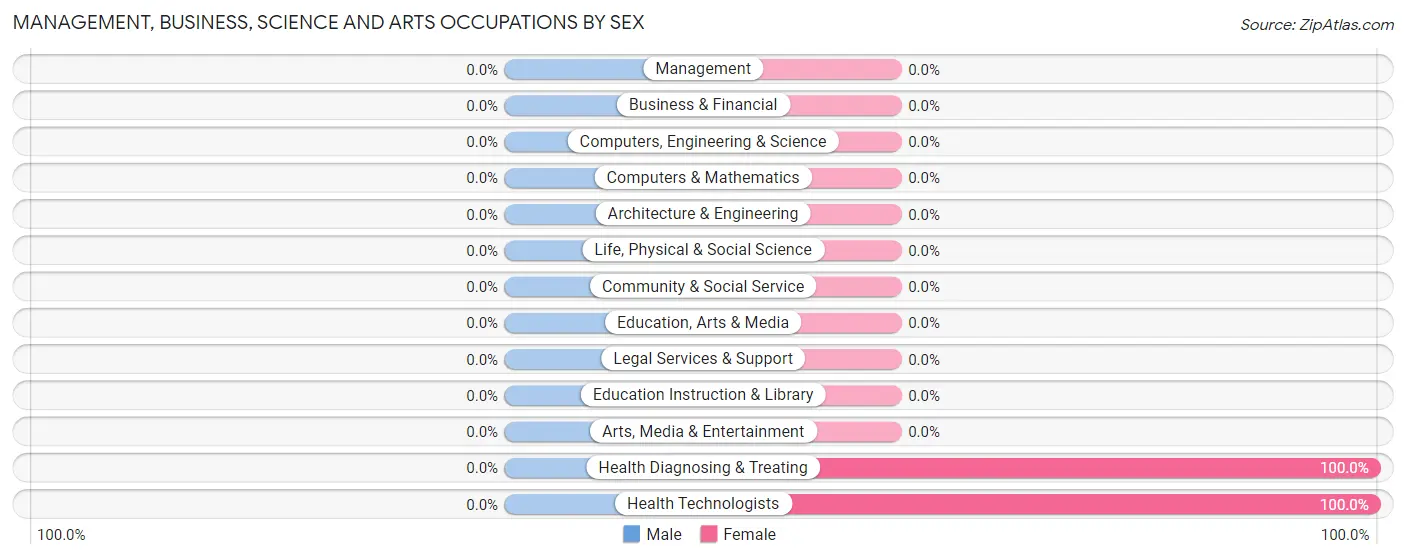
Management, Business, Science and Arts Occupations
The most common Management, Business, Science and Arts occupations in Mount Carmel are Health Diagnosing & Treating (1 | 4.5%), and Health Technologists (1 | 4.5%).
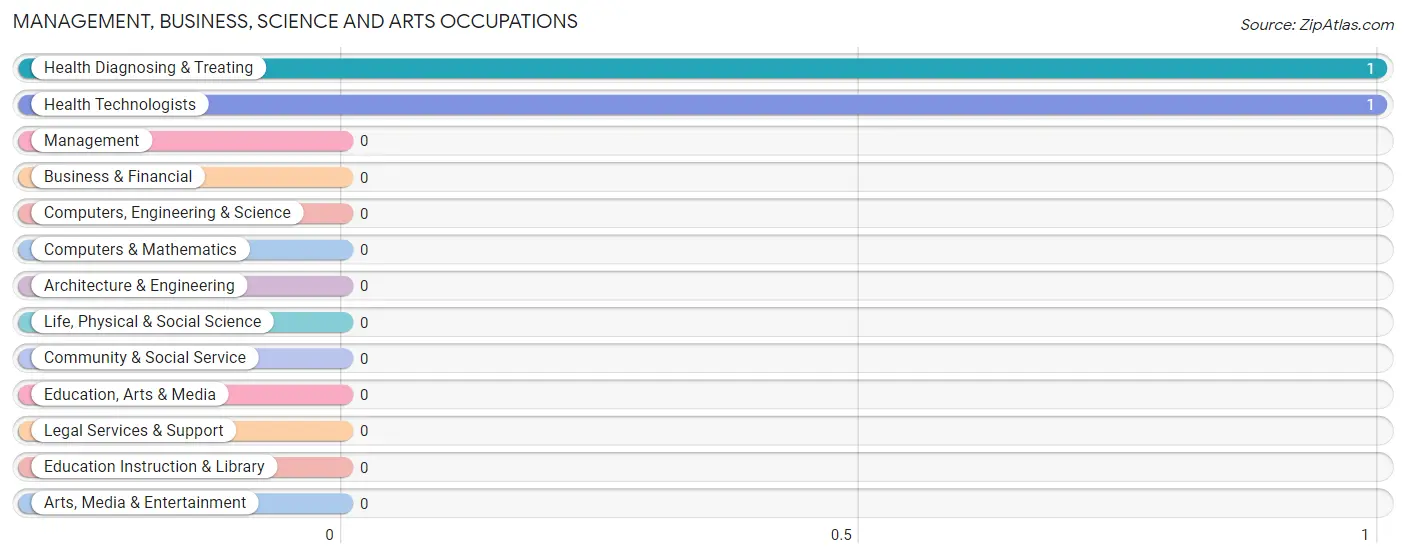
Management, Business, Science and Arts Occupations by Sex
| Occupation | Male | Female |
| Management | 0 (0.0%) | 0 (0.0%) |
| Business & Financial | 0 (0.0%) | 0 (0.0%) |
| Computers, Engineering & Science | 0 (0.0%) | 0 (0.0%) |
| Computers & Mathematics | 0 (0.0%) | 0 (0.0%) |
| Architecture & Engineering | 0 (0.0%) | 0 (0.0%) |
| Life, Physical & Social Science | 0 (0.0%) | 0 (0.0%) |
| Community & Social Service | 0 (0.0%) | 0 (0.0%) |
| Education, Arts & Media | 0 (0.0%) | 0 (0.0%) |
| Legal Services & Support | 0 (0.0%) | 0 (0.0%) |
| Education Instruction & Library | 0 (0.0%) | 0 (0.0%) |
| Arts, Media & Entertainment | 0 (0.0%) | 0 (0.0%) |
| Health Diagnosing & Treating | 0 (0.0%) | 1 (100.0%) |
| Health Technologists | 0 (0.0%) | 1 (100.0%) |
| Total (Category) | 0 (0.0%) | 1 (100.0%) |
| Total (Overall) | 11 (50.0%) | 11 (50.0%) |
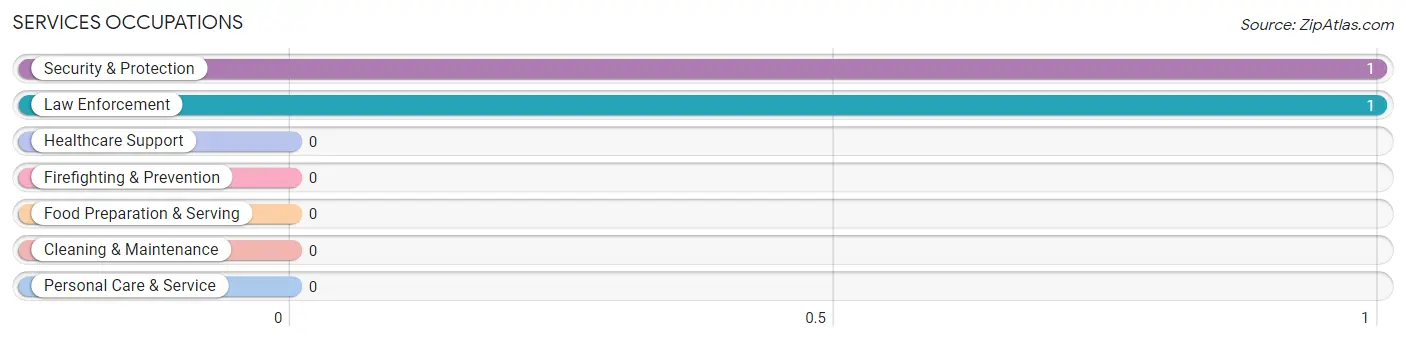
Services Occupations
The most common Services occupations in Mount Carmel are Security & Protection (1 | 4.5%), and Law Enforcement (1 | 4.5%).
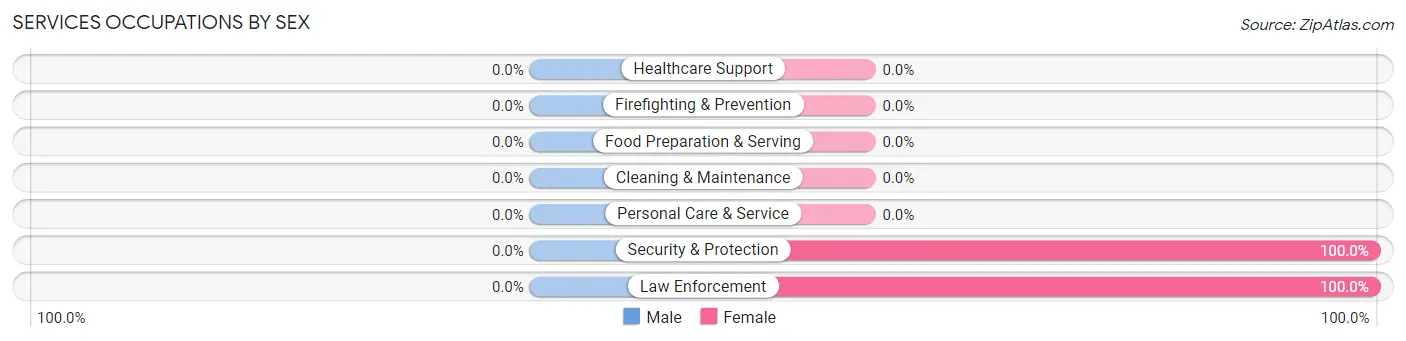
Services Occupations by Sex
| Occupation | Male | Female |
| Healthcare Support | 0 (0.0%) | 0 (0.0%) |
| Security & Protection | 0 (0.0%) | 1 (100.0%) |
| Firefighting & Prevention | 0 (0.0%) | 0 (0.0%) |
| Law Enforcement | 0 (0.0%) | 1 (100.0%) |
| Food Preparation & Serving | 0 (0.0%) | 0 (0.0%) |
| Cleaning & Maintenance | 0 (0.0%) | 0 (0.0%) |
| Personal Care & Service | 0 (0.0%) | 0 (0.0%) |
| Total (Category) | 0 (0.0%) | 1 (100.0%) |
| Total (Overall) | 11 (50.0%) | 11 (50.0%) |
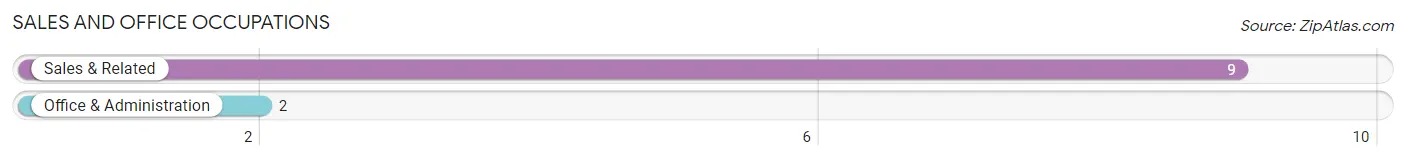
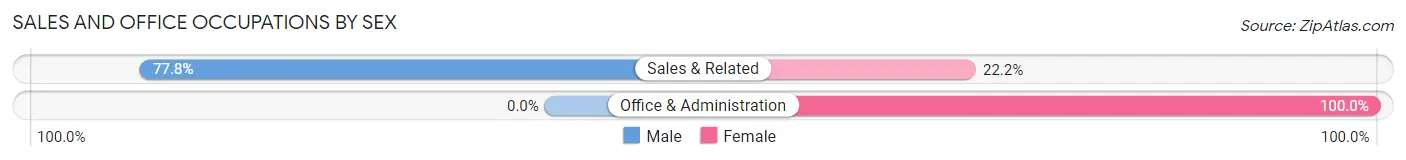
Sales and Office Occupations
The most common Sales and Office occupations in Mount Carmel are Sales & Related (9 | 40.9%), and Office & Administration (2 | 9.1%).
Sales and Office Occupations by Sex
| Occupation | Male | Female |
| Sales & Related | 7 (77.8%) | 2 (22.2%) |
| Office & Administration | 0 (0.0%) | 2 (100.0%) |
| Total (Category) | 7 (63.6%) | 4 (36.4%) |
| Total (Overall) | 11 (50.0%) | 11 (50.0%) |
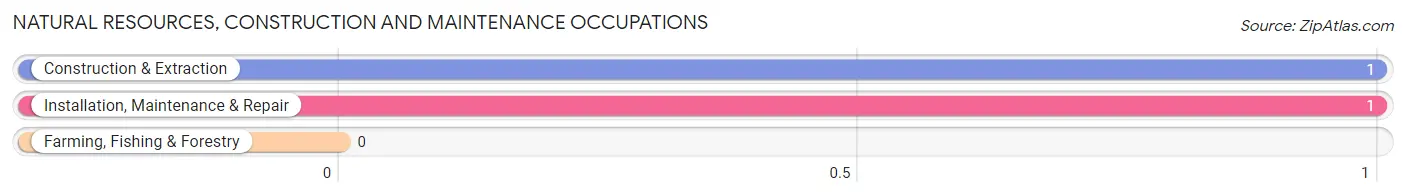
Natural Resources, Construction and Maintenance Occupations
The most common Natural Resources, Construction and Maintenance occupations in Mount Carmel are Construction & Extraction (1 | 4.5%), and Installation, Maintenance & Repair (1 | 4.5%).
Natural Resources, Construction and Maintenance Occupations by Sex
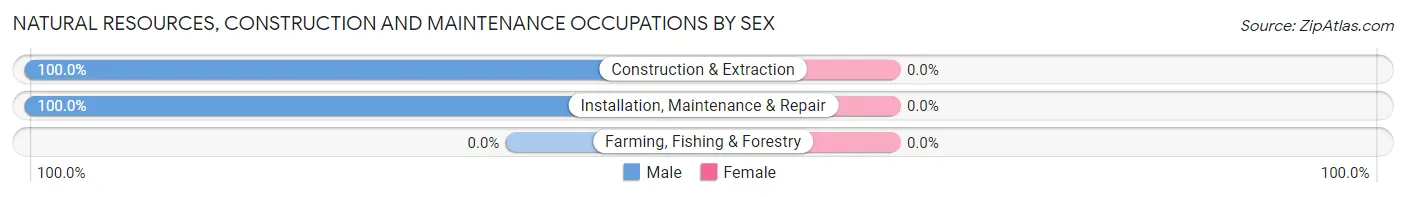
| Occupation | Male | Female |
| Farming, Fishing & Forestry | 0 (0.0%) | 0 (0.0%) |
| Construction & Extraction | 1 (100.0%) | 0 (0.0%) |
| Installation, Maintenance & Repair | 1 (100.0%) | 0 (0.0%) |
| Total (Category) | 2 (100.0%) | 0 (0.0%) |
| Total (Overall) | 11 (50.0%) | 11 (50.0%) |
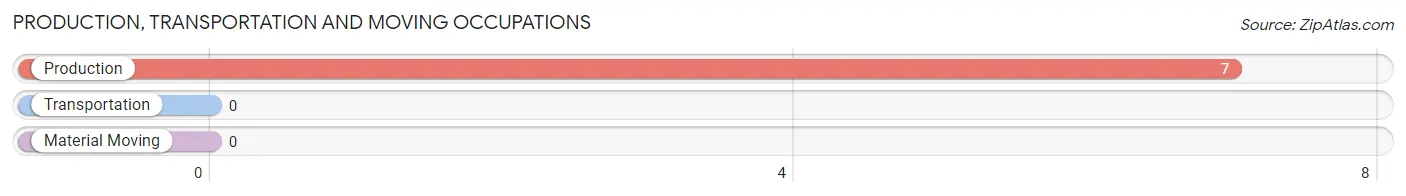
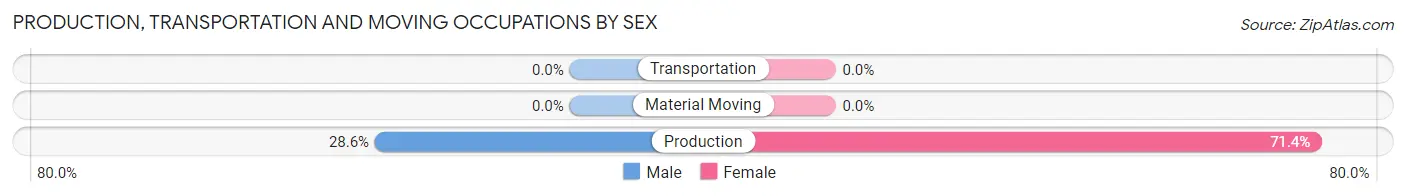
Production, Transportation and Moving Occupations
The most common Production, Transportation and Moving occupations in Mount Carmel are , and Production (7 | 31.8%).
Production, Transportation and Moving Occupations by Sex
| Occupation | Male | Female |
| Production | 2 (28.6%) | 5 (71.4%) |
| Transportation | 0 (0.0%) | 0 (0.0%) |
| Material Moving | 0 (0.0%) | 0 (0.0%) |
| Total (Category) | 2 (28.6%) | 5 (71.4%) |
| Total (Overall) | 11 (50.0%) | 11 (50.0%) |
Employment Industries by Sex in Mount Carmel
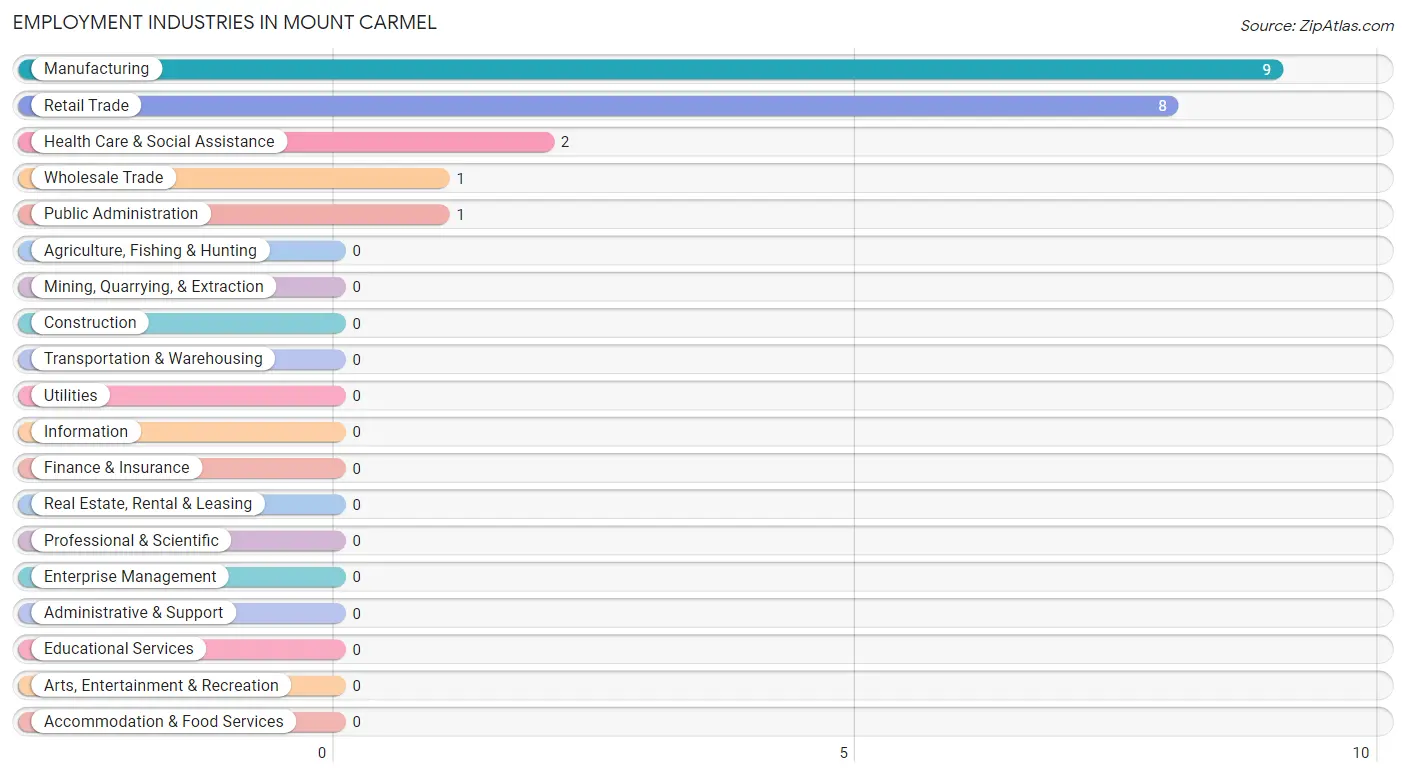
Employment Industries in Mount Carmel
The major employment industries in Mount Carmel include Manufacturing (9 | 40.9%), Retail Trade (8 | 36.4%), Health Care & Social Assistance (2 | 9.1%), Wholesale Trade (1 | 4.5%), and Public Administration (1 | 4.5%).
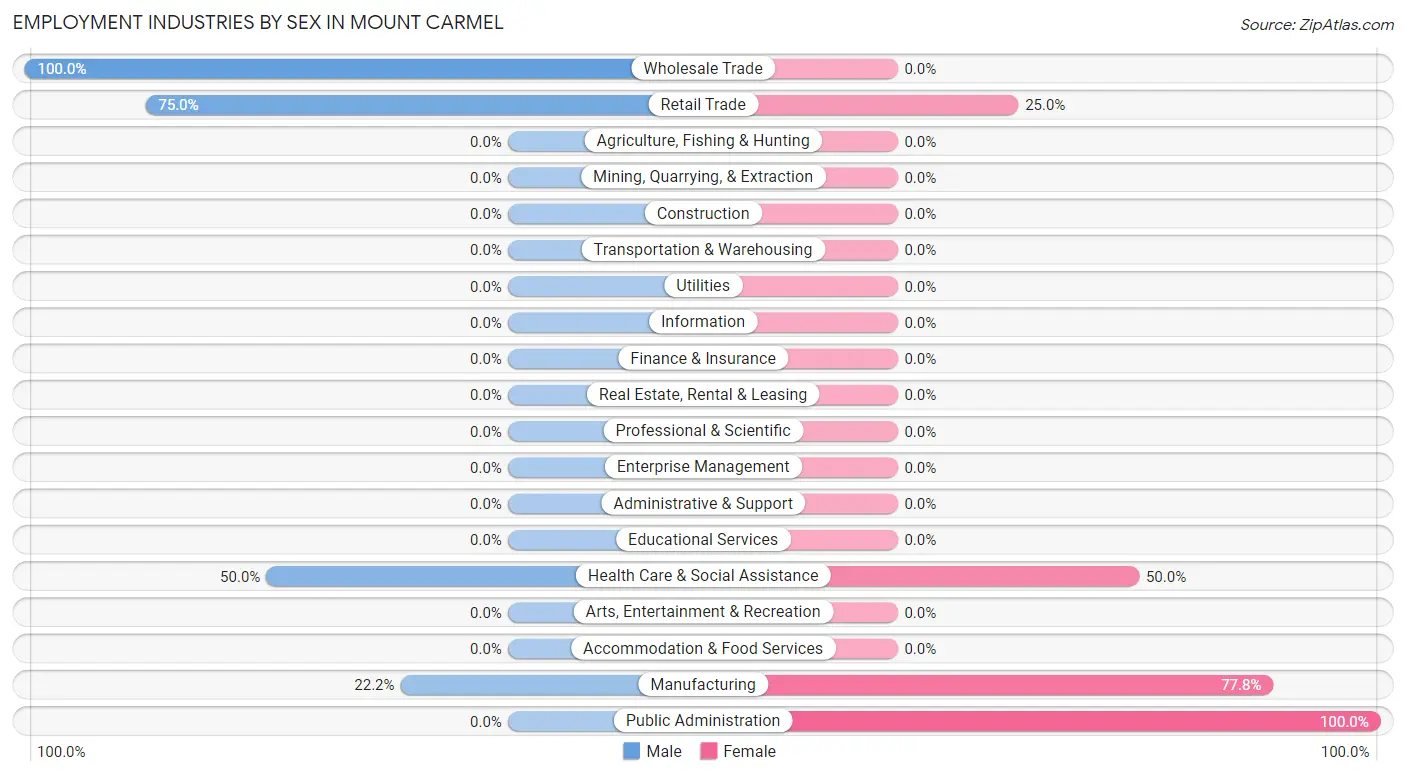
Employment Industries by Sex in Mount Carmel
The Mount Carmel industries that see more men than women are Wholesale Trade (100.0%), Retail Trade (75.0%), and Health Care & Social Assistance (50.0%), whereas the industries that tend to have a higher number of women are Public Administration (100.0%), Manufacturing (77.8%), and Health Care & Social Assistance (50.0%).
| Industry | Male | Female |
| Agriculture, Fishing & Hunting | 0 (0.0%) | 0 (0.0%) |
| Mining, Quarrying, & Extraction | 0 (0.0%) | 0 (0.0%) |
| Construction | 0 (0.0%) | 0 (0.0%) |
| Manufacturing | 2 (22.2%) | 7 (77.8%) |
| Wholesale Trade | 1 (100.0%) | 0 (0.0%) |
| Retail Trade | 6 (75.0%) | 2 (25.0%) |
| Transportation & Warehousing | 0 (0.0%) | 0 (0.0%) |
| Utilities | 0 (0.0%) | 0 (0.0%) |
| Information | 0 (0.0%) | 0 (0.0%) |
| Finance & Insurance | 0 (0.0%) | 0 (0.0%) |
| Real Estate, Rental & Leasing | 0 (0.0%) | 0 (0.0%) |
| Professional & Scientific | 0 (0.0%) | 0 (0.0%) |
| Enterprise Management | 0 (0.0%) | 0 (0.0%) |
| Administrative & Support | 0 (0.0%) | 0 (0.0%) |
| Educational Services | 0 (0.0%) | 0 (0.0%) |
| Health Care & Social Assistance | 1 (50.0%) | 1 (50.0%) |
| Arts, Entertainment & Recreation | 0 (0.0%) | 0 (0.0%) |
| Accommodation & Food Services | 0 (0.0%) | 0 (0.0%) |
| Public Administration | 0 (0.0%) | 1 (100.0%) |
| Total | 11 (50.0%) | 11 (50.0%) |
Education in Mount Carmel
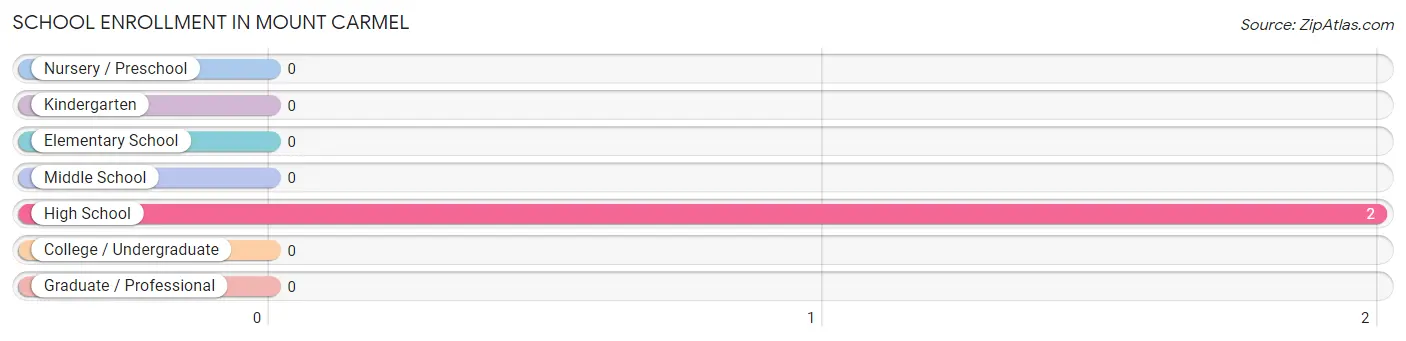
School Enrollment in Mount Carmel
| School Level | # Students | % Students |
| Nursery / Preschool | 0 | 0.0% |
| Kindergarten | 0 | 0.0% |
| Elementary School | 0 | 0.0% |
| Middle School | 0 | 0.0% |
| High School | 2 | 100.0% |
| College / Undergraduate | 0 | 0.0% |
| Graduate / Professional | 0 | 0.0% |
| Total | 2 | 100.0% |
School Enrollment by Age by Funding Source in Mount Carmel
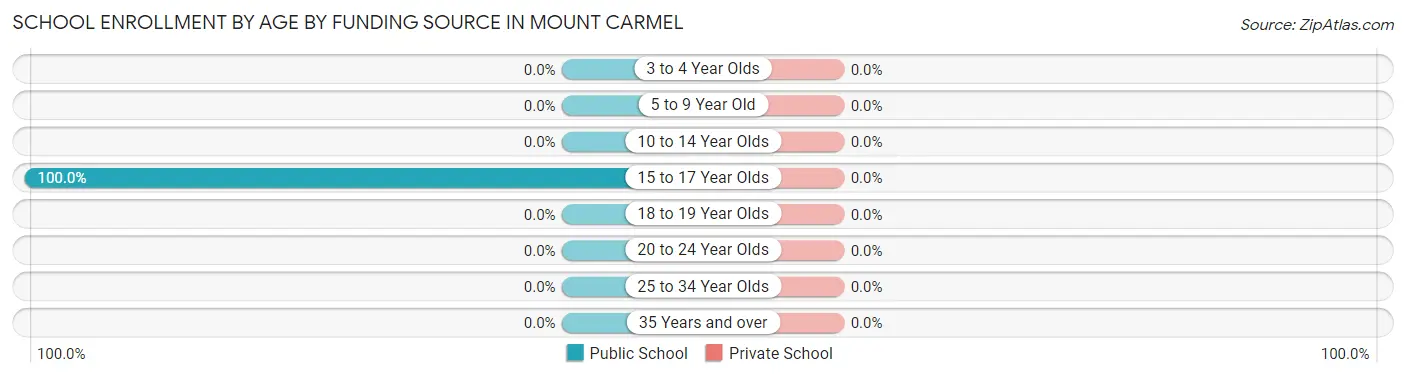
| Age Bracket | Public School | Private School |
| 3 to 4 Year Olds | 0 (0.0%) | 0 (0.0%) |
| 5 to 9 Year Old | 0 (0.0%) | 0 (0.0%) |
| 10 to 14 Year Olds | 0 (0.0%) | 0 (0.0%) |
| 15 to 17 Year Olds | 2 (100.0%) | 0 (0.0%) |
| 18 to 19 Year Olds | 0 (0.0%) | 0 (0.0%) |
| 20 to 24 Year Olds | 0 (0.0%) | 0 (0.0%) |
| 25 to 34 Year Olds | 0 (0.0%) | 0 (0.0%) |
| 35 Years and over | 0 (0.0%) | 0 (0.0%) |
| Total | 2 (100.0%) | 0 (0.0%) |
Educational Attainment by Field of Study in Mount Carmel
Physical & health sciences (6 | 46.2%), social sciences (5 | 38.5%), science & technology (1 | 7.7%), and education (1 | 7.7%) are the most common fields of study among 13 individuals in Mount Carmel who have obtained a bachelor's degree or higher.
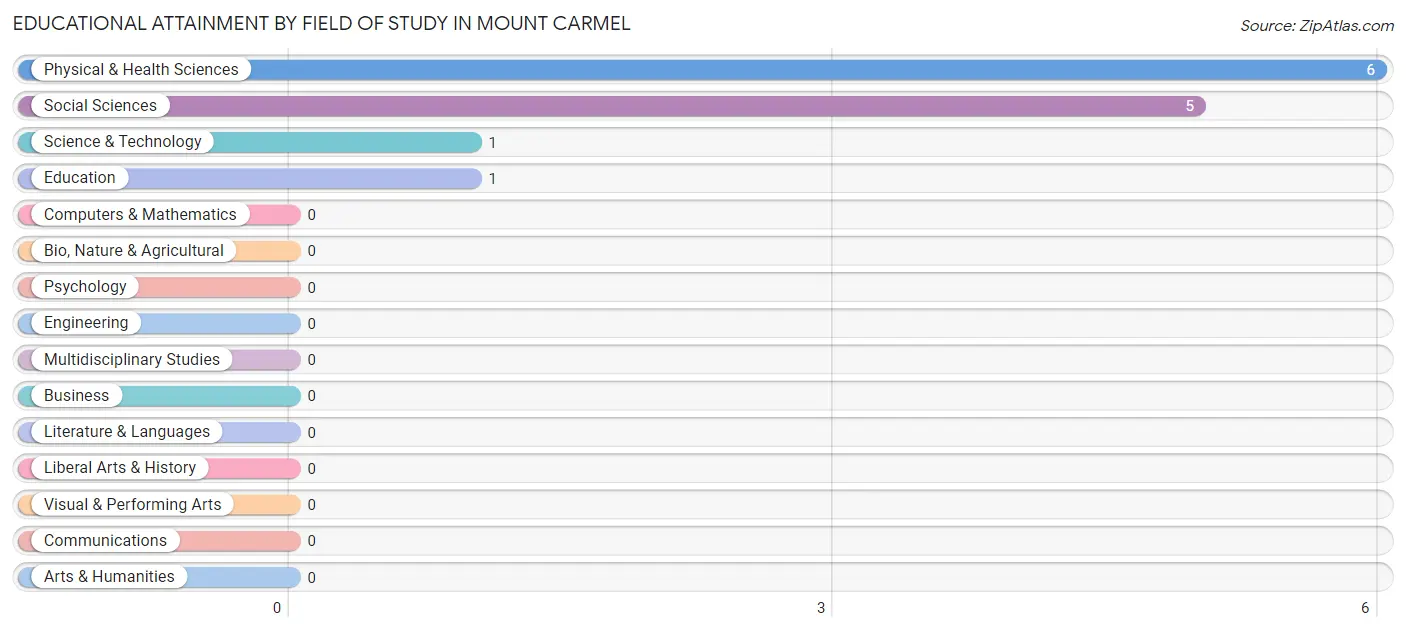
| Field of Study | # Graduates | % Graduates |
| Computers & Mathematics | 0 | 0.0% |
| Bio, Nature & Agricultural | 0 | 0.0% |
| Physical & Health Sciences | 6 | 46.2% |
| Psychology | 0 | 0.0% |
| Social Sciences | 5 | 38.5% |
| Engineering | 0 | 0.0% |
| Multidisciplinary Studies | 0 | 0.0% |
| Science & Technology | 1 | 7.7% |
| Business | 0 | 0.0% |
| Education | 1 | 7.7% |
| Literature & Languages | 0 | 0.0% |
| Liberal Arts & History | 0 | 0.0% |
| Visual & Performing Arts | 0 | 0.0% |
| Communications | 0 | 0.0% |
| Arts & Humanities | 0 | 0.0% |
| Total | 13 | 100.0% |
Transportation & Commute in Mount Carmel
Vehicle Availability by Sex in Mount Carmel
The most prevalent vehicle ownership categories in Mount Carmel are males with 2 vehicles (8, accounting for 72.7%) and females with 2 vehicles (5, making up 72.7%).
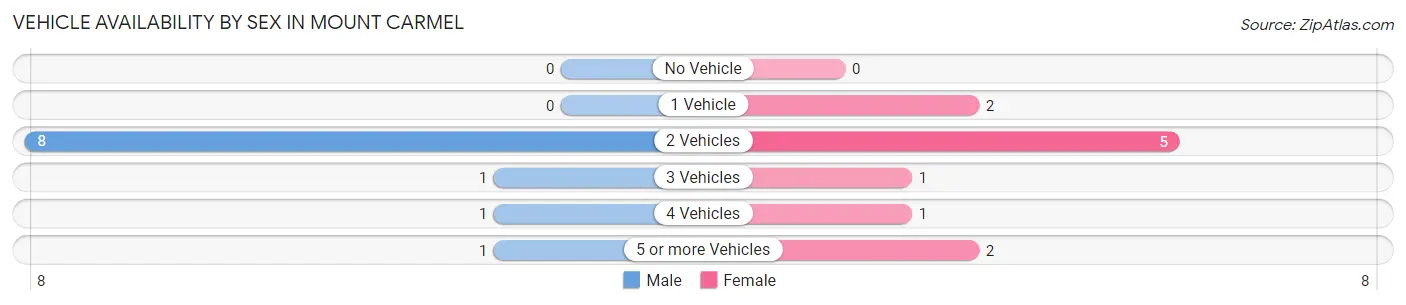
| Vehicles Available | Male | Female |
| No Vehicle | 0 (0.0%) | 0 (0.0%) |
| 1 Vehicle | 0 (0.0%) | 2 (18.2%) |
| 2 Vehicles | 8 (72.7%) | 5 (45.5%) |
| 3 Vehicles | 1 (9.1%) | 1 (9.1%) |
| 4 Vehicles | 1 (9.1%) | 1 (9.1%) |
| 5 or more Vehicles | 1 (9.1%) | 2 (18.2%) |
| Total | 11 (100.0%) | 11 (100.0%) |
Commute Time in Mount Carmel
The most frequently occuring commute durations in Mount Carmel are 20 to 24 minutes (11 commuters, 50.0%), 45 to 59 minutes (3 commuters, 13.6%), and 25 to 29 minutes (2 commuters, 9.1%).
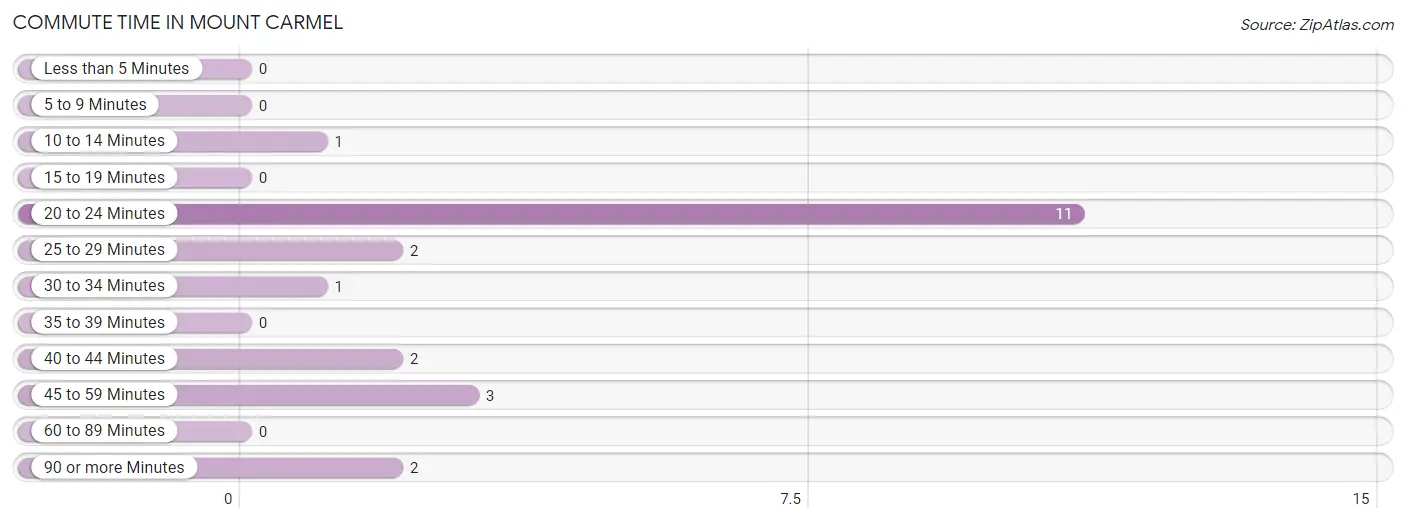
| Commute Time | # Commuters | % Commuters |
| Less than 5 Minutes | 0 | 0.0% |
| 5 to 9 Minutes | 0 | 0.0% |
| 10 to 14 Minutes | 1 | 4.5% |
| 15 to 19 Minutes | 0 | 0.0% |
| 20 to 24 Minutes | 11 | 50.0% |
| 25 to 29 Minutes | 2 | 9.1% |
| 30 to 34 Minutes | 1 | 4.5% |
| 35 to 39 Minutes | 0 | 0.0% |
| 40 to 44 Minutes | 2 | 9.1% |
| 45 to 59 Minutes | 3 | 13.6% |
| 60 to 89 Minutes | 0 | 0.0% |
| 90 or more Minutes | 2 | 9.1% |
Commute Time by Sex in Mount Carmel
The most common commute times in Mount Carmel are 20 to 24 minutes (6 commuters, 54.5%) for males and 20 to 24 minutes (5 commuters, 45.5%) for females.
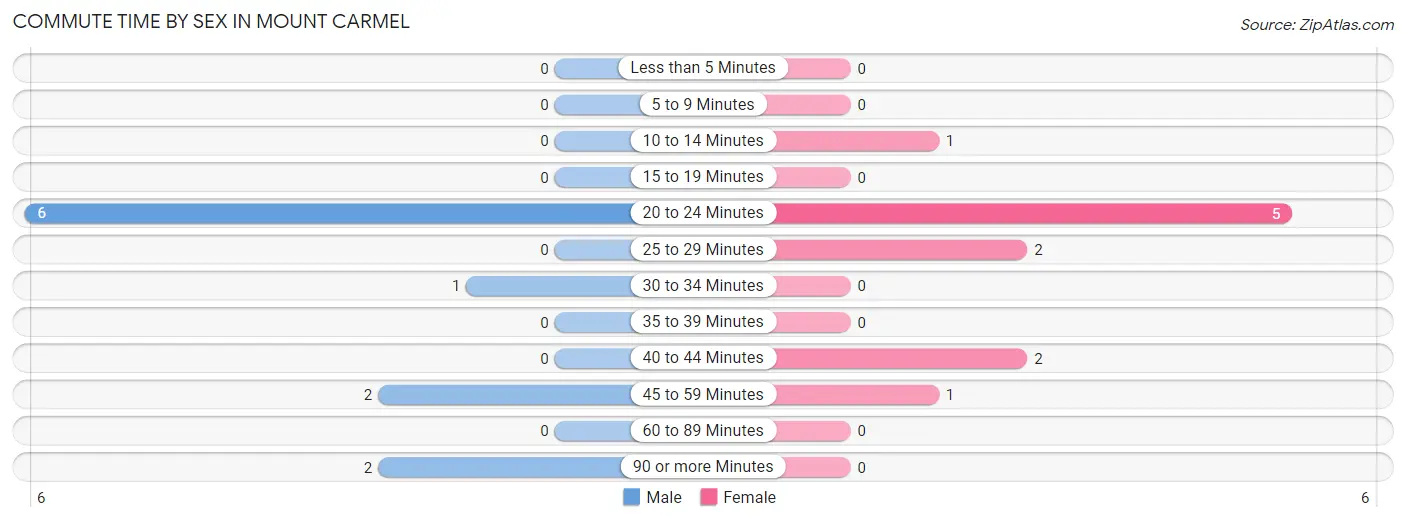
| Commute Time | Male | Female |
| Less than 5 Minutes | 0 (0.0%) | 0 (0.0%) |
| 5 to 9 Minutes | 0 (0.0%) | 0 (0.0%) |
| 10 to 14 Minutes | 0 (0.0%) | 1 (9.1%) |
| 15 to 19 Minutes | 0 (0.0%) | 0 (0.0%) |
| 20 to 24 Minutes | 6 (54.5%) | 5 (45.5%) |
| 25 to 29 Minutes | 0 (0.0%) | 2 (18.2%) |
| 30 to 34 Minutes | 1 (9.1%) | 0 (0.0%) |
| 35 to 39 Minutes | 0 (0.0%) | 0 (0.0%) |
| 40 to 44 Minutes | 0 (0.0%) | 2 (18.2%) |
| 45 to 59 Minutes | 2 (18.2%) | 1 (9.1%) |
| 60 to 89 Minutes | 0 (0.0%) | 0 (0.0%) |
| 90 or more Minutes | 2 (18.2%) | 0 (0.0%) |
Time of Departure to Work by Sex in Mount Carmel
The most frequent times of departure to work in Mount Carmel are 5:00 AM to 5:29 AM (6, 54.5%) for males and 5:00 AM to 5:29 AM (5, 45.5%) for females.
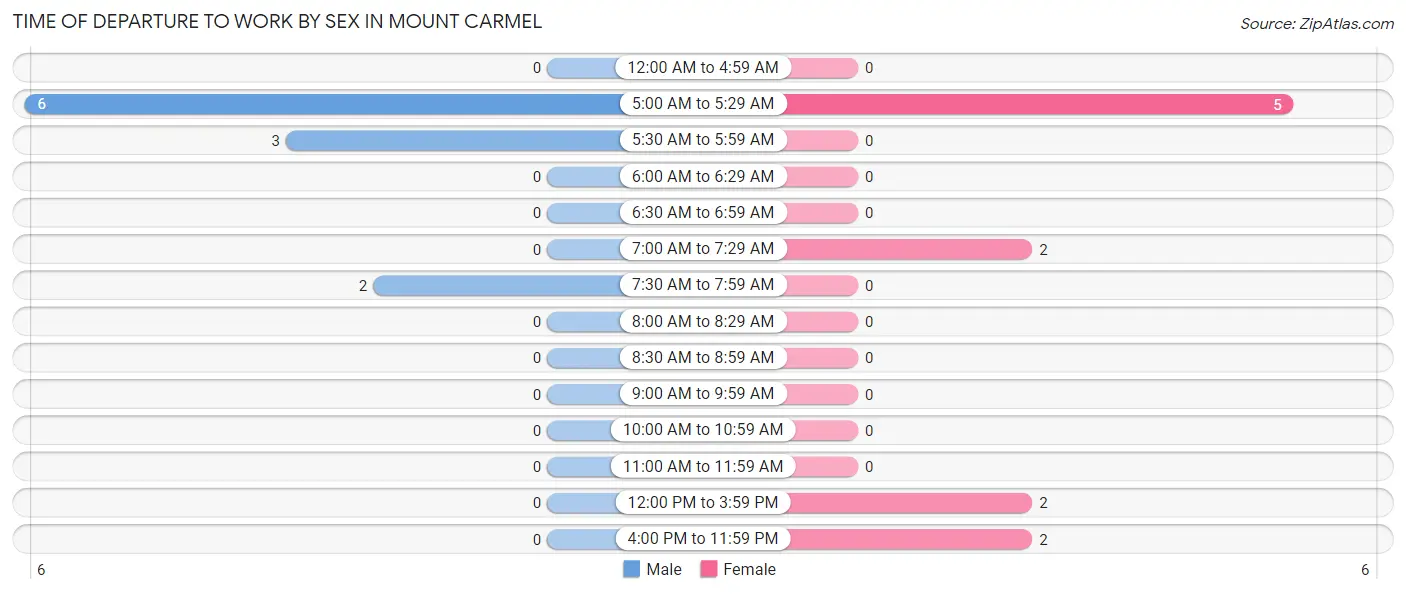
| Time of Departure | Male | Female |
| 12:00 AM to 4:59 AM | 0 (0.0%) | 0 (0.0%) |
| 5:00 AM to 5:29 AM | 6 (54.5%) | 5 (45.5%) |
| 5:30 AM to 5:59 AM | 3 (27.3%) | 0 (0.0%) |
| 6:00 AM to 6:29 AM | 0 (0.0%) | 0 (0.0%) |
| 6:30 AM to 6:59 AM | 0 (0.0%) | 0 (0.0%) |
| 7:00 AM to 7:29 AM | 0 (0.0%) | 2 (18.2%) |
| 7:30 AM to 7:59 AM | 2 (18.2%) | 0 (0.0%) |
| 8:00 AM to 8:29 AM | 0 (0.0%) | 0 (0.0%) |
| 8:30 AM to 8:59 AM | 0 (0.0%) | 0 (0.0%) |
| 9:00 AM to 9:59 AM | 0 (0.0%) | 0 (0.0%) |
| 10:00 AM to 10:59 AM | 0 (0.0%) | 0 (0.0%) |
| 11:00 AM to 11:59 AM | 0 (0.0%) | 0 (0.0%) |
| 12:00 PM to 3:59 PM | 0 (0.0%) | 2 (18.2%) |
| 4:00 PM to 11:59 PM | 0 (0.0%) | 2 (18.2%) |
| Total | 11 (100.0%) | 11 (100.0%) |
Housing Occupancy in Mount Carmel
Occupancy by Ownership in Mount Carmel
Of the total 19 dwellings in Mount Carmel, owner-occupied units account for 8 (42.1%), while renter-occupied units make up 11 (57.9%).
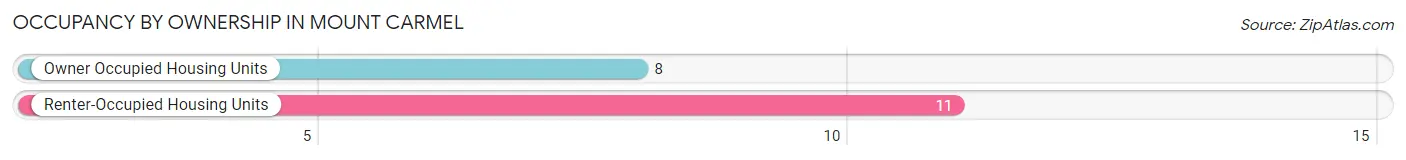
| Occupancy | # Housing Units | % Housing Units |
| Owner Occupied Housing Units | 8 | 42.1% |
| Renter-Occupied Housing Units | 11 | 57.9% |
| Total Occupied Housing Units | 19 | 100.0% |
Occupancy by Household Size in Mount Carmel
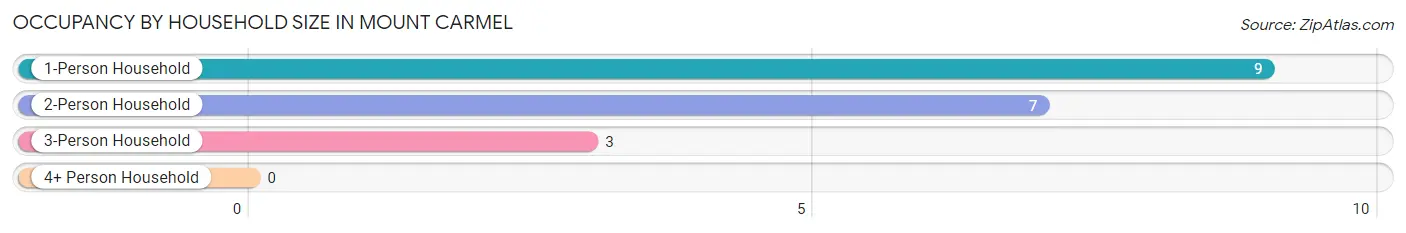
| Household Size | # Housing Units | % Housing Units |
| 1-Person Household | 9 | 47.4% |
| 2-Person Household | 7 | 36.8% |
| 3-Person Household | 3 | 15.8% |
| 4+ Person Household | 0 | 0.0% |
| Total Housing Units | 19 | 100.0% |
Occupancy by Ownership by Household Size in Mount Carmel
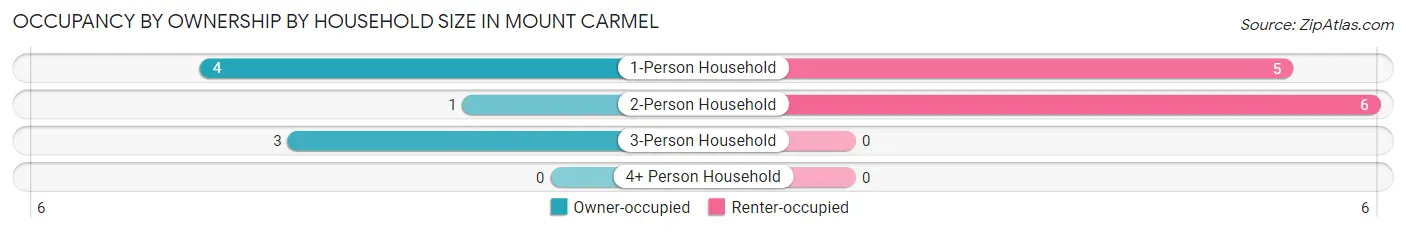
| Household Size | Owner-occupied | Renter-occupied |
| 1-Person Household | 4 (44.4%) | 5 (55.6%) |
| 2-Person Household | 1 (14.3%) | 6 (85.7%) |
| 3-Person Household | 3 (100.0%) | 0 (0.0%) |
| 4+ Person Household | 0 (0.0%) | 0 (0.0%) |
| Total Housing Units | 8 (42.1%) | 11 (57.9%) |
Occupancy by Educational Attainment in Mount Carmel
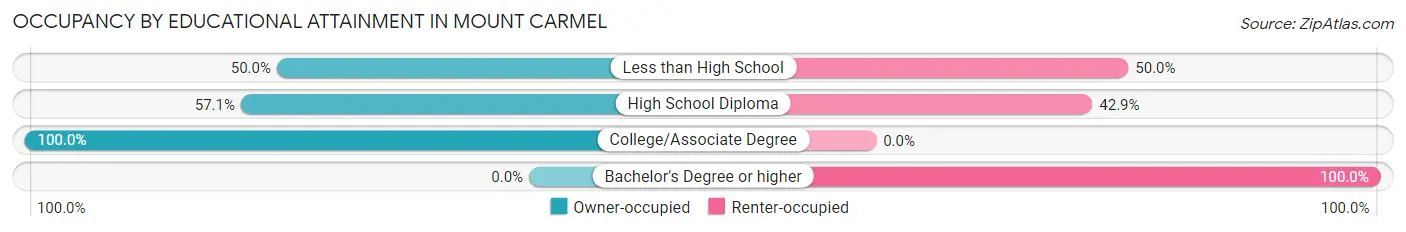
| Household Size | Owner-occupied | Renter-occupied |
| Less than High School | 2 (50.0%) | 2 (50.0%) |
| High School Diploma | 4 (57.1%) | 3 (42.9%) |
| College/Associate Degree | 2 (100.0%) | 0 (0.0%) |
| Bachelor's Degree or higher | 0 (0.0%) | 6 (100.0%) |
Occupancy by Age of Householder in Mount Carmel
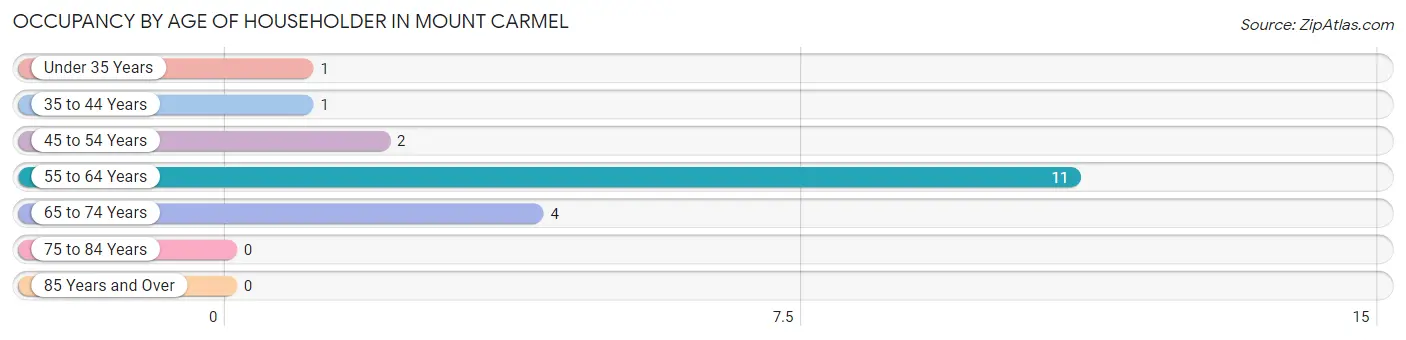
| Age Bracket | # Households | % Households |
| Under 35 Years | 1 | 5.3% |
| 35 to 44 Years | 1 | 5.3% |
| 45 to 54 Years | 2 | 10.5% |
| 55 to 64 Years | 11 | 57.9% |
| 65 to 74 Years | 4 | 21.0% |
| 75 to 84 Years | 0 | 0.0% |
| 85 Years and Over | 0 | 0.0% |
| Total | 19 | 100.0% |
Housing Finances in Mount Carmel
Median Income by Occupancy in Mount Carmel
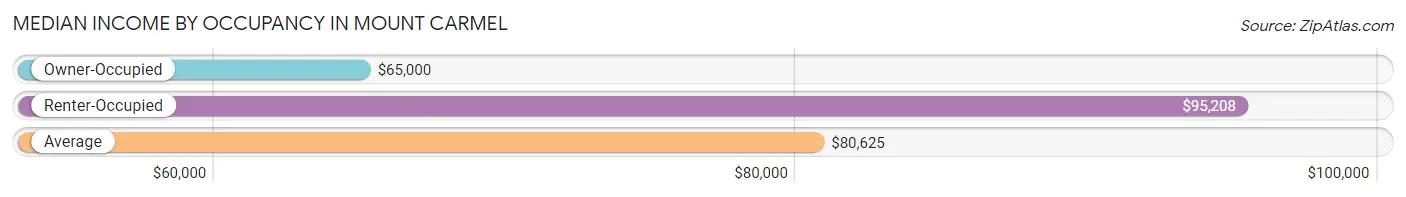
| Occupancy Type | # Households | Median Income |
| Owner-Occupied | 8 (42.1%) | $65,000 |
| Renter-Occupied | 11 (57.9%) | $95,208 |
| Average | 19 (100.0%) | $80,625 |
Occupancy by Householder Income Bracket in Mount Carmel
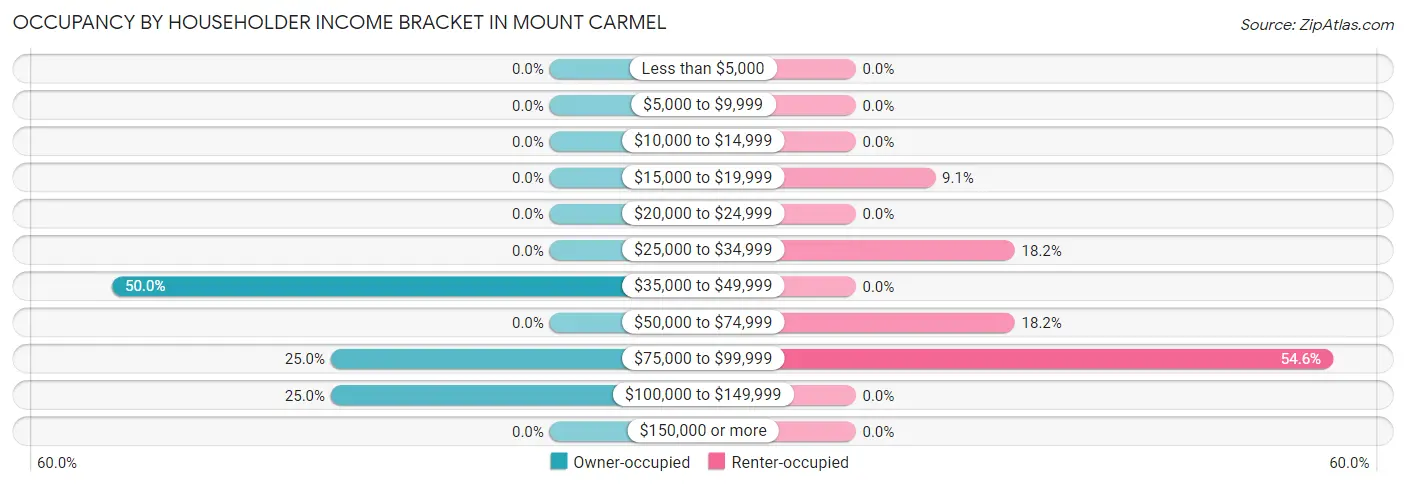
| Income Bracket | Owner-occupied | Renter-occupied |
| Less than $5,000 | 0 (0.0%) | 0 (0.0%) |
| $5,000 to $9,999 | 0 (0.0%) | 0 (0.0%) |
| $10,000 to $14,999 | 0 (0.0%) | 0 (0.0%) |
| $15,000 to $19,999 | 0 (0.0%) | 1 (9.1%) |
| $20,000 to $24,999 | 0 (0.0%) | 0 (0.0%) |
| $25,000 to $34,999 | 0 (0.0%) | 2 (18.2%) |
| $35,000 to $49,999 | 4 (50.0%) | 0 (0.0%) |
| $50,000 to $74,999 | 0 (0.0%) | 2 (18.2%) |
| $75,000 to $99,999 | 2 (25.0%) | 6 (54.5%) |
| $100,000 to $149,999 | 2 (25.0%) | 0 (0.0%) |
| $150,000 or more | 0 (0.0%) | 0 (0.0%) |
| Total | 8 (100.0%) | 11 (100.0%) |
Monthly Housing Cost Tiers in Mount Carmel
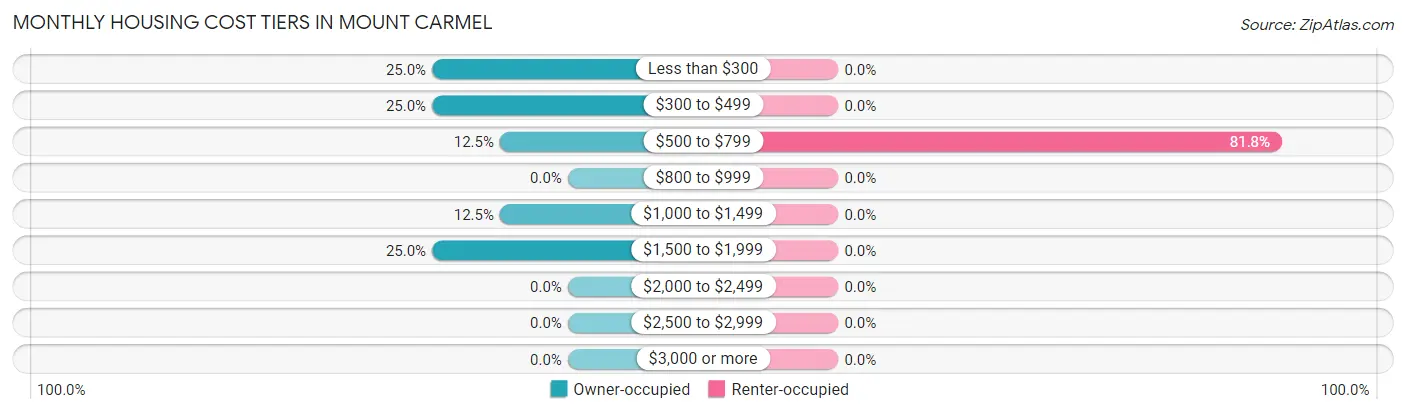
| Monthly Cost | Owner-occupied | Renter-occupied |
| Less than $300 | 2 (25.0%) | 0 (0.0%) |
| $300 to $499 | 2 (25.0%) | 0 (0.0%) |
| $500 to $799 | 1 (12.5%) | 9 (81.8%) |
| $800 to $999 | 0 (0.0%) | 0 (0.0%) |
| $1,000 to $1,499 | 1 (12.5%) | 0 (0.0%) |
| $1,500 to $1,999 | 2 (25.0%) | 0 (0.0%) |
| $2,000 to $2,499 | 0 (0.0%) | 0 (0.0%) |
| $2,500 to $2,999 | 0 (0.0%) | 0 (0.0%) |
| $3,000 or more | 0 (0.0%) | 0 (0.0%) |
| Total | 8 (100.0%) | 11 (100.0%) |
Physical Housing Characteristics in Mount Carmel
Housing Structures in Mount Carmel
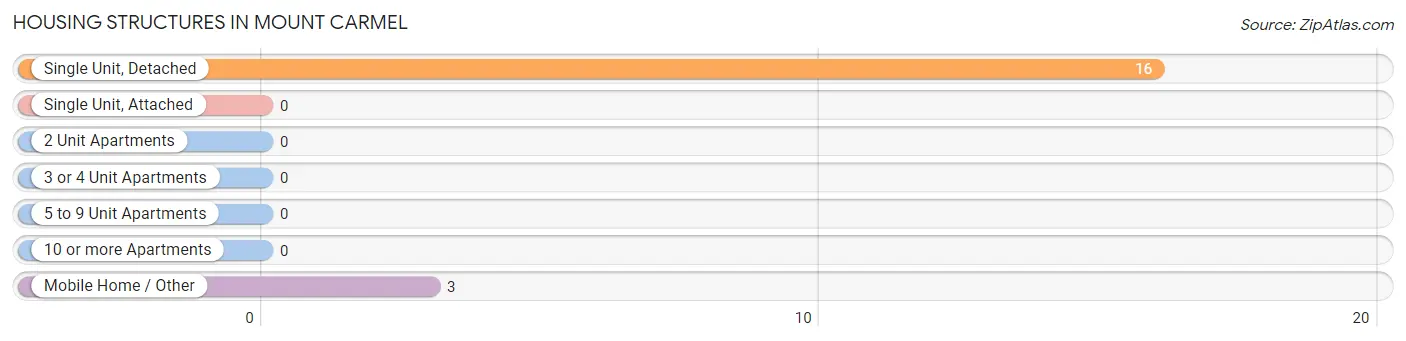
| Structure Type | # Housing Units | % Housing Units |
| Single Unit, Detached | 16 | 84.2% |
| Single Unit, Attached | 0 | 0.0% |
| 2 Unit Apartments | 0 | 0.0% |
| 3 or 4 Unit Apartments | 0 | 0.0% |
| 5 to 9 Unit Apartments | 0 | 0.0% |
| 10 or more Apartments | 0 | 0.0% |
| Mobile Home / Other | 3 | 15.8% |
| Total | 19 | 100.0% |
Housing Structures by Occupancy in Mount Carmel
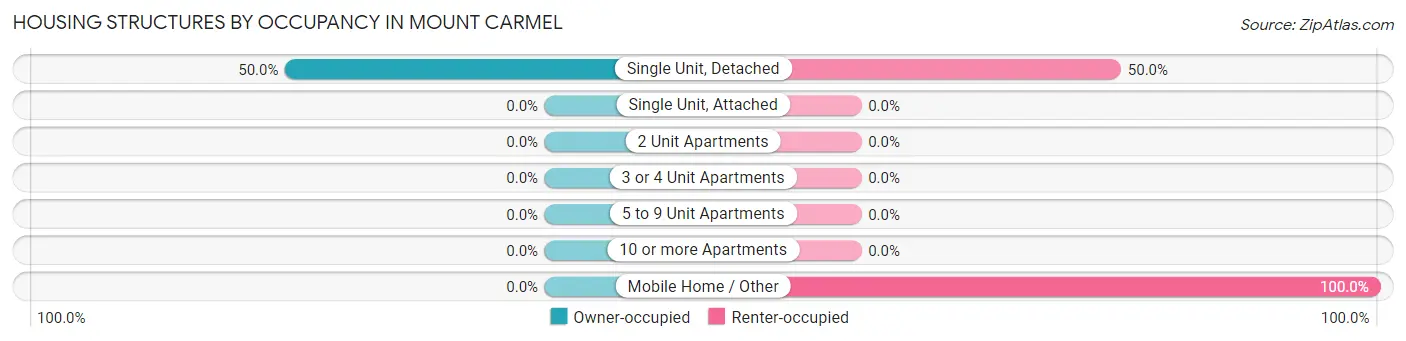
| Structure Type | Owner-occupied | Renter-occupied |
| Single Unit, Detached | 8 (50.0%) | 8 (50.0%) |
| Single Unit, Attached | 0 (0.0%) | 0 (0.0%) |
| 2 Unit Apartments | 0 (0.0%) | 0 (0.0%) |
| 3 or 4 Unit Apartments | 0 (0.0%) | 0 (0.0%) |
| 5 to 9 Unit Apartments | 0 (0.0%) | 0 (0.0%) |
| 10 or more Apartments | 0 (0.0%) | 0 (0.0%) |
| Mobile Home / Other | 0 (0.0%) | 3 (100.0%) |
| Total | 8 (42.1%) | 11 (57.9%) |
Housing Structures by Number of Rooms in Mount Carmel
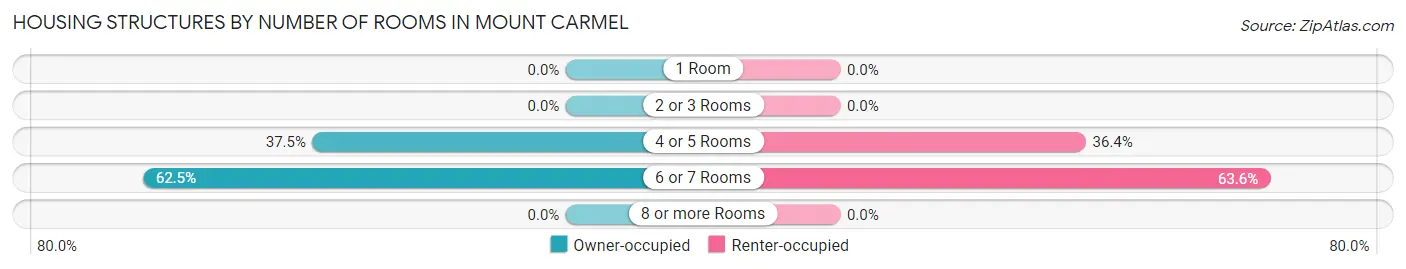
| Number of Rooms | Owner-occupied | Renter-occupied |
| 1 Room | 0 (0.0%) | 0 (0.0%) |
| 2 or 3 Rooms | 0 (0.0%) | 0 (0.0%) |
| 4 or 5 Rooms | 3 (37.5%) | 4 (36.4%) |
| 6 or 7 Rooms | 5 (62.5%) | 7 (63.6%) |
| 8 or more Rooms | 0 (0.0%) | 0 (0.0%) |
| Total | 8 (100.0%) | 11 (100.0%) |
Housing Structure by Heating Type in Mount Carmel
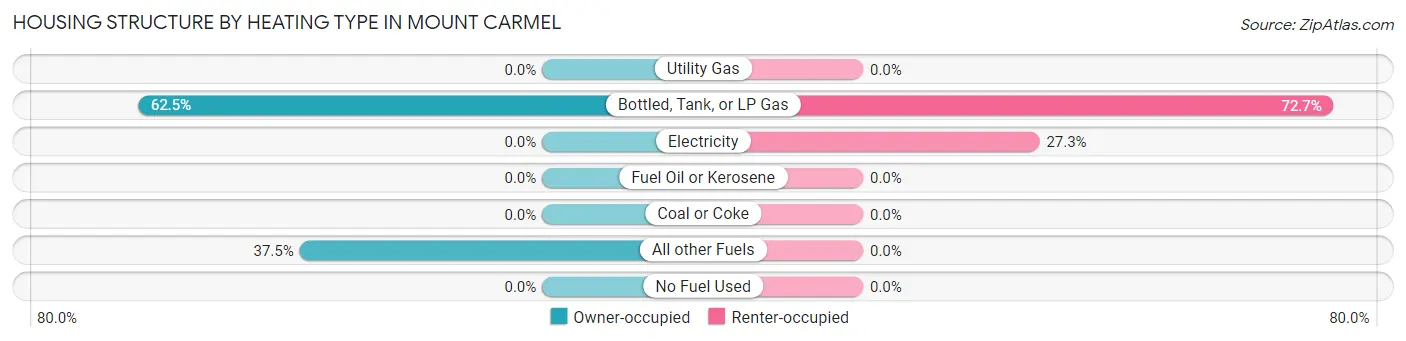
| Heating Type | Owner-occupied | Renter-occupied |
| Utility Gas | 0 (0.0%) | 0 (0.0%) |
| Bottled, Tank, or LP Gas | 5 (62.5%) | 8 (72.7%) |
| Electricity | 0 (0.0%) | 3 (27.3%) |
| Fuel Oil or Kerosene | 0 (0.0%) | 0 (0.0%) |
| Coal or Coke | 0 (0.0%) | 0 (0.0%) |
| All other Fuels | 3 (37.5%) | 0 (0.0%) |
| No Fuel Used | 0 (0.0%) | 0 (0.0%) |
| Total | 8 (100.0%) | 11 (100.0%) |
Household Vehicle Usage in Mount Carmel
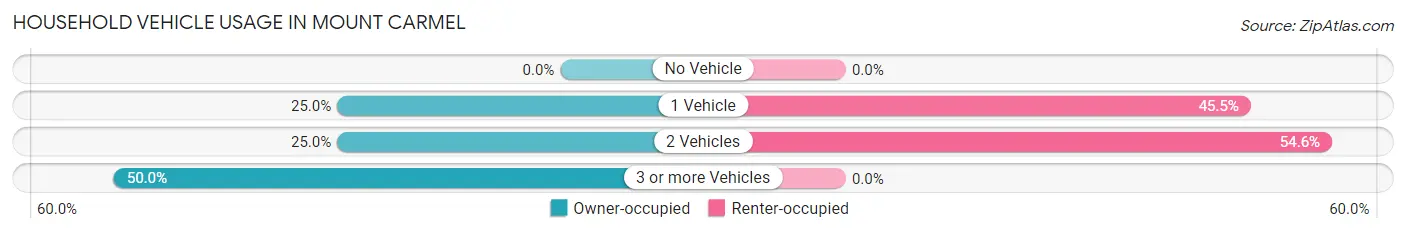
| Vehicles per Household | Owner-occupied | Renter-occupied |
| No Vehicle | 0 (0.0%) | 0 (0.0%) |
| 1 Vehicle | 2 (25.0%) | 5 (45.5%) |
| 2 Vehicles | 2 (25.0%) | 6 (54.5%) |
| 3 or more Vehicles | 4 (50.0%) | 0 (0.0%) |
| Total | 8 (100.0%) | 11 (100.0%) |
Real Estate & Mortgages in Mount Carmel
Real Estate and Mortgage Overview in Mount Carmel
| Characteristic | Without Mortgage | With Mortgage |
| Housing Units | 5 | 3 |
| Median Property Value | - | - |
| Median Household Income | $48,125 | $0 |
| Monthly Housing Costs | - | - |
| Real Estate Taxes | - | - |
Property Value by Mortgage Status in Mount Carmel
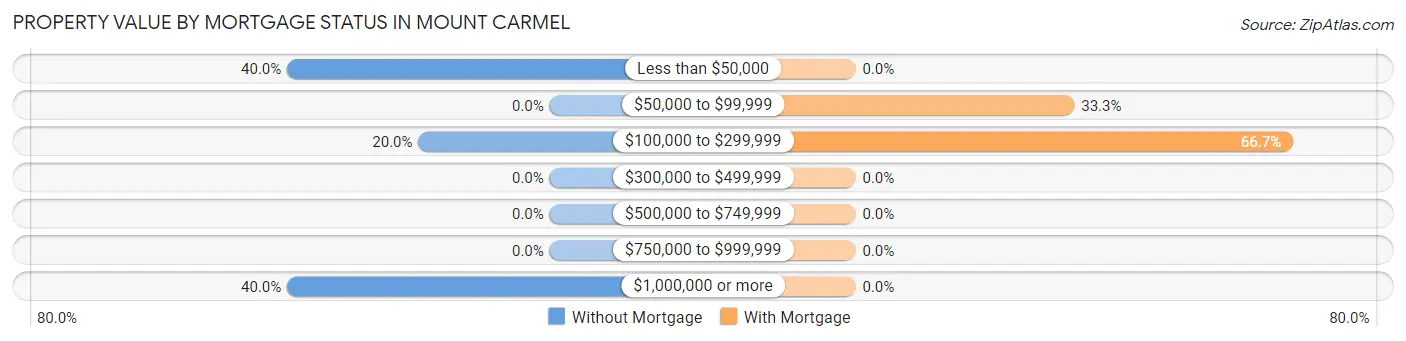
| Property Value | Without Mortgage | With Mortgage |
| Less than $50,000 | 2 (40.0%) | 0 (0.0%) |
| $50,000 to $99,999 | 0 (0.0%) | 1 (33.3%) |
| $100,000 to $299,999 | 1 (20.0%) | 2 (66.7%) |
| $300,000 to $499,999 | 0 (0.0%) | 0 (0.0%) |
| $500,000 to $749,999 | 0 (0.0%) | 0 (0.0%) |
| $750,000 to $999,999 | 0 (0.0%) | 0 (0.0%) |
| $1,000,000 or more | 2 (40.0%) | 0 (0.0%) |
| Total | 5 (100.0%) | 3 (100.0%) |
Household Income by Mortgage Status in Mount Carmel
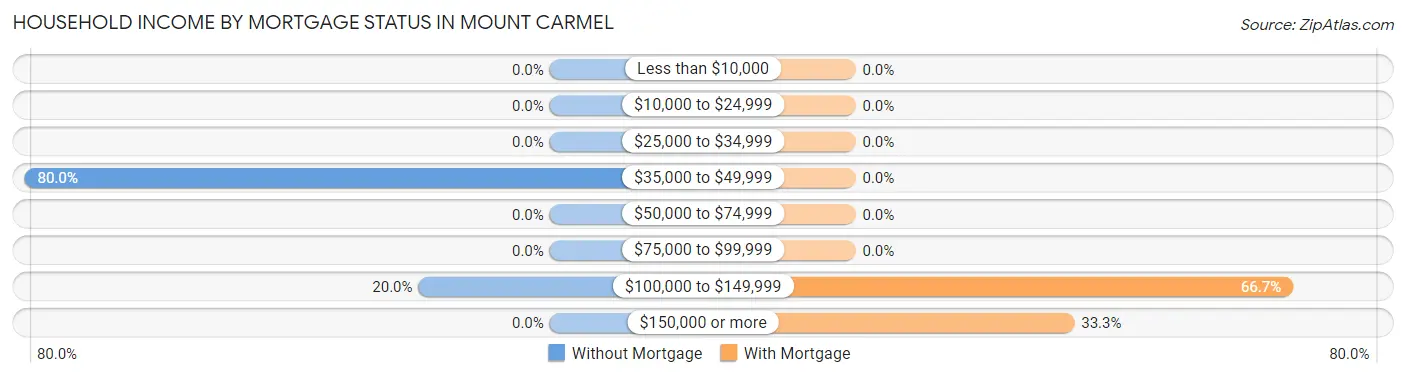
| Household Income | Without Mortgage | With Mortgage |
| Less than $10,000 | 0 (0.0%) | 0 (0.0%) |
| $10,000 to $24,999 | 0 (0.0%) | 0 (0.0%) |
| $25,000 to $34,999 | 0 (0.0%) | 0 (0.0%) |
| $35,000 to $49,999 | 4 (80.0%) | 0 (0.0%) |
| $50,000 to $74,999 | 0 (0.0%) | 0 (0.0%) |
| $75,000 to $99,999 | 0 (0.0%) | 0 (0.0%) |
| $100,000 to $149,999 | 1 (20.0%) | 2 (66.7%) |
| $150,000 or more | 0 (0.0%) | 1 (33.3%) |
| Total | 5 (100.0%) | 3 (100.0%) |
Property Value to Household Income Ratio in Mount Carmel
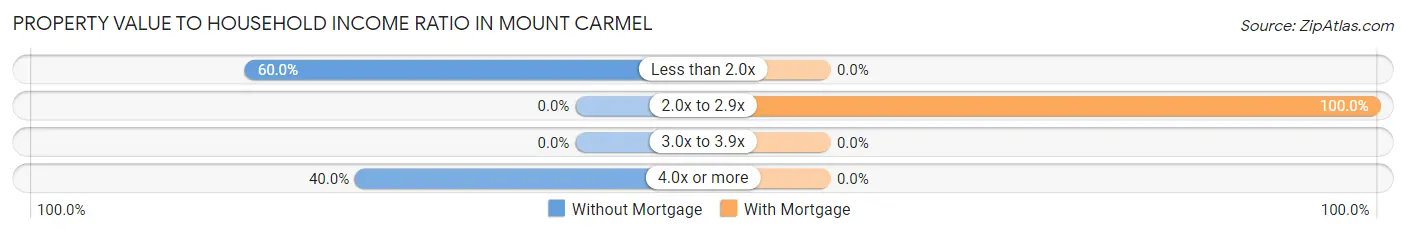
| Value-to-Income Ratio | Without Mortgage | With Mortgage |
| Less than 2.0x | 3 (60.0%) | 0 (0.0%) |
| 2.0x to 2.9x | 0 (0.0%) | 3 (100.0%) |
| 3.0x to 3.9x | 0 (0.0%) | 0 (0.0%) |
| 4.0x or more | 2 (40.0%) | 0 (0.0%) |
| Total | 5 (100.0%) | 3 (100.0%) |
Real Estate Taxes by Mortgage Status in Mount Carmel
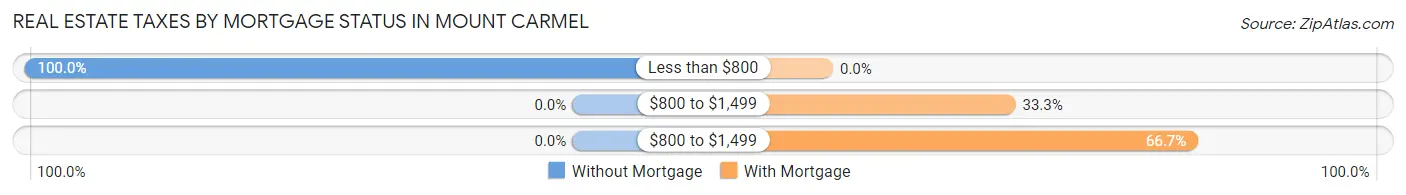
| Property Taxes | Without Mortgage | With Mortgage |
| Less than $800 | 5 (100.0%) | 0 (0.0%) |
| $800 to $1,499 | 0 (0.0%) | 1 (33.3%) |
| $800 to $1,499 | 0 (0.0%) | 2 (66.7%) |
| Total | 5 (100.0%) | 3 (100.0%) |
Health & Disability in Mount Carmel
Health Insurance Coverage by Age in Mount Carmel
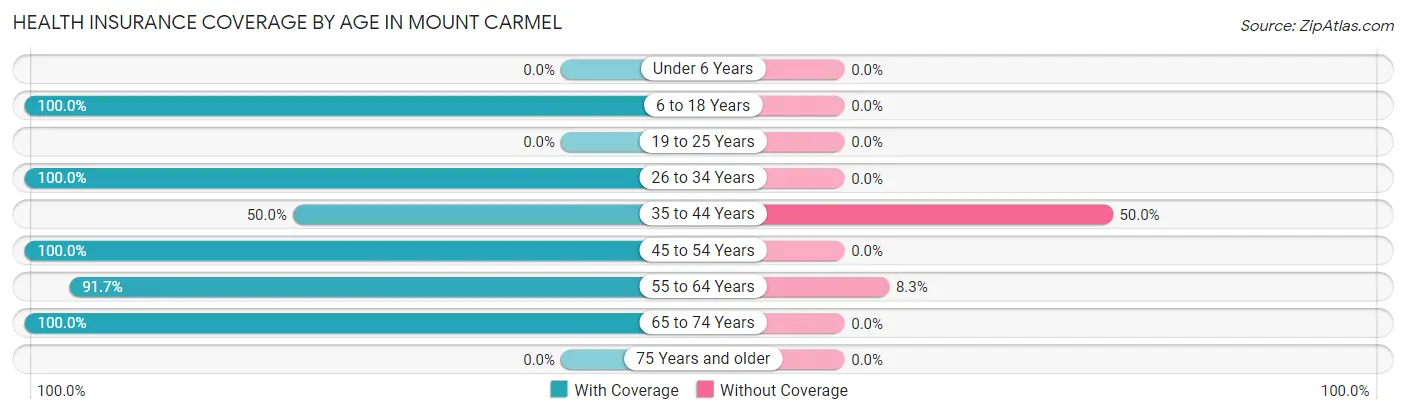
| Age Bracket | With Coverage | Without Coverage |
| Under 6 Years | 0 (0.0%) | 0 (0.0%) |
| 6 to 18 Years | 2 (100.0%) | 0 (0.0%) |
| 19 to 25 Years | 0 (0.0%) | 0 (0.0%) |
| 26 to 34 Years | 2 (100.0%) | 0 (0.0%) |
| 35 to 44 Years | 2 (50.0%) | 2 (50.0%) |
| 45 to 54 Years | 7 (100.0%) | 0 (0.0%) |
| 55 to 64 Years | 11 (91.7%) | 1 (8.3%) |
| 65 to 74 Years | 4 (100.0%) | 0 (0.0%) |
| 75 Years and older | 0 (0.0%) | 0 (0.0%) |
| Total | 28 (90.3%) | 3 (9.7%) |
Health Insurance Coverage by Citizenship Status in Mount Carmel
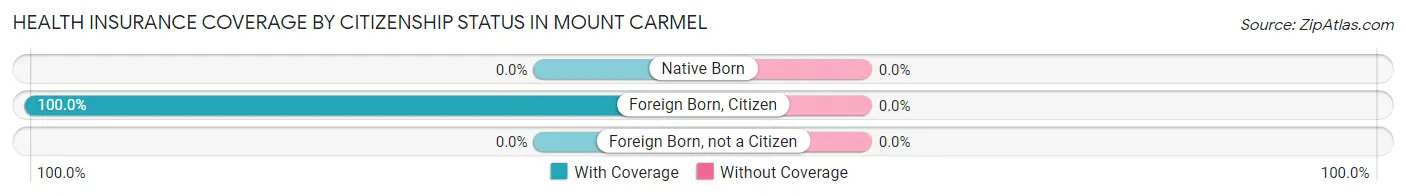
| Citizenship Status | With Coverage | Without Coverage |
| Native Born | 0 (0.0%) | 0 (0.0%) |
| Foreign Born, Citizen | 2 (100.0%) | 0 (0.0%) |
| Foreign Born, not a Citizen | 0 (0.0%) | 0 (0.0%) |
Health Insurance Coverage by Household Income in Mount Carmel
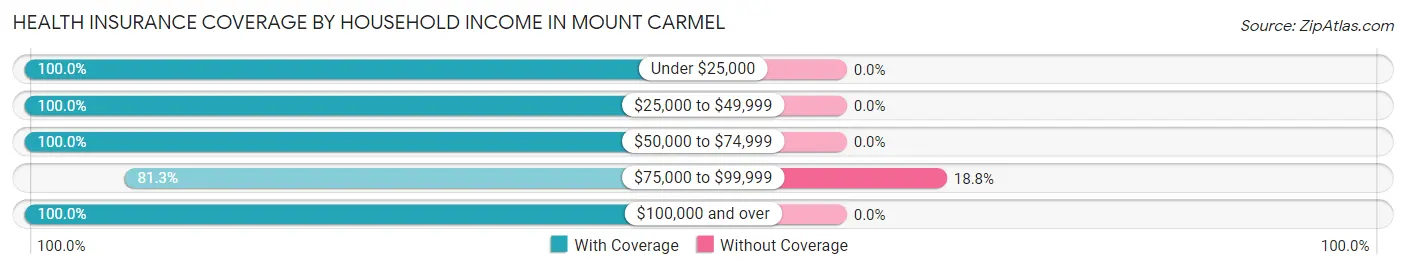
| Household Income | With Coverage | Without Coverage |
| Under $25,000 | 1 (100.0%) | 0 (0.0%) |
| $25,000 to $49,999 | 6 (100.0%) | 0 (0.0%) |
| $50,000 to $74,999 | 2 (100.0%) | 0 (0.0%) |
| $75,000 to $99,999 | 13 (81.2%) | 3 (18.8%) |
| $100,000 and over | 6 (100.0%) | 0 (0.0%) |
Public vs Private Health Insurance Coverage by Age in Mount Carmel
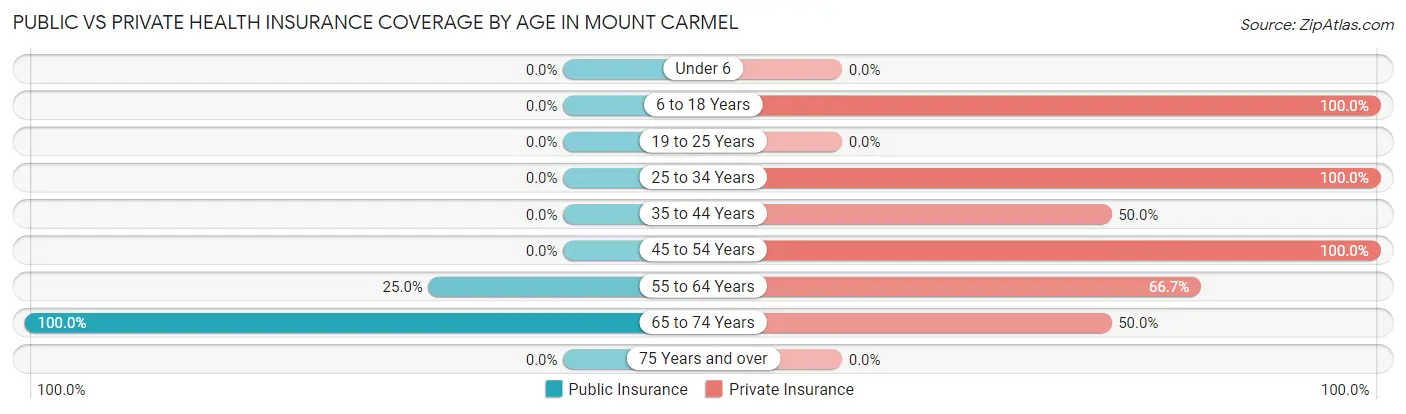
| Age Bracket | Public Insurance | Private Insurance |
| Under 6 | 0 (0.0%) | 0 (0.0%) |
| 6 to 18 Years | 0 (0.0%) | 2 (100.0%) |
| 19 to 25 Years | 0 (0.0%) | 0 (0.0%) |
| 25 to 34 Years | 0 (0.0%) | 2 (100.0%) |
| 35 to 44 Years | 0 (0.0%) | 2 (50.0%) |
| 45 to 54 Years | 0 (0.0%) | 7 (100.0%) |
| 55 to 64 Years | 3 (25.0%) | 8 (66.7%) |
| 65 to 74 Years | 4 (100.0%) | 2 (50.0%) |
| 75 Years and over | 0 (0.0%) | 0 (0.0%) |
| Total | 7 (22.6%) | 23 (74.2%) |
Disability Status by Sex by Age in Mount Carmel
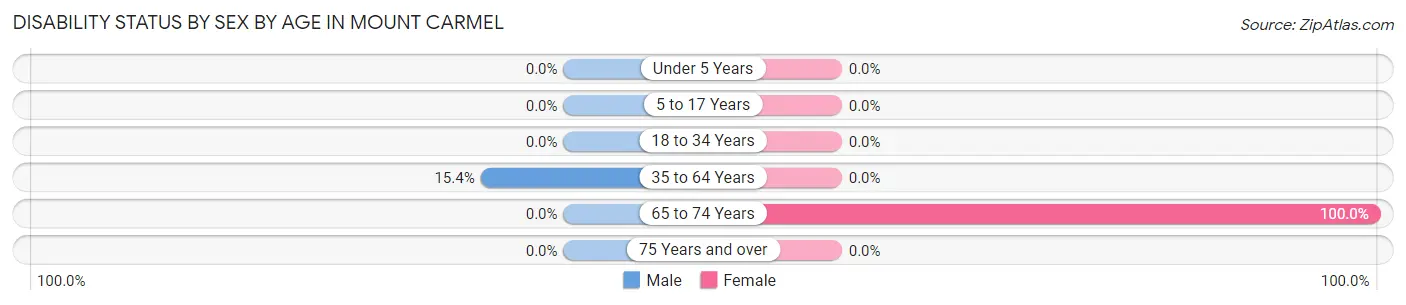
| Age Bracket | Male | Female |
| Under 5 Years | 0 (0.0%) | 0 (0.0%) |
| 5 to 17 Years | 0 (0.0%) | 0 (0.0%) |
| 18 to 34 Years | 0 (0.0%) | 0 (0.0%) |
| 35 to 64 Years | 2 (15.4%) | 0 (0.0%) |
| 65 to 74 Years | 0 (0.0%) | 4 (100.0%) |
| 75 Years and over | 0 (0.0%) | 0 (0.0%) |
Disability Class by Sex by Age in Mount Carmel
Disability Class: Hearing Difficulty
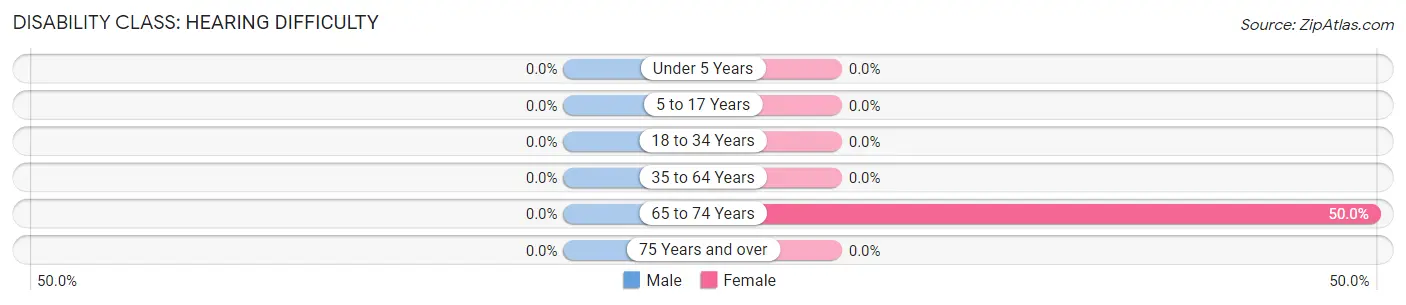
| Age Bracket | Male | Female |
| Under 5 Years | 0 (0.0%) | 0 (0.0%) |
| 5 to 17 Years | 0 (0.0%) | 0 (0.0%) |
| 18 to 34 Years | 0 (0.0%) | 0 (0.0%) |
| 35 to 64 Years | 0 (0.0%) | 0 (0.0%) |
| 65 to 74 Years | 0 (0.0%) | 2 (50.0%) |
| 75 Years and over | 0 (0.0%) | 0 (0.0%) |
Disability Class: Vision Difficulty
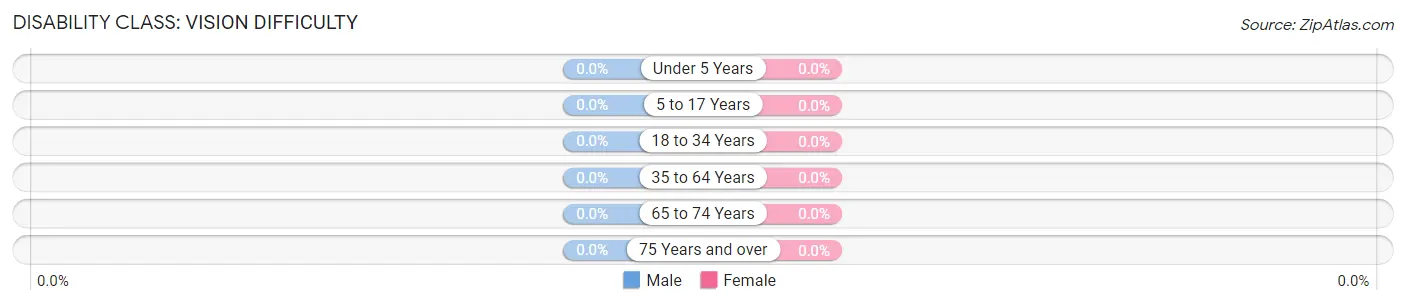
| Age Bracket | Male | Female |
| Under 5 Years | 0 (0.0%) | 0 (0.0%) |
| 5 to 17 Years | 0 (0.0%) | 0 (0.0%) |
| 18 to 34 Years | 0 (0.0%) | 0 (0.0%) |
| 35 to 64 Years | 0 (0.0%) | 0 (0.0%) |
| 65 to 74 Years | 0 (0.0%) | 0 (0.0%) |
| 75 Years and over | 0 (0.0%) | 0 (0.0%) |
Disability Class: Cognitive Difficulty
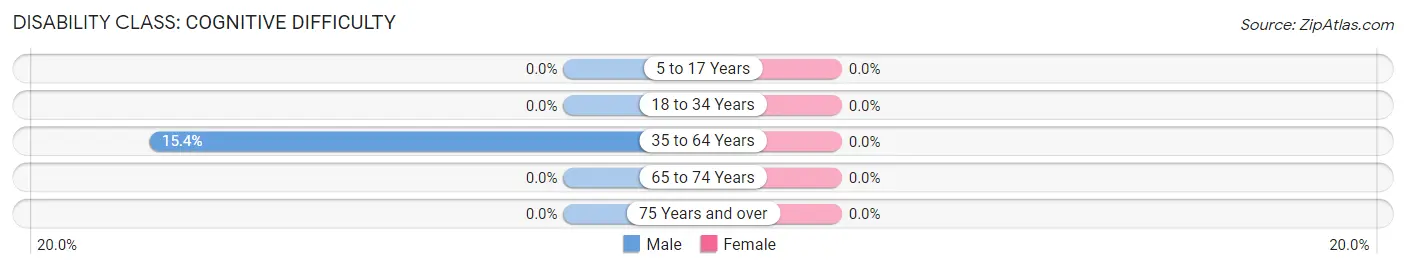
| Age Bracket | Male | Female |
| 5 to 17 Years | 0 (0.0%) | 0 (0.0%) |
| 18 to 34 Years | 0 (0.0%) | 0 (0.0%) |
| 35 to 64 Years | 2 (15.4%) | 0 (0.0%) |
| 65 to 74 Years | 0 (0.0%) | 0 (0.0%) |
| 75 Years and over | 0 (0.0%) | 0 (0.0%) |
Disability Class: Ambulatory Difficulty
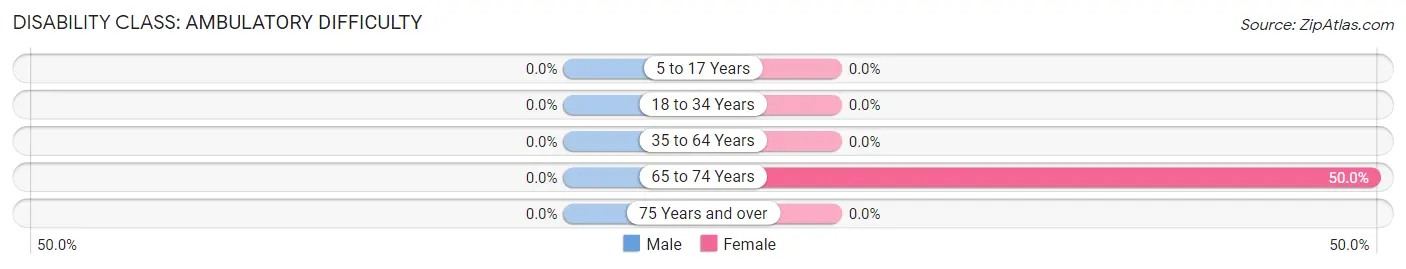
| Age Bracket | Male | Female |
| 5 to 17 Years | 0 (0.0%) | 0 (0.0%) |
| 18 to 34 Years | 0 (0.0%) | 0 (0.0%) |
| 35 to 64 Years | 0 (0.0%) | 0 (0.0%) |
| 65 to 74 Years | 0 (0.0%) | 2 (50.0%) |
| 75 Years and over | 0 (0.0%) | 0 (0.0%) |
Disability Class: Self-Care Difficulty
| Age Bracket | Male | Female |
| 5 to 17 Years | 0 (0.0%) | 0 (0.0%) |
| 18 to 34 Years | 0 (0.0%) | 0 (0.0%) |
| 35 to 64 Years | 0 (0.0%) | 0 (0.0%) |
| 65 to 74 Years | 0 (0.0%) | 0 (0.0%) |
| 75 Years and over | 0 (0.0%) | 0 (0.0%) |
Technology Access in Mount Carmel
Computing Device Access in Mount Carmel
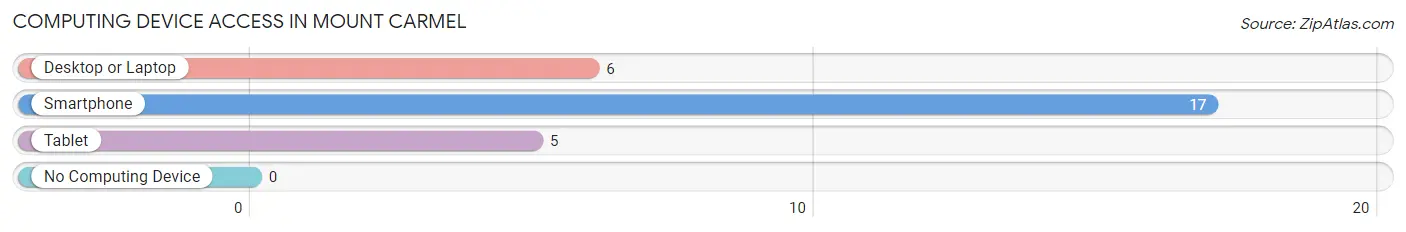
| Device Type | # Households | % Households |
| Desktop or Laptop | 6 | 31.6% |
| Smartphone | 17 | 89.5% |
| Tablet | 5 | 26.3% |
| No Computing Device | 0 | 0.0% |
| Total | 19 | 100.0% |
Internet Access in Mount Carmel
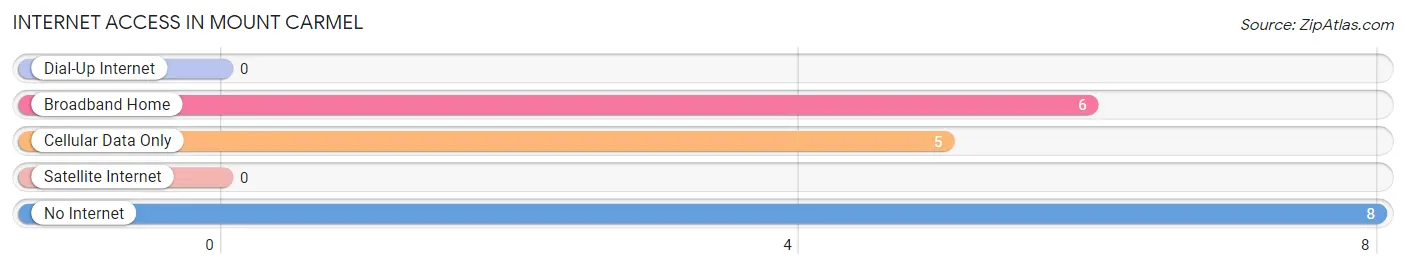
| Internet Type | # Households | % Households |
| Dial-Up Internet | 0 | 0.0% |
| Broadband Home | 6 | 31.6% |
| Cellular Data Only | 5 | 26.3% |
| Satellite Internet | 0 | 0.0% |
| No Internet | 8 | 42.1% |
| Total | 19 | 100.0% |
Mount Carmel Summary
Carmel, Indiana is a city located in Hamilton County, Indiana, United States. It is located in the northern part of the state, about 20 miles north of Indianapolis. The population was 79,191 at the 2010 census, making it the fifth-largest city in Indiana. It is part of the Indianapolis metropolitan area.
History
The area that is now Carmel was first settled in the early 1800s by Quaker families from North Carolina. The town was originally called Bethlehem, but was later renamed Carmel in 1837. The name was chosen in honor of the biblical Mount Carmel.
The town was incorporated in 1874 and grew rapidly in the late 19th and early 20th centuries. In the 1950s, the city began to expand rapidly, and by the 1970s, it had become a major suburb of Indianapolis.
Geography
Carmel is located in central Hamilton County, about 20 miles north of Indianapolis. It is bordered to the north by Westfield, to the east by Fishers, to the south by Zionsville, and to the west by Whitestown. The city is situated on the White River, which flows through the city from north to south.
The city has a total area of 48.2 square miles, of which 47.9 square miles is land and 0.3 square miles is water.
Economy
Carmel is home to a variety of businesses, including retail, healthcare, and technology. The city is also home to several corporate headquarters, including the headquarters of the CNO Financial Group, the parent company of Bankers Life and Casualty Company.
The city is also home to several major employers, including the Community Health Network, the Indiana University Health North Hospital, and the Indiana University Health West Hospital.
Demographics
As of the 2010 census, there were 79,191 people, 30,845 households, and 21,845 families residing in the city. The population density was 1,639.2 people per square mile. The racial makeup of the city was 87.2% White, 4.3% African American, 0.2% Native American, 5.2% Asian, 0.1% Pacific Islander, 1.2% from other races, and 1.9% from two or more races. Hispanic or Latino of any race were 3.9% of the population.
The median income for a household in the city was $87,542, and the median income for a family was $103,917. The per capita income for the city was $45,936. About 2.7% of families and 3.9% of the population were below the poverty line, including 4.3% of those under age 18 and 3.2% of those age 65 or over.
Carmel is a diverse city with a variety of cultures and backgrounds. The city is home to a large number of immigrants from India, China, and other countries. The city also has a large Jewish population.
Common Questions
What is Per Capita Income in Mount Carmel?
Per Capita income in Mount Carmel is $40,726.
What is the Median Family Income in Mount Carmel?
Median Family Income in Mount Carmel is $96,042.
What is the Median Household income in Mount Carmel?
Median Household Income in Mount Carmel is $80,625.
What is Income or Wage Gap in Mount Carmel?
Income or Wage Gap in Mount Carmel is 38.1%.
Women in Mount Carmel earn 61.9 cents for every dollar earned by a man.
What is Inequality or Gini Index in Mount Carmel?
Inequality or Gini Index in Mount Carmel is 0.24.
What is the Total Population of Mount Carmel?
Total Population of Mount Carmel is 31.
What is the Total Male Population of Mount Carmel?
Total Male Population of Mount Carmel is 14.
What is the Total Female Population of Mount Carmel?
Total Female Population of Mount Carmel is 17.
What is the Ratio of Males per 100 Females in Mount Carmel?
There are 82.35 Males per 100 Females in Mount Carmel.
What is the Ratio of Females per 100 Males in Mount Carmel?
There are 121.43 Females per 100 Males in Mount Carmel.
What is the Median Population Age in Mount Carmel?
Median Population Age in Mount Carmel is 57.1 Years.
What is the Average Family Size in Mount Carmel
Average Family Size in Mount Carmel is 2.2 People.
What is the Average Household Size in Mount Carmel
Average Household Size in Mount Carmel is 1.6 People.
How Large is the Labor Force in Mount Carmel?
There are 22 People in the Labor Forcein in Mount Carmel.
What is the Percentage of People in the Labor Force in Mount Carmel?
71.0% of People are in the Labor Force in Mount Carmel.