Zip Codes with the Highest Percentage of Population Employed in Security & Protection in Indiana
RELATED REPORTS & OPTIONS
Security & Protection
Indiana
Compare Zip Codes
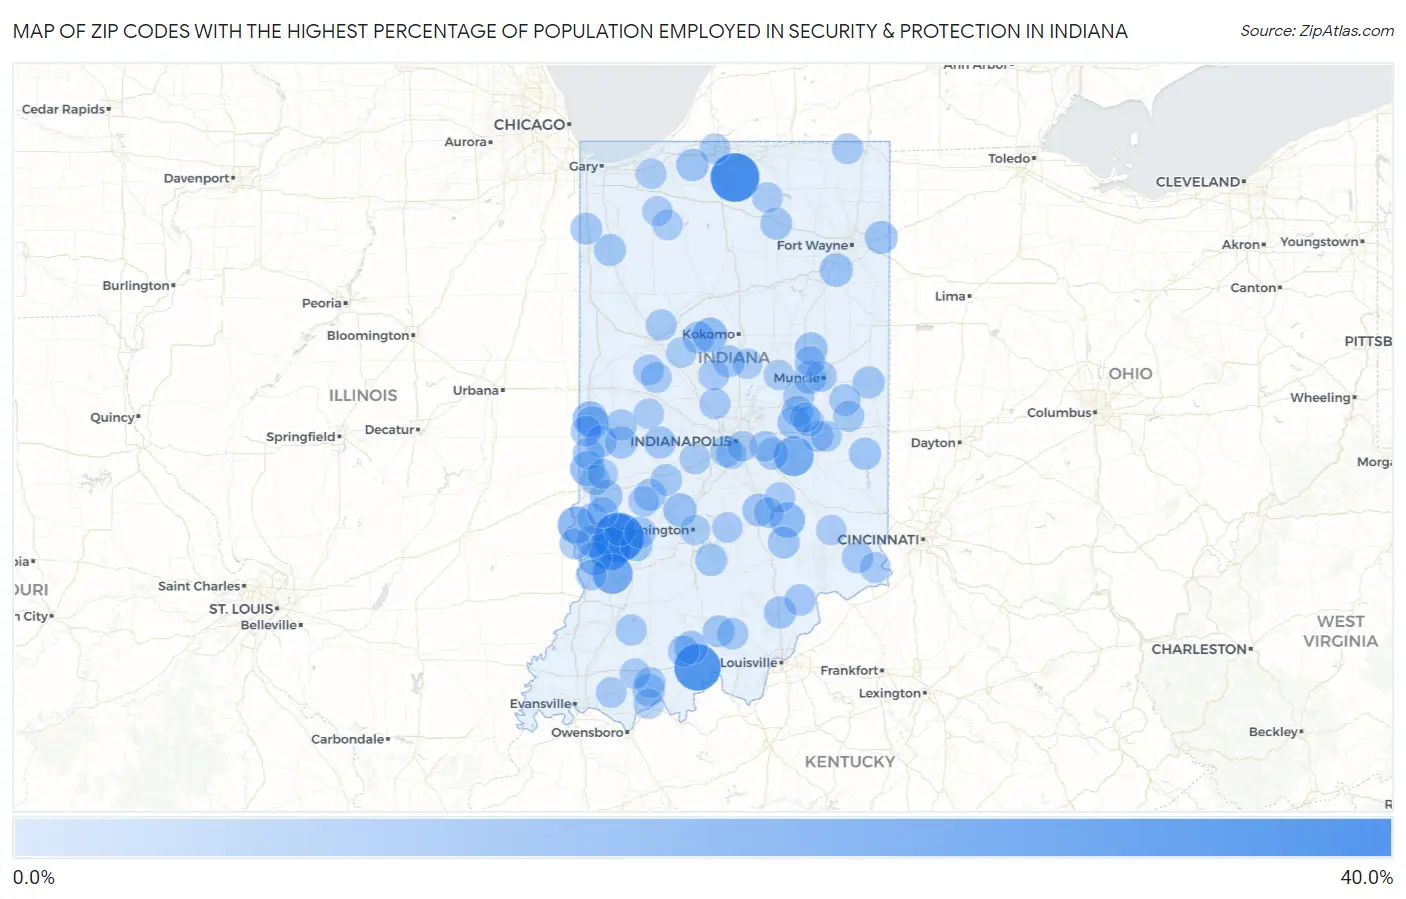
Map of Zip Codes with the Highest Percentage of Population Employed in Security & Protection in Indiana
0.0%
40.0%
Zip Codes with the Highest Percentage of Population Employed in Security & Protection in Indiana
| Zip Code | % Employed | vs State | vs National | |
| 1. | 47445 | 32.9% | 1.8%(+31.1)#1 | 2.1%(+30.7)#81 |
| 2. | 46595 | 31.6% | 1.8%(+29.8)#2 | 2.1%(+29.4)#86 |
| 3. | 47174 | 27.9% | 1.8%(+26.1)#3 | 2.1%(+25.8)#110 |
| 4. | 47848 | 22.2% | 1.8%(+20.4)#4 | 2.1%(+20.0)#168 |
| 5. | 47596 | 17.9% | 1.8%(+16.2)#5 | 2.1%(+15.8)#256 |
| 6. | 46144 | 17.5% | 1.8%(+15.7)#6 | 2.1%(+15.4)#268 |
| 7. | 47849 | 13.5% | 1.8%(+11.8)#7 | 2.1%(+11.4)#443 |
| 8. | 47244 | 10.7% | 1.8%(+8.92)#8 | 2.1%(+8.55)#677 |
| 9. | 46915 | 10.0% | 1.8%(+8.25)#9 | 2.1%(+7.88)#760 |
| 10. | 47928 | 10.0% | 1.8%(+8.23)#10 | 2.1%(+7.85)#762 |
| 11. | 47863 | 10.0% | 1.8%(+8.23)#11 | 2.1%(+7.85)#765 |
| 12. | 47838 | 8.1% | 1.8%(+6.36)#12 | 2.1%(+5.99)#1,116 |
| 13. | 47464 | 8.0% | 1.8%(+6.23)#13 | 2.1%(+5.85)#1,169 |
| 14. | 46799 | 7.7% | 1.8%(+5.95)#14 | 2.1%(+5.58)#1,260 |
| 15. | 47175 | 7.6% | 1.8%(+5.78)#15 | 2.1%(+5.41)#1,310 |
| 16. | 47396 | 7.3% | 1.8%(+5.48)#16 | 2.1%(+5.11)#1,421 |
| 17. | 46797 | 7.2% | 1.8%(+5.44)#17 | 2.1%(+5.07)#1,434 |
| 18. | 47966 | 7.1% | 1.8%(+5.31)#18 | 2.1%(+4.94)#1,496 |
| 19. | 46957 | 7.0% | 1.8%(+5.23)#19 | 2.1%(+4.85)#1,531 |
| 20. | 47280 | 6.9% | 1.8%(+5.14)#20 | 2.1%(+4.77)#1,571 |
| 21. | 46186 | 6.7% | 1.8%(+4.95)#21 | 2.1%(+4.58)#1,669 |
| 22. | 47882 | 6.7% | 1.8%(+4.94)#22 | 2.1%(+4.57)#1,681 |
| 23. | 47871 | 6.7% | 1.8%(+4.93)#23 | 2.1%(+4.55)#1,686 |
| 24. | 46365 | 6.6% | 1.8%(+4.80)#24 | 2.1%(+4.42)#1,753 |
| 25. | 47550 | 6.3% | 1.8%(+4.56)#25 | 2.1%(+4.18)#1,877 |
| 26. | 47177 | 6.3% | 1.8%(+4.54)#26 | 2.1%(+4.16)#1,893 |
| 27. | 47465 | 6.2% | 1.8%(+4.45)#27 | 2.1%(+4.07)#1,939 |
| 28. | 47325 | 6.2% | 1.8%(+4.38)#28 | 2.1%(+4.01)#1,982 |
| 29. | 47438 | 6.1% | 1.8%(+4.29)#29 | 2.1%(+3.91)#2,033 |
| 30. | 46920 | 6.1% | 1.8%(+4.29)#30 | 2.1%(+3.91)#2,035 |
| 31. | 47872 | 6.0% | 1.8%(+4.21)#31 | 2.1%(+3.83)#2,091 |
| 32. | 46130 | 6.0% | 1.8%(+4.20)#32 | 2.1%(+3.82)#2,098 |
| 33. | 47436 | 5.9% | 1.8%(+4.15)#33 | 2.1%(+3.78)#2,128 |
| 34. | 47394 | 5.9% | 1.8%(+4.11)#34 | 2.1%(+3.74)#2,151 |
| 35. | 47868 | 5.9% | 1.8%(+4.09)#35 | 2.1%(+3.71)#2,173 |
| 36. | 46049 | 5.8% | 1.8%(+4.03)#36 | 2.1%(+3.66)#2,204 |
| 37. | 47862 | 5.8% | 1.8%(+4.00)#37 | 2.1%(+3.63)#2,228 |
| 38. | 47943 | 5.7% | 1.8%(+3.94)#38 | 2.1%(+3.57)#2,274 |
| 39. | 46105 | 5.7% | 1.8%(+3.91)#39 | 2.1%(+3.53)#2,297 |
| 40. | 47842 | 5.6% | 1.8%(+3.86)#40 | 2.1%(+3.48)#2,348 |
| 41. | 46590 | 5.6% | 1.8%(+3.85)#41 | 2.1%(+3.48)#2,351 |
| 42. | 46376 | 5.6% | 1.8%(+3.78)#42 | 2.1%(+3.41)#2,414 |
| 43. | 47125 | 5.5% | 1.8%(+3.72)#43 | 2.1%(+3.35)#2,459 |
| 44. | 47471 | 5.4% | 1.8%(+3.63)#44 | 2.1%(+3.26)#2,539 |
| 45. | 47273 | 5.4% | 1.8%(+3.62)#45 | 2.1%(+3.25)#2,545 |
| 46. | 46120 | 5.2% | 1.8%(+3.43)#46 | 2.1%(+3.06)#2,708 |
| 47. | 46221 | 5.2% | 1.8%(+3.40)#47 | 2.1%(+3.02)#2,737 |
| 48. | 47120 | 5.1% | 1.8%(+3.30)#48 | 2.1%(+2.93)#2,837 |
| 49. | 47138 | 5.0% | 1.8%(+3.27)#49 | 2.1%(+2.89)#2,875 |
| 50. | 47354 | 5.0% | 1.8%(+3.27)#50 | 2.1%(+2.89)#2,877 |
| 51. | 47018 | 4.9% | 1.8%(+3.12)#51 | 2.1%(+2.75)#3,046 |
| 52. | 47920 | 4.8% | 1.8%(+3.01)#52 | 2.1%(+2.63)#3,191 |
| 53. | 47850 | 4.8% | 1.8%(+3.00)#53 | 2.1%(+2.62)#3,205 |
| 54. | 47859 | 4.8% | 1.8%(+3.00)#54 | 2.1%(+2.62)#3,207 |
| 55. | 46017 | 4.8% | 1.8%(+2.98)#55 | 2.1%(+2.61)#3,221 |
| 56. | 46056 | 4.8% | 1.8%(+2.98)#56 | 2.1%(+2.61)#3,226 |
| 57. | 47564 | 4.7% | 1.8%(+2.92)#57 | 2.1%(+2.55)#3,306 |
| 58. | 47346 | 4.7% | 1.8%(+2.92)#58 | 2.1%(+2.54)#3,315 |
| 59. | 47116 | 4.6% | 1.8%(+2.85)#59 | 2.1%(+2.48)#3,391 |
| 60. | 47337 | 4.5% | 1.8%(+2.77)#60 | 2.1%(+2.40)#3,534 |
| 61. | 47352 | 4.5% | 1.8%(+2.68)#61 | 2.1%(+2.31)#3,675 |
| 62. | 47866 | 4.3% | 1.8%(+2.56)#62 | 2.1%(+2.18)#3,887 |
| 63. | 46075 | 4.3% | 1.8%(+2.55)#63 | 2.1%(+2.18)#3,898 |
| 64. | 47861 | 4.3% | 1.8%(+2.54)#64 | 2.1%(+2.17)#3,913 |
| 65. | 47579 | 4.3% | 1.8%(+2.54)#65 | 2.1%(+2.16)#3,927 |
| 66. | 47306 | 4.3% | 1.8%(+2.53)#66 | 2.1%(+2.16)#3,934 |
| 67. | 47847 | 4.2% | 1.8%(+2.47)#67 | 2.1%(+2.10)#4,030 |
| 68. | 47955 | 4.2% | 1.8%(+2.47)#68 | 2.1%(+2.10)#4,036 |
| 69. | 46118 | 4.2% | 1.8%(+2.46)#69 | 2.1%(+2.09)#4,054 |
| 70. | 47981 | 4.2% | 1.8%(+2.43)#70 | 2.1%(+2.05)#4,119 |
| 71. | 46776 | 4.1% | 1.8%(+2.34)#71 | 2.1%(+1.97)#4,269 |
| 72. | 46050 | 4.1% | 1.8%(+2.32)#72 | 2.1%(+1.94)#4,317 |
| 73. | 47040 | 4.1% | 1.8%(+2.28)#73 | 2.1%(+1.90)#4,399 |
| 74. | 47833 | 4.0% | 1.8%(+2.26)#74 | 2.1%(+1.88)#4,431 |
| 75. | 46163 | 4.0% | 1.8%(+2.18)#75 | 2.1%(+1.81)#4,578 |
| 76. | 47234 | 3.8% | 1.8%(+1.98)#76 | 2.1%(+1.61)#5,007 |
| 77. | 47561 | 3.7% | 1.8%(+1.95)#77 | 2.1%(+1.57)#5,093 |
| 78. | 46391 | 3.7% | 1.8%(+1.92)#78 | 2.1%(+1.55)#5,159 |
| 79. | 46366 | 3.7% | 1.8%(+1.92)#79 | 2.1%(+1.54)#5,171 |
| 80. | 47965 | 3.7% | 1.8%(+1.90)#80 | 2.1%(+1.53)#5,204 |
| 81. | 47601 | 3.7% | 1.8%(+1.89)#81 | 2.1%(+1.51)#5,248 |
| 82. | 46542 | 3.7% | 1.8%(+1.88)#82 | 2.1%(+1.50)#5,267 |
| 83. | 47342 | 3.6% | 1.8%(+1.86)#83 | 2.1%(+1.49)#5,319 |
| 84. | 47448 | 3.6% | 1.8%(+1.85)#84 | 2.1%(+1.48)#5,345 |
| 85. | 47351 | 3.6% | 1.8%(+1.80)#85 | 2.1%(+1.42)#5,471 |
| 86. | 46628 | 3.6% | 1.8%(+1.79)#86 | 2.1%(+1.41)#5,501 |
| 87. | 46217 | 3.6% | 1.8%(+1.78)#87 | 2.1%(+1.40)#5,536 |
| 88. | 46044 | 3.5% | 1.8%(+1.77)#88 | 2.1%(+1.39)#5,567 |
| 89. | 47615 | 3.5% | 1.8%(+1.75)#89 | 2.1%(+1.38)#5,607 |
| 90. | 47405 | 3.5% | 1.8%(+1.75)#90 | 2.1%(+1.38)#5,611 |
| 91. | 47523 | 3.5% | 1.8%(+1.74)#91 | 2.1%(+1.36)#5,642 |
| 92. | 46072 | 3.5% | 1.8%(+1.73)#92 | 2.1%(+1.36)#5,656 |
| 93. | 47384 | 3.5% | 1.8%(+1.72)#93 | 2.1%(+1.35)#5,674 |
| 94. | 47804 | 3.5% | 1.8%(+1.71)#94 | 2.1%(+1.33)#5,722 |
| 95. | 47226 | 3.5% | 1.8%(+1.70)#95 | 2.1%(+1.32)#5,747 |
| 96. | 46203 | 3.4% | 1.8%(+1.66)#96 | 2.1%(+1.29)#5,829 |
| 97. | 47805 | 3.4% | 1.8%(+1.63)#97 | 2.1%(+1.26)#5,913 |
| 98. | 46058 | 3.3% | 1.8%(+1.57)#98 | 2.1%(+1.19)#6,126 |
| 99. | 47037 | 3.3% | 1.8%(+1.54)#99 | 2.1%(+1.16)#6,207 |
| 100. | 46348 | 3.3% | 1.8%(+1.54)#100 | 2.1%(+1.16)#6,216 |
Common Questions
What are the Top 10 Zip Codes with the Highest Percentage of Population Employed in Security & Protection in Indiana?
Top 10 Zip Codes with the Highest Percentage of Population Employed in Security & Protection in Indiana are:
What zip code has the Highest Percentage of Population Employed in Security & Protection in Indiana?
47445 has the Highest Percentage of Population Employed in Security & Protection in Indiana with 32.9%.
What is the Percentage of Population Employed in Security & Protection in the State of Indiana?
Percentage of Population Employed in Security & Protection in Indiana is 1.8%.
What is the Percentage of Population Employed in Security & Protection in the United States?
Percentage of Population Employed in Security & Protection in the United States is 2.1%.