Zip Codes with the Highest Percentage of Population Employed in Security & Protection in South Bend, IN
RELATED REPORTS & OPTIONS
Security & Protection
South Bend
Compare Zip Codes
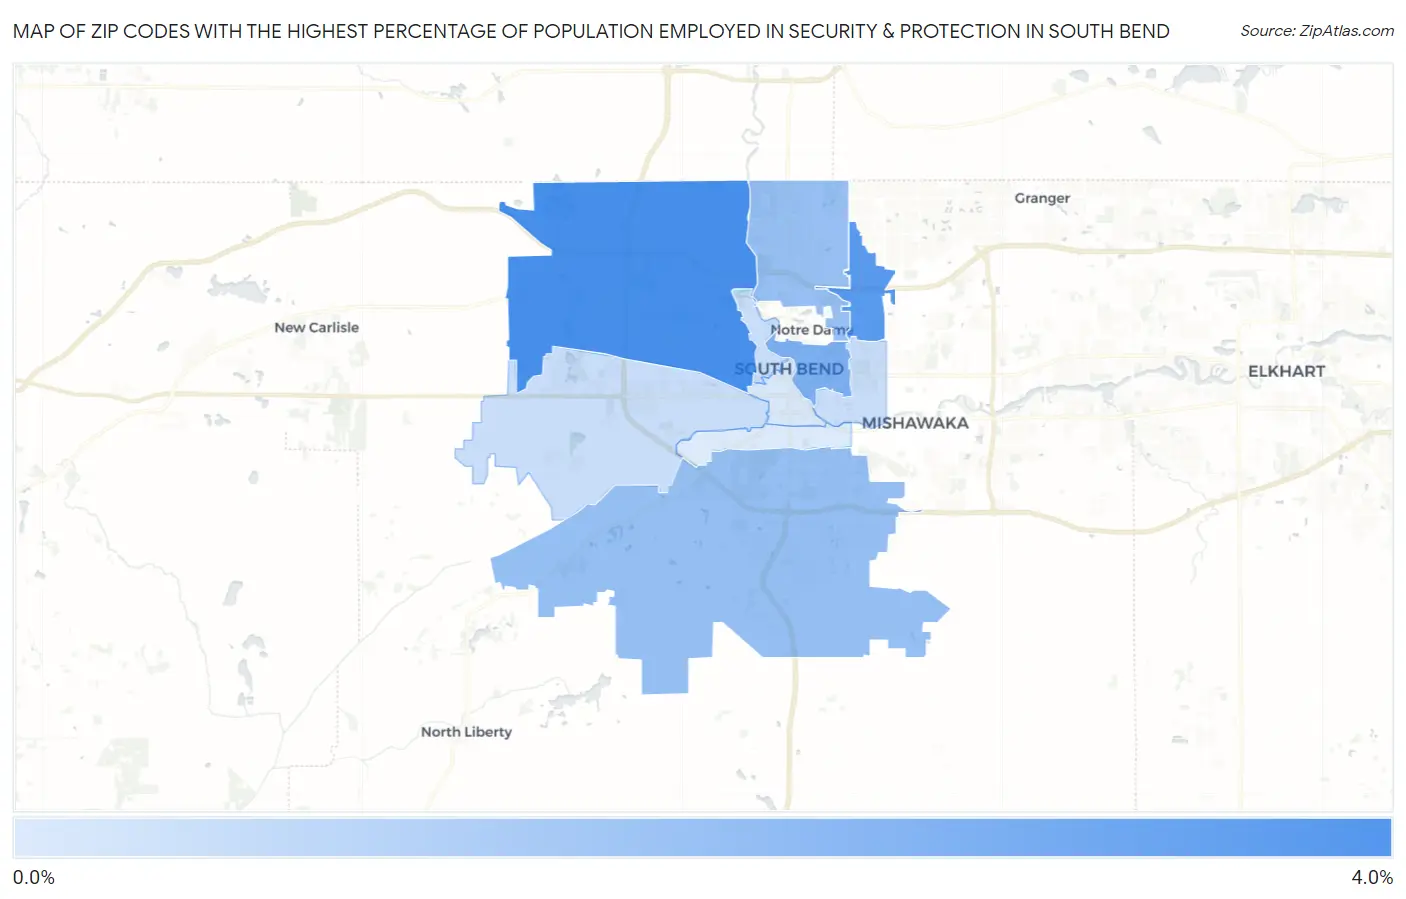
Map of Zip Codes with the Highest Percentage of Population Employed in Security & Protection in South Bend
0.56%
3.6%
Zip Codes with the Highest Percentage of Population Employed in Security & Protection in South Bend, IN
| Zip Code | % Employed | vs State | vs National | |
| 1. | 46628 | 3.6% | 1.8%(+1.79)#86 | 2.1%(+1.41)#5,501 |
| 2. | 46635 | 3.2% | 1.8%(+1.45)#103 | 2.1%(+1.08)#6,465 |
| 3. | 46617 | 2.5% | 1.8%(+0.705)#179 | 2.1%(+0.332)#9,614 |
| 4. | 46614 | 2.0% | 1.8%(+0.189)#258 | 2.1%(-0.184)#12,792 |
| 5. | 46637 | 2.0% | 1.8%(+0.183)#260 | 2.1%(-0.191)#12,836 |
| 6. | 46616 | 0.99% | 1.8%(-0.784)#470 | 2.1%(-1.16)#20,114 |
| 7. | 46619 | 0.98% | 1.8%(-0.790)#471 | 2.1%(-1.16)#20,170 |
| 8. | 46615 | 0.98% | 1.8%(-0.794)#472 | 2.1%(-1.17)#20,205 |
| 9. | 46601 | 0.63% | 1.8%(-1.14)#550 | 2.1%(-1.51)#22,472 |
| 10. | 46613 | 0.56% | 1.8%(-1.21)#560 | 2.1%(-1.58)#22,863 |
1
Common Questions
What are the Top 5 Zip Codes with the Highest Percentage of Population Employed in Security & Protection in South Bend, IN?
Top 5 Zip Codes with the Highest Percentage of Population Employed in Security & Protection in South Bend, IN are:
What zip code has the Highest Percentage of Population Employed in Security & Protection in South Bend, IN?
46628 has the Highest Percentage of Population Employed in Security & Protection in South Bend, IN with 3.6%.
What is the Percentage of Population Employed in Security & Protection in South Bend, IN?
Percentage of Population Employed in Security & Protection in South Bend is 1.8%.
What is the Percentage of Population Employed in Security & Protection in Indiana?
Percentage of Population Employed in Security & Protection in Indiana is 1.8%.
What is the Percentage of Population Employed in Security & Protection in the United States?
Percentage of Population Employed in Security & Protection in the United States is 2.1%.