Wilkinson, IN Map & Demographics
Wilkinson Map
Wilkinson Overview
$31,327
PER CAPITA INCOME
$68,750
AVG FAMILY INCOME
$61,146
AVG HOUSEHOLD INCOME
33.7%
WAGE / INCOME GAP [ % ]
66.3¢/ $1
WAGE / INCOME GAP [ $ ]
0.42
INEQUALITY / GINI INDEX
436
TOTAL POPULATION
231
MALE POPULATION
205
FEMALE POPULATION
112.68
MALES / 100 FEMALES
88.74
FEMALES / 100 MALES
33.5
MEDIAN AGE
3.3
AVG FAMILY SIZE
2.4
AVG HOUSEHOLD SIZE
255
LABOR FORCE [ PEOPLE ]
75.7%
PERCENT IN LABOR FORCE
0.8%
UNEMPLOYMENT RATE
Wilkinson Zip Codes
Wilkinson Area Codes
Income in Wilkinson
Income Overview in Wilkinson
Per Capita Income in Wilkinson is $31,327, while median incomes of families and households are $68,750 and $61,146 respectively.
| Characteristic | Number | Measure |
| Per Capita Income | 436 | $31,327 |
| Median Family Income | 102 | $68,750 |
| Mean Family Income | 102 | $94,763 |
| Median Household Income | 181 | $61,146 |
| Mean Household Income | 181 | $76,751 |
| Income Deficit | 102 | $0 |
| Wage / Income Gap (%) | 436 | 33.68% |
| Wage / Income Gap ($) | 436 | 66.32¢ per $1 |
| Gini / Inequality Index | 436 | 0.42 |
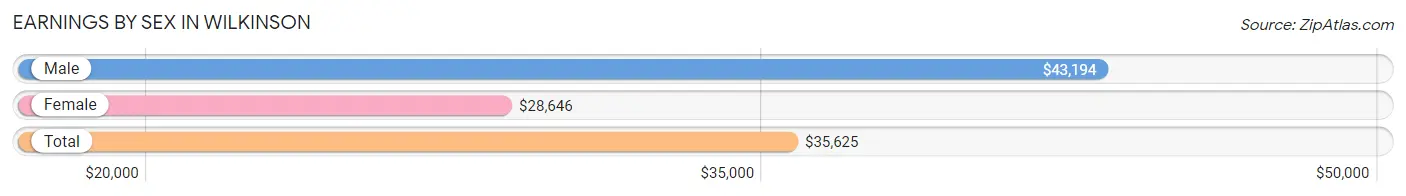
Earnings by Sex in Wilkinson
Average Earnings in Wilkinson are $35,625, $43,194 for men and $28,646 for women, a difference of 33.7%.
| Sex | Number | Average Earnings |
| Male | 143 (54.2%) | $43,194 |
| Female | 121 (45.8%) | $28,646 |
| Total | 264 (100.0%) | $35,625 |
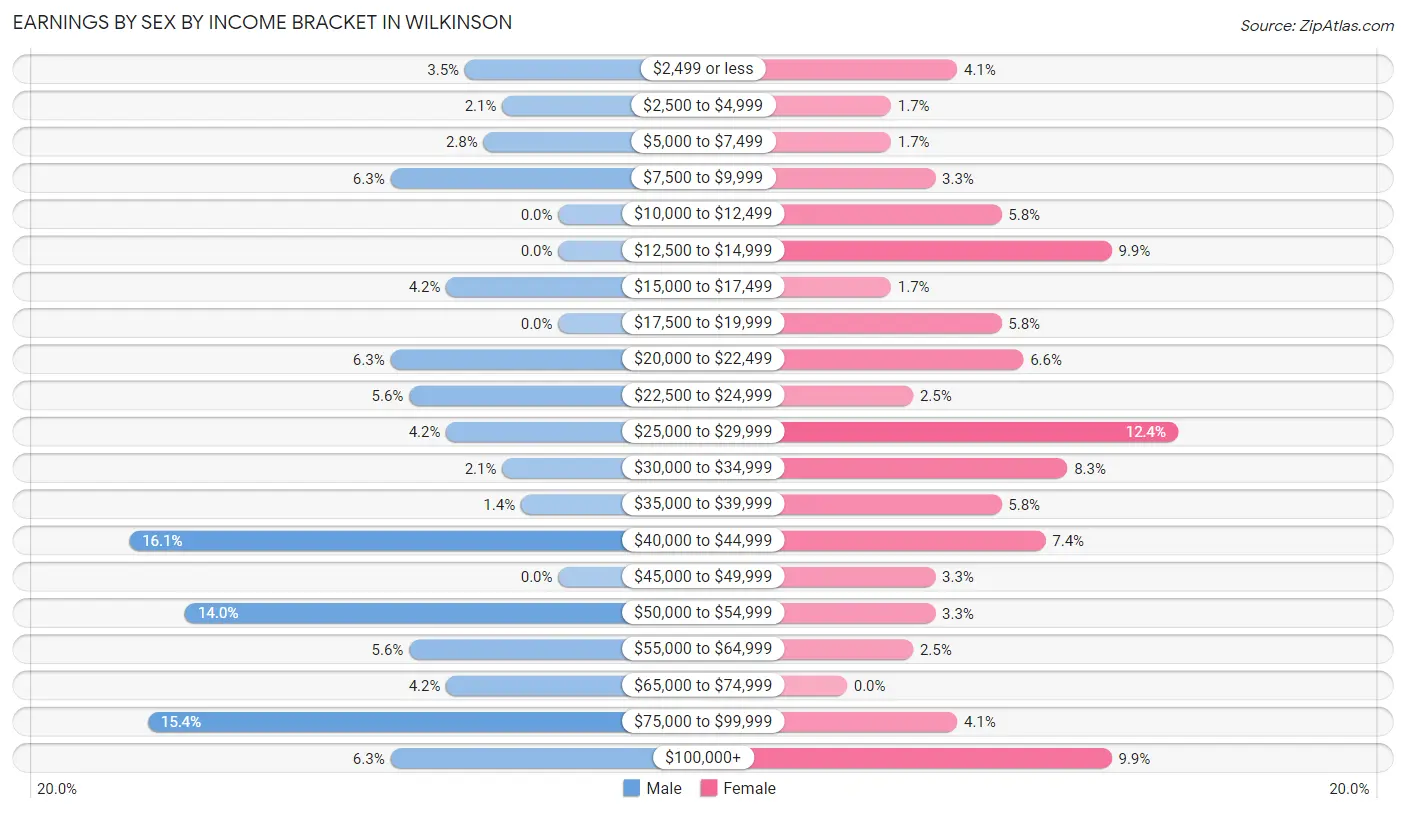
Earnings by Sex by Income Bracket in Wilkinson
The most common earnings brackets in Wilkinson are $40,000 to $44,999 for men (23 | 16.1%) and $25,000 to $29,999 for women (15 | 12.4%).
| Income | Male | Female |
| $2,499 or less | 5 (3.5%) | 5 (4.1%) |
| $2,500 to $4,999 | 3 (2.1%) | 2 (1.7%) |
| $5,000 to $7,499 | 4 (2.8%) | 2 (1.7%) |
| $7,500 to $9,999 | 9 (6.3%) | 4 (3.3%) |
| $10,000 to $12,499 | 0 (0.0%) | 7 (5.8%) |
| $12,500 to $14,999 | 0 (0.0%) | 12 (9.9%) |
| $15,000 to $17,499 | 6 (4.2%) | 2 (1.7%) |
| $17,500 to $19,999 | 0 (0.0%) | 7 (5.8%) |
| $20,000 to $22,499 | 9 (6.3%) | 8 (6.6%) |
| $22,500 to $24,999 | 8 (5.6%) | 3 (2.5%) |
| $25,000 to $29,999 | 6 (4.2%) | 15 (12.4%) |
| $30,000 to $34,999 | 3 (2.1%) | 10 (8.3%) |
| $35,000 to $39,999 | 2 (1.4%) | 7 (5.8%) |
| $40,000 to $44,999 | 23 (16.1%) | 9 (7.4%) |
| $45,000 to $49,999 | 0 (0.0%) | 4 (3.3%) |
| $50,000 to $54,999 | 20 (14.0%) | 4 (3.3%) |
| $55,000 to $64,999 | 8 (5.6%) | 3 (2.5%) |
| $65,000 to $74,999 | 6 (4.2%) | 0 (0.0%) |
| $75,000 to $99,999 | 22 (15.4%) | 5 (4.1%) |
| $100,000+ | 9 (6.3%) | 12 (9.9%) |
| Total | 143 (100.0%) | 121 (100.0%) |
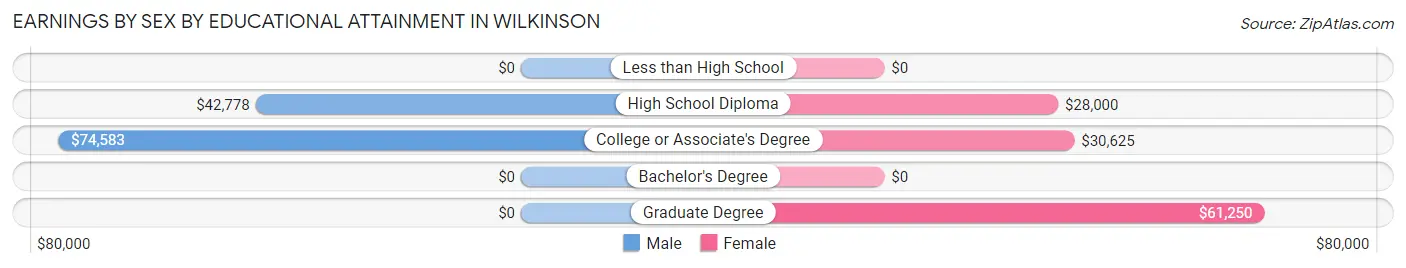
Earnings by Sex by Educational Attainment in Wilkinson
Average earnings in Wilkinson are $50,268 for men and $28,750 for women, a difference of 42.8%. Men with an educational attainment of college or associate's degree enjoy the highest average annual earnings of $74,583, while those with high school diploma education earn the least with $42,778. Women with an educational attainment of graduate degree earn the most with the average annual earnings of $61,250, while those with high school diploma education have the smallest earnings of $28,000.
| Educational Attainment | Male Income | Female Income |
| Less than High School | - | - |
| High School Diploma | $42,778 | $28,000 |
| College or Associate's Degree | $74,583 | $30,625 |
| Bachelor's Degree | - | - |
| Graduate Degree | - | - |
| Total | $50,268 | $28,750 |
Family Income in Wilkinson
Family Income Brackets in Wilkinson
According to the Wilkinson family income data, there are 23 families falling into the $100,000 to $149,999 income range, which is the most common income bracket and makes up 22.6% of all families.
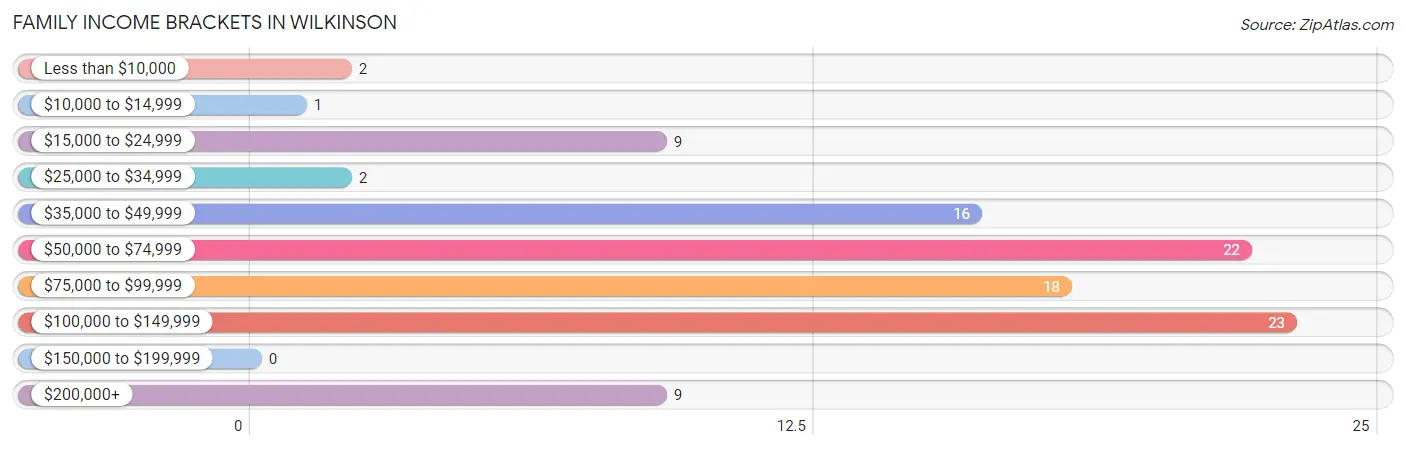
| Income Bracket | # Families | % Families |
| Less than $10,000 | 2 | 2.0% |
| $10,000 to $14,999 | 1 | 1.0% |
| $15,000 to $24,999 | 9 | 8.8% |
| $25,000 to $34,999 | 2 | 2.0% |
| $35,000 to $49,999 | 16 | 15.7% |
| $50,000 to $74,999 | 22 | 21.6% |
| $75,000 to $99,999 | 18 | 17.6% |
| $100,000 to $149,999 | 23 | 22.5% |
| $150,000 to $199,999 | 0 | 0.0% |
| $200,000+ | 9 | 8.8% |
Family Income by Famaliy Size in Wilkinson
3-person families (23 | 22.6%) account for the highest median family income in Wilkinson with $63,750 per family, while 2-person families (53 | 52.0%) have the highest median income of $31,562 per family member.
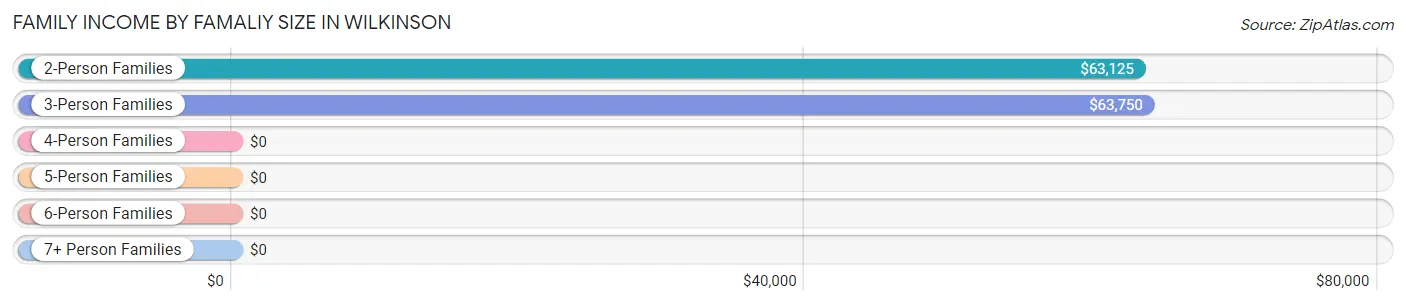
| Income Bracket | # Families | Median Income |
| 2-Person Families | 53 (52.0%) | $63,125 |
| 3-Person Families | 23 (22.6%) | $63,750 |
| 4-Person Families | 18 (17.6%) | $0 |
| 5-Person Families | 0 (0.0%) | $0 |
| 6-Person Families | 6 (5.9%) | $0 |
| 7+ Person Families | 2 (2.0%) | $0 |
| Total | 102 (100.0%) | $68,750 |
Family Income by Number of Earners in Wilkinson
The median family income in Wilkinson is $68,750, with families comprising 3+ earners (16) having the highest median family income of $250,001, while families with 1 earner (25) have the lowest median family income of $43,750, accounting for 15.7% and 24.5% of families, respectively.
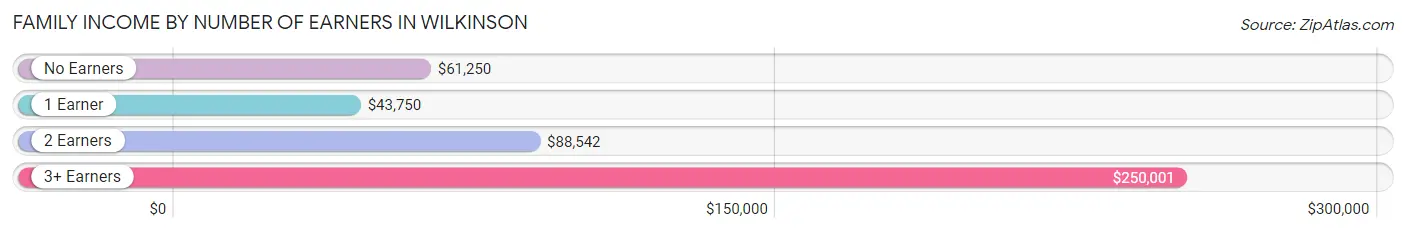
| Number of Earners | # Families | Median Income |
| No Earners | 10 (9.8%) | $61,250 |
| 1 Earner | 25 (24.5%) | $43,750 |
| 2 Earners | 51 (50.0%) | $88,542 |
| 3+ Earners | 16 (15.7%) | $250,001 |
| Total | 102 (100.0%) | $68,750 |
Household Income in Wilkinson
Household Income Brackets in Wilkinson
With 43 households falling in the category, the $50,000 to $74,999 income range is the most frequent in Wilkinson, accounting for 23.8% of all households. In contrast, only 3 households (1.7%) fall into the $150,000 to $199,999 income bracket, making it the least populous group.
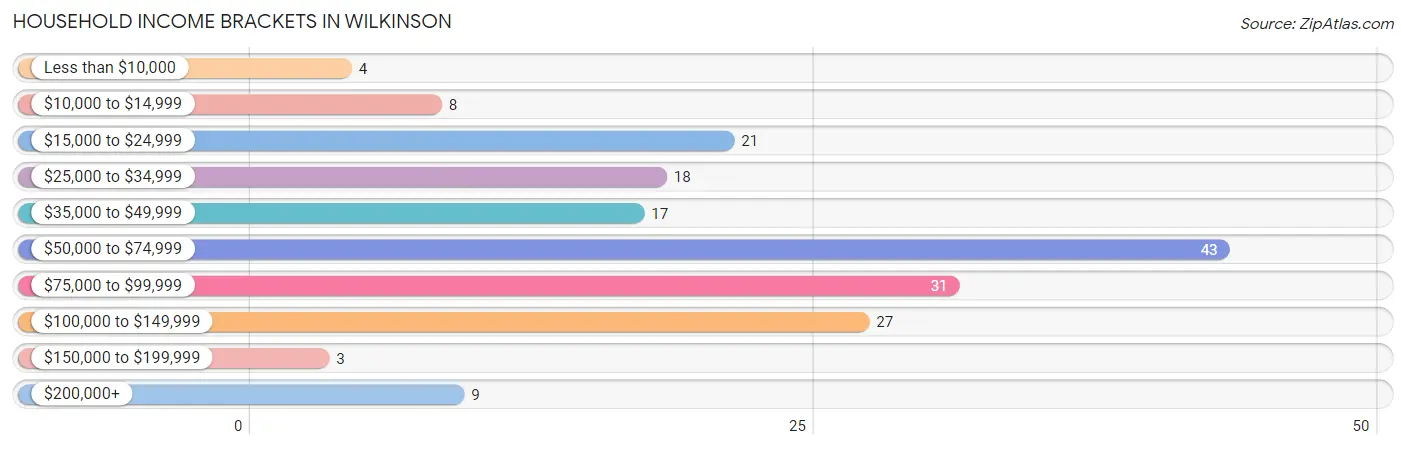
| Income Bracket | # Households | % Households |
| Less than $10,000 | 4 | 2.2% |
| $10,000 to $14,999 | 8 | 4.4% |
| $15,000 to $24,999 | 21 | 11.6% |
| $25,000 to $34,999 | 18 | 9.9% |
| $35,000 to $49,999 | 17 | 9.4% |
| $50,000 to $74,999 | 43 | 23.8% |
| $75,000 to $99,999 | 31 | 17.1% |
| $100,000 to $149,999 | 27 | 14.9% |
| $150,000 to $199,999 | 3 | 1.7% |
| $200,000+ | 9 | 5.0% |
Household Income by Householder Age in Wilkinson
The median household income in Wilkinson is $61,146, with the highest median household income of $70,000 found in the 45 to 64 years age bracket for the primary householder. A total of 76 households (42.0%) fall into this category. Meanwhile, the 15 to 24 years age bracket for the primary householder has the lowest median household income of $0, with 9 households (5.0%) in this group.
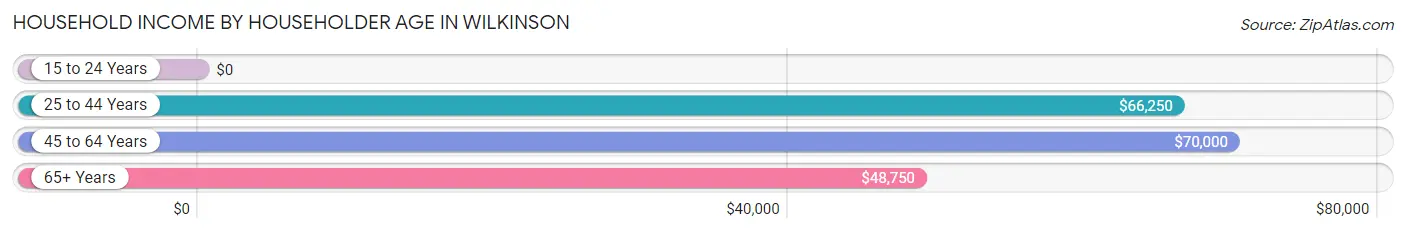
| Income Bracket | # Households | Median Income |
| 15 to 24 Years | 9 (5.0%) | $0 |
| 25 to 44 Years | 63 (34.8%) | $66,250 |
| 45 to 64 Years | 76 (42.0%) | $70,000 |
| 65+ Years | 33 (18.2%) | $48,750 |
| Total | 181 (100.0%) | $61,146 |
Poverty in Wilkinson
Income Below Poverty by Sex and Age in Wilkinson
With 8.2% poverty level for males and 10.2% for females among the residents of Wilkinson, 25 to 34 year old males and 35 to 44 year old females are the most vulnerable to poverty, with 10 males (17.5%) and 8 females (33.3%) in their respective age groups living below the poverty level.
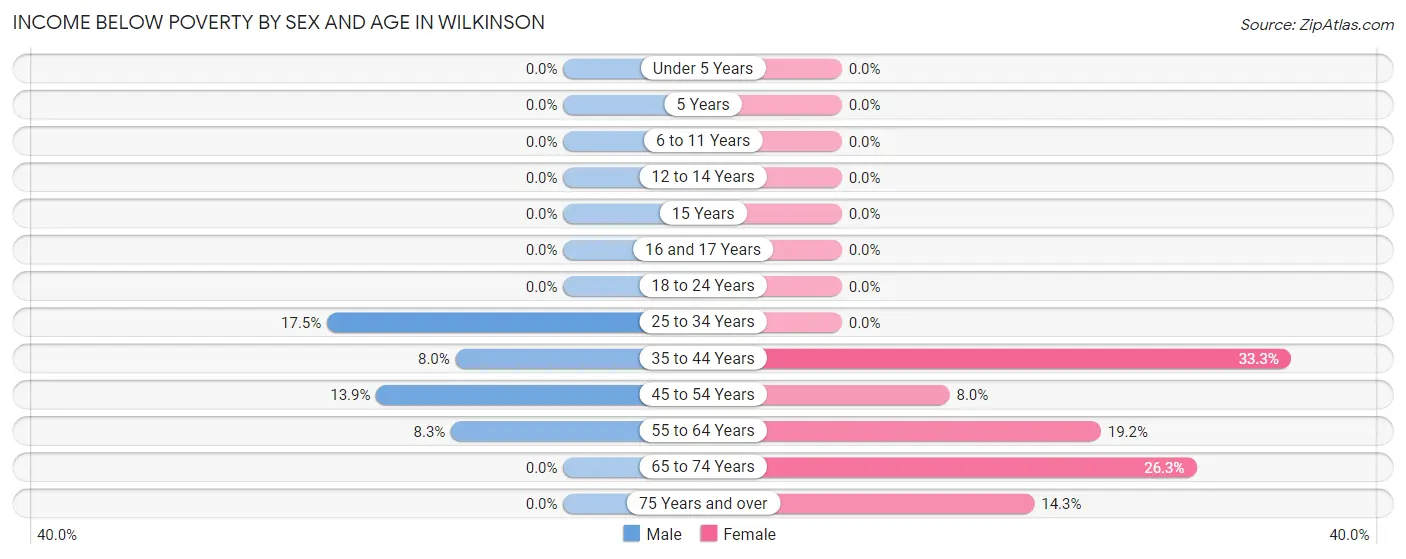
| Age Bracket | Male | Female |
| Under 5 Years | 0 (0.0%) | 0 (0.0%) |
| 5 Years | 0 (0.0%) | 0 (0.0%) |
| 6 to 11 Years | 0 (0.0%) | 0 (0.0%) |
| 12 to 14 Years | 0 (0.0%) | 0 (0.0%) |
| 15 Years | 0 (0.0%) | 0 (0.0%) |
| 16 and 17 Years | 0 (0.0%) | 0 (0.0%) |
| 18 to 24 Years | 0 (0.0%) | 0 (0.0%) |
| 25 to 34 Years | 10 (17.5%) | 0 (0.0%) |
| 35 to 44 Years | 2 (8.0%) | 8 (33.3%) |
| 45 to 54 Years | 5 (13.9%) | 2 (8.0%) |
| 55 to 64 Years | 2 (8.3%) | 5 (19.2%) |
| 65 to 74 Years | 0 (0.0%) | 5 (26.3%) |
| 75 Years and over | 0 (0.0%) | 1 (14.3%) |
| Total | 19 (8.2%) | 21 (10.2%) |
Income Above Poverty by Sex and Age in Wilkinson
According to the poverty statistics in Wilkinson, males aged under 5 years and females aged under 5 years are the age groups that are most secure financially, with 100.0% of males and 100.0% of females in these age groups living above the poverty line.
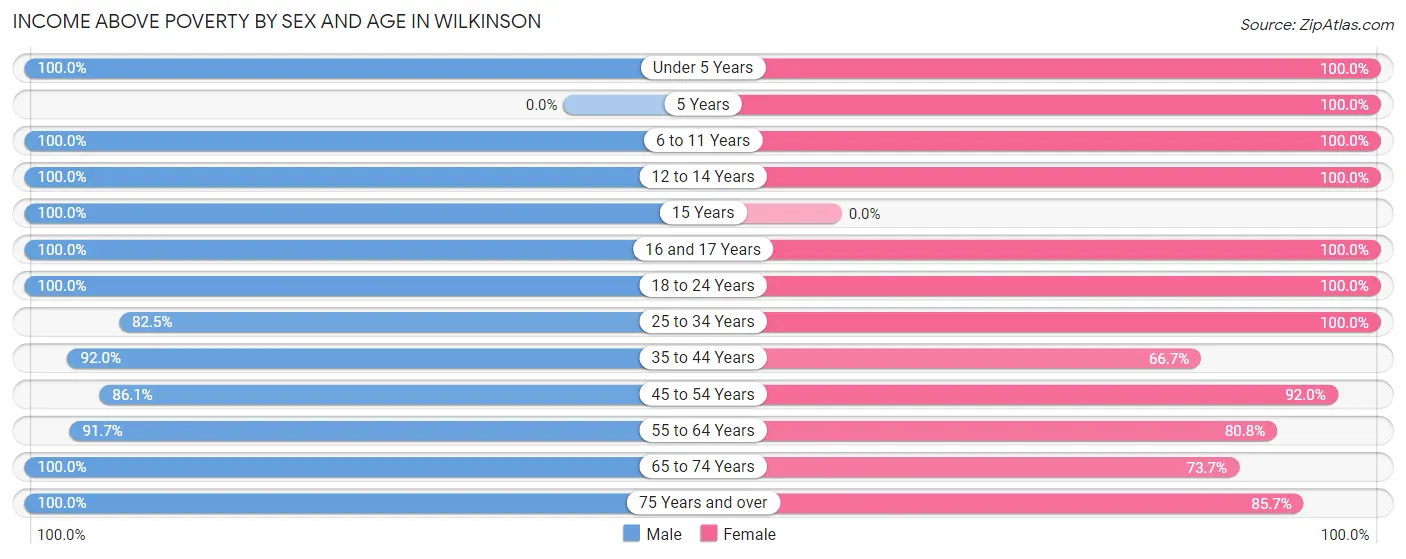
| Age Bracket | Male | Female |
| Under 5 Years | 7 (100.0%) | 28 (100.0%) |
| 5 Years | 0 (0.0%) | 7 (100.0%) |
| 6 to 11 Years | 22 (100.0%) | 9 (100.0%) |
| 12 to 14 Years | 16 (100.0%) | 7 (100.0%) |
| 15 Years | 3 (100.0%) | 0 (0.0%) |
| 16 and 17 Years | 9 (100.0%) | 1 (100.0%) |
| 18 to 24 Years | 18 (100.0%) | 16 (100.0%) |
| 25 to 34 Years | 47 (82.5%) | 36 (100.0%) |
| 35 to 44 Years | 23 (92.0%) | 16 (66.7%) |
| 45 to 54 Years | 31 (86.1%) | 23 (92.0%) |
| 55 to 64 Years | 22 (91.7%) | 21 (80.8%) |
| 65 to 74 Years | 9 (100.0%) | 14 (73.7%) |
| 75 Years and over | 5 (100.0%) | 6 (85.7%) |
| Total | 212 (91.8%) | 184 (89.8%) |
Income Below Poverty Among Married-Couple Families in Wilkinson
The poverty statistics for married-couple families in Wilkinson show that 2.8% or 2 of the total 72 families live below the poverty line. Families with no children have the highest poverty rate of 4.6%, comprising of 2 families. On the other hand, families with 1 or 2 children have the lowest poverty rate of 0.0%, which includes 0 families.
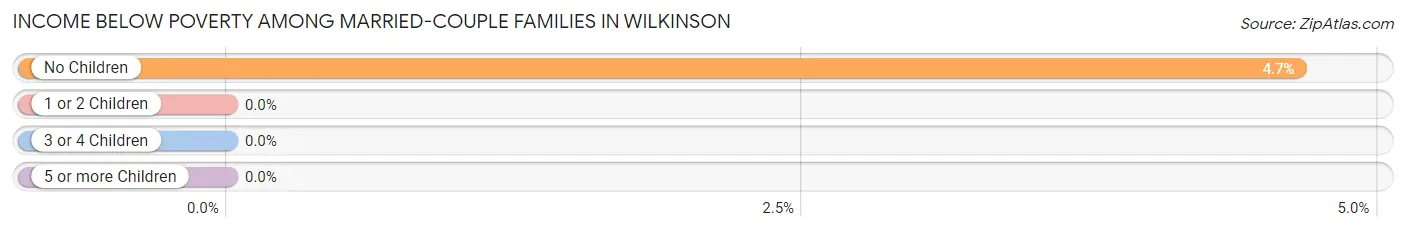
| Children | Above Poverty | Below Poverty |
| No Children | 41 (95.4%) | 2 (4.6%) |
| 1 or 2 Children | 21 (100.0%) | 0 (0.0%) |
| 3 or 4 Children | 6 (100.0%) | 0 (0.0%) |
| 5 or more Children | 2 (100.0%) | 0 (0.0%) |
| Total | 70 (97.2%) | 2 (2.8%) |
Income Below Poverty Among Single-Parent Households in Wilkinson
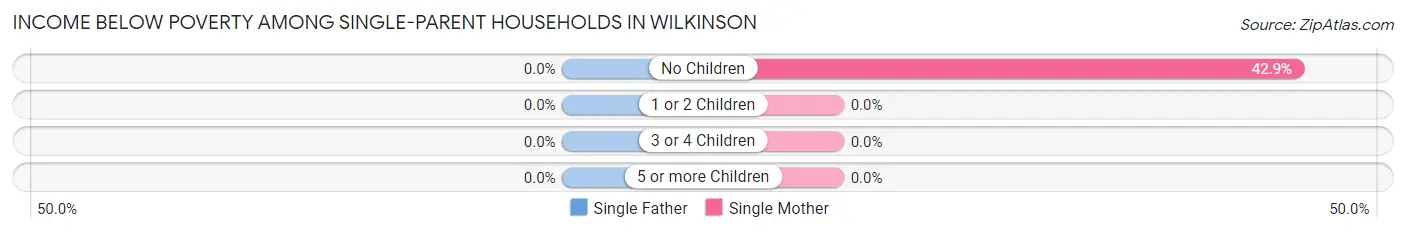
| Children | Single Father | Single Mother |
| No Children | 0 (0.0%) | 6 (42.9%) |
| 1 or 2 Children | 0 (0.0%) | 0 (0.0%) |
| 3 or 4 Children | 0 (0.0%) | 0 (0.0%) |
| 5 or more Children | 0 (0.0%) | 0 (0.0%) |
| Total | 0 (0.0%) | 6 (37.5%) |
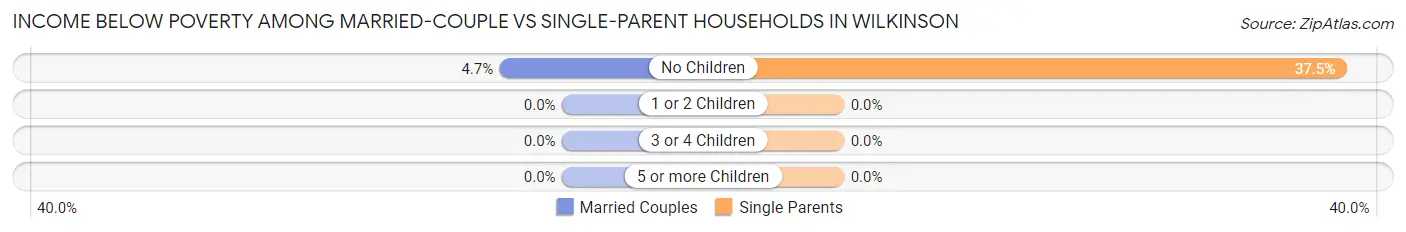
Income Below Poverty Among Married-Couple vs Single-Parent Households in Wilkinson
The poverty data for Wilkinson shows that 2 of the married-couple family households (2.8%) and 6 of the single-parent households (20.0%) are living below the poverty level. Within the married-couple family households, those with no children have the highest poverty rate, with 2 households (4.6%) falling below the poverty line. Among the single-parent households, those with no children have the highest poverty rate, with 6 household (37.5%) living below poverty.
| Children | Married-Couple Families | Single-Parent Households |
| No Children | 2 (4.6%) | 6 (37.5%) |
| 1 or 2 Children | 0 (0.0%) | 0 (0.0%) |
| 3 or 4 Children | 0 (0.0%) | 0 (0.0%) |
| 5 or more Children | 0 (0.0%) | 0 (0.0%) |
| Total | 2 (2.8%) | 6 (20.0%) |
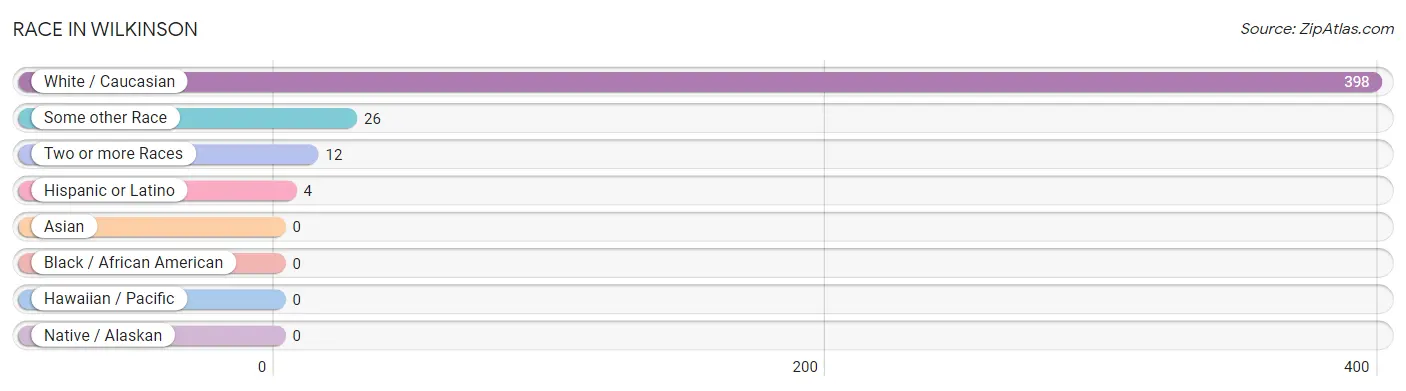
Race in Wilkinson
The most populous races in Wilkinson are White / Caucasian (398 | 91.3%), Some other Race (26 | 6.0%), and Two or more Races (12 | 2.8%).
| Race | # Population | % Population |
| Asian | 0 | 0.0% |
| Black / African American | 0 | 0.0% |
| Hawaiian / Pacific | 0 | 0.0% |
| Hispanic or Latino | 4 | 0.9% |
| Native / Alaskan | 0 | 0.0% |
| White / Caucasian | 398 | 91.3% |
| Two or more Races | 12 | 2.8% |
| Some other Race | 26 | 6.0% |
| Total | 436 | 100.0% |
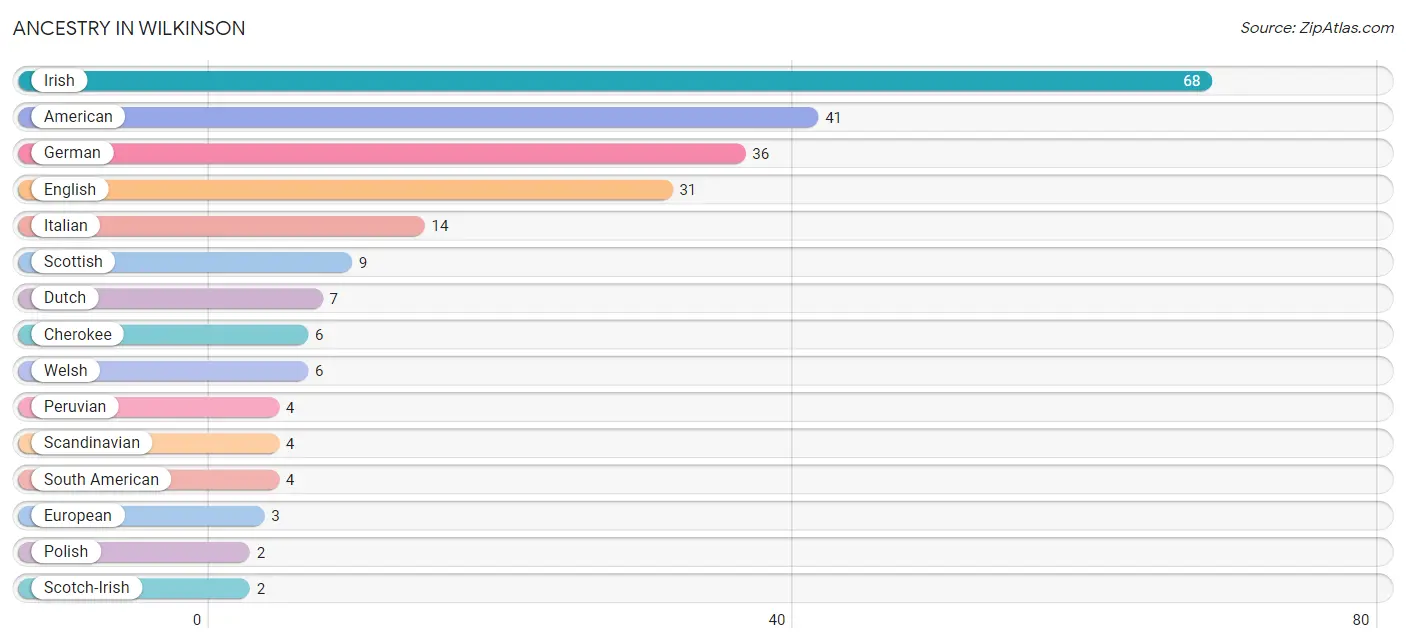
Ancestry in Wilkinson
The most populous ancestries reported in Wilkinson are Irish (68 | 15.6%), American (41 | 9.4%), German (36 | 8.3%), English (31 | 7.1%), and Italian (14 | 3.2%), together accounting for 43.6% of all Wilkinson residents.
| Ancestry | # Population | % Population |
| American | 41 | 9.4% |
| Cherokee | 6 | 1.4% |
| Dutch | 7 | 1.6% |
| English | 31 | 7.1% |
| European | 3 | 0.7% |
| German | 36 | 8.3% |
| Irish | 68 | 15.6% |
| Italian | 14 | 3.2% |
| Northern European | 1 | 0.2% |
| Peruvian | 4 | 0.9% |
| Polish | 2 | 0.5% |
| Scandinavian | 4 | 0.9% |
| Scotch-Irish | 2 | 0.5% |
| Scottish | 9 | 2.1% |
| Slovak | 1 | 0.2% |
| South American | 4 | 0.9% |
| Swiss | 1 | 0.2% |
| Welsh | 6 | 1.4% | View All 18 Rows |
Immigrants in Wilkinson
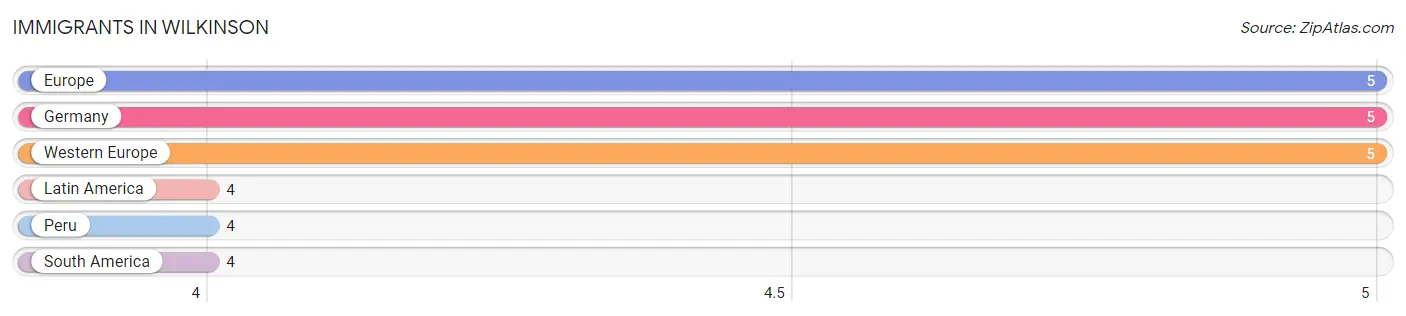
The most numerous immigrant groups reported in Wilkinson came from Europe (5 | 1.1%), Germany (5 | 1.1%), Western Europe (5 | 1.1%), Latin America (4 | 0.9%), and Peru (4 | 0.9%), together accounting for 5.3% of all Wilkinson residents.
| Immigration Origin | # Population | % Population |
| Europe | 5 | 1.1% |
| Germany | 5 | 1.1% |
| Latin America | 4 | 0.9% |
| Peru | 4 | 0.9% |
| South America | 4 | 0.9% |
| Western Europe | 5 | 1.1% | View All 6 Rows |
Sex and Age in Wilkinson
Sex and Age in Wilkinson
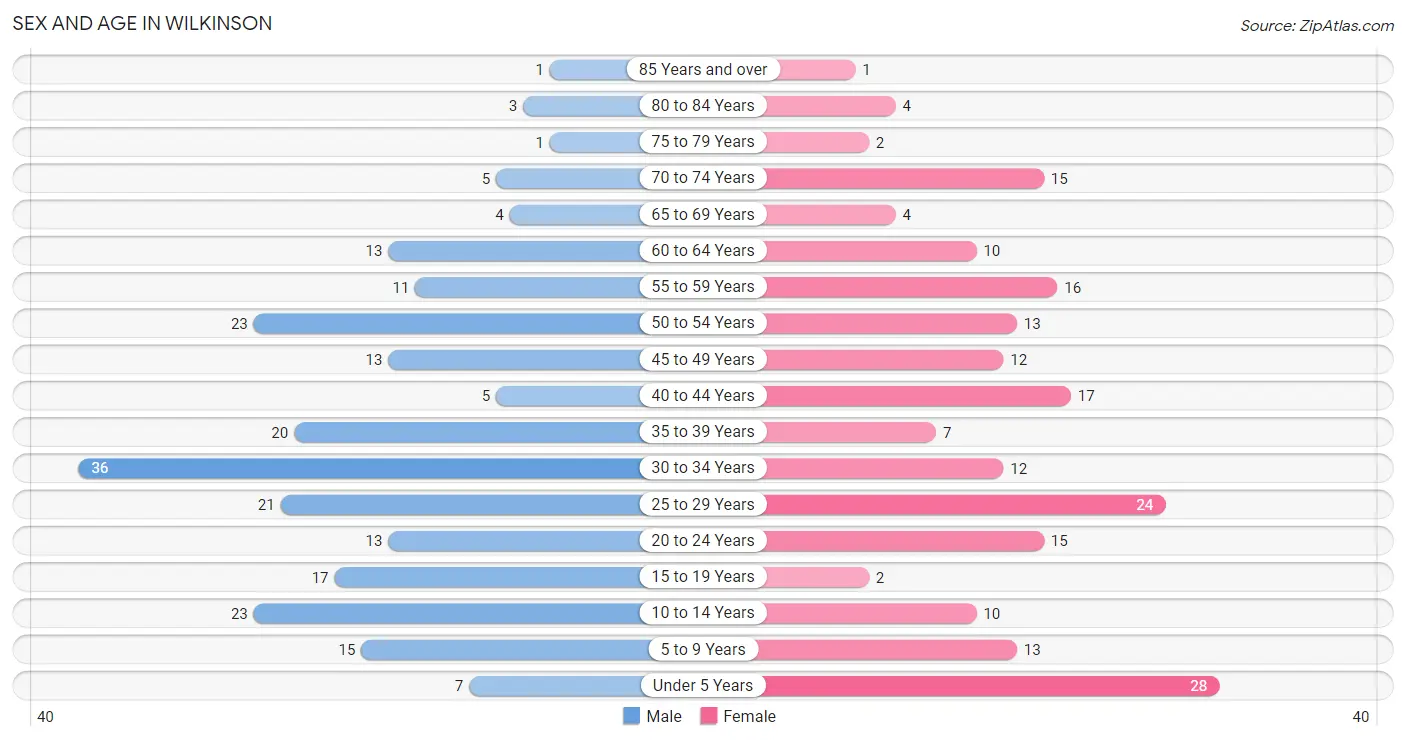
The most populous age groups in Wilkinson are 30 to 34 Years (36 | 15.6%) for men and Under 5 Years (28 | 13.7%) for women.
| Age Bracket | Male | Female |
| Under 5 Years | 7 (3.0%) | 28 (13.7%) |
| 5 to 9 Years | 15 (6.5%) | 13 (6.3%) |
| 10 to 14 Years | 23 (10.0%) | 10 (4.9%) |
| 15 to 19 Years | 17 (7.4%) | 2 (1.0%) |
| 20 to 24 Years | 13 (5.6%) | 15 (7.3%) |
| 25 to 29 Years | 21 (9.1%) | 24 (11.7%) |
| 30 to 34 Years | 36 (15.6%) | 12 (5.9%) |
| 35 to 39 Years | 20 (8.7%) | 7 (3.4%) |
| 40 to 44 Years | 5 (2.2%) | 17 (8.3%) |
| 45 to 49 Years | 13 (5.6%) | 12 (5.9%) |
| 50 to 54 Years | 23 (10.0%) | 13 (6.3%) |
| 55 to 59 Years | 11 (4.8%) | 16 (7.8%) |
| 60 to 64 Years | 13 (5.6%) | 10 (4.9%) |
| 65 to 69 Years | 4 (1.7%) | 4 (1.9%) |
| 70 to 74 Years | 5 (2.2%) | 15 (7.3%) |
| 75 to 79 Years | 1 (0.4%) | 2 (1.0%) |
| 80 to 84 Years | 3 (1.3%) | 4 (1.9%) |
| 85 Years and over | 1 (0.4%) | 1 (0.5%) |
| Total | 231 (100.0%) | 205 (100.0%) |
Families and Households in Wilkinson
Median Family Size in Wilkinson
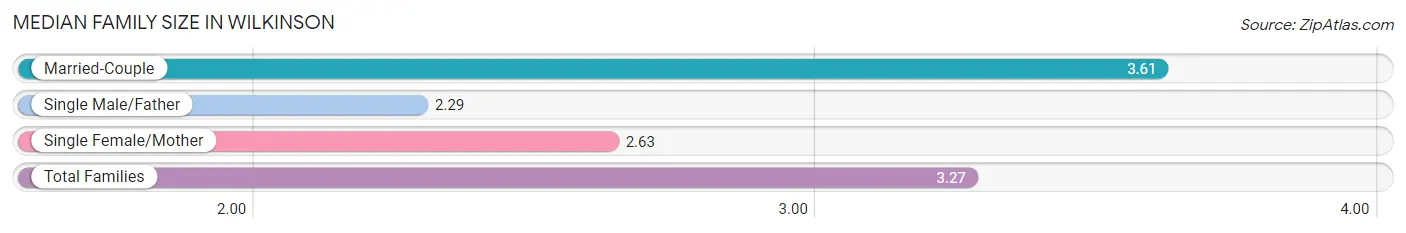
The median family size in Wilkinson is 3.27 persons per family, with married-couple families (72 | 70.6%) accounting for the largest median family size of 3.61 persons per family. On the other hand, single male/father families (14 | 13.7%) represent the smallest median family size with 2.29 persons per family.
| Family Type | # Families | Family Size |
| Married-Couple | 72 (70.6%) | 3.61 |
| Single Male/Father | 14 (13.7%) | 2.29 |
| Single Female/Mother | 16 (15.7%) | 2.63 |
| Total Families | 102 (100.0%) | 3.27 |
Median Household Size in Wilkinson
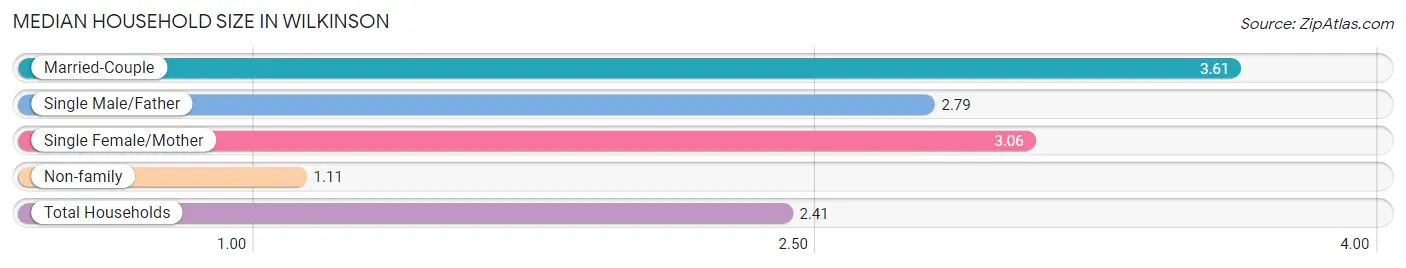
The median household size in Wilkinson is 2.41 persons per household, with married-couple households (72 | 39.8%) accounting for the largest median household size of 3.61 persons per household. non-family households (79 | 43.6%) represent the smallest median household size with 1.11 persons per household.
| Household Type | # Households | Household Size |
| Married-Couple | 72 (39.8%) | 3.61 |
| Single Male/Father | 14 (7.7%) | 2.79 |
| Single Female/Mother | 16 (8.8%) | 3.06 |
| Non-family | 79 (43.6%) | 1.11 |
| Total Households | 181 (100.0%) | 2.41 |
Household Size by Marriage Status in Wilkinson
Out of a total of 181 households in Wilkinson, 102 (56.4%) are family households, while 79 (43.6%) are nonfamily households. The most numerous type of family households are 2-person households, comprising 41, and the most common type of nonfamily households are 1-person households, comprising 68.
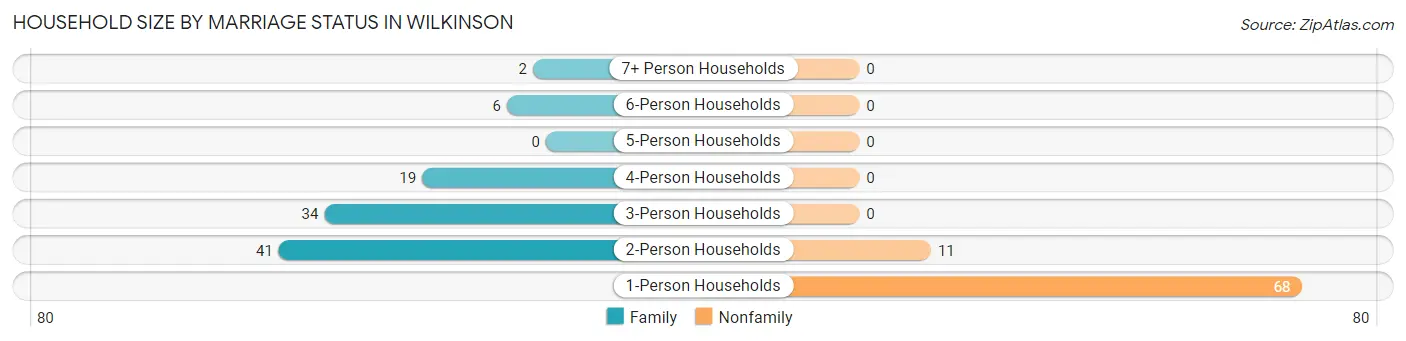
| Household Size | Family Households | Nonfamily Households |
| 1-Person Households | - | 68 (37.6%) |
| 2-Person Households | 41 (22.7%) | 11 (6.1%) |
| 3-Person Households | 34 (18.8%) | 0 (0.0%) |
| 4-Person Households | 19 (10.5%) | 0 (0.0%) |
| 5-Person Households | 0 (0.0%) | 0 (0.0%) |
| 6-Person Households | 6 (3.3%) | 0 (0.0%) |
| 7+ Person Households | 2 (1.1%) | 0 (0.0%) |
| Total | 102 (56.4%) | 79 (43.6%) |
Female Fertility in Wilkinson
Fertility by Age in Wilkinson
Average fertility rate in Wilkinson is 183.0 births per 1,000 women. Women in the age bracket of 20 to 34 years have the highest fertility rate with 333.0 births per 1,000 women. Women in the age bracket of 20 to 34 years acount for 100.0% of all women with births.
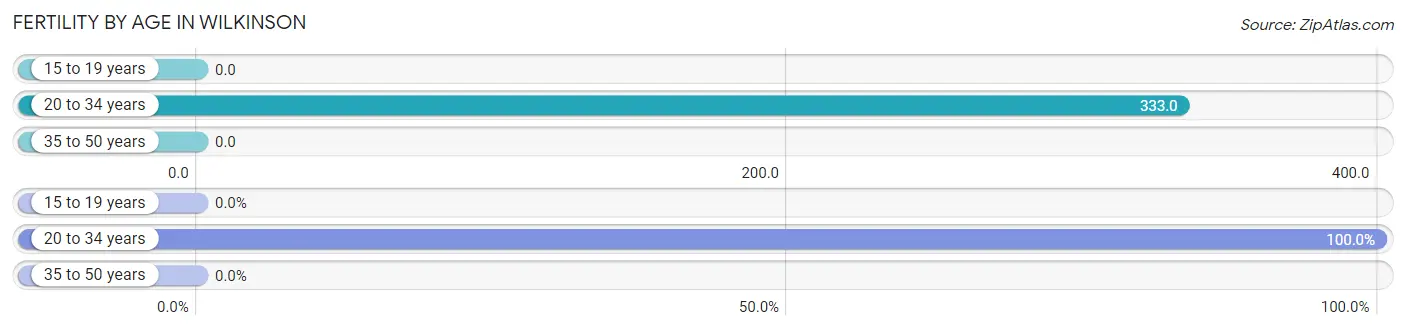
| Age Bracket | Women with Births | Births / 1,000 Women |
| 15 to 19 years | 0 (0.0%) | 0.0 |
| 20 to 34 years | 17 (100.0%) | 333.0 |
| 35 to 50 years | 0 (0.0%) | 0.0 |
| Total | 17 (100.0%) | 183.0 |
Fertility by Age by Marriage Status in Wilkinson
58.8% of women with births (17) in Wilkinson are married. The highest percentage of unmarried women with births falls into 20 to 34 years age bracket with 41.2% of them unmarried at the time of birth, while the lowest percentage of unmarried women with births belong to 20 to 34 years age bracket with 41.2% of them unmarried.
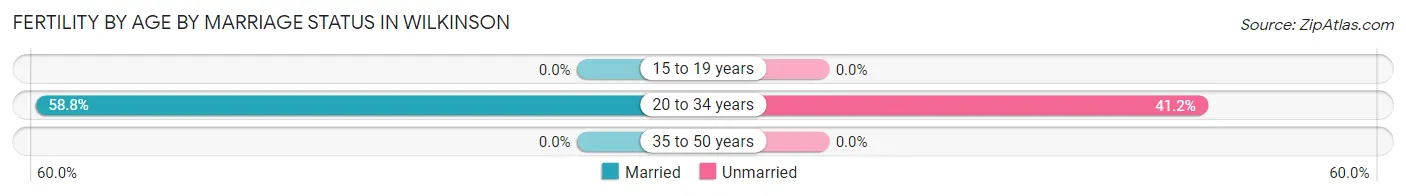
| Age Bracket | Married | Unmarried |
| 15 to 19 years | 0 (0.0%) | 0 (0.0%) |
| 20 to 34 years | 10 (58.8%) | 7 (41.2%) |
| 35 to 50 years | 0 (0.0%) | 0 (0.0%) |
| Total | 10 (58.8%) | 7 (41.2%) |
Fertility by Education in Wilkinson
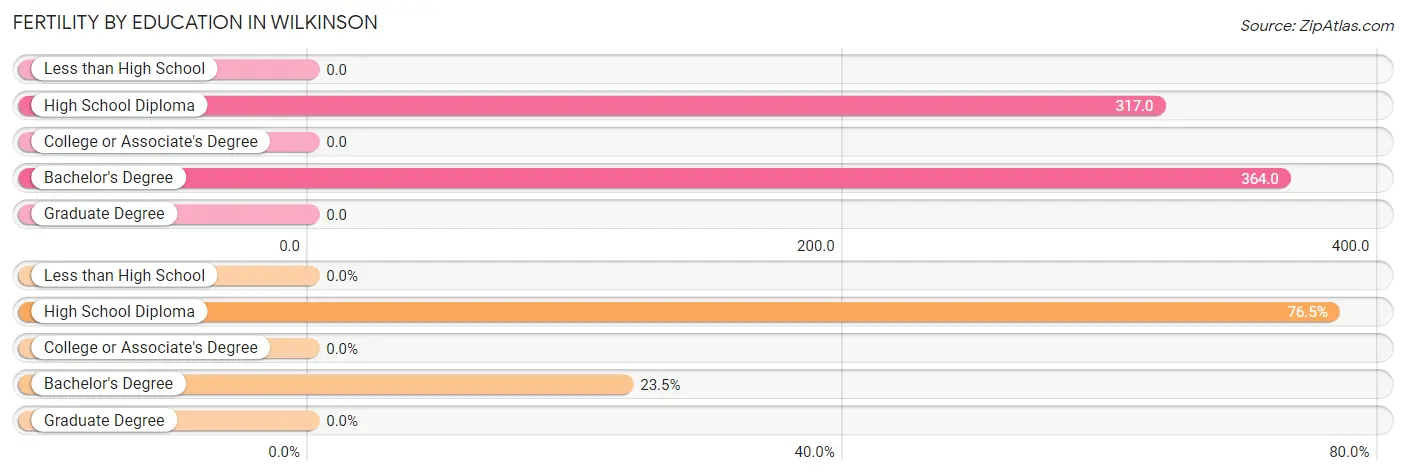
| Educational Attainment | Women with Births | Births / 1,000 Women |
| Less than High School | 0 (0.0%) | 0.0 |
| High School Diploma | 13 (76.5%) | 317.0 |
| College or Associate's Degree | 0 (0.0%) | 0.0 |
| Bachelor's Degree | 4 (23.5%) | 364.0 |
| Graduate Degree | 0 (0.0%) | 0.0 |
| Total | 17 (100.0%) | 183.0 |
Fertility by Education by Marriage Status in Wilkinson
41.2% of women with births in Wilkinson are unmarried. Women with the educational attainment of bachelor's degree are most likely to be married with 100.0% of them married at childbirth, while women with the educational attainment of high school diploma are least likely to be married with 53.8% of them unmarried at childbirth.
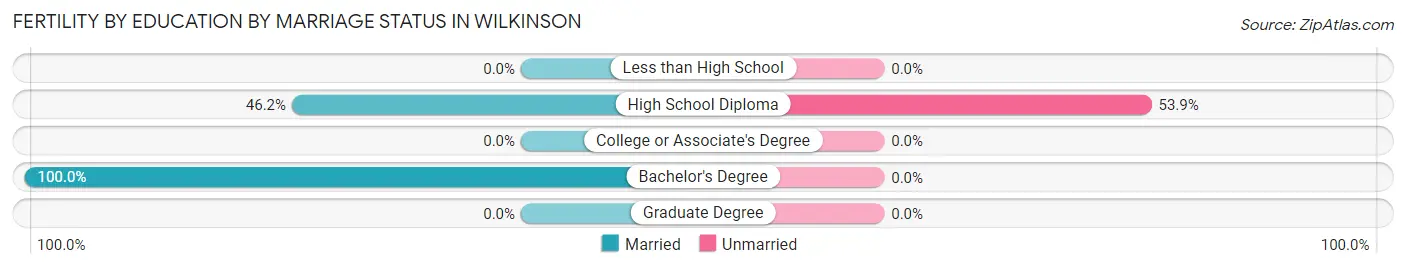
| Educational Attainment | Married | Unmarried |
| Less than High School | 0 (0.0%) | 0 (0.0%) |
| High School Diploma | 6 (46.2%) | 7 (53.8%) |
| College or Associate's Degree | 0 (0.0%) | 0 (0.0%) |
| Bachelor's Degree | 4 (100.0%) | 0 (0.0%) |
| Graduate Degree | 0 (0.0%) | 0 (0.0%) |
| Total | 10 (58.8%) | 7 (41.2%) |
Employment Characteristics in Wilkinson
Employment by Class of Employer in Wilkinson
Among the 241 employed individuals in Wilkinson, private company employees (194 | 80.5%), local government employees (25 | 10.4%), and self-employed (not incorporated) (12 | 5.0%) make up the most common classes of employment.
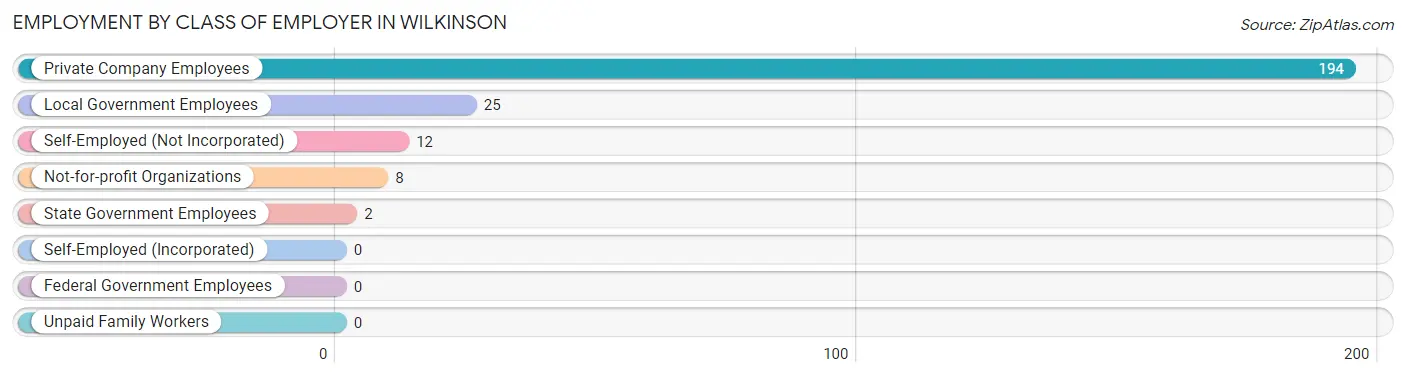
| Employer Class | # Employees | % Employees |
| Private Company Employees | 194 | 80.5% |
| Self-Employed (Incorporated) | 0 | 0.0% |
| Self-Employed (Not Incorporated) | 12 | 5.0% |
| Not-for-profit Organizations | 8 | 3.3% |
| Local Government Employees | 25 | 10.4% |
| State Government Employees | 2 | 0.8% |
| Federal Government Employees | 0 | 0.0% |
| Unpaid Family Workers | 0 | 0.0% |
| Total | 241 | 100.0% |
Employment Status by Age in Wilkinson
According to the labor force statistics for Wilkinson, out of the total population over 16 years of age (337), 75.7% or 255 individuals are in the labor force, with 0.8% or 2 of them unemployed. The age group with the highest labor force participation rate is 20 to 24 years, with 92.9% or 26 individuals in the labor force. Within the labor force, the 16 to 19 years age range has the highest percentage of unemployed individuals, with 16.7% or 2 of them being unemployed.
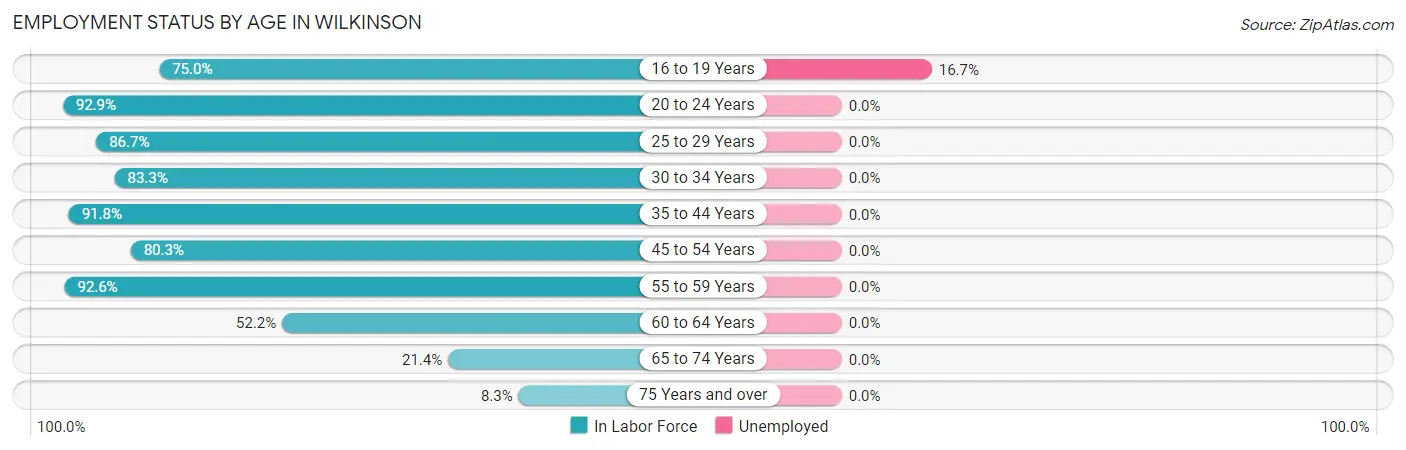
| Age Bracket | In Labor Force | Unemployed |
| 16 to 19 Years | 12 (75.0%) | 2 (16.7%) |
| 20 to 24 Years | 26 (92.9%) | 0 (0.0%) |
| 25 to 29 Years | 39 (86.7%) | 0 (0.0%) |
| 30 to 34 Years | 40 (83.3%) | 0 (0.0%) |
| 35 to 44 Years | 45 (91.8%) | 0 (0.0%) |
| 45 to 54 Years | 49 (80.3%) | 0 (0.0%) |
| 55 to 59 Years | 25 (92.6%) | 0 (0.0%) |
| 60 to 64 Years | 12 (52.2%) | 0 (0.0%) |
| 65 to 74 Years | 6 (21.4%) | 0 (0.0%) |
| 75 Years and over | 1 (8.3%) | 0 (0.0%) |
| Total | 255 (75.7%) | 2 (0.8%) |
Employment Status by Educational Attainment in Wilkinson
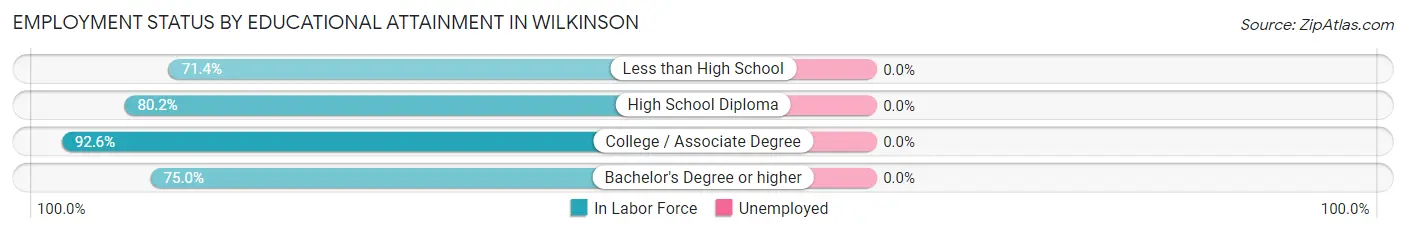
| Educational Attainment | In Labor Force | Unemployed |
| Less than High School | 10 (71.4%) | 0 (0.0%) |
| High School Diploma | 101 (80.2%) | 0 (0.0%) |
| College / Associate Degree | 75 (92.6%) | 0 (0.0%) |
| Bachelor's Degree or higher | 24 (75.0%) | 0 (0.0%) |
| Total | 210 (83.0%) | 0 (0.0%) |
Employment Occupations by Sex in Wilkinson
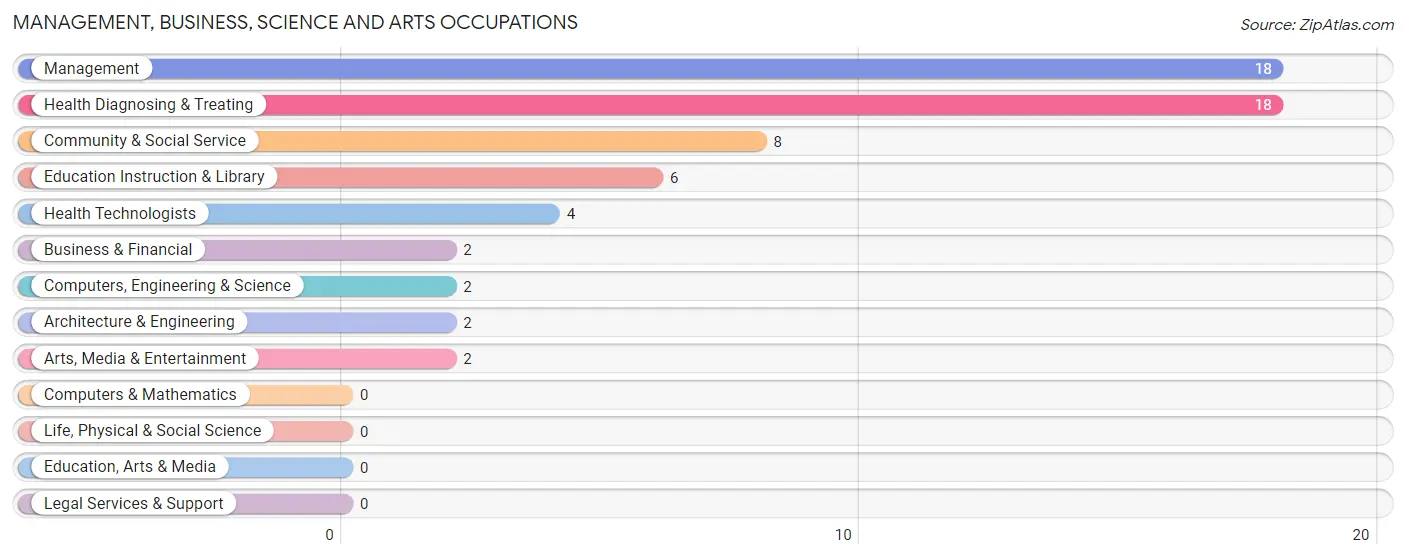
Management, Business, Science and Arts Occupations
The most common Management, Business, Science and Arts occupations in Wilkinson are Management (18 | 7.1%), Health Diagnosing & Treating (18 | 7.1%), Community & Social Service (8 | 3.2%), Education Instruction & Library (6 | 2.4%), and Health Technologists (4 | 1.6%).
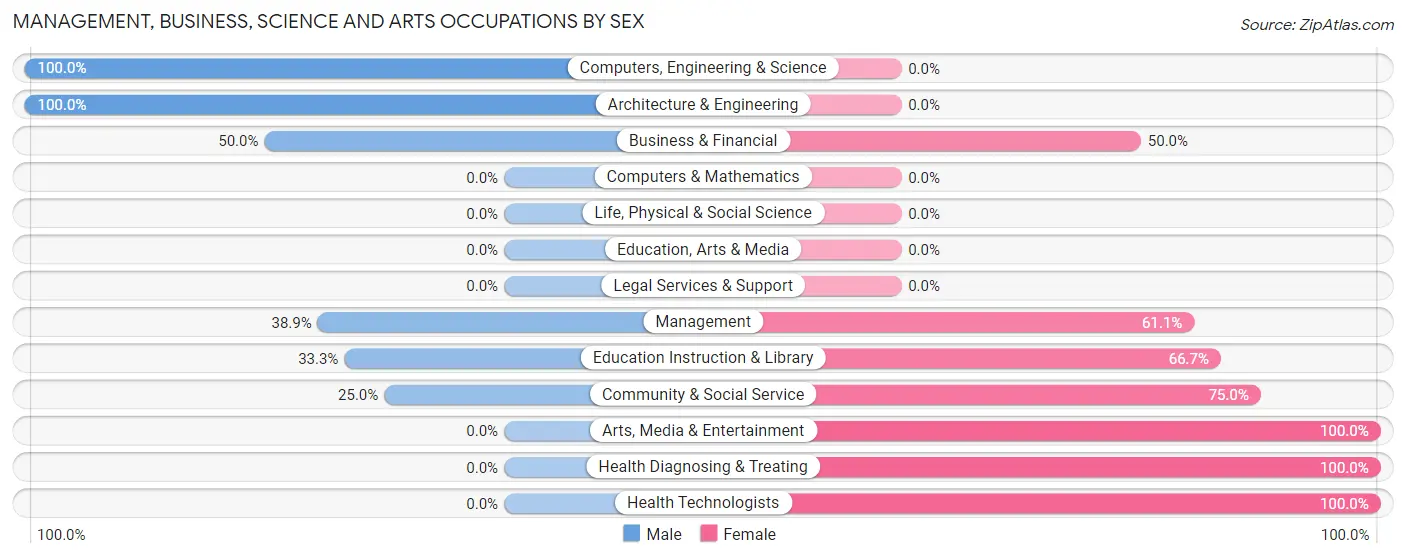
Management, Business, Science and Arts Occupations by Sex
Within the Management, Business, Science and Arts occupations in Wilkinson, the most male-oriented occupations are Computers, Engineering & Science (100.0%), Architecture & Engineering (100.0%), and Business & Financial (50.0%), while the most female-oriented occupations are Arts, Media & Entertainment (100.0%), Health Diagnosing & Treating (100.0%), and Health Technologists (100.0%).
| Occupation | Male | Female |
| Management | 7 (38.9%) | 11 (61.1%) |
| Business & Financial | 1 (50.0%) | 1 (50.0%) |
| Computers, Engineering & Science | 2 (100.0%) | 0 (0.0%) |
| Computers & Mathematics | 0 (0.0%) | 0 (0.0%) |
| Architecture & Engineering | 2 (100.0%) | 0 (0.0%) |
| Life, Physical & Social Science | 0 (0.0%) | 0 (0.0%) |
| Community & Social Service | 2 (25.0%) | 6 (75.0%) |
| Education, Arts & Media | 0 (0.0%) | 0 (0.0%) |
| Legal Services & Support | 0 (0.0%) | 0 (0.0%) |
| Education Instruction & Library | 2 (33.3%) | 4 (66.7%) |
| Arts, Media & Entertainment | 0 (0.0%) | 2 (100.0%) |
| Health Diagnosing & Treating | 0 (0.0%) | 18 (100.0%) |
| Health Technologists | 0 (0.0%) | 4 (100.0%) |
| Total (Category) | 12 (25.0%) | 36 (75.0%) |
| Total (Overall) | 135 (53.4%) | 118 (46.6%) |
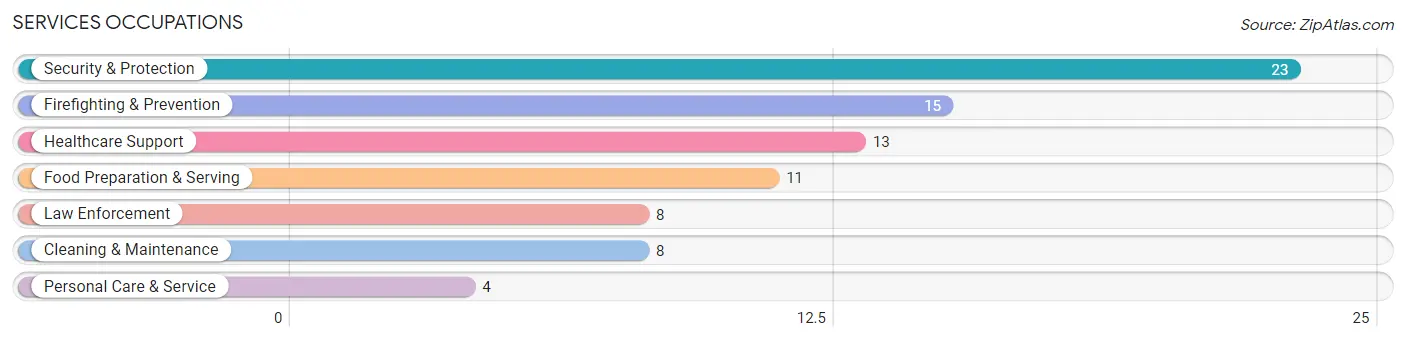
Services Occupations
The most common Services occupations in Wilkinson are Security & Protection (23 | 9.1%), Firefighting & Prevention (15 | 5.9%), Healthcare Support (13 | 5.1%), Food Preparation & Serving (11 | 4.3%), and Law Enforcement (8 | 3.2%).
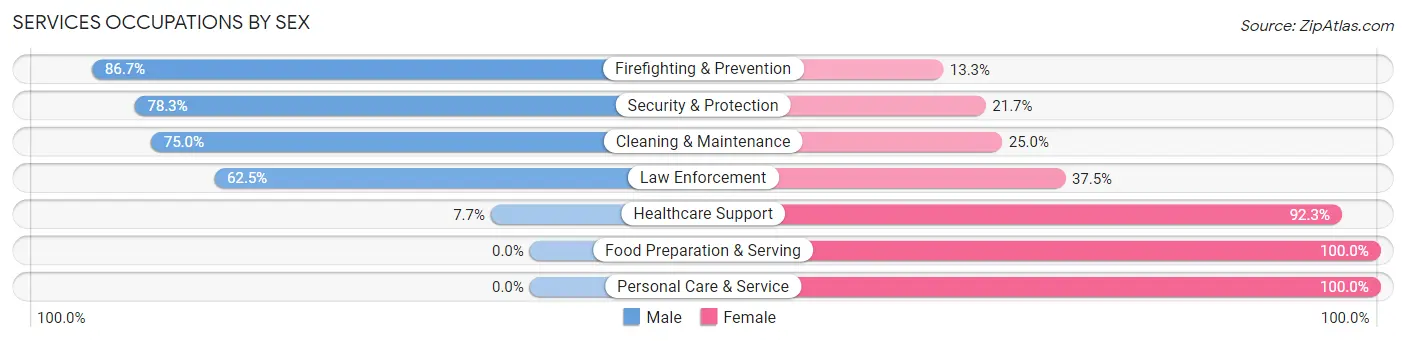
Services Occupations by Sex
Within the Services occupations in Wilkinson, the most male-oriented occupations are Firefighting & Prevention (86.7%), Security & Protection (78.3%), and Cleaning & Maintenance (75.0%), while the most female-oriented occupations are Food Preparation & Serving (100.0%), Personal Care & Service (100.0%), and Healthcare Support (92.3%).
| Occupation | Male | Female |
| Healthcare Support | 1 (7.7%) | 12 (92.3%) |
| Security & Protection | 18 (78.3%) | 5 (21.7%) |
| Firefighting & Prevention | 13 (86.7%) | 2 (13.3%) |
| Law Enforcement | 5 (62.5%) | 3 (37.5%) |
| Food Preparation & Serving | 0 (0.0%) | 11 (100.0%) |
| Cleaning & Maintenance | 6 (75.0%) | 2 (25.0%) |
| Personal Care & Service | 0 (0.0%) | 4 (100.0%) |
| Total (Category) | 25 (42.4%) | 34 (57.6%) |
| Total (Overall) | 135 (53.4%) | 118 (46.6%) |
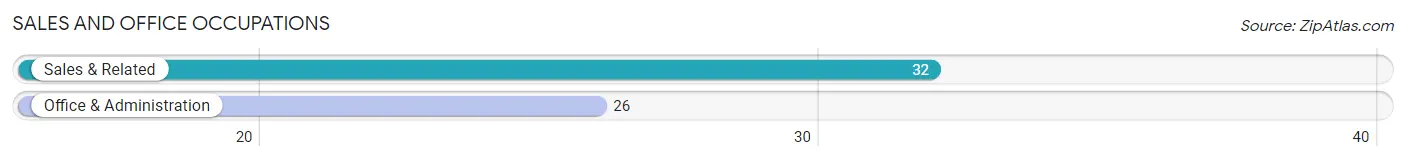
Sales and Office Occupations
The most common Sales and Office occupations in Wilkinson are Sales & Related (32 | 12.7%), and Office & Administration (26 | 10.3%).
Sales and Office Occupations by Sex
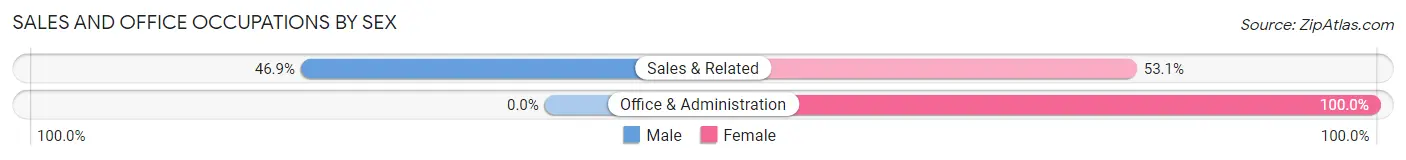
| Occupation | Male | Female |
| Sales & Related | 15 (46.9%) | 17 (53.1%) |
| Office & Administration | 0 (0.0%) | 26 (100.0%) |
| Total (Category) | 15 (25.9%) | 43 (74.1%) |
| Total (Overall) | 135 (53.4%) | 118 (46.6%) |
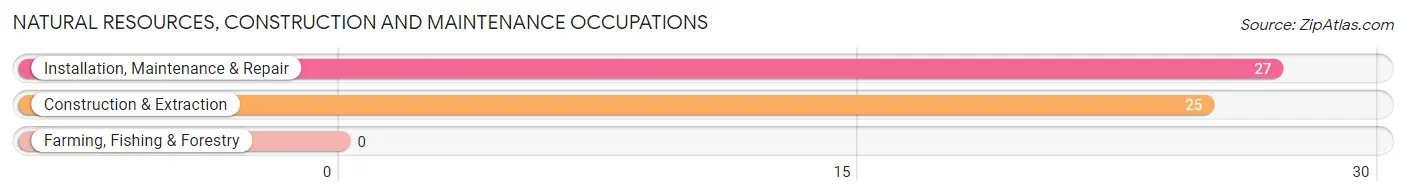
Natural Resources, Construction and Maintenance Occupations
The most common Natural Resources, Construction and Maintenance occupations in Wilkinson are Installation, Maintenance & Repair (27 | 10.7%), and Construction & Extraction (25 | 9.9%).
Natural Resources, Construction and Maintenance Occupations by Sex
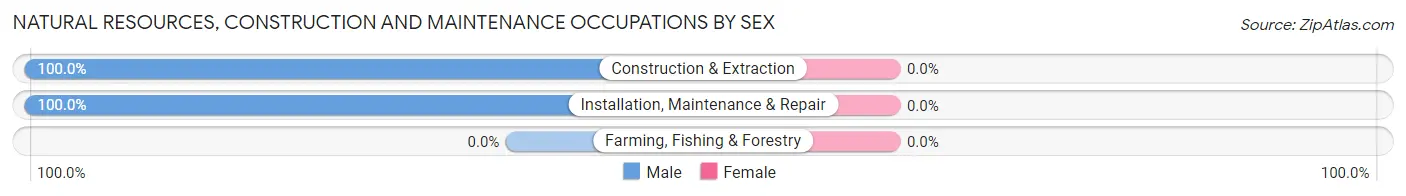
| Occupation | Male | Female |
| Farming, Fishing & Forestry | 0 (0.0%) | 0 (0.0%) |
| Construction & Extraction | 25 (100.0%) | 0 (0.0%) |
| Installation, Maintenance & Repair | 27 (100.0%) | 0 (0.0%) |
| Total (Category) | 52 (100.0%) | 0 (0.0%) |
| Total (Overall) | 135 (53.4%) | 118 (46.6%) |
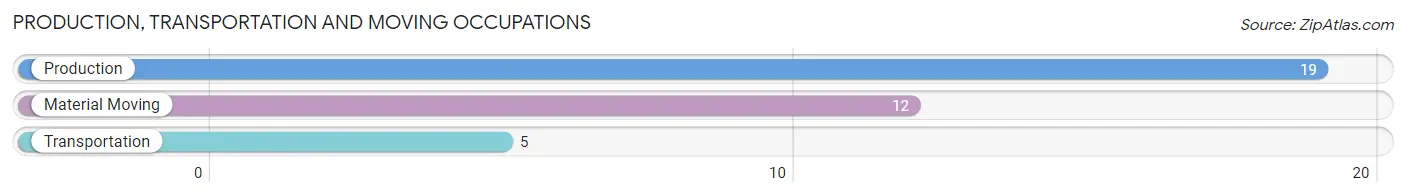
Production, Transportation and Moving Occupations
The most common Production, Transportation and Moving occupations in Wilkinson are Production (19 | 7.5%), Material Moving (12 | 4.7%), and Transportation (5 | 2.0%).
Production, Transportation and Moving Occupations by Sex
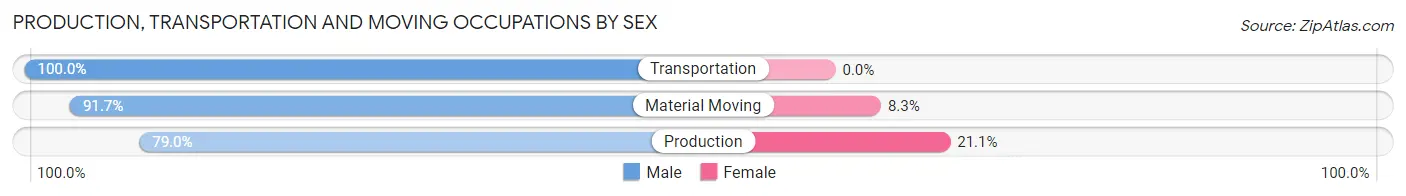
| Occupation | Male | Female |
| Production | 15 (78.9%) | 4 (21.0%) |
| Transportation | 5 (100.0%) | 0 (0.0%) |
| Material Moving | 11 (91.7%) | 1 (8.3%) |
| Total (Category) | 31 (86.1%) | 5 (13.9%) |
| Total (Overall) | 135 (53.4%) | 118 (46.6%) |
Employment Industries by Sex in Wilkinson
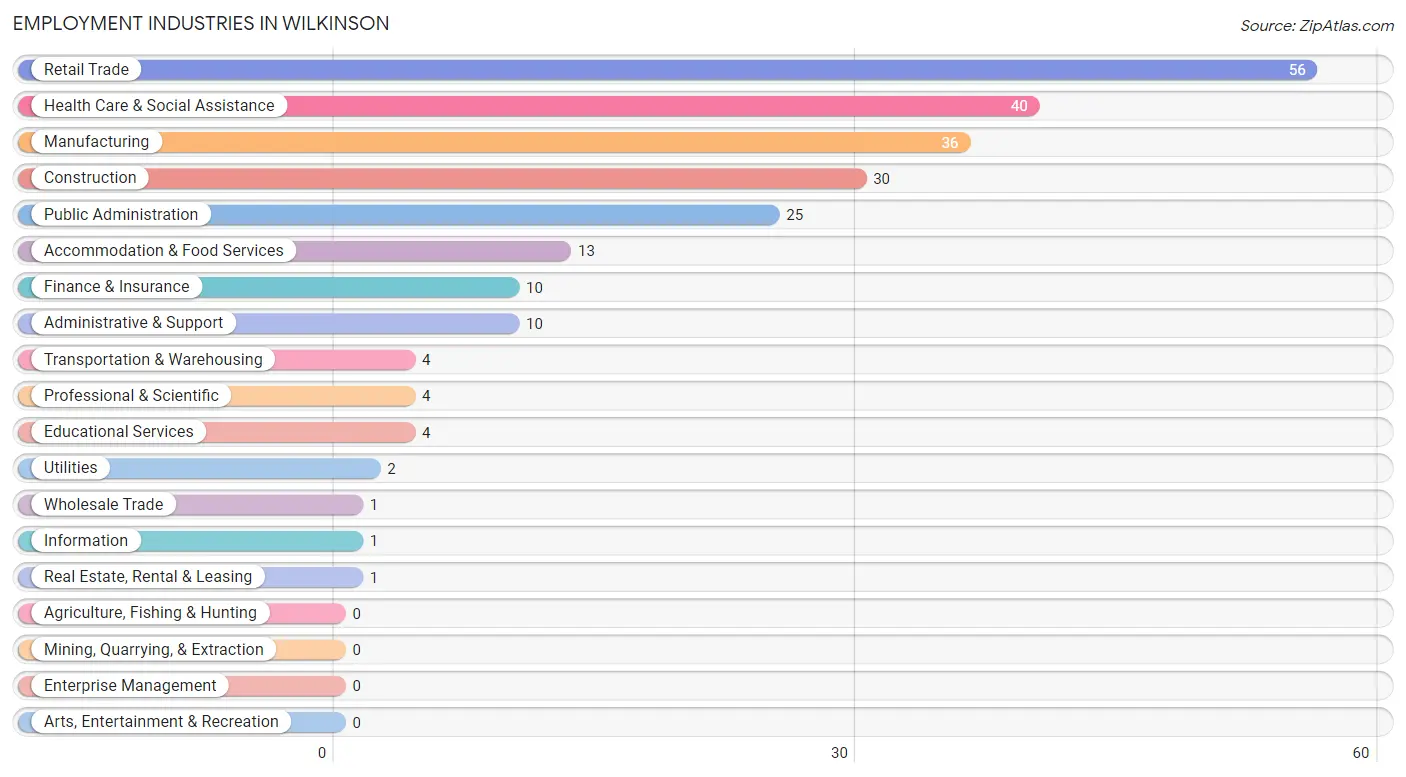
Employment Industries in Wilkinson
The major employment industries in Wilkinson include Retail Trade (56 | 22.1%), Health Care & Social Assistance (40 | 15.8%), Manufacturing (36 | 14.2%), Construction (30 | 11.9%), and Public Administration (25 | 9.9%).
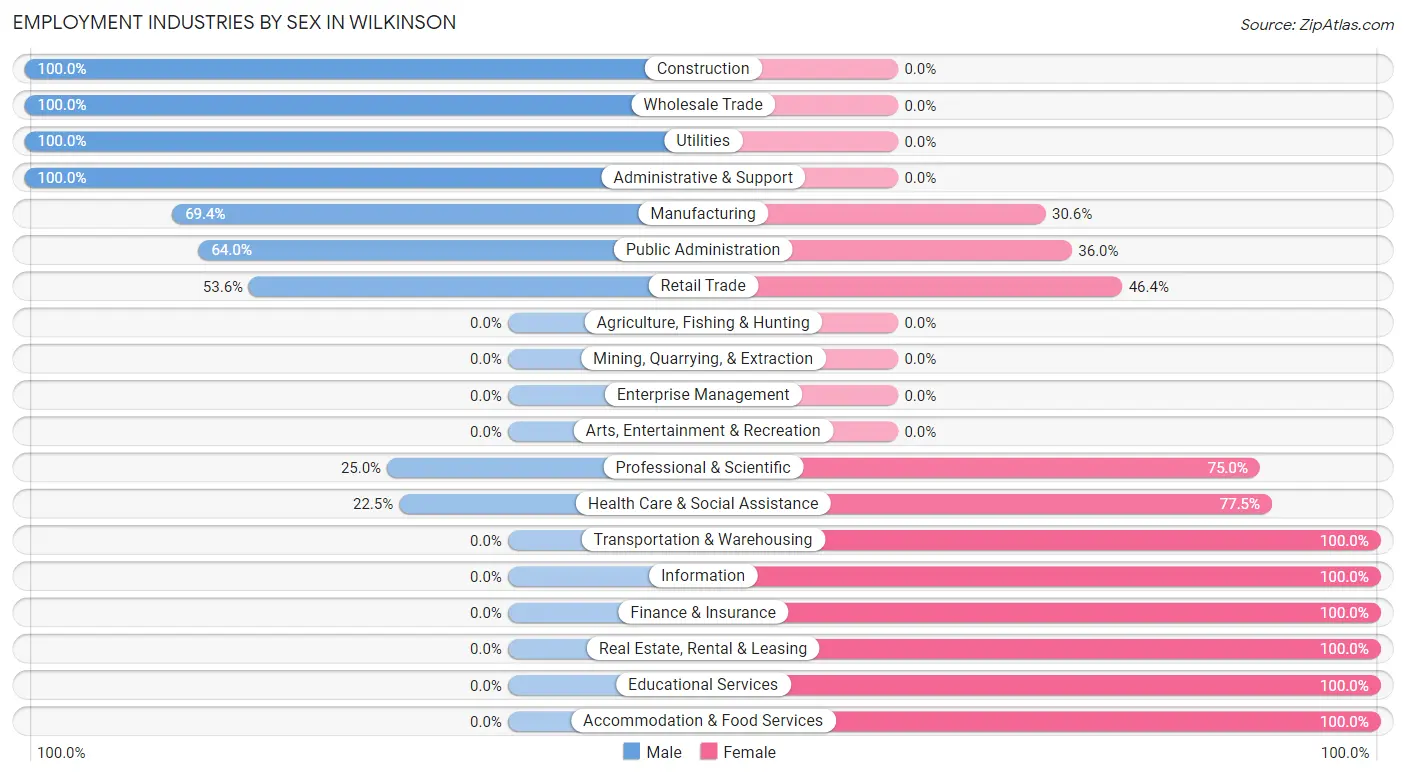
Employment Industries by Sex in Wilkinson
The Wilkinson industries that see more men than women are Construction (100.0%), Wholesale Trade (100.0%), and Utilities (100.0%), whereas the industries that tend to have a higher number of women are Transportation & Warehousing (100.0%), Information (100.0%), and Finance & Insurance (100.0%).
| Industry | Male | Female |
| Agriculture, Fishing & Hunting | 0 (0.0%) | 0 (0.0%) |
| Mining, Quarrying, & Extraction | 0 (0.0%) | 0 (0.0%) |
| Construction | 30 (100.0%) | 0 (0.0%) |
| Manufacturing | 25 (69.4%) | 11 (30.6%) |
| Wholesale Trade | 1 (100.0%) | 0 (0.0%) |
| Retail Trade | 30 (53.6%) | 26 (46.4%) |
| Transportation & Warehousing | 0 (0.0%) | 4 (100.0%) |
| Utilities | 2 (100.0%) | 0 (0.0%) |
| Information | 0 (0.0%) | 1 (100.0%) |
| Finance & Insurance | 0 (0.0%) | 10 (100.0%) |
| Real Estate, Rental & Leasing | 0 (0.0%) | 1 (100.0%) |
| Professional & Scientific | 1 (25.0%) | 3 (75.0%) |
| Enterprise Management | 0 (0.0%) | 0 (0.0%) |
| Administrative & Support | 10 (100.0%) | 0 (0.0%) |
| Educational Services | 0 (0.0%) | 4 (100.0%) |
| Health Care & Social Assistance | 9 (22.5%) | 31 (77.5%) |
| Arts, Entertainment & Recreation | 0 (0.0%) | 0 (0.0%) |
| Accommodation & Food Services | 0 (0.0%) | 13 (100.0%) |
| Public Administration | 16 (64.0%) | 9 (36.0%) |
| Total | 135 (53.4%) | 118 (46.6%) |
Education in Wilkinson
School Enrollment in Wilkinson
The most common levels of schooling among the 96 students in Wilkinson are middle school (32 | 33.3%), elementary school (21 | 21.9%), and college / undergraduate (20 | 20.8%).
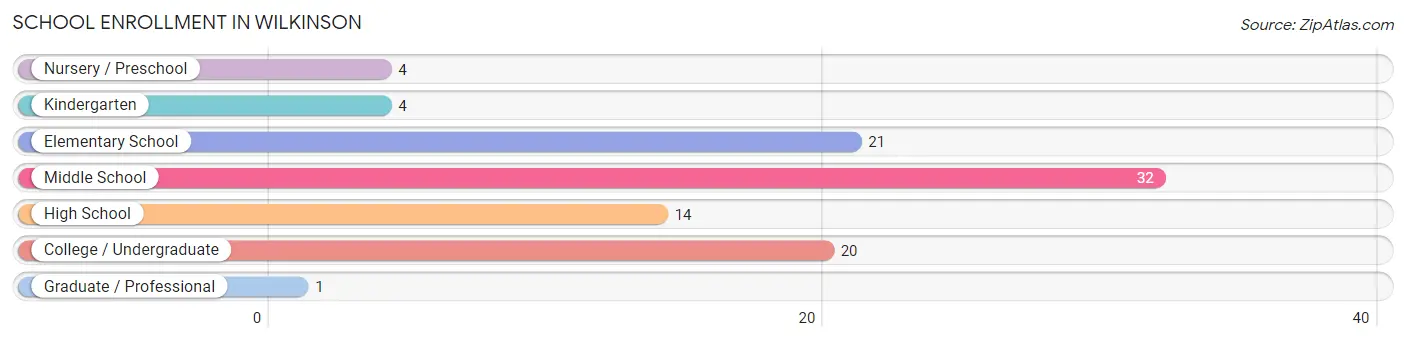
| School Level | # Students | % Students |
| Nursery / Preschool | 4 | 4.2% |
| Kindergarten | 4 | 4.2% |
| Elementary School | 21 | 21.9% |
| Middle School | 32 | 33.3% |
| High School | 14 | 14.6% |
| College / Undergraduate | 20 | 20.8% |
| Graduate / Professional | 1 | 1.0% |
| Total | 96 | 100.0% |
School Enrollment by Age by Funding Source in Wilkinson
Out of a total of 96 students who are enrolled in schools in Wilkinson, 32 (33.3%) attend a private institution, while the remaining 64 (66.7%) are enrolled in public schools. The age group of 3 to 4 year olds has the highest likelihood of being enrolled in private schools, with 4 (100.0% in the age bracket) enrolled. Conversely, the age group of 20 to 24 year olds has the lowest likelihood of being enrolled in a private school, with 9 (100.0% in the age bracket) attending a public institution.
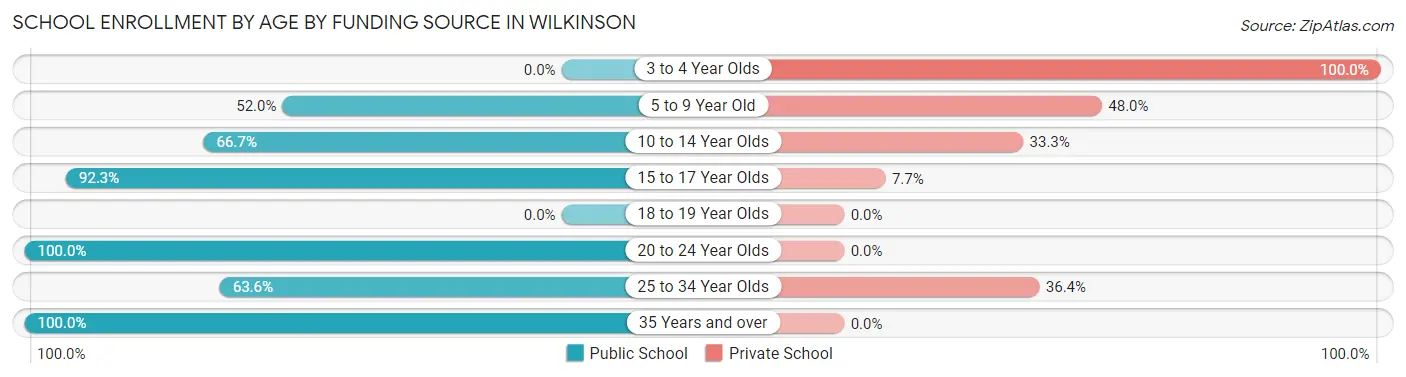
| Age Bracket | Public School | Private School |
| 3 to 4 Year Olds | 0 (0.0%) | 4 (100.0%) |
| 5 to 9 Year Old | 13 (52.0%) | 12 (48.0%) |
| 10 to 14 Year Olds | 22 (66.7%) | 11 (33.3%) |
| 15 to 17 Year Olds | 12 (92.3%) | 1 (7.7%) |
| 18 to 19 Year Olds | 0 (0.0%) | 0 (0.0%) |
| 20 to 24 Year Olds | 9 (100.0%) | 0 (0.0%) |
| 25 to 34 Year Olds | 7 (63.6%) | 4 (36.4%) |
| 35 Years and over | 1 (100.0%) | 0 (0.0%) |
| Total | 64 (66.7%) | 32 (33.3%) |
Educational Attainment by Field of Study in Wilkinson
Arts & humanities (10 | 27.8%), liberal arts & history (6 | 16.7%), education (5 | 13.9%), business (4 | 11.1%), and computers & mathematics (3 | 8.3%) are the most common fields of study among 36 individuals in Wilkinson who have obtained a bachelor's degree or higher.
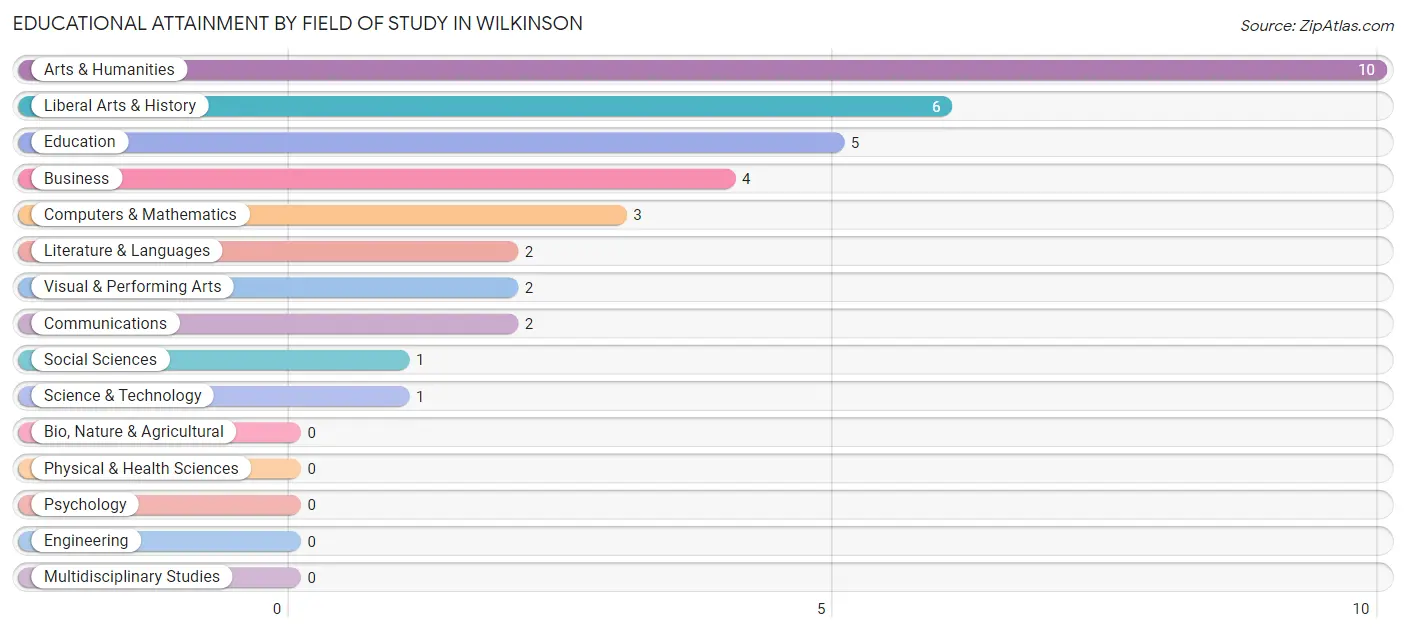
| Field of Study | # Graduates | % Graduates |
| Computers & Mathematics | 3 | 8.3% |
| Bio, Nature & Agricultural | 0 | 0.0% |
| Physical & Health Sciences | 0 | 0.0% |
| Psychology | 0 | 0.0% |
| Social Sciences | 1 | 2.8% |
| Engineering | 0 | 0.0% |
| Multidisciplinary Studies | 0 | 0.0% |
| Science & Technology | 1 | 2.8% |
| Business | 4 | 11.1% |
| Education | 5 | 13.9% |
| Literature & Languages | 2 | 5.6% |
| Liberal Arts & History | 6 | 16.7% |
| Visual & Performing Arts | 2 | 5.6% |
| Communications | 2 | 5.6% |
| Arts & Humanities | 10 | 27.8% |
| Total | 36 | 100.0% |
Transportation & Commute in Wilkinson
Vehicle Availability by Sex in Wilkinson
The most prevalent vehicle ownership categories in Wilkinson are males with 2 vehicles (41, accounting for 30.4%) and females with 2 vehicles (36, making up 38.7%).
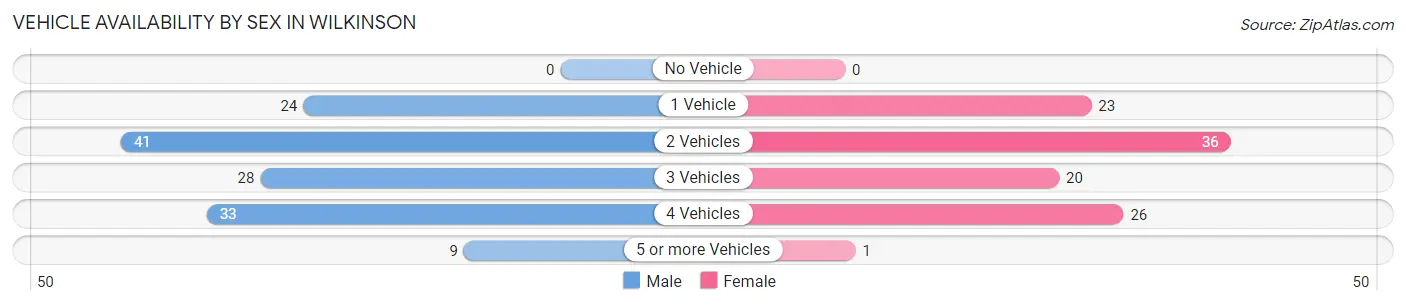
| Vehicles Available | Male | Female |
| No Vehicle | 0 (0.0%) | 0 (0.0%) |
| 1 Vehicle | 24 (17.8%) | 23 (21.7%) |
| 2 Vehicles | 41 (30.4%) | 36 (34.0%) |
| 3 Vehicles | 28 (20.7%) | 20 (18.9%) |
| 4 Vehicles | 33 (24.4%) | 26 (24.5%) |
| 5 or more Vehicles | 9 (6.7%) | 1 (0.9%) |
| Total | 135 (100.0%) | 106 (100.0%) |
Commute Time in Wilkinson
The most frequently occuring commute durations in Wilkinson are 20 to 24 minutes (58 commuters, 25.2%), 30 to 34 minutes (50 commuters, 21.7%), and 45 to 59 minutes (33 commuters, 14.3%).
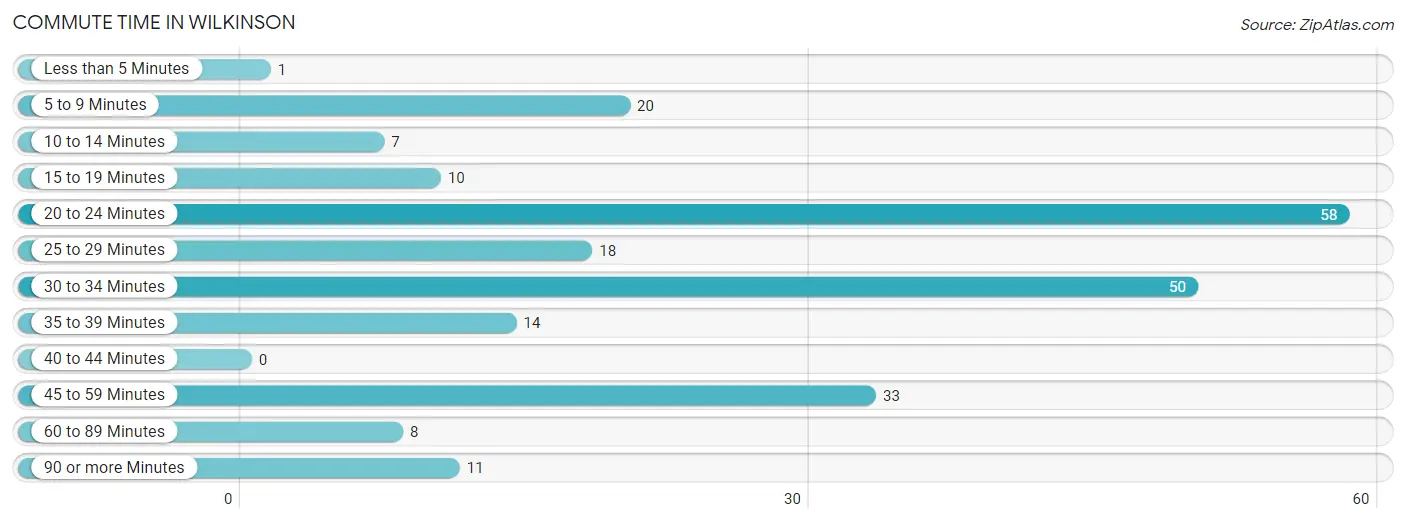
| Commute Time | # Commuters | % Commuters |
| Less than 5 Minutes | 1 | 0.4% |
| 5 to 9 Minutes | 20 | 8.7% |
| 10 to 14 Minutes | 7 | 3.0% |
| 15 to 19 Minutes | 10 | 4.3% |
| 20 to 24 Minutes | 58 | 25.2% |
| 25 to 29 Minutes | 18 | 7.8% |
| 30 to 34 Minutes | 50 | 21.7% |
| 35 to 39 Minutes | 14 | 6.1% |
| 40 to 44 Minutes | 0 | 0.0% |
| 45 to 59 Minutes | 33 | 14.3% |
| 60 to 89 Minutes | 8 | 3.5% |
| 90 or more Minutes | 11 | 4.8% |
Commute Time by Sex in Wilkinson
The most common commute times in Wilkinson are 30 to 34 minutes (33 commuters, 25.0%) for males and 20 to 24 minutes (33 commuters, 33.7%) for females.
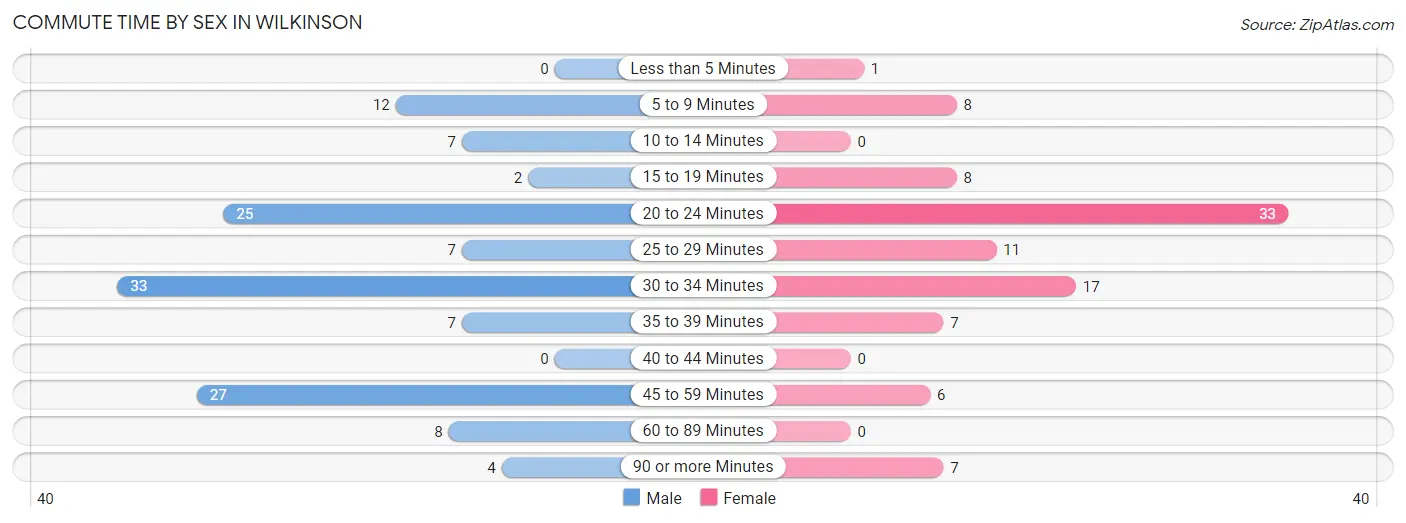
| Commute Time | Male | Female |
| Less than 5 Minutes | 0 (0.0%) | 1 (1.0%) |
| 5 to 9 Minutes | 12 (9.1%) | 8 (8.2%) |
| 10 to 14 Minutes | 7 (5.3%) | 0 (0.0%) |
| 15 to 19 Minutes | 2 (1.5%) | 8 (8.2%) |
| 20 to 24 Minutes | 25 (18.9%) | 33 (33.7%) |
| 25 to 29 Minutes | 7 (5.3%) | 11 (11.2%) |
| 30 to 34 Minutes | 33 (25.0%) | 17 (17.3%) |
| 35 to 39 Minutes | 7 (5.3%) | 7 (7.1%) |
| 40 to 44 Minutes | 0 (0.0%) | 0 (0.0%) |
| 45 to 59 Minutes | 27 (20.4%) | 6 (6.1%) |
| 60 to 89 Minutes | 8 (6.1%) | 0 (0.0%) |
| 90 or more Minutes | 4 (3.0%) | 7 (7.1%) |
Time of Departure to Work by Sex in Wilkinson
The most frequent times of departure to work in Wilkinson are 6:00 AM to 6:29 AM (24, 18.2%) for males and 7:30 AM to 7:59 AM (21, 21.4%) for females.
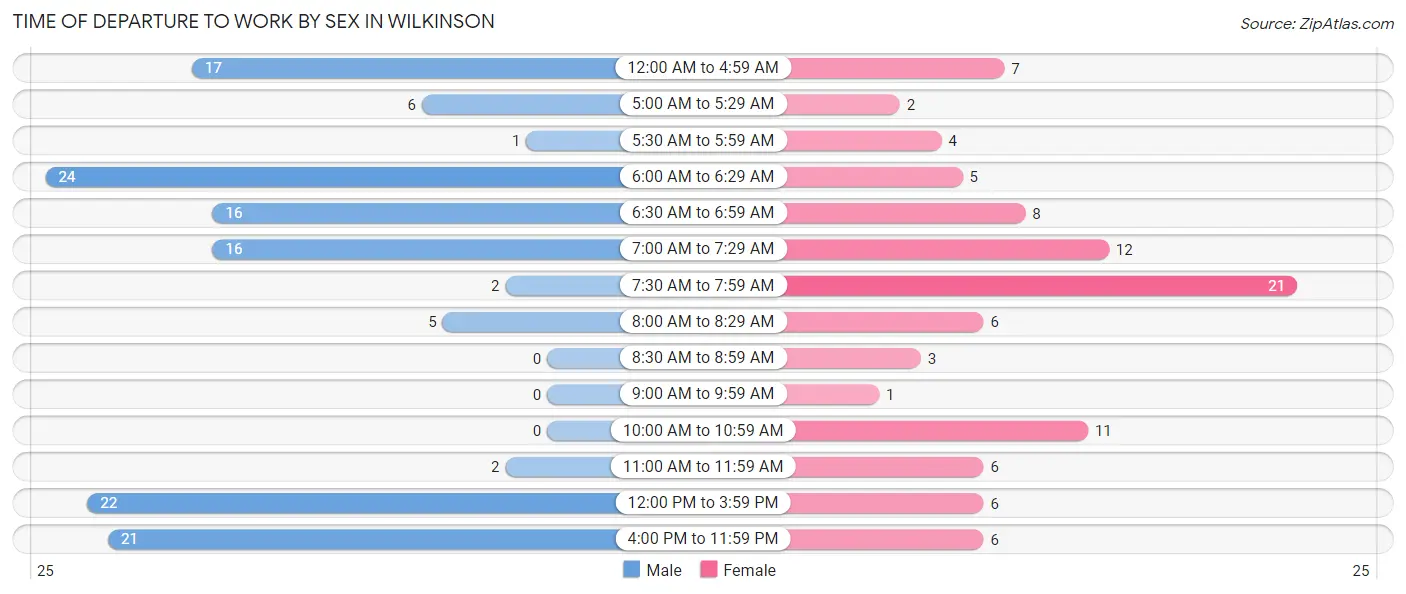
| Time of Departure | Male | Female |
| 12:00 AM to 4:59 AM | 17 (12.9%) | 7 (7.1%) |
| 5:00 AM to 5:29 AM | 6 (4.5%) | 2 (2.0%) |
| 5:30 AM to 5:59 AM | 1 (0.8%) | 4 (4.1%) |
| 6:00 AM to 6:29 AM | 24 (18.2%) | 5 (5.1%) |
| 6:30 AM to 6:59 AM | 16 (12.1%) | 8 (8.2%) |
| 7:00 AM to 7:29 AM | 16 (12.1%) | 12 (12.2%) |
| 7:30 AM to 7:59 AM | 2 (1.5%) | 21 (21.4%) |
| 8:00 AM to 8:29 AM | 5 (3.8%) | 6 (6.1%) |
| 8:30 AM to 8:59 AM | 0 (0.0%) | 3 (3.1%) |
| 9:00 AM to 9:59 AM | 0 (0.0%) | 1 (1.0%) |
| 10:00 AM to 10:59 AM | 0 (0.0%) | 11 (11.2%) |
| 11:00 AM to 11:59 AM | 2 (1.5%) | 6 (6.1%) |
| 12:00 PM to 3:59 PM | 22 (16.7%) | 6 (6.1%) |
| 4:00 PM to 11:59 PM | 21 (15.9%) | 6 (6.1%) |
| Total | 132 (100.0%) | 98 (100.0%) |
Housing Occupancy in Wilkinson
Occupancy by Ownership in Wilkinson
Of the total 181 dwellings in Wilkinson, owner-occupied units account for 147 (81.2%), while renter-occupied units make up 34 (18.8%).
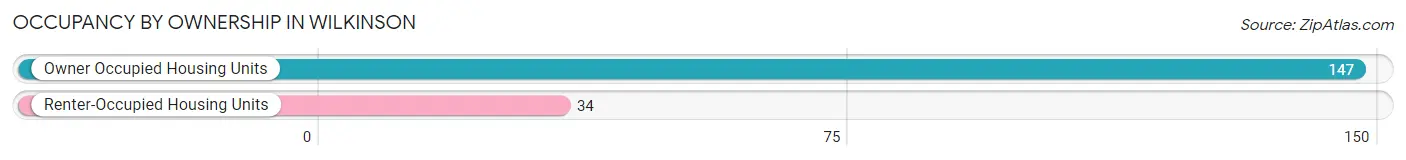
| Occupancy | # Housing Units | % Housing Units |
| Owner Occupied Housing Units | 147 | 81.2% |
| Renter-Occupied Housing Units | 34 | 18.8% |
| Total Occupied Housing Units | 181 | 100.0% |
Occupancy by Household Size in Wilkinson
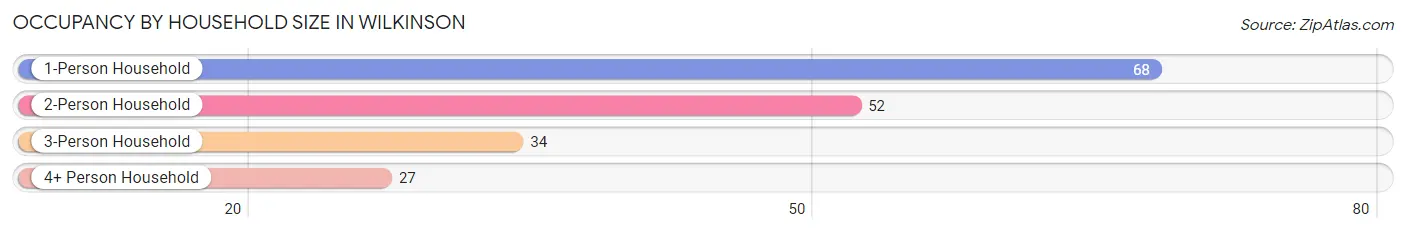
| Household Size | # Housing Units | % Housing Units |
| 1-Person Household | 68 | 37.6% |
| 2-Person Household | 52 | 28.7% |
| 3-Person Household | 34 | 18.8% |
| 4+ Person Household | 27 | 14.9% |
| Total Housing Units | 181 | 100.0% |
Occupancy by Ownership by Household Size in Wilkinson
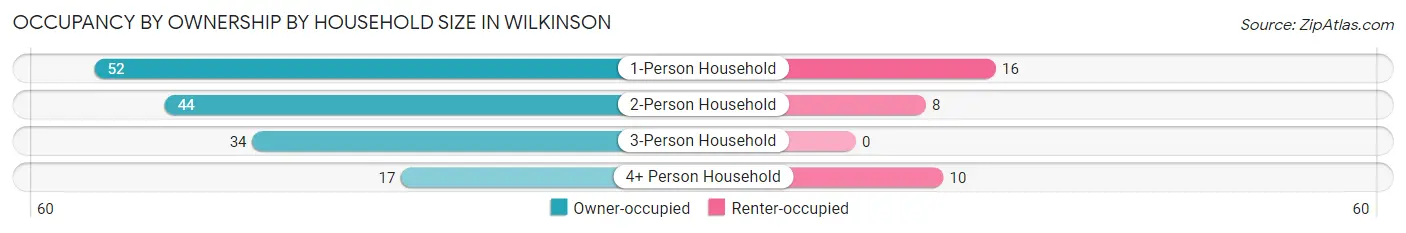
| Household Size | Owner-occupied | Renter-occupied |
| 1-Person Household | 52 (76.5%) | 16 (23.5%) |
| 2-Person Household | 44 (84.6%) | 8 (15.4%) |
| 3-Person Household | 34 (100.0%) | 0 (0.0%) |
| 4+ Person Household | 17 (63.0%) | 10 (37.0%) |
| Total Housing Units | 147 (81.2%) | 34 (18.8%) |
Occupancy by Educational Attainment in Wilkinson
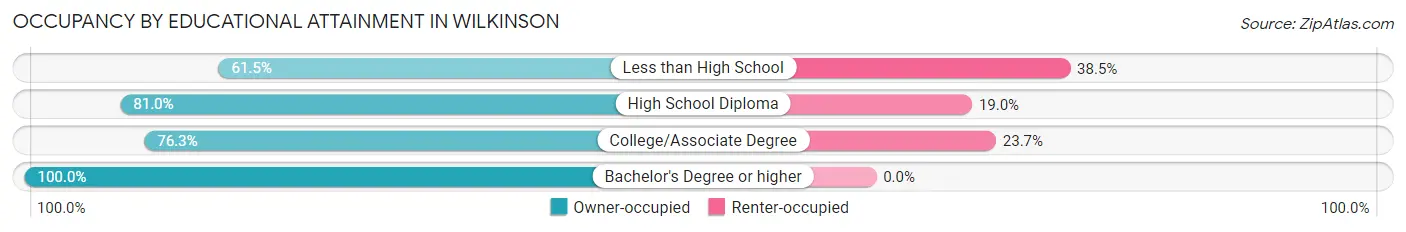
| Household Size | Owner-occupied | Renter-occupied |
| Less than High School | 8 (61.5%) | 5 (38.5%) |
| High School Diploma | 64 (81.0%) | 15 (19.0%) |
| College/Associate Degree | 45 (76.3%) | 14 (23.7%) |
| Bachelor's Degree or higher | 30 (100.0%) | 0 (0.0%) |
Occupancy by Age of Householder in Wilkinson
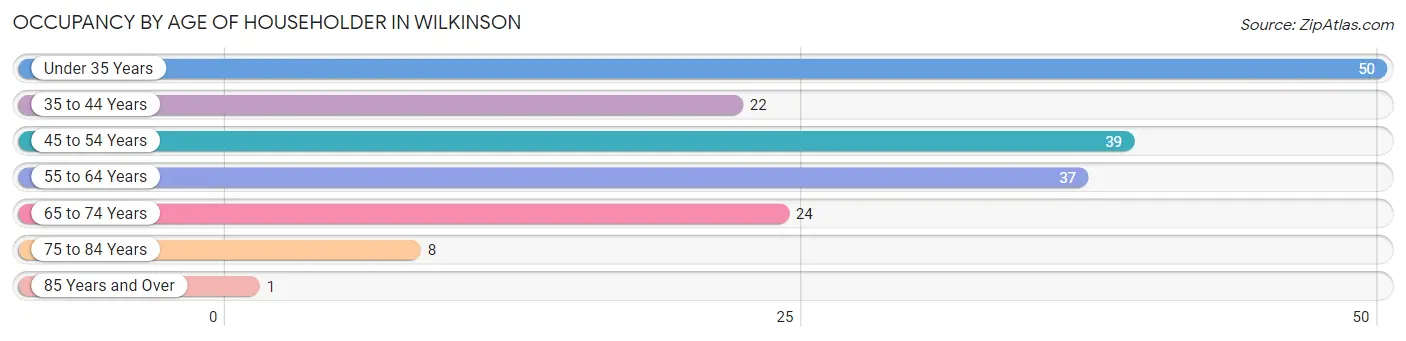
| Age Bracket | # Households | % Households |
| Under 35 Years | 50 | 27.6% |
| 35 to 44 Years | 22 | 12.1% |
| 45 to 54 Years | 39 | 21.5% |
| 55 to 64 Years | 37 | 20.4% |
| 65 to 74 Years | 24 | 13.3% |
| 75 to 84 Years | 8 | 4.4% |
| 85 Years and Over | 1 | 0.5% |
| Total | 181 | 100.0% |
Housing Finances in Wilkinson
Median Income by Occupancy in Wilkinson
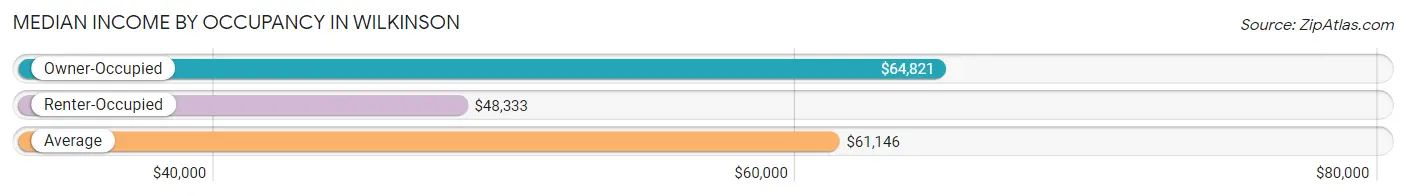
| Occupancy Type | # Households | Median Income |
| Owner-Occupied | 147 (81.2%) | $64,821 |
| Renter-Occupied | 34 (18.8%) | $48,333 |
| Average | 181 (100.0%) | $61,146 |
Occupancy by Householder Income Bracket in Wilkinson
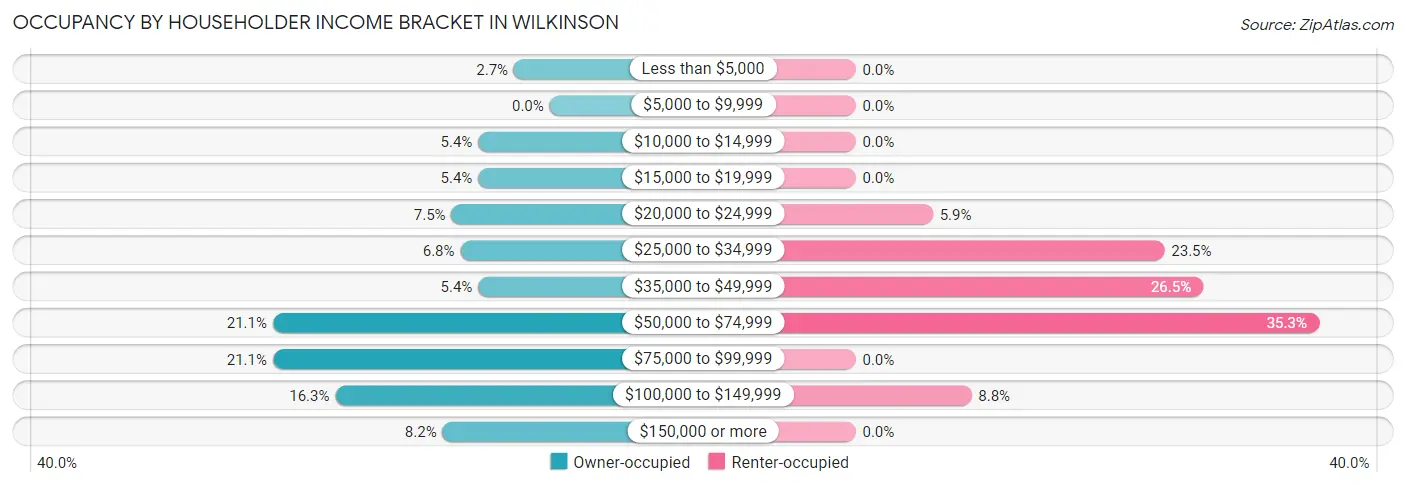
| Income Bracket | Owner-occupied | Renter-occupied |
| Less than $5,000 | 4 (2.7%) | 0 (0.0%) |
| $5,000 to $9,999 | 0 (0.0%) | 0 (0.0%) |
| $10,000 to $14,999 | 8 (5.4%) | 0 (0.0%) |
| $15,000 to $19,999 | 8 (5.4%) | 0 (0.0%) |
| $20,000 to $24,999 | 11 (7.5%) | 2 (5.9%) |
| $25,000 to $34,999 | 10 (6.8%) | 8 (23.5%) |
| $35,000 to $49,999 | 8 (5.4%) | 9 (26.5%) |
| $50,000 to $74,999 | 31 (21.1%) | 12 (35.3%) |
| $75,000 to $99,999 | 31 (21.1%) | 0 (0.0%) |
| $100,000 to $149,999 | 24 (16.3%) | 3 (8.8%) |
| $150,000 or more | 12 (8.2%) | 0 (0.0%) |
| Total | 147 (100.0%) | 34 (100.0%) |
Monthly Housing Cost Tiers in Wilkinson
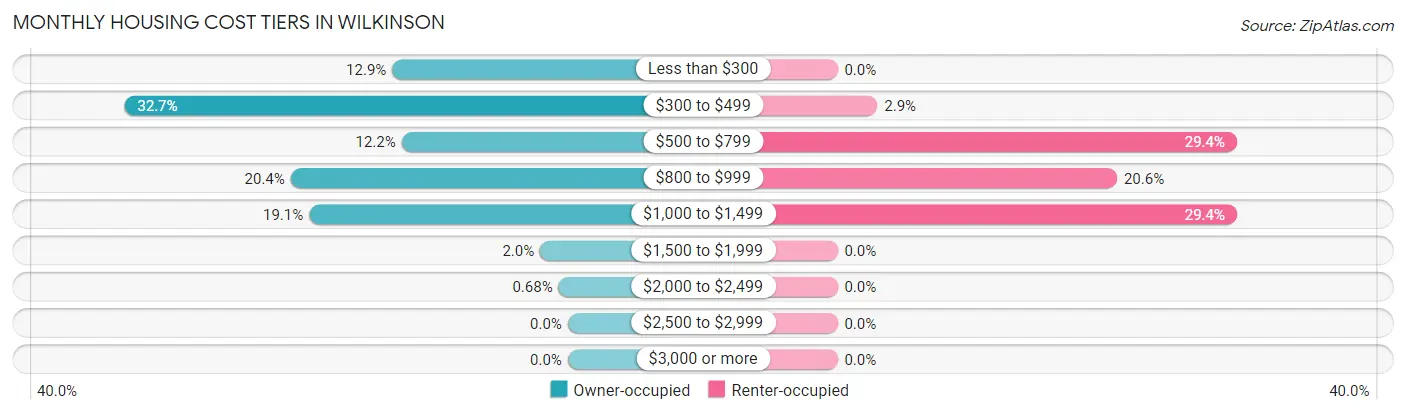
| Monthly Cost | Owner-occupied | Renter-occupied |
| Less than $300 | 19 (12.9%) | 0 (0.0%) |
| $300 to $499 | 48 (32.7%) | 1 (2.9%) |
| $500 to $799 | 18 (12.2%) | 10 (29.4%) |
| $800 to $999 | 30 (20.4%) | 7 (20.6%) |
| $1,000 to $1,499 | 28 (19.1%) | 10 (29.4%) |
| $1,500 to $1,999 | 3 (2.0%) | 0 (0.0%) |
| $2,000 to $2,499 | 1 (0.7%) | 0 (0.0%) |
| $2,500 to $2,999 | 0 (0.0%) | 0 (0.0%) |
| $3,000 or more | 0 (0.0%) | 0 (0.0%) |
| Total | 147 (100.0%) | 34 (100.0%) |
Physical Housing Characteristics in Wilkinson
Housing Structures in Wilkinson
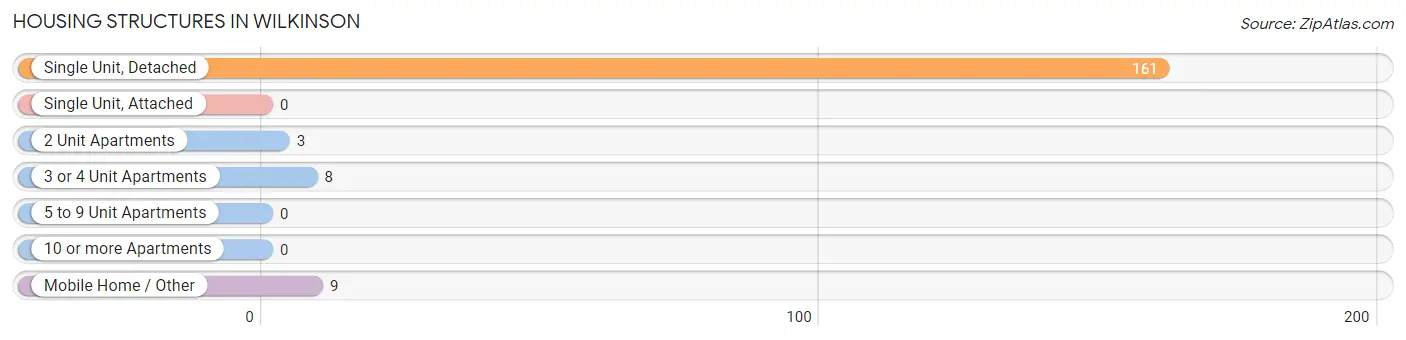
| Structure Type | # Housing Units | % Housing Units |
| Single Unit, Detached | 161 | 88.9% |
| Single Unit, Attached | 0 | 0.0% |
| 2 Unit Apartments | 3 | 1.7% |
| 3 or 4 Unit Apartments | 8 | 4.4% |
| 5 to 9 Unit Apartments | 0 | 0.0% |
| 10 or more Apartments | 0 | 0.0% |
| Mobile Home / Other | 9 | 5.0% |
| Total | 181 | 100.0% |
Housing Structures by Occupancy in Wilkinson
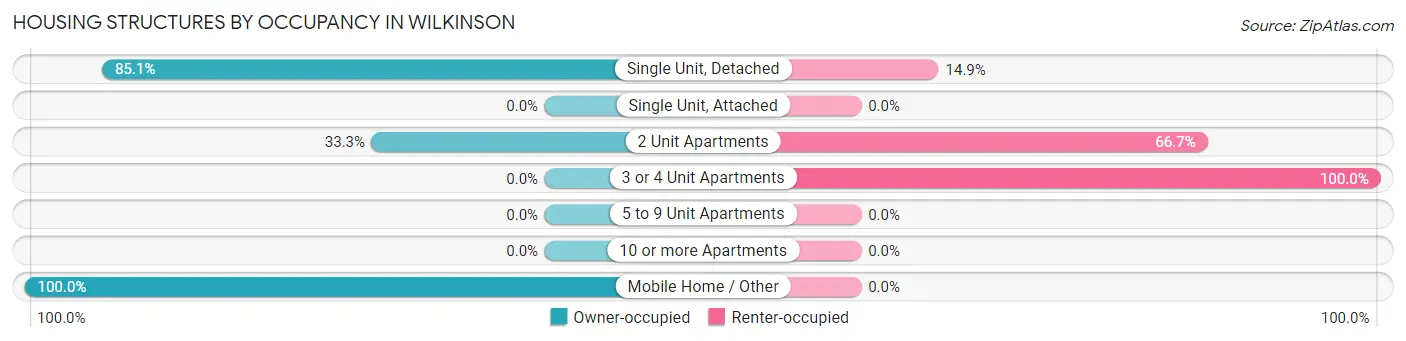
| Structure Type | Owner-occupied | Renter-occupied |
| Single Unit, Detached | 137 (85.1%) | 24 (14.9%) |
| Single Unit, Attached | 0 (0.0%) | 0 (0.0%) |
| 2 Unit Apartments | 1 (33.3%) | 2 (66.7%) |
| 3 or 4 Unit Apartments | 0 (0.0%) | 8 (100.0%) |
| 5 to 9 Unit Apartments | 0 (0.0%) | 0 (0.0%) |
| 10 or more Apartments | 0 (0.0%) | 0 (0.0%) |
| Mobile Home / Other | 9 (100.0%) | 0 (0.0%) |
| Total | 147 (81.2%) | 34 (18.8%) |
Housing Structures by Number of Rooms in Wilkinson
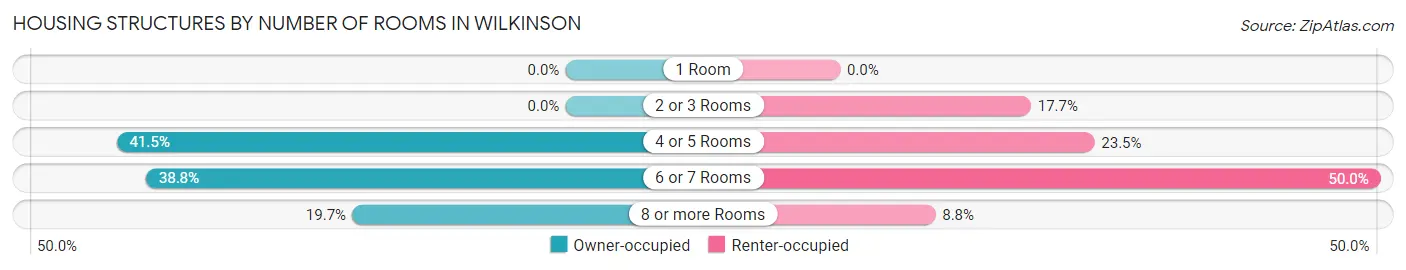
| Number of Rooms | Owner-occupied | Renter-occupied |
| 1 Room | 0 (0.0%) | 0 (0.0%) |
| 2 or 3 Rooms | 0 (0.0%) | 6 (17.6%) |
| 4 or 5 Rooms | 61 (41.5%) | 8 (23.5%) |
| 6 or 7 Rooms | 57 (38.8%) | 17 (50.0%) |
| 8 or more Rooms | 29 (19.7%) | 3 (8.8%) |
| Total | 147 (100.0%) | 34 (100.0%) |
Housing Structure by Heating Type in Wilkinson
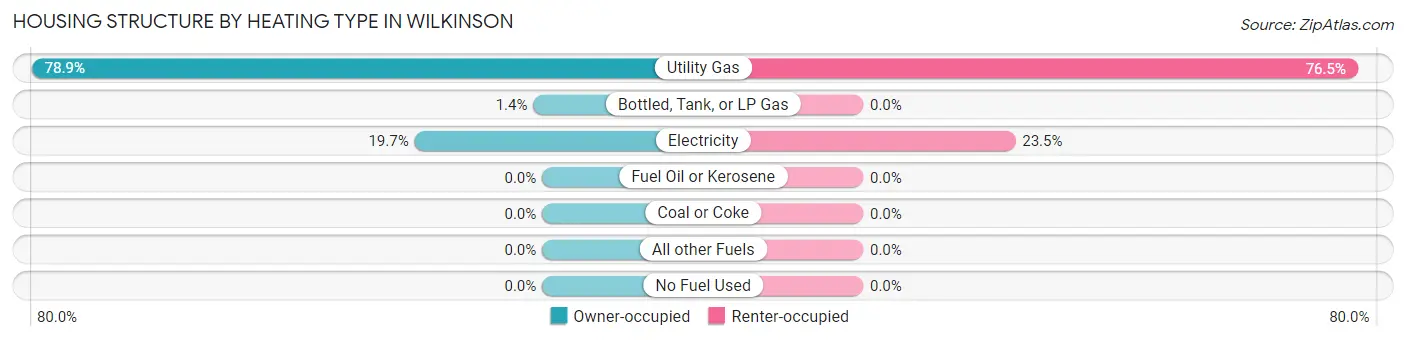
| Heating Type | Owner-occupied | Renter-occupied |
| Utility Gas | 116 (78.9%) | 26 (76.5%) |
| Bottled, Tank, or LP Gas | 2 (1.4%) | 0 (0.0%) |
| Electricity | 29 (19.7%) | 8 (23.5%) |
| Fuel Oil or Kerosene | 0 (0.0%) | 0 (0.0%) |
| Coal or Coke | 0 (0.0%) | 0 (0.0%) |
| All other Fuels | 0 (0.0%) | 0 (0.0%) |
| No Fuel Used | 0 (0.0%) | 0 (0.0%) |
| Total | 147 (100.0%) | 34 (100.0%) |
Household Vehicle Usage in Wilkinson
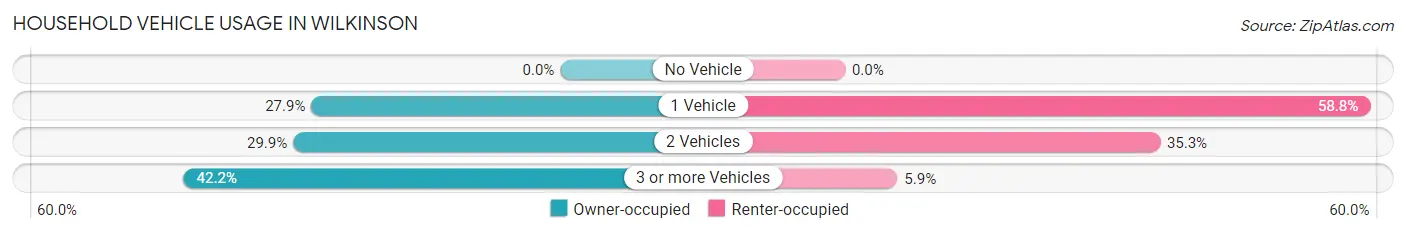
| Vehicles per Household | Owner-occupied | Renter-occupied |
| No Vehicle | 0 (0.0%) | 0 (0.0%) |
| 1 Vehicle | 41 (27.9%) | 20 (58.8%) |
| 2 Vehicles | 44 (29.9%) | 12 (35.3%) |
| 3 or more Vehicles | 62 (42.2%) | 2 (5.9%) |
| Total | 147 (100.0%) | 34 (100.0%) |
Real Estate & Mortgages in Wilkinson
Real Estate and Mortgage Overview in Wilkinson
| Characteristic | Without Mortgage | With Mortgage |
| Housing Units | 79 | 68 |
| Median Property Value | $105,700 | $138,600 |
| Median Household Income | $61,250 | $0 |
| Monthly Housing Costs | $391 | $0 |
| Real Estate Taxes | $700 | $6 |
Property Value by Mortgage Status in Wilkinson
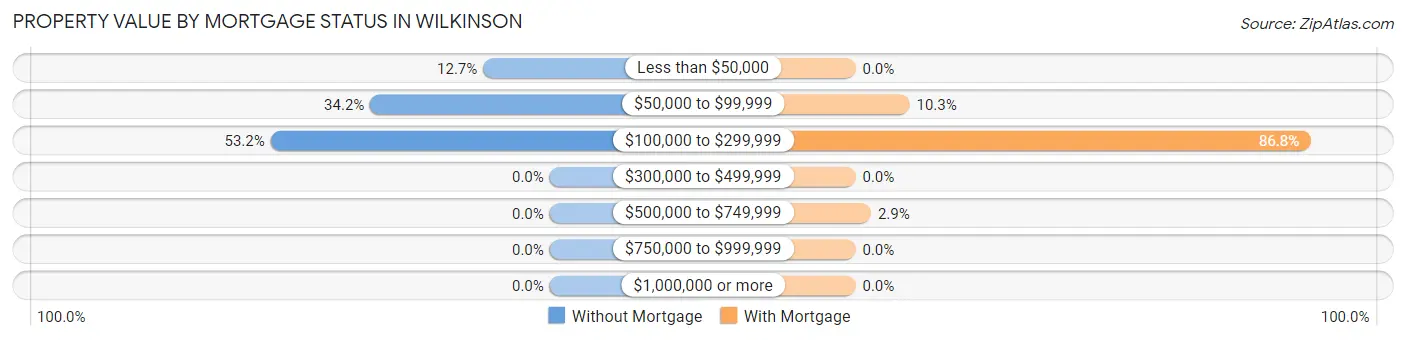
| Property Value | Without Mortgage | With Mortgage |
| Less than $50,000 | 10 (12.7%) | 0 (0.0%) |
| $50,000 to $99,999 | 27 (34.2%) | 7 (10.3%) |
| $100,000 to $299,999 | 42 (53.2%) | 59 (86.8%) |
| $300,000 to $499,999 | 0 (0.0%) | 0 (0.0%) |
| $500,000 to $749,999 | 0 (0.0%) | 2 (2.9%) |
| $750,000 to $999,999 | 0 (0.0%) | 0 (0.0%) |
| $1,000,000 or more | 0 (0.0%) | 0 (0.0%) |
| Total | 79 (100.0%) | 68 (100.0%) |
Household Income by Mortgage Status in Wilkinson
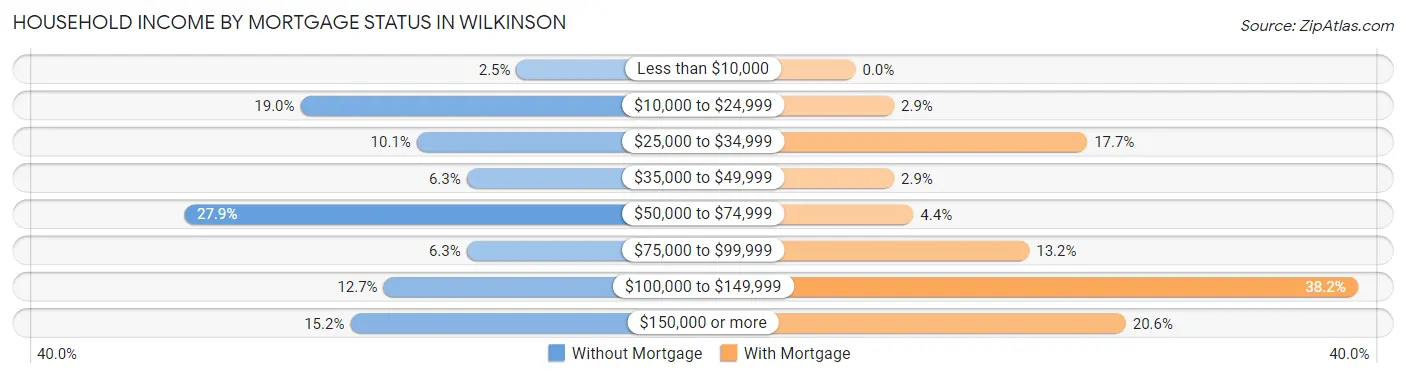
| Household Income | Without Mortgage | With Mortgage |
| Less than $10,000 | 2 (2.5%) | 0 (0.0%) |
| $10,000 to $24,999 | 15 (19.0%) | 2 (2.9%) |
| $25,000 to $34,999 | 8 (10.1%) | 12 (17.6%) |
| $35,000 to $49,999 | 5 (6.3%) | 2 (2.9%) |
| $50,000 to $74,999 | 22 (27.9%) | 3 (4.4%) |
| $75,000 to $99,999 | 5 (6.3%) | 9 (13.2%) |
| $100,000 to $149,999 | 10 (12.7%) | 26 (38.2%) |
| $150,000 or more | 12 (15.2%) | 14 (20.6%) |
| Total | 79 (100.0%) | 68 (100.0%) |
Property Value to Household Income Ratio in Wilkinson
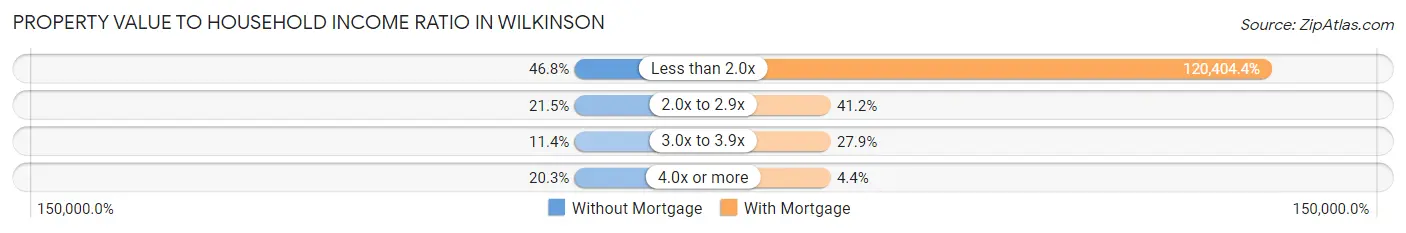
| Value-to-Income Ratio | Without Mortgage | With Mortgage |
| Less than 2.0x | 37 (46.8%) | 81,875 (120,404.4%) |
| 2.0x to 2.9x | 17 (21.5%) | 28 (41.2%) |
| 3.0x to 3.9x | 9 (11.4%) | 19 (27.9%) |
| 4.0x or more | 16 (20.3%) | 3 (4.4%) |
| Total | 79 (100.0%) | 68 (100.0%) |
Real Estate Taxes by Mortgage Status in Wilkinson
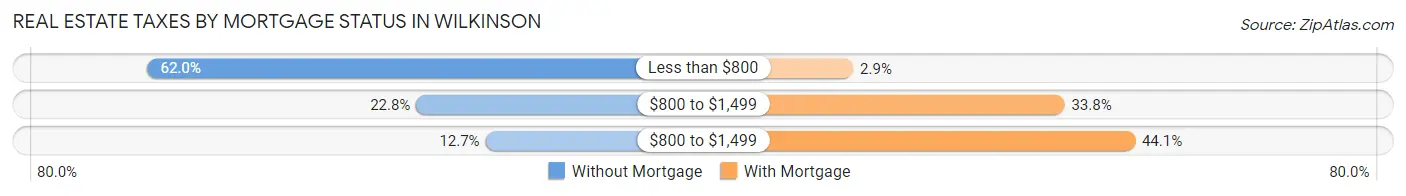
| Property Taxes | Without Mortgage | With Mortgage |
| Less than $800 | 49 (62.0%) | 2 (2.9%) |
| $800 to $1,499 | 18 (22.8%) | 23 (33.8%) |
| $800 to $1,499 | 10 (12.7%) | 30 (44.1%) |
| Total | 79 (100.0%) | 68 (100.0%) |
Health & Disability in Wilkinson
Health Insurance Coverage by Age in Wilkinson
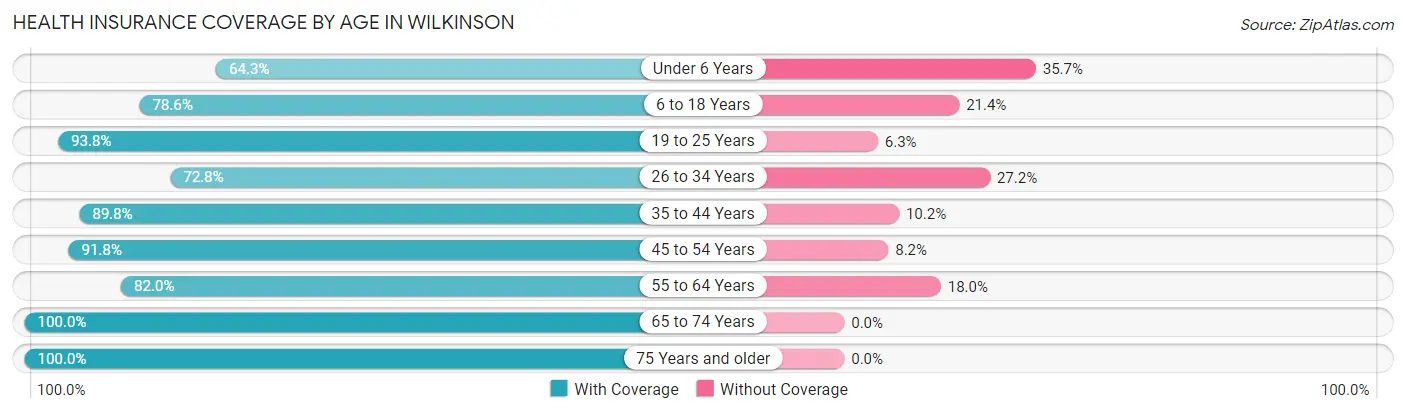
| Age Bracket | With Coverage | Without Coverage |
| Under 6 Years | 27 (64.3%) | 15 (35.7%) |
| 6 to 18 Years | 55 (78.6%) | 15 (21.4%) |
| 19 to 25 Years | 30 (93.8%) | 2 (6.2%) |
| 26 to 34 Years | 67 (72.8%) | 25 (27.2%) |
| 35 to 44 Years | 44 (89.8%) | 5 (10.2%) |
| 45 to 54 Years | 56 (91.8%) | 5 (8.2%) |
| 55 to 64 Years | 41 (82.0%) | 9 (18.0%) |
| 65 to 74 Years | 28 (100.0%) | 0 (0.0%) |
| 75 Years and older | 12 (100.0%) | 0 (0.0%) |
| Total | 360 (82.6%) | 76 (17.4%) |
Health Insurance Coverage by Citizenship Status in Wilkinson
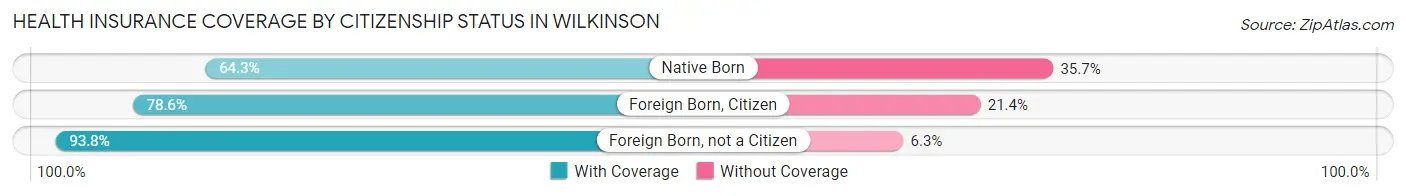
| Citizenship Status | With Coverage | Without Coverage |
| Native Born | 27 (64.3%) | 15 (35.7%) |
| Foreign Born, Citizen | 55 (78.6%) | 15 (21.4%) |
| Foreign Born, not a Citizen | 30 (93.8%) | 2 (6.2%) |
Health Insurance Coverage by Household Income in Wilkinson
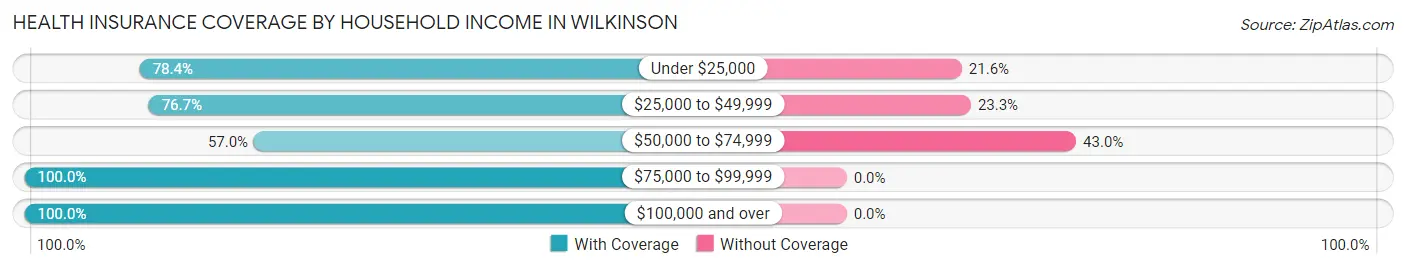
| Household Income | With Coverage | Without Coverage |
| Under $25,000 | 40 (78.4%) | 11 (21.6%) |
| $25,000 to $49,999 | 33 (76.7%) | 10 (23.3%) |
| $50,000 to $74,999 | 73 (57.0%) | 55 (43.0%) |
| $75,000 to $99,999 | 82 (100.0%) | 0 (0.0%) |
| $100,000 and over | 132 (100.0%) | 0 (0.0%) |
Public vs Private Health Insurance Coverage by Age in Wilkinson
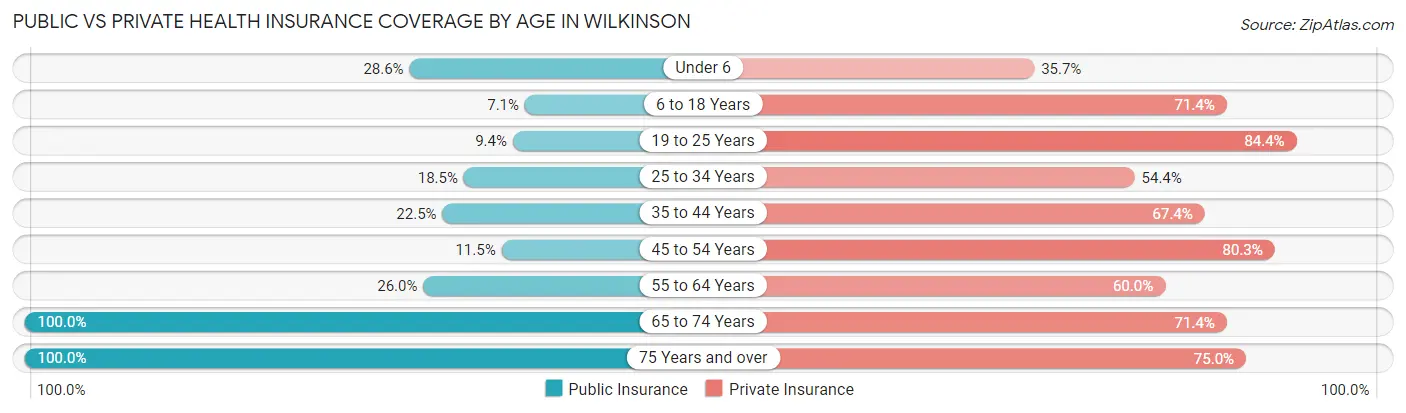
| Age Bracket | Public Insurance | Private Insurance |
| Under 6 | 12 (28.6%) | 15 (35.7%) |
| 6 to 18 Years | 5 (7.1%) | 50 (71.4%) |
| 19 to 25 Years | 3 (9.4%) | 27 (84.4%) |
| 25 to 34 Years | 17 (18.5%) | 50 (54.3%) |
| 35 to 44 Years | 11 (22.5%) | 33 (67.3%) |
| 45 to 54 Years | 7 (11.5%) | 49 (80.3%) |
| 55 to 64 Years | 13 (26.0%) | 30 (60.0%) |
| 65 to 74 Years | 28 (100.0%) | 20 (71.4%) |
| 75 Years and over | 12 (100.0%) | 9 (75.0%) |
| Total | 108 (24.8%) | 283 (64.9%) |
Disability Status by Sex by Age in Wilkinson
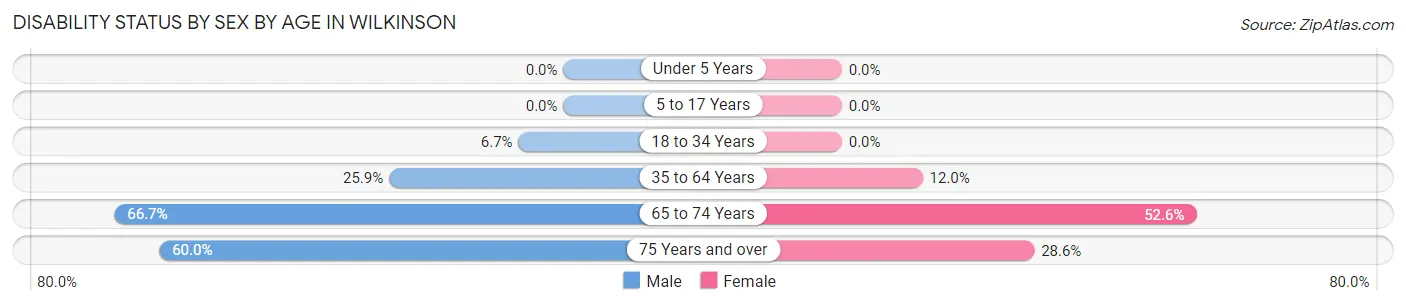
| Age Bracket | Male | Female |
| Under 5 Years | 0 (0.0%) | 0 (0.0%) |
| 5 to 17 Years | 0 (0.0%) | 0 (0.0%) |
| 18 to 34 Years | 5 (6.7%) | 0 (0.0%) |
| 35 to 64 Years | 22 (25.9%) | 9 (12.0%) |
| 65 to 74 Years | 6 (66.7%) | 10 (52.6%) |
| 75 Years and over | 3 (60.0%) | 2 (28.6%) |
Disability Class by Sex by Age in Wilkinson
Disability Class: Hearing Difficulty
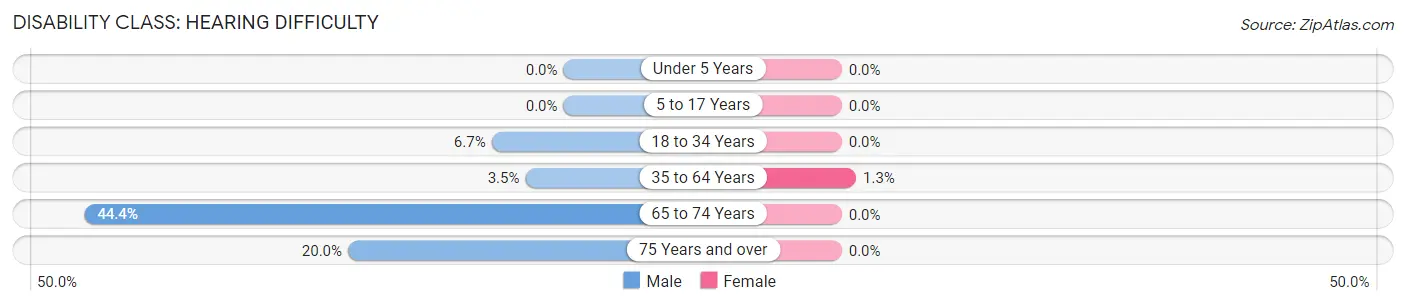
| Age Bracket | Male | Female |
| Under 5 Years | 0 (0.0%) | 0 (0.0%) |
| 5 to 17 Years | 0 (0.0%) | 0 (0.0%) |
| 18 to 34 Years | 5 (6.7%) | 0 (0.0%) |
| 35 to 64 Years | 3 (3.5%) | 1 (1.3%) |
| 65 to 74 Years | 4 (44.4%) | 0 (0.0%) |
| 75 Years and over | 1 (20.0%) | 0 (0.0%) |
Disability Class: Vision Difficulty
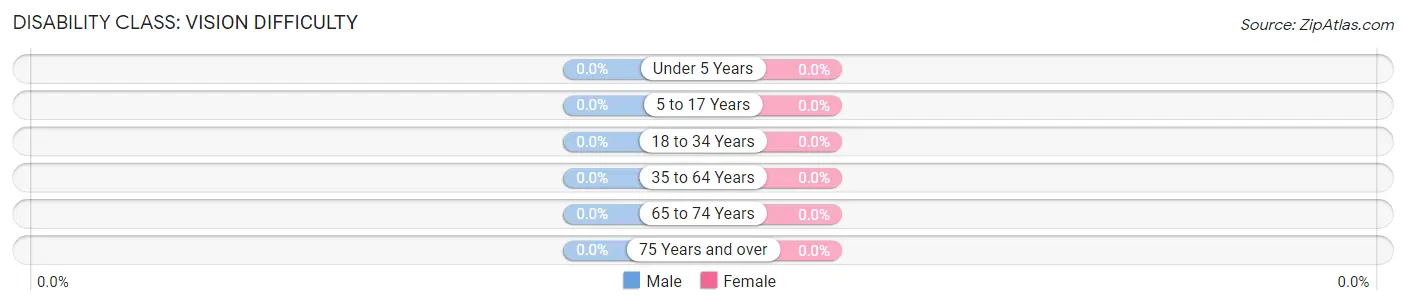
| Age Bracket | Male | Female |
| Under 5 Years | 0 (0.0%) | 0 (0.0%) |
| 5 to 17 Years | 0 (0.0%) | 0 (0.0%) |
| 18 to 34 Years | 0 (0.0%) | 0 (0.0%) |
| 35 to 64 Years | 0 (0.0%) | 0 (0.0%) |
| 65 to 74 Years | 0 (0.0%) | 0 (0.0%) |
| 75 Years and over | 0 (0.0%) | 0 (0.0%) |
Disability Class: Cognitive Difficulty
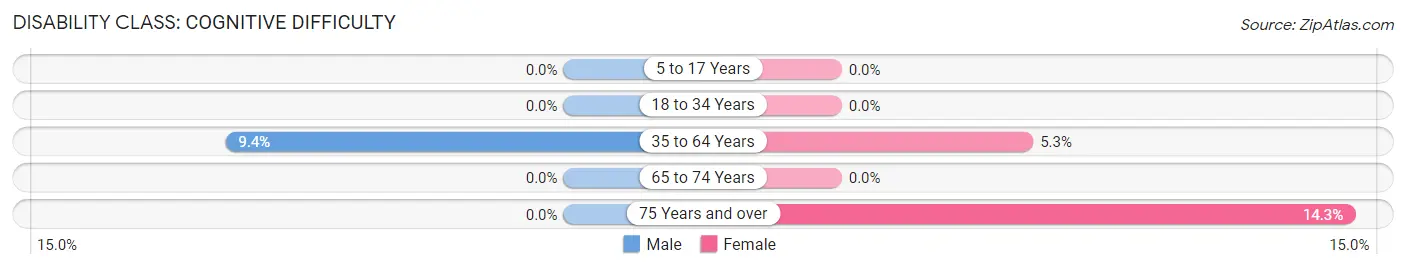
| Age Bracket | Male | Female |
| 5 to 17 Years | 0 (0.0%) | 0 (0.0%) |
| 18 to 34 Years | 0 (0.0%) | 0 (0.0%) |
| 35 to 64 Years | 8 (9.4%) | 4 (5.3%) |
| 65 to 74 Years | 0 (0.0%) | 0 (0.0%) |
| 75 Years and over | 0 (0.0%) | 1 (14.3%) |
Disability Class: Ambulatory Difficulty
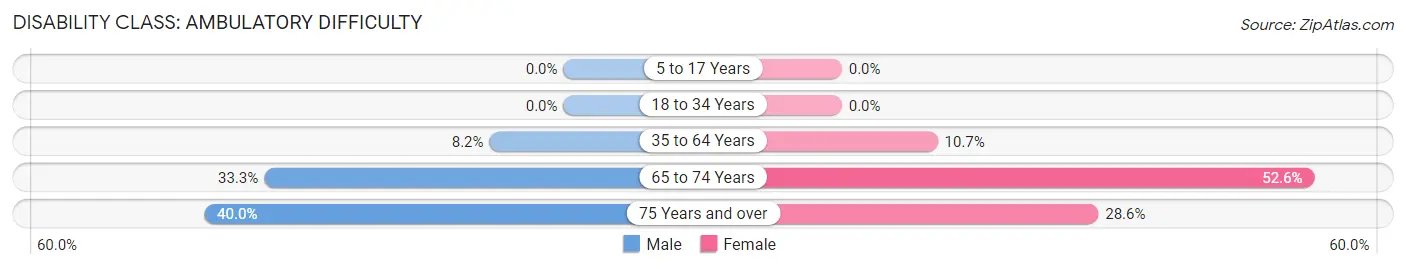
| Age Bracket | Male | Female |
| 5 to 17 Years | 0 (0.0%) | 0 (0.0%) |
| 18 to 34 Years | 0 (0.0%) | 0 (0.0%) |
| 35 to 64 Years | 7 (8.2%) | 8 (10.7%) |
| 65 to 74 Years | 3 (33.3%) | 10 (52.6%) |
| 75 Years and over | 2 (40.0%) | 2 (28.6%) |
Disability Class: Self-Care Difficulty
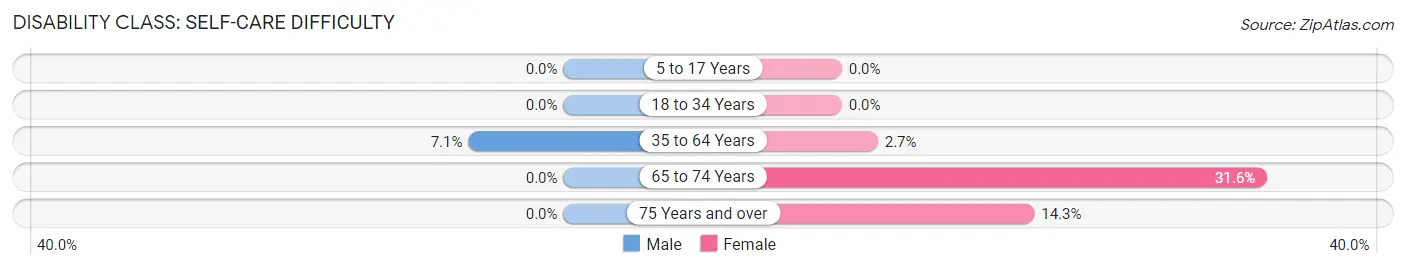
| Age Bracket | Male | Female |
| 5 to 17 Years | 0 (0.0%) | 0 (0.0%) |
| 18 to 34 Years | 0 (0.0%) | 0 (0.0%) |
| 35 to 64 Years | 6 (7.1%) | 2 (2.7%) |
| 65 to 74 Years | 0 (0.0%) | 6 (31.6%) |
| 75 Years and over | 0 (0.0%) | 1 (14.3%) |
Technology Access in Wilkinson
Computing Device Access in Wilkinson
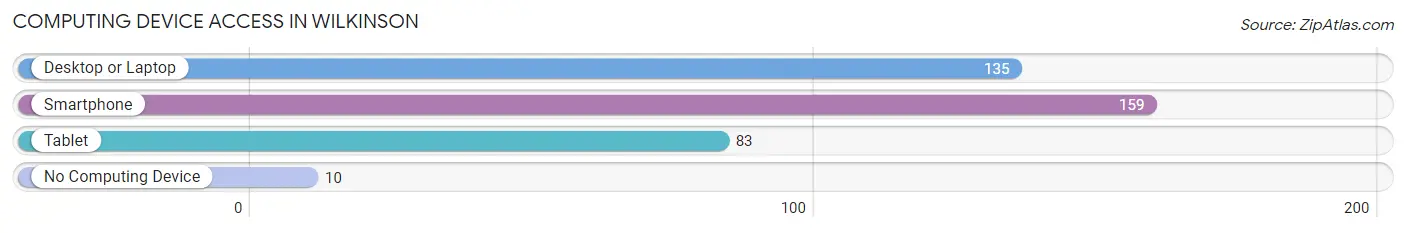
| Device Type | # Households | % Households |
| Desktop or Laptop | 135 | 74.6% |
| Smartphone | 159 | 87.8% |
| Tablet | 83 | 45.9% |
| No Computing Device | 10 | 5.5% |
| Total | 181 | 100.0% |
Internet Access in Wilkinson
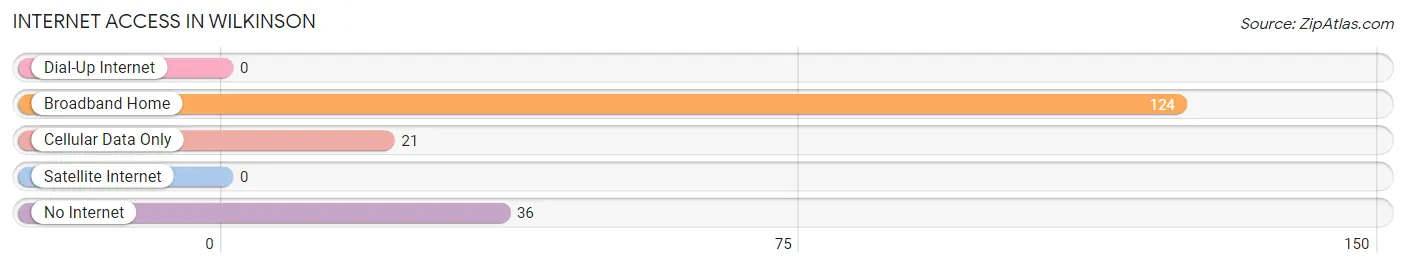
| Internet Type | # Households | % Households |
| Dial-Up Internet | 0 | 0.0% |
| Broadband Home | 124 | 68.5% |
| Cellular Data Only | 21 | 11.6% |
| Satellite Internet | 0 | 0.0% |
| No Internet | 36 | 19.9% |
| Total | 181 | 100.0% |
Wilkinson Summary
INTRODUCTION
Wilkinson is a small town located in the state of Indiana in the United States. It is located in the northern part of the state, near the border with Michigan. The town has a population of just over 1,000 people and is a rural community. The town is known for its agricultural heritage and is home to a variety of farms and businesses. The town is also home to a number of historic sites, including the Wilkinson Historical Museum and the Wilkinson County Courthouse.
HISTORY
The town of Wilkinson was founded in 1837 by a group of settlers from Ohio. The town was named after the Wilkinson family, who were among the first settlers in the area. The town was originally a farming community, and the Wilkinson family was instrumental in the development of the town. The town was incorporated in 1845 and was the county seat of Wilkinson County.
The town grew steadily throughout the 19th century, and by the early 20th century, it had become a thriving agricultural center. The town was home to a variety of businesses, including a flour mill, a sawmill, a blacksmith shop, and a general store. The town also had a number of churches, including the First Presbyterian Church, which was founded in 1845.
The town experienced a period of decline in the mid-20th century, as many of the businesses and farms in the area closed. However, the town has seen a resurgence in recent years, with a number of new businesses opening in the area.
GEOGRAPHY
Wilkinson is located in the northern part of Indiana, near the border with Michigan. The town is situated in a rural area, and is surrounded by farmland and woodlands. The town is located on the banks of the Wabash River, and is approximately 30 miles from the city of Fort Wayne.
The town has a total area of 1.2 square miles, and has a population density of 845 people per square mile. The town is located at an elevation of 845 feet above sea level.
ECONOMY
The economy of Wilkinson is largely based on agriculture. The town is home to a number of farms, which produce a variety of crops, including corn, soybeans, wheat, and hay. The town is also home to a number of businesses, including a lumber yard, a hardware store, and a variety of restaurants and shops.
The town is also home to a number of historic sites, including the Wilkinson Historical Museum and the Wilkinson County Courthouse. These sites attract visitors from around the state and the country, and help to boost the local economy.
DEMOGRAPHICS
As of the 2010 census, the population of Wilkinson was 1,072. The town has a population density of 845 people per square mile. The median age of the population is 43.7 years, and the median household income is $41,250.
The town is predominantly white, with 92.3% of the population identifying as white. The town also has a small Hispanic population, with 4.2% of the population identifying as Hispanic or Latino.
CONCLUSION
Wilkinson is a small town located in the northern part of Indiana. The town has a population of just over 1,000 people and is a rural community. The town is known for its agricultural heritage and is home to a variety of farms and businesses. The town is also home to a number of historic sites, including the Wilkinson Historical Museum and the Wilkinson County Courthouse. The town has a largely agricultural economy, and is home to a number of businesses and historic sites. The town is predominantly white, with 92.3% of the population identifying as white.
Common Questions
What is Per Capita Income in Wilkinson?
Per Capita income in Wilkinson is $31,327.
What is the Median Family Income in Wilkinson?
Median Family Income in Wilkinson is $68,750.
What is the Median Household income in Wilkinson?
Median Household Income in Wilkinson is $61,146.
What is Income or Wage Gap in Wilkinson?
Income or Wage Gap in Wilkinson is 33.7%.
Women in Wilkinson earn 66.3 cents for every dollar earned by a man.
What is Inequality or Gini Index in Wilkinson?
Inequality or Gini Index in Wilkinson is 0.42.
What is the Total Population of Wilkinson?
Total Population of Wilkinson is 436.
What is the Total Male Population of Wilkinson?
Total Male Population of Wilkinson is 231.
What is the Total Female Population of Wilkinson?
Total Female Population of Wilkinson is 205.
What is the Ratio of Males per 100 Females in Wilkinson?
There are 112.68 Males per 100 Females in Wilkinson.
What is the Ratio of Females per 100 Males in Wilkinson?
There are 88.74 Females per 100 Males in Wilkinson.
What is the Median Population Age in Wilkinson?
Median Population Age in Wilkinson is 33.5 Years.
What is the Average Family Size in Wilkinson
Average Family Size in Wilkinson is 3.3 People.
What is the Average Household Size in Wilkinson
Average Household Size in Wilkinson is 2.4 People.
How Large is the Labor Force in Wilkinson?
There are 255 People in the Labor Forcein in Wilkinson.
What is the Percentage of People in the Labor Force in Wilkinson?
75.7% of People are in the Labor Force in Wilkinson.
What is the Unemployment Rate in Wilkinson?
Unemployment Rate in Wilkinson is 0.8%.