Zip Codes with the Highest Percentage of Population Employed in Security & Protection in Terre Haute, IN
RELATED REPORTS & OPTIONS
Security & Protection
Terre Haute
Compare Zip Codes
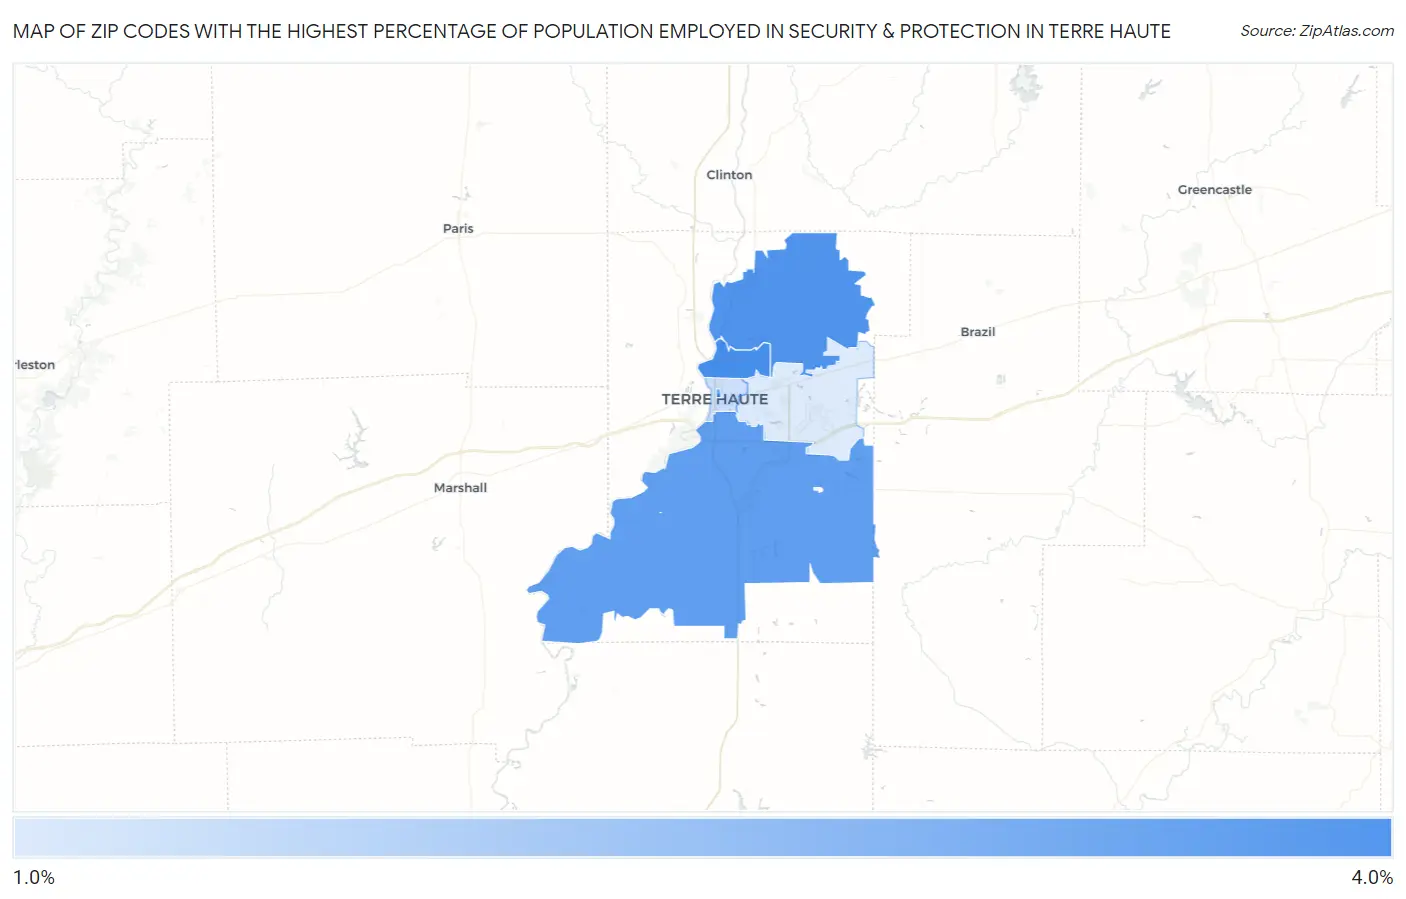
Map of Zip Codes with the Highest Percentage of Population Employed in Security & Protection in Terre Haute
1.8%
3.5%
Zip Codes with the Highest Percentage of Population Employed in Security & Protection in Terre Haute, IN
| Zip Code | % Employed | vs State | vs National | |
| 1. | 47804 | 3.5% | 1.8%(+1.71)#94 | 2.1%(+1.33)#5,722 |
| 2. | 47805 | 3.4% | 1.8%(+1.63)#97 | 2.1%(+1.26)#5,913 |
| 3. | 47809 | 3.2% | 1.8%(+1.45)#102 | 2.1%(+1.08)#6,460 |
| 4. | 47802 | 3.2% | 1.8%(+1.42)#107 | 2.1%(+1.05)#6,558 |
| 5. | 47807 | 2.1% | 1.8%(+0.281)#241 | 2.1%(-0.093)#12,211 |
| 6. | 47803 | 1.8% | 1.8%(+0.069)#277 | 2.1%(-0.304)#13,608 |
1
Common Questions
What are the Top 5 Zip Codes with the Highest Percentage of Population Employed in Security & Protection in Terre Haute, IN?
Top 5 Zip Codes with the Highest Percentage of Population Employed in Security & Protection in Terre Haute, IN are:
What zip code has the Highest Percentage of Population Employed in Security & Protection in Terre Haute, IN?
47804 has the Highest Percentage of Population Employed in Security & Protection in Terre Haute, IN with 3.5%.
What is the Percentage of Population Employed in Security & Protection in Terre Haute, IN?
Percentage of Population Employed in Security & Protection in Terre Haute is 2.3%.
What is the Percentage of Population Employed in Security & Protection in Indiana?
Percentage of Population Employed in Security & Protection in Indiana is 1.8%.
What is the Percentage of Population Employed in Security & Protection in the United States?
Percentage of Population Employed in Security & Protection in the United States is 2.1%.