Perris, CA Map & Demographics
Perris Map
Perris Overview
$24,084
PER CAPITA INCOME
$78,527
AVG FAMILY INCOME
$78,352
AVG HOUSEHOLD INCOME
27.3%
WAGE / INCOME GAP [ % ]
72.7¢/ $1
WAGE / INCOME GAP [ $ ]
$13,868
FAMILY INCOME DEFICIT
0.40
INEQUALITY / GINI INDEX
78,881
TOTAL POPULATION
39,871
MALE POPULATION
39,010
FEMALE POPULATION
102.21
MALES / 100 FEMALES
97.84
FEMALES / 100 MALES
30.0
MEDIAN AGE
4.4
AVG FAMILY SIZE
4.2
AVG HOUSEHOLD SIZE
36,799
LABOR FORCE [ PEOPLE ]
63.9%
PERCENT IN LABOR FORCE
7.1%
UNEMPLOYMENT RATE
Perris Area Codes
Income in Perris
Income Overview in Perris
Per Capita Income in Perris is $24,084, while median incomes of families and households are $78,527 and $78,352 respectively.
| Characteristic | Number | Measure |
| Per Capita Income | 78,881 | $24,084 |
| Median Family Income | 16,438 | $78,527 |
| Mean Family Income | 16,438 | $99,022 |
| Median Household Income | 18,640 | $78,352 |
| Mean Household Income | 18,640 | $96,088 |
| Income Deficit | 16,438 | $13,868 |
| Wage / Income Gap (%) | 78,881 | 27.26% |
| Wage / Income Gap ($) | 78,881 | 72.74¢ per $1 |
| Gini / Inequality Index | 78,881 | 0.40 |
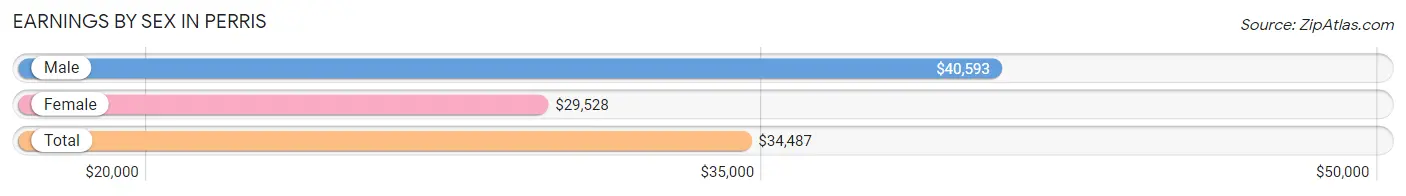
Earnings by Sex in Perris
Average Earnings in Perris are $34,487, $40,593 for men and $29,528 for women, a difference of 27.3%.
| Sex | Number | Average Earnings |
| Male | 20,862 (56.3%) | $40,593 |
| Female | 16,185 (43.7%) | $29,528 |
| Total | 37,047 (100.0%) | $34,487 |
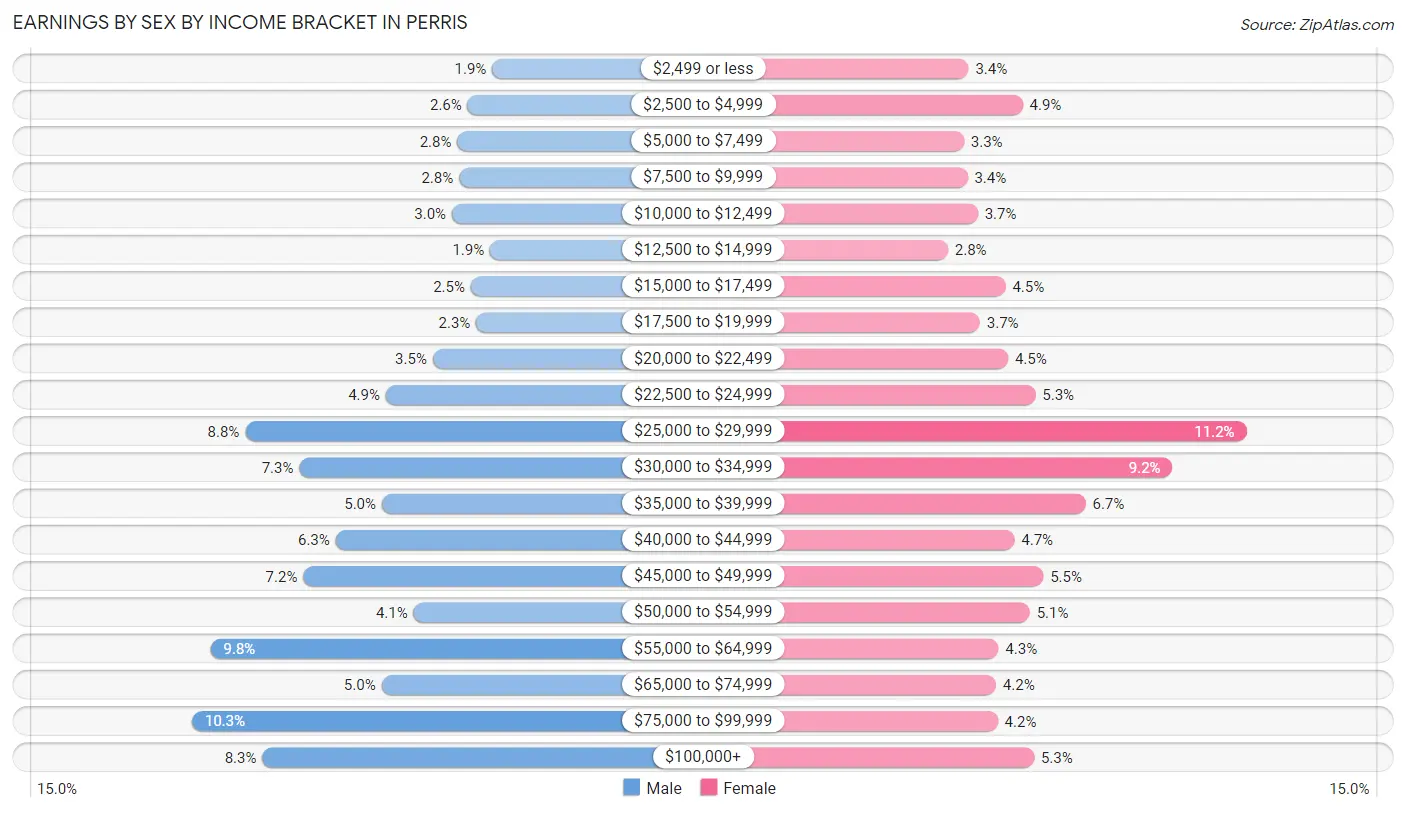
Earnings by Sex by Income Bracket in Perris
The most common earnings brackets in Perris are $75,000 to $99,999 for men (2,148 | 10.3%) and $25,000 to $29,999 for women (1,817 | 11.2%).
| Income | Male | Female |
| $2,499 or less | 387 (1.9%) | 553 (3.4%) |
| $2,500 to $4,999 | 533 (2.5%) | 800 (4.9%) |
| $5,000 to $7,499 | 592 (2.8%) | 533 (3.3%) |
| $7,500 to $9,999 | 583 (2.8%) | 549 (3.4%) |
| $10,000 to $12,499 | 623 (3.0%) | 595 (3.7%) |
| $12,500 to $14,999 | 400 (1.9%) | 460 (2.8%) |
| $15,000 to $17,499 | 514 (2.5%) | 722 (4.5%) |
| $17,500 to $19,999 | 481 (2.3%) | 605 (3.7%) |
| $20,000 to $22,499 | 736 (3.5%) | 733 (4.5%) |
| $22,500 to $24,999 | 1,012 (4.9%) | 858 (5.3%) |
| $25,000 to $29,999 | 1,836 (8.8%) | 1,817 (11.2%) |
| $30,000 to $34,999 | 1,519 (7.3%) | 1,481 (9.1%) |
| $35,000 to $39,999 | 1,034 (5.0%) | 1,086 (6.7%) |
| $40,000 to $44,999 | 1,306 (6.3%) | 762 (4.7%) |
| $45,000 to $49,999 | 1,495 (7.2%) | 893 (5.5%) |
| $50,000 to $54,999 | 850 (4.1%) | 832 (5.1%) |
| $55,000 to $64,999 | 2,041 (9.8%) | 690 (4.3%) |
| $65,000 to $74,999 | 1,036 (5.0%) | 678 (4.2%) |
| $75,000 to $99,999 | 2,148 (10.3%) | 687 (4.2%) |
| $100,000+ | 1,736 (8.3%) | 851 (5.3%) |
| Total | 20,862 (100.0%) | 16,185 (100.0%) |
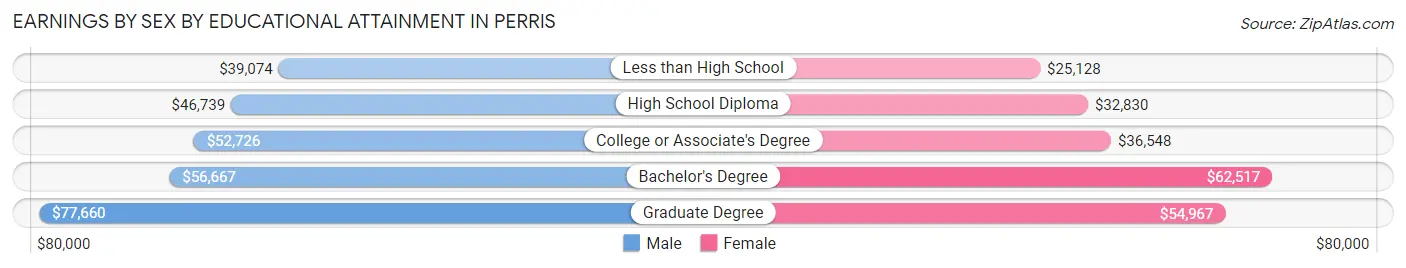
Earnings by Sex by Educational Attainment in Perris
Average earnings in Perris are $45,889 for men and $33,819 for women, a difference of 26.3%. Men with an educational attainment of graduate degree enjoy the highest average annual earnings of $77,660, while those with less than high school education earn the least with $39,074. Women with an educational attainment of bachelor's degree earn the most with the average annual earnings of $62,517, while those with less than high school education have the smallest earnings of $25,128.
| Educational Attainment | Male Income | Female Income |
| Less than High School | $39,074 | $25,128 |
| High School Diploma | $46,739 | $32,830 |
| College or Associate's Degree | $52,726 | $36,548 |
| Bachelor's Degree | $56,667 | $62,517 |
| Graduate Degree | $77,660 | $54,967 |
| Total | $45,889 | $33,819 |
Family Income in Perris
Family Income Brackets in Perris
According to the Perris family income data, there are 3,682 families falling into the $50,000 to $74,999 income range, which is the most common income bracket and makes up 22.4% of all families. Conversely, the $10,000 to $14,999 income bracket is the least frequent group with only 115 families (0.7%) belonging to this category.
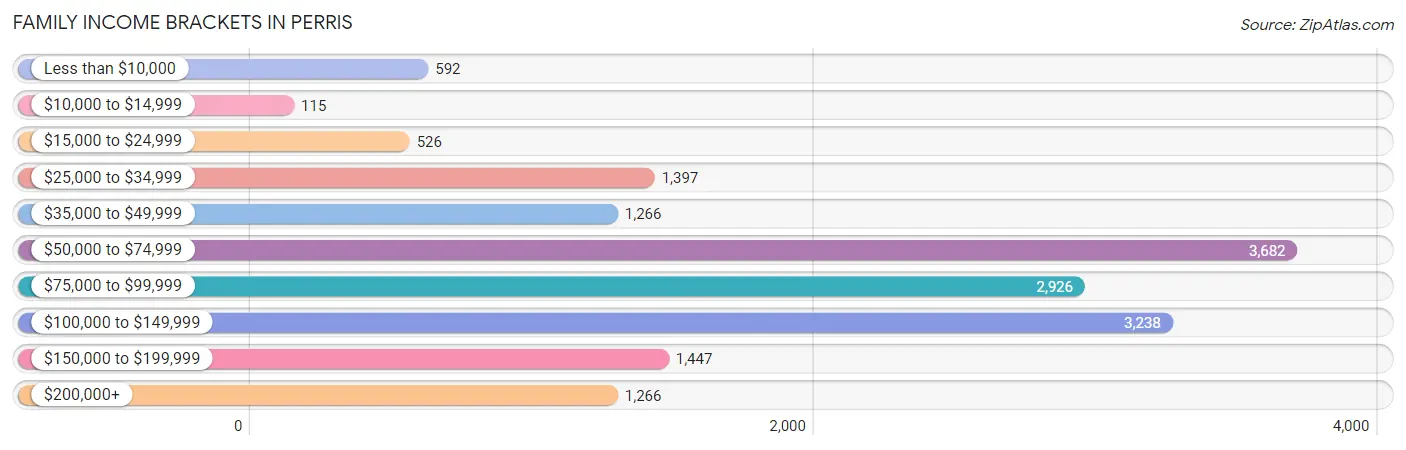
| Income Bracket | # Families | % Families |
| Less than $10,000 | 592 | 3.6% |
| $10,000 to $14,999 | 115 | 0.7% |
| $15,000 to $24,999 | 526 | 3.2% |
| $25,000 to $34,999 | 1,397 | 8.5% |
| $35,000 to $49,999 | 1,266 | 7.7% |
| $50,000 to $74,999 | 3,682 | 22.4% |
| $75,000 to $99,999 | 2,926 | 17.8% |
| $100,000 to $149,999 | 3,238 | 19.7% |
| $150,000 to $199,999 | 1,447 | 8.8% |
| $200,000+ | 1,266 | 7.7% |
Family Income by Famaliy Size in Perris
7+ person families (1,392 | 8.5%) account for the highest median family income in Perris with $122,375 per family, while 2-person families (2,804 | 17.1%) have the highest median income of $29,084 per family member.
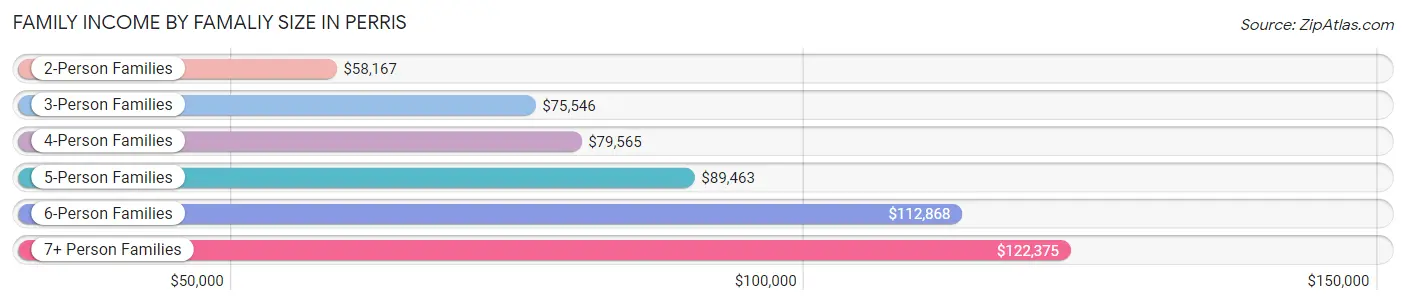
| Income Bracket | # Families | Median Income |
| 2-Person Families | 2,804 (17.1%) | $58,167 |
| 3-Person Families | 3,582 (21.8%) | $75,546 |
| 4-Person Families | 4,203 (25.6%) | $79,565 |
| 5-Person Families | 2,815 (17.1%) | $89,463 |
| 6-Person Families | 1,642 (10.0%) | $112,868 |
| 7+ Person Families | 1,392 (8.5%) | $122,375 |
| Total | 16,438 (100.0%) | $78,527 |
Family Income by Number of Earners in Perris
The median family income in Perris is $78,527, with families comprising 3+ earners (3,952) having the highest median family income of $140,444, while families with no earners (1,166) have the lowest median family income of $30,696, accounting for 24.0% and 7.1% of families, respectively.
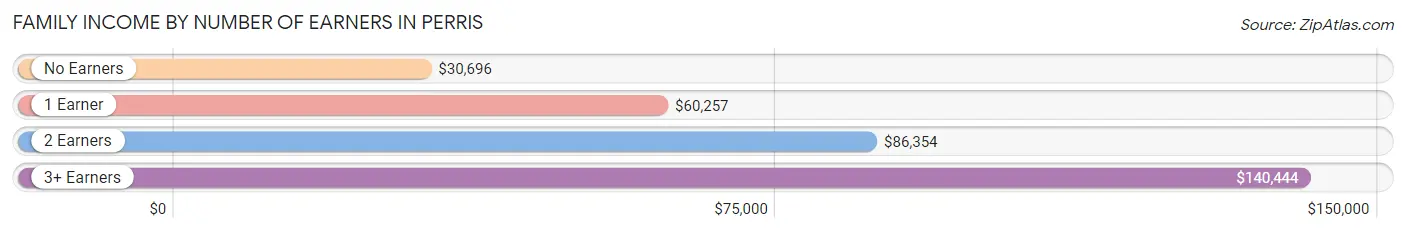
| Number of Earners | # Families | Median Income |
| No Earners | 1,166 (7.1%) | $30,696 |
| 1 Earner | 5,419 (33.0%) | $60,257 |
| 2 Earners | 5,901 (35.9%) | $86,354 |
| 3+ Earners | 3,952 (24.0%) | $140,444 |
| Total | 16,438 (100.0%) | $78,527 |
Household Income in Perris
Household Income Brackets in Perris
With 3,877 households falling in the category, the $50,000 to $74,999 income range is the most frequent in Perris, accounting for 20.8% of all households. In contrast, only 373 households (2.0%) fall into the $10,000 to $14,999 income bracket, making it the least populous group.
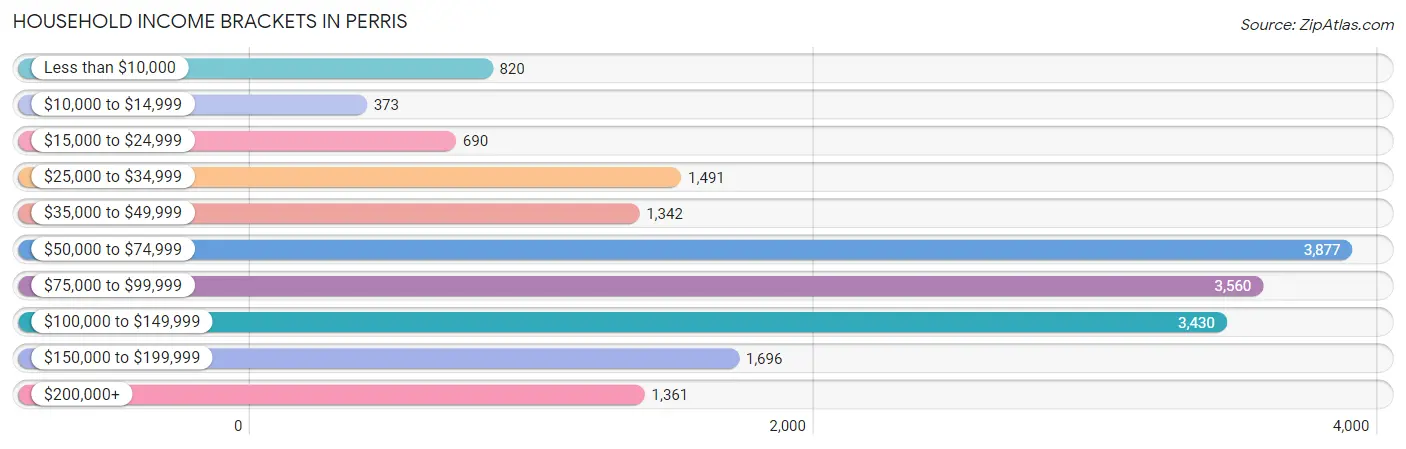
| Income Bracket | # Households | % Households |
| Less than $10,000 | 820 | 4.4% |
| $10,000 to $14,999 | 373 | 2.0% |
| $15,000 to $24,999 | 690 | 3.7% |
| $25,000 to $34,999 | 1,491 | 8.0% |
| $35,000 to $49,999 | 1,342 | 7.2% |
| $50,000 to $74,999 | 3,877 | 20.8% |
| $75,000 to $99,999 | 3,560 | 19.1% |
| $100,000 to $149,999 | 3,430 | 18.4% |
| $150,000 to $199,999 | 1,696 | 9.1% |
| $200,000+ | 1,361 | 7.3% |
Household Income by Householder Age in Perris
The median household income in Perris is $78,352, with the highest median household income of $83,870 found in the 45 to 64 years age bracket for the primary householder. A total of 7,202 households (38.6%) fall into this category. Meanwhile, the 65+ years age bracket for the primary householder has the lowest median household income of $56,040, with 2,347 households (12.6%) in this group.
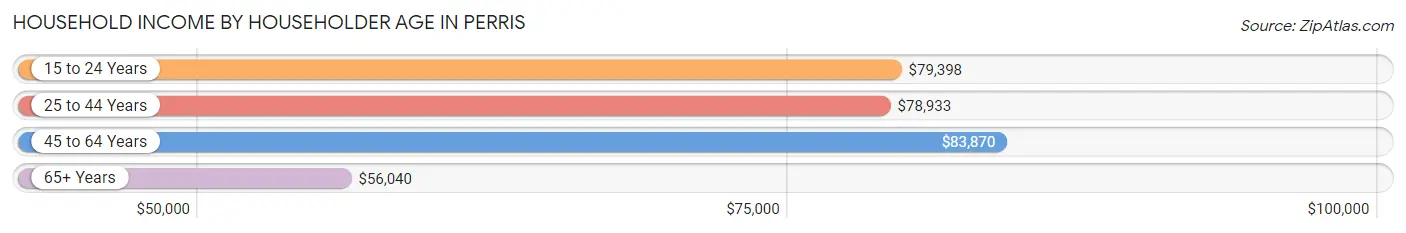
| Income Bracket | # Households | Median Income |
| 15 to 24 Years | 363 (1.9%) | $79,398 |
| 25 to 44 Years | 8,728 (46.8%) | $78,933 |
| 45 to 64 Years | 7,202 (38.6%) | $83,870 |
| 65+ Years | 2,347 (12.6%) | $56,040 |
| Total | 18,640 (100.0%) | $78,352 |
Poverty in Perris
Income Below Poverty by Sex and Age in Perris
With 12.0% poverty level for males and 13.5% for females among the residents of Perris, 15 year old males and 16 and 17 year old females are the most vulnerable to poverty, with 196 males (26.3%) and 307 females (22.1%) in their respective age groups living below the poverty level.
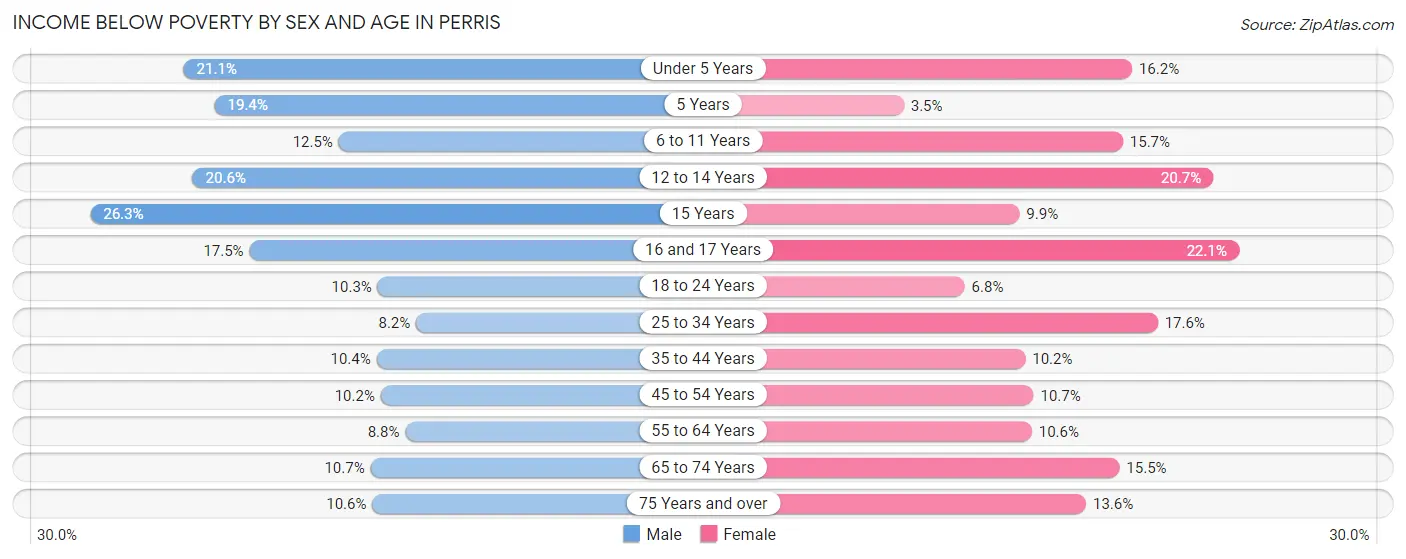
| Age Bracket | Male | Female |
| Under 5 Years | 549 (21.1%) | 511 (16.2%) |
| 5 Years | 133 (19.4%) | 12 (3.5%) |
| 6 to 11 Years | 526 (12.5%) | 637 (15.7%) |
| 12 to 14 Years | 444 (20.6%) | 470 (20.7%) |
| 15 Years | 196 (26.3%) | 69 (9.9%) |
| 16 and 17 Years | 216 (17.5%) | 307 (22.1%) |
| 18 to 24 Years | 495 (10.3%) | 281 (6.8%) |
| 25 to 34 Years | 529 (8.2%) | 1,045 (17.6%) |
| 35 to 44 Years | 552 (10.4%) | 534 (10.2%) |
| 45 to 54 Years | 548 (10.2%) | 477 (10.7%) |
| 55 to 64 Years | 316 (8.8%) | 431 (10.6%) |
| 65 to 74 Years | 158 (10.7%) | 298 (15.5%) |
| 75 Years and over | 102 (10.6%) | 154 (13.6%) |
| Total | 4,764 (12.0%) | 5,226 (13.5%) |
Income Above Poverty by Sex and Age in Perris
According to the poverty statistics in Perris, males aged 25 to 34 years and females aged 5 years are the age groups that are most secure financially, with 91.8% of males and 96.6% of females in these age groups living above the poverty line.
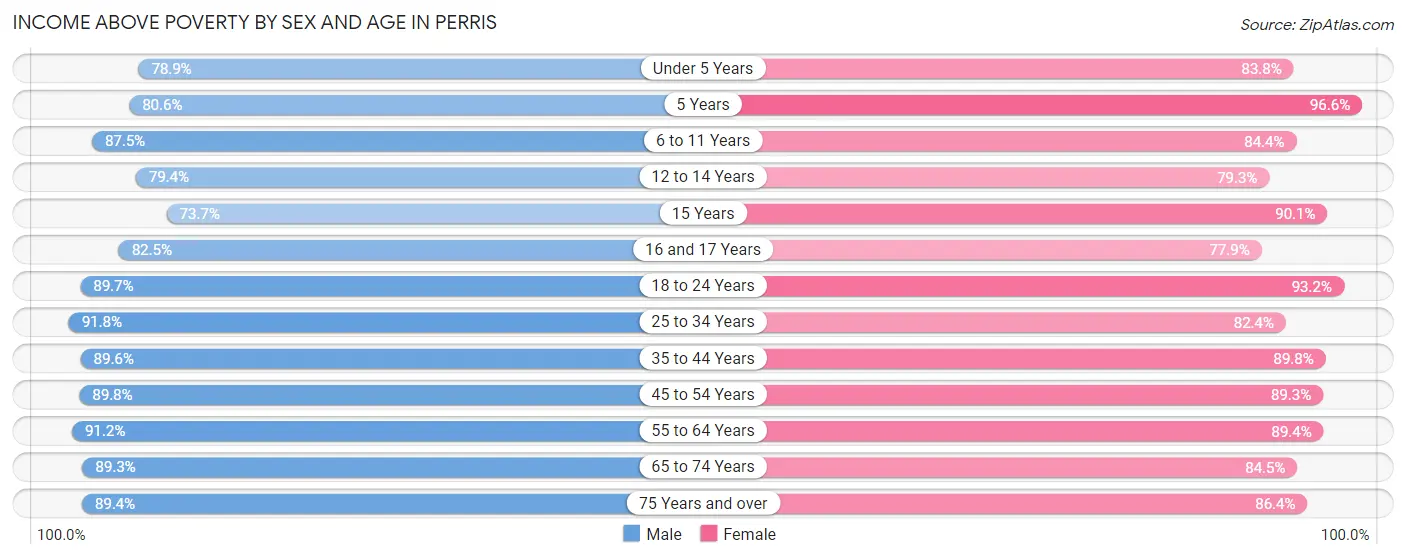
| Age Bracket | Male | Female |
| Under 5 Years | 2,048 (78.9%) | 2,651 (83.8%) |
| 5 Years | 552 (80.6%) | 336 (96.6%) |
| 6 to 11 Years | 3,680 (87.5%) | 3,434 (84.4%) |
| 12 to 14 Years | 1,707 (79.4%) | 1,804 (79.3%) |
| 15 Years | 548 (73.7%) | 629 (90.1%) |
| 16 and 17 Years | 1,020 (82.5%) | 1,082 (77.9%) |
| 18 to 24 Years | 4,290 (89.7%) | 3,825 (93.2%) |
| 25 to 34 Years | 5,925 (91.8%) | 4,896 (82.4%) |
| 35 to 44 Years | 4,754 (89.6%) | 4,692 (89.8%) |
| 45 to 54 Years | 4,839 (89.8%) | 3,990 (89.3%) |
| 55 to 64 Years | 3,275 (91.2%) | 3,641 (89.4%) |
| 65 to 74 Years | 1,313 (89.3%) | 1,630 (84.5%) |
| 75 Years and over | 857 (89.4%) | 978 (86.4%) |
| Total | 34,808 (88.0%) | 33,588 (86.5%) |
Income Below Poverty Among Married-Couple Families in Perris
The poverty statistics for married-couple families in Perris show that 6.5% or 743 of the total 11,458 families live below the poverty line. Families with 5 or more children have the highest poverty rate of 58.5%, comprising of 96 families. On the other hand, families with 1 or 2 children have the lowest poverty rate of 3.4%, which includes 183 families.
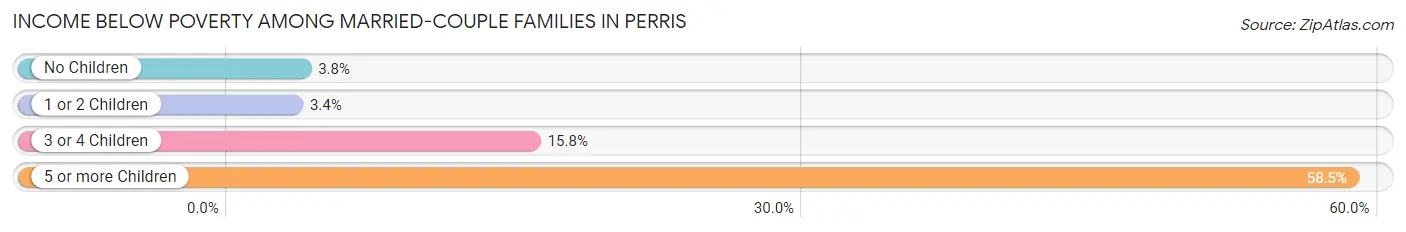
| Children | Above Poverty | Below Poverty |
| No Children | 3,752 (96.2%) | 149 (3.8%) |
| 1 or 2 Children | 5,218 (96.6%) | 183 (3.4%) |
| 3 or 4 Children | 1,677 (84.2%) | 315 (15.8%) |
| 5 or more Children | 68 (41.5%) | 96 (58.5%) |
| Total | 10,715 (93.5%) | 743 (6.5%) |
Income Below Poverty Among Single-Parent Households in Perris
According to the poverty data in Perris, 13.0% or 210 single-father households and 21.5% or 724 single-mother households are living below the poverty line. Among single-father households, those with 3 or 4 children have the highest poverty rate, with 79 households (54.5%) experiencing poverty. Likewise, among single-mother households, those with 3 or 4 children have the highest poverty rate, with 388 households (55.2%) falling below the poverty line.
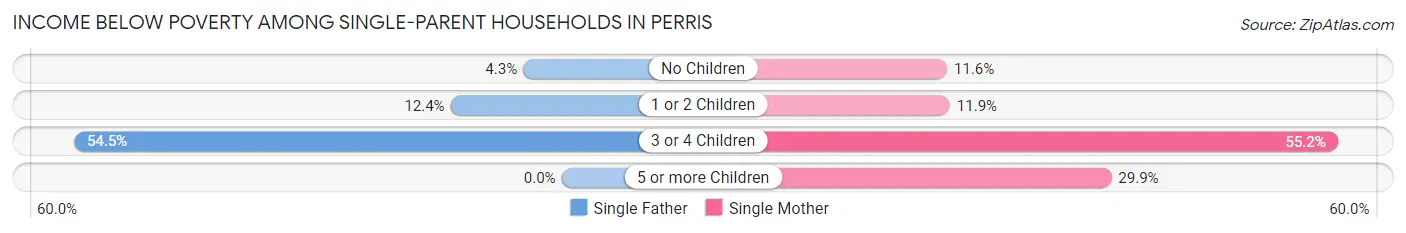
| Children | Single Father | Single Mother |
| No Children | 27 (4.3%) | 125 (11.6%) |
| 1 or 2 Children | 104 (12.4%) | 173 (11.9%) |
| 3 or 4 Children | 79 (54.5%) | 388 (55.2%) |
| 5 or more Children | 0 (0.0%) | 38 (29.9%) |
| Total | 210 (13.0%) | 724 (21.5%) |
Income Below Poverty Among Married-Couple vs Single-Parent Households in Perris
The poverty data for Perris shows that 743 of the married-couple family households (6.5%) and 934 of the single-parent households (18.8%) are living below the poverty level. Within the married-couple family households, those with 5 or more children have the highest poverty rate, with 96 households (58.5%) falling below the poverty line. Among the single-parent households, those with 3 or 4 children have the highest poverty rate, with 467 household (55.1%) living below poverty.
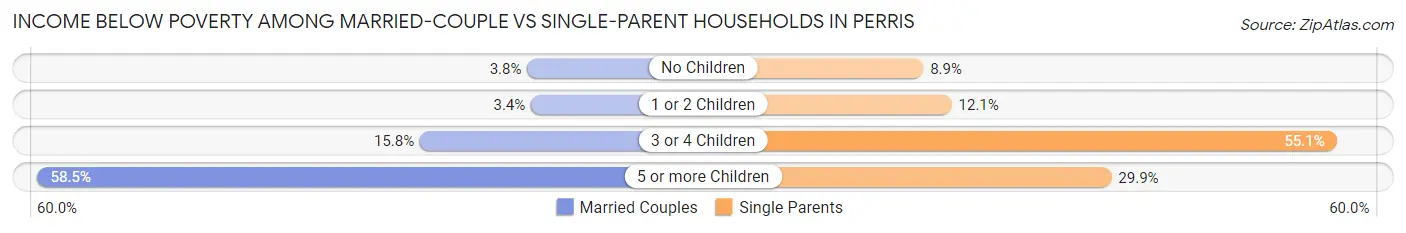
| Children | Married-Couple Families | Single-Parent Households |
| No Children | 149 (3.8%) | 152 (8.9%) |
| 1 or 2 Children | 183 (3.4%) | 277 (12.1%) |
| 3 or 4 Children | 315 (15.8%) | 467 (55.1%) |
| 5 or more Children | 96 (58.5%) | 38 (29.9%) |
| Total | 743 (6.5%) | 934 (18.8%) |
Race in Perris
The most populous races in Perris are Hispanic or Latino (62,211 | 78.9%), Some other Race (39,419 | 50.0%), and White / Caucasian (18,543 | 23.5%).
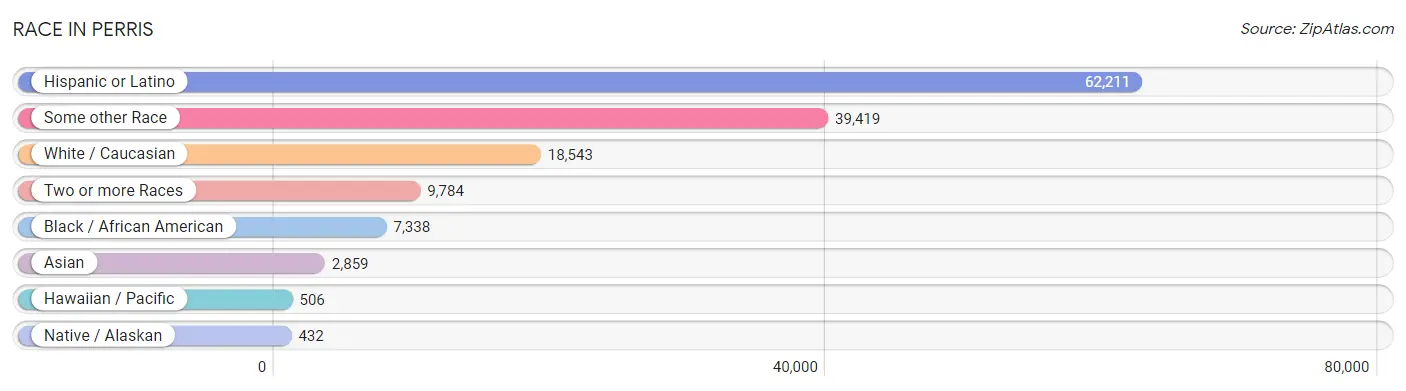
| Race | # Population | % Population |
| Asian | 2,859 | 3.6% |
| Black / African American | 7,338 | 9.3% |
| Hawaiian / Pacific | 506 | 0.6% |
| Hispanic or Latino | 62,211 | 78.9% |
| Native / Alaskan | 432 | 0.5% |
| White / Caucasian | 18,543 | 23.5% |
| Two or more Races | 9,784 | 12.4% |
| Some other Race | 39,419 | 50.0% |
| Total | 78,881 | 100.0% |
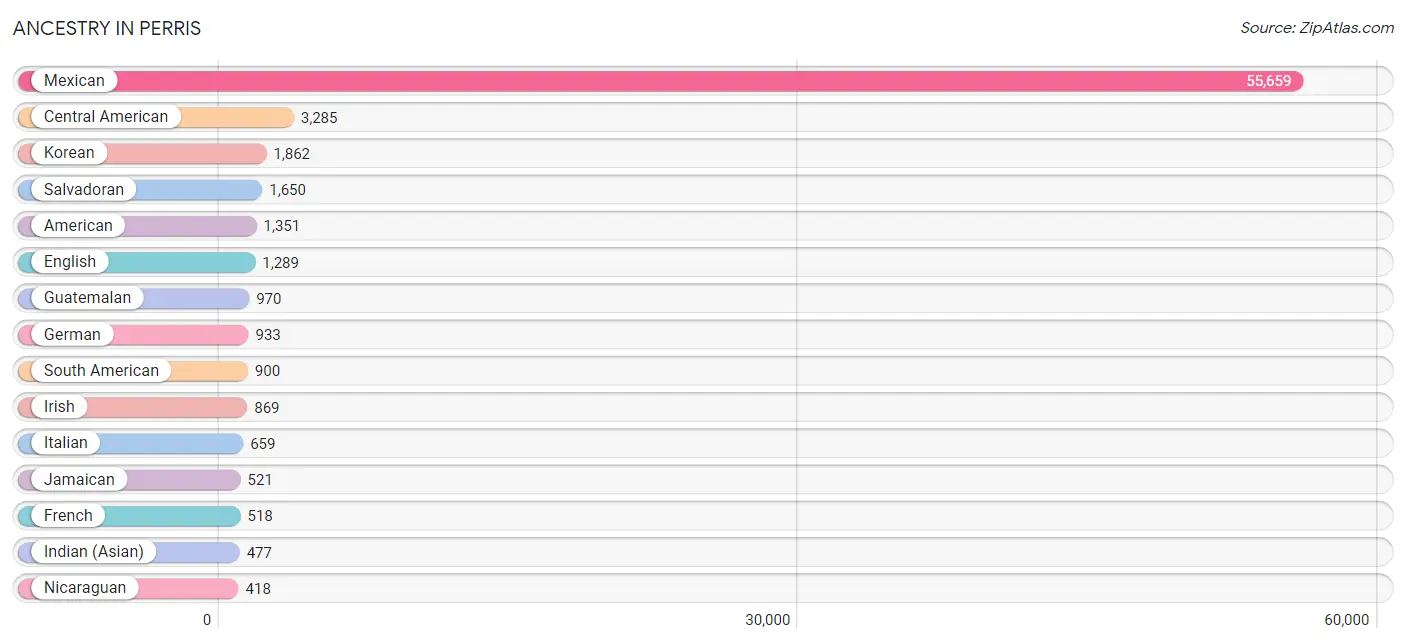
Ancestry in Perris
The most populous ancestries reported in Perris are Mexican (55,659 | 70.6%), Central American (3,285 | 4.2%), Korean (1,862 | 2.4%), Salvadoran (1,650 | 2.1%), and American (1,351 | 1.7%), together accounting for 80.9% of all Perris residents.
| Ancestry | # Population | % Population |
| African | 256 | 0.3% |
| American | 1,351 | 1.7% |
| Apache | 20 | 0.0% |
| Arab | 160 | 0.2% |
| Argentinean | 256 | 0.3% |
| Austrian | 32 | 0.0% |
| Bangladeshi | 82 | 0.1% |
| Basque | 8 | 0.0% |
| Belizean | 291 | 0.4% |
| Bhutanese | 395 | 0.5% |
| Blackfeet | 20 | 0.0% |
| Brazilian | 17 | 0.0% |
| Burmese | 43 | 0.1% |
| Canadian | 34 | 0.0% |
| Central American | 3,285 | 4.2% |
| Central American Indian | 12 | 0.0% |
| Cherokee | 83 | 0.1% |
| Choctaw | 18 | 0.0% |
| Colombian | 238 | 0.3% |
| Cuban | 106 | 0.1% |
| Czech | 30 | 0.0% |
| Danish | 13 | 0.0% |
| Dutch | 80 | 0.1% |
| Ecuadorian | 38 | 0.1% |
| English | 1,289 | 1.6% |
| European | 173 | 0.2% |
| Filipino | 27 | 0.0% |
| Finnish | 10 | 0.0% |
| French | 518 | 0.7% |
| French Canadian | 148 | 0.2% |
| German | 933 | 1.2% |
| Guamanian / Chamorro | 181 | 0.2% |
| Guatemalan | 970 | 1.2% |
| Honduran | 53 | 0.1% |
| Indian (Asian) | 477 | 0.6% |
| Iranian | 10 | 0.0% |
| Iraqi | 31 | 0.0% |
| Irish | 869 | 1.1% |
| Italian | 659 | 0.8% |
| Jamaican | 521 | 0.7% |
| Japanese | 130 | 0.2% |
| Korean | 1,862 | 2.4% |
| Laotian | 76 | 0.1% |
| Lebanese | 23 | 0.0% |
| Mexican | 55,659 | 70.6% |
| Mexican American Indian | 343 | 0.4% |
| Mongolian | 22 | 0.0% |
| Native Hawaiian | 14 | 0.0% |
| Navajo | 38 | 0.1% |
| Nicaraguan | 418 | 0.5% |
| Nigerian | 67 | 0.1% |
| Norwegian | 98 | 0.1% |
| Pakistani | 103 | 0.1% |
| Panamanian | 136 | 0.2% |
| Peruvian | 285 | 0.4% |
| Polish | 25 | 0.0% |
| Portuguese | 43 | 0.1% |
| Pueblo | 24 | 0.0% |
| Puerto Rican | 385 | 0.5% |
| Romanian | 79 | 0.1% |
| Russian | 10 | 0.0% |
| Salvadoran | 1,650 | 2.1% |
| Samoan | 311 | 0.4% |
| Scandinavian | 71 | 0.1% |
| Scotch-Irish | 10 | 0.0% |
| Scottish | 76 | 0.1% |
| South American | 900 | 1.1% |
| Spaniard | 151 | 0.2% |
| Spanish | 193 | 0.2% |
| Sri Lankan | 254 | 0.3% |
| Subsaharan African | 323 | 0.4% |
| Swedish | 70 | 0.1% |
| Swiss | 5 | 0.0% |
| Thai | 120 | 0.2% |
| Venezuelan | 64 | 0.1% |
| West Indian | 12 | 0.0% |
| Yaqui | 40 | 0.1% |
| Yup'ik | 46 | 0.1% | View All 78 Rows |
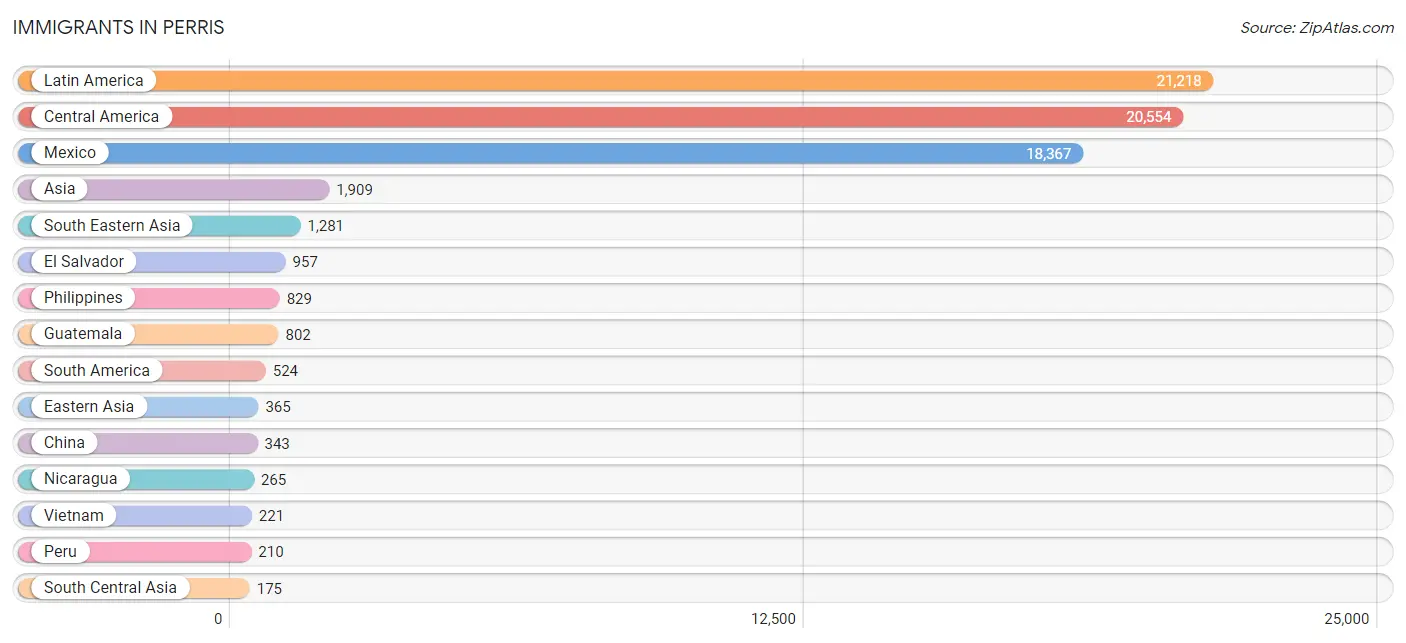
Immigrants in Perris
The most numerous immigrant groups reported in Perris came from Latin America (21,218 | 26.9%), Central America (20,554 | 26.1%), Mexico (18,367 | 23.3%), Asia (1,909 | 2.4%), and South Eastern Asia (1,281 | 1.6%), together accounting for 80.3% of all Perris residents.
| Immigration Origin | # Population | % Population |
| Africa | 169 | 0.2% |
| Argentina | 19 | 0.0% |
| Asia | 1,909 | 2.4% |
| Belize | 36 | 0.1% |
| Brazil | 85 | 0.1% |
| Cambodia | 117 | 0.2% |
| Canada | 46 | 0.1% |
| Caribbean | 140 | 0.2% |
| Central America | 20,554 | 26.1% |
| China | 343 | 0.4% |
| Colombia | 142 | 0.2% |
| Cuba | 10 | 0.0% |
| Eastern Africa | 117 | 0.2% |
| Eastern Asia | 365 | 0.5% |
| Eastern Europe | 15 | 0.0% |
| Ecuador | 38 | 0.1% |
| El Salvador | 957 | 1.2% |
| England | 10 | 0.0% |
| Europe | 116 | 0.2% |
| Fiji | 27 | 0.0% |
| Germany | 40 | 0.1% |
| Guatemala | 802 | 1.0% |
| Guyana | 7 | 0.0% |
| Honduras | 42 | 0.1% |
| Hong Kong | 98 | 0.1% |
| India | 165 | 0.2% |
| Indonesia | 37 | 0.1% |
| Iran | 10 | 0.0% |
| Iraq | 22 | 0.0% |
| Jamaica | 130 | 0.2% |
| Japan | 10 | 0.0% |
| Kenya | 117 | 0.2% |
| Korea | 12 | 0.0% |
| Laos | 32 | 0.0% |
| Latin America | 21,218 | 26.9% |
| Mexico | 18,367 | 23.3% |
| Nicaragua | 265 | 0.3% |
| Nigeria | 25 | 0.0% |
| Northern Europe | 61 | 0.1% |
| Oceania | 147 | 0.2% |
| Panama | 85 | 0.1% |
| Peru | 210 | 0.3% |
| Philippines | 829 | 1.1% |
| Romania | 15 | 0.0% |
| Singapore | 5 | 0.0% |
| South America | 524 | 0.7% |
| South Central Asia | 175 | 0.2% |
| South Eastern Asia | 1,281 | 1.6% |
| Sweden | 29 | 0.0% |
| Syria | 66 | 0.1% |
| Taiwan | 27 | 0.0% |
| Thailand | 40 | 0.1% |
| Venezuela | 23 | 0.0% |
| Vietnam | 221 | 0.3% |
| Western Africa | 25 | 0.0% |
| Western Asia | 88 | 0.1% |
| Western Europe | 40 | 0.1% | View All 57 Rows |
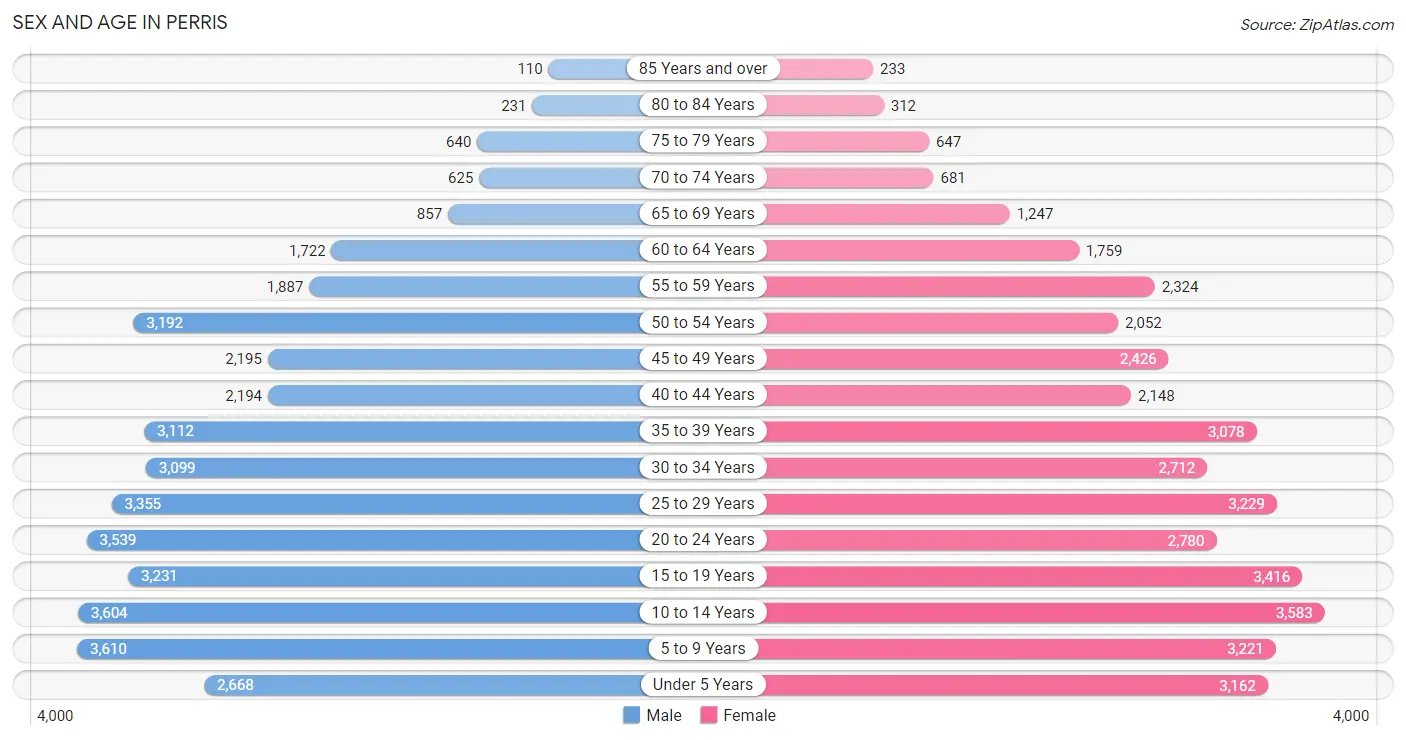
Sex and Age in Perris
Sex and Age in Perris
The most populous age groups in Perris are 5 to 9 Years (3,610 | 9.0%) for men and 10 to 14 Years (3,583 | 9.2%) for women.
| Age Bracket | Male | Female |
| Under 5 Years | 2,668 (6.7%) | 3,162 (8.1%) |
| 5 to 9 Years | 3,610 (9.0%) | 3,221 (8.3%) |
| 10 to 14 Years | 3,604 (9.0%) | 3,583 (9.2%) |
| 15 to 19 Years | 3,231 (8.1%) | 3,416 (8.8%) |
| 20 to 24 Years | 3,539 (8.9%) | 2,780 (7.1%) |
| 25 to 29 Years | 3,355 (8.4%) | 3,229 (8.3%) |
| 30 to 34 Years | 3,099 (7.8%) | 2,712 (7.0%) |
| 35 to 39 Years | 3,112 (7.8%) | 3,078 (7.9%) |
| 40 to 44 Years | 2,194 (5.5%) | 2,148 (5.5%) |
| 45 to 49 Years | 2,195 (5.5%) | 2,426 (6.2%) |
| 50 to 54 Years | 3,192 (8.0%) | 2,052 (5.3%) |
| 55 to 59 Years | 1,887 (4.7%) | 2,324 (6.0%) |
| 60 to 64 Years | 1,722 (4.3%) | 1,759 (4.5%) |
| 65 to 69 Years | 857 (2.1%) | 1,247 (3.2%) |
| 70 to 74 Years | 625 (1.6%) | 681 (1.8%) |
| 75 to 79 Years | 640 (1.6%) | 647 (1.7%) |
| 80 to 84 Years | 231 (0.6%) | 312 (0.8%) |
| 85 Years and over | 110 (0.3%) | 233 (0.6%) |
| Total | 39,871 (100.0%) | 39,010 (100.0%) |
Families and Households in Perris
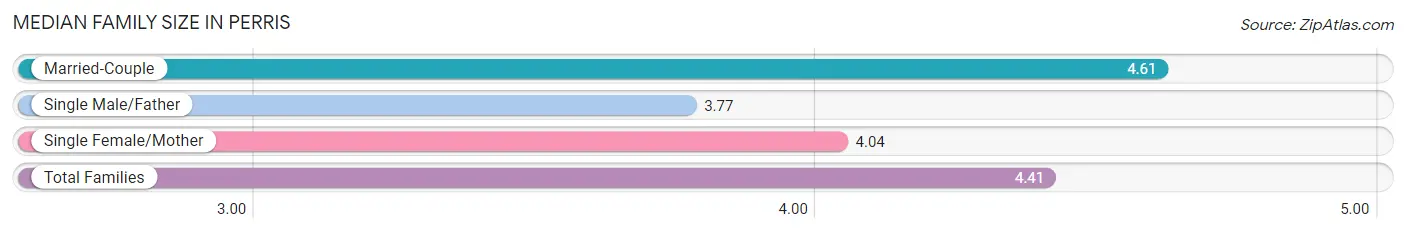
Median Family Size in Perris
The median family size in Perris is 4.41 persons per family, with married-couple families (11,458 | 69.7%) accounting for the largest median family size of 4.61 persons per family. On the other hand, single male/father families (1,611 | 9.8%) represent the smallest median family size with 3.77 persons per family.
| Family Type | # Families | Family Size |
| Married-Couple | 11,458 (69.7%) | 4.61 |
| Single Male/Father | 1,611 (9.8%) | 3.77 |
| Single Female/Mother | 3,369 (20.5%) | 4.04 |
| Total Families | 16,438 (100.0%) | 4.41 |
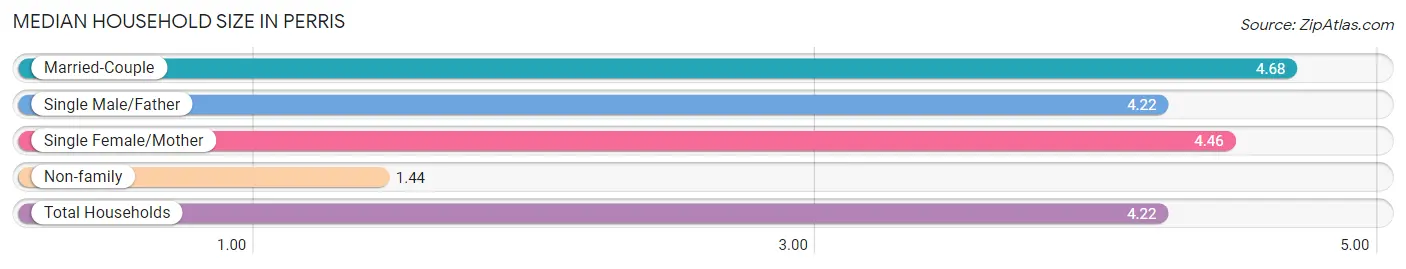
Median Household Size in Perris
The median household size in Perris is 4.22 persons per household, with married-couple households (11,458 | 61.5%) accounting for the largest median household size of 4.68 persons per household. non-family households (2,202 | 11.8%) represent the smallest median household size with 1.44 persons per household.
| Household Type | # Households | Household Size |
| Married-Couple | 11,458 (61.5%) | 4.68 |
| Single Male/Father | 1,611 (8.6%) | 4.22 |
| Single Female/Mother | 3,369 (18.1%) | 4.46 |
| Non-family | 2,202 (11.8%) | 1.44 |
| Total Households | 18,640 (100.0%) | 4.22 |
Household Size by Marriage Status in Perris
Out of a total of 18,640 households in Perris, 16,438 (88.2%) are family households, while 2,202 (11.8%) are nonfamily households. The most numerous type of family households are 4-person households, comprising 4,521, and the most common type of nonfamily households are 1-person households, comprising 1,650.
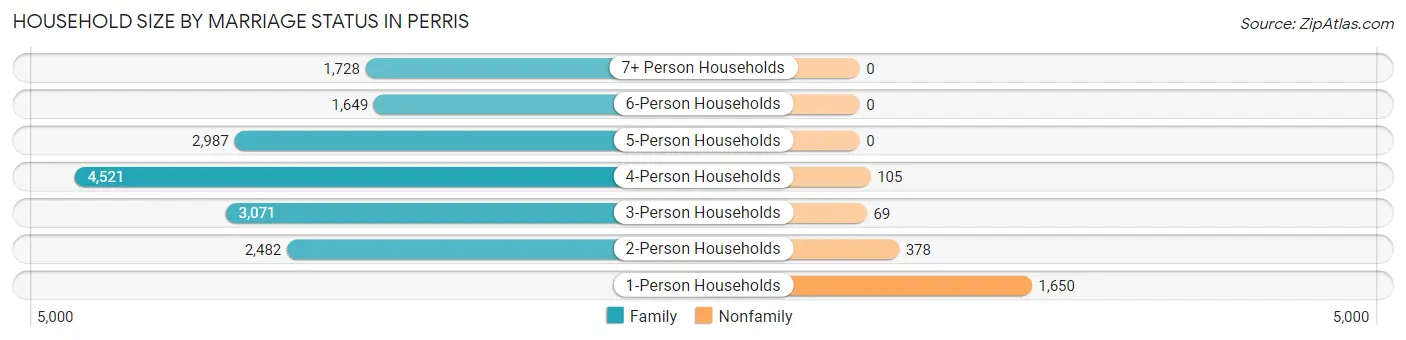
| Household Size | Family Households | Nonfamily Households |
| 1-Person Households | - | 1,650 (8.8%) |
| 2-Person Households | 2,482 (13.3%) | 378 (2.0%) |
| 3-Person Households | 3,071 (16.5%) | 69 (0.4%) |
| 4-Person Households | 4,521 (24.2%) | 105 (0.6%) |
| 5-Person Households | 2,987 (16.0%) | 0 (0.0%) |
| 6-Person Households | 1,649 (8.8%) | 0 (0.0%) |
| 7+ Person Households | 1,728 (9.3%) | 0 (0.0%) |
| Total | 16,438 (88.2%) | 2,202 (11.8%) |
Female Fertility in Perris
Fertility by Age in Perris
Average fertility rate in Perris is 54.0 births per 1,000 women. Women in the age bracket of 20 to 34 years have the highest fertility rate with 100.0 births per 1,000 women. Women in the age bracket of 20 to 34 years acount for 80.0% of all women with births.
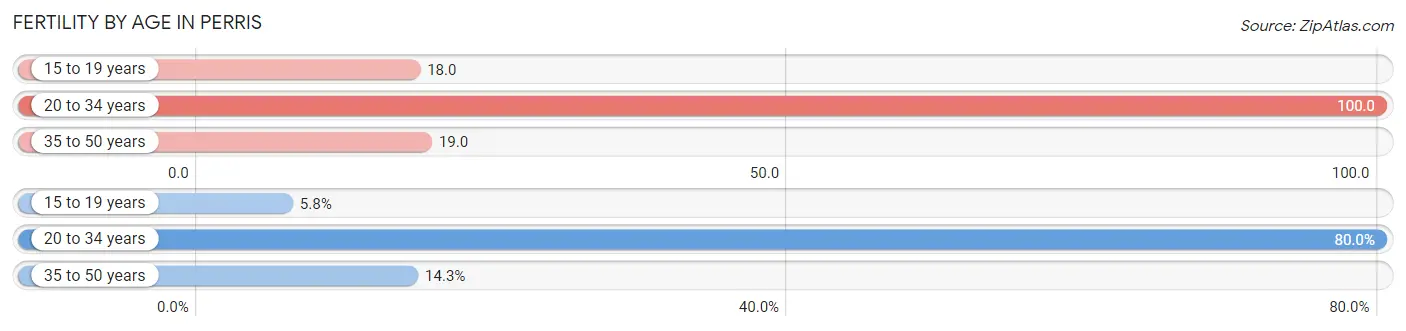
| Age Bracket | Women with Births | Births / 1,000 Women |
| 15 to 19 years | 63 (5.8%) | 18.0 |
| 20 to 34 years | 875 (80.0%) | 100.0 |
| 35 to 50 years | 156 (14.3%) | 19.0 |
| Total | 1,094 (100.0%) | 54.0 |
Fertility by Age by Marriage Status in Perris
55.9% of women with births (1,094) in Perris are married. The highest percentage of unmarried women with births falls into 15 to 19 years age bracket with 100.0% of them unmarried at the time of birth, while the lowest percentage of unmarried women with births belong to 35 to 50 years age bracket with 33.3% of them unmarried.
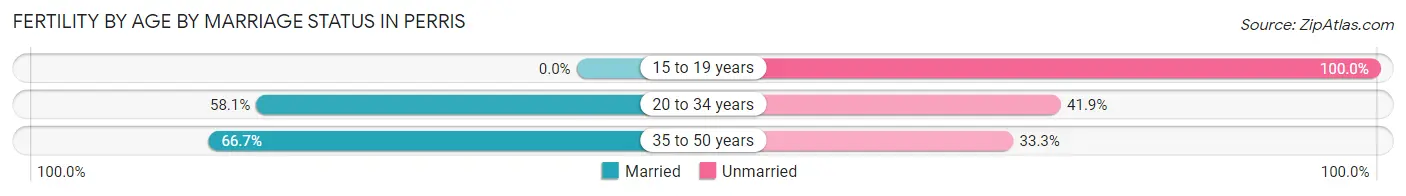
| Age Bracket | Married | Unmarried |
| 15 to 19 years | 0 (0.0%) | 63 (100.0%) |
| 20 to 34 years | 508 (58.1%) | 367 (41.9%) |
| 35 to 50 years | 104 (66.7%) | 52 (33.3%) |
| Total | 612 (55.9%) | 482 (44.1%) |
Fertility by Education in Perris
Average fertility rate in Perris is 54.0 births per 1,000 women. Women with the education attainment of college or associate's degree have the highest fertility rate of 87.0 births per 1,000 women, while women with the education attainment of less than high school have the lowest fertility at 11.0 births per 1,000 women. Women with the education attainment of college or associate's degree represent 50.6% of all women with births.
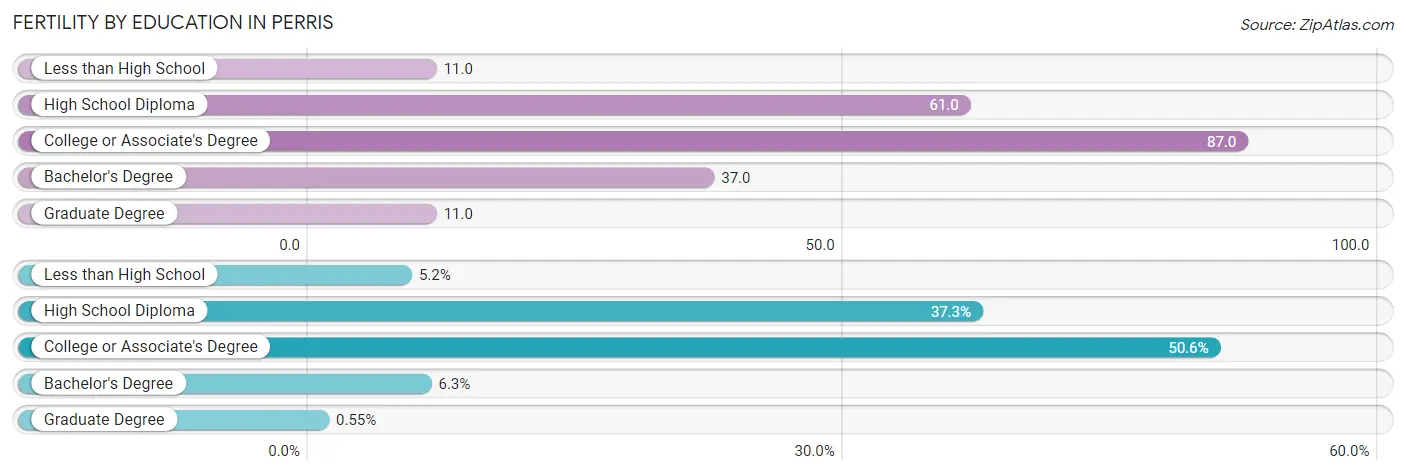
| Educational Attainment | Women with Births | Births / 1,000 Women |
| Less than High School | 57 (5.2%) | 11.0 |
| High School Diploma | 408 (37.3%) | 61.0 |
| College or Associate's Degree | 554 (50.6%) | 87.0 |
| Bachelor's Degree | 69 (6.3%) | 37.0 |
| Graduate Degree | 6 (0.5%) | 11.0 |
| Total | 1,094 (100.0%) | 54.0 |
Fertility by Education by Marriage Status in Perris
44.1% of women with births in Perris are unmarried. Women with the educational attainment of graduate degree are most likely to be married with 100.0% of them married at childbirth, while women with the educational attainment of high school diploma are least likely to be married with 46.3% of them unmarried at childbirth.
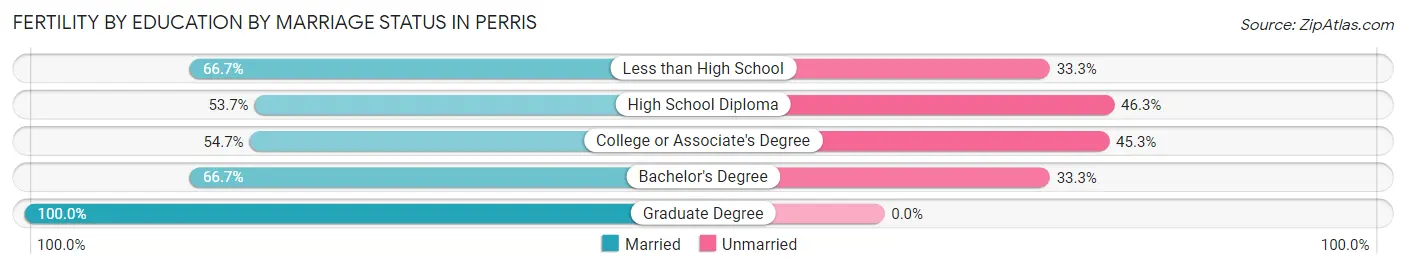
| Educational Attainment | Married | Unmarried |
| Less than High School | 38 (66.7%) | 19 (33.3%) |
| High School Diploma | 219 (53.7%) | 189 (46.3%) |
| College or Associate's Degree | 303 (54.7%) | 251 (45.3%) |
| Bachelor's Degree | 46 (66.7%) | 23 (33.3%) |
| Graduate Degree | 6 (100.0%) | 0 (0.0%) |
| Total | 612 (55.9%) | 482 (44.1%) |
Employment Characteristics in Perris
Employment by Class of Employer in Perris
Among the 33,501 employed individuals in Perris, private company employees (26,125 | 78.0%), local government employees (2,793 | 8.3%), and self-employed (not incorporated) (1,528 | 4.6%) make up the most common classes of employment.
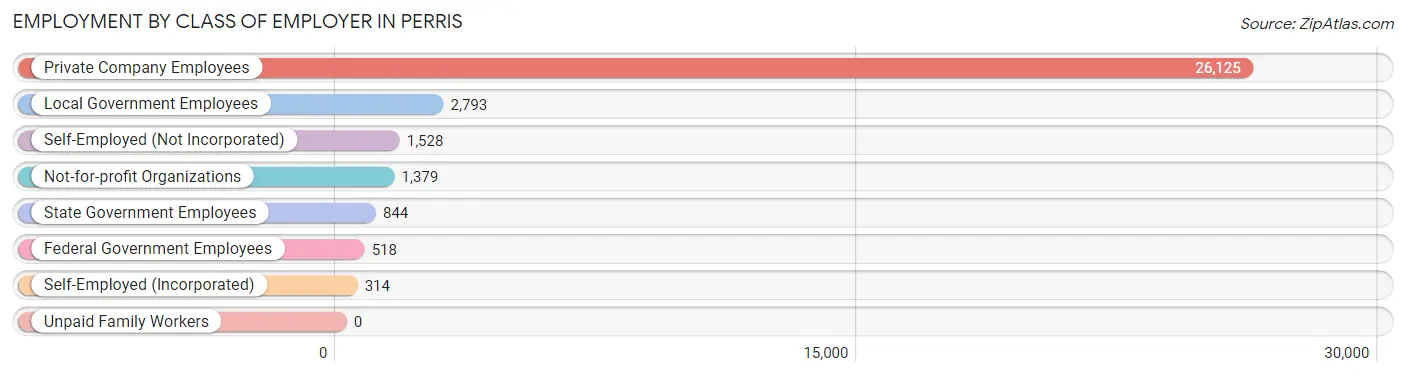
| Employer Class | # Employees | % Employees |
| Private Company Employees | 26,125 | 78.0% |
| Self-Employed (Incorporated) | 314 | 0.9% |
| Self-Employed (Not Incorporated) | 1,528 | 4.6% |
| Not-for-profit Organizations | 1,379 | 4.1% |
| Local Government Employees | 2,793 | 8.3% |
| State Government Employees | 844 | 2.5% |
| Federal Government Employees | 518 | 1.5% |
| Unpaid Family Workers | 0 | 0.0% |
| Total | 33,501 | 100.0% |
Employment Status by Age in Perris
According to the labor force statistics for Perris, out of the total population over 16 years of age (57,589), 63.9% or 36,799 individuals are in the labor force, with 7.1% or 2,613 of them unemployed. The age group with the highest labor force participation rate is 35 to 44 years, with 79.7% or 8,394 individuals in the labor force. Within the labor force, the 16 to 19 years age range has the highest percentage of unemployed individuals, with 20.3% or 319 of them being unemployed.
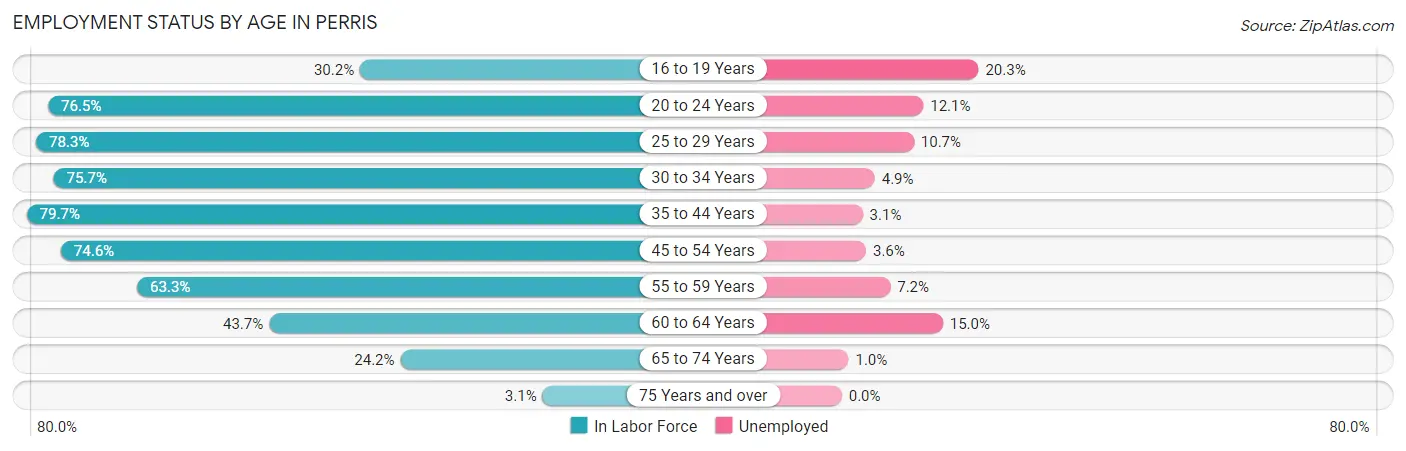
| Age Bracket | In Labor Force | Unemployed |
| 16 to 19 Years | 1,571 (30.2%) | 319 (20.3%) |
| 20 to 24 Years | 4,834 (76.5%) | 585 (12.1%) |
| 25 to 29 Years | 5,155 (78.3%) | 552 (10.7%) |
| 30 to 34 Years | 4,399 (75.7%) | 216 (4.9%) |
| 35 to 44 Years | 8,394 (79.7%) | 260 (3.1%) |
| 45 to 54 Years | 7,359 (74.6%) | 265 (3.6%) |
| 55 to 59 Years | 2,666 (63.3%) | 192 (7.2%) |
| 60 to 64 Years | 1,521 (43.7%) | 228 (15.0%) |
| 65 to 74 Years | 825 (24.2%) | 8 (1.0%) |
| 75 Years and over | 67 (3.1%) | 0 (0.0%) |
| Total | 36,799 (63.9%) | 2,613 (7.1%) |
Employment Status by Educational Attainment in Perris
According to labor force statistics for Perris, 72.9% of individuals (29,513) out of the total population between 25 and 64 years of age (40,484) are in the labor force, with 5.8% or 1,712 of them being unemployed. The group with the highest labor force participation rate are those with the educational attainment of bachelor's degree or higher, with 86.0% or 3,664 individuals in the labor force. Within the labor force, individuals with college / associate degree education have the highest percentage of unemployment, with 8.3% or 772 of them being unemployed.
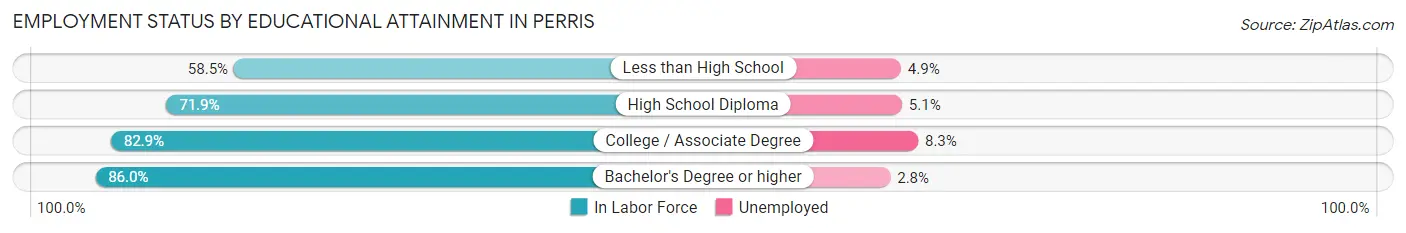
| Educational Attainment | In Labor Force | Unemployed |
| Less than High School | 6,286 (58.5%) | 527 (4.9%) |
| High School Diploma | 10,248 (71.9%) | 727 (5.1%) |
| College / Associate Degree | 9,306 (82.9%) | 932 (8.3%) |
| Bachelor's Degree or higher | 3,664 (86.0%) | 119 (2.8%) |
| Total | 29,513 (72.9%) | 2,348 (5.8%) |
Employment Occupations by Sex in Perris
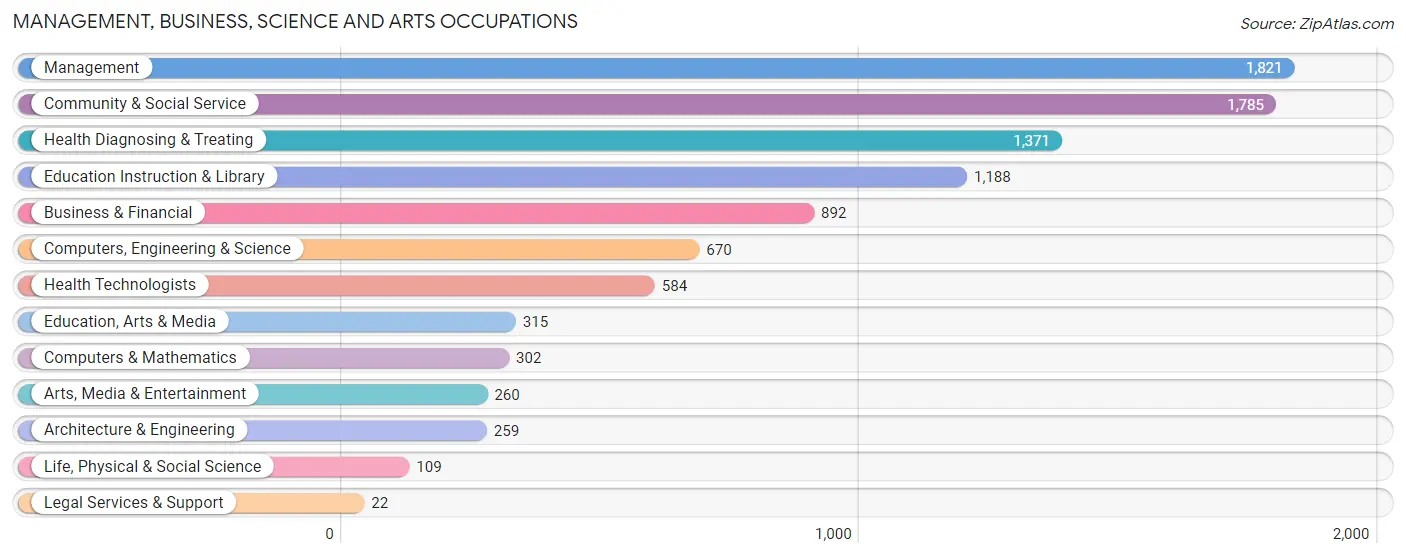
Management, Business, Science and Arts Occupations
The most common Management, Business, Science and Arts occupations in Perris are Management (1,821 | 5.3%), Community & Social Service (1,785 | 5.2%), Health Diagnosing & Treating (1,371 | 4.0%), Education Instruction & Library (1,188 | 3.5%), and Business & Financial (892 | 2.6%).
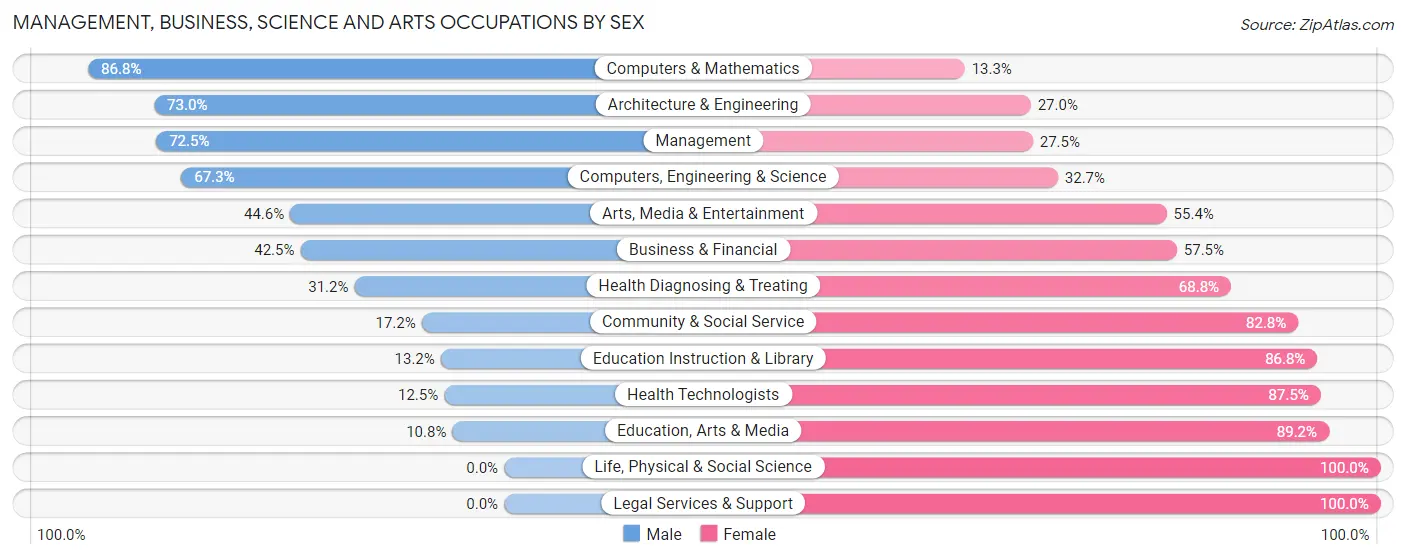
Management, Business, Science and Arts Occupations by Sex
Within the Management, Business, Science and Arts occupations in Perris, the most male-oriented occupations are Computers & Mathematics (86.8%), Architecture & Engineering (73.0%), and Management (72.5%), while the most female-oriented occupations are Life, Physical & Social Science (100.0%), Legal Services & Support (100.0%), and Education, Arts & Media (89.2%).
| Occupation | Male | Female |
| Management | 1,321 (72.5%) | 500 (27.5%) |
| Business & Financial | 379 (42.5%) | 513 (57.5%) |
| Computers, Engineering & Science | 451 (67.3%) | 219 (32.7%) |
| Computers & Mathematics | 262 (86.8%) | 40 (13.3%) |
| Architecture & Engineering | 189 (73.0%) | 70 (27.0%) |
| Life, Physical & Social Science | 0 (0.0%) | 109 (100.0%) |
| Community & Social Service | 307 (17.2%) | 1,478 (82.8%) |
| Education, Arts & Media | 34 (10.8%) | 281 (89.2%) |
| Legal Services & Support | 0 (0.0%) | 22 (100.0%) |
| Education Instruction & Library | 157 (13.2%) | 1,031 (86.8%) |
| Arts, Media & Entertainment | 116 (44.6%) | 144 (55.4%) |
| Health Diagnosing & Treating | 428 (31.2%) | 943 (68.8%) |
| Health Technologists | 73 (12.5%) | 511 (87.5%) |
| Total (Category) | 2,886 (44.1%) | 3,653 (55.9%) |
| Total (Overall) | 19,219 (56.4%) | 14,882 (43.6%) |
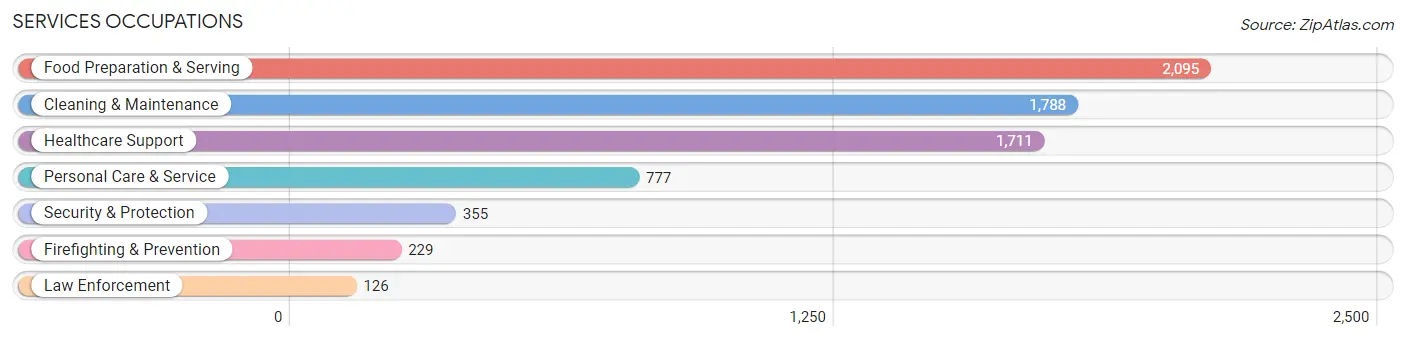
Services Occupations
The most common Services occupations in Perris are Food Preparation & Serving (2,095 | 6.1%), Cleaning & Maintenance (1,788 | 5.2%), Healthcare Support (1,711 | 5.0%), Personal Care & Service (777 | 2.3%), and Security & Protection (355 | 1.0%).
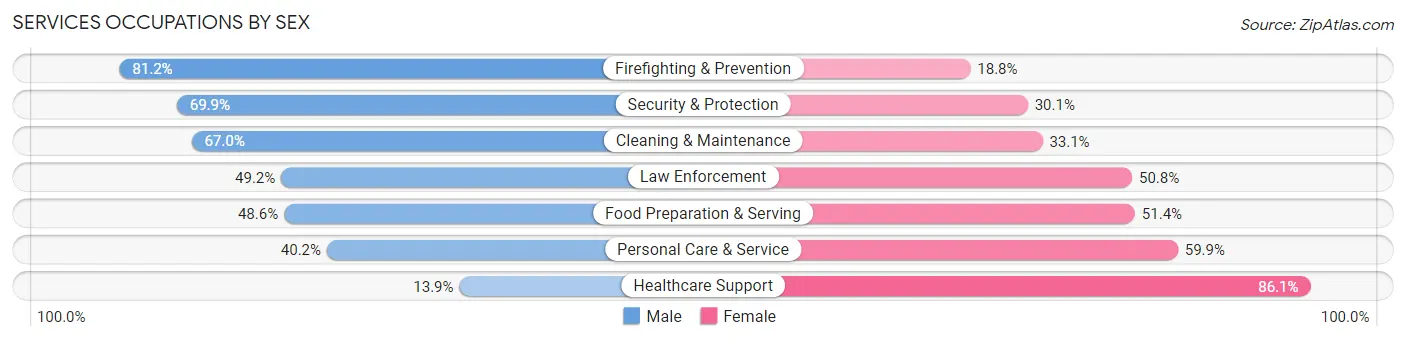
Services Occupations by Sex
Within the Services occupations in Perris, the most male-oriented occupations are Firefighting & Prevention (81.2%), Security & Protection (69.9%), and Cleaning & Maintenance (66.9%), while the most female-oriented occupations are Healthcare Support (86.1%), Personal Care & Service (59.9%), and Food Preparation & Serving (51.4%).
| Occupation | Male | Female |
| Healthcare Support | 238 (13.9%) | 1,473 (86.1%) |
| Security & Protection | 248 (69.9%) | 107 (30.1%) |
| Firefighting & Prevention | 186 (81.2%) | 43 (18.8%) |
| Law Enforcement | 62 (49.2%) | 64 (50.8%) |
| Food Preparation & Serving | 1,019 (48.6%) | 1,076 (51.4%) |
| Cleaning & Maintenance | 1,197 (66.9%) | 591 (33.1%) |
| Personal Care & Service | 312 (40.2%) | 465 (59.9%) |
| Total (Category) | 3,014 (44.8%) | 3,712 (55.2%) |
| Total (Overall) | 19,219 (56.4%) | 14,882 (43.6%) |
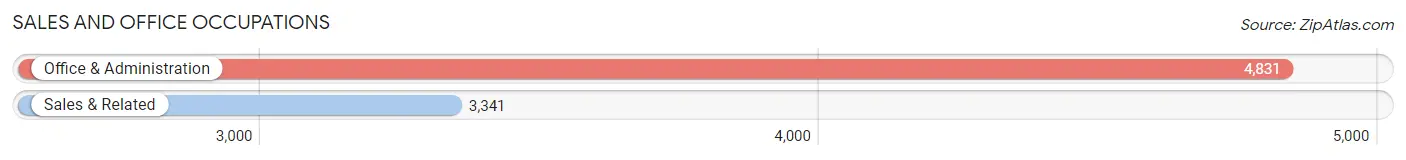
Sales and Office Occupations
The most common Sales and Office occupations in Perris are Office & Administration (4,831 | 14.2%), and Sales & Related (3,341 | 9.8%).
Sales and Office Occupations by Sex
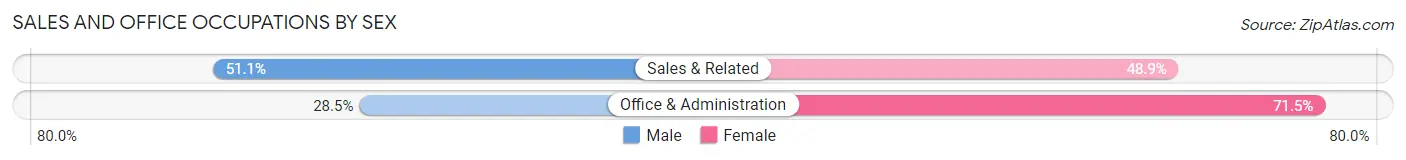
| Occupation | Male | Female |
| Sales & Related | 1,706 (51.1%) | 1,635 (48.9%) |
| Office & Administration | 1,378 (28.5%) | 3,453 (71.5%) |
| Total (Category) | 3,084 (37.7%) | 5,088 (62.3%) |
| Total (Overall) | 19,219 (56.4%) | 14,882 (43.6%) |
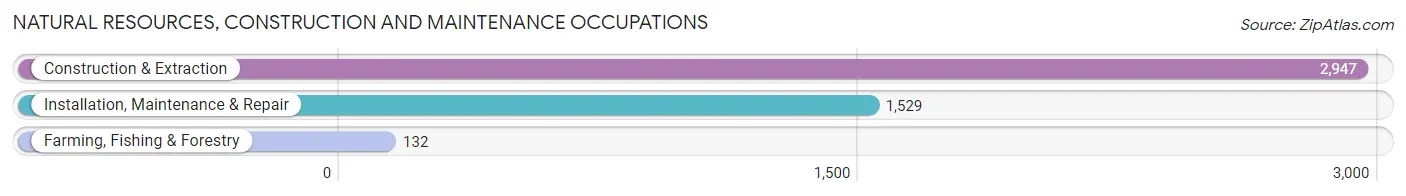
Natural Resources, Construction and Maintenance Occupations
The most common Natural Resources, Construction and Maintenance occupations in Perris are Construction & Extraction (2,947 | 8.6%), Installation, Maintenance & Repair (1,529 | 4.5%), and Farming, Fishing & Forestry (132 | 0.4%).
Natural Resources, Construction and Maintenance Occupations by Sex
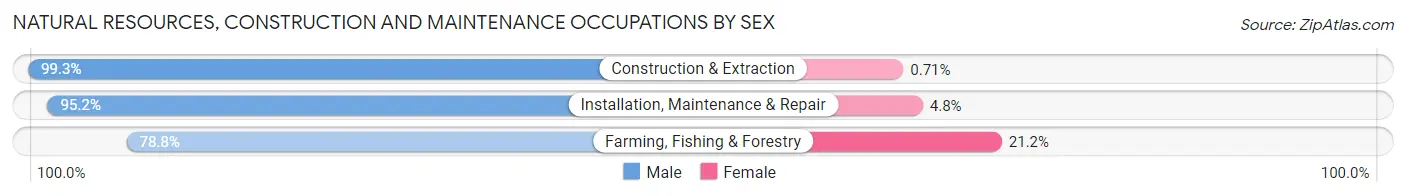
| Occupation | Male | Female |
| Farming, Fishing & Forestry | 104 (78.8%) | 28 (21.2%) |
| Construction & Extraction | 2,926 (99.3%) | 21 (0.7%) |
| Installation, Maintenance & Repair | 1,456 (95.2%) | 73 (4.8%) |
| Total (Category) | 4,486 (97.4%) | 122 (2.6%) |
| Total (Overall) | 19,219 (56.4%) | 14,882 (43.6%) |
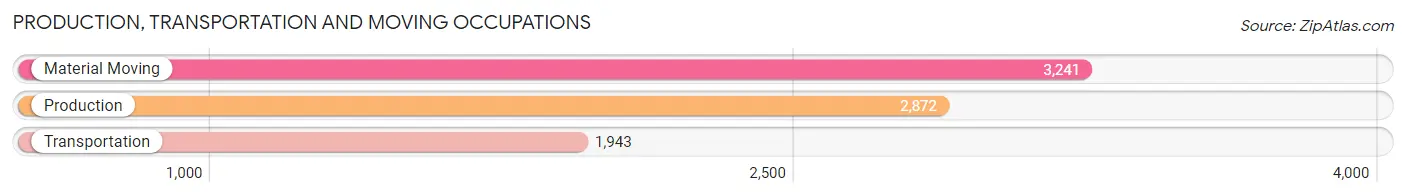
Production, Transportation and Moving Occupations
The most common Production, Transportation and Moving occupations in Perris are Material Moving (3,241 | 9.5%), Production (2,872 | 8.4%), and Transportation (1,943 | 5.7%).
Production, Transportation and Moving Occupations by Sex
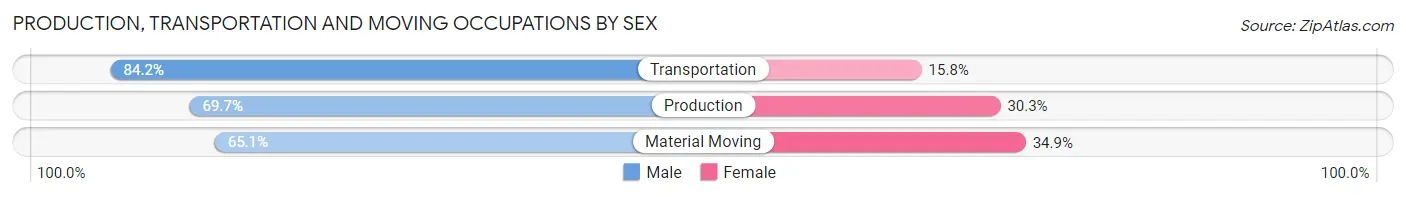
| Occupation | Male | Female |
| Production | 2,003 (69.7%) | 869 (30.3%) |
| Transportation | 1,636 (84.2%) | 307 (15.8%) |
| Material Moving | 2,110 (65.1%) | 1,131 (34.9%) |
| Total (Category) | 5,749 (71.4%) | 2,307 (28.6%) |
| Total (Overall) | 19,219 (56.4%) | 14,882 (43.6%) |
Employment Industries by Sex in Perris
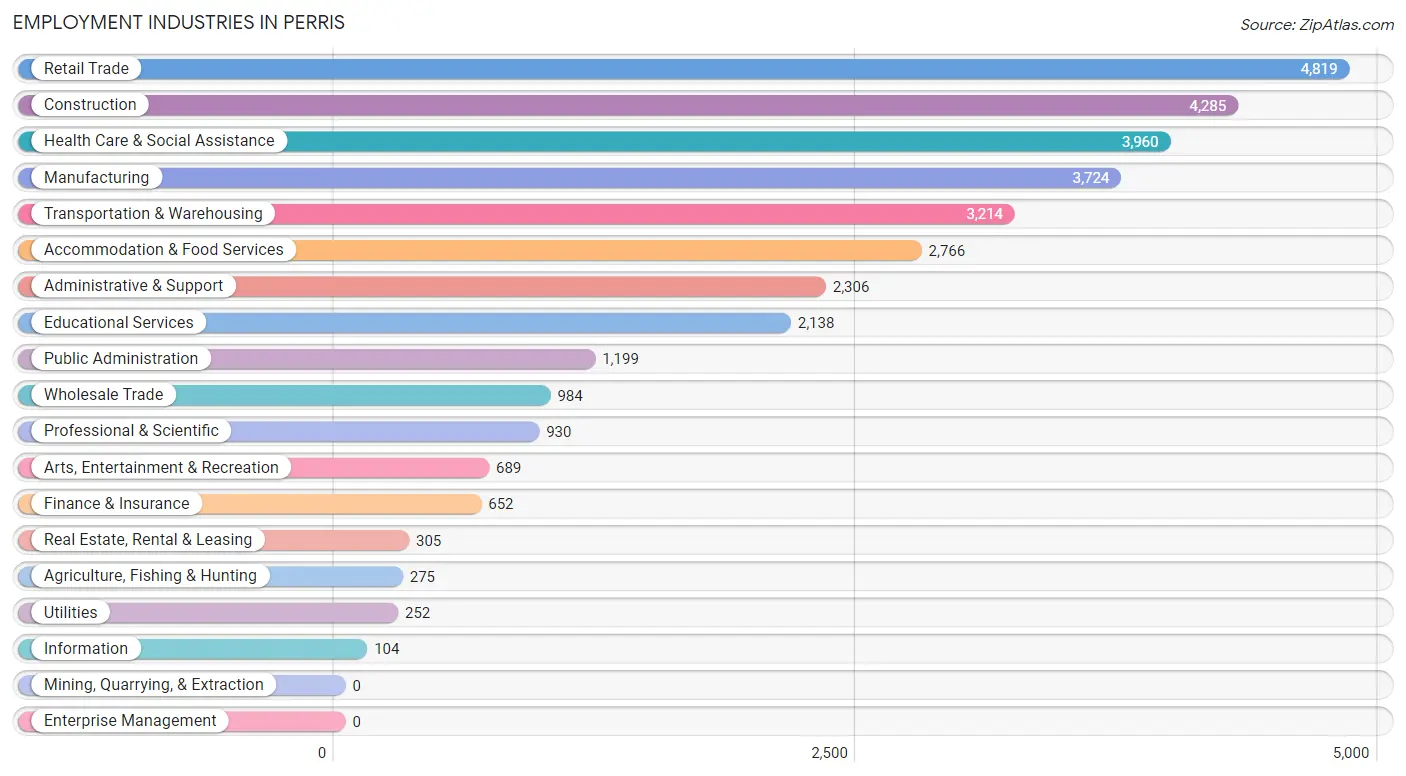
Employment Industries in Perris
The major employment industries in Perris include Retail Trade (4,819 | 14.1%), Construction (4,285 | 12.6%), Health Care & Social Assistance (3,960 | 11.6%), Manufacturing (3,724 | 10.9%), and Transportation & Warehousing (3,214 | 9.4%).
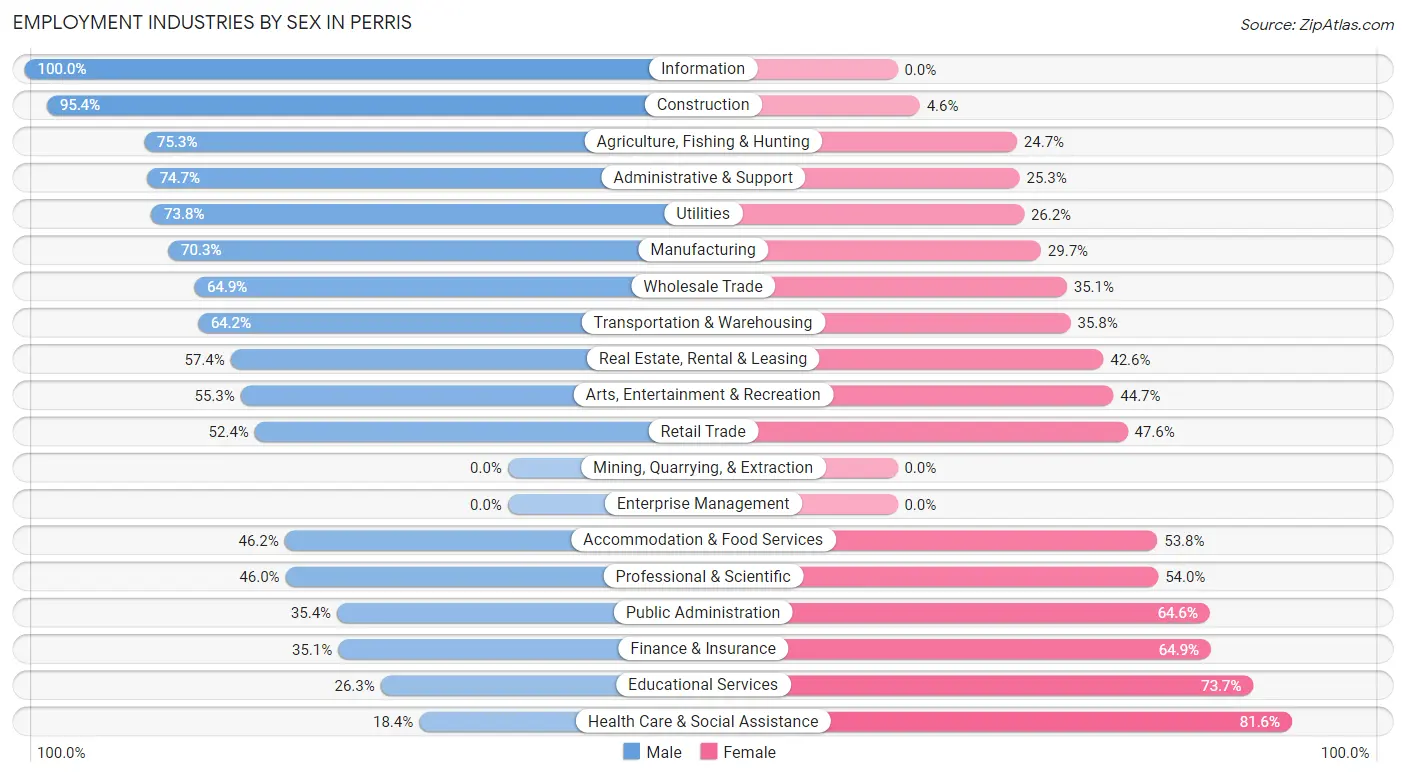
Employment Industries by Sex in Perris
The Perris industries that see more men than women are Information (100.0%), Construction (95.4%), and Agriculture, Fishing & Hunting (75.3%), whereas the industries that tend to have a higher number of women are Health Care & Social Assistance (81.6%), Educational Services (73.7%), and Finance & Insurance (64.9%).
| Industry | Male | Female |
| Agriculture, Fishing & Hunting | 207 (75.3%) | 68 (24.7%) |
| Mining, Quarrying, & Extraction | 0 (0.0%) | 0 (0.0%) |
| Construction | 4,087 (95.4%) | 198 (4.6%) |
| Manufacturing | 2,618 (70.3%) | 1,106 (29.7%) |
| Wholesale Trade | 639 (64.9%) | 345 (35.1%) |
| Retail Trade | 2,524 (52.4%) | 2,295 (47.6%) |
| Transportation & Warehousing | 2,062 (64.2%) | 1,152 (35.8%) |
| Utilities | 186 (73.8%) | 66 (26.2%) |
| Information | 104 (100.0%) | 0 (0.0%) |
| Finance & Insurance | 229 (35.1%) | 423 (64.9%) |
| Real Estate, Rental & Leasing | 175 (57.4%) | 130 (42.6%) |
| Professional & Scientific | 428 (46.0%) | 502 (54.0%) |
| Enterprise Management | 0 (0.0%) | 0 (0.0%) |
| Administrative & Support | 1,723 (74.7%) | 583 (25.3%) |
| Educational Services | 563 (26.3%) | 1,575 (73.7%) |
| Health Care & Social Assistance | 727 (18.4%) | 3,233 (81.6%) |
| Arts, Entertainment & Recreation | 381 (55.3%) | 308 (44.7%) |
| Accommodation & Food Services | 1,278 (46.2%) | 1,488 (53.8%) |
| Public Administration | 424 (35.4%) | 775 (64.6%) |
| Total | 19,219 (56.4%) | 14,882 (43.6%) |
Education in Perris
School Enrollment in Perris
The most common levels of schooling among the 23,248 students in Perris are high school (5,832 | 25.1%), elementary school (5,361 | 23.1%), and middle school (5,129 | 22.1%).
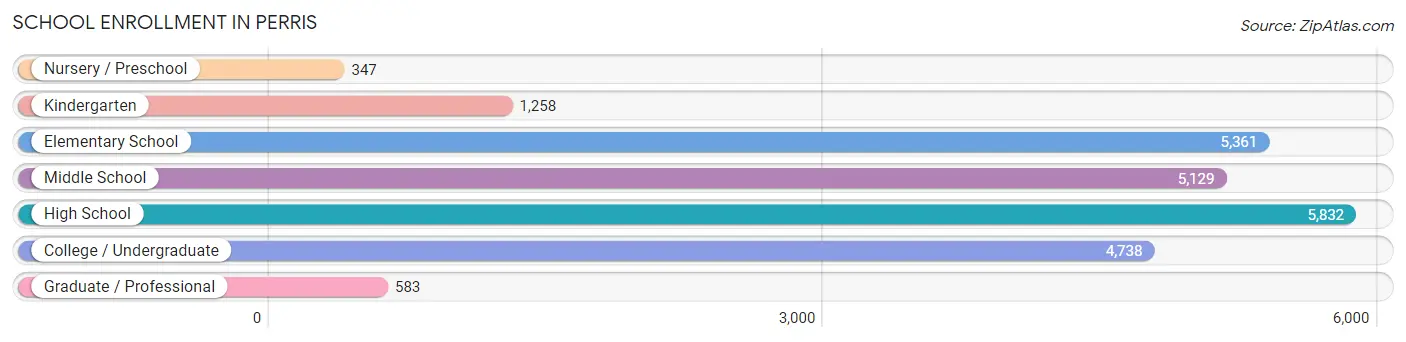
| School Level | # Students | % Students |
| Nursery / Preschool | 347 | 1.5% |
| Kindergarten | 1,258 | 5.4% |
| Elementary School | 5,361 | 23.1% |
| Middle School | 5,129 | 22.1% |
| High School | 5,832 | 25.1% |
| College / Undergraduate | 4,738 | 20.4% |
| Graduate / Professional | 583 | 2.5% |
| Total | 23,248 | 100.0% |
School Enrollment by Age by Funding Source in Perris
Out of a total of 23,248 students who are enrolled in schools in Perris, 1,930 (8.3%) attend a private institution, while the remaining 21,318 (91.7%) are enrolled in public schools. The age group of 35 years and over has the highest likelihood of being enrolled in private schools, with 281 (36.0% in the age bracket) enrolled. Conversely, the age group of 5 to 9 year old has the lowest likelihood of being enrolled in a private school, with 6,026 (98.8% in the age bracket) attending a public institution.
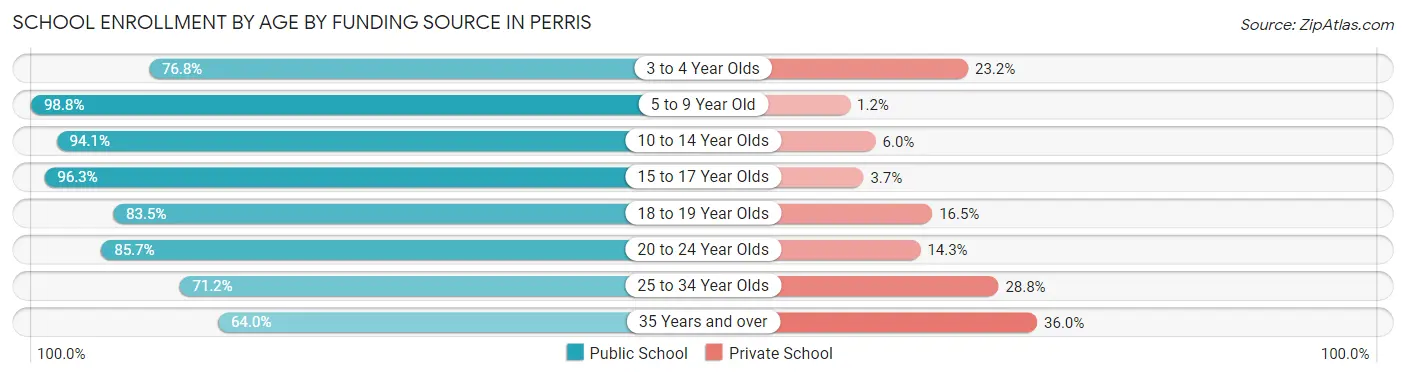
| Age Bracket | Public School | Private School |
| 3 to 4 Year Olds | 305 (76.8%) | 92 (23.2%) |
| 5 to 9 Year Old | 6,026 (98.8%) | 73 (1.2%) |
| 10 to 14 Year Olds | 6,605 (94.1%) | 418 (5.9%) |
| 15 to 17 Year Olds | 3,786 (96.3%) | 145 (3.7%) |
| 18 to 19 Year Olds | 1,372 (83.5%) | 271 (16.5%) |
| 20 to 24 Year Olds | 1,840 (85.7%) | 307 (14.3%) |
| 25 to 34 Year Olds | 874 (71.2%) | 354 (28.8%) |
| 35 Years and over | 499 (64.0%) | 281 (36.0%) |
| Total | 21,318 (91.7%) | 1,930 (8.3%) |
Educational Attainment by Field of Study in Perris
Business (856 | 17.3%), science & technology (801 | 16.2%), arts & humanities (718 | 14.5%), education (427 | 8.6%), and computers & mathematics (401 | 8.1%) are the most common fields of study among 4,960 individuals in Perris who have obtained a bachelor's degree or higher.
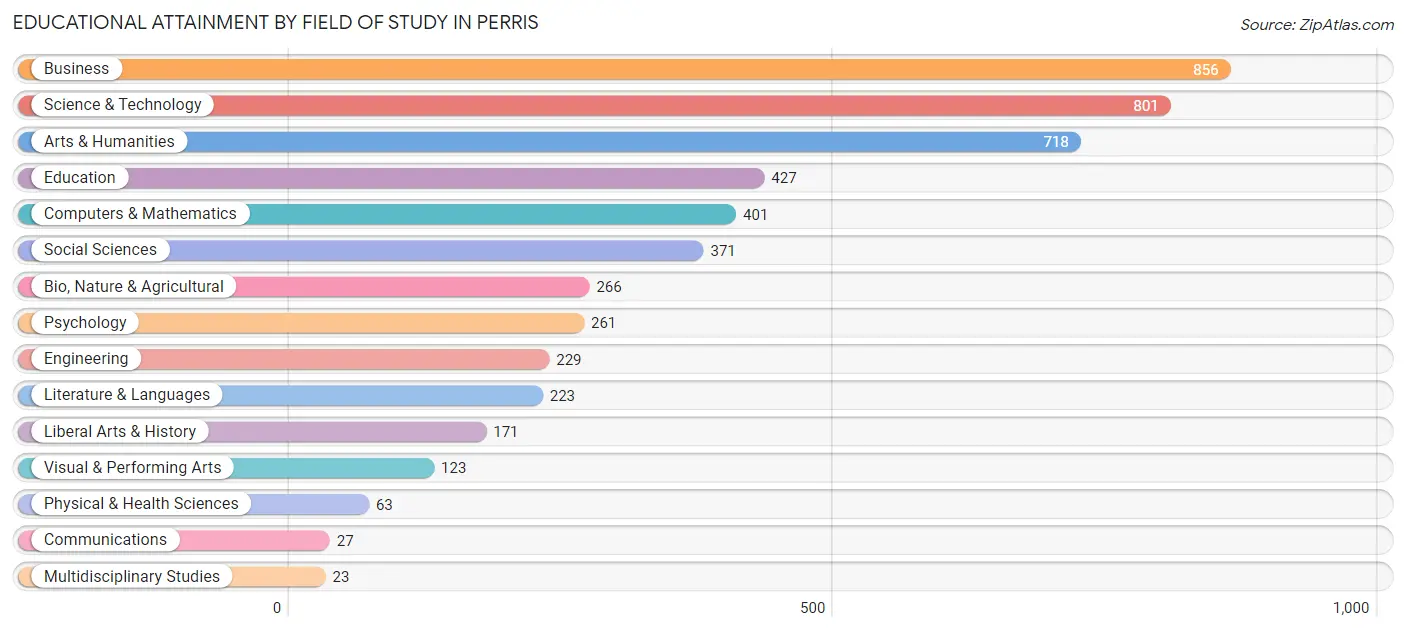
| Field of Study | # Graduates | % Graduates |
| Computers & Mathematics | 401 | 8.1% |
| Bio, Nature & Agricultural | 266 | 5.4% |
| Physical & Health Sciences | 63 | 1.3% |
| Psychology | 261 | 5.3% |
| Social Sciences | 371 | 7.5% |
| Engineering | 229 | 4.6% |
| Multidisciplinary Studies | 23 | 0.5% |
| Science & Technology | 801 | 16.2% |
| Business | 856 | 17.3% |
| Education | 427 | 8.6% |
| Literature & Languages | 223 | 4.5% |
| Liberal Arts & History | 171 | 3.5% |
| Visual & Performing Arts | 123 | 2.5% |
| Communications | 27 | 0.5% |
| Arts & Humanities | 718 | 14.5% |
| Total | 4,960 | 100.0% |
Transportation & Commute in Perris
Vehicle Availability by Sex in Perris
The most prevalent vehicle ownership categories in Perris are males with 2 vehicles (5,949, accounting for 31.3%) and females with 2 vehicles (3,785, making up 41.2%).
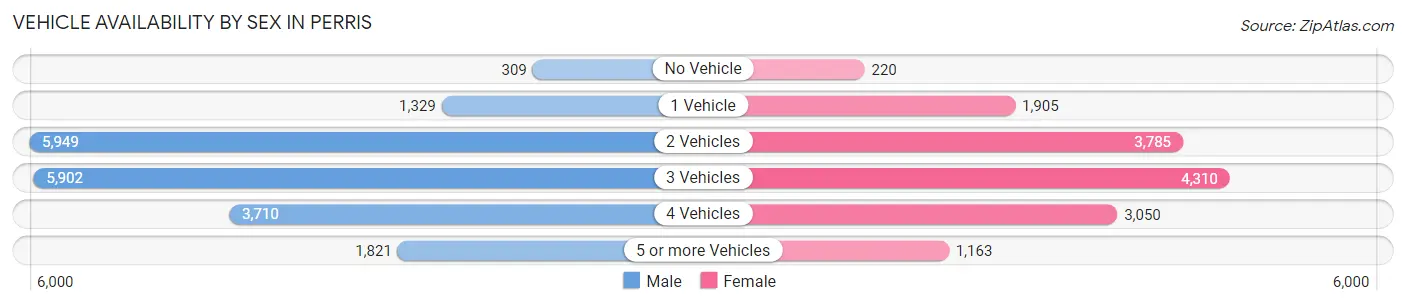
| Vehicles Available | Male | Female |
| No Vehicle | 309 (1.6%) | 220 (1.5%) |
| 1 Vehicle | 1,329 (7.0%) | 1,905 (13.2%) |
| 2 Vehicles | 5,949 (31.3%) | 3,785 (26.2%) |
| 3 Vehicles | 5,902 (31.0%) | 4,310 (29.9%) |
| 4 Vehicles | 3,710 (19.5%) | 3,050 (21.1%) |
| 5 or more Vehicles | 1,821 (9.6%) | 1,163 (8.1%) |
| Total | 19,020 (100.0%) | 14,433 (100.0%) |
Commute Time in Perris
The most frequently occuring commute durations in Perris are 30 to 34 minutes (7,897 commuters, 24.6%), 15 to 19 minutes (4,772 commuters, 14.8%), and 20 to 24 minutes (3,990 commuters, 12.4%).
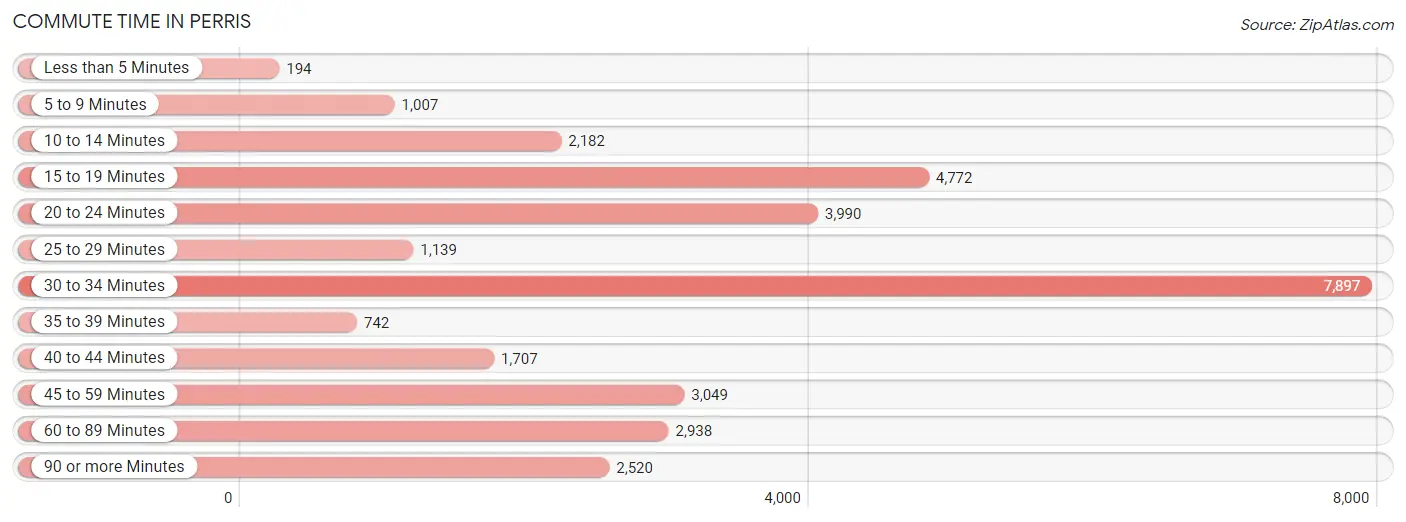
| Commute Time | # Commuters | % Commuters |
| Less than 5 Minutes | 194 | 0.6% |
| 5 to 9 Minutes | 1,007 | 3.1% |
| 10 to 14 Minutes | 2,182 | 6.8% |
| 15 to 19 Minutes | 4,772 | 14.8% |
| 20 to 24 Minutes | 3,990 | 12.4% |
| 25 to 29 Minutes | 1,139 | 3.5% |
| 30 to 34 Minutes | 7,897 | 24.6% |
| 35 to 39 Minutes | 742 | 2.3% |
| 40 to 44 Minutes | 1,707 | 5.3% |
| 45 to 59 Minutes | 3,049 | 9.5% |
| 60 to 89 Minutes | 2,938 | 9.1% |
| 90 or more Minutes | 2,520 | 7.8% |
Commute Time by Sex in Perris
The most common commute times in Perris are 30 to 34 minutes (4,964 commuters, 26.8%) for males and 30 to 34 minutes (2,933 commuters, 21.6%) for females.
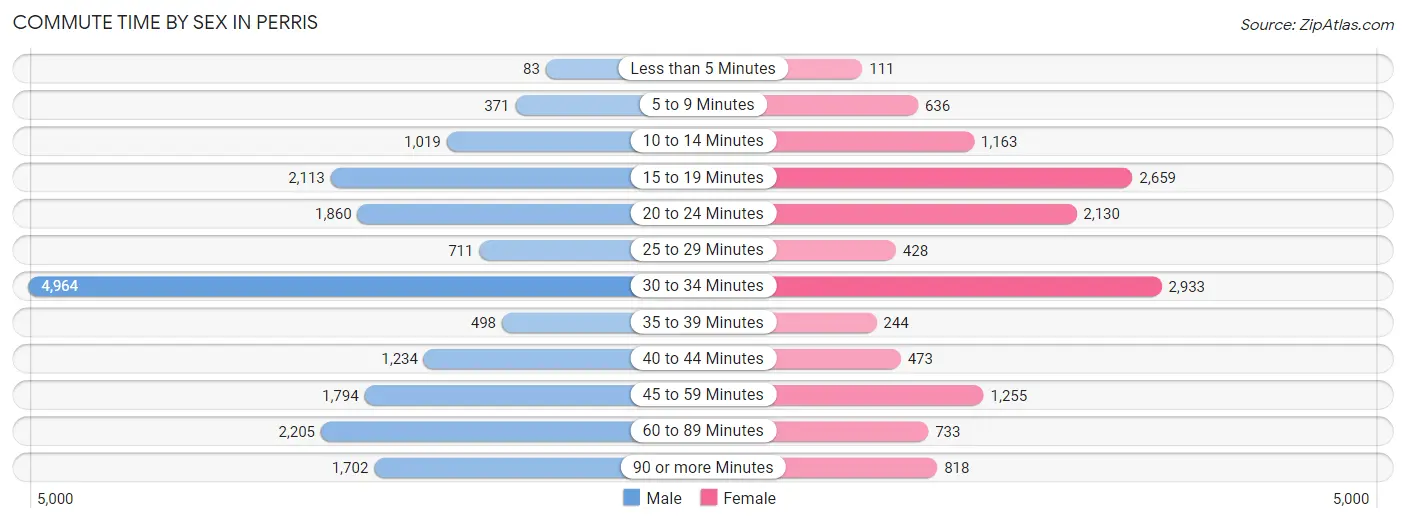
| Commute Time | Male | Female |
| Less than 5 Minutes | 83 (0.4%) | 111 (0.8%) |
| 5 to 9 Minutes | 371 (2.0%) | 636 (4.7%) |
| 10 to 14 Minutes | 1,019 (5.5%) | 1,163 (8.6%) |
| 15 to 19 Minutes | 2,113 (11.4%) | 2,659 (19.6%) |
| 20 to 24 Minutes | 1,860 (10.0%) | 2,130 (15.7%) |
| 25 to 29 Minutes | 711 (3.8%) | 428 (3.2%) |
| 30 to 34 Minutes | 4,964 (26.8%) | 2,933 (21.6%) |
| 35 to 39 Minutes | 498 (2.7%) | 244 (1.8%) |
| 40 to 44 Minutes | 1,234 (6.7%) | 473 (3.5%) |
| 45 to 59 Minutes | 1,794 (9.7%) | 1,255 (9.2%) |
| 60 to 89 Minutes | 2,205 (11.9%) | 733 (5.4%) |
| 90 or more Minutes | 1,702 (9.2%) | 818 (6.0%) |
Time of Departure to Work by Sex in Perris
The most frequent times of departure to work in Perris are 12:00 AM to 4:59 AM (3,362, 18.1%) for males and 7:00 AM to 7:29 AM (2,079, 15.3%) for females.
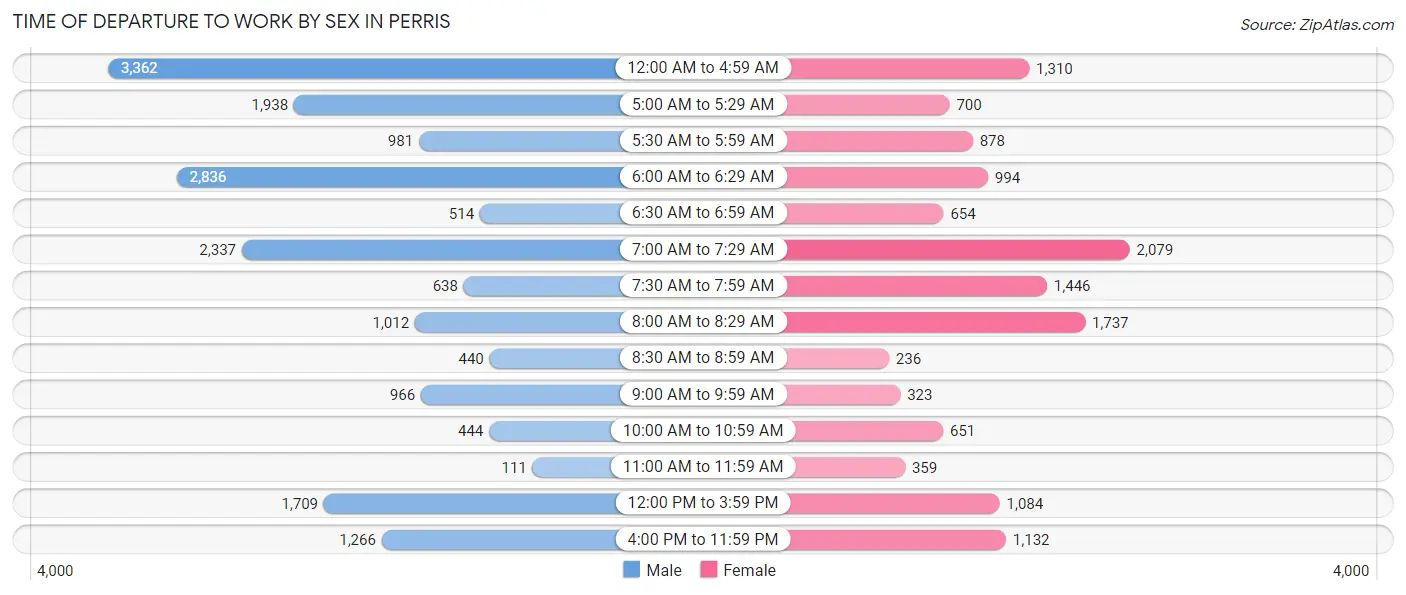
| Time of Departure | Male | Female |
| 12:00 AM to 4:59 AM | 3,362 (18.1%) | 1,310 (9.6%) |
| 5:00 AM to 5:29 AM | 1,938 (10.4%) | 700 (5.1%) |
| 5:30 AM to 5:59 AM | 981 (5.3%) | 878 (6.5%) |
| 6:00 AM to 6:29 AM | 2,836 (15.3%) | 994 (7.3%) |
| 6:30 AM to 6:59 AM | 514 (2.8%) | 654 (4.8%) |
| 7:00 AM to 7:29 AM | 2,337 (12.6%) | 2,079 (15.3%) |
| 7:30 AM to 7:59 AM | 638 (3.4%) | 1,446 (10.6%) |
| 8:00 AM to 8:29 AM | 1,012 (5.4%) | 1,737 (12.8%) |
| 8:30 AM to 8:59 AM | 440 (2.4%) | 236 (1.7%) |
| 9:00 AM to 9:59 AM | 966 (5.2%) | 323 (2.4%) |
| 10:00 AM to 10:59 AM | 444 (2.4%) | 651 (4.8%) |
| 11:00 AM to 11:59 AM | 111 (0.6%) | 359 (2.6%) |
| 12:00 PM to 3:59 PM | 1,709 (9.2%) | 1,084 (8.0%) |
| 4:00 PM to 11:59 PM | 1,266 (6.8%) | 1,132 (8.3%) |
| Total | 18,554 (100.0%) | 13,583 (100.0%) |
Housing Occupancy in Perris
Occupancy by Ownership in Perris
Of the total 18,640 dwellings in Perris, owner-occupied units account for 12,610 (67.6%), while renter-occupied units make up 6,030 (32.4%).
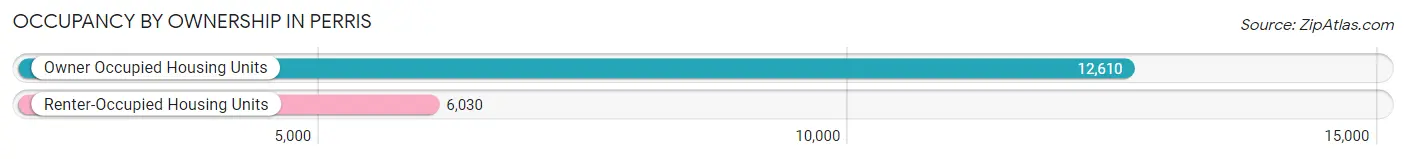
| Occupancy | # Housing Units | % Housing Units |
| Owner Occupied Housing Units | 12,610 | 67.6% |
| Renter-Occupied Housing Units | 6,030 | 32.4% |
| Total Occupied Housing Units | 18,640 | 100.0% |
Occupancy by Household Size in Perris
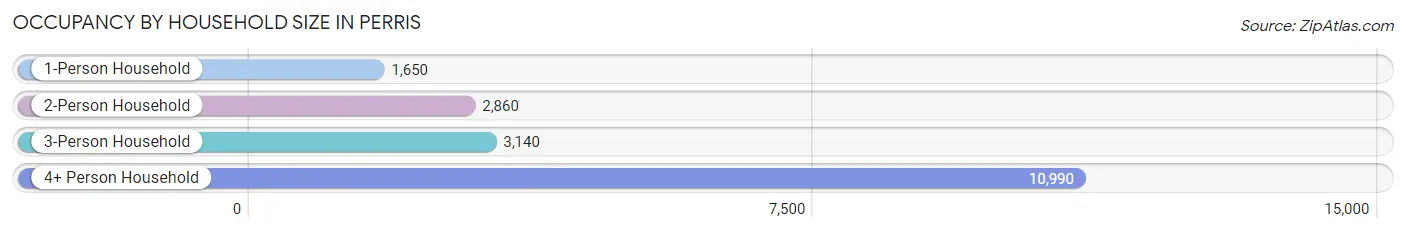
| Household Size | # Housing Units | % Housing Units |
| 1-Person Household | 1,650 | 8.8% |
| 2-Person Household | 2,860 | 15.3% |
| 3-Person Household | 3,140 | 16.9% |
| 4+ Person Household | 10,990 | 59.0% |
| Total Housing Units | 18,640 | 100.0% |
Occupancy by Ownership by Household Size in Perris
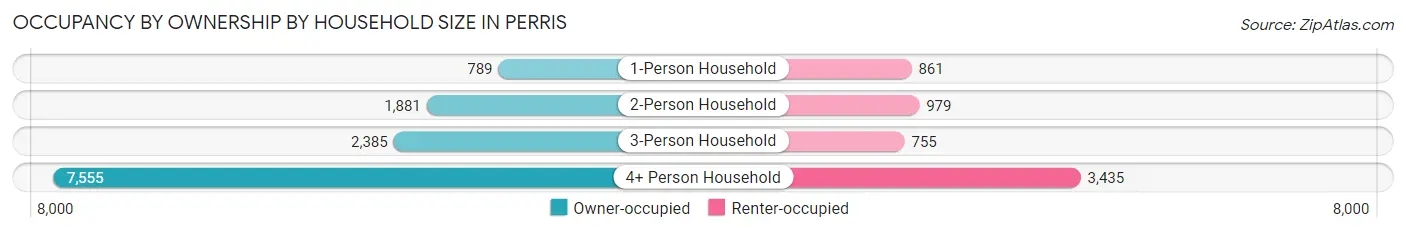
| Household Size | Owner-occupied | Renter-occupied |
| 1-Person Household | 789 (47.8%) | 861 (52.2%) |
| 2-Person Household | 1,881 (65.8%) | 979 (34.2%) |
| 3-Person Household | 2,385 (76.0%) | 755 (24.0%) |
| 4+ Person Household | 7,555 (68.7%) | 3,435 (31.3%) |
| Total Housing Units | 12,610 (67.6%) | 6,030 (32.4%) |
Occupancy by Educational Attainment in Perris
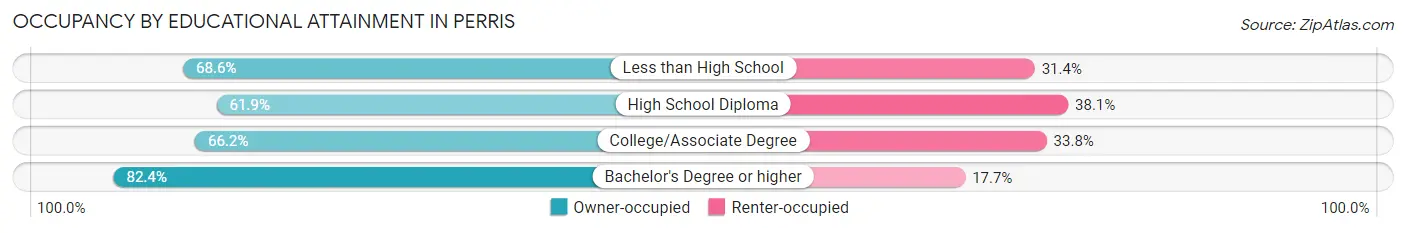
| Household Size | Owner-occupied | Renter-occupied |
| Less than High School | 3,273 (68.6%) | 1,501 (31.4%) |
| High School Diploma | 3,589 (61.9%) | 2,205 (38.1%) |
| College/Associate Degree | 3,686 (66.2%) | 1,882 (33.8%) |
| Bachelor's Degree or higher | 2,062 (82.4%) | 442 (17.6%) |
Occupancy by Age of Householder in Perris
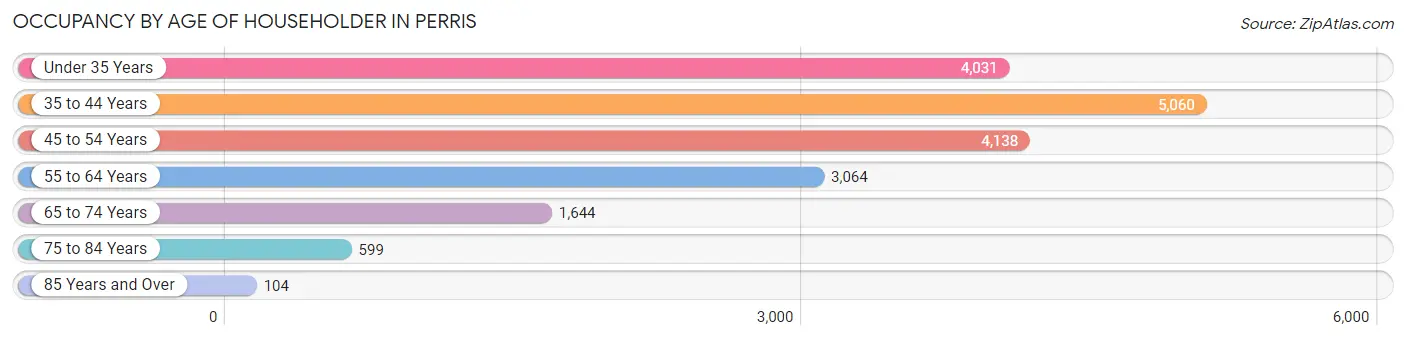
| Age Bracket | # Households | % Households |
| Under 35 Years | 4,031 | 21.6% |
| 35 to 44 Years | 5,060 | 27.2% |
| 45 to 54 Years | 4,138 | 22.2% |
| 55 to 64 Years | 3,064 | 16.4% |
| 65 to 74 Years | 1,644 | 8.8% |
| 75 to 84 Years | 599 | 3.2% |
| 85 Years and Over | 104 | 0.6% |
| Total | 18,640 | 100.0% |
Housing Finances in Perris
Median Income by Occupancy in Perris
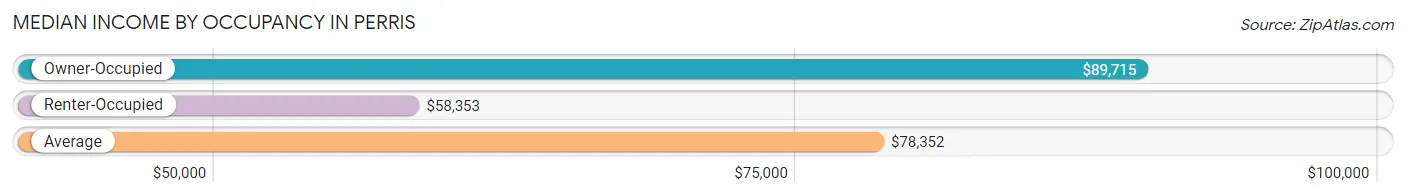
| Occupancy Type | # Households | Median Income |
| Owner-Occupied | 12,610 (67.6%) | $89,715 |
| Renter-Occupied | 6,030 (32.4%) | $58,353 |
| Average | 18,640 (100.0%) | $78,352 |
Occupancy by Householder Income Bracket in Perris
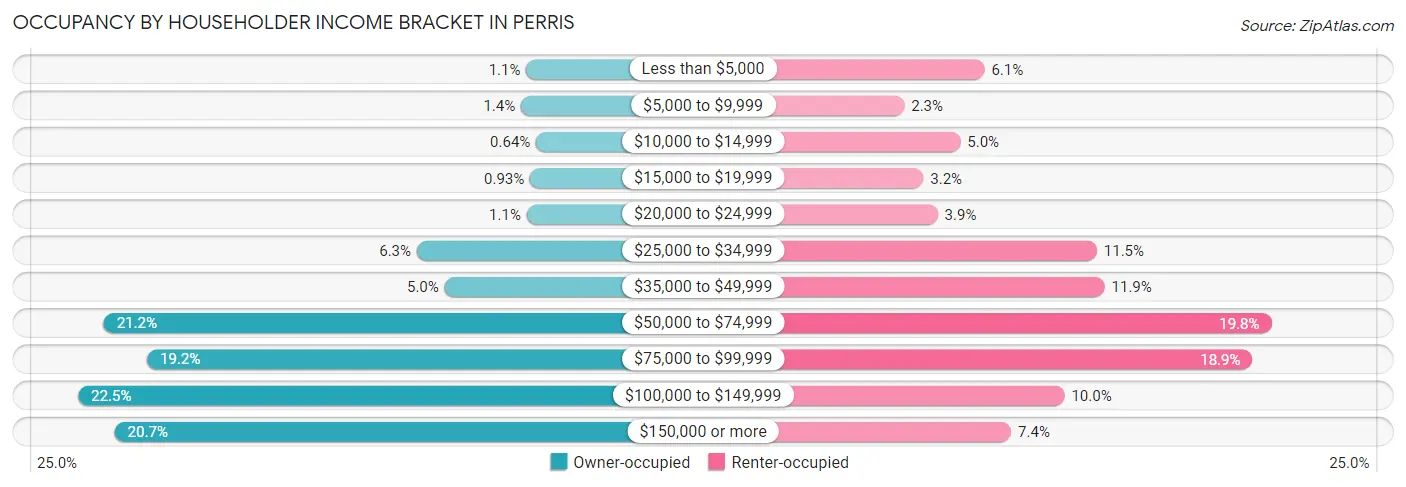
| Income Bracket | Owner-occupied | Renter-occupied |
| Less than $5,000 | 140 (1.1%) | 370 (6.1%) |
| $5,000 to $9,999 | 171 (1.4%) | 140 (2.3%) |
| $10,000 to $14,999 | 81 (0.6%) | 301 (5.0%) |
| $15,000 to $19,999 | 117 (0.9%) | 195 (3.2%) |
| $20,000 to $24,999 | 137 (1.1%) | 236 (3.9%) |
| $25,000 to $34,999 | 797 (6.3%) | 693 (11.5%) |
| $35,000 to $49,999 | 630 (5.0%) | 715 (11.9%) |
| $50,000 to $74,999 | 2,677 (21.2%) | 1,194 (19.8%) |
| $75,000 to $99,999 | 2,417 (19.2%) | 1,139 (18.9%) |
| $100,000 to $149,999 | 2,831 (22.5%) | 600 (10.0%) |
| $150,000 or more | 2,612 (20.7%) | 447 (7.4%) |
| Total | 12,610 (100.0%) | 6,030 (100.0%) |
Monthly Housing Cost Tiers in Perris
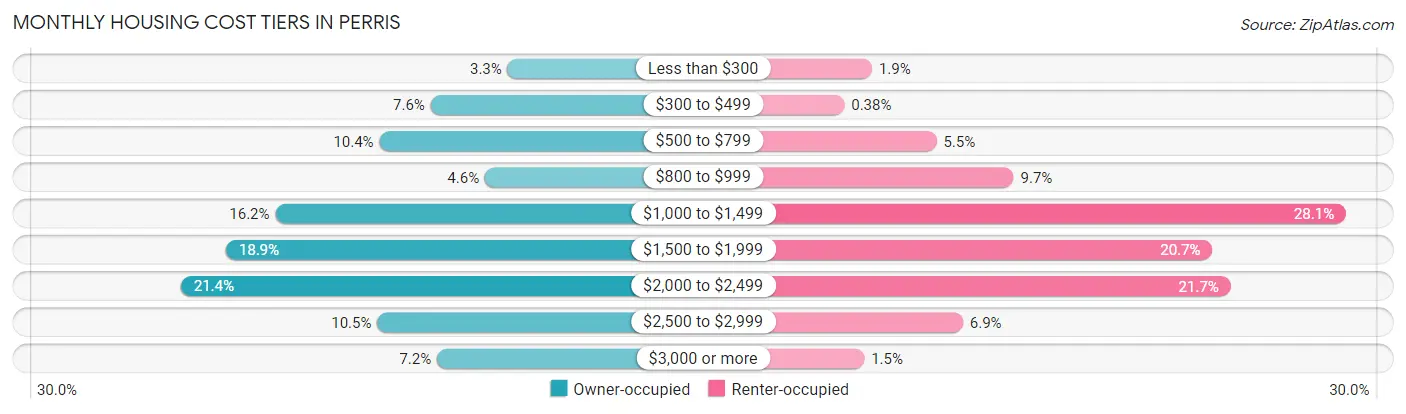
| Monthly Cost | Owner-occupied | Renter-occupied |
| Less than $300 | 419 (3.3%) | 115 (1.9%) |
| $300 to $499 | 954 (7.6%) | 23 (0.4%) |
| $500 to $799 | 1,312 (10.4%) | 330 (5.5%) |
| $800 to $999 | 576 (4.6%) | 587 (9.7%) |
| $1,000 to $1,499 | 2,036 (16.2%) | 1,694 (28.1%) |
| $1,500 to $1,999 | 2,381 (18.9%) | 1,249 (20.7%) |
| $2,000 to $2,499 | 2,695 (21.4%) | 1,310 (21.7%) |
| $2,500 to $2,999 | 1,326 (10.5%) | 418 (6.9%) |
| $3,000 or more | 911 (7.2%) | 89 (1.5%) |
| Total | 12,610 (100.0%) | 6,030 (100.0%) |
Physical Housing Characteristics in Perris
Housing Structures in Perris
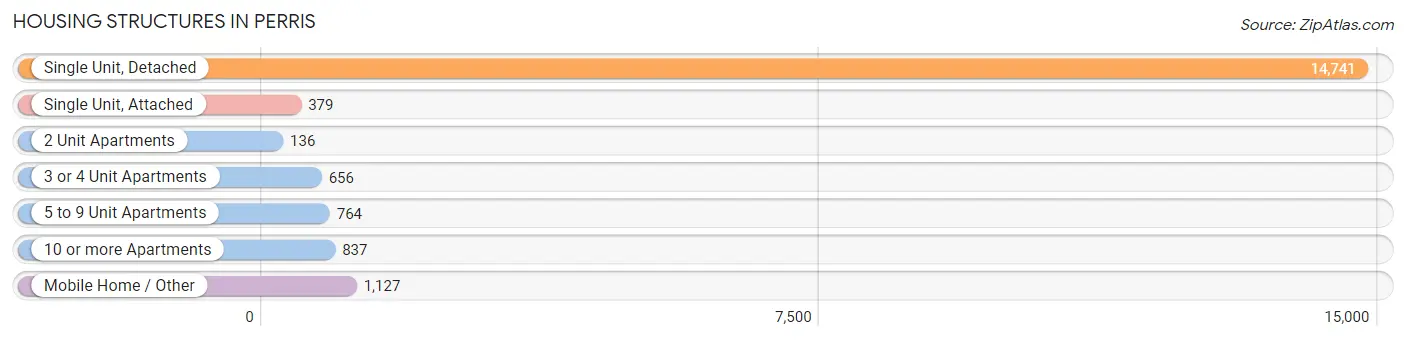
| Structure Type | # Housing Units | % Housing Units |
| Single Unit, Detached | 14,741 | 79.1% |
| Single Unit, Attached | 379 | 2.0% |
| 2 Unit Apartments | 136 | 0.7% |
| 3 or 4 Unit Apartments | 656 | 3.5% |
| 5 to 9 Unit Apartments | 764 | 4.1% |
| 10 or more Apartments | 837 | 4.5% |
| Mobile Home / Other | 1,127 | 6.0% |
| Total | 18,640 | 100.0% |
Housing Structures by Occupancy in Perris
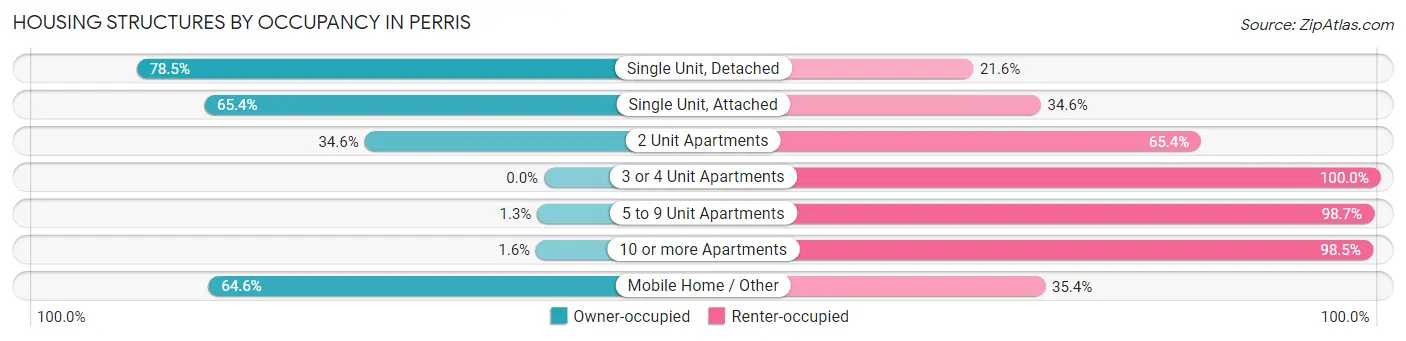
| Structure Type | Owner-occupied | Renter-occupied |
| Single Unit, Detached | 11,564 (78.4%) | 3,177 (21.5%) |
| Single Unit, Attached | 248 (65.4%) | 131 (34.6%) |
| 2 Unit Apartments | 47 (34.6%) | 89 (65.4%) |
| 3 or 4 Unit Apartments | 0 (0.0%) | 656 (100.0%) |
| 5 to 9 Unit Apartments | 10 (1.3%) | 754 (98.7%) |
| 10 or more Apartments | 13 (1.5%) | 824 (98.5%) |
| Mobile Home / Other | 728 (64.6%) | 399 (35.4%) |
| Total | 12,610 (67.6%) | 6,030 (32.4%) |
Housing Structures by Number of Rooms in Perris
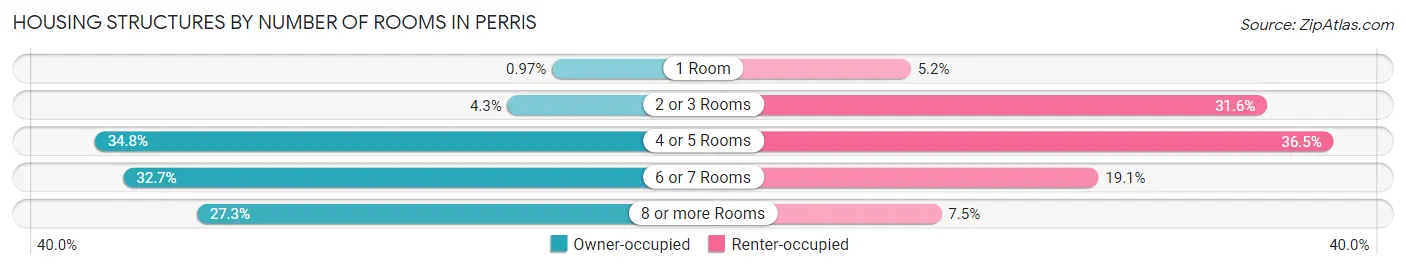
| Number of Rooms | Owner-occupied | Renter-occupied |
| 1 Room | 122 (1.0%) | 316 (5.2%) |
| 2 or 3 Rooms | 539 (4.3%) | 1,906 (31.6%) |
| 4 or 5 Rooms | 4,389 (34.8%) | 2,202 (36.5%) |
| 6 or 7 Rooms | 4,122 (32.7%) | 1,153 (19.1%) |
| 8 or more Rooms | 3,438 (27.3%) | 453 (7.5%) |
| Total | 12,610 (100.0%) | 6,030 (100.0%) |
Housing Structure by Heating Type in Perris
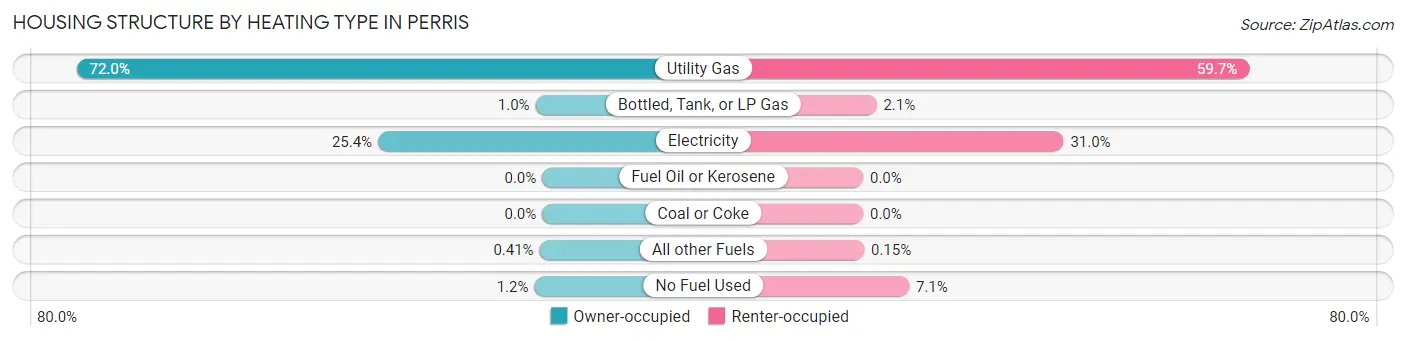
| Heating Type | Owner-occupied | Renter-occupied |
| Utility Gas | 9,076 (72.0%) | 3,599 (59.7%) |
| Bottled, Tank, or LP Gas | 130 (1.0%) | 125 (2.1%) |
| Electricity | 3,200 (25.4%) | 1,868 (31.0%) |
| Fuel Oil or Kerosene | 0 (0.0%) | 0 (0.0%) |
| Coal or Coke | 0 (0.0%) | 0 (0.0%) |
| All other Fuels | 52 (0.4%) | 9 (0.2%) |
| No Fuel Used | 152 (1.2%) | 429 (7.1%) |
| Total | 12,610 (100.0%) | 6,030 (100.0%) |
Household Vehicle Usage in Perris
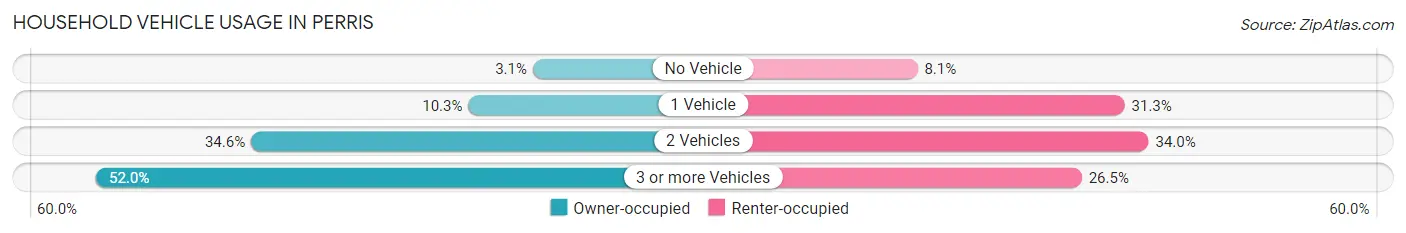
| Vehicles per Household | Owner-occupied | Renter-occupied |
| No Vehicle | 387 (3.1%) | 490 (8.1%) |
| 1 Vehicle | 1,299 (10.3%) | 1,889 (31.3%) |
| 2 Vehicles | 4,368 (34.6%) | 2,051 (34.0%) |
| 3 or more Vehicles | 6,556 (52.0%) | 1,600 (26.5%) |
| Total | 12,610 (100.0%) | 6,030 (100.0%) |
Real Estate & Mortgages in Perris
Real Estate and Mortgage Overview in Perris
| Characteristic | Without Mortgage | With Mortgage |
| Housing Units | 3,436 | 9,174 |
| Median Property Value | $369,800 | $388,100 |
| Median Household Income | $75,551 | $2,093 |
| Monthly Housing Costs | $637 | $895 |
| Real Estate Taxes | $2,912 | $360 |
Property Value by Mortgage Status in Perris
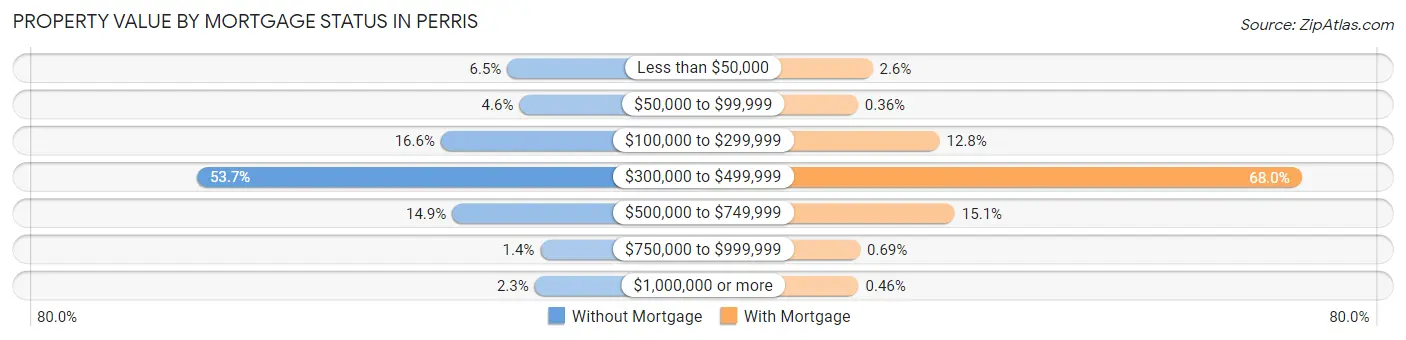
| Property Value | Without Mortgage | With Mortgage |
| Less than $50,000 | 222 (6.5%) | 238 (2.6%) |
| $50,000 to $99,999 | 159 (4.6%) | 33 (0.4%) |
| $100,000 to $299,999 | 570 (16.6%) | 1,175 (12.8%) |
| $300,000 to $499,999 | 1,846 (53.7%) | 6,234 (67.9%) |
| $500,000 to $749,999 | 511 (14.9%) | 1,389 (15.1%) |
| $750,000 to $999,999 | 49 (1.4%) | 63 (0.7%) |
| $1,000,000 or more | 79 (2.3%) | 42 (0.5%) |
| Total | 3,436 (100.0%) | 9,174 (100.0%) |
Household Income by Mortgage Status in Perris
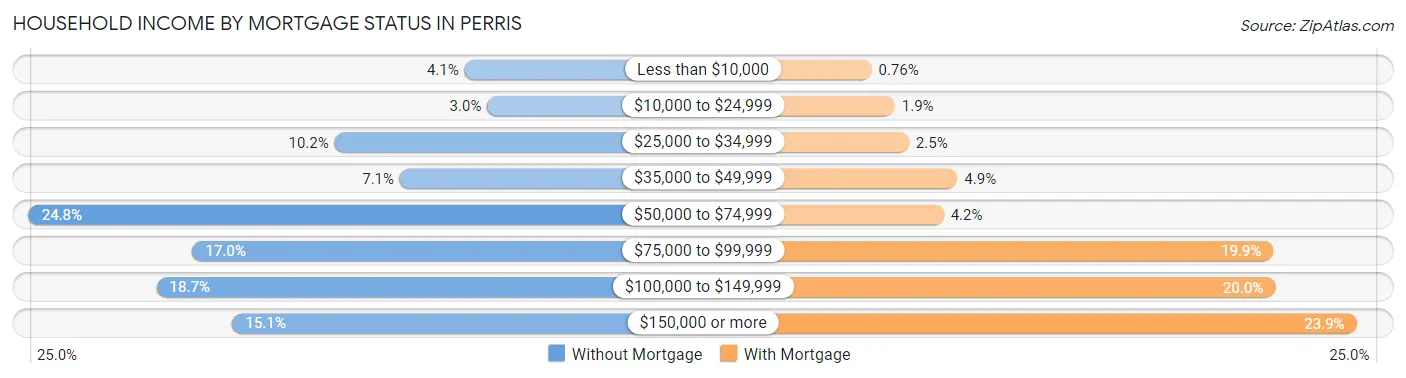
| Household Income | Without Mortgage | With Mortgage |
| Less than $10,000 | 139 (4.1%) | 70 (0.8%) |
| $10,000 to $24,999 | 102 (3.0%) | 172 (1.9%) |
| $25,000 to $34,999 | 352 (10.2%) | 233 (2.5%) |
| $35,000 to $49,999 | 245 (7.1%) | 445 (4.9%) |
| $50,000 to $74,999 | 852 (24.8%) | 385 (4.2%) |
| $75,000 to $99,999 | 584 (17.0%) | 1,825 (19.9%) |
| $100,000 to $149,999 | 643 (18.7%) | 1,833 (20.0%) |
| $150,000 or more | 519 (15.1%) | 2,188 (23.8%) |
| Total | 3,436 (100.0%) | 9,174 (100.0%) |
Property Value to Household Income Ratio in Perris
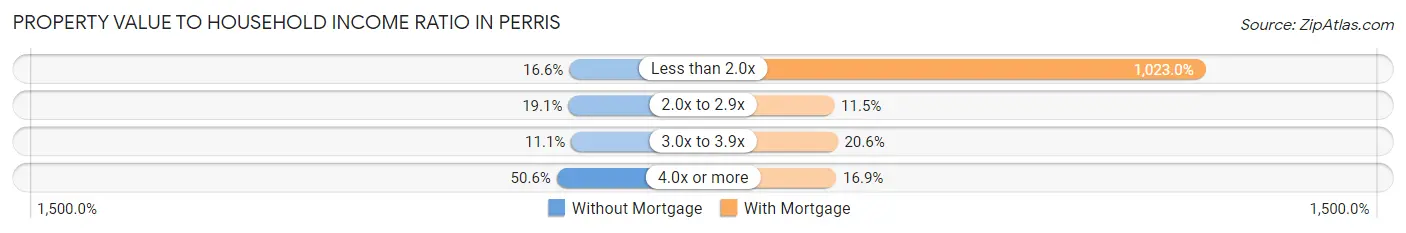
| Value-to-Income Ratio | Without Mortgage | With Mortgage |
| Less than 2.0x | 570 (16.6%) | 93,853 (1,023.0%) |
| 2.0x to 2.9x | 655 (19.1%) | 1,058 (11.5%) |
| 3.0x to 3.9x | 381 (11.1%) | 1,890 (20.6%) |
| 4.0x or more | 1,739 (50.6%) | 1,553 (16.9%) |
| Total | 3,436 (100.0%) | 9,174 (100.0%) |
Real Estate Taxes by Mortgage Status in Perris
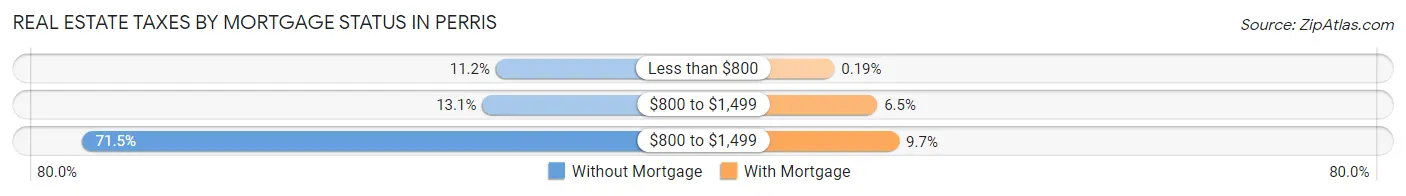
| Property Taxes | Without Mortgage | With Mortgage |
| Less than $800 | 383 (11.2%) | 17 (0.2%) |
| $800 to $1,499 | 451 (13.1%) | 593 (6.5%) |
| $800 to $1,499 | 2,457 (71.5%) | 886 (9.7%) |
| Total | 3,436 (100.0%) | 9,174 (100.0%) |
Health & Disability in Perris
Health Insurance Coverage by Age in Perris
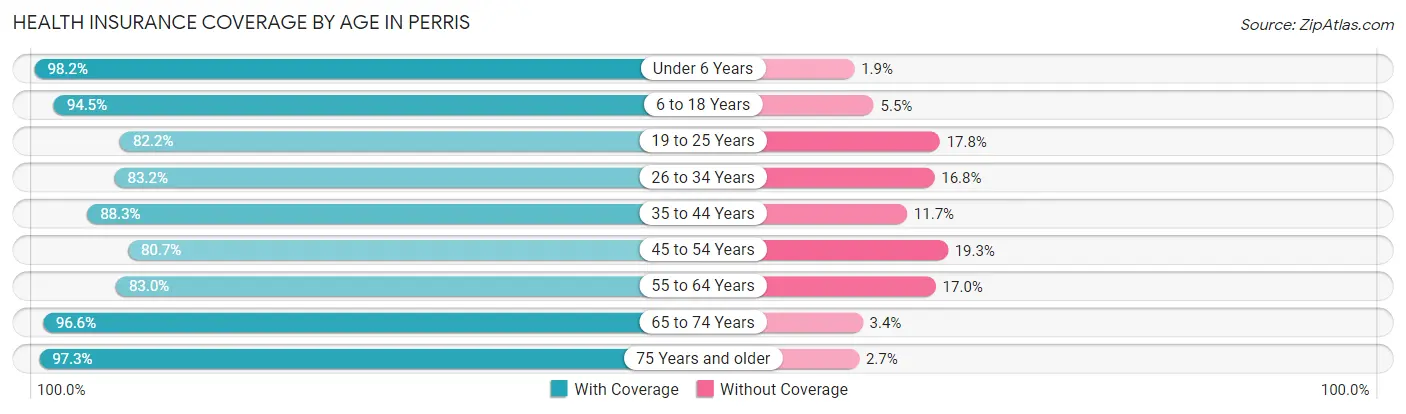
| Age Bracket | With Coverage | Without Coverage |
| Under 6 Years | 6,736 (98.2%) | 127 (1.8%) |
| 6 to 18 Years | 17,461 (94.5%) | 1,009 (5.5%) |
| 19 to 25 Years | 7,055 (82.2%) | 1,527 (17.8%) |
| 26 to 34 Years | 9,331 (83.2%) | 1,881 (16.8%) |
| 35 to 44 Years | 9,290 (88.3%) | 1,228 (11.7%) |
| 45 to 54 Years | 7,954 (80.7%) | 1,900 (19.3%) |
| 55 to 64 Years | 6,357 (83.0%) | 1,306 (17.0%) |
| 65 to 74 Years | 3,283 (96.6%) | 116 (3.4%) |
| 75 Years and older | 2,034 (97.3%) | 57 (2.7%) |
| Total | 69,501 (88.4%) | 9,151 (11.6%) |
Health Insurance Coverage by Citizenship Status in Perris
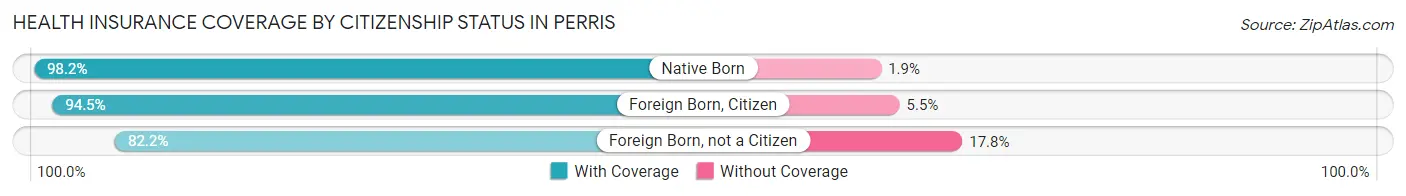
| Citizenship Status | With Coverage | Without Coverage |
| Native Born | 6,736 (98.2%) | 127 (1.8%) |
| Foreign Born, Citizen | 17,461 (94.5%) | 1,009 (5.5%) |
| Foreign Born, not a Citizen | 7,055 (82.2%) | 1,527 (17.8%) |
Health Insurance Coverage by Household Income in Perris
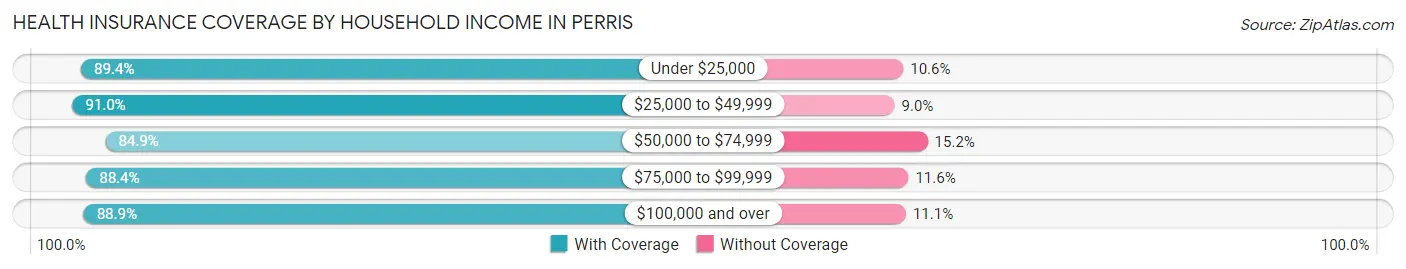
| Household Income | With Coverage | Without Coverage |
| Under $25,000 | 4,335 (89.4%) | 513 (10.6%) |
| $25,000 to $49,999 | 9,262 (91.0%) | 912 (9.0%) |
| $50,000 to $74,999 | 12,813 (84.9%) | 2,287 (15.1%) |
| $75,000 to $99,999 | 13,667 (88.4%) | 1,787 (11.6%) |
| $100,000 and over | 29,273 (88.9%) | 3,652 (11.1%) |
Public vs Private Health Insurance Coverage by Age in Perris
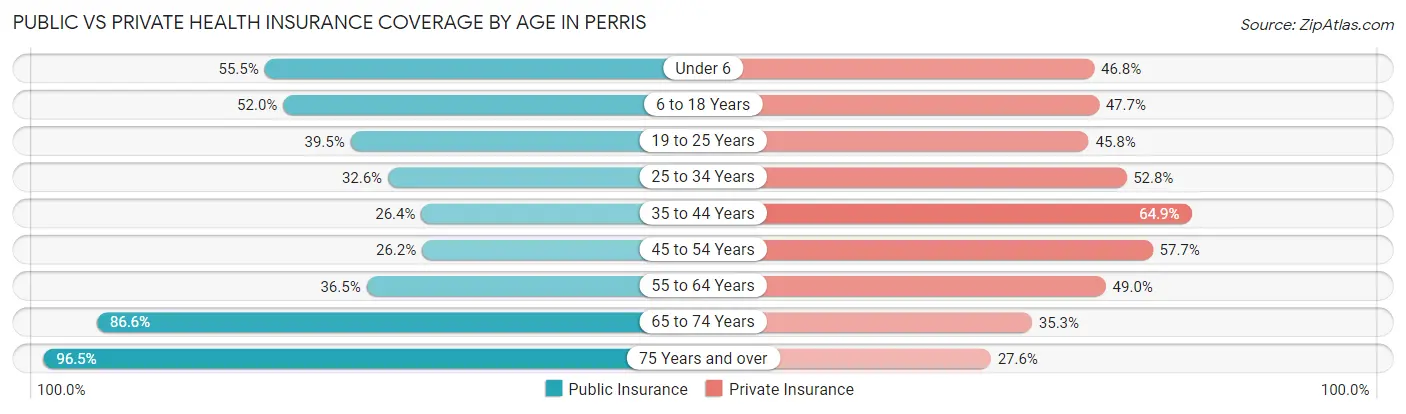
| Age Bracket | Public Insurance | Private Insurance |
| Under 6 | 3,806 (55.5%) | 3,213 (46.8%) |
| 6 to 18 Years | 9,606 (52.0%) | 8,808 (47.7%) |
| 19 to 25 Years | 3,390 (39.5%) | 3,931 (45.8%) |
| 25 to 34 Years | 3,651 (32.6%) | 5,919 (52.8%) |
| 35 to 44 Years | 2,773 (26.4%) | 6,824 (64.9%) |
| 45 to 54 Years | 2,585 (26.2%) | 5,685 (57.7%) |
| 55 to 64 Years | 2,800 (36.5%) | 3,753 (49.0%) |
| 65 to 74 Years | 2,943 (86.6%) | 1,199 (35.3%) |
| 75 Years and over | 2,018 (96.5%) | 578 (27.6%) |
| Total | 33,572 (42.7%) | 39,910 (50.7%) |
Disability Status by Sex by Age in Perris
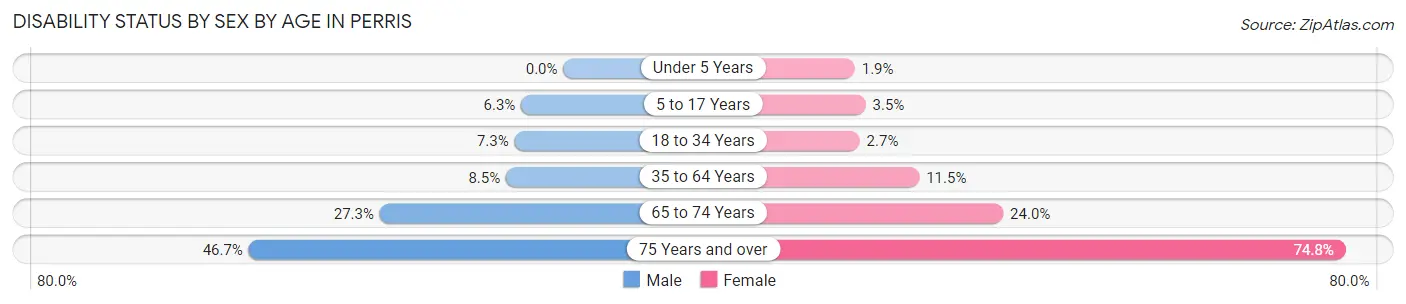
| Age Bracket | Male | Female |
| Under 5 Years | 0 (0.0%) | 61 (1.9%) |
| 5 to 17 Years | 576 (6.3%) | 315 (3.5%) |
| 18 to 34 Years | 810 (7.2%) | 266 (2.6%) |
| 35 to 64 Years | 1,215 (8.5%) | 1,582 (11.5%) |
| 65 to 74 Years | 401 (27.3%) | 462 (24.0%) |
| 75 Years and over | 448 (46.7%) | 847 (74.8%) |
Disability Class by Sex by Age in Perris
Disability Class: Hearing Difficulty
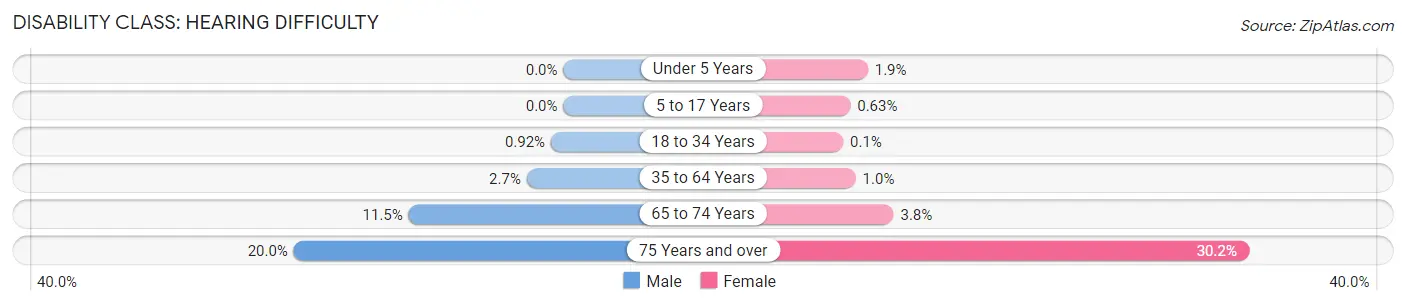
| Age Bracket | Male | Female |
| Under 5 Years | 0 (0.0%) | 61 (1.9%) |
| 5 to 17 Years | 0 (0.0%) | 56 (0.6%) |
| 18 to 34 Years | 103 (0.9%) | 10 (0.1%) |
| 35 to 64 Years | 389 (2.7%) | 142 (1.0%) |
| 65 to 74 Years | 169 (11.5%) | 74 (3.8%) |
| 75 Years and over | 192 (20.0%) | 342 (30.2%) |
Disability Class: Vision Difficulty
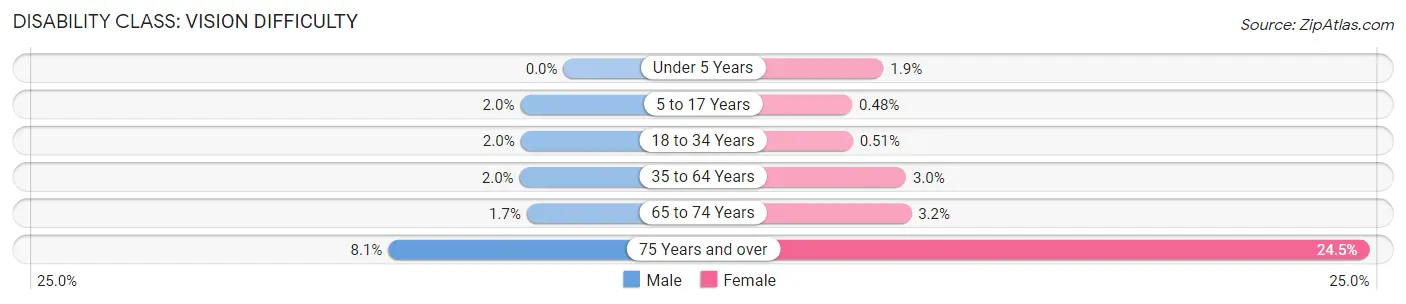
| Age Bracket | Male | Female |
| Under 5 Years | 0 (0.0%) | 61 (1.9%) |
| 5 to 17 Years | 184 (2.0%) | 43 (0.5%) |
| 18 to 34 Years | 222 (2.0%) | 51 (0.5%) |
| 35 to 64 Years | 292 (2.0%) | 410 (3.0%) |
| 65 to 74 Years | 25 (1.7%) | 62 (3.2%) |
| 75 Years and over | 78 (8.1%) | 277 (24.5%) |
Disability Class: Cognitive Difficulty
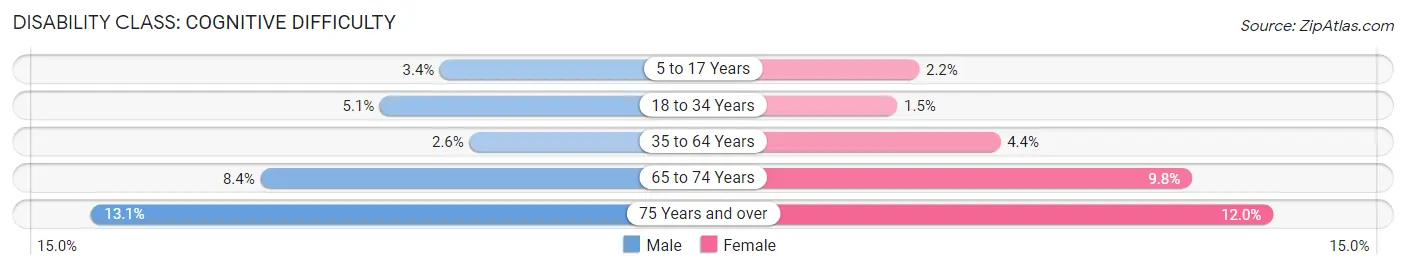
| Age Bracket | Male | Female |
| 5 to 17 Years | 315 (3.4%) | 191 (2.1%) |
| 18 to 34 Years | 570 (5.1%) | 155 (1.5%) |
| 35 to 64 Years | 373 (2.6%) | 607 (4.4%) |
| 65 to 74 Years | 124 (8.4%) | 188 (9.8%) |
| 75 Years and over | 126 (13.1%) | 136 (12.0%) |
Disability Class: Ambulatory Difficulty
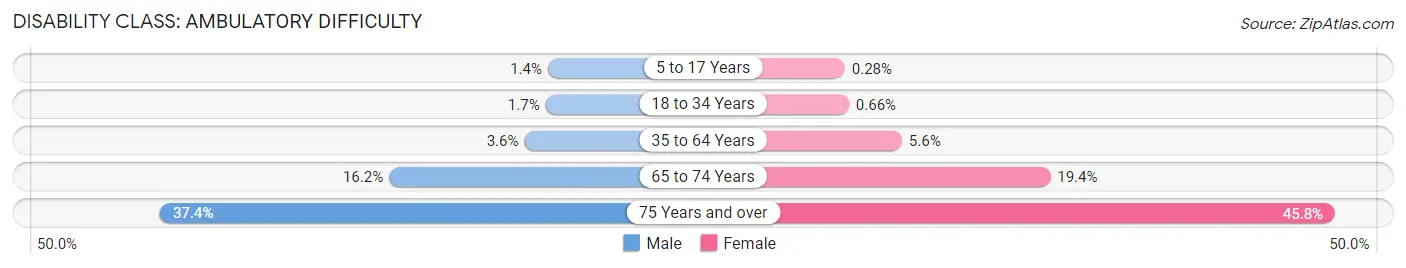
| Age Bracket | Male | Female |
| 5 to 17 Years | 132 (1.4%) | 25 (0.3%) |
| 18 to 34 Years | 185 (1.7%) | 66 (0.7%) |
| 35 to 64 Years | 517 (3.6%) | 767 (5.6%) |
| 65 to 74 Years | 238 (16.2%) | 373 (19.4%) |
| 75 Years and over | 359 (37.4%) | 518 (45.8%) |
Disability Class: Self-Care Difficulty
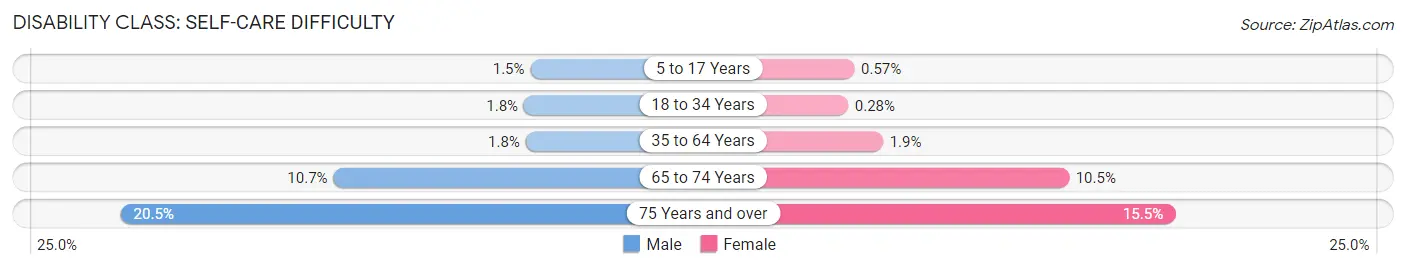
| Age Bracket | Male | Female |
| 5 to 17 Years | 141 (1.5%) | 51 (0.6%) |
| 18 to 34 Years | 204 (1.8%) | 28 (0.3%) |
| 35 to 64 Years | 250 (1.8%) | 261 (1.9%) |
| 65 to 74 Years | 157 (10.7%) | 203 (10.5%) |
| 75 Years and over | 197 (20.5%) | 175 (15.5%) |
Technology Access in Perris
Computing Device Access in Perris
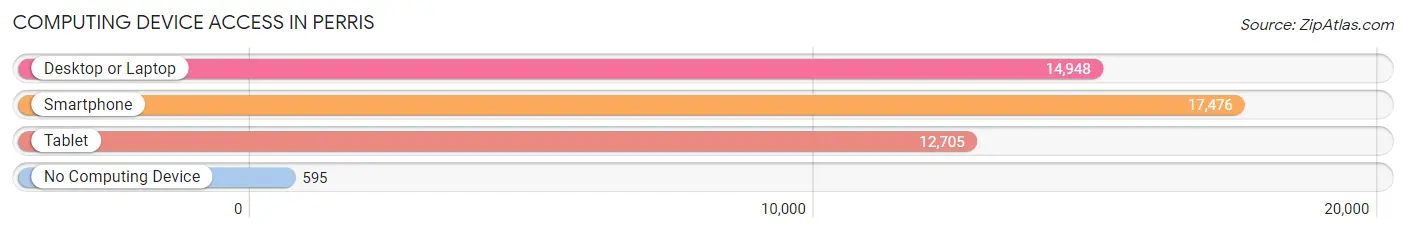
| Device Type | # Households | % Households |
| Desktop or Laptop | 14,948 | 80.2% |
| Smartphone | 17,476 | 93.8% |
| Tablet | 12,705 | 68.2% |
| No Computing Device | 595 | 3.2% |
| Total | 18,640 | 100.0% |
Internet Access in Perris
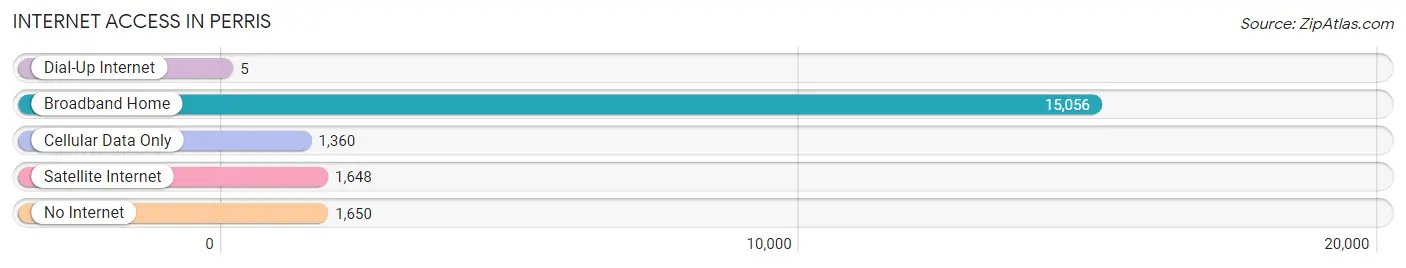
| Internet Type | # Households | % Households |
| Dial-Up Internet | 5 | 0.0% |
| Broadband Home | 15,056 | 80.8% |
| Cellular Data Only | 1,360 | 7.3% |
| Satellite Internet | 1,648 | 8.8% |
| No Internet | 1,650 | 8.8% |
| Total | 18,640 | 100.0% |
Perris Summary
Perris, California is a city located in Riverside County, California, United States. It is situated in the Inland Empire region of Southern California, approximately 70 miles east of Los Angeles. The city is known for its agricultural and industrial heritage, as well as its recreational opportunities.
History
The area that is now Perris was originally inhabited by the Serrano Indians. The first Europeans to settle in the area were the Spanish, who established a mission in the area in 1771. The area was later part of the Rancho San Jacinto, which was granted to Mexican settlers in 1842.
In 1885, the city of Perris was founded by Fred T. Perris, a civil engineer from Los Angeles. The city was named after him. The city was incorporated in 1911 and has since grown to a population of over 75,000.
Geography
Perris is located in the Inland Empire region of Southern California, approximately 70 miles east of Los Angeles. The city is situated in the Perris Valley, which is surrounded by the San Jacinto Mountains to the north and the Santa Ana Mountains to the south. The city covers an area of 24.3 square miles and has an elevation of 830 feet.
Climate
Perris has a Mediterranean climate, with hot, dry summers and mild, wet winters. The average high temperature in the summer is around 95°F, while the average low temperature in the winter is around 40°F. The city receives an average of 13 inches of precipitation per year.
Demographics
As of the 2010 census, the population of Perris was 68,386. The racial makeup of the city was 57.2% White, 4.2% African American, 1.2% Native American, 2.3% Asian, 0.2% Pacific Islander, and 33.9% from other races. The median household income was $45,837, and the median family income was $50,945.
Economy
Perris is home to a variety of industries, including agriculture, manufacturing, and retail. The city is also home to several military bases, including March Air Reserve Base and the Naval Surface Warfare Center.
Agriculture is a major part of the economy in Perris, with the city being home to several large farms and ranches. The city is also home to several manufacturing companies, including a large steel mill and a plastics factory.
Retail is also an important part of the economy in Perris, with the city being home to several large shopping centers and malls. The city is also home to several restaurants, bars, and entertainment venues.
Conclusion
Perris, California is a city located in Riverside County, California, United States. It is situated in the Inland Empire region of Southern California, approximately 70 miles east of Los Angeles. The city is known for its agricultural and industrial heritage, as well as its recreational opportunities. The city has a population of over 75,000 and is home to a variety of industries, including agriculture, manufacturing, and retail. The city is also home to several military bases, including March Air Reserve Base and the Naval Surface Warfare Center. Perris is a great place to live, work, and play, and is a great example of the diversity and culture of Southern California.
Common Questions
What is Per Capita Income in Perris?
Per Capita income in Perris is $24,084.
What is the Median Family Income in Perris?
Median Family Income in Perris is $78,527.
What is the Median Household income in Perris?
Median Household Income in Perris is $78,352.
What is Income or Wage Gap in Perris?
Income or Wage Gap in Perris is 27.3%.
Women in Perris earn 72.7 cents for every dollar earned by a man.
What is Family Income Deficit in Perris?
Family Income Deficit in Perris is $13,868.
Families that are below poverty line in Perris earn $13,868 less on average than the poverty threshold level.
What is Inequality or Gini Index in Perris?
Inequality or Gini Index in Perris is 0.40.
What is the Total Population of Perris?
Total Population of Perris is 78,881.
What is the Total Male Population of Perris?
Total Male Population of Perris is 39,871.
What is the Total Female Population of Perris?
Total Female Population of Perris is 39,010.
What is the Ratio of Males per 100 Females in Perris?
There are 102.21 Males per 100 Females in Perris.
What is the Ratio of Females per 100 Males in Perris?
There are 97.84 Females per 100 Males in Perris.
What is the Median Population Age in Perris?
Median Population Age in Perris is 30.0 Years.
What is the Average Family Size in Perris
Average Family Size in Perris is 4.4 People.
What is the Average Household Size in Perris
Average Household Size in Perris is 4.2 People.
How Large is the Labor Force in Perris?
There are 36,799 People in the Labor Forcein in Perris.
What is the Percentage of People in the Labor Force in Perris?
63.9% of People are in the Labor Force in Perris.
What is the Unemployment Rate in Perris?
Unemployment Rate in Perris is 7.1%.