Coachella, CA Map & Demographics
Coachella Map
Coachella Overview
$23,962
PER CAPITA INCOME
$69,573
AVG FAMILY INCOME
$52,466
AVG HOUSEHOLD INCOME
22.6%
WAGE / INCOME GAP [ % ]
77.4¢/ $1
WAGE / INCOME GAP [ $ ]
0.42
INEQUALITY / GINI INDEX
42,279
TOTAL POPULATION
21,435
MALE POPULATION
20,844
FEMALE POPULATION
102.84
MALES / 100 FEMALES
97.24
FEMALES / 100 MALES
34.9
MEDIAN AGE
3.8
AVG FAMILY SIZE
3.0
AVG HOUSEHOLD SIZE
23,601
LABOR FORCE [ PEOPLE ]
69.0%
PERCENT IN LABOR FORCE
11.9%
UNEMPLOYMENT RATE
Coachella Zip Codes
Coachella Area Codes
Income in Coachella
Income Overview in Coachella
Per Capita Income in Coachella is $23,962, while median incomes of families and households are $69,573 and $52,466 respectively.
| Characteristic | Number | Measure |
| Per Capita Income | 42,279 | $23,962 |
| Median Family Income | 9,674 | $69,573 |
| Mean Family Income | 9,674 | $79,469 |
| Median Household Income | 13,942 | $52,466 |
| Mean Household Income | 13,942 | $67,455 |
| Income Deficit | 9,674 | $0 |
| Wage / Income Gap (%) | 42,279 | 22.64% |
| Wage / Income Gap ($) | 42,279 | 77.36¢ per $1 |
| Gini / Inequality Index | 42,279 | 0.42 |
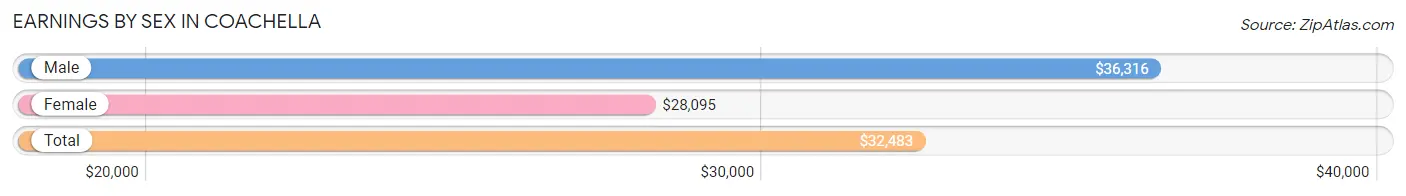
Earnings by Sex in Coachella
Average Earnings in Coachella are $32,483, $36,316 for men and $28,095 for women, a difference of 22.6%.
| Sex | Number | Average Earnings |
| Male | 12,487 (54.4%) | $36,316 |
| Female | 10,468 (45.6%) | $28,095 |
| Total | 22,955 (100.0%) | $32,483 |
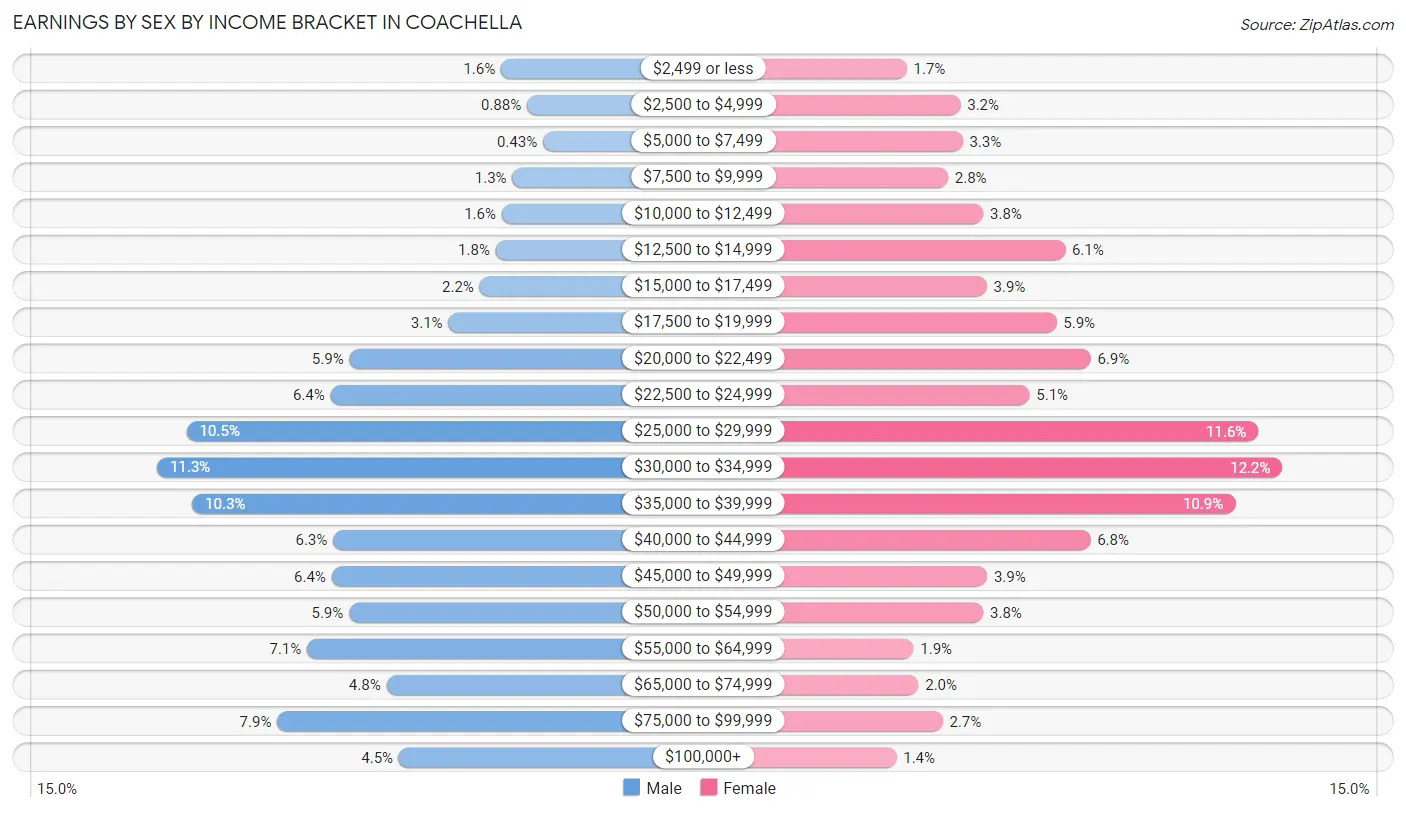
Earnings by Sex by Income Bracket in Coachella
The most common earnings brackets in Coachella are $30,000 to $34,999 for men (1,409 | 11.3%) and $30,000 to $34,999 for women (1,281 | 12.2%).
| Income | Male | Female |
| $2,499 or less | 201 (1.6%) | 176 (1.7%) |
| $2,500 to $4,999 | 110 (0.9%) | 334 (3.2%) |
| $5,000 to $7,499 | 54 (0.4%) | 340 (3.3%) |
| $7,500 to $9,999 | 161 (1.3%) | 297 (2.8%) |
| $10,000 to $12,499 | 198 (1.6%) | 401 (3.8%) |
| $12,500 to $14,999 | 220 (1.8%) | 642 (6.1%) |
| $15,000 to $17,499 | 276 (2.2%) | 411 (3.9%) |
| $17,500 to $19,999 | 386 (3.1%) | 617 (5.9%) |
| $20,000 to $22,499 | 733 (5.9%) | 717 (6.9%) |
| $22,500 to $24,999 | 799 (6.4%) | 537 (5.1%) |
| $25,000 to $29,999 | 1,305 (10.4%) | 1,210 (11.6%) |
| $30,000 to $34,999 | 1,409 (11.3%) | 1,281 (12.2%) |
| $35,000 to $39,999 | 1,285 (10.3%) | 1,142 (10.9%) |
| $40,000 to $44,999 | 790 (6.3%) | 716 (6.8%) |
| $45,000 to $49,999 | 796 (6.4%) | 412 (3.9%) |
| $50,000 to $54,999 | 734 (5.9%) | 401 (3.8%) |
| $55,000 to $64,999 | 881 (7.1%) | 196 (1.9%) |
| $65,000 to $74,999 | 603 (4.8%) | 210 (2.0%) |
| $75,000 to $99,999 | 986 (7.9%) | 282 (2.7%) |
| $100,000+ | 560 (4.5%) | 146 (1.4%) |
| Total | 12,487 (100.0%) | 10,468 (100.0%) |
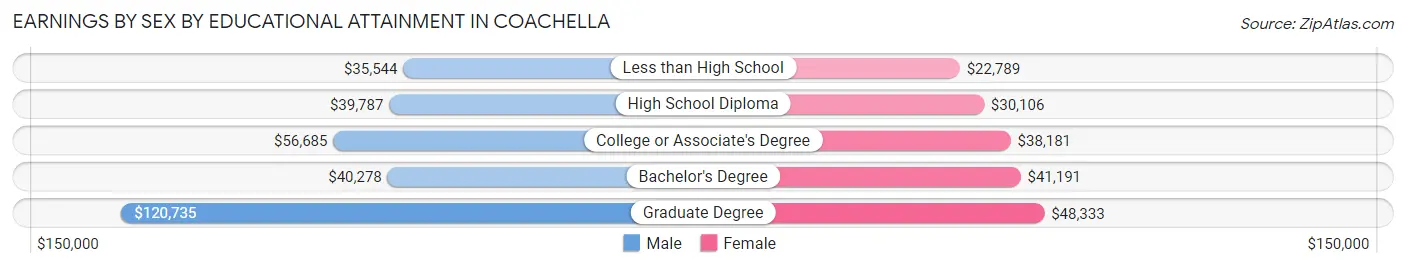
Earnings by Sex by Educational Attainment in Coachella
Average earnings in Coachella are $38,859 for men and $29,294 for women, a difference of 24.6%. Men with an educational attainment of graduate degree enjoy the highest average annual earnings of $120,735, while those with less than high school education earn the least with $35,544. Women with an educational attainment of graduate degree earn the most with the average annual earnings of $48,333, while those with less than high school education have the smallest earnings of $22,789.
| Educational Attainment | Male Income | Female Income |
| Less than High School | $35,544 | $22,789 |
| High School Diploma | $39,787 | $30,106 |
| College or Associate's Degree | $56,685 | $38,181 |
| Bachelor's Degree | $40,278 | $41,191 |
| Graduate Degree | $120,735 | $48,333 |
| Total | $38,859 | $29,294 |
Family Income in Coachella
Family Income Brackets in Coachella
According to the Coachella family income data, there are 2,099 families falling into the $75,000 to $99,999 income range, which is the most common income bracket and makes up 21.7% of all families. Conversely, the less than $10,000 income bracket is the least frequent group with only 252 families (2.6%) belonging to this category.
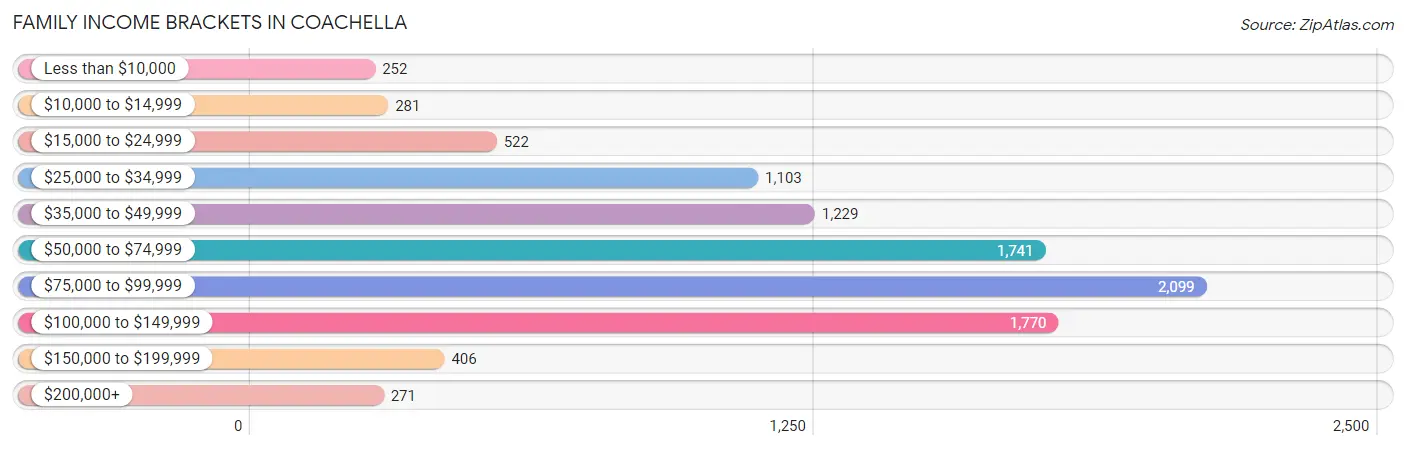
| Income Bracket | # Families | % Families |
| Less than $10,000 | 252 | 2.6% |
| $10,000 to $14,999 | 281 | 2.9% |
| $15,000 to $24,999 | 522 | 5.4% |
| $25,000 to $34,999 | 1,103 | 11.4% |
| $35,000 to $49,999 | 1,229 | 12.7% |
| $50,000 to $74,999 | 1,741 | 18.0% |
| $75,000 to $99,999 | 2,099 | 21.7% |
| $100,000 to $149,999 | 1,770 | 18.3% |
| $150,000 to $199,999 | 406 | 4.2% |
| $200,000+ | 271 | 2.8% |
Family Income by Famaliy Size in Coachella
6-person families (391 | 4.0%) account for the highest median family income in Coachella with $110,461 per family, while 3-person families (1,967 | 20.3%) have the highest median income of $25,417 per family member.
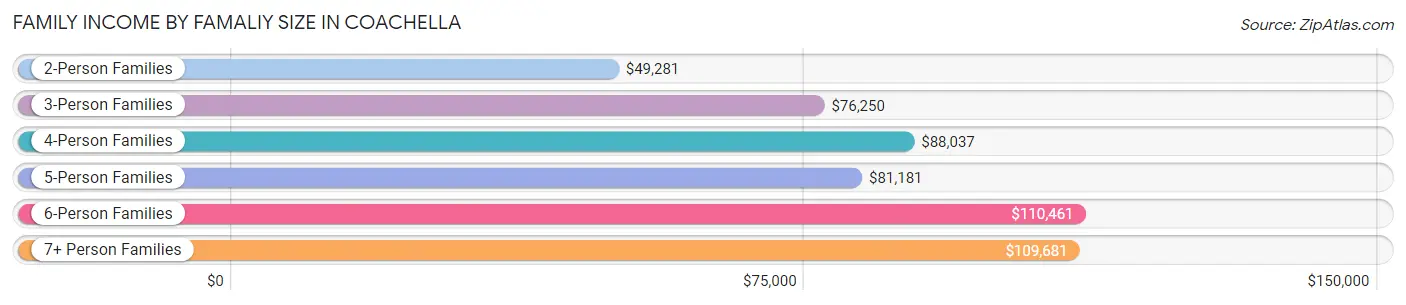
| Income Bracket | # Families | Median Income |
| 2-Person Families | 3,392 (35.1%) | $49,281 |
| 3-Person Families | 1,967 (20.3%) | $76,250 |
| 4-Person Families | 1,872 (19.4%) | $88,037 |
| 5-Person Families | 1,622 (16.8%) | $81,181 |
| 6-Person Families | 391 (4.0%) | $110,461 |
| 7+ Person Families | 430 (4.4%) | $109,681 |
| Total | 9,674 (100.0%) | $69,573 |
Family Income by Number of Earners in Coachella
The median family income in Coachella is $69,573, with families comprising 3+ earners (1,980) having the highest median family income of $110,962, while families with no earners (1,153) have the lowest median family income of $27,609, accounting for 20.5% and 11.9% of families, respectively.
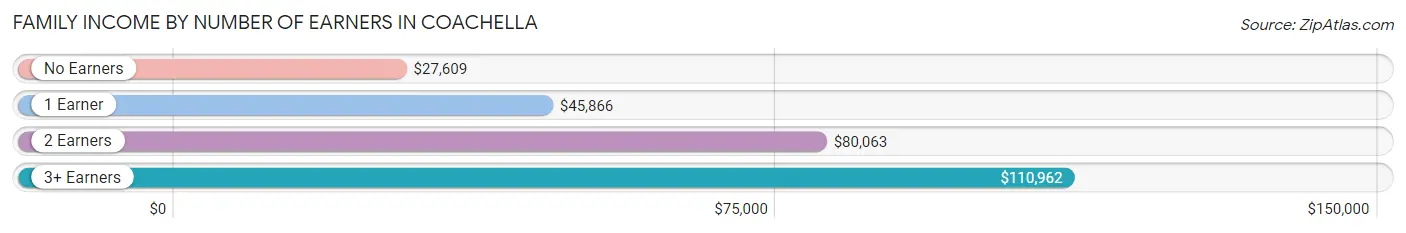
| Number of Earners | # Families | Median Income |
| No Earners | 1,153 (11.9%) | $27,609 |
| 1 Earner | 2,795 (28.9%) | $45,866 |
| 2 Earners | 3,746 (38.7%) | $80,063 |
| 3+ Earners | 1,980 (20.5%) | $110,962 |
| Total | 9,674 (100.0%) | $69,573 |
Household Income in Coachella
Household Income Brackets in Coachella
With 2,259 households falling in the category, the $75,000 to $99,999 income range is the most frequent in Coachella, accounting for 16.2% of all households. In contrast, only 307 households (2.2%) fall into the $200,000+ income bracket, making it the least populous group.
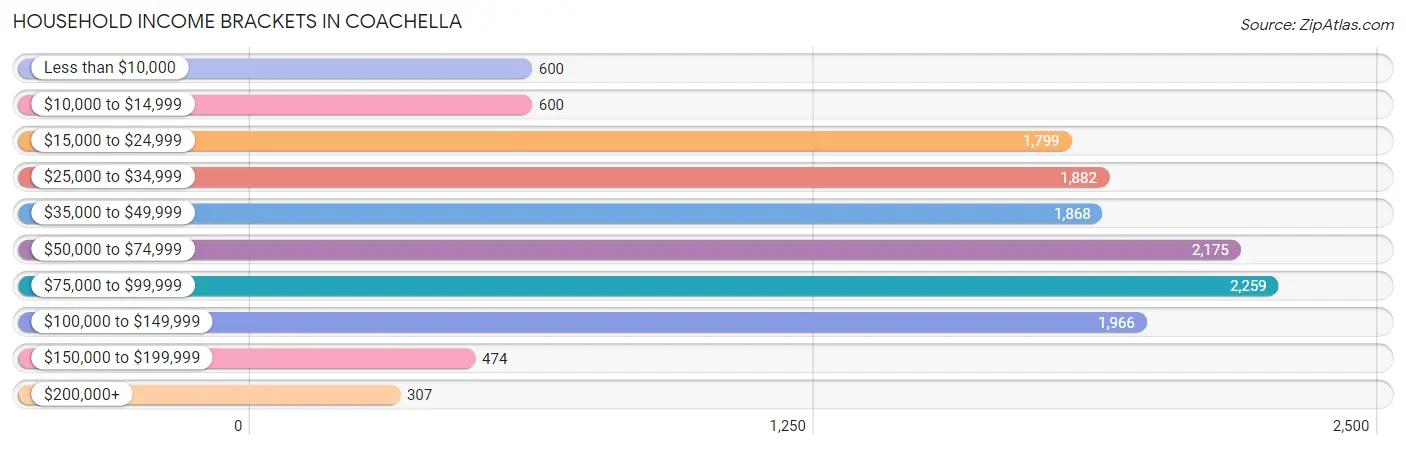
| Income Bracket | # Households | % Households |
| Less than $10,000 | 600 | 4.3% |
| $10,000 to $14,999 | 600 | 4.3% |
| $15,000 to $24,999 | 1,799 | 12.9% |
| $25,000 to $34,999 | 1,882 | 13.5% |
| $35,000 to $49,999 | 1,868 | 13.4% |
| $50,000 to $74,999 | 2,175 | 15.6% |
| $75,000 to $99,999 | 2,259 | 16.2% |
| $100,000 to $149,999 | 1,966 | 14.1% |
| $150,000 to $199,999 | 474 | 3.4% |
| $200,000+ | 307 | 2.2% |
Household Income by Householder Age in Coachella
The median household income in Coachella is $52,466, with the highest median household income of $65,324 found in the 25 to 44 years age bracket for the primary householder. A total of 5,437 households (39.0%) fall into this category. Meanwhile, the 15 to 24 years age bracket for the primary householder has the lowest median household income of $31,708, with 377 households (2.7%) in this group.
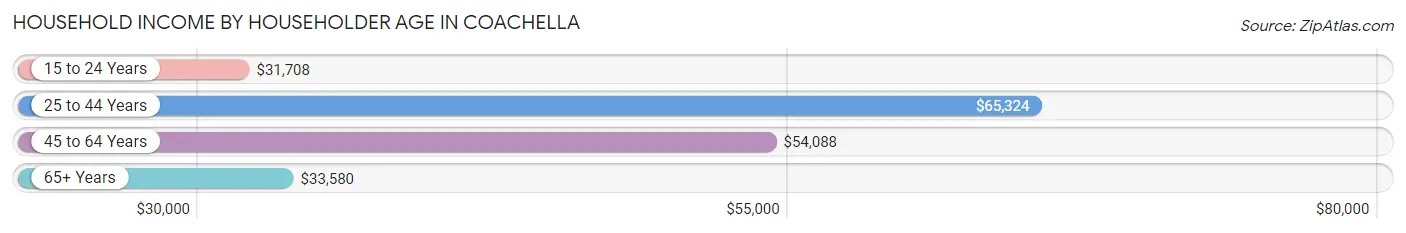
| Income Bracket | # Households | Median Income |
| 15 to 24 Years | 377 (2.7%) | $31,708 |
| 25 to 44 Years | 5,437 (39.0%) | $65,324 |
| 45 to 64 Years | 5,828 (41.8%) | $54,088 |
| 65+ Years | 2,300 (16.5%) | $33,580 |
| Total | 13,942 (100.0%) | $52,466 |
Poverty in Coachella
Income Below Poverty by Sex and Age in Coachella
With 8.2% poverty level for males and 14.2% for females among the residents of Coachella, 5 year old males and 5 year old females are the most vulnerable to poverty, with 72 males (29.5%) and 48 females (23.8%) in their respective age groups living below the poverty level.
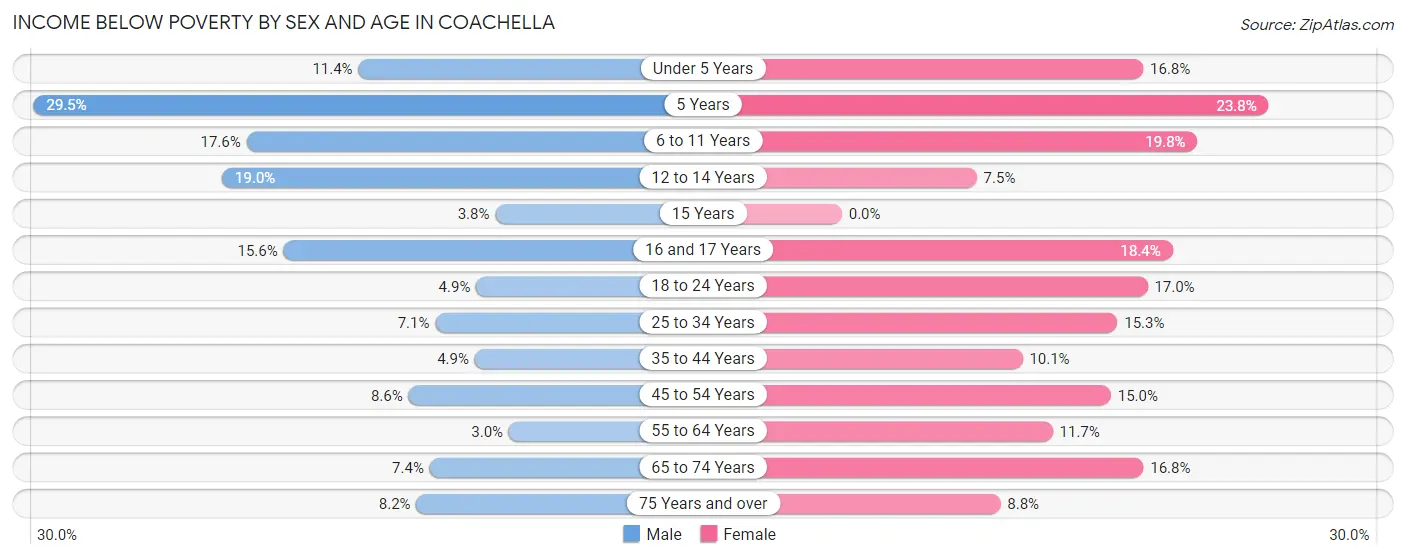
| Age Bracket | Male | Female |
| Under 5 Years | 127 (11.4%) | 146 (16.8%) |
| 5 Years | 72 (29.5%) | 48 (23.8%) |
| 6 to 11 Years | 290 (17.6%) | 263 (19.8%) |
| 12 to 14 Years | 161 (19.0%) | 71 (7.5%) |
| 15 Years | 22 (3.8%) | 0 (0.0%) |
| 16 and 17 Years | 93 (15.6%) | 119 (18.4%) |
| 18 to 24 Years | 121 (4.9%) | 338 (17.0%) |
| 25 to 34 Years | 248 (7.1%) | 607 (15.3%) |
| 35 to 44 Years | 167 (4.9%) | 320 (10.1%) |
| 45 to 54 Years | 218 (8.6%) | 448 (15.0%) |
| 55 to 64 Years | 69 (3.0%) | 264 (11.7%) |
| 65 to 74 Years | 94 (7.4%) | 275 (16.8%) |
| 75 Years and over | 76 (8.2%) | 53 (8.8%) |
| Total | 1,758 (8.2%) | 2,952 (14.2%) |
Income Above Poverty by Sex and Age in Coachella
According to the poverty statistics in Coachella, males aged 55 to 64 years and females aged 15 years are the age groups that are most secure financially, with 97.0% of males and 100.0% of females in these age groups living above the poverty line.
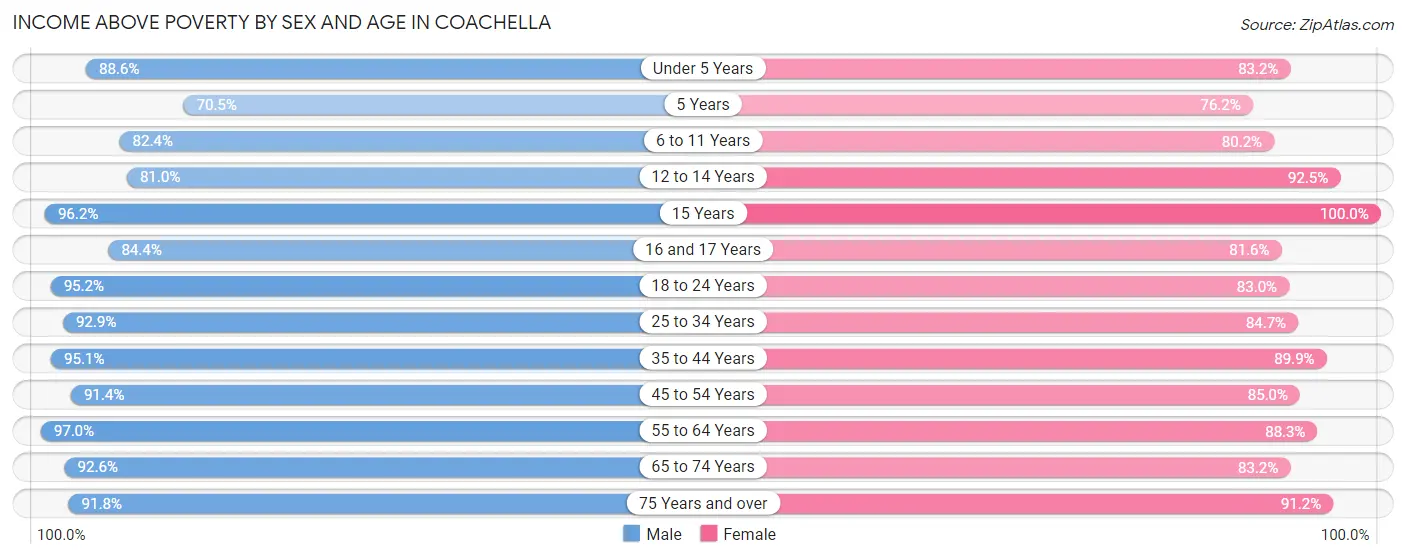
| Age Bracket | Male | Female |
| Under 5 Years | 986 (88.6%) | 724 (83.2%) |
| 5 Years | 172 (70.5%) | 154 (76.2%) |
| 6 to 11 Years | 1,354 (82.4%) | 1,065 (80.2%) |
| 12 to 14 Years | 686 (81.0%) | 875 (92.5%) |
| 15 Years | 558 (96.2%) | 198 (100.0%) |
| 16 and 17 Years | 504 (84.4%) | 527 (81.6%) |
| 18 to 24 Years | 2,374 (95.2%) | 1,648 (83.0%) |
| 25 to 34 Years | 3,229 (92.9%) | 3,350 (84.7%) |
| 35 to 44 Years | 3,223 (95.1%) | 2,860 (89.9%) |
| 45 to 54 Years | 2,311 (91.4%) | 2,542 (85.0%) |
| 55 to 64 Years | 2,210 (97.0%) | 1,984 (88.3%) |
| 65 to 74 Years | 1,169 (92.6%) | 1,363 (83.2%) |
| 75 Years and over | 853 (91.8%) | 547 (91.2%) |
| Total | 19,629 (91.8%) | 17,837 (85.8%) |
Income Below Poverty Among Married-Couple Families in Coachella
The poverty statistics for married-couple families in Coachella show that 5.4% or 342 of the total 6,385 families live below the poverty line. Families with 3 or 4 children have the highest poverty rate of 10.1%, comprising of 63 families. On the other hand, families with 5 or more children have the lowest poverty rate of 0.0%, which includes 0 families.
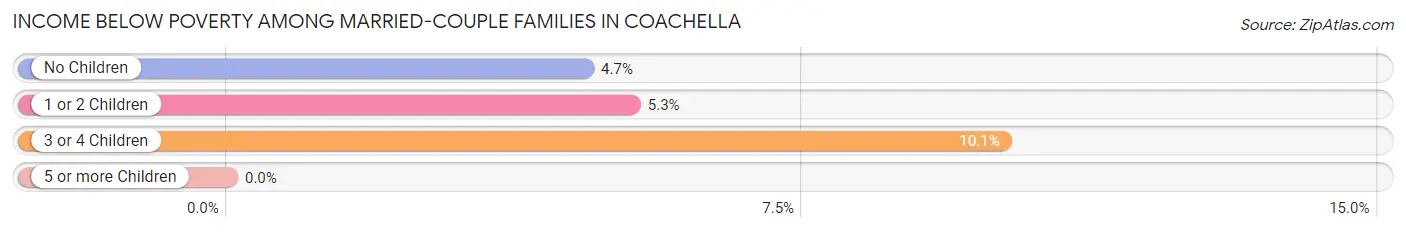
| Children | Above Poverty | Below Poverty |
| No Children | 3,218 (95.4%) | 157 (4.6%) |
| 1 or 2 Children | 2,196 (94.7%) | 122 (5.3%) |
| 3 or 4 Children | 561 (89.9%) | 63 (10.1%) |
| 5 or more Children | 68 (100.0%) | 0 (0.0%) |
| Total | 6,043 (94.6%) | 342 (5.4%) |
Income Below Poverty Among Single-Parent Households in Coachella
According to the poverty data in Coachella, 4.0% or 40 single-father households and 28.6% or 652 single-mother households are living below the poverty line. Among single-father households, those with 3 or 4 children have the highest poverty rate, with 15 households (41.7%) experiencing poverty. Likewise, among single-mother households, those with 3 or 4 children have the highest poverty rate, with 111 households (53.4%) falling below the poverty line.
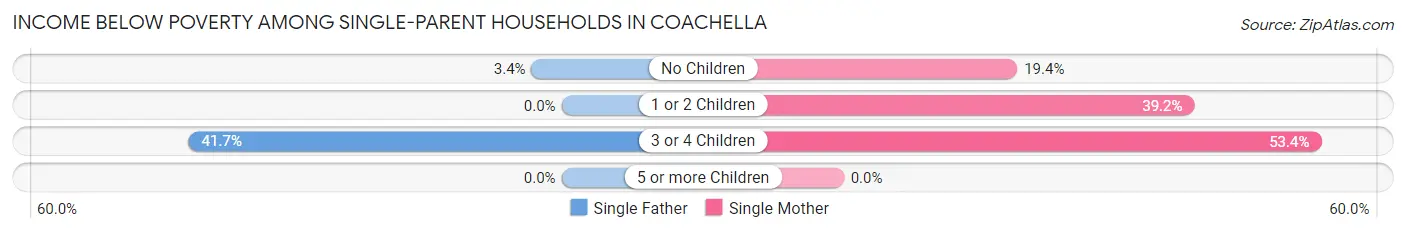
| Children | Single Father | Single Mother |
| No Children | 25 (3.4%) | 246 (19.4%) |
| 1 or 2 Children | 0 (0.0%) | 295 (39.2%) |
| 3 or 4 Children | 15 (41.7%) | 111 (53.4%) |
| 5 or more Children | 0 (0.0%) | 0 (0.0%) |
| Total | 40 (4.0%) | 652 (28.6%) |
Income Below Poverty Among Married-Couple vs Single-Parent Households in Coachella
The poverty data for Coachella shows that 342 of the married-couple family households (5.4%) and 692 of the single-parent households (21.0%) are living below the poverty level. Within the married-couple family households, those with 3 or 4 children have the highest poverty rate, with 63 households (10.1%) falling below the poverty line. Among the single-parent households, those with 3 or 4 children have the highest poverty rate, with 126 household (51.6%) living below poverty.
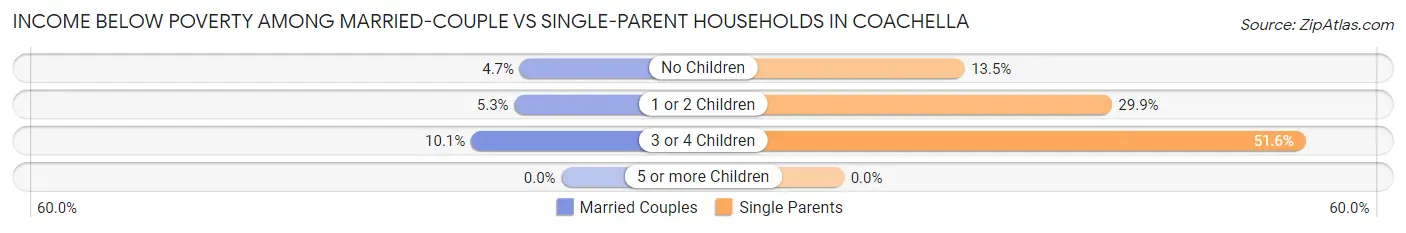
| Children | Married-Couple Families | Single-Parent Households |
| No Children | 157 (4.6%) | 271 (13.5%) |
| 1 or 2 Children | 122 (5.3%) | 295 (29.9%) |
| 3 or 4 Children | 63 (10.1%) | 126 (51.6%) |
| 5 or more Children | 0 (0.0%) | 0 (0.0%) |
| Total | 342 (5.4%) | 692 (21.0%) |
Race in Coachella
The most populous races in Coachella are Hispanic or Latino (41,298 | 97.7%), Some other Race (20,925 | 49.5%), and Two or more Races (15,610 | 36.9%).
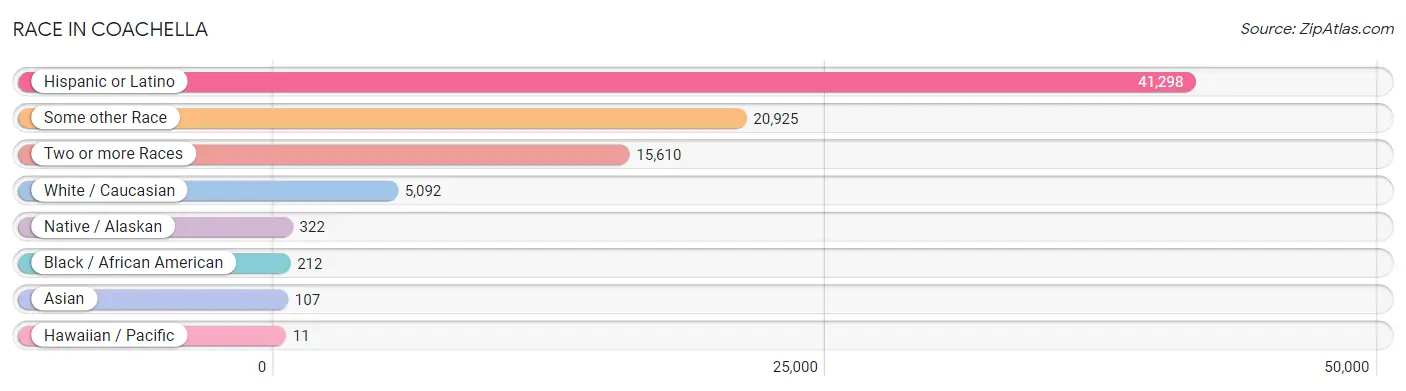
| Race | # Population | % Population |
| Asian | 107 | 0.3% |
| Black / African American | 212 | 0.5% |
| Hawaiian / Pacific | 11 | 0.0% |
| Hispanic or Latino | 41,298 | 97.7% |
| Native / Alaskan | 322 | 0.8% |
| White / Caucasian | 5,092 | 12.0% |
| Two or more Races | 15,610 | 36.9% |
| Some other Race | 20,925 | 49.5% |
| Total | 42,279 | 100.0% |
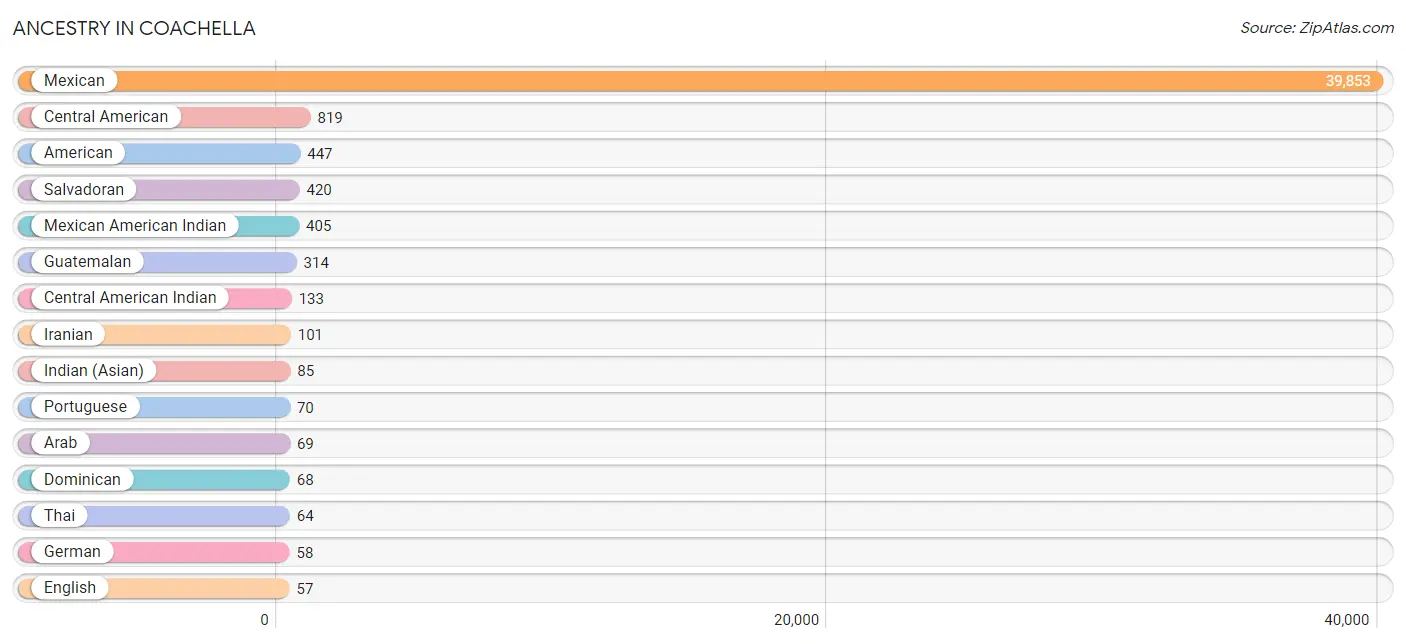
Ancestry in Coachella
The most populous ancestries reported in Coachella are Mexican (39,853 | 94.3%), Central American (819 | 1.9%), American (447 | 1.1%), Salvadoran (420 | 1.0%), and Mexican American Indian (405 | 1.0%), together accounting for 99.2% of all Coachella residents.
| Ancestry | # Population | % Population |
| African | 16 | 0.0% |
| American | 447 | 1.1% |
| Apache | 7 | 0.0% |
| Arab | 69 | 0.2% |
| Bhutanese | 34 | 0.1% |
| British | 1 | 0.0% |
| Burmese | 11 | 0.0% |
| Central American | 819 | 1.9% |
| Central American Indian | 133 | 0.3% |
| Colombian | 10 | 0.0% |
| Cuban | 16 | 0.0% |
| Dominican | 68 | 0.2% |
| English | 57 | 0.1% |
| European | 29 | 0.1% |
| Filipino | 12 | 0.0% |
| German | 58 | 0.1% |
| Guatemalan | 314 | 0.7% |
| Honduran | 29 | 0.1% |
| Indian (Asian) | 85 | 0.2% |
| Iranian | 101 | 0.2% |
| Irish | 43 | 0.1% |
| Italian | 43 | 0.1% |
| Korean | 57 | 0.1% |
| Mexican | 39,853 | 94.3% |
| Mexican American Indian | 405 | 1.0% |
| Native Hawaiian | 34 | 0.1% |
| Nicaraguan | 41 | 0.1% |
| Portuguese | 70 | 0.2% |
| Puerto Rican | 55 | 0.1% |
| Salvadoran | 420 | 1.0% |
| South American | 10 | 0.0% |
| Spaniard | 35 | 0.1% |
| Sri Lankan | 24 | 0.1% |
| Subsaharan African | 16 | 0.0% |
| Thai | 64 | 0.2% |
| Tongan | 32 | 0.1% |
| Ukrainian | 23 | 0.1% |
| Yuman | 37 | 0.1% | View All 38 Rows |
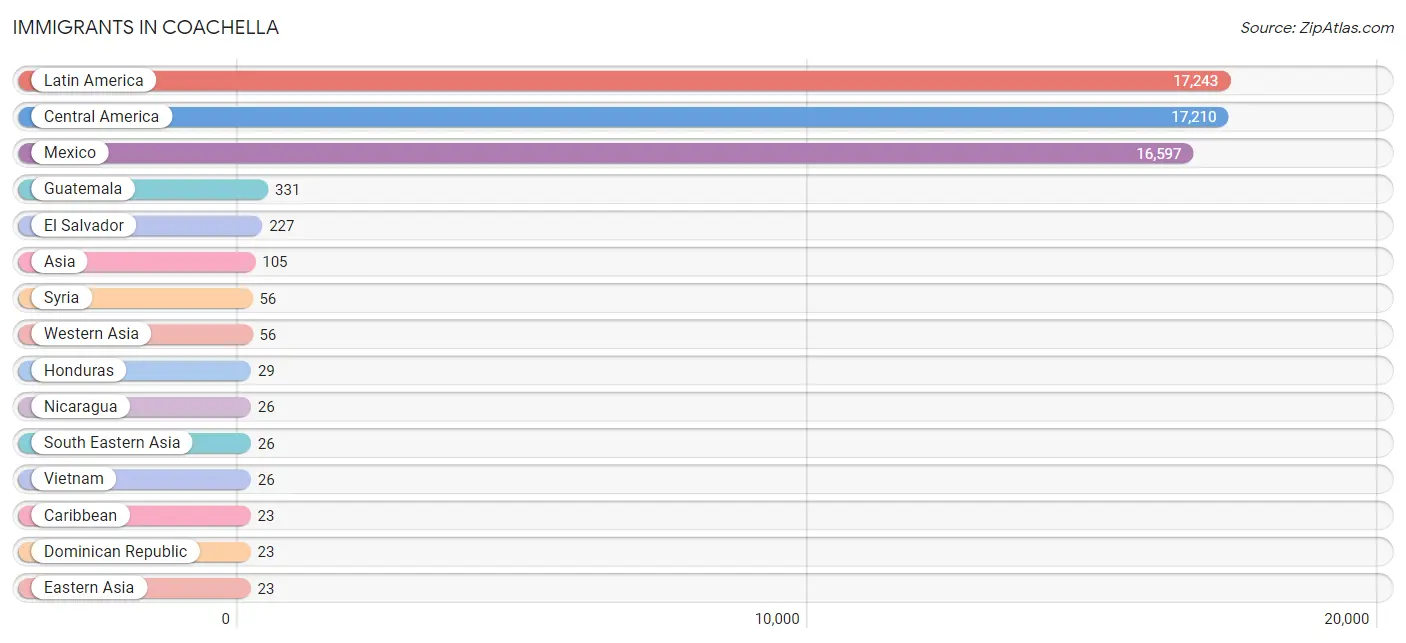
Immigrants in Coachella
The most numerous immigrant groups reported in Coachella came from Latin America (17,243 | 40.8%), Central America (17,210 | 40.7%), Mexico (16,597 | 39.3%), Guatemala (331 | 0.8%), and El Salvador (227 | 0.5%), together accounting for 122.1% of all Coachella residents.
| Immigration Origin | # Population | % Population |
| Asia | 105 | 0.3% |
| Canada | 1 | 0.0% |
| Caribbean | 23 | 0.1% |
| Central America | 17,210 | 40.7% |
| China | 16 | 0.0% |
| Colombia | 10 | 0.0% |
| Dominican Republic | 23 | 0.1% |
| Eastern Asia | 23 | 0.1% |
| El Salvador | 227 | 0.5% |
| Europe | 1 | 0.0% |
| Guatemala | 331 | 0.8% |
| Honduras | 29 | 0.1% |
| Hong Kong | 12 | 0.0% |
| Japan | 7 | 0.0% |
| Latin America | 17,243 | 40.8% |
| Mexico | 16,597 | 39.3% |
| Nicaragua | 26 | 0.1% |
| Northern Europe | 1 | 0.0% |
| South America | 10 | 0.0% |
| South Eastern Asia | 26 | 0.1% |
| Syria | 56 | 0.1% |
| Taiwan | 4 | 0.0% |
| Vietnam | 26 | 0.1% |
| Western Asia | 56 | 0.1% | View All 24 Rows |
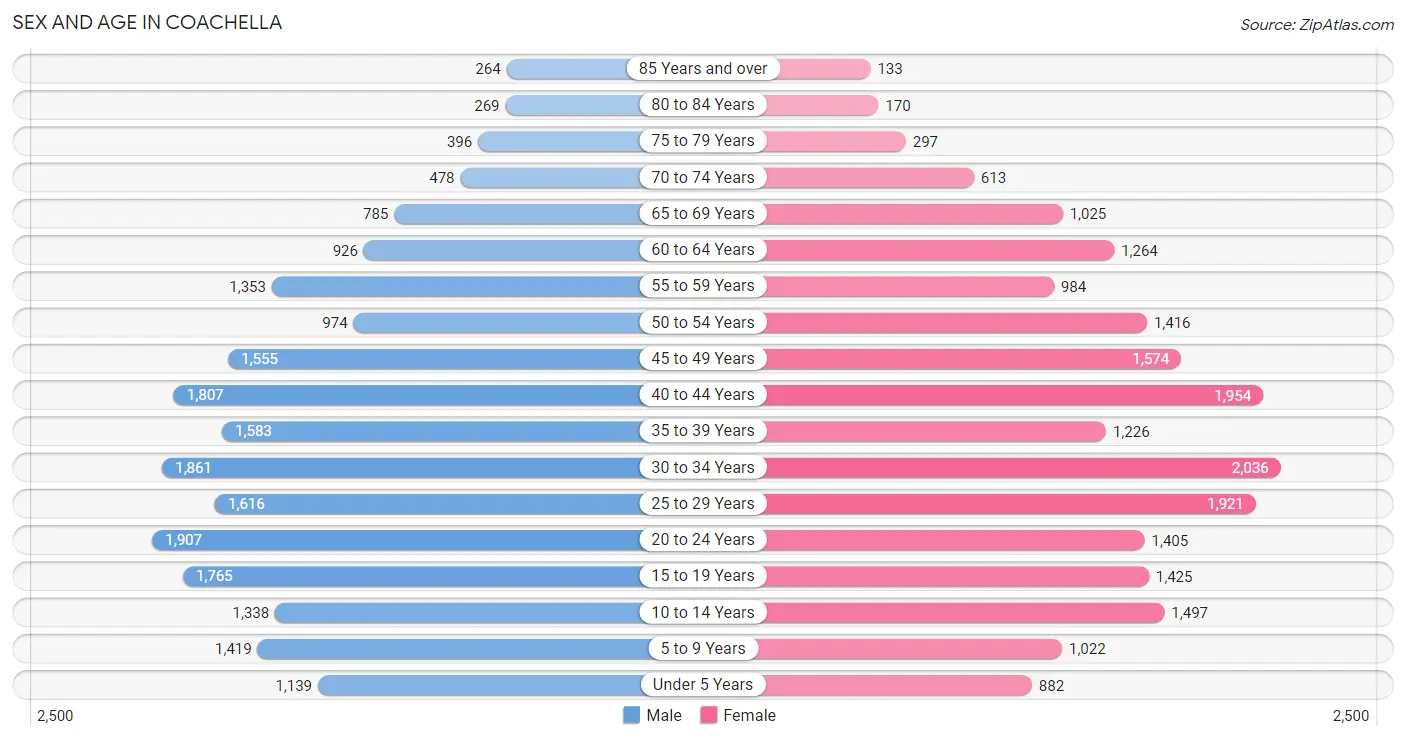
Sex and Age in Coachella
Sex and Age in Coachella
The most populous age groups in Coachella are 20 to 24 Years (1,907 | 8.9%) for men and 30 to 34 Years (2,036 | 9.8%) for women.
| Age Bracket | Male | Female |
| Under 5 Years | 1,139 (5.3%) | 882 (4.2%) |
| 5 to 9 Years | 1,419 (6.6%) | 1,022 (4.9%) |
| 10 to 14 Years | 1,338 (6.2%) | 1,497 (7.2%) |
| 15 to 19 Years | 1,765 (8.2%) | 1,425 (6.8%) |
| 20 to 24 Years | 1,907 (8.9%) | 1,405 (6.7%) |
| 25 to 29 Years | 1,616 (7.5%) | 1,921 (9.2%) |
| 30 to 34 Years | 1,861 (8.7%) | 2,036 (9.8%) |
| 35 to 39 Years | 1,583 (7.4%) | 1,226 (5.9%) |
| 40 to 44 Years | 1,807 (8.4%) | 1,954 (9.4%) |
| 45 to 49 Years | 1,555 (7.2%) | 1,574 (7.5%) |
| 50 to 54 Years | 974 (4.5%) | 1,416 (6.8%) |
| 55 to 59 Years | 1,353 (6.3%) | 984 (4.7%) |
| 60 to 64 Years | 926 (4.3%) | 1,264 (6.1%) |
| 65 to 69 Years | 785 (3.7%) | 1,025 (4.9%) |
| 70 to 74 Years | 478 (2.2%) | 613 (2.9%) |
| 75 to 79 Years | 396 (1.8%) | 297 (1.4%) |
| 80 to 84 Years | 269 (1.3%) | 170 (0.8%) |
| 85 Years and over | 264 (1.2%) | 133 (0.6%) |
| Total | 21,435 (100.0%) | 20,844 (100.0%) |
Families and Households in Coachella
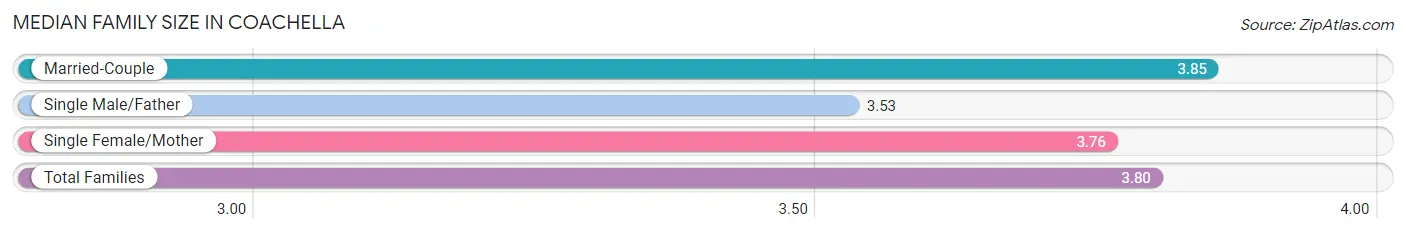
Median Family Size in Coachella
The median family size in Coachella is 3.80 persons per family, with married-couple families (6,385 | 66.0%) accounting for the largest median family size of 3.85 persons per family. On the other hand, single male/father families (1,013 | 10.5%) represent the smallest median family size with 3.53 persons per family.
| Family Type | # Families | Family Size |
| Married-Couple | 6,385 (66.0%) | 3.85 |
| Single Male/Father | 1,013 (10.5%) | 3.53 |
| Single Female/Mother | 2,276 (23.5%) | 3.76 |
| Total Families | 9,674 (100.0%) | 3.80 |
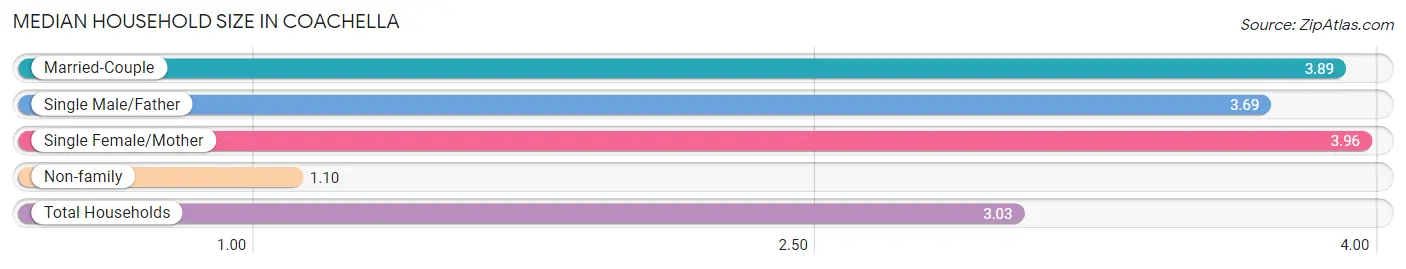
Median Household Size in Coachella
The median household size in Coachella is 3.03 persons per household, with single female/mother households (2,276 | 16.3%) accounting for the largest median household size of 3.96 persons per household. non-family households (4,268 | 30.6%) represent the smallest median household size with 1.10 persons per household.
| Household Type | # Households | Household Size |
| Married-Couple | 6,385 (45.8%) | 3.89 |
| Single Male/Father | 1,013 (7.3%) | 3.69 |
| Single Female/Mother | 2,276 (16.3%) | 3.96 |
| Non-family | 4,268 (30.6%) | 1.10 |
| Total Households | 13,942 (100.0%) | 3.03 |
Household Size by Marriage Status in Coachella
Out of a total of 13,942 households in Coachella, 9,674 (69.4%) are family households, while 4,268 (30.6%) are nonfamily households. The most numerous type of family households are 2-person households, comprising 3,278, and the most common type of nonfamily households are 1-person households, comprising 3,924.
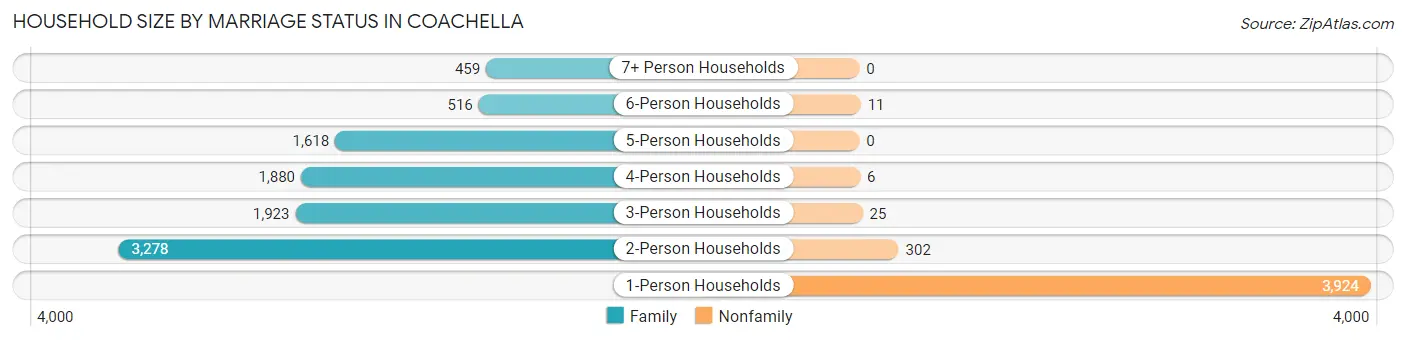
| Household Size | Family Households | Nonfamily Households |
| 1-Person Households | - | 3,924 (28.1%) |
| 2-Person Households | 3,278 (23.5%) | 302 (2.2%) |
| 3-Person Households | 1,923 (13.8%) | 25 (0.2%) |
| 4-Person Households | 1,880 (13.5%) | 6 (0.0%) |
| 5-Person Households | 1,618 (11.6%) | 0 (0.0%) |
| 6-Person Households | 516 (3.7%) | 11 (0.1%) |
| 7+ Person Households | 459 (3.3%) | 0 (0.0%) |
| Total | 9,674 (69.4%) | 4,268 (30.6%) |
Female Fertility in Coachella
Fertility by Age in Coachella
Average fertility rate in Coachella is 49.0 births per 1,000 women. Women in the age bracket of 20 to 34 years have the highest fertility rate with 71.0 births per 1,000 women. Women in the age bracket of 20 to 34 years acount for 66.4% of all women with births.
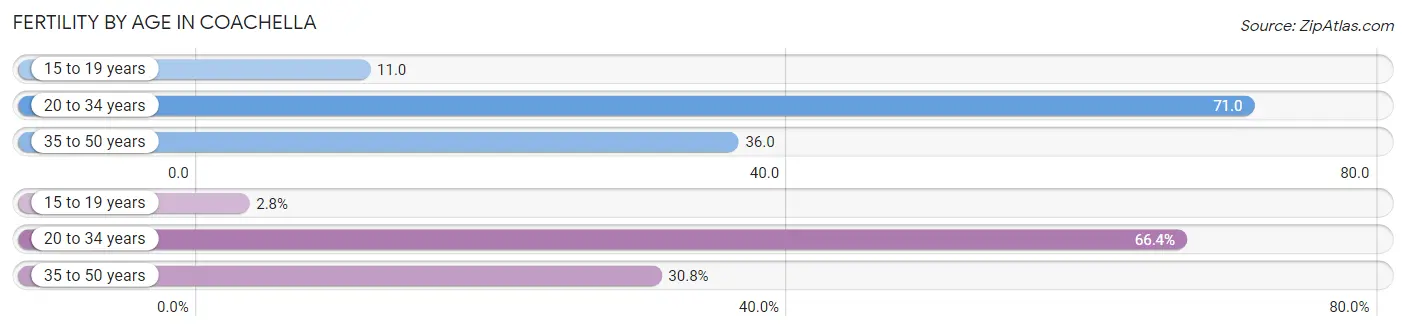
| Age Bracket | Women with Births | Births / 1,000 Women |
| 15 to 19 years | 16 (2.8%) | 11.0 |
| 20 to 34 years | 380 (66.4%) | 71.0 |
| 35 to 50 years | 176 (30.8%) | 36.0 |
| Total | 572 (100.0%) | 49.0 |
Fertility by Age by Marriage Status in Coachella
74.5% of women with births (572) in Coachella are married. The highest percentage of unmarried women with births falls into 15 to 19 years age bracket with 100.0% of them unmarried at the time of birth, while the lowest percentage of unmarried women with births belong to 35 to 50 years age bracket with 10.2% of them unmarried.
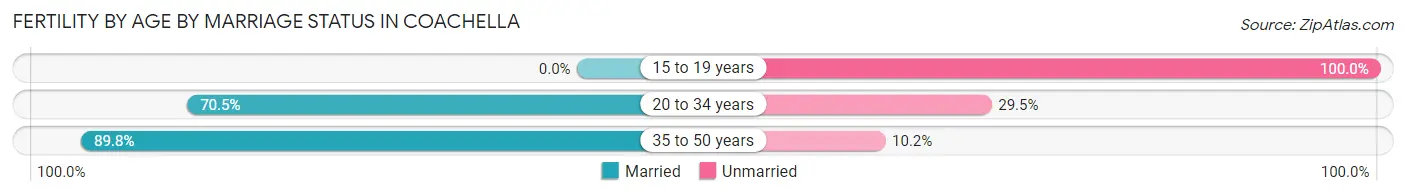
| Age Bracket | Married | Unmarried |
| 15 to 19 years | 0 (0.0%) | 16 (100.0%) |
| 20 to 34 years | 268 (70.5%) | 112 (29.5%) |
| 35 to 50 years | 158 (89.8%) | 18 (10.2%) |
| Total | 426 (74.5%) | 146 (25.5%) |
Fertility by Education in Coachella
Average fertility rate in Coachella is 49.0 births per 1,000 women. Women with the education attainment of graduate degree have the highest fertility rate of 245.0 births per 1,000 women, while women with the education attainment of high school diploma have the lowest fertility at 17.0 births per 1,000 women. Women with the education attainment of college or associate's degree represent 38.1% of all women with births.
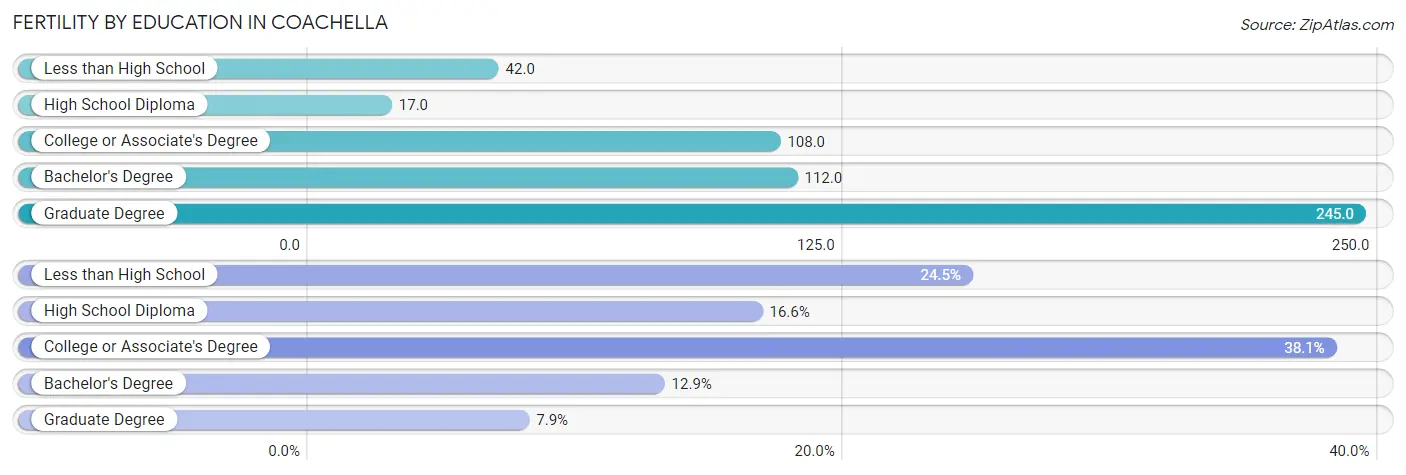
| Educational Attainment | Women with Births | Births / 1,000 Women |
| Less than High School | 140 (24.5%) | 42.0 |
| High School Diploma | 95 (16.6%) | 17.0 |
| College or Associate's Degree | 218 (38.1%) | 108.0 |
| Bachelor's Degree | 74 (12.9%) | 112.0 |
| Graduate Degree | 45 (7.9%) | 245.0 |
| Total | 572 (100.0%) | 49.0 |
Fertility by Education by Marriage Status in Coachella
25.5% of women with births in Coachella are unmarried. Women with the educational attainment of graduate degree are most likely to be married with 100.0% of them married at childbirth, while women with the educational attainment of high school diploma are least likely to be married with 75.8% of them unmarried at childbirth.
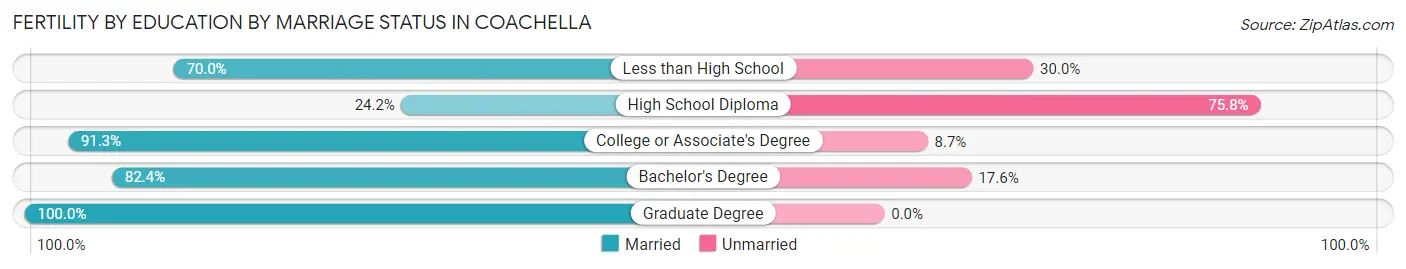
| Educational Attainment | Married | Unmarried |
| Less than High School | 98 (70.0%) | 42 (30.0%) |
| High School Diploma | 23 (24.2%) | 72 (75.8%) |
| College or Associate's Degree | 199 (91.3%) | 19 (8.7%) |
| Bachelor's Degree | 61 (82.4%) | 13 (17.6%) |
| Graduate Degree | 45 (100.0%) | 0 (0.0%) |
| Total | 426 (74.5%) | 146 (25.5%) |
Employment Characteristics in Coachella
Employment by Class of Employer in Coachella
Among the 20,484 employed individuals in Coachella, private company employees (16,398 | 80.0%), self-employed (not incorporated) (1,357 | 6.6%), and local government employees (1,095 | 5.3%) make up the most common classes of employment.
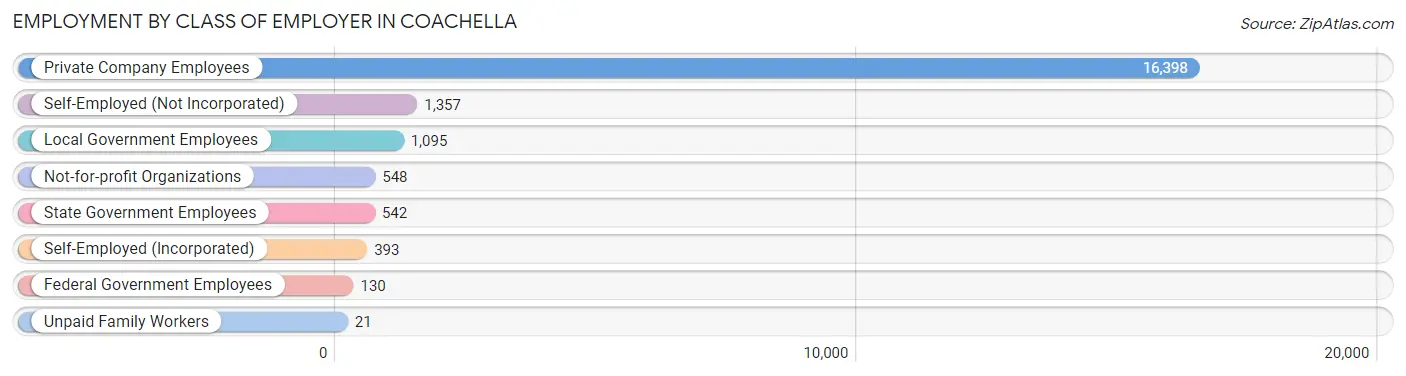
| Employer Class | # Employees | % Employees |
| Private Company Employees | 16,398 | 80.0% |
| Self-Employed (Incorporated) | 393 | 1.9% |
| Self-Employed (Not Incorporated) | 1,357 | 6.6% |
| Not-for-profit Organizations | 548 | 2.7% |
| Local Government Employees | 1,095 | 5.3% |
| State Government Employees | 542 | 2.6% |
| Federal Government Employees | 130 | 0.6% |
| Unpaid Family Workers | 21 | 0.1% |
| Total | 20,484 | 100.0% |
Employment Status by Age in Coachella
According to the labor force statistics for Coachella, out of the total population over 16 years of age (34,204), 69.0% or 23,601 individuals are in the labor force, with 11.9% or 2,809 of them unemployed. The age group with the highest labor force participation rate is 35 to 44 years, with 89.1% or 5,854 individuals in the labor force. Within the labor force, the 20 to 24 years age range has the highest percentage of unemployed individuals, with 27.8% or 696 of them being unemployed.
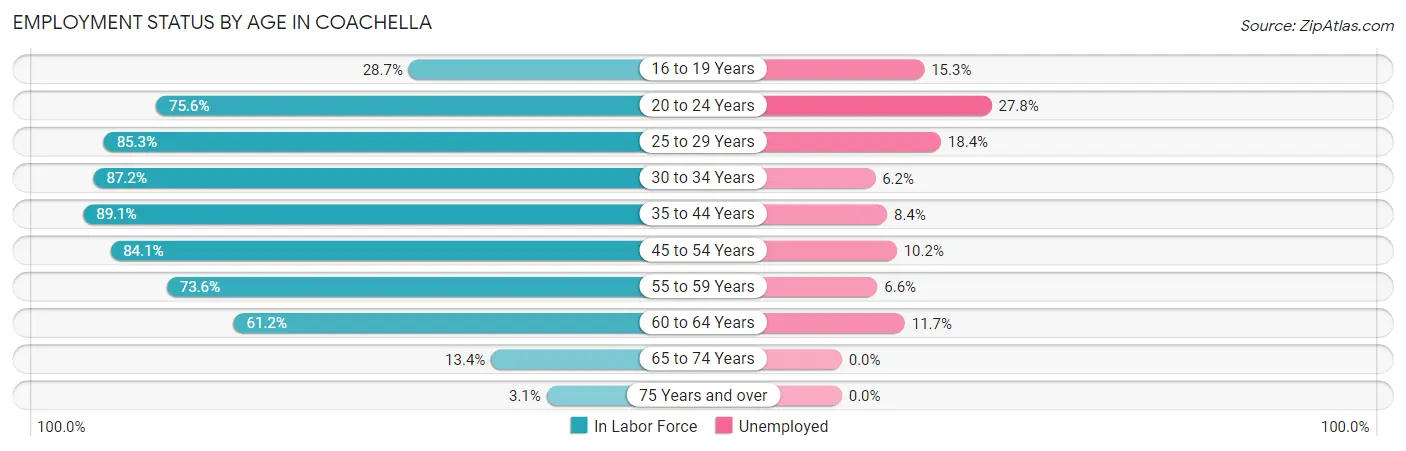
| Age Bracket | In Labor Force | Unemployed |
| 16 to 19 Years | 692 (28.7%) | 106 (15.3%) |
| 20 to 24 Years | 2,504 (75.6%) | 696 (27.8%) |
| 25 to 29 Years | 3,017 (85.3%) | 555 (18.4%) |
| 30 to 34 Years | 3,398 (87.2%) | 211 (6.2%) |
| 35 to 44 Years | 5,854 (89.1%) | 492 (8.4%) |
| 45 to 54 Years | 4,641 (84.1%) | 473 (10.2%) |
| 55 to 59 Years | 1,720 (73.6%) | 114 (6.6%) |
| 60 to 64 Years | 1,340 (61.2%) | 157 (11.7%) |
| 65 to 74 Years | 389 (13.4%) | 0 (0.0%) |
| 75 Years and over | 47 (3.1%) | 0 (0.0%) |
| Total | 23,601 (69.0%) | 2,809 (11.9%) |
Employment Status by Educational Attainment in Coachella
According to labor force statistics for Coachella, 83.0% of individuals (19,962) out of the total population between 25 and 64 years of age (24,050) are in the labor force, with 10.0% or 1,996 of them being unemployed. The group with the highest labor force participation rate are those with the educational attainment of high school diploma, with 88.3% or 9,588 individuals in the labor force. Within the labor force, individuals with less than high school education have the highest percentage of unemployment, with 12.0% or 784 of them being unemployed.
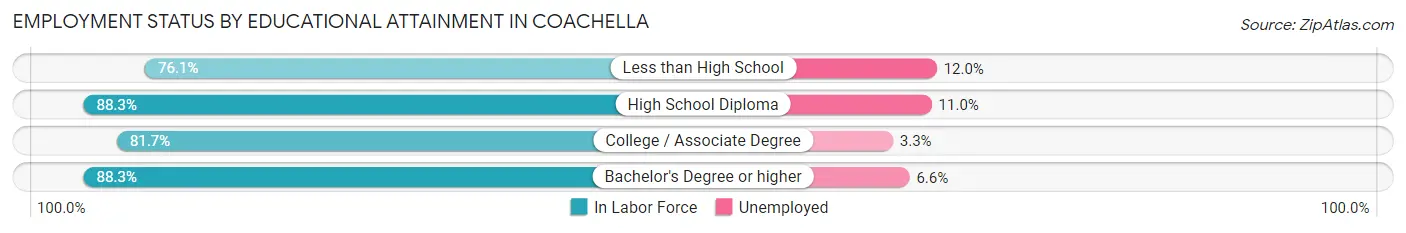
| Educational Attainment | In Labor Force | Unemployed |
| Less than High School | 6,532 (76.1%) | 1,030 (12.0%) |
| High School Diploma | 9,588 (88.3%) | 1,194 (11.0%) |
| College / Associate Degree | 2,797 (81.7%) | 113 (3.3%) |
| Bachelor's Degree or higher | 1,045 (88.3%) | 78 (6.6%) |
| Total | 19,962 (83.0%) | 2,405 (10.0%) |
Employment Occupations by Sex in Coachella
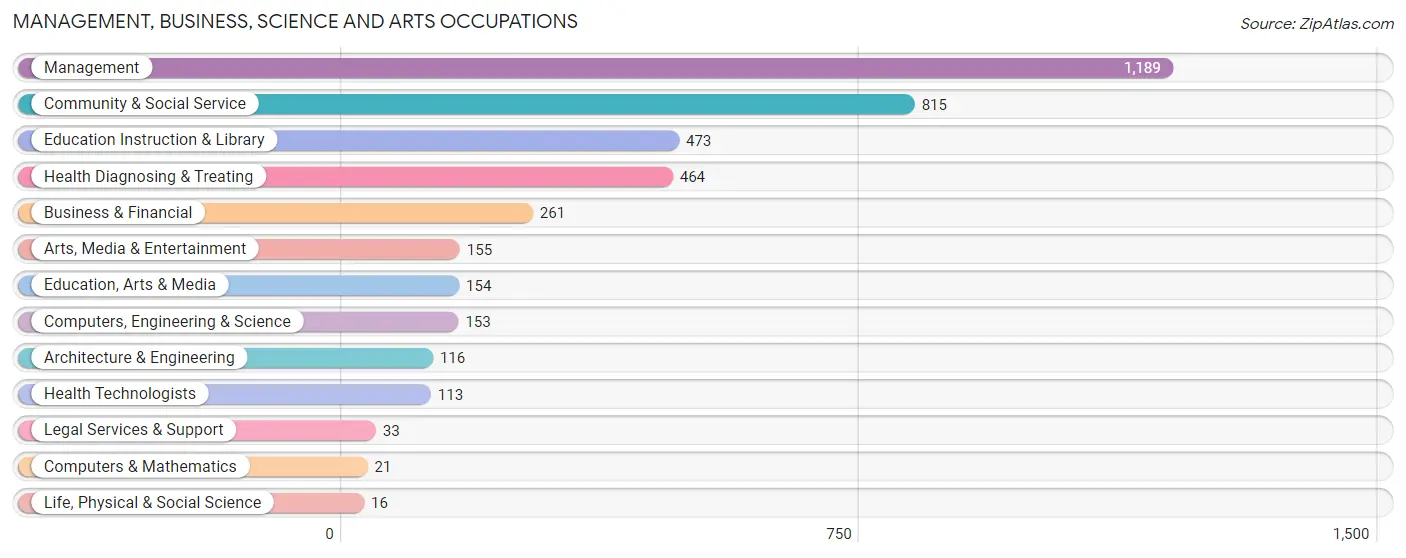
Management, Business, Science and Arts Occupations
The most common Management, Business, Science and Arts occupations in Coachella are Management (1,189 | 5.7%), Community & Social Service (815 | 3.9%), Education Instruction & Library (473 | 2.3%), Health Diagnosing & Treating (464 | 2.2%), and Business & Financial (261 | 1.3%).
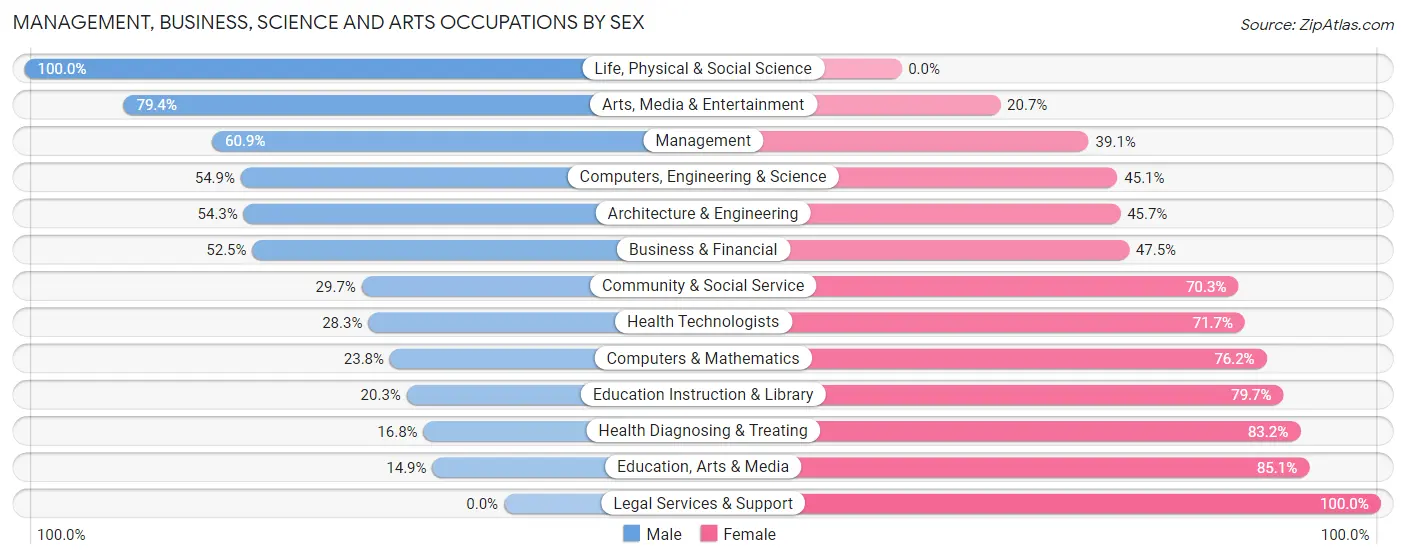
Management, Business, Science and Arts Occupations by Sex
Within the Management, Business, Science and Arts occupations in Coachella, the most male-oriented occupations are Life, Physical & Social Science (100.0%), Arts, Media & Entertainment (79.3%), and Management (60.9%), while the most female-oriented occupations are Legal Services & Support (100.0%), Education, Arts & Media (85.1%), and Health Diagnosing & Treating (83.2%).
| Occupation | Male | Female |
| Management | 724 (60.9%) | 465 (39.1%) |
| Business & Financial | 137 (52.5%) | 124 (47.5%) |
| Computers, Engineering & Science | 84 (54.9%) | 69 (45.1%) |
| Computers & Mathematics | 5 (23.8%) | 16 (76.2%) |
| Architecture & Engineering | 63 (54.3%) | 53 (45.7%) |
| Life, Physical & Social Science | 16 (100.0%) | 0 (0.0%) |
| Community & Social Service | 242 (29.7%) | 573 (70.3%) |
| Education, Arts & Media | 23 (14.9%) | 131 (85.1%) |
| Legal Services & Support | 0 (0.0%) | 33 (100.0%) |
| Education Instruction & Library | 96 (20.3%) | 377 (79.7%) |
| Arts, Media & Entertainment | 123 (79.3%) | 32 (20.6%) |
| Health Diagnosing & Treating | 78 (16.8%) | 386 (83.2%) |
| Health Technologists | 32 (28.3%) | 81 (71.7%) |
| Total (Category) | 1,265 (43.9%) | 1,617 (56.1%) |
| Total (Overall) | 11,639 (56.0%) | 9,156 (44.0%) |
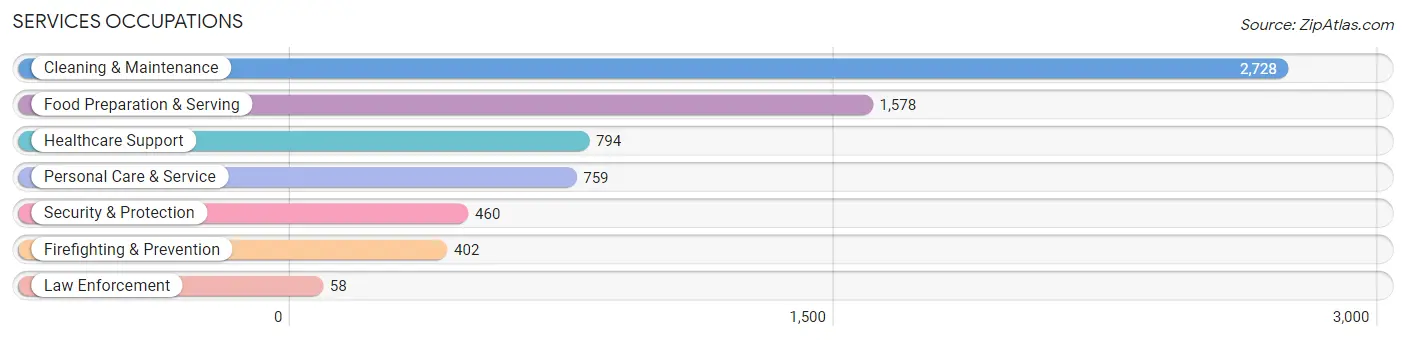
Services Occupations
The most common Services occupations in Coachella are Cleaning & Maintenance (2,728 | 13.1%), Food Preparation & Serving (1,578 | 7.6%), Healthcare Support (794 | 3.8%), Personal Care & Service (759 | 3.6%), and Security & Protection (460 | 2.2%).
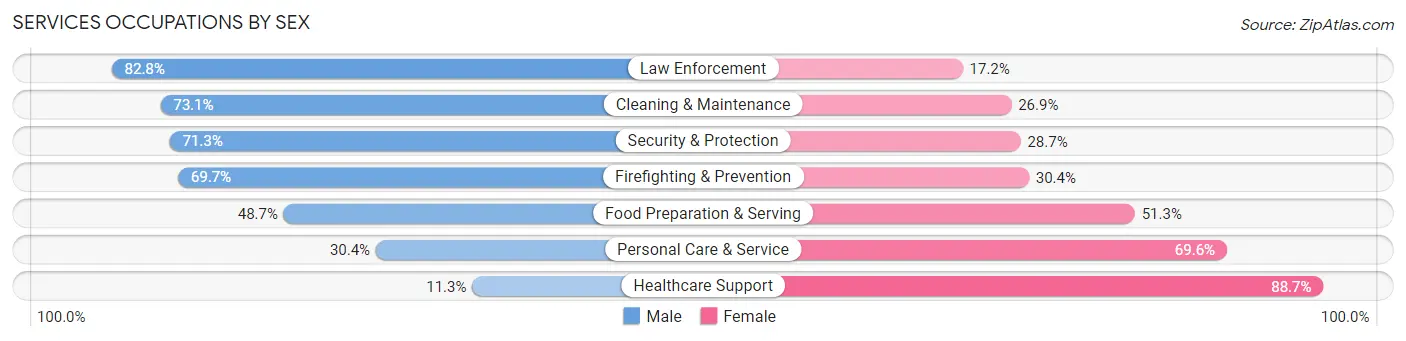
Services Occupations by Sex
Within the Services occupations in Coachella, the most male-oriented occupations are Law Enforcement (82.8%), Cleaning & Maintenance (73.1%), and Security & Protection (71.3%), while the most female-oriented occupations are Healthcare Support (88.7%), Personal Care & Service (69.6%), and Food Preparation & Serving (51.3%).
| Occupation | Male | Female |
| Healthcare Support | 90 (11.3%) | 704 (88.7%) |
| Security & Protection | 328 (71.3%) | 132 (28.7%) |
| Firefighting & Prevention | 280 (69.7%) | 122 (30.3%) |
| Law Enforcement | 48 (82.8%) | 10 (17.2%) |
| Food Preparation & Serving | 768 (48.7%) | 810 (51.3%) |
| Cleaning & Maintenance | 1,995 (73.1%) | 733 (26.9%) |
| Personal Care & Service | 231 (30.4%) | 528 (69.6%) |
| Total (Category) | 3,412 (54.0%) | 2,907 (46.0%) |
| Total (Overall) | 11,639 (56.0%) | 9,156 (44.0%) |
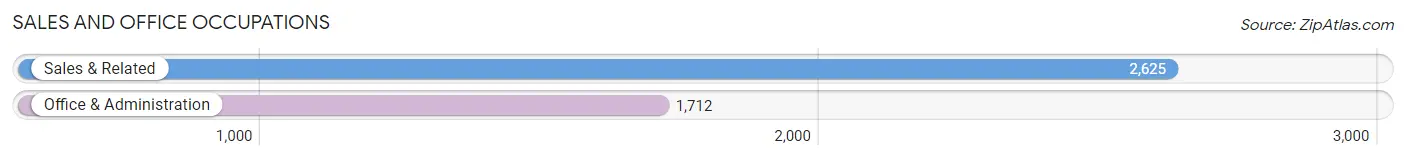
Sales and Office Occupations
The most common Sales and Office occupations in Coachella are Sales & Related (2,625 | 12.6%), and Office & Administration (1,712 | 8.2%).
Sales and Office Occupations by Sex
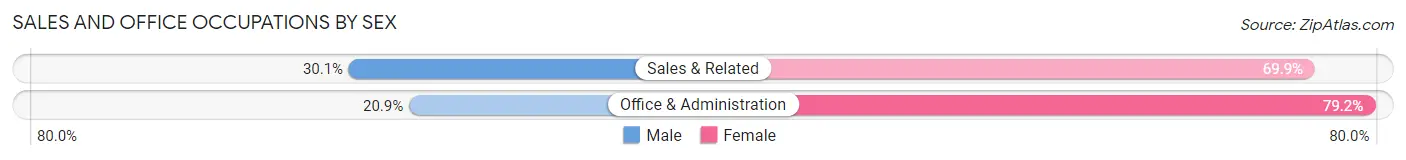
| Occupation | Male | Female |
| Sales & Related | 790 (30.1%) | 1,835 (69.9%) |
| Office & Administration | 357 (20.8%) | 1,355 (79.1%) |
| Total (Category) | 1,147 (26.5%) | 3,190 (73.6%) |
| Total (Overall) | 11,639 (56.0%) | 9,156 (44.0%) |
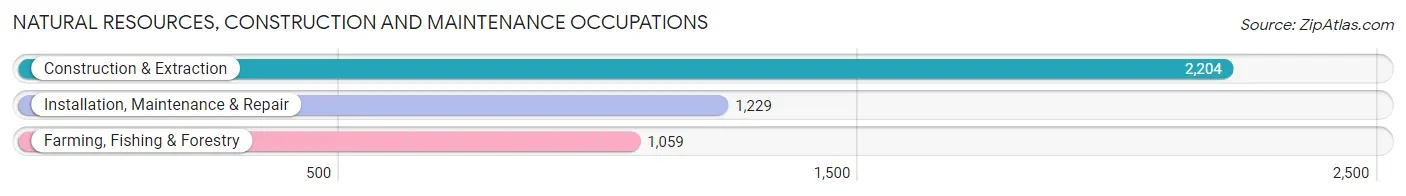
Natural Resources, Construction and Maintenance Occupations
The most common Natural Resources, Construction and Maintenance occupations in Coachella are Construction & Extraction (2,204 | 10.6%), Installation, Maintenance & Repair (1,229 | 5.9%), and Farming, Fishing & Forestry (1,059 | 5.1%).
Natural Resources, Construction and Maintenance Occupations by Sex
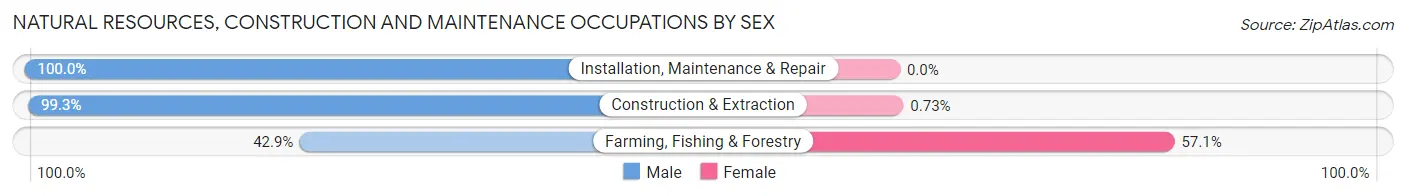
| Occupation | Male | Female |
| Farming, Fishing & Forestry | 454 (42.9%) | 605 (57.1%) |
| Construction & Extraction | 2,188 (99.3%) | 16 (0.7%) |
| Installation, Maintenance & Repair | 1,229 (100.0%) | 0 (0.0%) |
| Total (Category) | 3,871 (86.2%) | 621 (13.8%) |
| Total (Overall) | 11,639 (56.0%) | 9,156 (44.0%) |
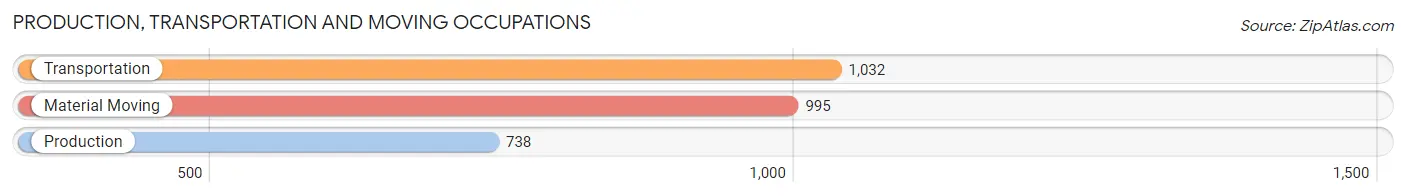
Production, Transportation and Moving Occupations
The most common Production, Transportation and Moving occupations in Coachella are Transportation (1,032 | 5.0%), Material Moving (995 | 4.8%), and Production (738 | 3.5%).
Production, Transportation and Moving Occupations by Sex
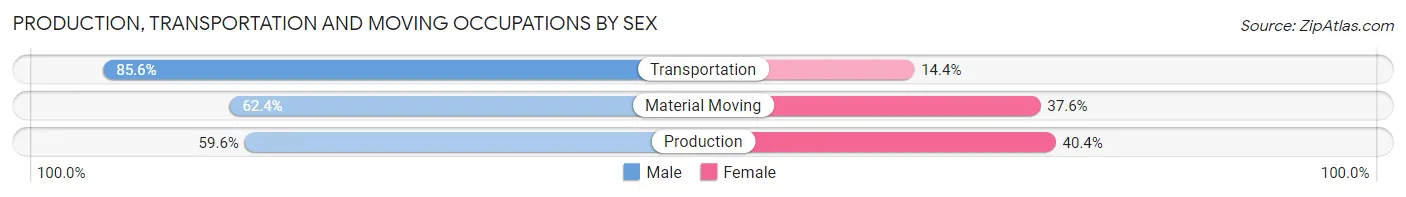
| Occupation | Male | Female |
| Production | 440 (59.6%) | 298 (40.4%) |
| Transportation | 883 (85.6%) | 149 (14.4%) |
| Material Moving | 621 (62.4%) | 374 (37.6%) |
| Total (Category) | 1,944 (70.3%) | 821 (29.7%) |
| Total (Overall) | 11,639 (56.0%) | 9,156 (44.0%) |
Employment Industries by Sex in Coachella
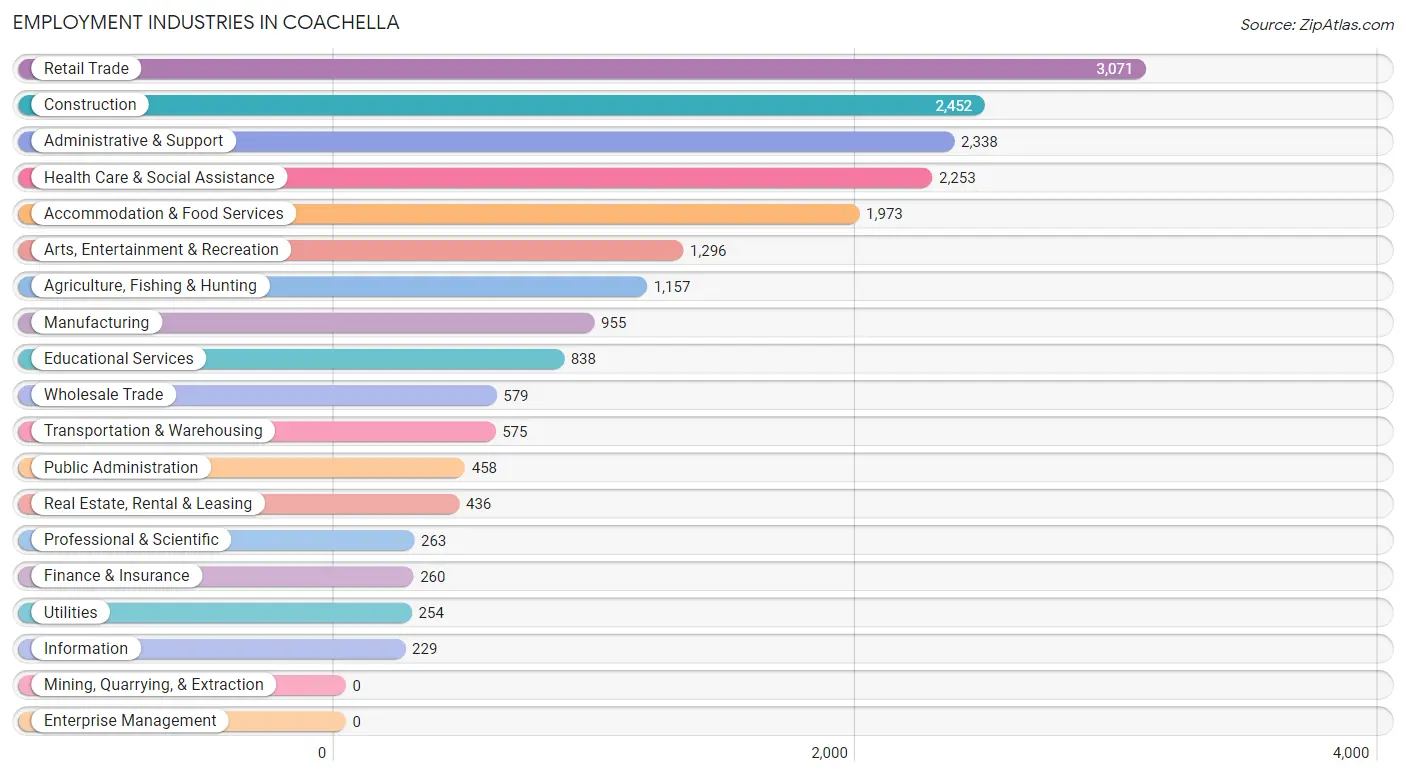
Employment Industries in Coachella
The major employment industries in Coachella include Retail Trade (3,071 | 14.8%), Construction (2,452 | 11.8%), Administrative & Support (2,338 | 11.2%), Health Care & Social Assistance (2,253 | 10.8%), and Accommodation & Food Services (1,973 | 9.5%).
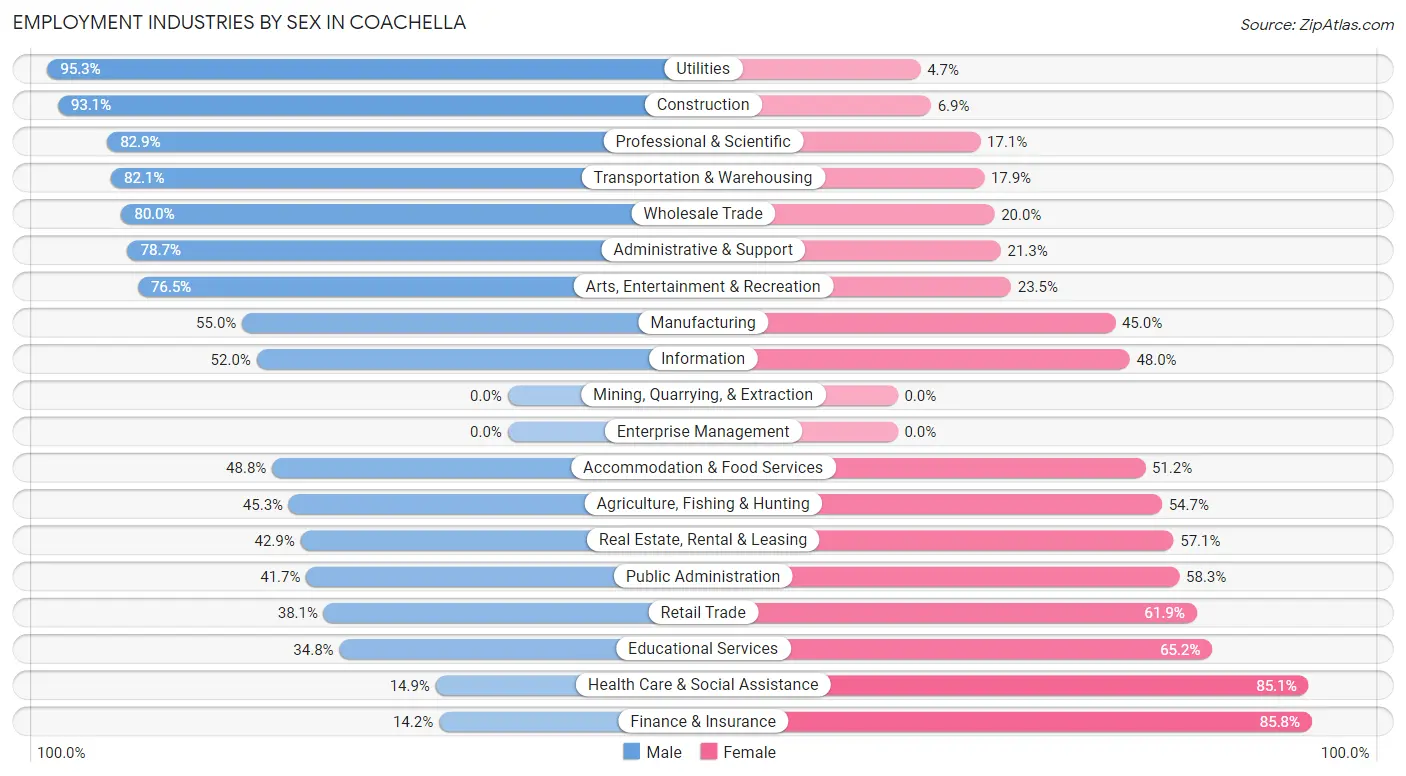
Employment Industries by Sex in Coachella
The Coachella industries that see more men than women are Utilities (95.3%), Construction (93.1%), and Professional & Scientific (82.9%), whereas the industries that tend to have a higher number of women are Finance & Insurance (85.8%), Health Care & Social Assistance (85.1%), and Educational Services (65.2%).
| Industry | Male | Female |
| Agriculture, Fishing & Hunting | 524 (45.3%) | 633 (54.7%) |
| Mining, Quarrying, & Extraction | 0 (0.0%) | 0 (0.0%) |
| Construction | 2,283 (93.1%) | 169 (6.9%) |
| Manufacturing | 525 (55.0%) | 430 (45.0%) |
| Wholesale Trade | 463 (80.0%) | 116 (20.0%) |
| Retail Trade | 1,169 (38.1%) | 1,902 (61.9%) |
| Transportation & Warehousing | 472 (82.1%) | 103 (17.9%) |
| Utilities | 242 (95.3%) | 12 (4.7%) |
| Information | 119 (52.0%) | 110 (48.0%) |
| Finance & Insurance | 37 (14.2%) | 223 (85.8%) |
| Real Estate, Rental & Leasing | 187 (42.9%) | 249 (57.1%) |
| Professional & Scientific | 218 (82.9%) | 45 (17.1%) |
| Enterprise Management | 0 (0.0%) | 0 (0.0%) |
| Administrative & Support | 1,839 (78.7%) | 499 (21.3%) |
| Educational Services | 292 (34.8%) | 546 (65.2%) |
| Health Care & Social Assistance | 336 (14.9%) | 1,917 (85.1%) |
| Arts, Entertainment & Recreation | 992 (76.5%) | 304 (23.5%) |
| Accommodation & Food Services | 962 (48.8%) | 1,011 (51.2%) |
| Public Administration | 191 (41.7%) | 267 (58.3%) |
| Total | 11,639 (56.0%) | 9,156 (44.0%) |
Education in Coachella
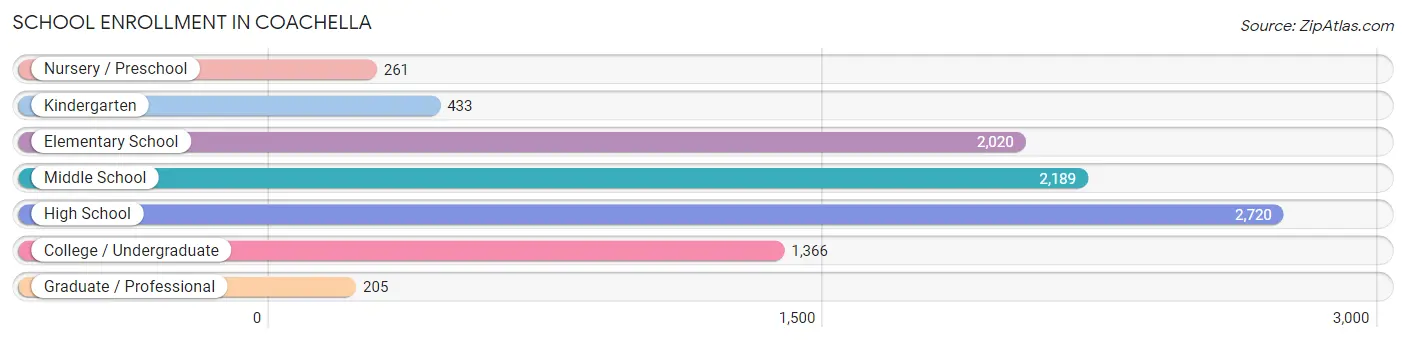
School Enrollment in Coachella
The most common levels of schooling among the 9,194 students in Coachella are high school (2,720 | 29.6%), middle school (2,189 | 23.8%), and elementary school (2,020 | 22.0%).
| School Level | # Students | % Students |
| Nursery / Preschool | 261 | 2.8% |
| Kindergarten | 433 | 4.7% |
| Elementary School | 2,020 | 22.0% |
| Middle School | 2,189 | 23.8% |
| High School | 2,720 | 29.6% |
| College / Undergraduate | 1,366 | 14.9% |
| Graduate / Professional | 205 | 2.2% |
| Total | 9,194 | 100.0% |
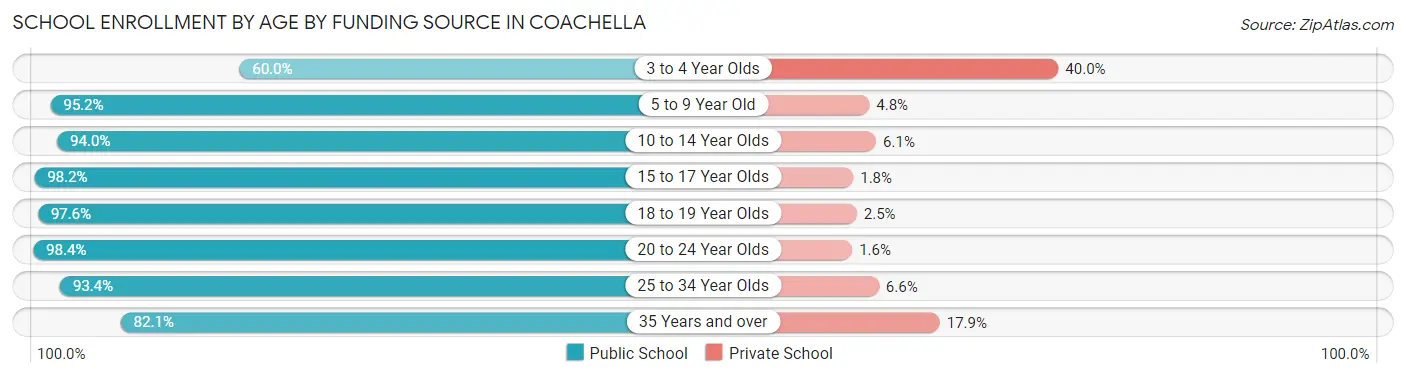
School Enrollment by Age by Funding Source in Coachella
Out of a total of 9,194 students who are enrolled in schools in Coachella, 506 (5.5%) attend a private institution, while the remaining 8,688 (94.5%) are enrolled in public schools. The age group of 3 to 4 year olds has the highest likelihood of being enrolled in private schools, with 92 (40.0% in the age bracket) enrolled. Conversely, the age group of 20 to 24 year olds has the lowest likelihood of being enrolled in a private school, with 676 (98.4% in the age bracket) attending a public institution.
| Age Bracket | Public School | Private School |
| 3 to 4 Year Olds | 138 (60.0%) | 92 (40.0%) |
| 5 to 9 Year Old | 2,149 (95.2%) | 108 (4.8%) |
| 10 to 14 Year Olds | 2,638 (94.0%) | 170 (6.0%) |
| 15 to 17 Year Olds | 1,806 (98.2%) | 33 (1.8%) |
| 18 to 19 Year Olds | 598 (97.6%) | 15 (2.5%) |
| 20 to 24 Year Olds | 676 (98.4%) | 11 (1.6%) |
| 25 to 34 Year Olds | 470 (93.4%) | 33 (6.6%) |
| 35 Years and over | 211 (82.1%) | 46 (17.9%) |
| Total | 8,688 (94.5%) | 506 (5.5%) |
Educational Attainment by Field of Study in Coachella
Business (373 | 26.5%), psychology (184 | 13.1%), education (181 | 12.9%), engineering (146 | 10.4%), and arts & humanities (127 | 9.0%) are the most common fields of study among 1,406 individuals in Coachella who have obtained a bachelor's degree or higher.
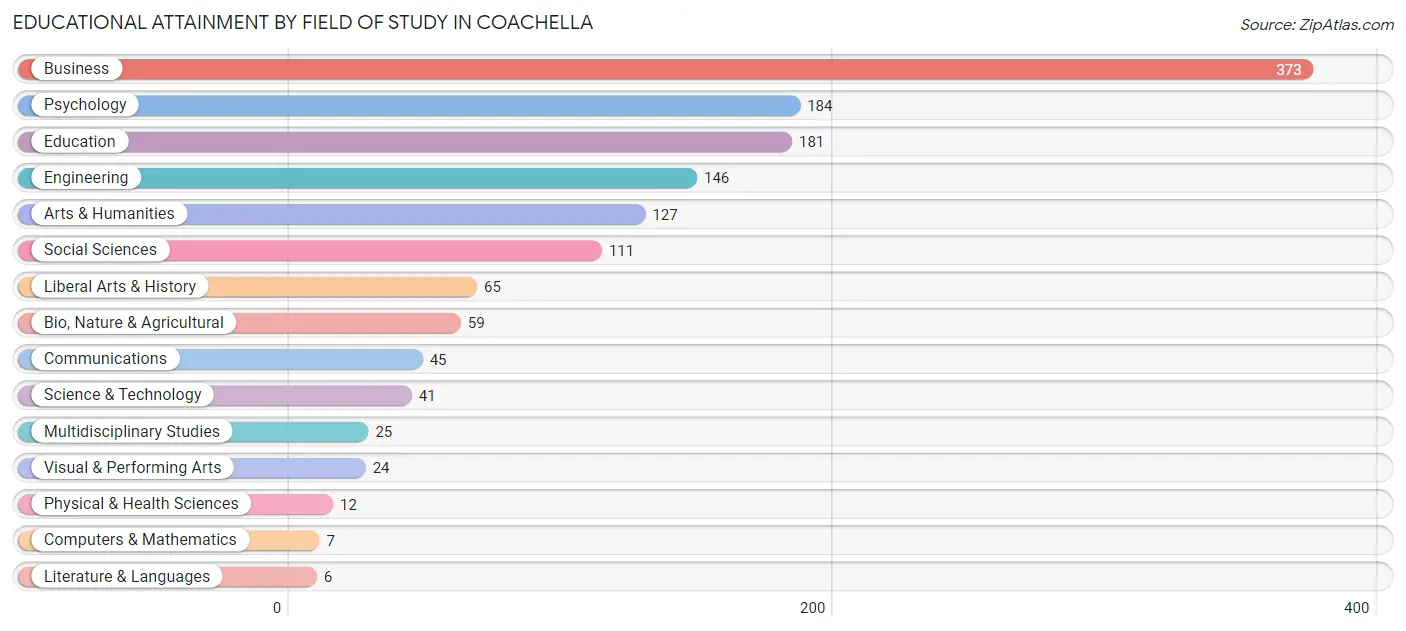
| Field of Study | # Graduates | % Graduates |
| Computers & Mathematics | 7 | 0.5% |
| Bio, Nature & Agricultural | 59 | 4.2% |
| Physical & Health Sciences | 12 | 0.9% |
| Psychology | 184 | 13.1% |
| Social Sciences | 111 | 7.9% |
| Engineering | 146 | 10.4% |
| Multidisciplinary Studies | 25 | 1.8% |
| Science & Technology | 41 | 2.9% |
| Business | 373 | 26.5% |
| Education | 181 | 12.9% |
| Literature & Languages | 6 | 0.4% |
| Liberal Arts & History | 65 | 4.6% |
| Visual & Performing Arts | 24 | 1.7% |
| Communications | 45 | 3.2% |
| Arts & Humanities | 127 | 9.0% |
| Total | 1,406 | 100.0% |
Transportation & Commute in Coachella
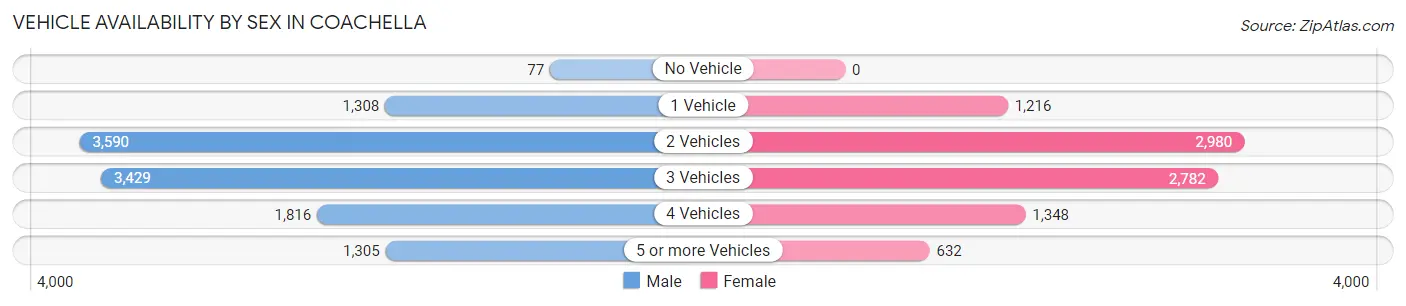
Vehicle Availability by Sex in Coachella
The most prevalent vehicle ownership categories in Coachella are males with 2 vehicles (3,590, accounting for 31.1%) and females with 2 vehicles (2,980, making up 40.1%).
| Vehicles Available | Male | Female |
| No Vehicle | 77 (0.7%) | 0 (0.0%) |
| 1 Vehicle | 1,308 (11.4%) | 1,216 (13.6%) |
| 2 Vehicles | 3,590 (31.1%) | 2,980 (33.3%) |
| 3 Vehicles | 3,429 (29.7%) | 2,782 (31.1%) |
| 4 Vehicles | 1,816 (15.8%) | 1,348 (15.0%) |
| 5 or more Vehicles | 1,305 (11.3%) | 632 (7.1%) |
| Total | 11,525 (100.0%) | 8,958 (100.0%) |
Commute Time in Coachella
The most frequently occuring commute durations in Coachella are 20 to 24 minutes (4,425 commuters, 22.0%), 30 to 34 minutes (3,415 commuters, 17.0%), and 10 to 14 minutes (3,345 commuters, 16.6%).
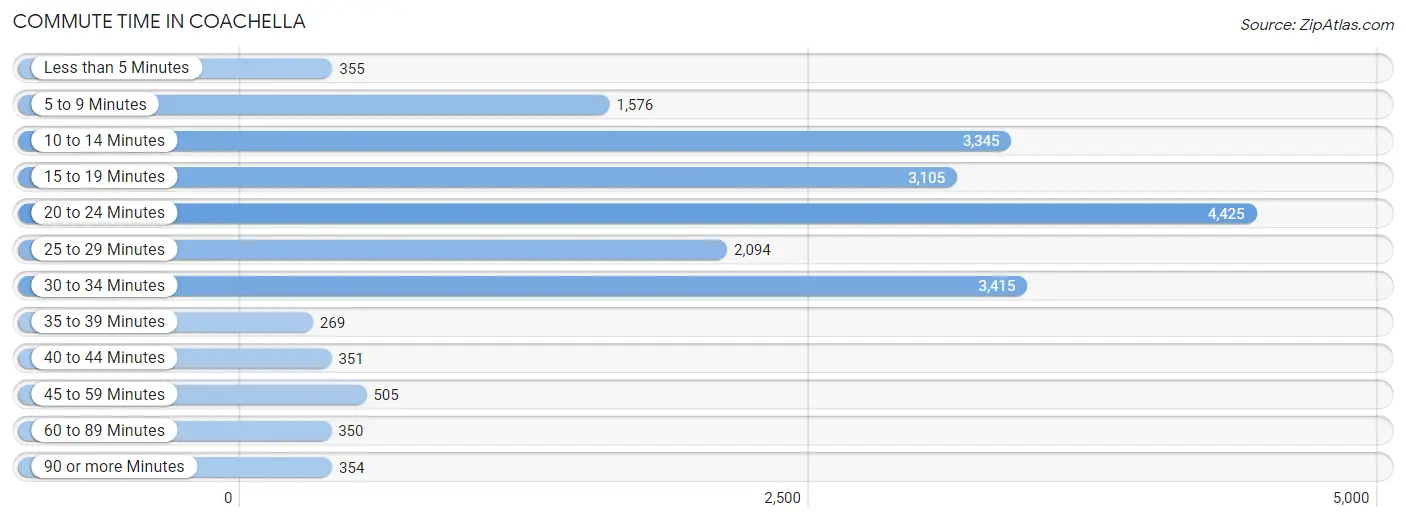
| Commute Time | # Commuters | % Commuters |
| Less than 5 Minutes | 355 | 1.8% |
| 5 to 9 Minutes | 1,576 | 7.8% |
| 10 to 14 Minutes | 3,345 | 16.6% |
| 15 to 19 Minutes | 3,105 | 15.4% |
| 20 to 24 Minutes | 4,425 | 22.0% |
| 25 to 29 Minutes | 2,094 | 10.4% |
| 30 to 34 Minutes | 3,415 | 17.0% |
| 35 to 39 Minutes | 269 | 1.3% |
| 40 to 44 Minutes | 351 | 1.7% |
| 45 to 59 Minutes | 505 | 2.5% |
| 60 to 89 Minutes | 350 | 1.7% |
| 90 or more Minutes | 354 | 1.8% |
Commute Time by Sex in Coachella
The most common commute times in Coachella are 20 to 24 minutes (2,898 commuters, 25.3%) for males and 15 to 19 minutes (1,938 commuters, 22.3%) for females.
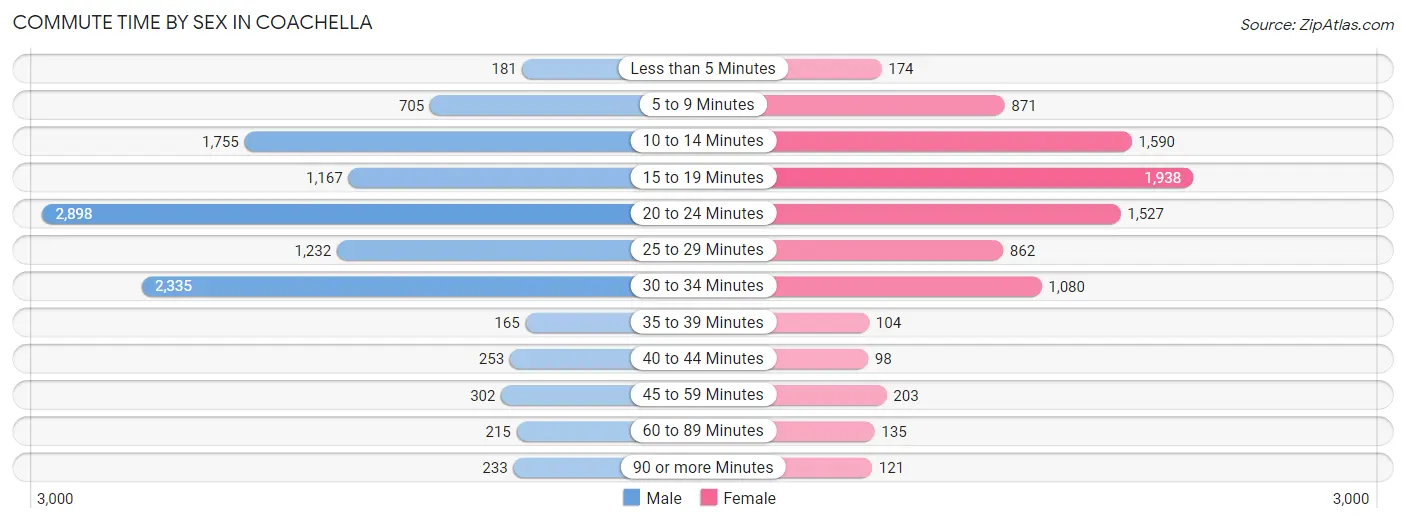
| Commute Time | Male | Female |
| Less than 5 Minutes | 181 (1.6%) | 174 (2.0%) |
| 5 to 9 Minutes | 705 (6.2%) | 871 (10.0%) |
| 10 to 14 Minutes | 1,755 (15.3%) | 1,590 (18.3%) |
| 15 to 19 Minutes | 1,167 (10.2%) | 1,938 (22.3%) |
| 20 to 24 Minutes | 2,898 (25.3%) | 1,527 (17.5%) |
| 25 to 29 Minutes | 1,232 (10.8%) | 862 (9.9%) |
| 30 to 34 Minutes | 2,335 (20.4%) | 1,080 (12.4%) |
| 35 to 39 Minutes | 165 (1.4%) | 104 (1.2%) |
| 40 to 44 Minutes | 253 (2.2%) | 98 (1.1%) |
| 45 to 59 Minutes | 302 (2.6%) | 203 (2.3%) |
| 60 to 89 Minutes | 215 (1.9%) | 135 (1.5%) |
| 90 or more Minutes | 233 (2.0%) | 121 (1.4%) |
Time of Departure to Work by Sex in Coachella
The most frequent times of departure to work in Coachella are 5:30 AM to 5:59 AM (1,803, 15.8%) for males and 7:00 AM to 7:29 AM (1,519, 17.4%) for females.
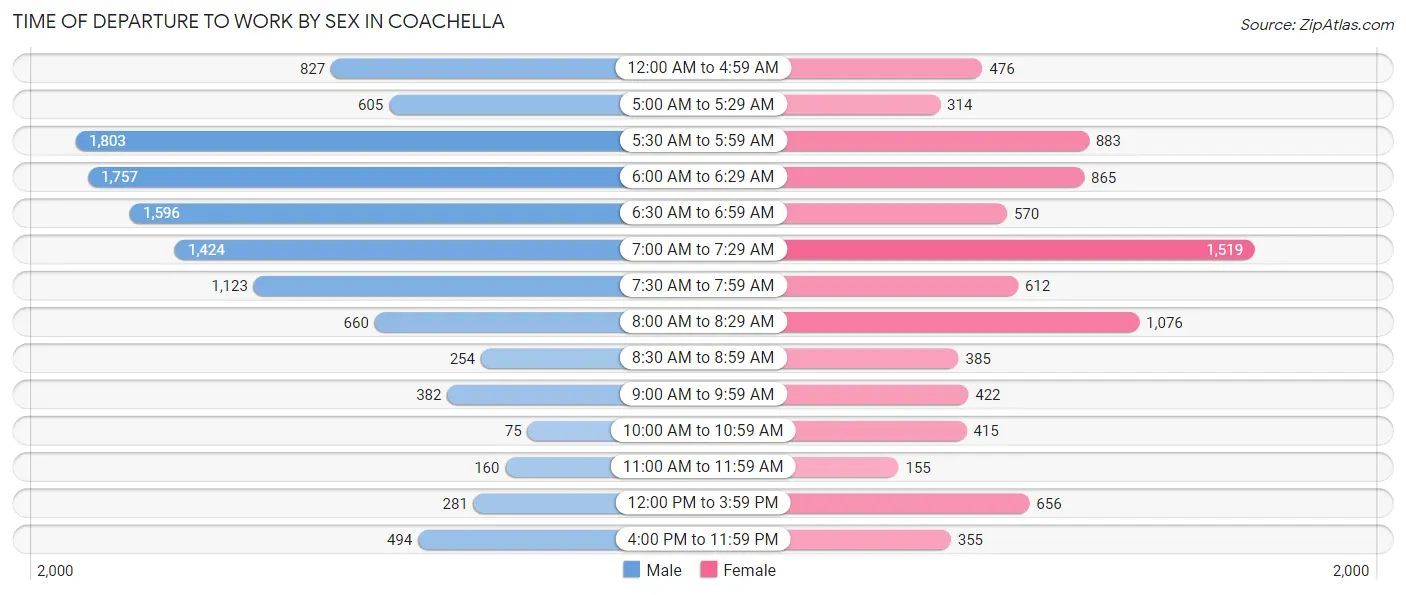
| Time of Departure | Male | Female |
| 12:00 AM to 4:59 AM | 827 (7.2%) | 476 (5.5%) |
| 5:00 AM to 5:29 AM | 605 (5.3%) | 314 (3.6%) |
| 5:30 AM to 5:59 AM | 1,803 (15.8%) | 883 (10.2%) |
| 6:00 AM to 6:29 AM | 1,757 (15.4%) | 865 (9.9%) |
| 6:30 AM to 6:59 AM | 1,596 (14.0%) | 570 (6.6%) |
| 7:00 AM to 7:29 AM | 1,424 (12.4%) | 1,519 (17.4%) |
| 7:30 AM to 7:59 AM | 1,123 (9.8%) | 612 (7.0%) |
| 8:00 AM to 8:29 AM | 660 (5.8%) | 1,076 (12.4%) |
| 8:30 AM to 8:59 AM | 254 (2.2%) | 385 (4.4%) |
| 9:00 AM to 9:59 AM | 382 (3.3%) | 422 (4.9%) |
| 10:00 AM to 10:59 AM | 75 (0.7%) | 415 (4.8%) |
| 11:00 AM to 11:59 AM | 160 (1.4%) | 155 (1.8%) |
| 12:00 PM to 3:59 PM | 281 (2.5%) | 656 (7.5%) |
| 4:00 PM to 11:59 PM | 494 (4.3%) | 355 (4.1%) |
| Total | 11,441 (100.0%) | 8,703 (100.0%) |
Housing Occupancy in Coachella
Occupancy by Ownership in Coachella
Of the total 13,942 dwellings in Coachella, owner-occupied units account for 9,470 (67.9%), while renter-occupied units make up 4,472 (32.1%).
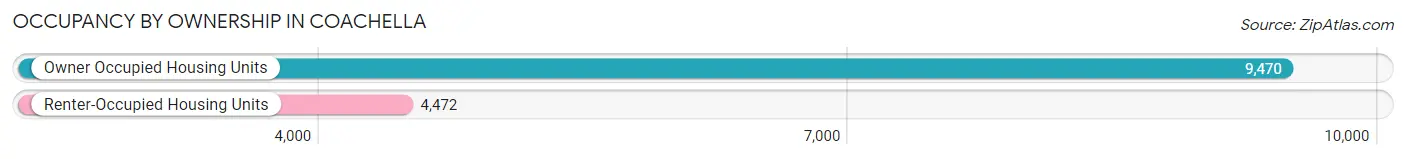
| Occupancy | # Housing Units | % Housing Units |
| Owner Occupied Housing Units | 9,470 | 67.9% |
| Renter-Occupied Housing Units | 4,472 | 32.1% |
| Total Occupied Housing Units | 13,942 | 100.0% |
Occupancy by Household Size in Coachella
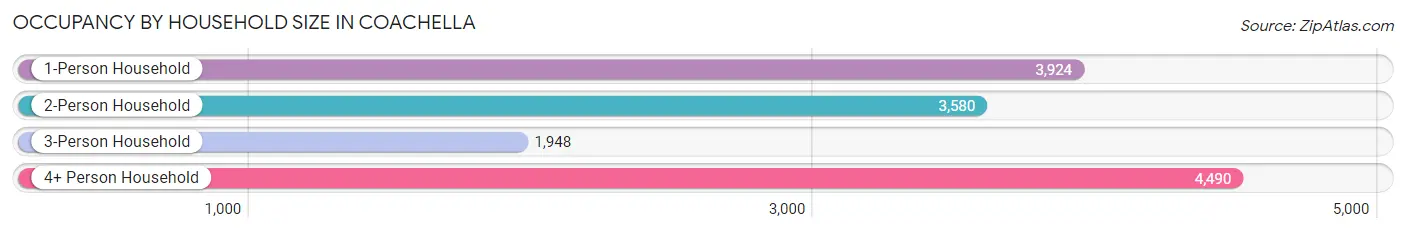
| Household Size | # Housing Units | % Housing Units |
| 1-Person Household | 3,924 | 28.1% |
| 2-Person Household | 3,580 | 25.7% |
| 3-Person Household | 1,948 | 14.0% |
| 4+ Person Household | 4,490 | 32.2% |
| Total Housing Units | 13,942 | 100.0% |
Occupancy by Ownership by Household Size in Coachella

| Household Size | Owner-occupied | Renter-occupied |
| 1-Person Household | 2,181 (55.6%) | 1,743 (44.4%) |
| 2-Person Household | 2,911 (81.3%) | 669 (18.7%) |
| 3-Person Household | 1,231 (63.2%) | 717 (36.8%) |
| 4+ Person Household | 3,147 (70.1%) | 1,343 (29.9%) |
| Total Housing Units | 9,470 (67.9%) | 4,472 (32.1%) |
Occupancy by Educational Attainment in Coachella
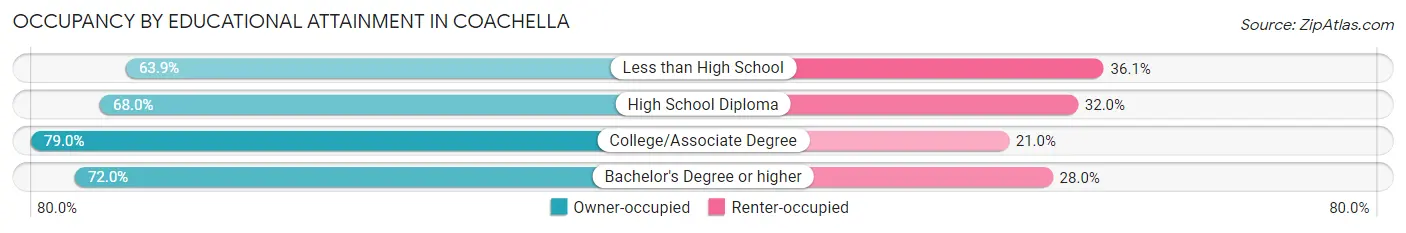
| Household Size | Owner-occupied | Renter-occupied |
| Less than High School | 3,652 (63.9%) | 2,061 (36.1%) |
| High School Diploma | 3,977 (68.0%) | 1,871 (32.0%) |
| College/Associate Degree | 1,437 (79.0%) | 383 (21.0%) |
| Bachelor's Degree or higher | 404 (72.0%) | 157 (28.0%) |
Occupancy by Age of Householder in Coachella
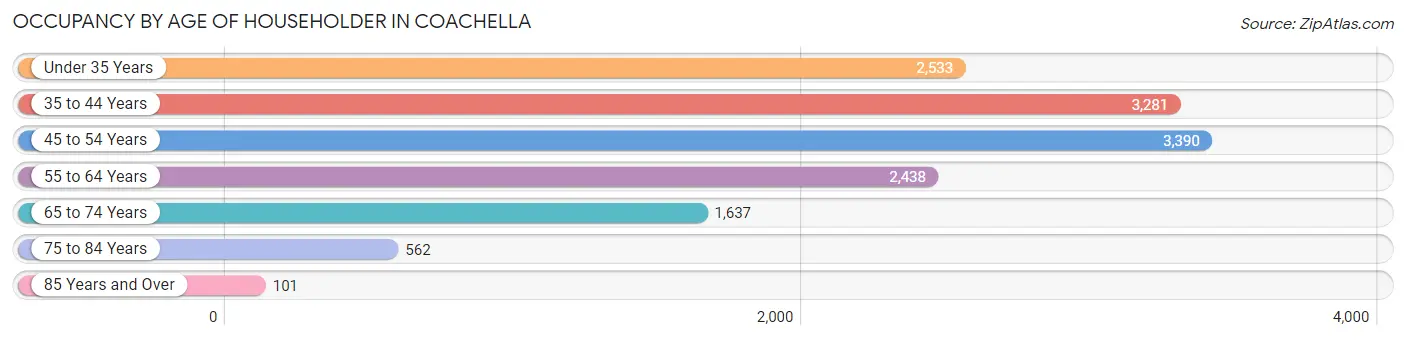
| Age Bracket | # Households | % Households |
| Under 35 Years | 2,533 | 18.2% |
| 35 to 44 Years | 3,281 | 23.5% |
| 45 to 54 Years | 3,390 | 24.3% |
| 55 to 64 Years | 2,438 | 17.5% |
| 65 to 74 Years | 1,637 | 11.7% |
| 75 to 84 Years | 562 | 4.0% |
| 85 Years and Over | 101 | 0.7% |
| Total | 13,942 | 100.0% |
Housing Finances in Coachella
Median Income by Occupancy in Coachella
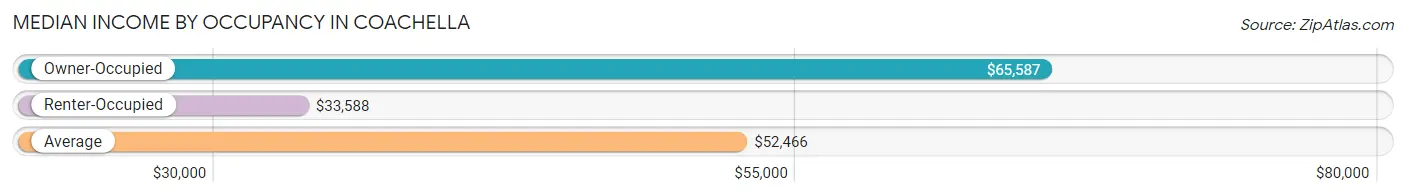
| Occupancy Type | # Households | Median Income |
| Owner-Occupied | 9,470 (67.9%) | $65,587 |
| Renter-Occupied | 4,472 (32.1%) | $33,588 |
| Average | 13,942 (100.0%) | $52,466 |
Occupancy by Householder Income Bracket in Coachella
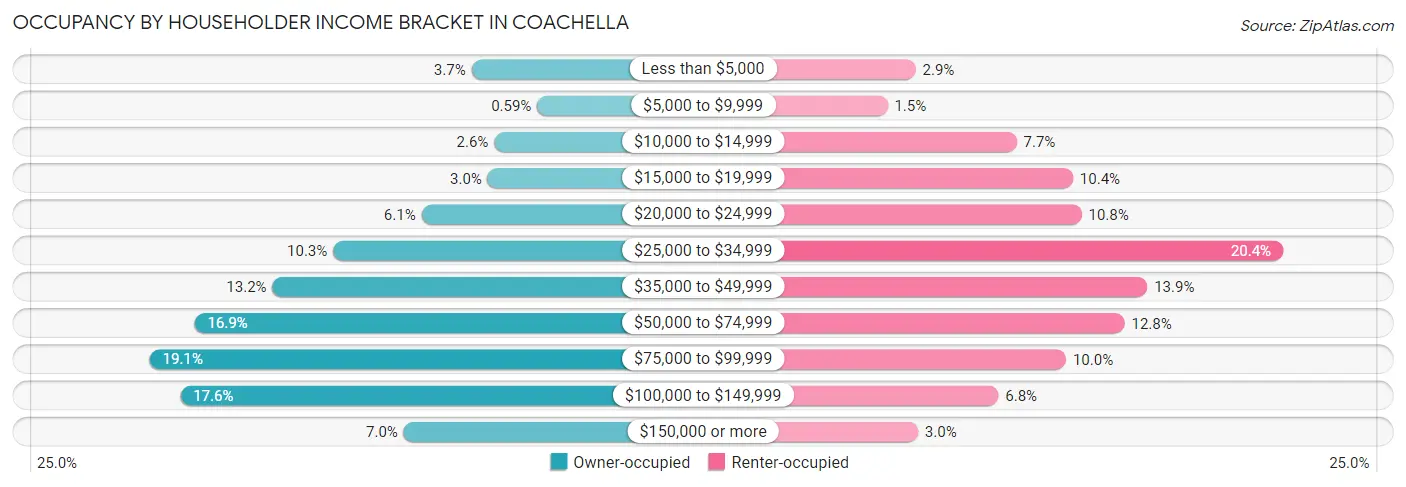
| Income Bracket | Owner-occupied | Renter-occupied |
| Less than $5,000 | 352 (3.7%) | 128 (2.9%) |
| $5,000 to $9,999 | 56 (0.6%) | 68 (1.5%) |
| $10,000 to $14,999 | 250 (2.6%) | 343 (7.7%) |
| $15,000 to $19,999 | 279 (2.9%) | 463 (10.3%) |
| $20,000 to $24,999 | 578 (6.1%) | 481 (10.8%) |
| $25,000 to $34,999 | 976 (10.3%) | 910 (20.3%) |
| $35,000 to $49,999 | 1,250 (13.2%) | 621 (13.9%) |
| $50,000 to $74,999 | 1,601 (16.9%) | 573 (12.8%) |
| $75,000 to $99,999 | 1,804 (19.1%) | 448 (10.0%) |
| $100,000 to $149,999 | 1,666 (17.6%) | 304 (6.8%) |
| $150,000 or more | 658 (7.0%) | 133 (3.0%) |
| Total | 9,470 (100.0%) | 4,472 (100.0%) |
Monthly Housing Cost Tiers in Coachella
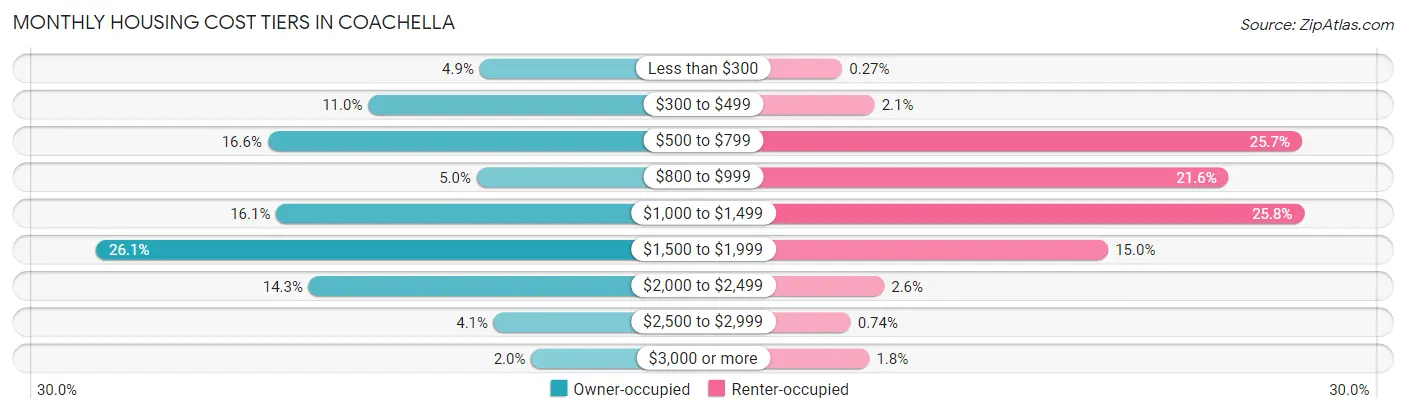
| Monthly Cost | Owner-occupied | Renter-occupied |
| Less than $300 | 460 (4.9%) | 12 (0.3%) |
| $300 to $499 | 1,044 (11.0%) | 92 (2.1%) |
| $500 to $799 | 1,569 (16.6%) | 1,147 (25.7%) |
| $800 to $999 | 475 (5.0%) | 966 (21.6%) |
| $1,000 to $1,499 | 1,525 (16.1%) | 1,153 (25.8%) |
| $1,500 to $1,999 | 2,467 (26.1%) | 669 (15.0%) |
| $2,000 to $2,499 | 1,354 (14.3%) | 116 (2.6%) |
| $2,500 to $2,999 | 386 (4.1%) | 33 (0.7%) |
| $3,000 or more | 190 (2.0%) | 79 (1.8%) |
| Total | 9,470 (100.0%) | 4,472 (100.0%) |
Physical Housing Characteristics in Coachella
Housing Structures in Coachella
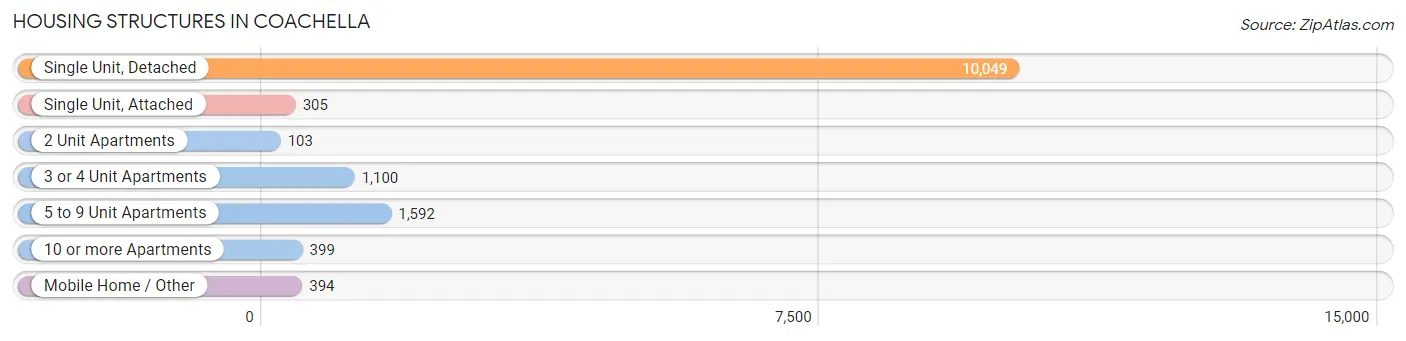
| Structure Type | # Housing Units | % Housing Units |
| Single Unit, Detached | 10,049 | 72.1% |
| Single Unit, Attached | 305 | 2.2% |
| 2 Unit Apartments | 103 | 0.7% |
| 3 or 4 Unit Apartments | 1,100 | 7.9% |
| 5 to 9 Unit Apartments | 1,592 | 11.4% |
| 10 or more Apartments | 399 | 2.9% |
| Mobile Home / Other | 394 | 2.8% |
| Total | 13,942 | 100.0% |
Housing Structures by Occupancy in Coachella
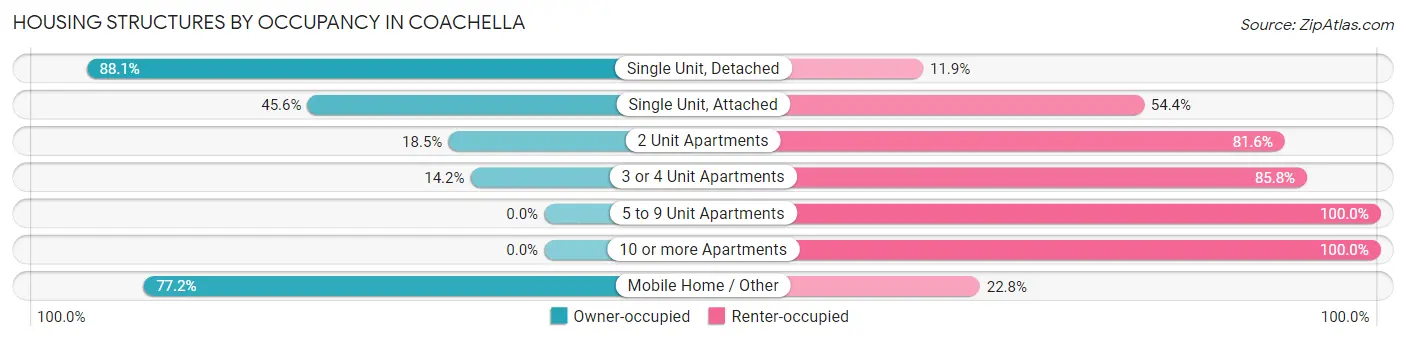
| Structure Type | Owner-occupied | Renter-occupied |
| Single Unit, Detached | 8,852 (88.1%) | 1,197 (11.9%) |
| Single Unit, Attached | 139 (45.6%) | 166 (54.4%) |
| 2 Unit Apartments | 19 (18.4%) | 84 (81.6%) |
| 3 or 4 Unit Apartments | 156 (14.2%) | 944 (85.8%) |
| 5 to 9 Unit Apartments | 0 (0.0%) | 1,592 (100.0%) |
| 10 or more Apartments | 0 (0.0%) | 399 (100.0%) |
| Mobile Home / Other | 304 (77.2%) | 90 (22.8%) |
| Total | 9,470 (67.9%) | 4,472 (32.1%) |
Housing Structures by Number of Rooms in Coachella
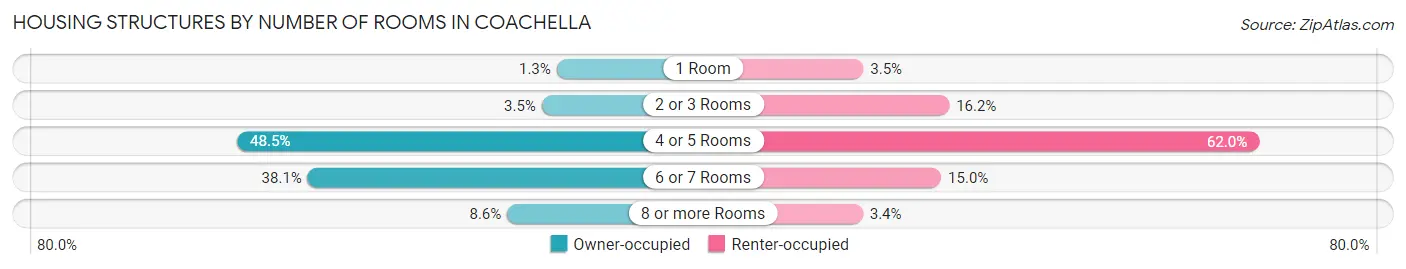
| Number of Rooms | Owner-occupied | Renter-occupied |
| 1 Room | 120 (1.3%) | 155 (3.5%) |
| 2 or 3 Rooms | 330 (3.5%) | 723 (16.2%) |
| 4 or 5 Rooms | 4,597 (48.5%) | 2,773 (62.0%) |
| 6 or 7 Rooms | 3,609 (38.1%) | 670 (15.0%) |
| 8 or more Rooms | 814 (8.6%) | 151 (3.4%) |
| Total | 9,470 (100.0%) | 4,472 (100.0%) |
Housing Structure by Heating Type in Coachella
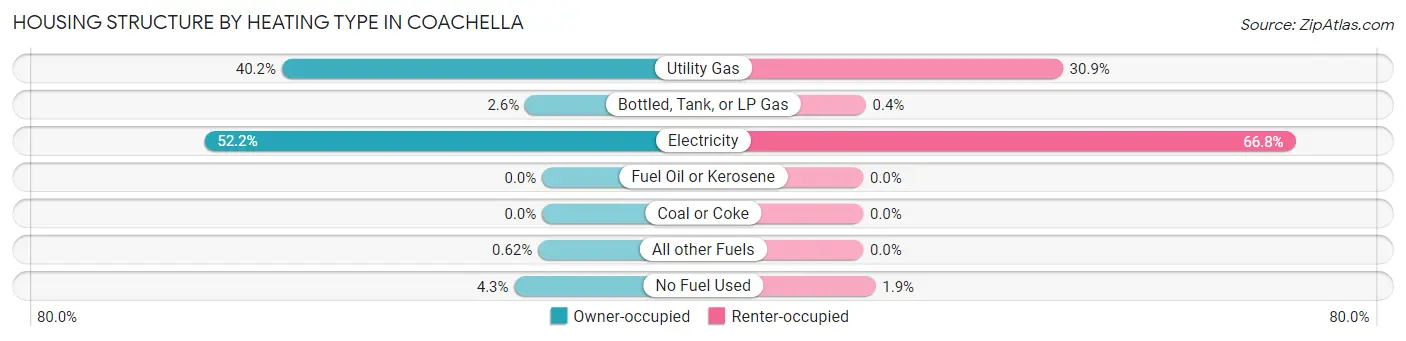
| Heating Type | Owner-occupied | Renter-occupied |
| Utility Gas | 3,811 (40.2%) | 1,380 (30.9%) |
| Bottled, Tank, or LP Gas | 249 (2.6%) | 18 (0.4%) |
| Electricity | 4,945 (52.2%) | 2,989 (66.8%) |
| Fuel Oil or Kerosene | 0 (0.0%) | 0 (0.0%) |
| Coal or Coke | 0 (0.0%) | 0 (0.0%) |
| All other Fuels | 59 (0.6%) | 0 (0.0%) |
| No Fuel Used | 406 (4.3%) | 85 (1.9%) |
| Total | 9,470 (100.0%) | 4,472 (100.0%) |
Household Vehicle Usage in Coachella
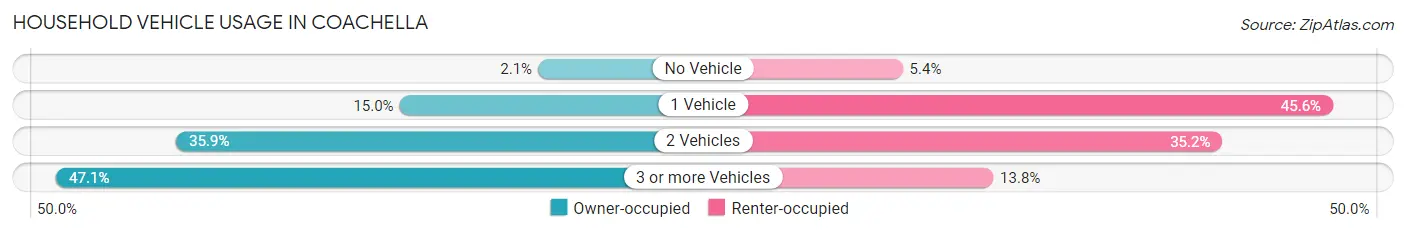
| Vehicles per Household | Owner-occupied | Renter-occupied |
| No Vehicle | 197 (2.1%) | 241 (5.4%) |
| 1 Vehicle | 1,421 (15.0%) | 2,037 (45.6%) |
| 2 Vehicles | 3,396 (35.9%) | 1,575 (35.2%) |
| 3 or more Vehicles | 4,456 (47.0%) | 619 (13.8%) |
| Total | 9,470 (100.0%) | 4,472 (100.0%) |
Real Estate & Mortgages in Coachella
Real Estate and Mortgage Overview in Coachella
| Characteristic | Without Mortgage | With Mortgage |
| Housing Units | 3,557 | 5,913 |
| Median Property Value | $245,300 | $334,800 |
| Median Household Income | $48,431 | $442 |
| Monthly Housing Costs | $544 | $190 |
| Real Estate Taxes | $2,475 | $58 |
Property Value by Mortgage Status in Coachella
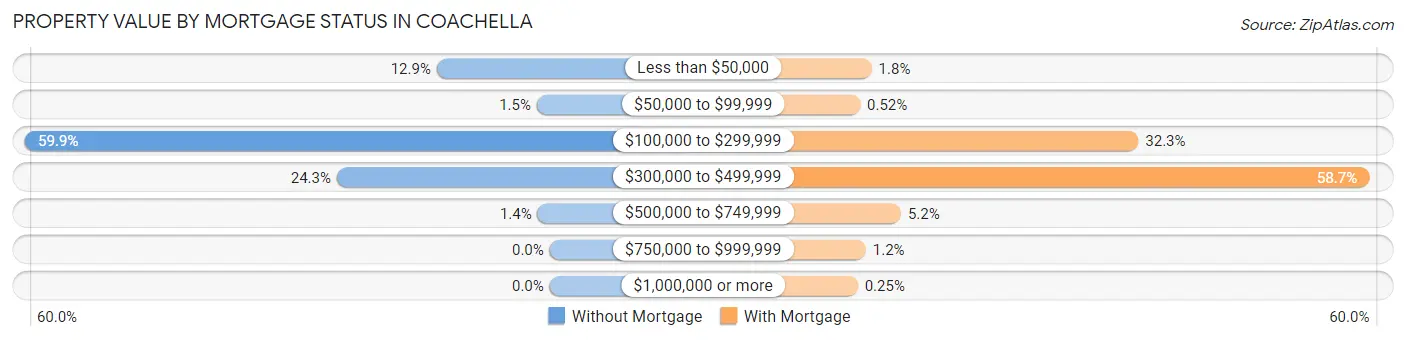
| Property Value | Without Mortgage | With Mortgage |
| Less than $50,000 | 459 (12.9%) | 109 (1.8%) |
| $50,000 to $99,999 | 52 (1.5%) | 31 (0.5%) |
| $100,000 to $299,999 | 2,132 (59.9%) | 1,911 (32.3%) |
| $300,000 to $499,999 | 865 (24.3%) | 3,470 (58.7%) |
| $500,000 to $749,999 | 49 (1.4%) | 307 (5.2%) |
| $750,000 to $999,999 | 0 (0.0%) | 70 (1.2%) |
| $1,000,000 or more | 0 (0.0%) | 15 (0.3%) |
| Total | 3,557 (100.0%) | 5,913 (100.0%) |
Household Income by Mortgage Status in Coachella
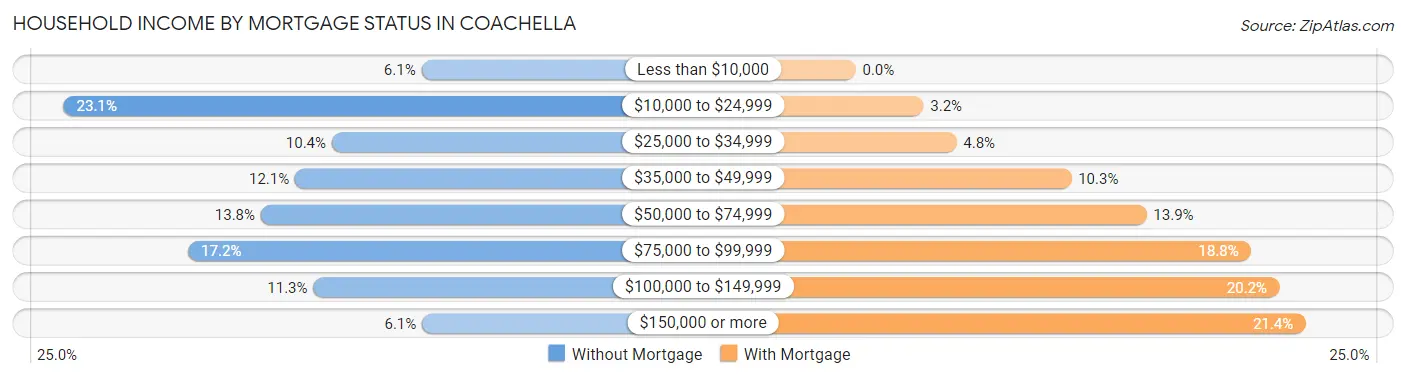
| Household Income | Without Mortgage | With Mortgage |
| Less than $10,000 | 217 (6.1%) | 0 (0.0%) |
| $10,000 to $24,999 | 823 (23.1%) | 191 (3.2%) |
| $25,000 to $34,999 | 369 (10.4%) | 284 (4.8%) |
| $35,000 to $49,999 | 431 (12.1%) | 607 (10.3%) |
| $50,000 to $74,999 | 489 (13.8%) | 819 (13.9%) |
| $75,000 to $99,999 | 612 (17.2%) | 1,112 (18.8%) |
| $100,000 to $149,999 | 400 (11.3%) | 1,192 (20.2%) |
| $150,000 or more | 216 (6.1%) | 1,266 (21.4%) |
| Total | 3,557 (100.0%) | 5,913 (100.0%) |
Property Value to Household Income Ratio in Coachella
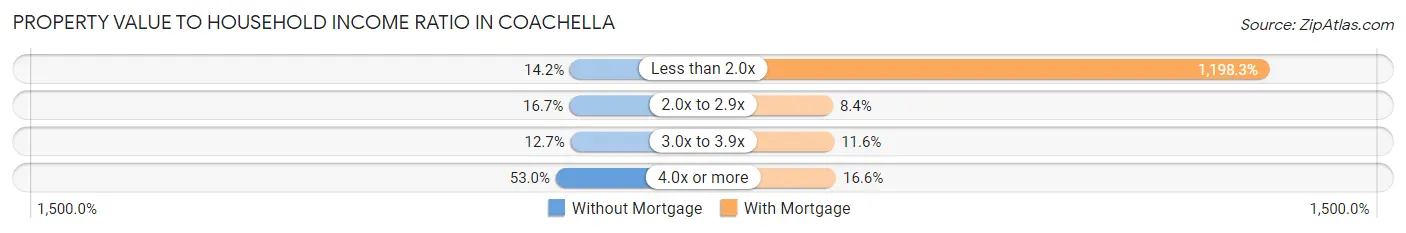
| Value-to-Income Ratio | Without Mortgage | With Mortgage |
| Less than 2.0x | 505 (14.2%) | 70,855 (1,198.3%) |
| 2.0x to 2.9x | 595 (16.7%) | 494 (8.4%) |
| 3.0x to 3.9x | 451 (12.7%) | 687 (11.6%) |
| 4.0x or more | 1,885 (53.0%) | 982 (16.6%) |
| Total | 3,557 (100.0%) | 5,913 (100.0%) |
Real Estate Taxes by Mortgage Status in Coachella
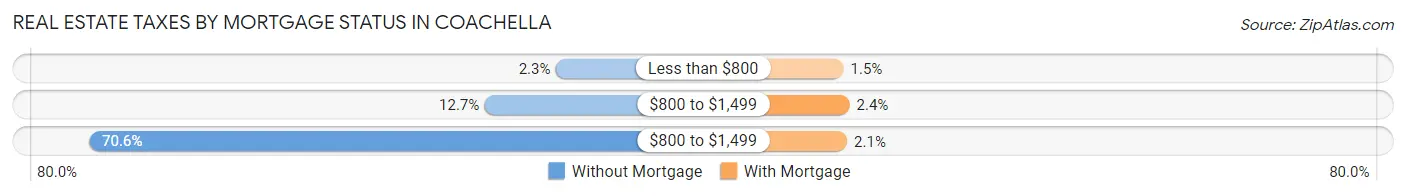
| Property Taxes | Without Mortgage | With Mortgage |
| Less than $800 | 82 (2.3%) | 91 (1.5%) |
| $800 to $1,499 | 452 (12.7%) | 143 (2.4%) |
| $800 to $1,499 | 2,510 (70.6%) | 122 (2.1%) |
| Total | 3,557 (100.0%) | 5,913 (100.0%) |
Health & Disability in Coachella
Health Insurance Coverage by Age in Coachella
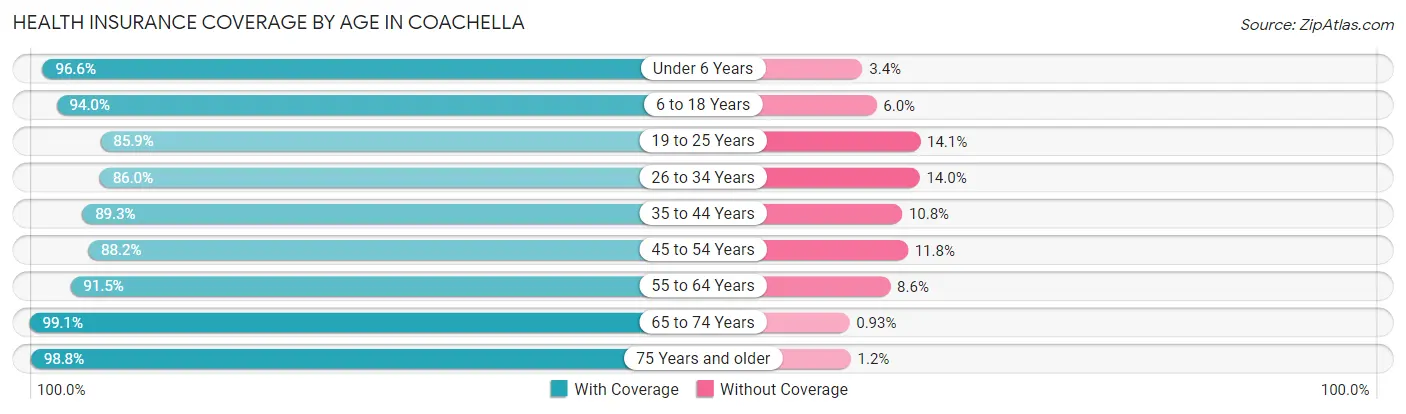
| Age Bracket | With Coverage | Without Coverage |
| Under 6 Years | 2,384 (96.6%) | 83 (3.4%) |
| 6 to 18 Years | 6,932 (94.0%) | 440 (6.0%) |
| 19 to 25 Years | 4,052 (85.9%) | 667 (14.1%) |
| 26 to 34 Years | 5,739 (86.0%) | 936 (14.0%) |
| 35 to 44 Years | 5,864 (89.2%) | 706 (10.7%) |
| 45 to 54 Years | 4,866 (88.2%) | 653 (11.8%) |
| 55 to 64 Years | 4,140 (91.4%) | 387 (8.6%) |
| 65 to 74 Years | 2,874 (99.1%) | 27 (0.9%) |
| 75 Years and older | 1,511 (98.8%) | 18 (1.2%) |
| Total | 38,362 (90.7%) | 3,917 (9.3%) |
Health Insurance Coverage by Citizenship Status in Coachella
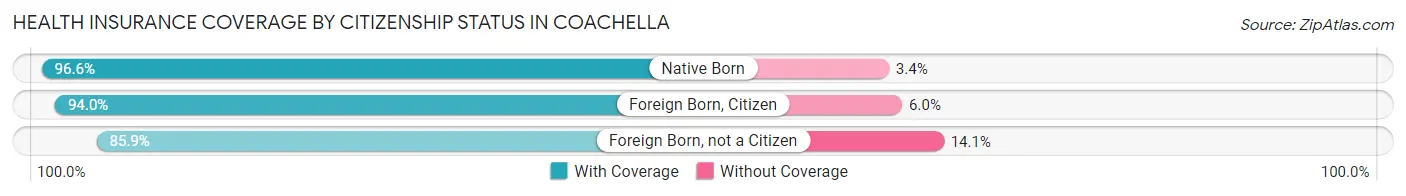
| Citizenship Status | With Coverage | Without Coverage |
| Native Born | 2,384 (96.6%) | 83 (3.4%) |
| Foreign Born, Citizen | 6,932 (94.0%) | 440 (6.0%) |
| Foreign Born, not a Citizen | 4,052 (85.9%) | 667 (14.1%) |
Health Insurance Coverage by Household Income in Coachella
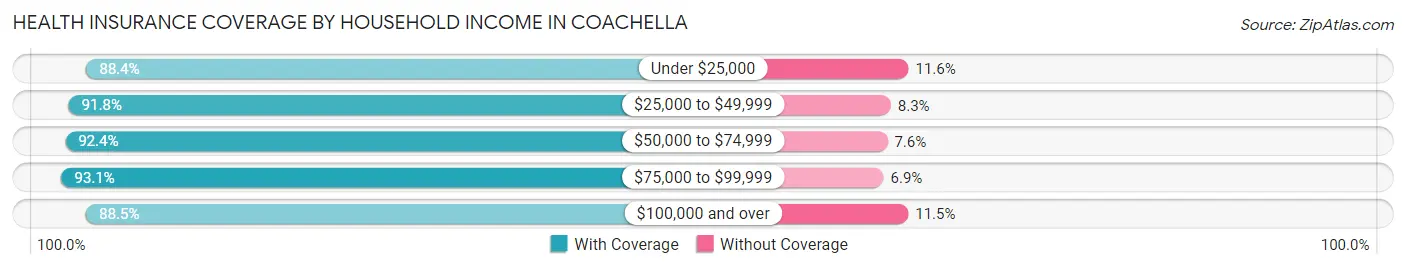
| Household Income | With Coverage | Without Coverage |
| Under $25,000 | 4,364 (88.4%) | 571 (11.6%) |
| $25,000 to $49,999 | 8,191 (91.7%) | 737 (8.3%) |
| $50,000 to $74,999 | 6,738 (92.4%) | 556 (7.6%) |
| $75,000 to $99,999 | 7,661 (93.1%) | 568 (6.9%) |
| $100,000 and over | 11,407 (88.5%) | 1,485 (11.5%) |
Public vs Private Health Insurance Coverage by Age in Coachella
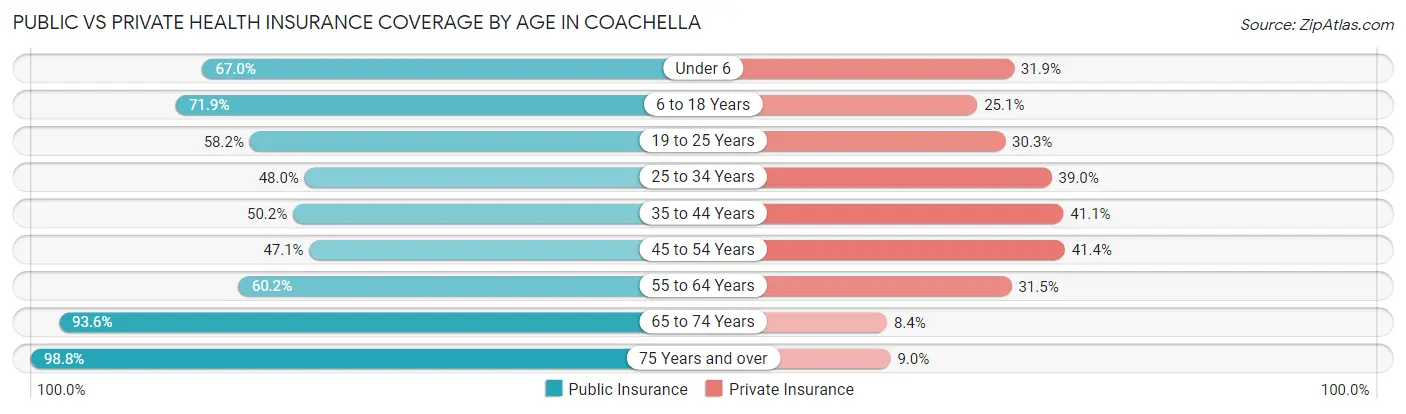
| Age Bracket | Public Insurance | Private Insurance |
| Under 6 | 1,652 (67.0%) | 788 (31.9%) |
| 6 to 18 Years | 5,300 (71.9%) | 1,853 (25.1%) |
| 19 to 25 Years | 2,747 (58.2%) | 1,431 (30.3%) |
| 25 to 34 Years | 3,205 (48.0%) | 2,600 (39.0%) |
| 35 to 44 Years | 3,297 (50.2%) | 2,702 (41.1%) |
| 45 to 54 Years | 2,601 (47.1%) | 2,284 (41.4%) |
| 55 to 64 Years | 2,727 (60.2%) | 1,426 (31.5%) |
| 65 to 74 Years | 2,715 (93.6%) | 243 (8.4%) |
| 75 Years and over | 1,511 (98.8%) | 138 (9.0%) |
| Total | 25,755 (60.9%) | 13,465 (31.9%) |
Disability Status by Sex by Age in Coachella
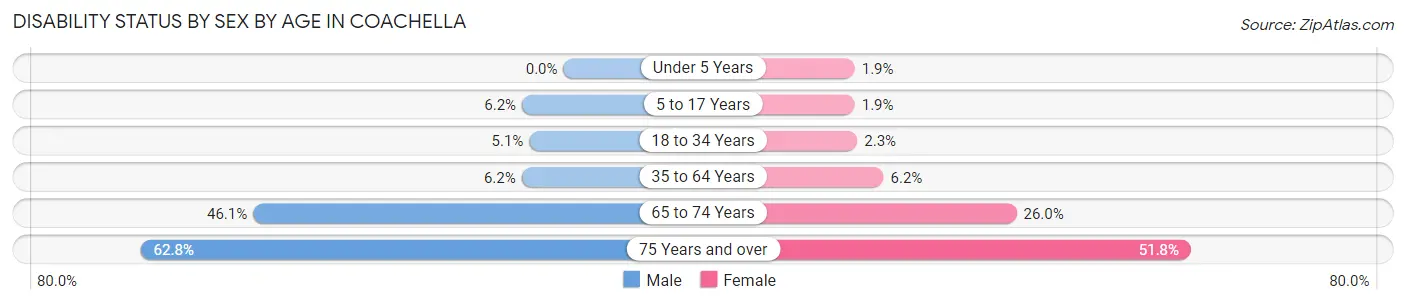
| Age Bracket | Male | Female |
| Under 5 Years | 0 (0.0%) | 17 (1.9%) |
| 5 to 17 Years | 242 (6.1%) | 65 (1.9%) |
| 18 to 34 Years | 303 (5.1%) | 137 (2.3%) |
| 35 to 64 Years | 509 (6.2%) | 523 (6.2%) |
| 65 to 74 Years | 582 (46.1%) | 425 (26.0%) |
| 75 Years and over | 583 (62.8%) | 311 (51.8%) |
Disability Class by Sex by Age in Coachella
Disability Class: Hearing Difficulty
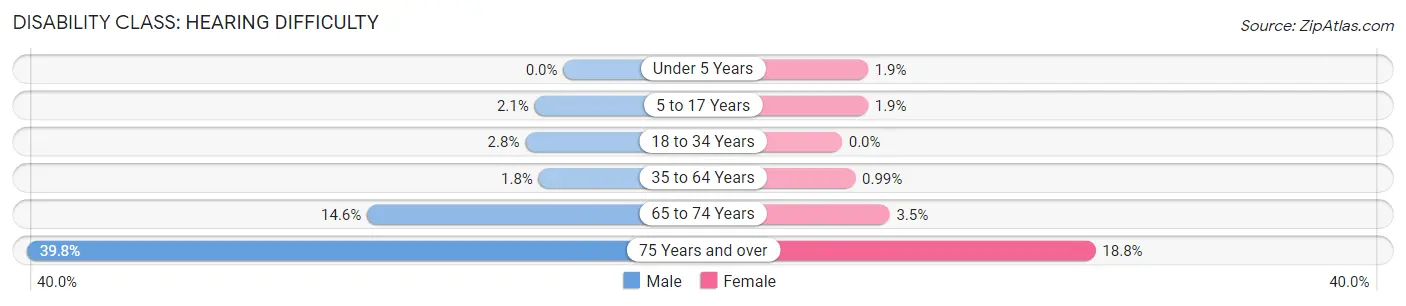
| Age Bracket | Male | Female |
| Under 5 Years | 0 (0.0%) | 17 (1.9%) |
| 5 to 17 Years | 84 (2.1%) | 65 (1.9%) |
| 18 to 34 Years | 169 (2.8%) | 0 (0.0%) |
| 35 to 64 Years | 150 (1.8%) | 83 (1.0%) |
| 65 to 74 Years | 184 (14.6%) | 58 (3.5%) |
| 75 Years and over | 370 (39.8%) | 113 (18.8%) |
Disability Class: Vision Difficulty
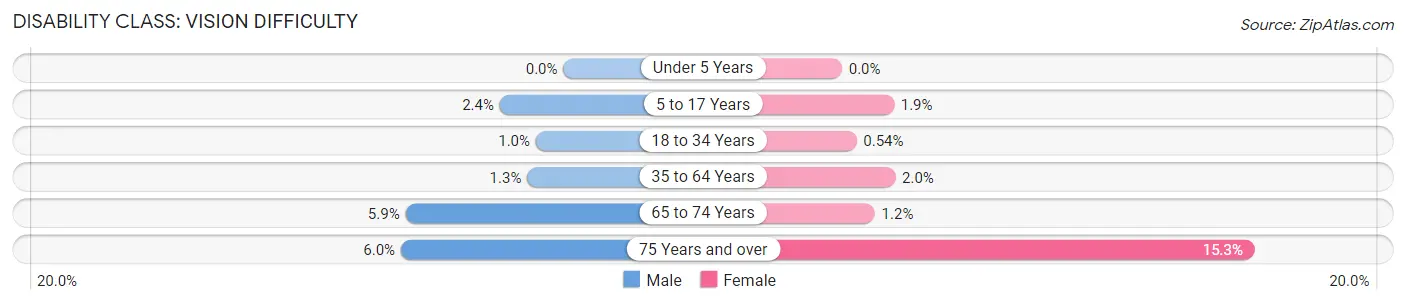
| Age Bracket | Male | Female |
| Under 5 Years | 0 (0.0%) | 0 (0.0%) |
| 5 to 17 Years | 93 (2.4%) | 65 (1.9%) |
| 18 to 34 Years | 61 (1.0%) | 32 (0.5%) |
| 35 to 64 Years | 110 (1.3%) | 167 (2.0%) |
| 65 to 74 Years | 74 (5.9%) | 20 (1.2%) |
| 75 Years and over | 56 (6.0%) | 92 (15.3%) |
Disability Class: Cognitive Difficulty
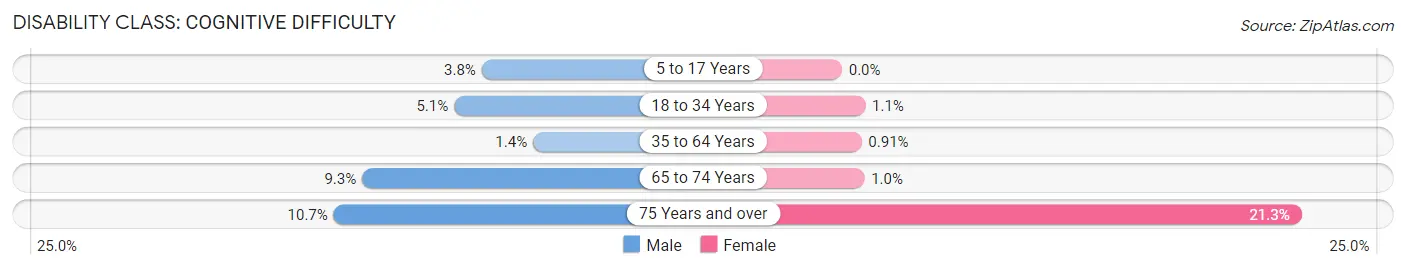
| Age Bracket | Male | Female |
| 5 to 17 Years | 149 (3.8%) | 0 (0.0%) |
| 18 to 34 Years | 303 (5.1%) | 64 (1.1%) |
| 35 to 64 Years | 116 (1.4%) | 77 (0.9%) |
| 65 to 74 Years | 118 (9.3%) | 17 (1.0%) |
| 75 Years and over | 99 (10.7%) | 128 (21.3%) |
Disability Class: Ambulatory Difficulty
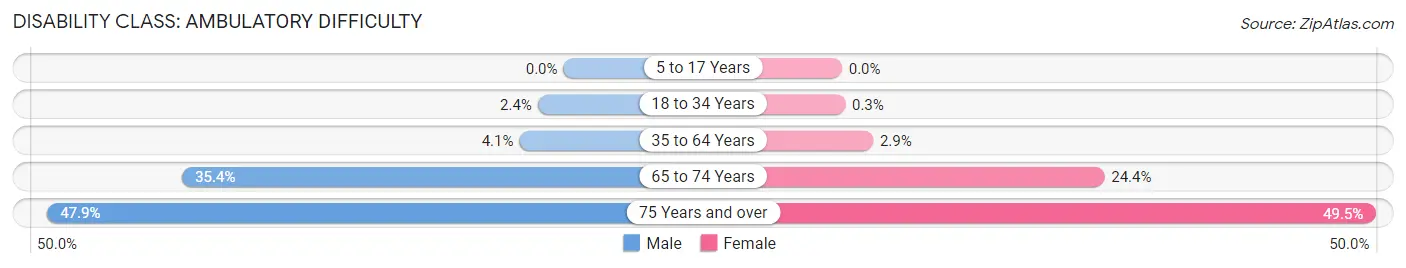
| Age Bracket | Male | Female |
| 5 to 17 Years | 0 (0.0%) | 0 (0.0%) |
| 18 to 34 Years | 142 (2.4%) | 18 (0.3%) |
| 35 to 64 Years | 335 (4.1%) | 243 (2.9%) |
| 65 to 74 Years | 447 (35.4%) | 399 (24.4%) |
| 75 Years and over | 445 (47.9%) | 297 (49.5%) |
Disability Class: Self-Care Difficulty
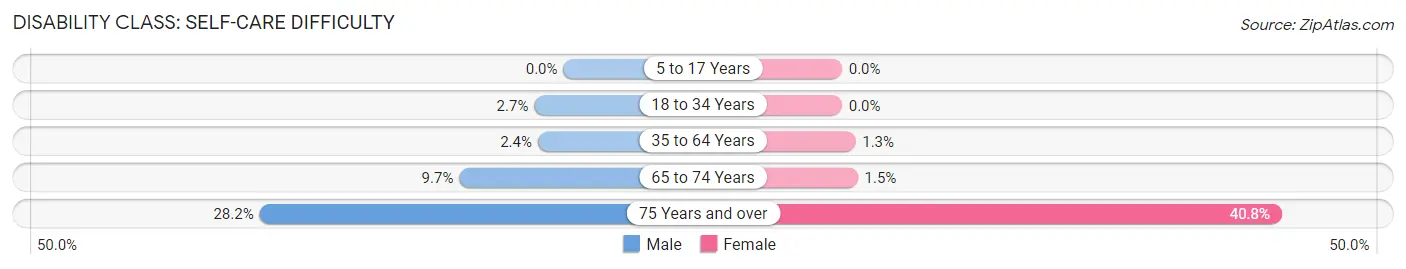
| Age Bracket | Male | Female |
| 5 to 17 Years | 0 (0.0%) | 0 (0.0%) |
| 18 to 34 Years | 161 (2.7%) | 0 (0.0%) |
| 35 to 64 Years | 194 (2.4%) | 105 (1.3%) |
| 65 to 74 Years | 122 (9.7%) | 24 (1.5%) |
| 75 Years and over | 262 (28.2%) | 245 (40.8%) |
Technology Access in Coachella
Computing Device Access in Coachella
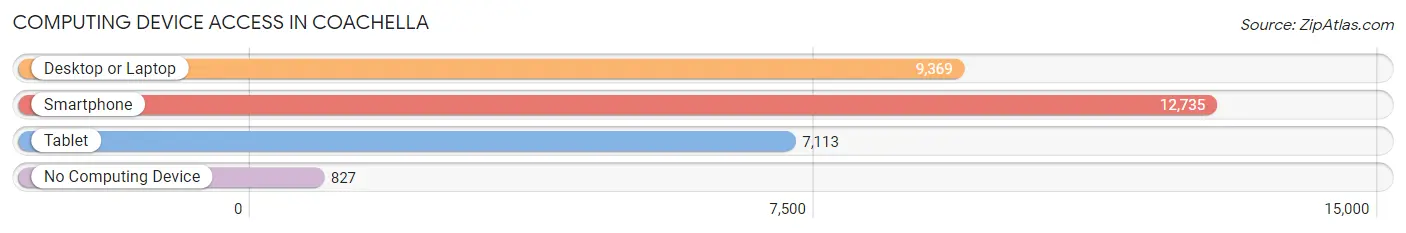
| Device Type | # Households | % Households |
| Desktop or Laptop | 9,369 | 67.2% |
| Smartphone | 12,735 | 91.3% |
| Tablet | 7,113 | 51.0% |
| No Computing Device | 827 | 5.9% |
| Total | 13,942 | 100.0% |
Internet Access in Coachella
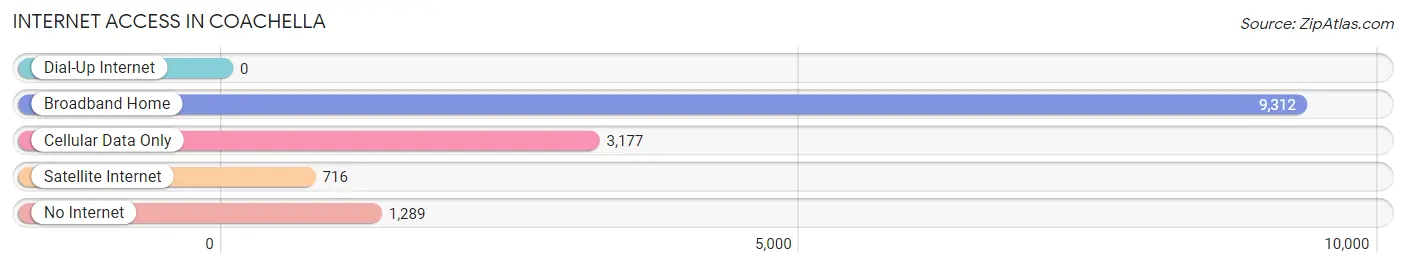
| Internet Type | # Households | % Households |
| Dial-Up Internet | 0 | 0.0% |
| Broadband Home | 9,312 | 66.8% |
| Cellular Data Only | 3,177 | 22.8% |
| Satellite Internet | 716 | 5.1% |
| No Internet | 1,289 | 9.2% |
| Total | 13,942 | 100.0% |
Coachella Summary
Coachella, California is a city located in Riverside County, California, United States. It is part of the Coachella Valley, a large metropolitan area in the desert region of Southern California. The city is located about 130 miles east of Los Angeles and about 30 miles east of Palm Springs. As of the 2010 census, the population of Coachella was 40,704, making it the largest city in the Coachella Valley.
Geography
Coachella is located at 33°40'N 116°10'W (33.6667, -116.1667). It is situated in the Coachella Valley, a large metropolitan area in the desert region of Southern California. The city is located about 130 miles east of Los Angeles and about 30 miles east of Palm Springs. The city is surrounded by the Santa Rosa Mountains to the north, the San Jacinto Mountains to the south, and the Chocolate Mountains to the east.
The city has a total area of 28.3 square miles, of which 28.2 square miles is land and 0.1 square miles is water. The elevation of Coachella is -76 feet.
Economy
Coachella is a major agricultural center in the Coachella Valley. The city is home to a variety of crops, including dates, citrus, vegetables, and melons. The city is also home to a number of manufacturing and distribution centers, including the Coachella Valley Distribution Center, which is the largest distribution center in the region.
The city is also home to a number of tourism-related businesses, including hotels, restaurants, and golf courses. The city is home to the Coachella Valley Music and Arts Festival, which is held annually in April and is one of the largest music festivals in the world.
Demographics
As of the 2010 census, the population of Coachella was 40,704, making it the largest city in the Coachella Valley. The population density was 1,433.3 people per square mile. The racial makeup of the city was 68.2% Hispanic or Latino, 25.2% White, 0.7% African American, 0.5% Native American, 0.3% Asian, 0.1% Pacific Islander, and 4.9% from other races.
The median household income in Coachella was $35,945, and the median family income was $41,945. The per capita income was $14,945. About 24.2% of the population was below the poverty line.
Conclusion
Coachella, California is a city located in Riverside County, California, United States. It is part of the Coachella Valley, a large metropolitan area in the desert region of Southern California. The city is located about 130 miles east of Los Angeles and about 30 miles east of Palm Springs. As of the 2010 census, the population of Coachella was 40,704, making it the largest city in the Coachella Valley. The city is a major agricultural center in the Coachella Valley and is home to a variety of crops, manufacturing and distribution centers, and tourism-related businesses. The racial makeup of the city was 68.2% Hispanic or Latino, 25.2% White, 0.7% African American, 0.5% Native American, 0.3% Asian, 0.1% Pacific Islander, and 4.9% from other races. The median household income in Coachella was $35,945, and the median family income was $41,945. The per capita income was $14,945. About 24.2% of the population was below the poverty line.
Common Questions
What is Per Capita Income in Coachella?
Per Capita income in Coachella is $23,962.
What is the Median Family Income in Coachella?
Median Family Income in Coachella is $69,573.
What is the Median Household income in Coachella?
Median Household Income in Coachella is $52,466.
What is Income or Wage Gap in Coachella?
Income or Wage Gap in Coachella is 22.6%.
Women in Coachella earn 77.4 cents for every dollar earned by a man.
What is Inequality or Gini Index in Coachella?
Inequality or Gini Index in Coachella is 0.42.
What is the Total Population of Coachella?
Total Population of Coachella is 42,279.
What is the Total Male Population of Coachella?
Total Male Population of Coachella is 21,435.
What is the Total Female Population of Coachella?
Total Female Population of Coachella is 20,844.
What is the Ratio of Males per 100 Females in Coachella?
There are 102.84 Males per 100 Females in Coachella.
What is the Ratio of Females per 100 Males in Coachella?
There are 97.24 Females per 100 Males in Coachella.
What is the Median Population Age in Coachella?
Median Population Age in Coachella is 34.9 Years.
What is the Average Family Size in Coachella
Average Family Size in Coachella is 3.8 People.
What is the Average Household Size in Coachella
Average Household Size in Coachella is 3.0 People.
How Large is the Labor Force in Coachella?
There are 23,601 People in the Labor Forcein in Coachella.
What is the Percentage of People in the Labor Force in Coachella?
69.0% of People are in the Labor Force in Coachella.
What is the Unemployment Rate in Coachella?
Unemployment Rate in Coachella is 11.9%.