Santa Ana, CA Map & Demographics
Santa Ana Map
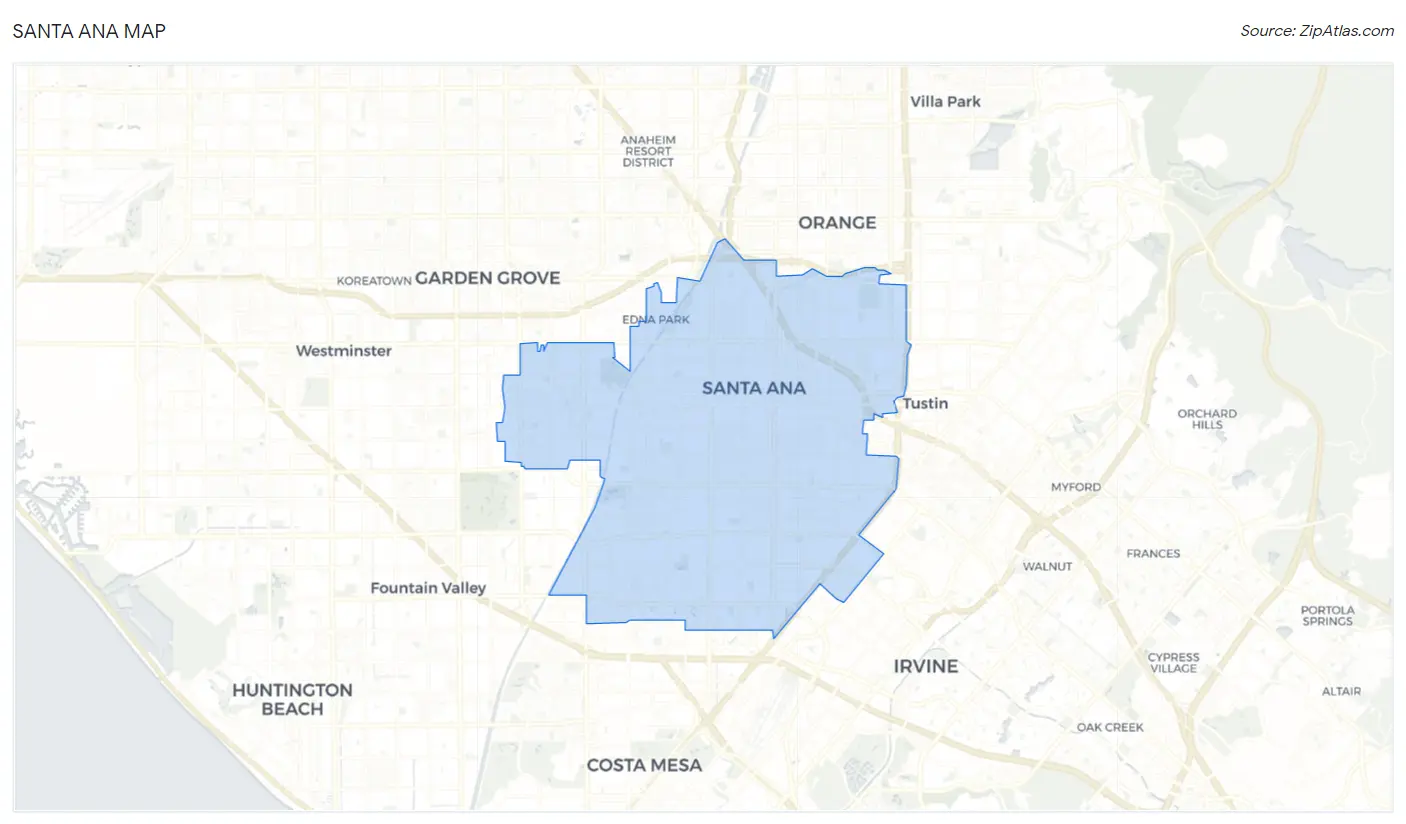
Santa Ana Overview
$27,328
PER CAPITA INCOME
$83,689
AVG FAMILY INCOME
$84,210
AVG HOUSEHOLD INCOME
20.4%
WAGE / INCOME GAP [ % ]
79.6¢/ $1
WAGE / INCOME GAP [ $ ]
$10,623
FAMILY INCOME DEFICIT
0.41
INEQUALITY / GINI INDEX
311,379
TOTAL POPULATION
160,488
MALE POPULATION
150,891
FEMALE POPULATION
106.36
MALES / 100 FEMALES
94.02
FEMALES / 100 MALES
33.4
MEDIAN AGE
4.3
AVG FAMILY SIZE
4.0
AVG HOUSEHOLD SIZE
164,094
LABOR FORCE [ PEOPLE ]
66.7%
PERCENT IN LABOR FORCE
5.5%
UNEMPLOYMENT RATE
Income in Santa Ana
Income Overview in Santa Ana
Per Capita Income in Santa Ana is $27,328, while median incomes of families and households are $83,689 and $84,210 respectively.
| Characteristic | Number | Measure |
| Per Capita Income | 311,379 | $27,328 |
| Median Family Income | 62,588 | $83,689 |
| Mean Family Income | 62,588 | $104,243 |
| Median Household Income | 77,553 | $84,210 |
| Mean Household Income | 77,553 | $104,106 |
| Income Deficit | 62,588 | $10,623 |
| Wage / Income Gap (%) | 311,379 | 20.37% |
| Wage / Income Gap ($) | 311,379 | 79.63¢ per $1 |
| Gini / Inequality Index | 311,379 | 0.41 |
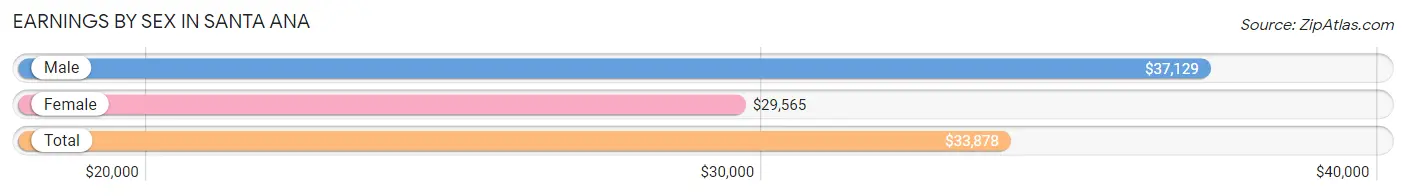
Earnings by Sex in Santa Ana
Average Earnings in Santa Ana are $33,878, $37,129 for men and $29,565 for women, a difference of 20.4%.
| Sex | Number | Average Earnings |
| Male | 93,939 (56.5%) | $37,129 |
| Female | 72,194 (43.5%) | $29,565 |
| Total | 166,133 (100.0%) | $33,878 |
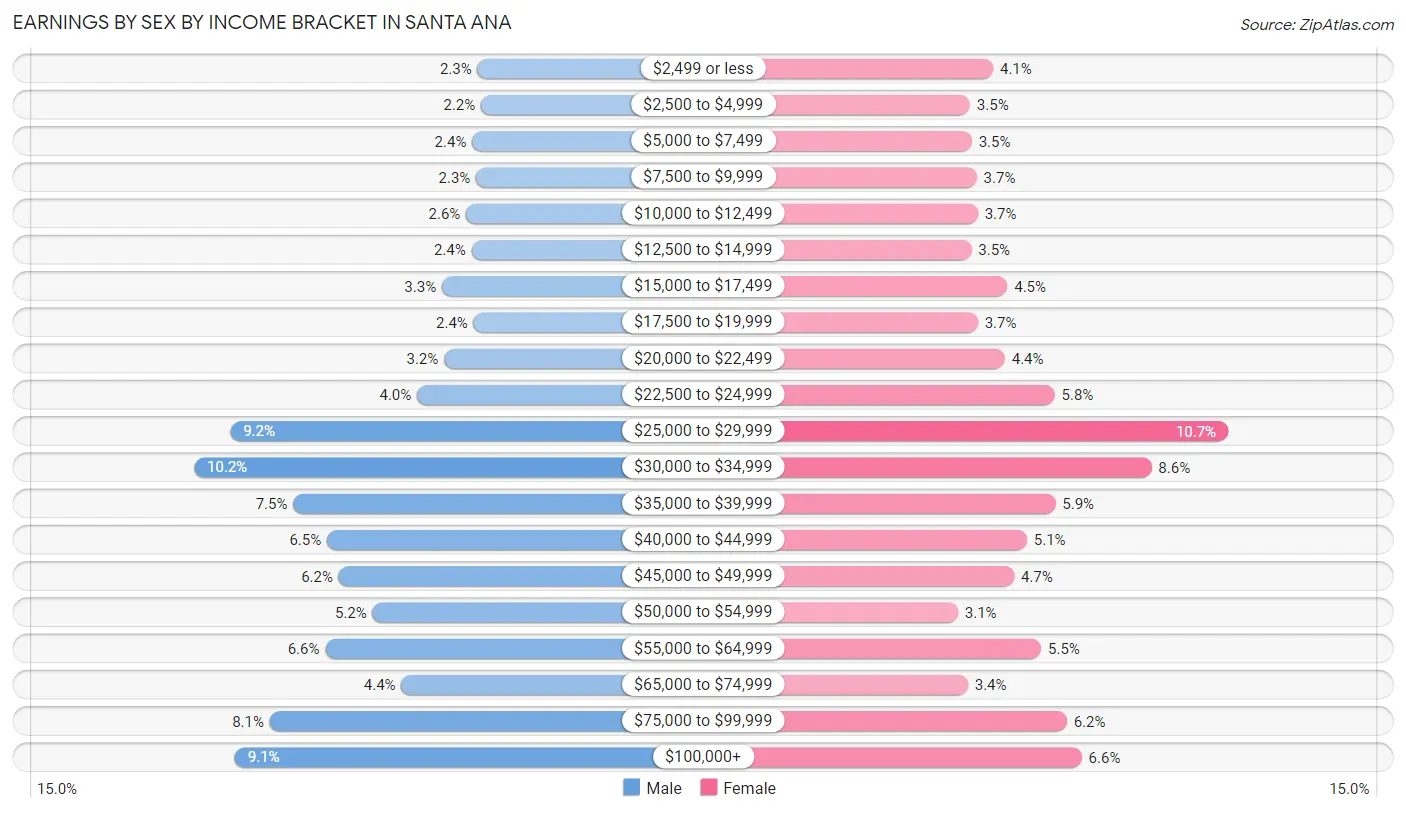
Earnings by Sex by Income Bracket in Santa Ana
The most common earnings brackets in Santa Ana are $30,000 to $34,999 for men (9,622 | 10.2%) and $25,000 to $29,999 for women (7,733 | 10.7%).
| Income | Male | Female |
| $2,499 or less | 2,132 (2.3%) | 2,964 (4.1%) |
| $2,500 to $4,999 | 2,042 (2.2%) | 2,497 (3.5%) |
| $5,000 to $7,499 | 2,269 (2.4%) | 2,531 (3.5%) |
| $7,500 to $9,999 | 2,169 (2.3%) | 2,634 (3.6%) |
| $10,000 to $12,499 | 2,434 (2.6%) | 2,660 (3.7%) |
| $12,500 to $14,999 | 2,288 (2.4%) | 2,525 (3.5%) |
| $15,000 to $17,499 | 3,068 (3.3%) | 3,255 (4.5%) |
| $17,500 to $19,999 | 2,238 (2.4%) | 2,654 (3.7%) |
| $20,000 to $22,499 | 3,013 (3.2%) | 3,206 (4.4%) |
| $22,500 to $24,999 | 3,733 (4.0%) | 4,214 (5.8%) |
| $25,000 to $29,999 | 8,664 (9.2%) | 7,733 (10.7%) |
| $30,000 to $34,999 | 9,622 (10.2%) | 6,178 (8.6%) |
| $35,000 to $39,999 | 7,002 (7.4%) | 4,229 (5.9%) |
| $40,000 to $44,999 | 6,107 (6.5%) | 3,652 (5.1%) |
| $45,000 to $49,999 | 5,799 (6.2%) | 3,394 (4.7%) |
| $50,000 to $54,999 | 4,906 (5.2%) | 2,254 (3.1%) |
| $55,000 to $64,999 | 6,155 (6.6%) | 3,940 (5.5%) |
| $65,000 to $74,999 | 4,140 (4.4%) | 2,452 (3.4%) |
| $75,000 to $99,999 | 7,617 (8.1%) | 4,460 (6.2%) |
| $100,000+ | 8,541 (9.1%) | 4,762 (6.6%) |
| Total | 93,939 (100.0%) | 72,194 (100.0%) |
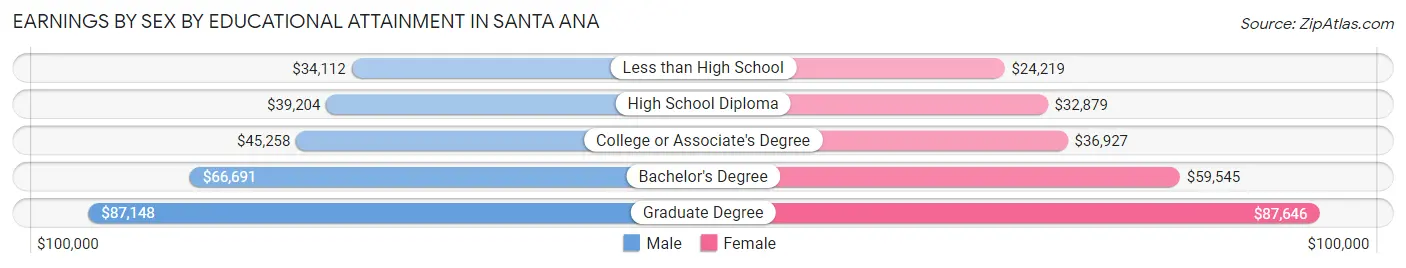
Earnings by Sex by Educational Attainment in Santa Ana
Average earnings in Santa Ana are $40,908 for men and $33,153 for women, a difference of 19.0%. Men with an educational attainment of graduate degree enjoy the highest average annual earnings of $87,148, while those with less than high school education earn the least with $34,112. Women with an educational attainment of graduate degree earn the most with the average annual earnings of $87,646, while those with less than high school education have the smallest earnings of $24,219.
| Educational Attainment | Male Income | Female Income |
| Less than High School | $34,112 | $24,219 |
| High School Diploma | $39,204 | $32,879 |
| College or Associate's Degree | $45,258 | $36,927 |
| Bachelor's Degree | $66,691 | $59,545 |
| Graduate Degree | $87,148 | $87,646 |
| Total | $40,908 | $33,153 |
Family Income in Santa Ana
Family Income Brackets in Santa Ana
According to the Santa Ana family income data, there are 13,206 families falling into the $100,000 to $149,999 income range, which is the most common income bracket and makes up 21.1% of all families. Conversely, the $10,000 to $14,999 income bracket is the least frequent group with only 1,127 families (1.8%) belonging to this category.
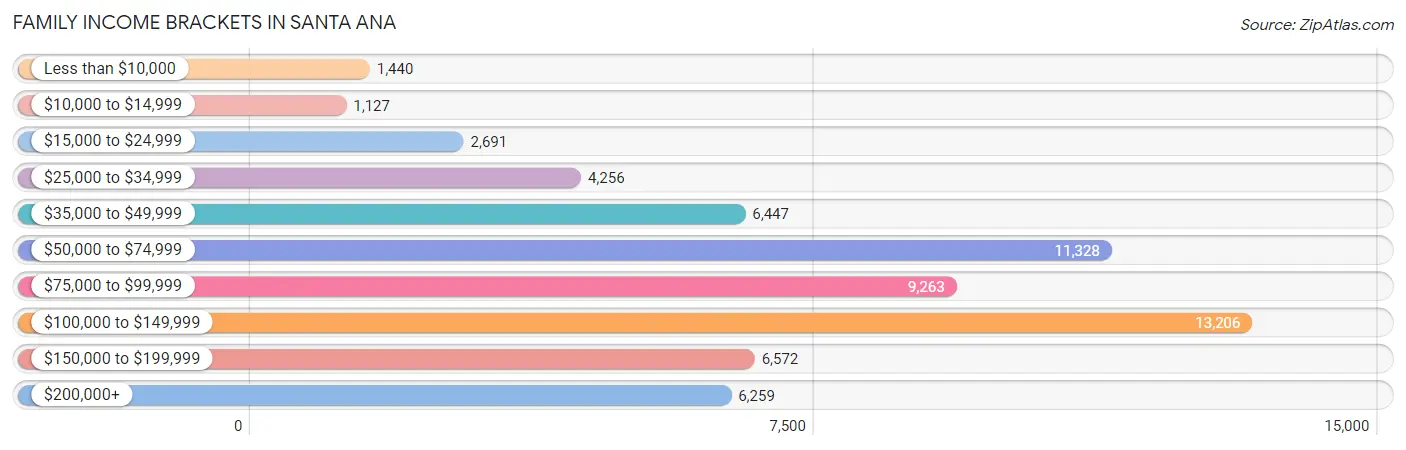
| Income Bracket | # Families | % Families |
| Less than $10,000 | 1,440 | 2.3% |
| $10,000 to $14,999 | 1,127 | 1.8% |
| $15,000 to $24,999 | 2,691 | 4.3% |
| $25,000 to $34,999 | 4,256 | 6.8% |
| $35,000 to $49,999 | 6,447 | 10.3% |
| $50,000 to $74,999 | 11,328 | 18.1% |
| $75,000 to $99,999 | 9,263 | 14.8% |
| $100,000 to $149,999 | 13,206 | 21.1% |
| $150,000 to $199,999 | 6,572 | 10.5% |
| $200,000+ | 6,259 | 10.0% |
Family Income by Famaliy Size in Santa Ana
7+ person families (5,550 | 8.9%) account for the highest median family income in Santa Ana with $131,905 per family, while 2-person families (14,813 | 23.7%) have the highest median income of $31,742 per family member.
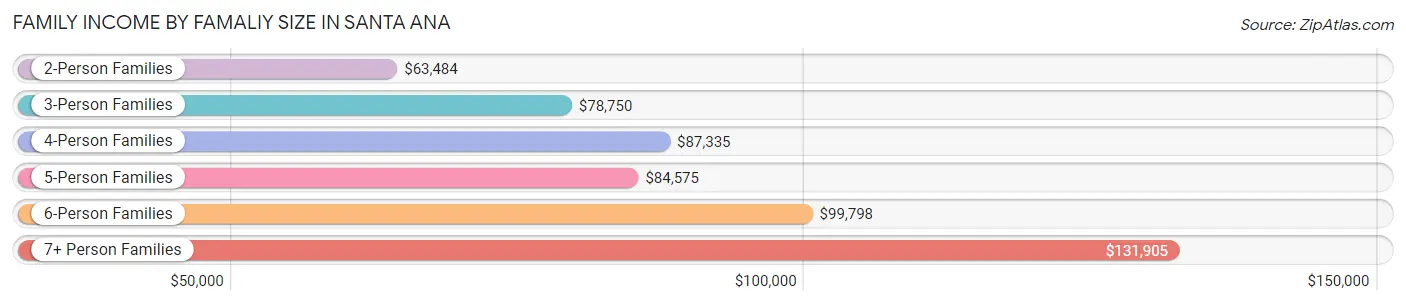
| Income Bracket | # Families | Median Income |
| 2-Person Families | 14,813 (23.7%) | $63,484 |
| 3-Person Families | 11,797 (18.9%) | $78,750 |
| 4-Person Families | 15,167 (24.2%) | $87,335 |
| 5-Person Families | 9,749 (15.6%) | $84,575 |
| 6-Person Families | 5,512 (8.8%) | $99,798 |
| 7+ Person Families | 5,550 (8.9%) | $131,905 |
| Total | 62,588 (100.0%) | $83,689 |
Family Income by Number of Earners in Santa Ana
The median family income in Santa Ana is $83,689, with families comprising 3+ earners (18,991) having the highest median family income of $131,390, while families with no earners (4,700) have the lowest median family income of $27,271, accounting for 30.3% and 7.5% of families, respectively.
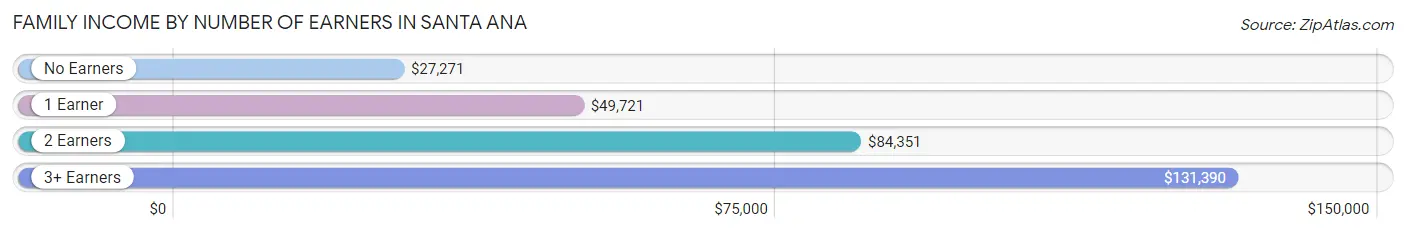
| Number of Earners | # Families | Median Income |
| No Earners | 4,700 (7.5%) | $27,271 |
| 1 Earner | 15,933 (25.5%) | $49,721 |
| 2 Earners | 22,964 (36.7%) | $84,351 |
| 3+ Earners | 18,991 (30.3%) | $131,390 |
| Total | 62,588 (100.0%) | $83,689 |
Household Income in Santa Ana
Household Income Brackets in Santa Ana
With 15,898 households falling in the category, the $100,000 to $149,999 income range is the most frequent in Santa Ana, accounting for 20.5% of all households. In contrast, only 2,171 households (2.8%) fall into the $10,000 to $14,999 income bracket, making it the least populous group.
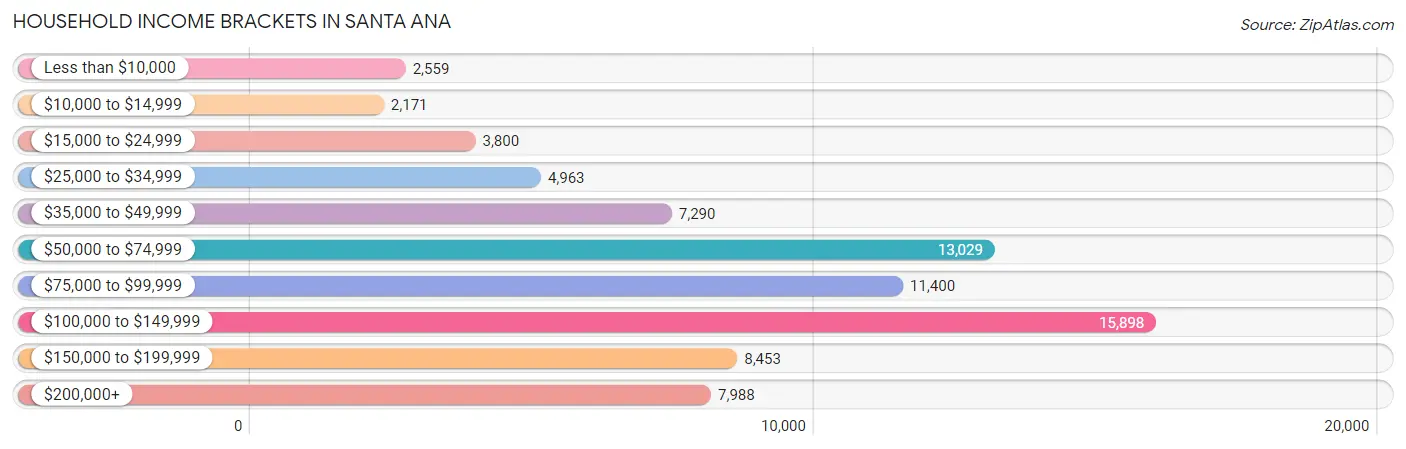
| Income Bracket | # Households | % Households |
| Less than $10,000 | 2,559 | 3.3% |
| $10,000 to $14,999 | 2,171 | 2.8% |
| $15,000 to $24,999 | 3,800 | 4.9% |
| $25,000 to $34,999 | 4,963 | 6.4% |
| $35,000 to $49,999 | 7,290 | 9.4% |
| $50,000 to $74,999 | 13,029 | 16.8% |
| $75,000 to $99,999 | 11,400 | 14.7% |
| $100,000 to $149,999 | 15,898 | 20.5% |
| $150,000 to $199,999 | 8,453 | 10.9% |
| $200,000+ | 7,988 | 10.3% |
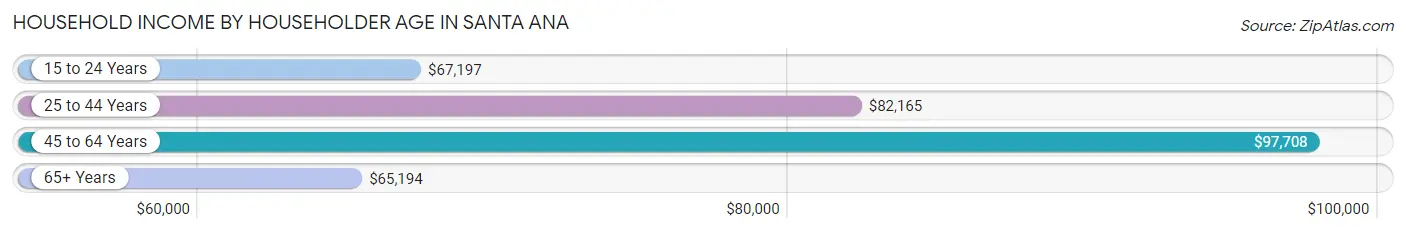
Household Income by Householder Age in Santa Ana
The median household income in Santa Ana is $84,210, with the highest median household income of $97,708 found in the 45 to 64 years age bracket for the primary householder. A total of 31,313 households (40.4%) fall into this category. Meanwhile, the 65+ years age bracket for the primary householder has the lowest median household income of $65,194, with 15,189 households (19.6%) in this group.
| Income Bracket | # Households | Median Income |
| 15 to 24 Years | 2,204 (2.8%) | $67,197 |
| 25 to 44 Years | 28,847 (37.2%) | $82,165 |
| 45 to 64 Years | 31,313 (40.4%) | $97,708 |
| 65+ Years | 15,189 (19.6%) | $65,194 |
| Total | 77,553 (100.0%) | $84,210 |
Poverty in Santa Ana
Income Below Poverty by Sex and Age in Santa Ana
With 10.7% poverty level for males and 12.4% for females among the residents of Santa Ana, under 5 year old males and 75 year old and over females are the most vulnerable to poverty, with 1,863 males (20.8%) and 1,470 females (19.4%) in their respective age groups living below the poverty level.
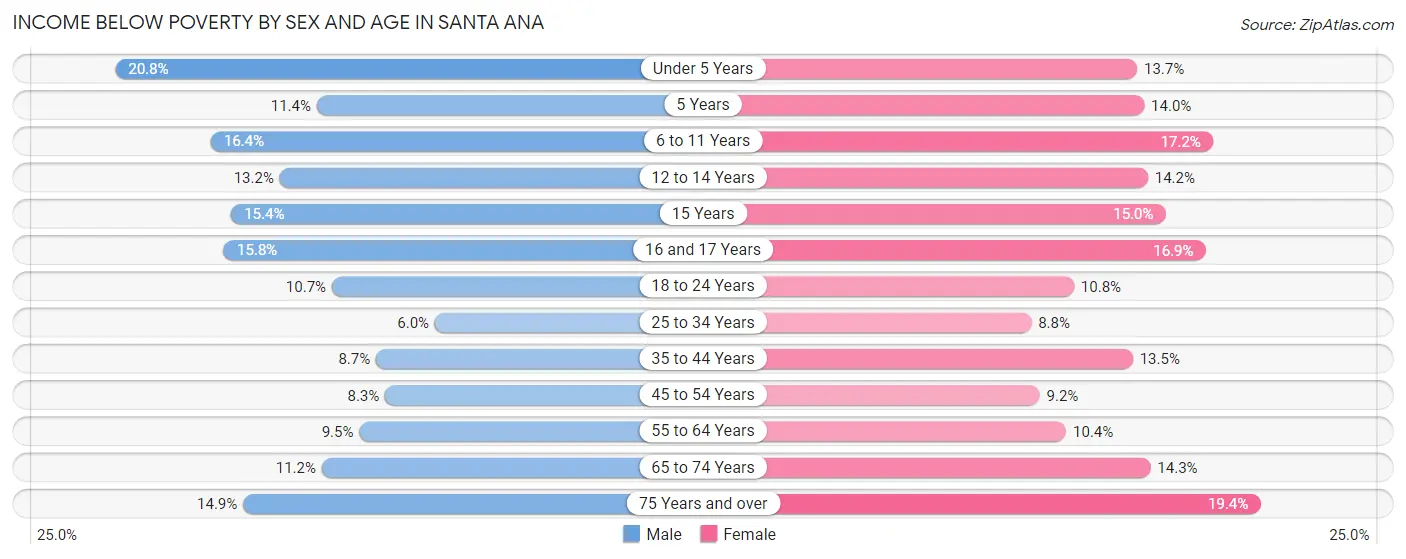
| Age Bracket | Male | Female |
| Under 5 Years | 1,863 (20.8%) | 1,220 (13.7%) |
| 5 Years | 272 (11.4%) | 263 (14.0%) |
| 6 to 11 Years | 2,039 (16.4%) | 1,924 (17.2%) |
| 12 to 14 Years | 954 (13.2%) | 910 (14.2%) |
| 15 Years | 340 (15.4%) | 319 (15.0%) |
| 16 and 17 Years | 735 (15.8%) | 847 (16.9%) |
| 18 to 24 Years | 2,043 (10.7%) | 1,846 (10.8%) |
| 25 to 34 Years | 1,618 (6.0%) | 2,048 (8.8%) |
| 35 to 44 Years | 2,018 (8.7%) | 2,785 (13.5%) |
| 45 to 54 Years | 1,603 (8.3%) | 1,802 (9.2%) |
| 55 to 64 Years | 1,613 (9.5%) | 1,565 (10.4%) |
| 65 to 74 Years | 1,048 (11.2%) | 1,512 (14.3%) |
| 75 Years and over | 734 (14.9%) | 1,470 (19.4%) |
| Total | 16,880 (10.7%) | 18,511 (12.4%) |
Income Above Poverty by Sex and Age in Santa Ana
According to the poverty statistics in Santa Ana, males aged 25 to 34 years and females aged 25 to 34 years are the age groups that are most secure financially, with 94.0% of males and 91.2% of females in these age groups living above the poverty line.
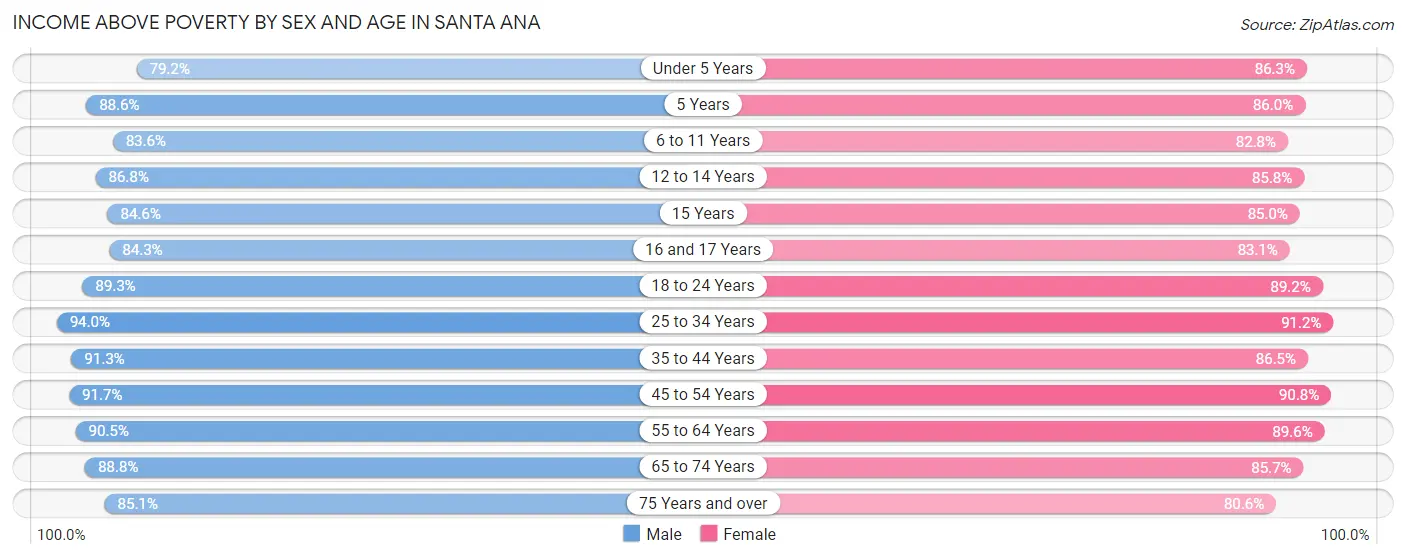
| Age Bracket | Male | Female |
| Under 5 Years | 7,100 (79.2%) | 7,684 (86.3%) |
| 5 Years | 2,106 (88.6%) | 1,612 (86.0%) |
| 6 to 11 Years | 10,426 (83.6%) | 9,258 (82.8%) |
| 12 to 14 Years | 6,295 (86.8%) | 5,497 (85.8%) |
| 15 Years | 1,867 (84.6%) | 1,806 (85.0%) |
| 16 and 17 Years | 3,931 (84.3%) | 4,174 (83.1%) |
| 18 to 24 Years | 16,973 (89.3%) | 15,296 (89.2%) |
| 25 to 34 Years | 25,535 (94.0%) | 21,241 (91.2%) |
| 35 to 44 Years | 21,212 (91.3%) | 17,852 (86.5%) |
| 45 to 54 Years | 17,788 (91.7%) | 17,827 (90.8%) |
| 55 to 64 Years | 15,414 (90.5%) | 13,474 (89.6%) |
| 65 to 74 Years | 8,300 (88.8%) | 9,048 (85.7%) |
| 75 Years and over | 4,204 (85.1%) | 6,102 (80.6%) |
| Total | 141,151 (89.3%) | 130,871 (87.6%) |
Income Below Poverty Among Married-Couple Families in Santa Ana
The poverty statistics for married-couple families in Santa Ana show that 6.6% or 2,796 of the total 42,542 families live below the poverty line. Families with 5 or more children have the highest poverty rate of 23.3%, comprising of 133 families. On the other hand, families with no children have the lowest poverty rate of 4.8%, which includes 910 families.
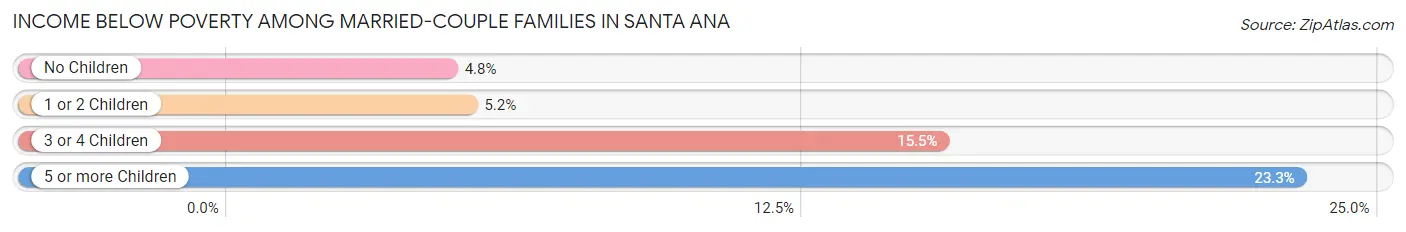
| Children | Above Poverty | Below Poverty |
| No Children | 18,111 (95.2%) | 910 (4.8%) |
| 1 or 2 Children | 16,603 (94.8%) | 912 (5.2%) |
| 3 or 4 Children | 4,593 (84.5%) | 841 (15.5%) |
| 5 or more Children | 439 (76.7%) | 133 (23.3%) |
| Total | 39,746 (93.4%) | 2,796 (6.6%) |
Income Below Poverty Among Single-Parent Households in Santa Ana
According to the poverty data in Santa Ana, 10.9% or 730 single-father households and 17.8% or 2,373 single-mother households are living below the poverty line. Among single-father households, those with 5 or more children have the highest poverty rate, with 20 households (57.1%) experiencing poverty. Likewise, among single-mother households, those with 3 or 4 children have the highest poverty rate, with 657 households (39.3%) falling below the poverty line.
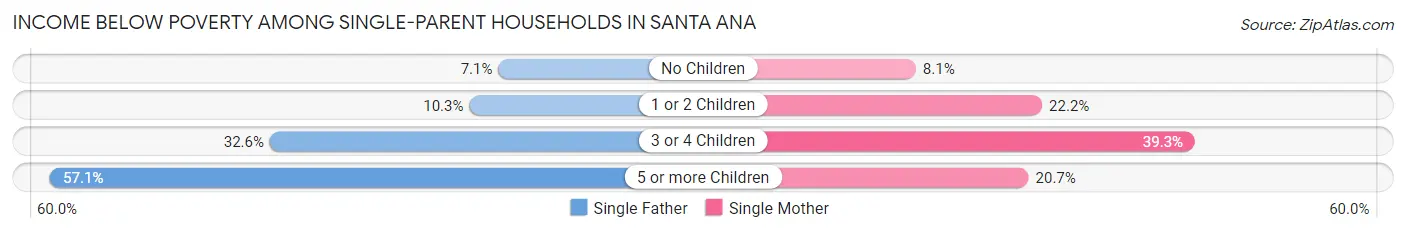
| Children | Single Father | Single Mother |
| No Children | 234 (7.1%) | 498 (8.1%) |
| 1 or 2 Children | 284 (10.3%) | 1,175 (22.2%) |
| 3 or 4 Children | 192 (32.6%) | 657 (39.3%) |
| 5 or more Children | 20 (57.1%) | 43 (20.7%) |
| Total | 730 (10.9%) | 2,373 (17.8%) |
Income Below Poverty Among Married-Couple vs Single-Parent Households in Santa Ana
The poverty data for Santa Ana shows that 2,796 of the married-couple family households (6.6%) and 3,103 of the single-parent households (15.5%) are living below the poverty level. Within the married-couple family households, those with 5 or more children have the highest poverty rate, with 133 households (23.3%) falling below the poverty line. Among the single-parent households, those with 3 or 4 children have the highest poverty rate, with 849 household (37.5%) living below poverty.
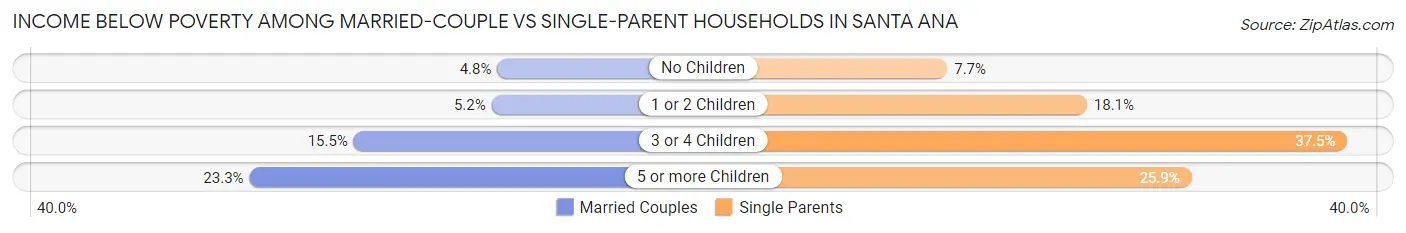
| Children | Married-Couple Families | Single-Parent Households |
| No Children | 910 (4.8%) | 732 (7.7%) |
| 1 or 2 Children | 912 (5.2%) | 1,459 (18.1%) |
| 3 or 4 Children | 841 (15.5%) | 849 (37.5%) |
| 5 or more Children | 133 (23.3%) | 63 (25.9%) |
| Total | 2,796 (6.6%) | 3,103 (15.5%) |
Race in Santa Ana
The most populous races in Santa Ana are Hispanic or Latino (239,824 | 77.0%), Some other Race (148,017 | 47.5%), and White / Caucasian (78,880 | 25.3%).
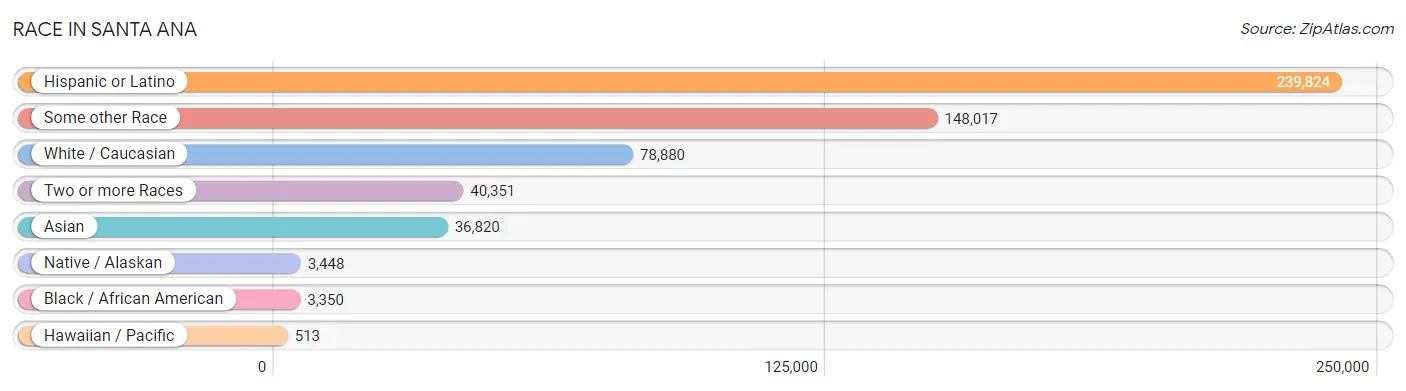
| Race | # Population | % Population |
| Asian | 36,820 | 11.8% |
| Black / African American | 3,350 | 1.1% |
| Hawaiian / Pacific | 513 | 0.2% |
| Hispanic or Latino | 239,824 | 77.0% |
| Native / Alaskan | 3,448 | 1.1% |
| White / Caucasian | 78,880 | 25.3% |
| Two or more Races | 40,351 | 13.0% |
| Some other Race | 148,017 | 47.5% |
| Total | 311,379 | 100.0% |
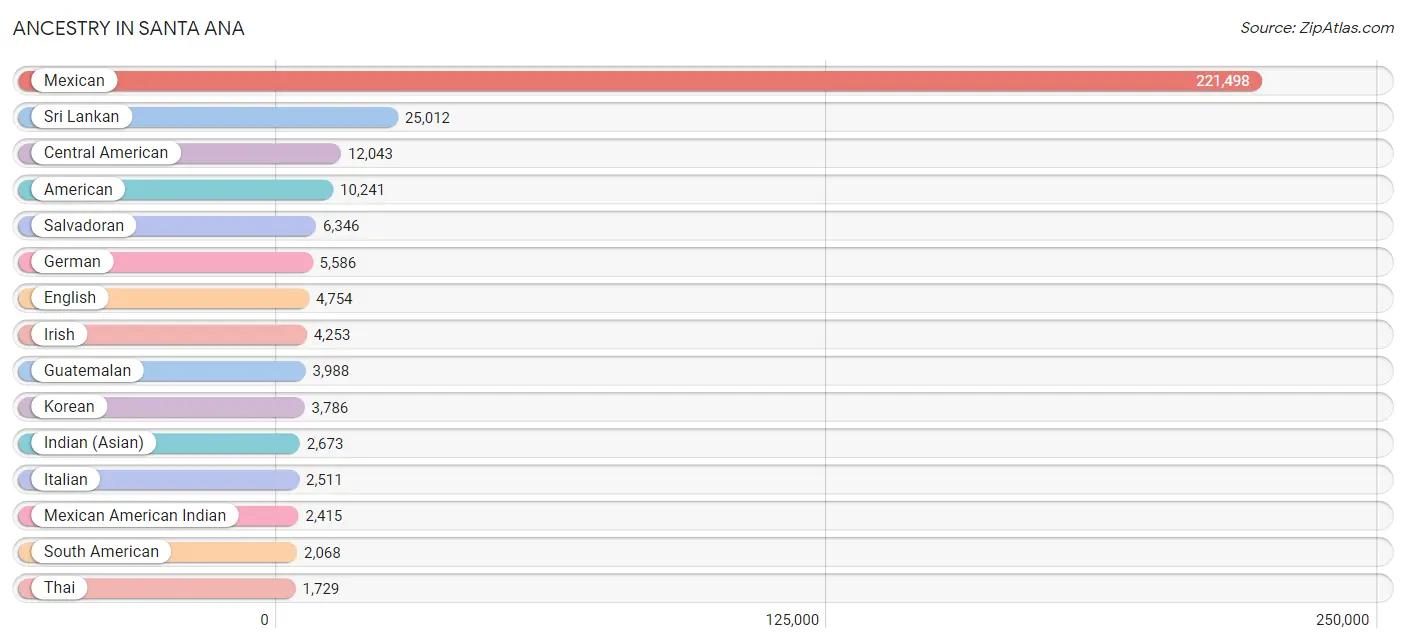
Ancestry in Santa Ana
The most populous ancestries reported in Santa Ana are Mexican (221,498 | 71.1%), Sri Lankan (25,012 | 8.0%), Central American (12,043 | 3.9%), American (10,241 | 3.3%), and Salvadoran (6,346 | 2.0%), together accounting for 88.4% of all Santa Ana residents.
| Ancestry | # Population | % Population |
| Afghan | 157 | 0.1% |
| African | 261 | 0.1% |
| Albanian | 7 | 0.0% |
| American | 10,241 | 3.3% |
| Apache | 90 | 0.0% |
| Arab | 615 | 0.2% |
| Arapaho | 13 | 0.0% |
| Argentinean | 223 | 0.1% |
| Armenian | 45 | 0.0% |
| Australian | 28 | 0.0% |
| Austrian | 39 | 0.0% |
| Bahamian | 25 | 0.0% |
| Bangladeshi | 344 | 0.1% |
| Barbadian | 15 | 0.0% |
| Basque | 2 | 0.0% |
| Belgian | 15 | 0.0% |
| Belizean | 16 | 0.0% |
| Bhutanese | 1,375 | 0.4% |
| Blackfeet | 40 | 0.0% |
| Bolivian | 418 | 0.1% |
| Brazilian | 18 | 0.0% |
| British | 304 | 0.1% |
| Burmese | 1,270 | 0.4% |
| Cajun | 5 | 0.0% |
| Cambodian | 25 | 0.0% |
| Canadian | 174 | 0.1% |
| Cape Verdean | 97 | 0.0% |
| Celtic | 13 | 0.0% |
| Central American | 12,043 | 3.9% |
| Central American Indian | 482 | 0.2% |
| Cherokee | 236 | 0.1% |
| Chilean | 37 | 0.0% |
| Chippewa | 20 | 0.0% |
| Choctaw | 120 | 0.0% |
| Colombian | 530 | 0.2% |
| Comanche | 6 | 0.0% |
| Costa Rican | 126 | 0.0% |
| Croatian | 53 | 0.0% |
| Crow | 2 | 0.0% |
| Cuban | 503 | 0.2% |
| Czech | 152 | 0.1% |
| Czechoslovakian | 30 | 0.0% |
| Danish | 297 | 0.1% |
| Dominican | 68 | 0.0% |
| Dutch | 743 | 0.2% |
| Eastern European | 143 | 0.1% |
| Ecuadorian | 362 | 0.1% |
| Egyptian | 116 | 0.0% |
| English | 4,754 | 1.5% |
| Ethiopian | 87 | 0.0% |
| European | 1,173 | 0.4% |
| Fijian | 12 | 0.0% |
| Filipino | 298 | 0.1% |
| Finnish | 87 | 0.0% |
| French | 1,264 | 0.4% |
| French Canadian | 267 | 0.1% |
| German | 5,586 | 1.8% |
| Ghanaian | 10 | 0.0% |
| Greek | 252 | 0.1% |
| Guamanian / Chamorro | 148 | 0.1% |
| Guatemalan | 3,988 | 1.3% |
| Guyanese | 208 | 0.1% |
| Haitian | 24 | 0.0% |
| Honduran | 738 | 0.2% |
| Hopi | 10 | 0.0% |
| Hungarian | 304 | 0.1% |
| Indian (Asian) | 2,673 | 0.9% |
| Indonesian | 43 | 0.0% |
| Iranian | 246 | 0.1% |
| Iraqi | 11 | 0.0% |
| Irish | 4,253 | 1.4% |
| Israeli | 24 | 0.0% |
| Italian | 2,511 | 0.8% |
| Jamaican | 55 | 0.0% |
| Japanese | 1,651 | 0.5% |
| Jordanian | 9 | 0.0% |
| Korean | 3,786 | 1.2% |
| Laotian | 111 | 0.0% |
| Latvian | 14 | 0.0% |
| Lebanese | 127 | 0.0% |
| Lithuanian | 102 | 0.0% |
| Malaysian | 649 | 0.2% |
| Mexican | 221,498 | 71.1% |
| Mexican American Indian | 2,415 | 0.8% |
| Mongolian | 47 | 0.0% |
| Moroccan | 25 | 0.0% |
| Native Hawaiian | 190 | 0.1% |
| Navajo | 108 | 0.0% |
| New Zealander | 12 | 0.0% |
| Nicaraguan | 755 | 0.2% |
| Nigerian | 32 | 0.0% |
| Northern European | 79 | 0.0% |
| Norwegian | 593 | 0.2% |
| Paiute | 9 | 0.0% |
| Pakistani | 296 | 0.1% |
| Palestinian | 33 | 0.0% |
| Pennsylvania German | 4 | 0.0% |
| Peruvian | 382 | 0.1% |
| Pima | 2 | 0.0% |
| Polish | 784 | 0.3% |
| Portuguese | 90 | 0.0% |
| Pueblo | 86 | 0.0% |
| Puerto Rican | 651 | 0.2% |
| Puget Sound Salish | 67 | 0.0% |
| Romanian | 35 | 0.0% |
| Russian | 948 | 0.3% |
| Salvadoran | 6,346 | 2.0% |
| Samoan | 292 | 0.1% |
| Scandinavian | 139 | 0.0% |
| Scotch-Irish | 191 | 0.1% |
| Scottish | 756 | 0.2% |
| Seminole | 27 | 0.0% |
| Serbian | 117 | 0.0% |
| Sioux | 8 | 0.0% |
| Slavic | 19 | 0.0% |
| Slovak | 29 | 0.0% |
| Slovene | 12 | 0.0% |
| South African | 107 | 0.0% |
| South American | 2,068 | 0.7% |
| South American Indian | 45 | 0.0% |
| Spaniard | 292 | 0.1% |
| Spanish | 379 | 0.1% |
| Spanish American | 19 | 0.0% |
| Spanish American Indian | 20 | 0.0% |
| Sri Lankan | 25,012 | 8.0% |
| Subsaharan African | 594 | 0.2% |
| Swedish | 517 | 0.2% |
| Swiss | 146 | 0.1% |
| Syrian | 145 | 0.1% |
| Thai | 1,729 | 0.6% |
| Tohono O'Odham | 29 | 0.0% |
| Tongan | 35 | 0.0% |
| Trinidadian and Tobagonian | 8 | 0.0% |
| Turkish | 167 | 0.1% |
| Ukrainian | 66 | 0.0% |
| Venezuelan | 116 | 0.0% |
| Vietnamese | 97 | 0.0% |
| Welsh | 380 | 0.1% |
| Yaqui | 55 | 0.0% |
| Yugoslavian | 32 | 0.0% | View All 140 Rows |
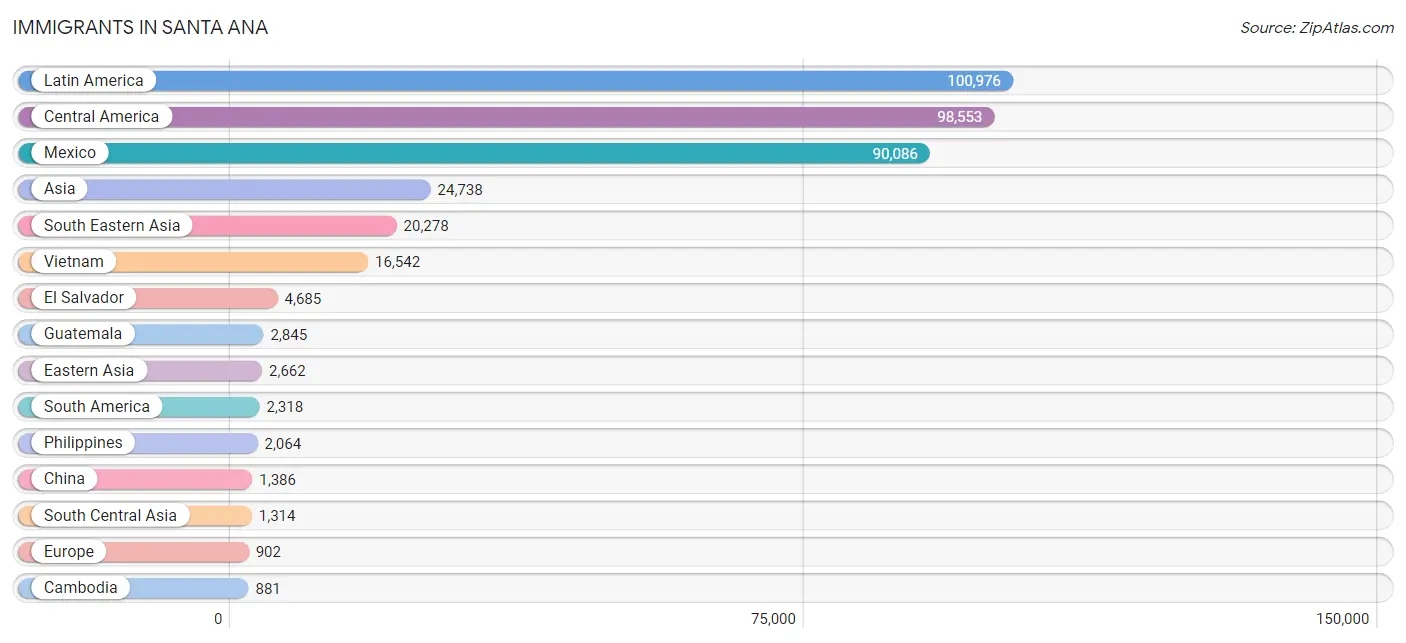
Immigrants in Santa Ana
The most numerous immigrant groups reported in Santa Ana came from Latin America (100,976 | 32.4%), Central America (98,553 | 31.7%), Mexico (90,086 | 28.9%), Asia (24,738 | 7.9%), and South Eastern Asia (20,278 | 6.5%), together accounting for 107.5% of all Santa Ana residents.
| Immigration Origin | # Population | % Population |
| Afghanistan | 187 | 0.1% |
| Africa | 367 | 0.1% |
| Argentina | 160 | 0.1% |
| Armenia | 9 | 0.0% |
| Asia | 24,738 | 7.9% |
| Australia | 46 | 0.0% |
| Bahamas | 8 | 0.0% |
| Bangladesh | 100 | 0.0% |
| Belgium | 15 | 0.0% |
| Bolivia | 612 | 0.2% |
| Bosnia and Herzegovina | 14 | 0.0% |
| Brazil | 32 | 0.0% |
| Cambodia | 881 | 0.3% |
| Canada | 238 | 0.1% |
| Caribbean | 105 | 0.0% |
| Central America | 98,553 | 31.7% |
| Chile | 20 | 0.0% |
| China | 1,386 | 0.4% |
| Colombia | 474 | 0.2% |
| Costa Rica | 43 | 0.0% |
| Cuba | 39 | 0.0% |
| Czechoslovakia | 42 | 0.0% |
| Dominican Republic | 47 | 0.0% |
| Eastern Africa | 128 | 0.0% |
| Eastern Asia | 2,662 | 0.9% |
| Eastern Europe | 356 | 0.1% |
| Ecuador | 328 | 0.1% |
| Egypt | 77 | 0.0% |
| El Salvador | 4,685 | 1.5% |
| England | 33 | 0.0% |
| Ethiopia | 128 | 0.0% |
| Europe | 902 | 0.3% |
| Fiji | 39 | 0.0% |
| France | 169 | 0.1% |
| Germany | 109 | 0.0% |
| Greece | 20 | 0.0% |
| Guatemala | 2,845 | 0.9% |
| Guyana | 123 | 0.0% |
| Haiti | 9 | 0.0% |
| Honduras | 551 | 0.2% |
| Hong Kong | 124 | 0.0% |
| Hungary | 27 | 0.0% |
| India | 669 | 0.2% |
| Indonesia | 90 | 0.0% |
| Iran | 121 | 0.0% |
| Ireland | 9 | 0.0% |
| Israel | 11 | 0.0% |
| Italy | 12 | 0.0% |
| Japan | 494 | 0.2% |
| Kazakhstan | 13 | 0.0% |
| Korea | 782 | 0.3% |
| Kuwait | 66 | 0.0% |
| Laos | 456 | 0.2% |
| Latin America | 100,976 | 32.4% |
| Lebanon | 89 | 0.0% |
| Lithuania | 19 | 0.0% |
| Malaysia | 31 | 0.0% |
| Mexico | 90,086 | 28.9% |
| Morocco | 29 | 0.0% |
| Netherlands | 28 | 0.0% |
| Nicaragua | 308 | 0.1% |
| Nigeria | 32 | 0.0% |
| Northern Africa | 127 | 0.0% |
| Northern Europe | 106 | 0.0% |
| Norway | 11 | 0.0% |
| Oceania | 135 | 0.0% |
| Pakistan | 209 | 0.1% |
| Peru | 450 | 0.1% |
| Philippines | 2,064 | 0.7% |
| Poland | 10 | 0.0% |
| Romania | 6 | 0.0% |
| Russia | 70 | 0.0% |
| Saudi Arabia | 20 | 0.0% |
| Serbia | 13 | 0.0% |
| Singapore | 15 | 0.0% |
| South Africa | 80 | 0.0% |
| South America | 2,318 | 0.7% |
| South Central Asia | 1,314 | 0.4% |
| South Eastern Asia | 20,278 | 6.5% |
| Southern Europe | 109 | 0.0% |
| Spain | 45 | 0.0% |
| Sri Lanka | 15 | 0.0% |
| Sweden | 11 | 0.0% |
| Syria | 69 | 0.0% |
| Taiwan | 446 | 0.1% |
| Thailand | 170 | 0.1% |
| Turkey | 129 | 0.0% |
| Ukraine | 155 | 0.1% |
| Venezuela | 119 | 0.0% |
| Vietnam | 16,542 | 5.3% |
| Western Africa | 32 | 0.0% |
| Western Asia | 438 | 0.1% |
| Western Europe | 321 | 0.1% | View All 93 Rows |
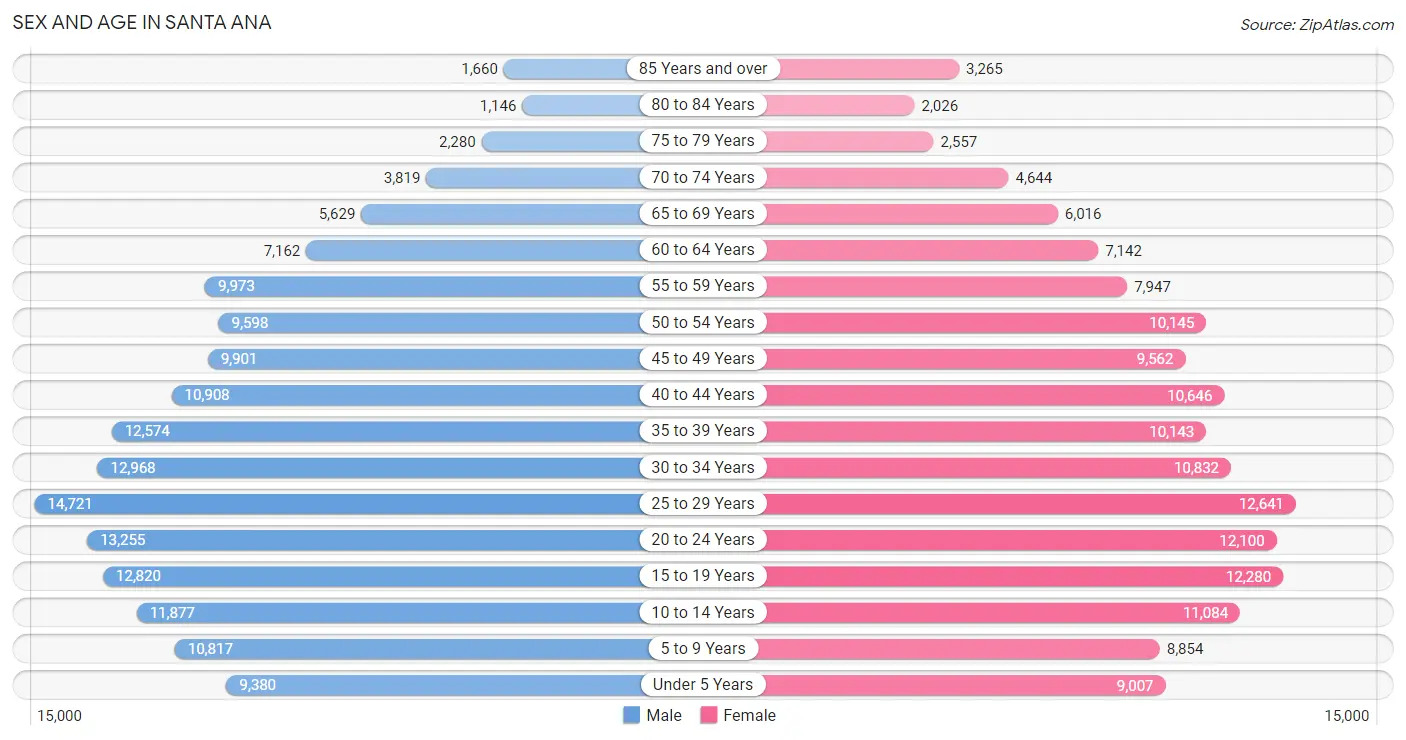
Sex and Age in Santa Ana
Sex and Age in Santa Ana
The most populous age groups in Santa Ana are 25 to 29 Years (14,721 | 9.2%) for men and 25 to 29 Years (12,641 | 8.4%) for women.
| Age Bracket | Male | Female |
| Under 5 Years | 9,380 (5.8%) | 9,007 (6.0%) |
| 5 to 9 Years | 10,817 (6.7%) | 8,854 (5.9%) |
| 10 to 14 Years | 11,877 (7.4%) | 11,084 (7.3%) |
| 15 to 19 Years | 12,820 (8.0%) | 12,280 (8.1%) |
| 20 to 24 Years | 13,255 (8.3%) | 12,100 (8.0%) |
| 25 to 29 Years | 14,721 (9.2%) | 12,641 (8.4%) |
| 30 to 34 Years | 12,968 (8.1%) | 10,832 (7.2%) |
| 35 to 39 Years | 12,574 (7.8%) | 10,143 (6.7%) |
| 40 to 44 Years | 10,908 (6.8%) | 10,646 (7.1%) |
| 45 to 49 Years | 9,901 (6.2%) | 9,562 (6.3%) |
| 50 to 54 Years | 9,598 (6.0%) | 10,145 (6.7%) |
| 55 to 59 Years | 9,973 (6.2%) | 7,947 (5.3%) |
| 60 to 64 Years | 7,162 (4.5%) | 7,142 (4.7%) |
| 65 to 69 Years | 5,629 (3.5%) | 6,016 (4.0%) |
| 70 to 74 Years | 3,819 (2.4%) | 4,644 (3.1%) |
| 75 to 79 Years | 2,280 (1.4%) | 2,557 (1.7%) |
| 80 to 84 Years | 1,146 (0.7%) | 2,026 (1.3%) |
| 85 Years and over | 1,660 (1.0%) | 3,265 (2.2%) |
| Total | 160,488 (100.0%) | 150,891 (100.0%) |
Families and Households in Santa Ana
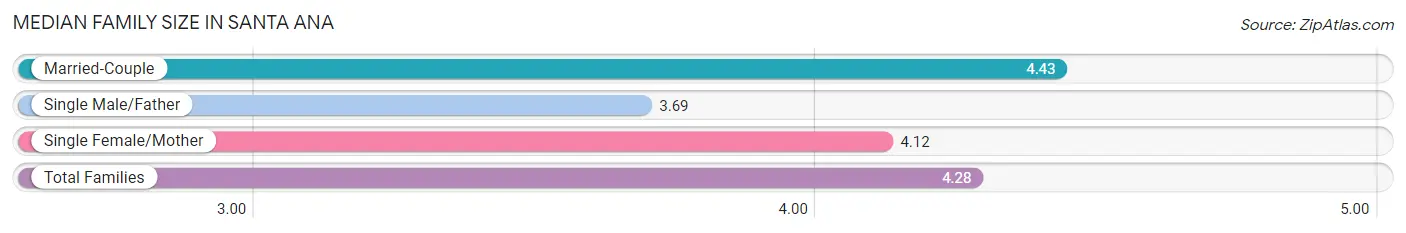
Median Family Size in Santa Ana
The median family size in Santa Ana is 4.28 persons per family, with married-couple families (42,542 | 68.0%) accounting for the largest median family size of 4.43 persons per family. On the other hand, single male/father families (6,694 | 10.7%) represent the smallest median family size with 3.69 persons per family.
| Family Type | # Families | Family Size |
| Married-Couple | 42,542 (68.0%) | 4.43 |
| Single Male/Father | 6,694 (10.7%) | 3.69 |
| Single Female/Mother | 13,352 (21.3%) | 4.12 |
| Total Families | 62,588 (100.0%) | 4.28 |
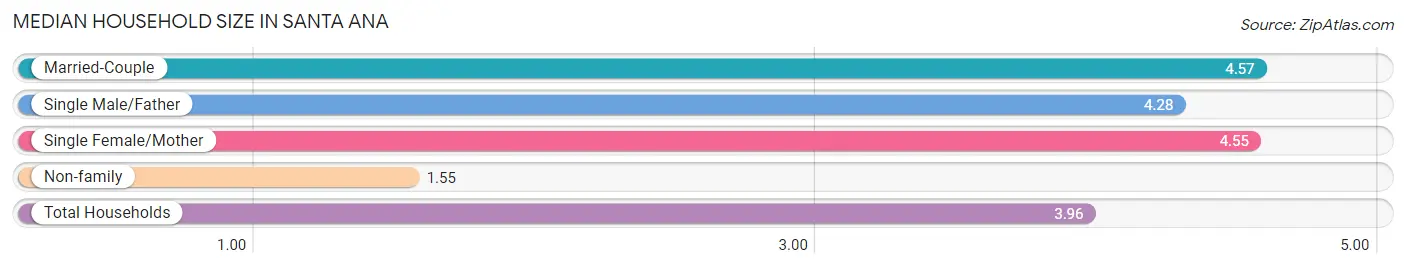
Median Household Size in Santa Ana
The median household size in Santa Ana is 3.96 persons per household, with married-couple households (42,542 | 54.9%) accounting for the largest median household size of 4.57 persons per household. non-family households (14,965 | 19.3%) represent the smallest median household size with 1.55 persons per household.
| Household Type | # Households | Household Size |
| Married-Couple | 42,542 (54.9%) | 4.57 |
| Single Male/Father | 6,694 (8.6%) | 4.28 |
| Single Female/Mother | 13,352 (17.2%) | 4.55 |
| Non-family | 14,965 (19.3%) | 1.55 |
| Total Households | 77,553 (100.0%) | 3.96 |
Household Size by Marriage Status in Santa Ana
Out of a total of 77,553 households in Santa Ana, 62,588 (80.7%) are family households, while 14,965 (19.3%) are nonfamily households. The most numerous type of family households are 4-person households, comprising 15,251, and the most common type of nonfamily households are 1-person households, comprising 10,550.
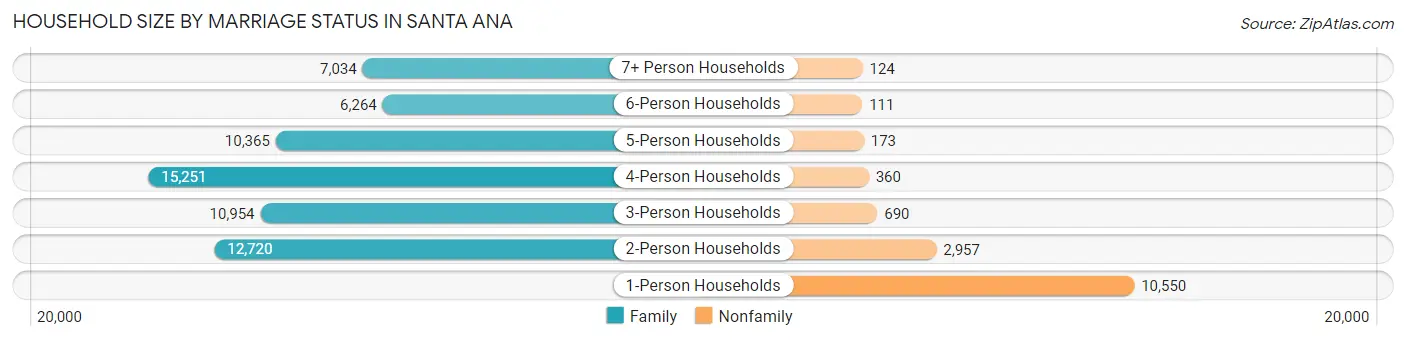
| Household Size | Family Households | Nonfamily Households |
| 1-Person Households | - | 10,550 (13.6%) |
| 2-Person Households | 12,720 (16.4%) | 2,957 (3.8%) |
| 3-Person Households | 10,954 (14.1%) | 690 (0.9%) |
| 4-Person Households | 15,251 (19.7%) | 360 (0.5%) |
| 5-Person Households | 10,365 (13.4%) | 173 (0.2%) |
| 6-Person Households | 6,264 (8.1%) | 111 (0.1%) |
| 7+ Person Households | 7,034 (9.1%) | 124 (0.2%) |
| Total | 62,588 (80.7%) | 14,965 (19.3%) |
Female Fertility in Santa Ana
Fertility by Age in Santa Ana
Average fertility rate in Santa Ana is 43.0 births per 1,000 women. Women in the age bracket of 20 to 34 years have the highest fertility rate with 71.0 births per 1,000 women. Women in the age bracket of 20 to 34 years acount for 71.9% of all women with births.
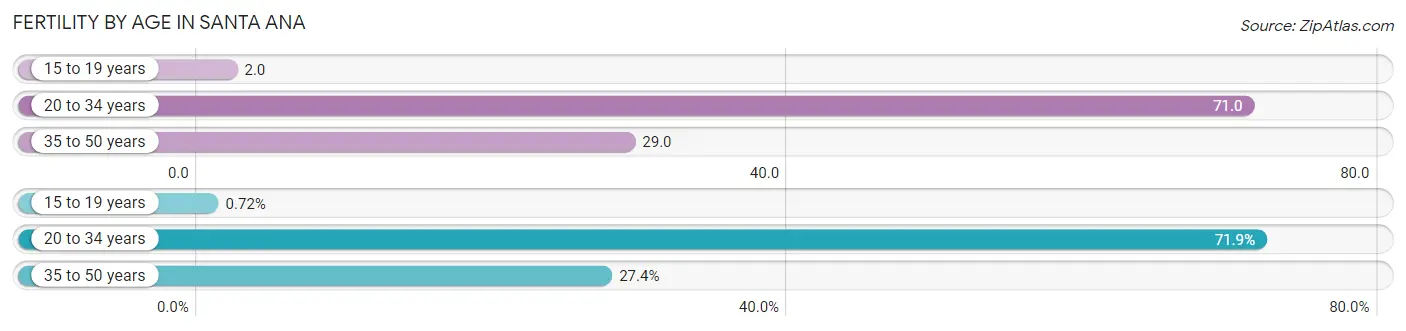
| Age Bracket | Women with Births | Births / 1,000 Women |
| 15 to 19 years | 25 (0.7%) | 2.0 |
| 20 to 34 years | 2,512 (71.9%) | 71.0 |
| 35 to 50 years | 959 (27.4%) | 29.0 |
| Total | 3,496 (100.0%) | 43.0 |
Fertility by Age by Marriage Status in Santa Ana
68.1% of women with births (3,496) in Santa Ana are married. The highest percentage of unmarried women with births falls into 20 to 34 years age bracket with 39.5% of them unmarried at the time of birth, while the lowest percentage of unmarried women with births belong to 15 to 19 years age bracket with 0.0% of them unmarried.

| Age Bracket | Married | Unmarried |
| 15 to 19 years | 25 (100.0%) | 0 (0.0%) |
| 20 to 34 years | 1,520 (60.5%) | 992 (39.5%) |
| 35 to 50 years | 834 (87.0%) | 125 (13.0%) |
| Total | 2,381 (68.1%) | 1,115 (31.9%) |
Fertility by Education in Santa Ana
Average fertility rate in Santa Ana is 43.0 births per 1,000 women. Women with the education attainment of graduate degree have the highest fertility rate of 97.0 births per 1,000 women, while women with the education attainment of less than high school have the lowest fertility at 25.0 births per 1,000 women. Women with the education attainment of college or associate's degree represent 31.8% of all women with births.
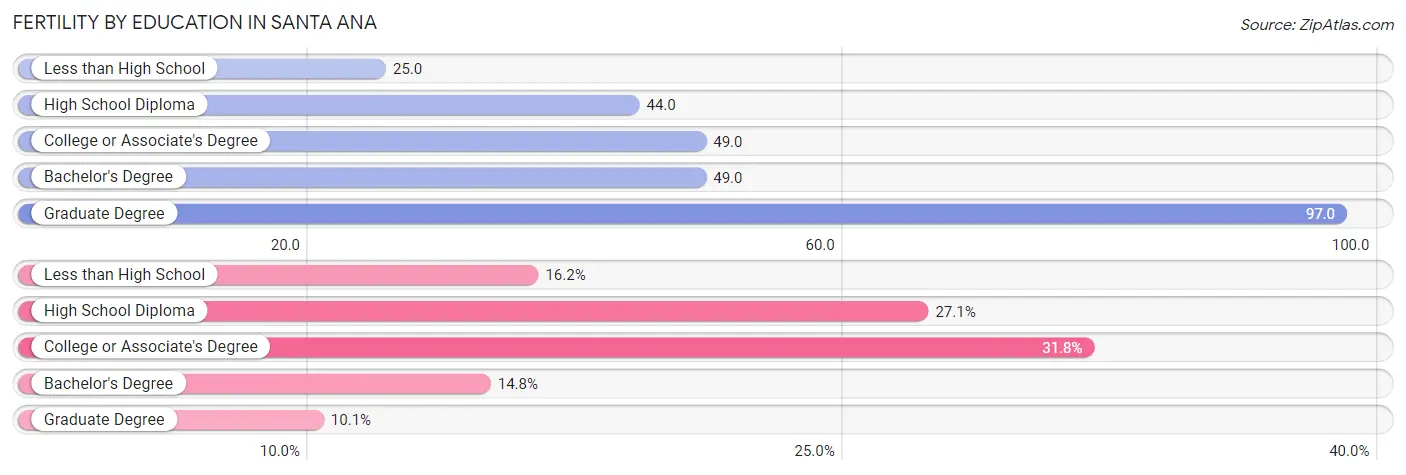
| Educational Attainment | Women with Births | Births / 1,000 Women |
| Less than High School | 565 (16.2%) | 25.0 |
| High School Diploma | 948 (27.1%) | 44.0 |
| College or Associate's Degree | 1,111 (31.8%) | 49.0 |
| Bachelor's Degree | 518 (14.8%) | 49.0 |
| Graduate Degree | 354 (10.1%) | 97.0 |
| Total | 3,496 (100.0%) | 43.0 |
Fertility by Education by Marriage Status in Santa Ana
31.9% of women with births in Santa Ana are unmarried. Women with the educational attainment of bachelor's degree are most likely to be married with 78.6% of them married at childbirth, while women with the educational attainment of less than high school are least likely to be married with 41.2% of them unmarried at childbirth.
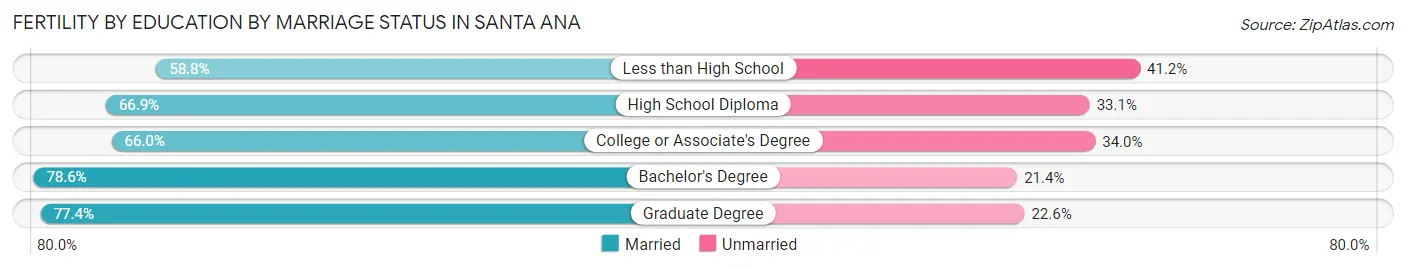
| Educational Attainment | Married | Unmarried |
| Less than High School | 332 (58.8%) | 233 (41.2%) |
| High School Diploma | 634 (66.9%) | 314 (33.1%) |
| College or Associate's Degree | 733 (66.0%) | 378 (34.0%) |
| Bachelor's Degree | 407 (78.6%) | 111 (21.4%) |
| Graduate Degree | 274 (77.4%) | 80 (22.6%) |
| Total | 2,381 (68.1%) | 1,115 (31.9%) |
Employment Characteristics in Santa Ana
Employment by Class of Employer in Santa Ana
Among the 151,343 employed individuals in Santa Ana, private company employees (116,811 | 77.2%), self-employed (not incorporated) (9,699 | 6.4%), and local government employees (9,403 | 6.2%) make up the most common classes of employment.
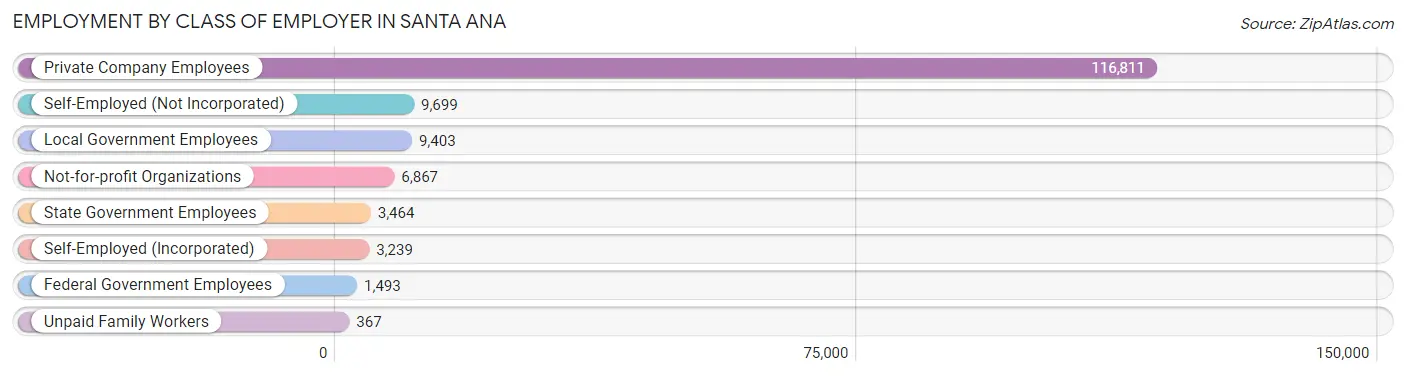
| Employer Class | # Employees | % Employees |
| Private Company Employees | 116,811 | 77.2% |
| Self-Employed (Incorporated) | 3,239 | 2.1% |
| Self-Employed (Not Incorporated) | 9,699 | 6.4% |
| Not-for-profit Organizations | 6,867 | 4.5% |
| Local Government Employees | 9,403 | 6.2% |
| State Government Employees | 3,464 | 2.3% |
| Federal Government Employees | 1,493 | 1.0% |
| Unpaid Family Workers | 367 | 0.2% |
| Total | 151,343 | 100.0% |
Employment Status by Age in Santa Ana
According to the labor force statistics for Santa Ana, out of the total population over 16 years of age (246,018), 66.7% or 164,094 individuals are in the labor force, with 5.5% or 9,025 of them unemployed. The age group with the highest labor force participation rate is 25 to 29 years, with 86.1% or 23,559 individuals in the labor force. Within the labor force, the 16 to 19 years age range has the highest percentage of unemployed individuals, with 15.5% or 1,036 of them being unemployed.
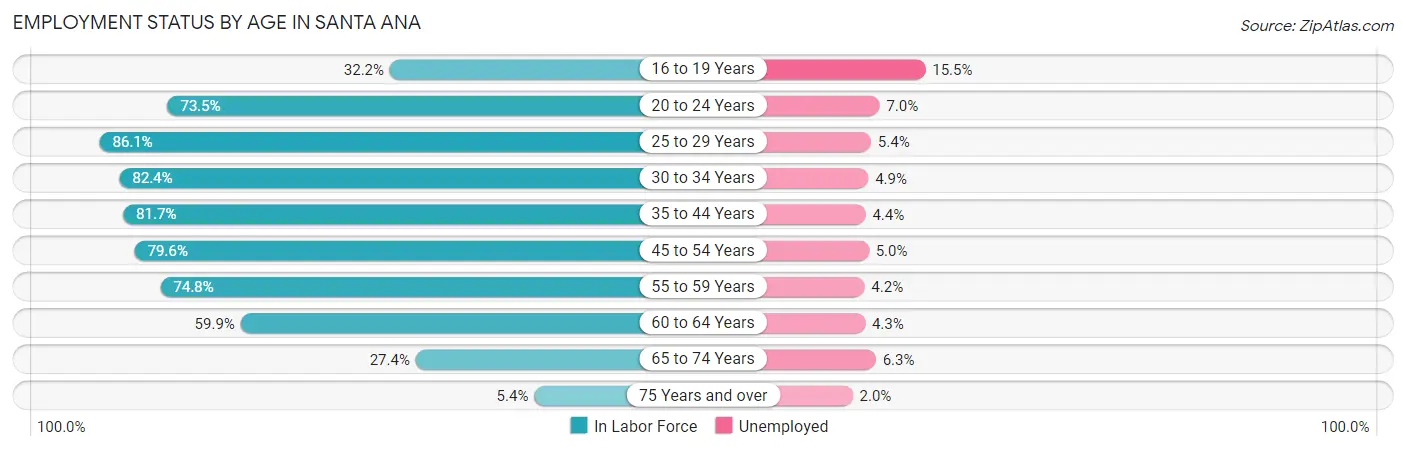
| Age Bracket | In Labor Force | Unemployed |
| 16 to 19 Years | 6,684 (32.2%) | 1,036 (15.5%) |
| 20 to 24 Years | 18,636 (73.5%) | 1,305 (7.0%) |
| 25 to 29 Years | 23,559 (86.1%) | 1,272 (5.4%) |
| 30 to 34 Years | 19,611 (82.4%) | 961 (4.9%) |
| 35 to 44 Years | 36,169 (81.7%) | 1,591 (4.4%) |
| 45 to 54 Years | 31,208 (79.6%) | 1,560 (5.0%) |
| 55 to 59 Years | 13,404 (74.8%) | 563 (4.2%) |
| 60 to 64 Years | 8,568 (59.9%) | 368 (4.3%) |
| 65 to 74 Years | 5,510 (27.4%) | 347 (6.3%) |
| 75 Years and over | 698 (5.4%) | 14 (2.0%) |
| Total | 164,094 (66.7%) | 9,025 (5.5%) |
Employment Status by Educational Attainment in Santa Ana
According to labor force statistics for Santa Ana, 79.4% of individuals (132,489) out of the total population between 25 and 64 years of age (166,863) are in the labor force, with 4.7% or 6,227 of them being unemployed. The group with the highest labor force participation rate are those with the educational attainment of bachelor's degree or higher, with 89.0% or 27,831 individuals in the labor force. Within the labor force, individuals with high school diploma education have the highest percentage of unemployment, with 5.5% or 1,883 of them being unemployed.
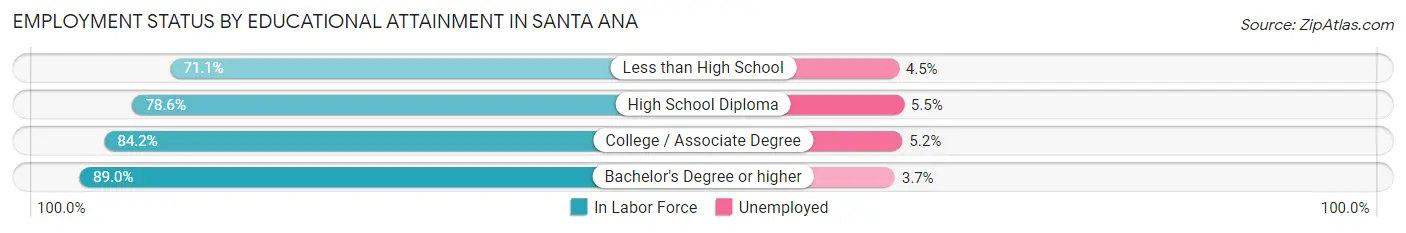
| Educational Attainment | In Labor Force | Unemployed |
| Less than High School | 38,139 (71.1%) | 2,414 (4.5%) |
| High School Diploma | 34,239 (78.6%) | 2,396 (5.5%) |
| College / Associate Degree | 32,324 (84.2%) | 1,996 (5.2%) |
| Bachelor's Degree or higher | 27,831 (89.0%) | 1,157 (3.7%) |
| Total | 132,489 (79.4%) | 7,843 (4.7%) |
Employment Occupations by Sex in Santa Ana
Management, Business, Science and Arts Occupations
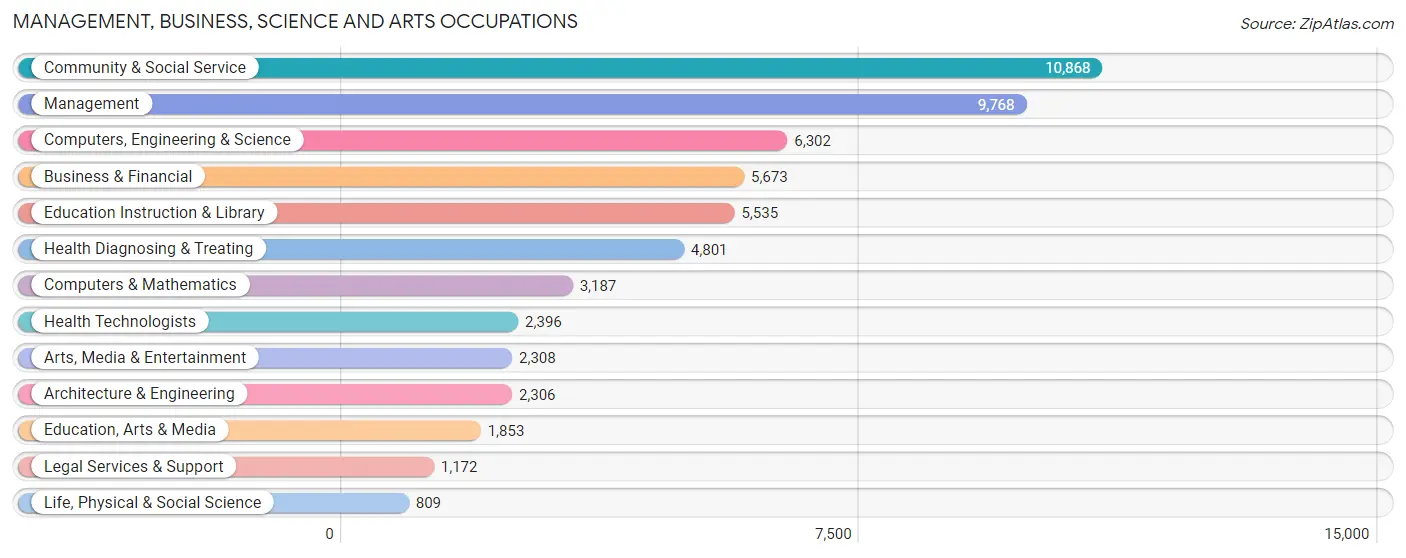
The most common Management, Business, Science and Arts occupations in Santa Ana are Community & Social Service (10,868 | 7.0%), Management (9,768 | 6.3%), Computers, Engineering & Science (6,302 | 4.1%), Business & Financial (5,673 | 3.7%), and Education Instruction & Library (5,535 | 3.6%).
Management, Business, Science and Arts Occupations by Sex
Within the Management, Business, Science and Arts occupations in Santa Ana, the most male-oriented occupations are Architecture & Engineering (85.3%), Computers, Engineering & Science (75.9%), and Computers & Mathematics (75.4%), while the most female-oriented occupations are Education, Arts & Media (68.5%), Health Diagnosing & Treating (68.4%), and Health Technologists (66.8%).
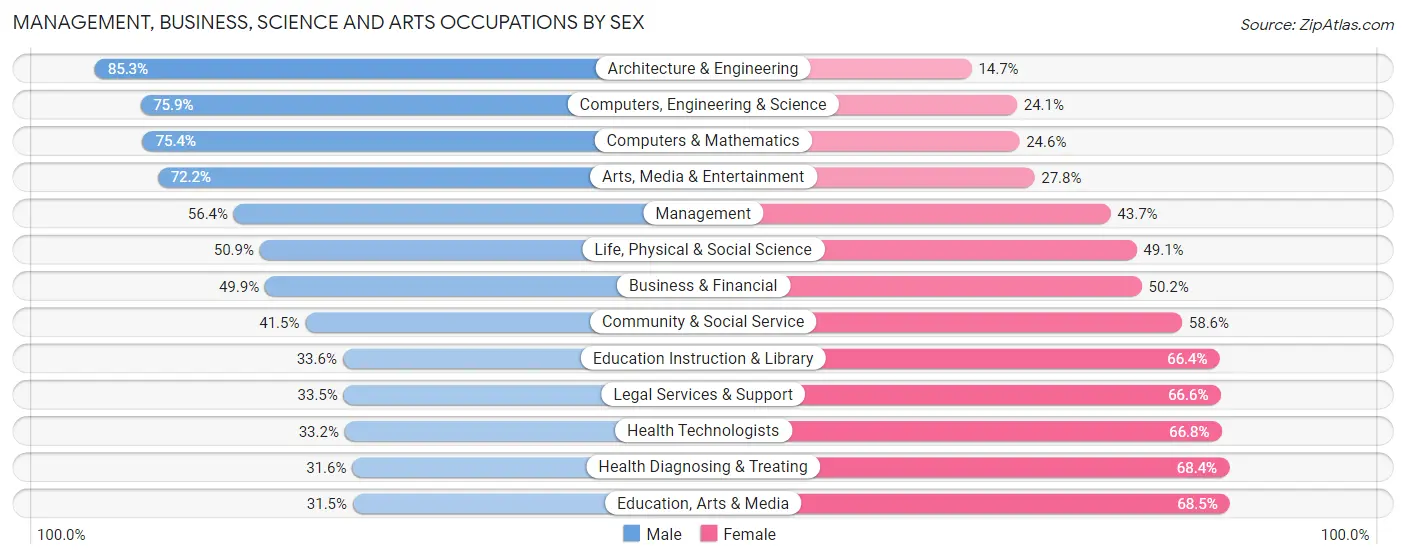
| Occupation | Male | Female |
| Management | 5,504 (56.4%) | 4,264 (43.6%) |
| Business & Financial | 2,828 (49.8%) | 2,845 (50.1%) |
| Computers, Engineering & Science | 4,782 (75.9%) | 1,520 (24.1%) |
| Computers & Mathematics | 2,402 (75.4%) | 785 (24.6%) |
| Architecture & Engineering | 1,968 (85.3%) | 338 (14.7%) |
| Life, Physical & Social Science | 412 (50.9%) | 397 (49.1%) |
| Community & Social Service | 4,505 (41.4%) | 6,363 (58.6%) |
| Education, Arts & Media | 584 (31.5%) | 1,269 (68.5%) |
| Legal Services & Support | 392 (33.5%) | 780 (66.5%) |
| Education Instruction & Library | 1,862 (33.6%) | 3,673 (66.4%) |
| Arts, Media & Entertainment | 1,667 (72.2%) | 641 (27.8%) |
| Health Diagnosing & Treating | 1,519 (31.6%) | 3,282 (68.4%) |
| Health Technologists | 796 (33.2%) | 1,600 (66.8%) |
| Total (Category) | 19,138 (51.1%) | 18,274 (48.8%) |
| Total (Overall) | 88,039 (56.8%) | 66,901 (43.2%) |
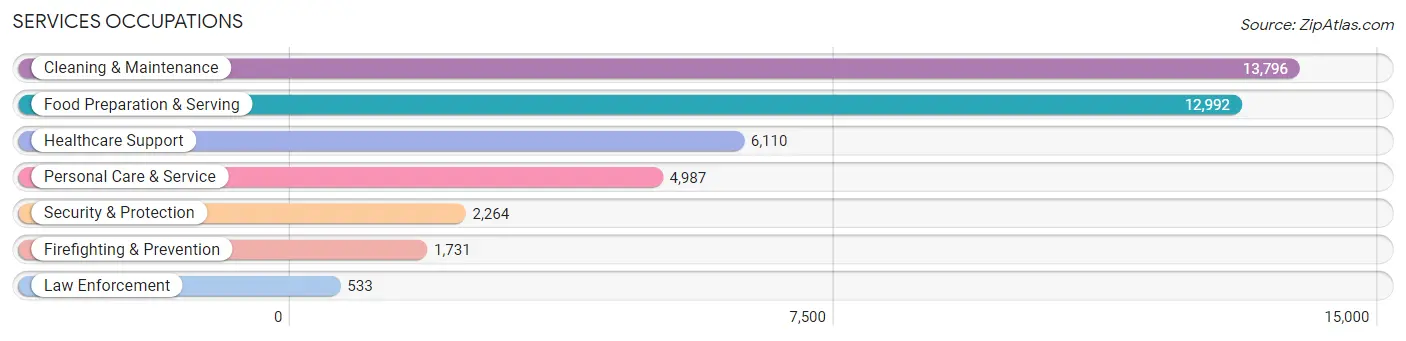
Services Occupations
The most common Services occupations in Santa Ana are Cleaning & Maintenance (13,796 | 8.9%), Food Preparation & Serving (12,992 | 8.4%), Healthcare Support (6,110 | 3.9%), Personal Care & Service (4,987 | 3.2%), and Security & Protection (2,264 | 1.5%).
Services Occupations by Sex
Within the Services occupations in Santa Ana, the most male-oriented occupations are Firefighting & Prevention (78.6%), Security & Protection (76.6%), and Law Enforcement (70.2%), while the most female-oriented occupations are Personal Care & Service (75.5%), Healthcare Support (74.0%), and Cleaning & Maintenance (42.2%).
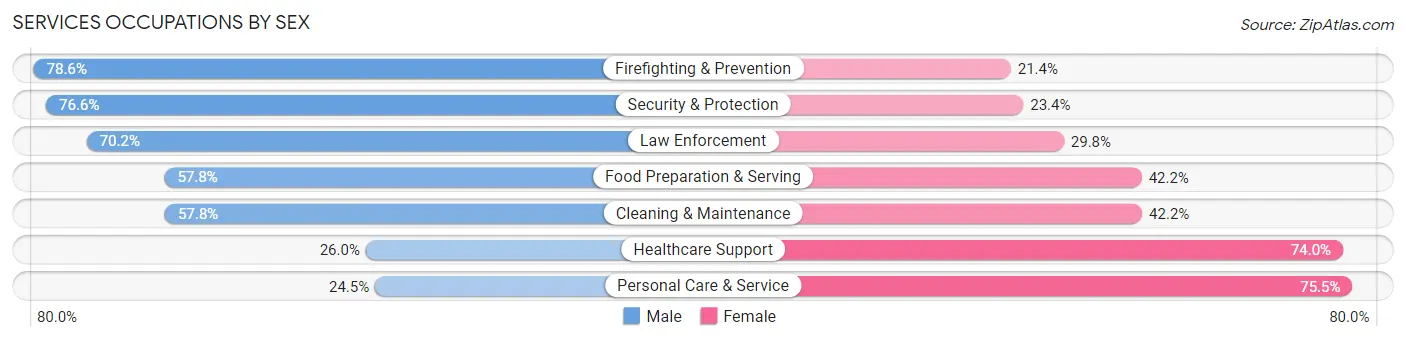
| Occupation | Male | Female |
| Healthcare Support | 1,586 (26.0%) | 4,524 (74.0%) |
| Security & Protection | 1,734 (76.6%) | 530 (23.4%) |
| Firefighting & Prevention | 1,360 (78.6%) | 371 (21.4%) |
| Law Enforcement | 374 (70.2%) | 159 (29.8%) |
| Food Preparation & Serving | 7,515 (57.8%) | 5,477 (42.2%) |
| Cleaning & Maintenance | 7,968 (57.8%) | 5,828 (42.2%) |
| Personal Care & Service | 1,221 (24.5%) | 3,766 (75.5%) |
| Total (Category) | 20,024 (49.9%) | 20,125 (50.1%) |
| Total (Overall) | 88,039 (56.8%) | 66,901 (43.2%) |
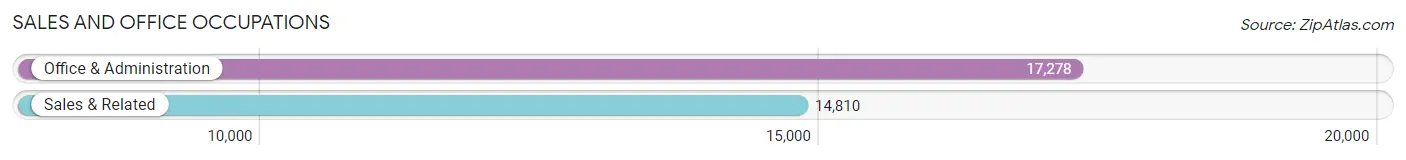
Sales and Office Occupations
The most common Sales and Office occupations in Santa Ana are Office & Administration (17,278 | 11.2%), and Sales & Related (14,810 | 9.6%).
Sales and Office Occupations by Sex
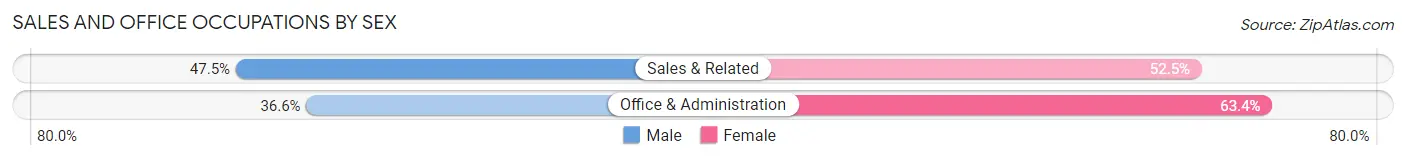
| Occupation | Male | Female |
| Sales & Related | 7,033 (47.5%) | 7,777 (52.5%) |
| Office & Administration | 6,331 (36.6%) | 10,947 (63.4%) |
| Total (Category) | 13,364 (41.6%) | 18,724 (58.4%) |
| Total (Overall) | 88,039 (56.8%) | 66,901 (43.2%) |
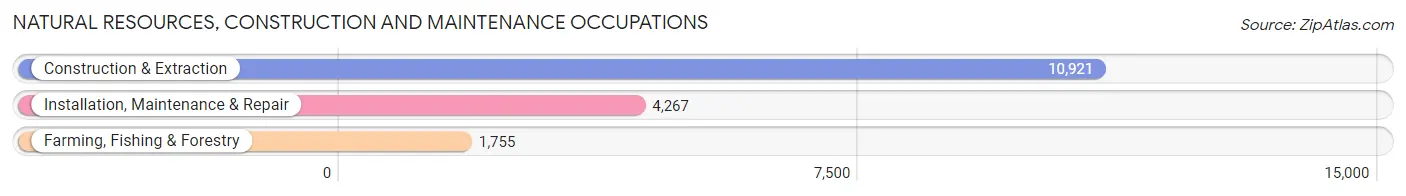
Natural Resources, Construction and Maintenance Occupations
The most common Natural Resources, Construction and Maintenance occupations in Santa Ana are Construction & Extraction (10,921 | 7.0%), Installation, Maintenance & Repair (4,267 | 2.8%), and Farming, Fishing & Forestry (1,755 | 1.1%).
Natural Resources, Construction and Maintenance Occupations by Sex
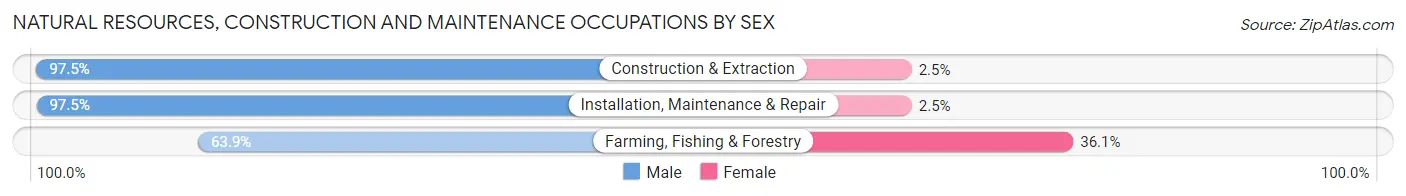
| Occupation | Male | Female |
| Farming, Fishing & Forestry | 1,122 (63.9%) | 633 (36.1%) |
| Construction & Extraction | 10,652 (97.5%) | 269 (2.5%) |
| Installation, Maintenance & Repair | 4,161 (97.5%) | 106 (2.5%) |
| Total (Category) | 15,935 (94.1%) | 1,008 (5.9%) |
| Total (Overall) | 88,039 (56.8%) | 66,901 (43.2%) |
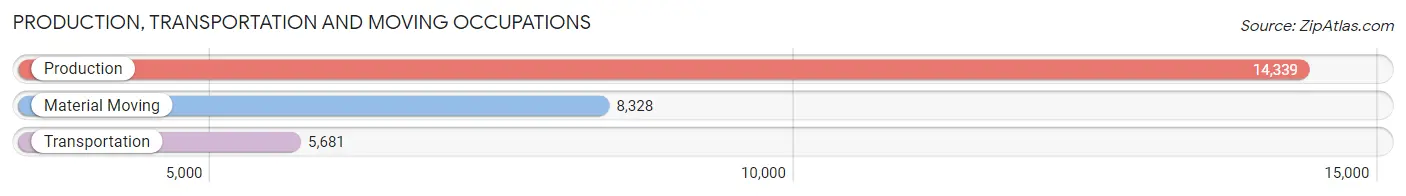
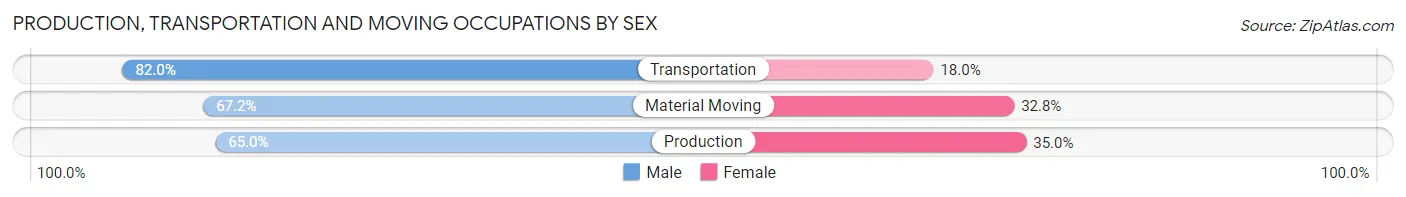
Production, Transportation and Moving Occupations
The most common Production, Transportation and Moving occupations in Santa Ana are Production (14,339 | 9.2%), Material Moving (8,328 | 5.4%), and Transportation (5,681 | 3.7%).
Production, Transportation and Moving Occupations by Sex
| Occupation | Male | Female |
| Production | 9,320 (65.0%) | 5,019 (35.0%) |
| Transportation | 4,660 (82.0%) | 1,021 (18.0%) |
| Material Moving | 5,598 (67.2%) | 2,730 (32.8%) |
| Total (Category) | 19,578 (69.1%) | 8,770 (30.9%) |
| Total (Overall) | 88,039 (56.8%) | 66,901 (43.2%) |
Employment Industries by Sex in Santa Ana
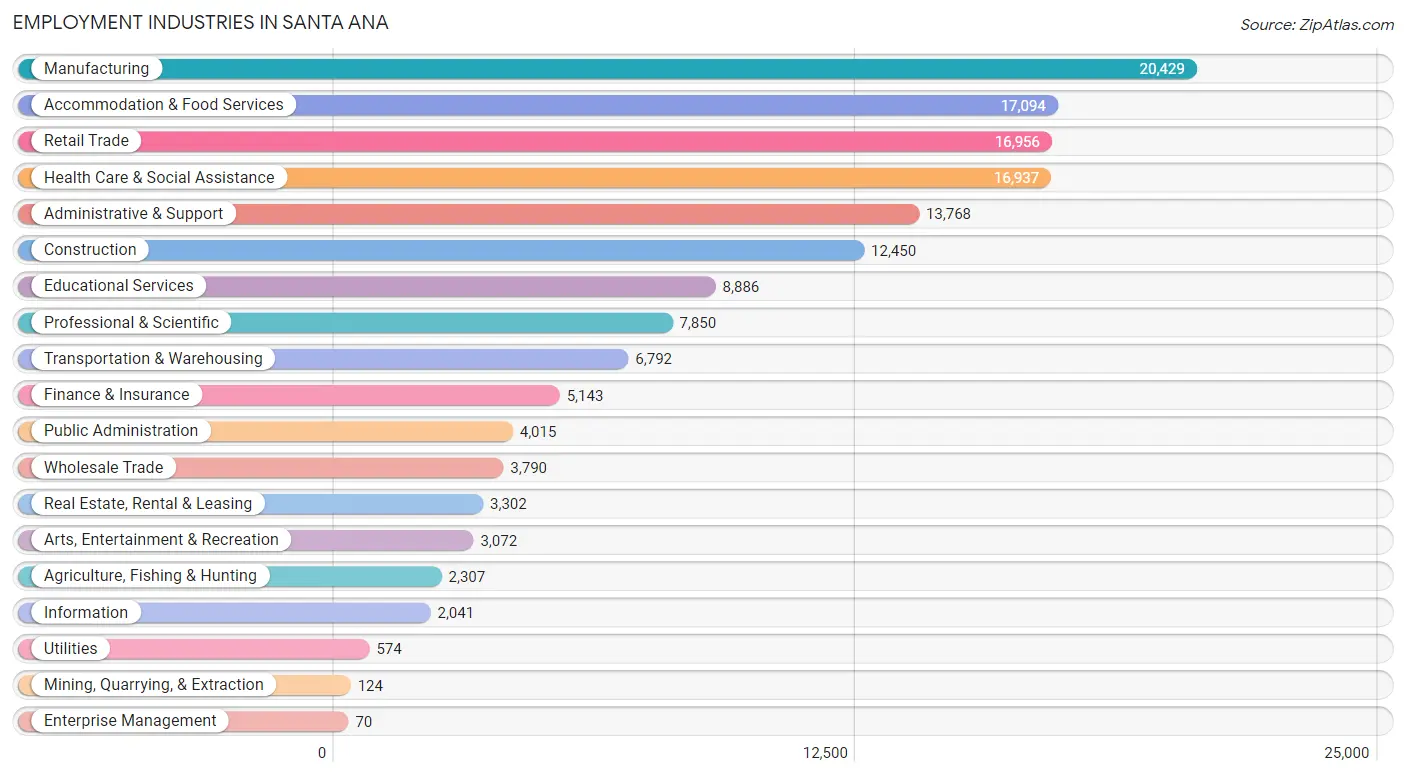
Employment Industries in Santa Ana
The major employment industries in Santa Ana include Manufacturing (20,429 | 13.2%), Accommodation & Food Services (17,094 | 11.0%), Retail Trade (16,956 | 10.9%), Health Care & Social Assistance (16,937 | 10.9%), and Administrative & Support (13,768 | 8.9%).
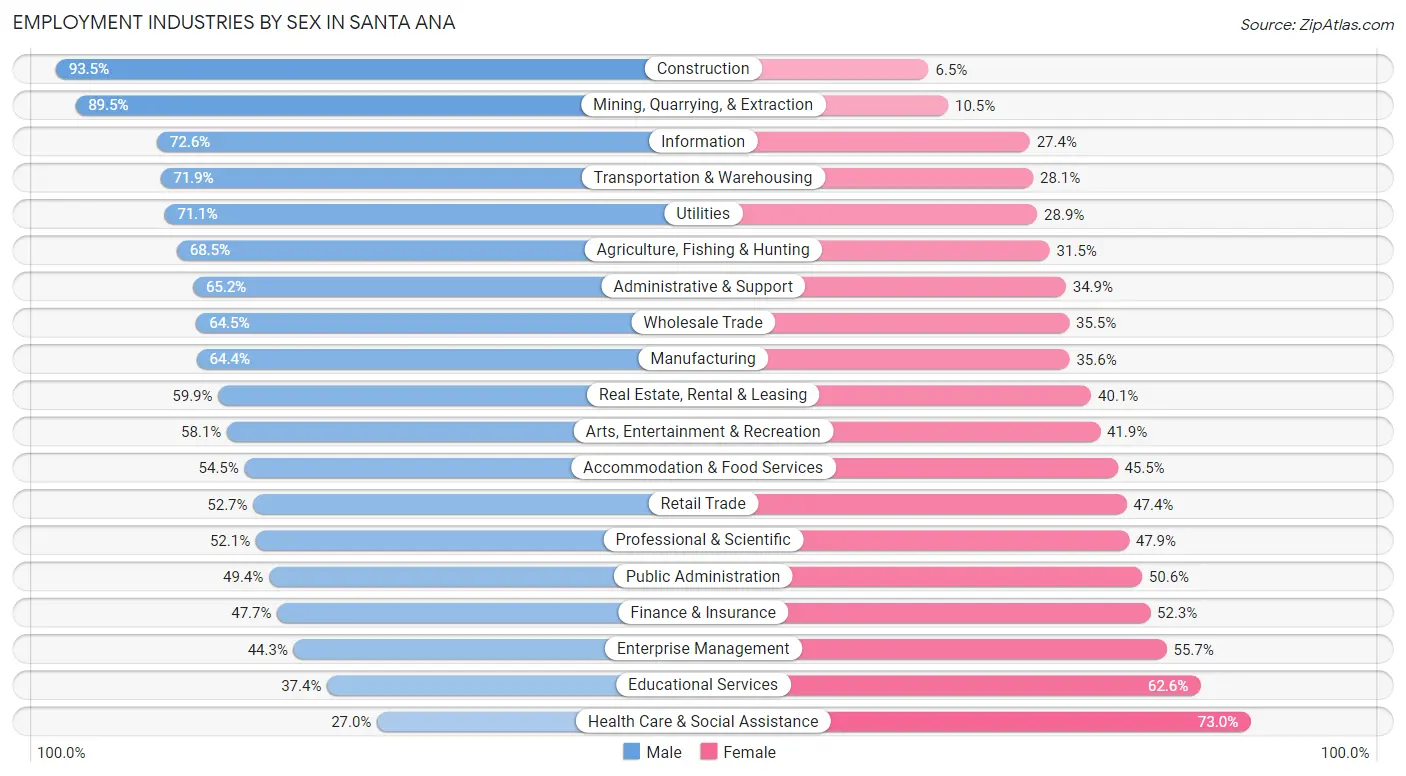
Employment Industries by Sex in Santa Ana
The Santa Ana industries that see more men than women are Construction (93.5%), Mining, Quarrying, & Extraction (89.5%), and Information (72.6%), whereas the industries that tend to have a higher number of women are Health Care & Social Assistance (73.0%), Educational Services (62.6%), and Enterprise Management (55.7%).
| Industry | Male | Female |
| Agriculture, Fishing & Hunting | 1,580 (68.5%) | 727 (31.5%) |
| Mining, Quarrying, & Extraction | 111 (89.5%) | 13 (10.5%) |
| Construction | 11,646 (93.5%) | 804 (6.5%) |
| Manufacturing | 13,152 (64.4%) | 7,277 (35.6%) |
| Wholesale Trade | 2,443 (64.5%) | 1,347 (35.5%) |
| Retail Trade | 8,928 (52.6%) | 8,028 (47.3%) |
| Transportation & Warehousing | 4,884 (71.9%) | 1,908 (28.1%) |
| Utilities | 408 (71.1%) | 166 (28.9%) |
| Information | 1,482 (72.6%) | 559 (27.4%) |
| Finance & Insurance | 2,453 (47.7%) | 2,690 (52.3%) |
| Real Estate, Rental & Leasing | 1,978 (59.9%) | 1,324 (40.1%) |
| Professional & Scientific | 4,091 (52.1%) | 3,759 (47.9%) |
| Enterprise Management | 31 (44.3%) | 39 (55.7%) |
| Administrative & Support | 8,970 (65.1%) | 4,798 (34.8%) |
| Educational Services | 3,320 (37.4%) | 5,566 (62.6%) |
| Health Care & Social Assistance | 4,576 (27.0%) | 12,361 (73.0%) |
| Arts, Entertainment & Recreation | 1,784 (58.1%) | 1,288 (41.9%) |
| Accommodation & Food Services | 9,309 (54.5%) | 7,785 (45.5%) |
| Public Administration | 1,983 (49.4%) | 2,032 (50.6%) |
| Total | 88,039 (56.8%) | 66,901 (43.2%) |
Education in Santa Ana
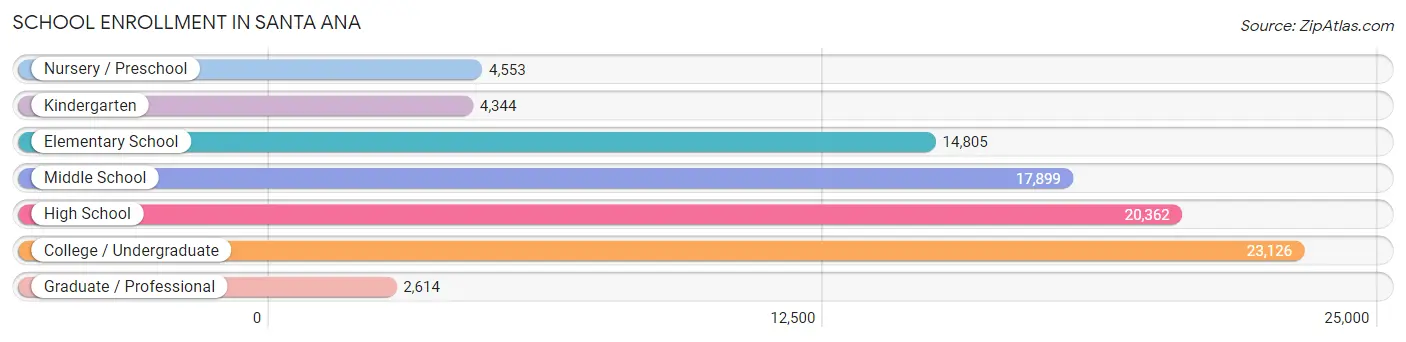
School Enrollment in Santa Ana
The most common levels of schooling among the 87,703 students in Santa Ana are college / undergraduate (23,126 | 26.4%), high school (20,362 | 23.2%), and middle school (17,899 | 20.4%).
| School Level | # Students | % Students |
| Nursery / Preschool | 4,553 | 5.2% |
| Kindergarten | 4,344 | 5.0% |
| Elementary School | 14,805 | 16.9% |
| Middle School | 17,899 | 20.4% |
| High School | 20,362 | 23.2% |
| College / Undergraduate | 23,126 | 26.4% |
| Graduate / Professional | 2,614 | 3.0% |
| Total | 87,703 | 100.0% |
School Enrollment by Age by Funding Source in Santa Ana
Out of a total of 87,703 students who are enrolled in schools in Santa Ana, 6,929 (7.9%) attend a private institution, while the remaining 80,774 (92.1%) are enrolled in public schools. The age group of 35 years and over has the highest likelihood of being enrolled in private schools, with 920 (25.8% in the age bracket) enrolled. Conversely, the age group of 18 to 19 year olds has the lowest likelihood of being enrolled in a private school, with 7,847 (96.9% in the age bracket) attending a public institution.
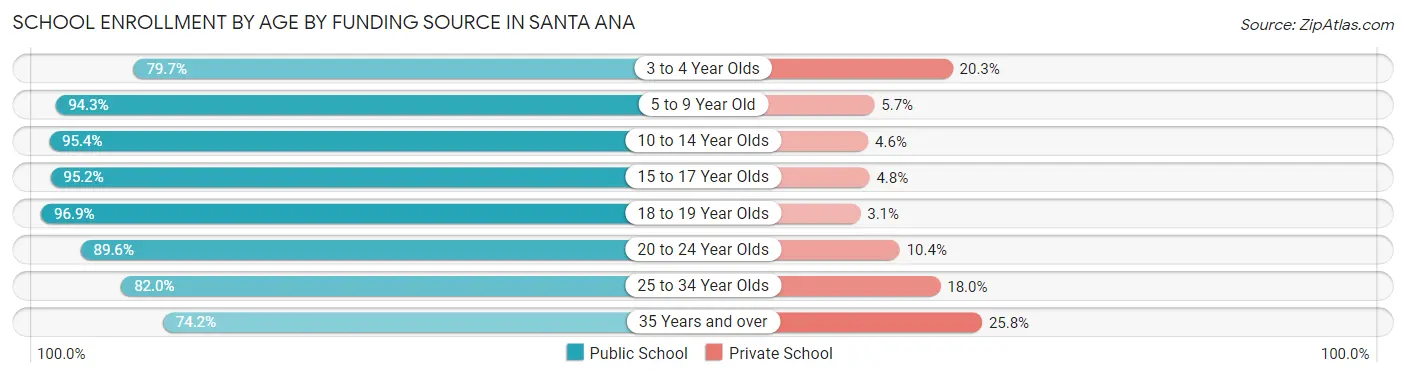
| Age Bracket | Public School | Private School |
| 3 to 4 Year Olds | 2,947 (79.7%) | 750 (20.3%) |
| 5 to 9 Year Old | 17,406 (94.3%) | 1,055 (5.7%) |
| 10 to 14 Year Olds | 21,543 (95.4%) | 1,030 (4.6%) |
| 15 to 17 Year Olds | 13,080 (95.2%) | 660 (4.8%) |
| 18 to 19 Year Olds | 7,847 (96.9%) | 250 (3.1%) |
| 20 to 24 Year Olds | 10,325 (89.6%) | 1,204 (10.4%) |
| 25 to 34 Year Olds | 4,949 (82.0%) | 1,086 (18.0%) |
| 35 Years and over | 2,651 (74.2%) | 920 (25.8%) |
| Total | 80,774 (92.1%) | 6,929 (7.9%) |
Educational Attainment by Field of Study in Santa Ana
Business (7,746 | 20.4%), social sciences (3,643 | 9.6%), arts & humanities (3,256 | 8.6%), science & technology (3,178 | 8.4%), and engineering (2,914 | 7.7%) are the most common fields of study among 37,978 individuals in Santa Ana who have obtained a bachelor's degree or higher.
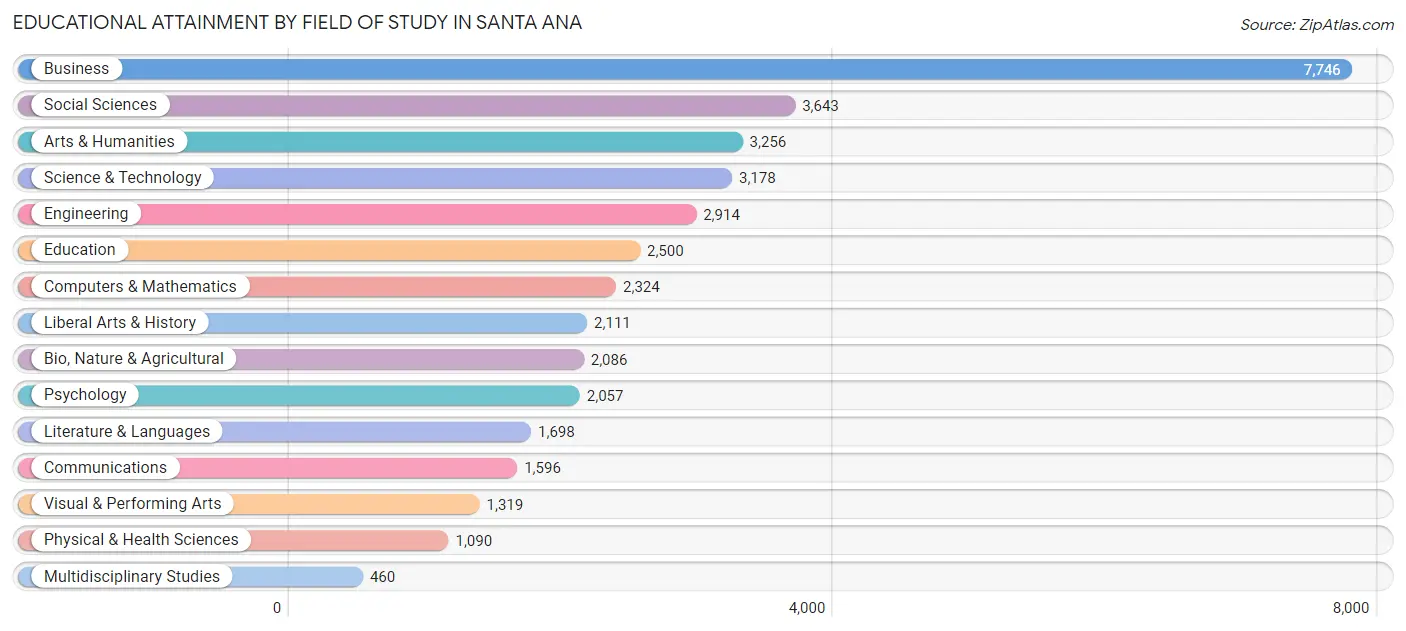
| Field of Study | # Graduates | % Graduates |
| Computers & Mathematics | 2,324 | 6.1% |
| Bio, Nature & Agricultural | 2,086 | 5.5% |
| Physical & Health Sciences | 1,090 | 2.9% |
| Psychology | 2,057 | 5.4% |
| Social Sciences | 3,643 | 9.6% |
| Engineering | 2,914 | 7.7% |
| Multidisciplinary Studies | 460 | 1.2% |
| Science & Technology | 3,178 | 8.4% |
| Business | 7,746 | 20.4% |
| Education | 2,500 | 6.6% |
| Literature & Languages | 1,698 | 4.5% |
| Liberal Arts & History | 2,111 | 5.6% |
| Visual & Performing Arts | 1,319 | 3.5% |
| Communications | 1,596 | 4.2% |
| Arts & Humanities | 3,256 | 8.6% |
| Total | 37,978 | 100.0% |
Transportation & Commute in Santa Ana
Vehicle Availability by Sex in Santa Ana
The most prevalent vehicle ownership categories in Santa Ana are males with 2 vehicles (27,019, accounting for 31.4%) and females with 2 vehicles (20,992, making up 41.7%).
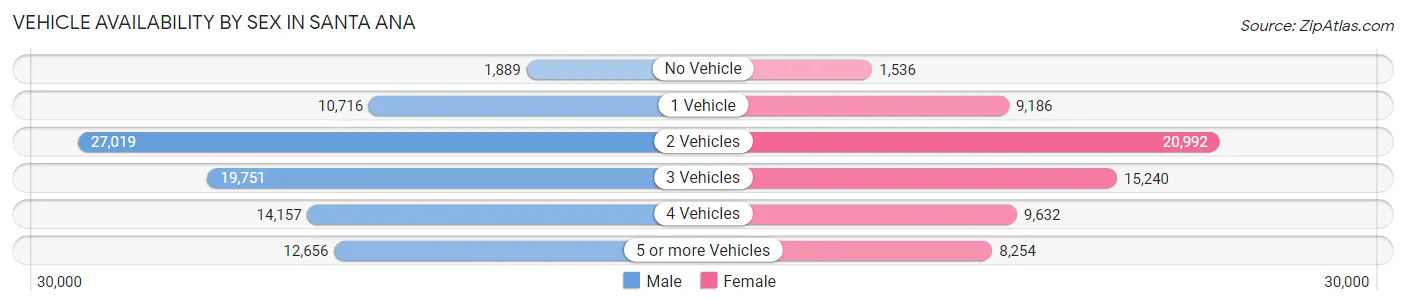
| Vehicles Available | Male | Female |
| No Vehicle | 1,889 (2.2%) | 1,536 (2.4%) |
| 1 Vehicle | 10,716 (12.4%) | 9,186 (14.2%) |
| 2 Vehicles | 27,019 (31.4%) | 20,992 (32.4%) |
| 3 Vehicles | 19,751 (22.9%) | 15,240 (23.5%) |
| 4 Vehicles | 14,157 (16.4%) | 9,632 (14.9%) |
| 5 or more Vehicles | 12,656 (14.7%) | 8,254 (12.7%) |
| Total | 86,188 (100.0%) | 64,840 (100.0%) |
Commute Time in Santa Ana
The most frequently occuring commute durations in Santa Ana are 15 to 19 minutes (28,563 commuters, 20.5%), 20 to 24 minutes (27,392 commuters, 19.7%), and 30 to 34 minutes (25,539 commuters, 18.3%).
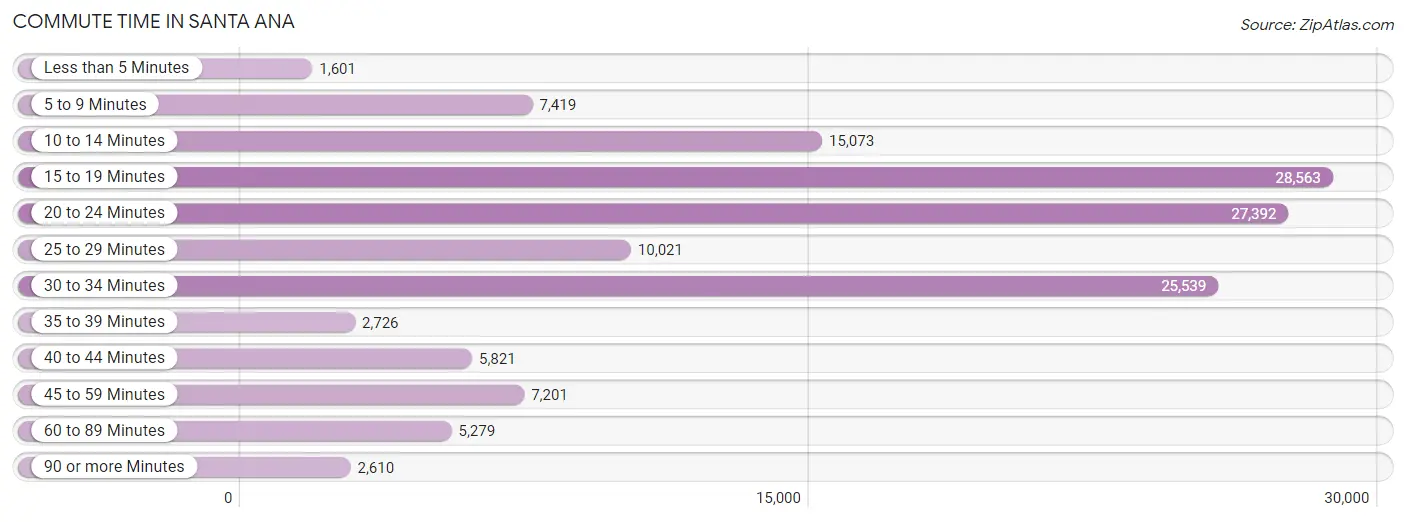
| Commute Time | # Commuters | % Commuters |
| Less than 5 Minutes | 1,601 | 1.1% |
| 5 to 9 Minutes | 7,419 | 5.3% |
| 10 to 14 Minutes | 15,073 | 10.8% |
| 15 to 19 Minutes | 28,563 | 20.5% |
| 20 to 24 Minutes | 27,392 | 19.7% |
| 25 to 29 Minutes | 10,021 | 7.2% |
| 30 to 34 Minutes | 25,539 | 18.3% |
| 35 to 39 Minutes | 2,726 | 2.0% |
| 40 to 44 Minutes | 5,821 | 4.2% |
| 45 to 59 Minutes | 7,201 | 5.2% |
| 60 to 89 Minutes | 5,279 | 3.8% |
| 90 or more Minutes | 2,610 | 1.9% |
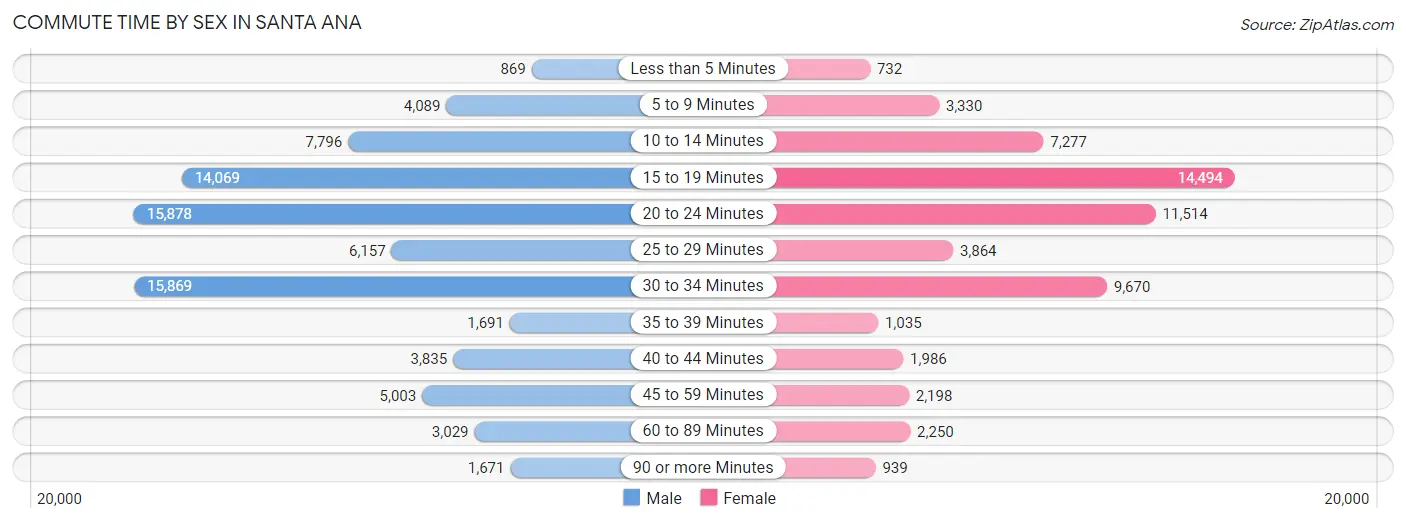
Commute Time by Sex in Santa Ana
The most common commute times in Santa Ana are 20 to 24 minutes (15,878 commuters, 19.9%) for males and 15 to 19 minutes (14,494 commuters, 24.4%) for females.
| Commute Time | Male | Female |
| Less than 5 Minutes | 869 (1.1%) | 732 (1.2%) |
| 5 to 9 Minutes | 4,089 (5.1%) | 3,330 (5.6%) |
| 10 to 14 Minutes | 7,796 (9.8%) | 7,277 (12.3%) |
| 15 to 19 Minutes | 14,069 (17.6%) | 14,494 (24.4%) |
| 20 to 24 Minutes | 15,878 (19.9%) | 11,514 (19.4%) |
| 25 to 29 Minutes | 6,157 (7.7%) | 3,864 (6.5%) |
| 30 to 34 Minutes | 15,869 (19.9%) | 9,670 (16.3%) |
| 35 to 39 Minutes | 1,691 (2.1%) | 1,035 (1.8%) |
| 40 to 44 Minutes | 3,835 (4.8%) | 1,986 (3.4%) |
| 45 to 59 Minutes | 5,003 (6.3%) | 2,198 (3.7%) |
| 60 to 89 Minutes | 3,029 (3.8%) | 2,250 (3.8%) |
| 90 or more Minutes | 1,671 (2.1%) | 939 (1.6%) |
Time of Departure to Work by Sex in Santa Ana
The most frequent times of departure to work in Santa Ana are 7:00 AM to 7:29 AM (10,015, 12.5%) for males and 7:00 AM to 7:29 AM (7,710, 13.0%) for females.
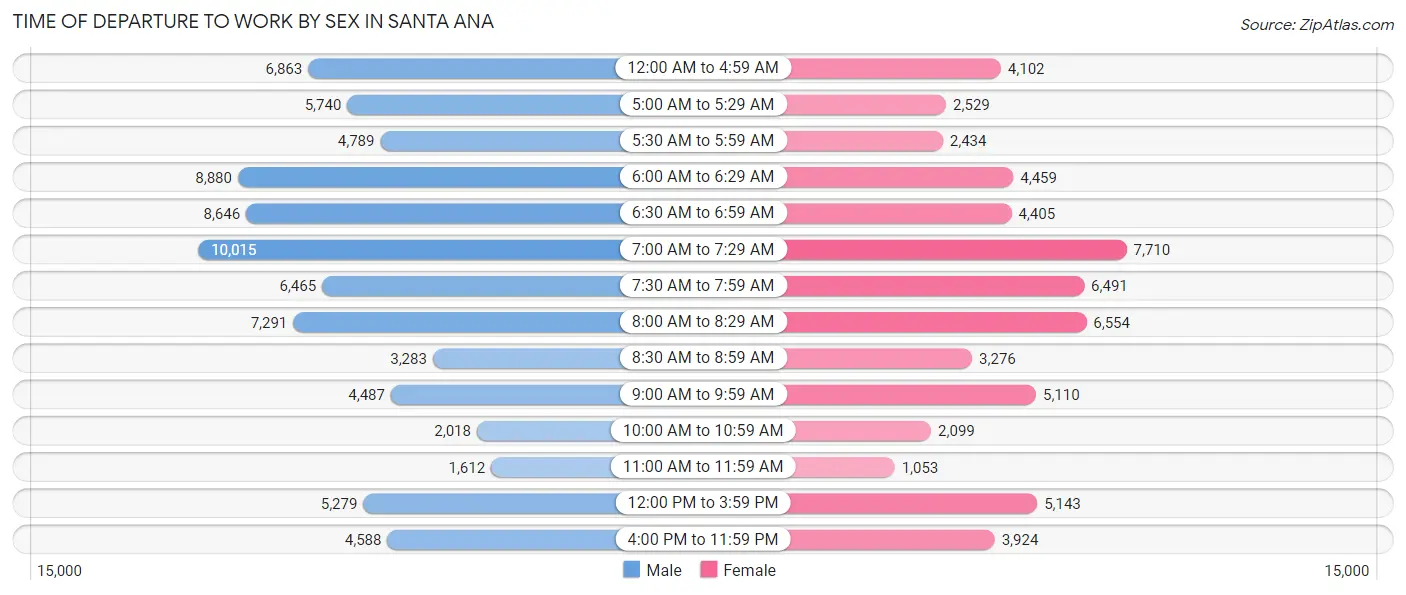
| Time of Departure | Male | Female |
| 12:00 AM to 4:59 AM | 6,863 (8.6%) | 4,102 (6.9%) |
| 5:00 AM to 5:29 AM | 5,740 (7.2%) | 2,529 (4.3%) |
| 5:30 AM to 5:59 AM | 4,789 (6.0%) | 2,434 (4.1%) |
| 6:00 AM to 6:29 AM | 8,880 (11.1%) | 4,459 (7.5%) |
| 6:30 AM to 6:59 AM | 8,646 (10.8%) | 4,405 (7.4%) |
| 7:00 AM to 7:29 AM | 10,015 (12.5%) | 7,710 (13.0%) |
| 7:30 AM to 7:59 AM | 6,465 (8.1%) | 6,491 (11.0%) |
| 8:00 AM to 8:29 AM | 7,291 (9.1%) | 6,554 (11.1%) |
| 8:30 AM to 8:59 AM | 3,283 (4.1%) | 3,276 (5.5%) |
| 9:00 AM to 9:59 AM | 4,487 (5.6%) | 5,110 (8.6%) |
| 10:00 AM to 10:59 AM | 2,018 (2.5%) | 2,099 (3.5%) |
| 11:00 AM to 11:59 AM | 1,612 (2.0%) | 1,053 (1.8%) |
| 12:00 PM to 3:59 PM | 5,279 (6.6%) | 5,143 (8.7%) |
| 4:00 PM to 11:59 PM | 4,588 (5.7%) | 3,924 (6.6%) |
| Total | 79,956 (100.0%) | 59,289 (100.0%) |
Housing Occupancy in Santa Ana
Occupancy by Ownership in Santa Ana
Of the total 77,553 dwellings in Santa Ana, owner-occupied units account for 34,749 (44.8%), while renter-occupied units make up 42,804 (55.2%).
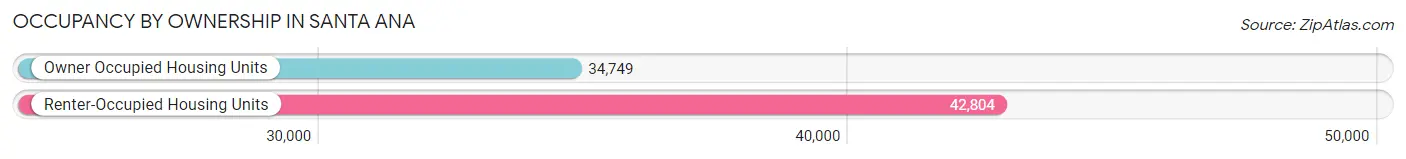
| Occupancy | # Housing Units | % Housing Units |
| Owner Occupied Housing Units | 34,749 | 44.8% |
| Renter-Occupied Housing Units | 42,804 | 55.2% |
| Total Occupied Housing Units | 77,553 | 100.0% |
Occupancy by Household Size in Santa Ana
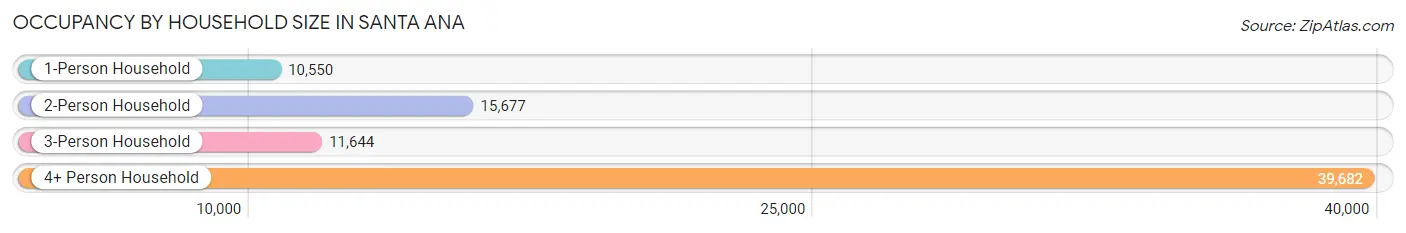
| Household Size | # Housing Units | % Housing Units |
| 1-Person Household | 10,550 | 13.6% |
| 2-Person Household | 15,677 | 20.2% |
| 3-Person Household | 11,644 | 15.0% |
| 4+ Person Household | 39,682 | 51.2% |
| Total Housing Units | 77,553 | 100.0% |
Occupancy by Ownership by Household Size in Santa Ana
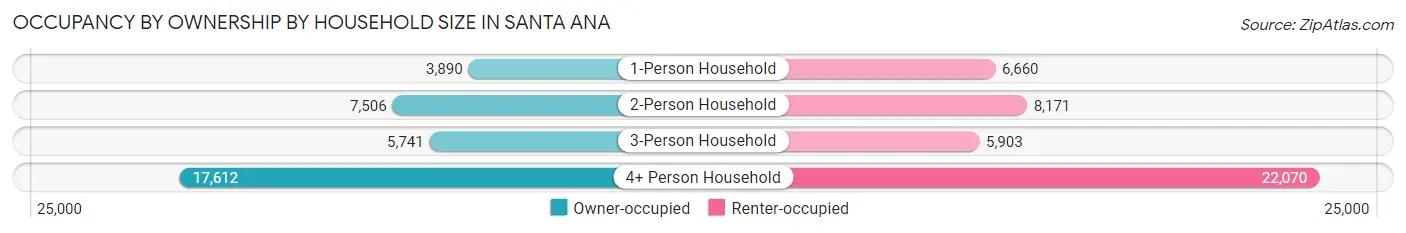
| Household Size | Owner-occupied | Renter-occupied |
| 1-Person Household | 3,890 (36.9%) | 6,660 (63.1%) |
| 2-Person Household | 7,506 (47.9%) | 8,171 (52.1%) |
| 3-Person Household | 5,741 (49.3%) | 5,903 (50.7%) |
| 4+ Person Household | 17,612 (44.4%) | 22,070 (55.6%) |
| Total Housing Units | 34,749 (44.8%) | 42,804 (55.2%) |
Occupancy by Educational Attainment in Santa Ana
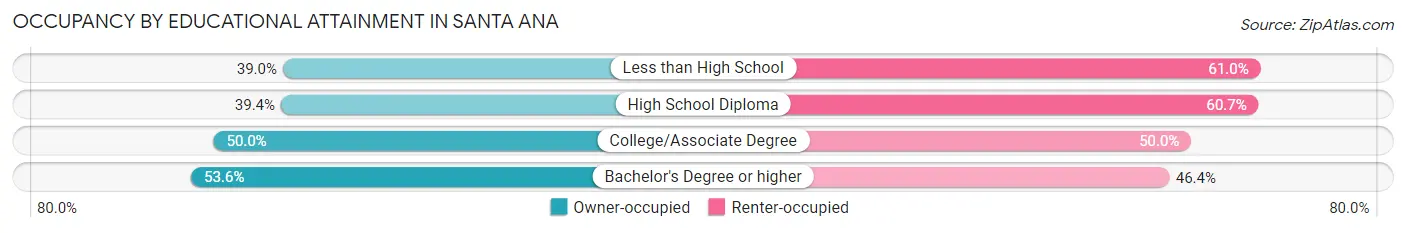
| Household Size | Owner-occupied | Renter-occupied |
| Less than High School | 9,937 (39.0%) | 15,515 (61.0%) |
| High School Diploma | 6,794 (39.4%) | 10,471 (60.7%) |
| College/Associate Degree | 9,181 (50.0%) | 9,165 (50.0%) |
| Bachelor's Degree or higher | 8,837 (53.6%) | 7,653 (46.4%) |
Occupancy by Age of Householder in Santa Ana
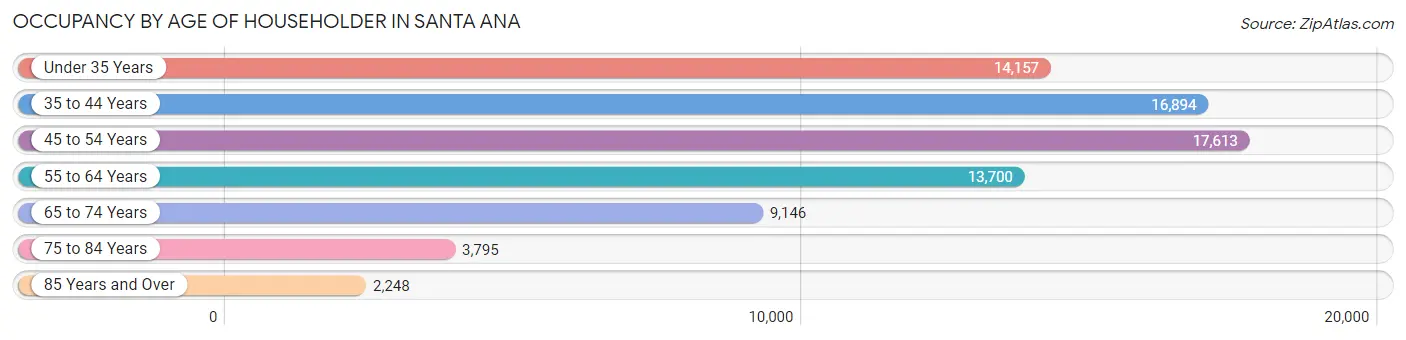
| Age Bracket | # Households | % Households |
| Under 35 Years | 14,157 | 18.2% |
| 35 to 44 Years | 16,894 | 21.8% |
| 45 to 54 Years | 17,613 | 22.7% |
| 55 to 64 Years | 13,700 | 17.7% |
| 65 to 74 Years | 9,146 | 11.8% |
| 75 to 84 Years | 3,795 | 4.9% |
| 85 Years and Over | 2,248 | 2.9% |
| Total | 77,553 | 100.0% |
Housing Finances in Santa Ana
Median Income by Occupancy in Santa Ana
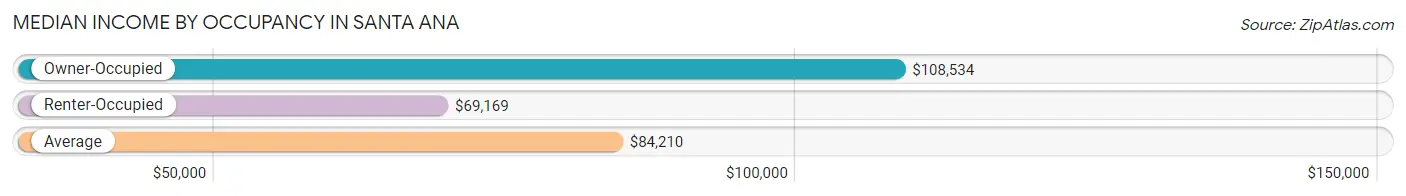
| Occupancy Type | # Households | Median Income |
| Owner-Occupied | 34,749 (44.8%) | $108,534 |
| Renter-Occupied | 42,804 (55.2%) | $69,169 |
| Average | 77,553 (100.0%) | $84,210 |
Occupancy by Householder Income Bracket in Santa Ana
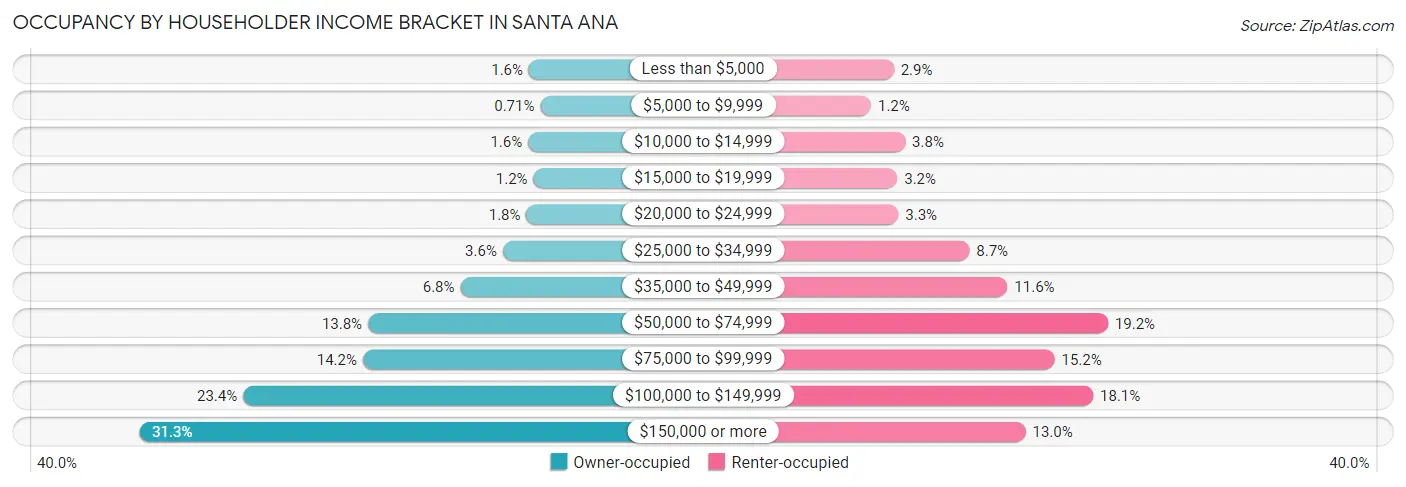
| Income Bracket | Owner-occupied | Renter-occupied |
| Less than $5,000 | 549 (1.6%) | 1,245 (2.9%) |
| $5,000 to $9,999 | 246 (0.7%) | 504 (1.2%) |
| $10,000 to $14,999 | 570 (1.6%) | 1,620 (3.8%) |
| $15,000 to $19,999 | 428 (1.2%) | 1,363 (3.2%) |
| $20,000 to $24,999 | 616 (1.8%) | 1,394 (3.3%) |
| $25,000 to $34,999 | 1,239 (3.6%) | 3,713 (8.7%) |
| $35,000 to $49,999 | 2,362 (6.8%) | 4,952 (11.6%) |
| $50,000 to $74,999 | 4,808 (13.8%) | 8,230 (19.2%) |
| $75,000 to $99,999 | 4,944 (14.2%) | 6,490 (15.2%) |
| $100,000 to $149,999 | 8,116 (23.4%) | 7,748 (18.1%) |
| $150,000 or more | 10,871 (31.3%) | 5,545 (13.0%) |
| Total | 34,749 (100.0%) | 42,804 (100.0%) |
Monthly Housing Cost Tiers in Santa Ana
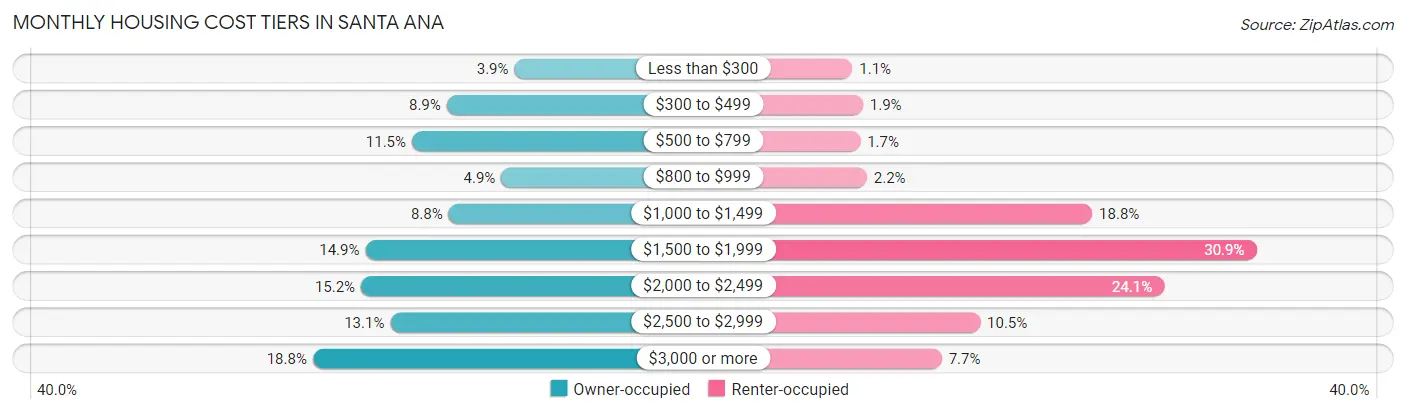
| Monthly Cost | Owner-occupied | Renter-occupied |
| Less than $300 | 1,365 (3.9%) | 471 (1.1%) |
| $300 to $499 | 3,099 (8.9%) | 799 (1.9%) |
| $500 to $799 | 3,990 (11.5%) | 719 (1.7%) |
| $800 to $999 | 1,701 (4.9%) | 927 (2.2%) |
| $1,000 to $1,499 | 3,052 (8.8%) | 8,028 (18.8%) |
| $1,500 to $1,999 | 5,182 (14.9%) | 13,206 (30.8%) |
| $2,000 to $2,499 | 5,292 (15.2%) | 10,293 (24.0%) |
| $2,500 to $2,999 | 4,541 (13.1%) | 4,499 (10.5%) |
| $3,000 or more | 6,527 (18.8%) | 3,286 (7.7%) |
| Total | 34,749 (100.0%) | 42,804 (100.0%) |
Physical Housing Characteristics in Santa Ana
Housing Structures in Santa Ana
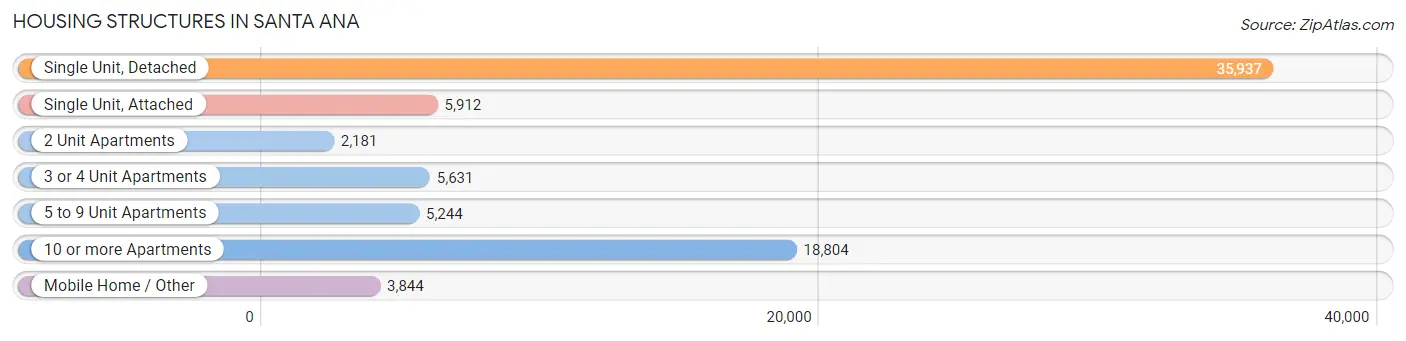
| Structure Type | # Housing Units | % Housing Units |
| Single Unit, Detached | 35,937 | 46.3% |
| Single Unit, Attached | 5,912 | 7.6% |
| 2 Unit Apartments | 2,181 | 2.8% |
| 3 or 4 Unit Apartments | 5,631 | 7.3% |
| 5 to 9 Unit Apartments | 5,244 | 6.8% |
| 10 or more Apartments | 18,804 | 24.2% |
| Mobile Home / Other | 3,844 | 5.0% |
| Total | 77,553 | 100.0% |
Housing Structures by Occupancy in Santa Ana
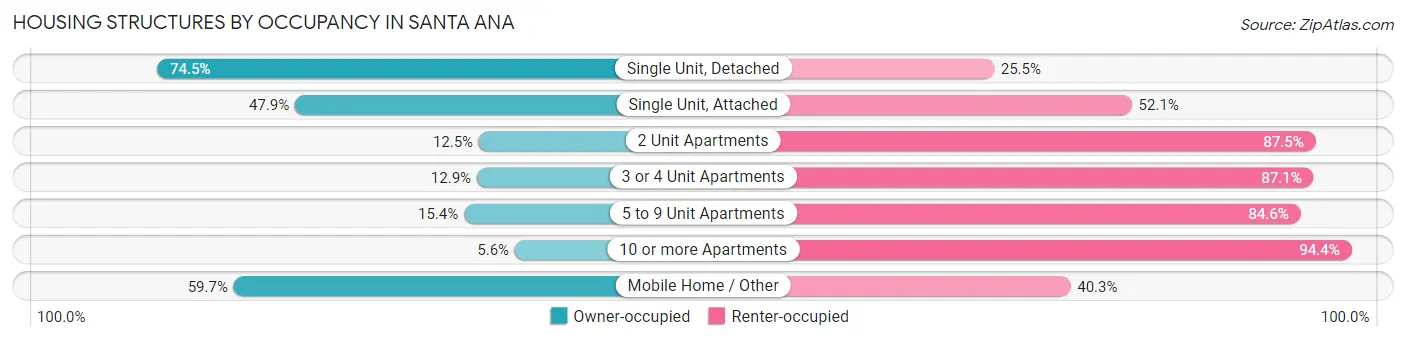
| Structure Type | Owner-occupied | Renter-occupied |
| Single Unit, Detached | 26,761 (74.5%) | 9,176 (25.5%) |
| Single Unit, Attached | 2,833 (47.9%) | 3,079 (52.1%) |
| 2 Unit Apartments | 273 (12.5%) | 1,908 (87.5%) |
| 3 or 4 Unit Apartments | 727 (12.9%) | 4,904 (87.1%) |
| 5 to 9 Unit Apartments | 807 (15.4%) | 4,437 (84.6%) |
| 10 or more Apartments | 1,052 (5.6%) | 17,752 (94.4%) |
| Mobile Home / Other | 2,296 (59.7%) | 1,548 (40.3%) |
| Total | 34,749 (44.8%) | 42,804 (55.2%) |
Housing Structures by Number of Rooms in Santa Ana
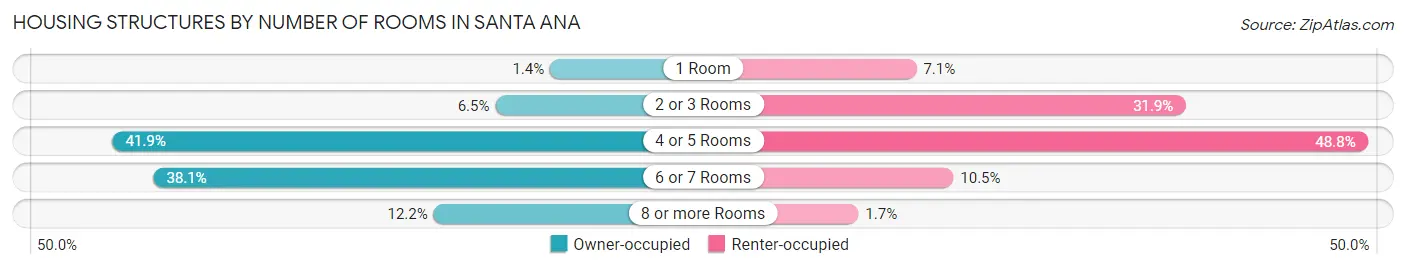
| Number of Rooms | Owner-occupied | Renter-occupied |
| 1 Room | 488 (1.4%) | 3,029 (7.1%) |
| 2 or 3 Rooms | 2,249 (6.5%) | 13,666 (31.9%) |
| 4 or 5 Rooms | 14,548 (41.9%) | 20,885 (48.8%) |
| 6 or 7 Rooms | 13,233 (38.1%) | 4,490 (10.5%) |
| 8 or more Rooms | 4,231 (12.2%) | 734 (1.7%) |
| Total | 34,749 (100.0%) | 42,804 (100.0%) |
Housing Structure by Heating Type in Santa Ana
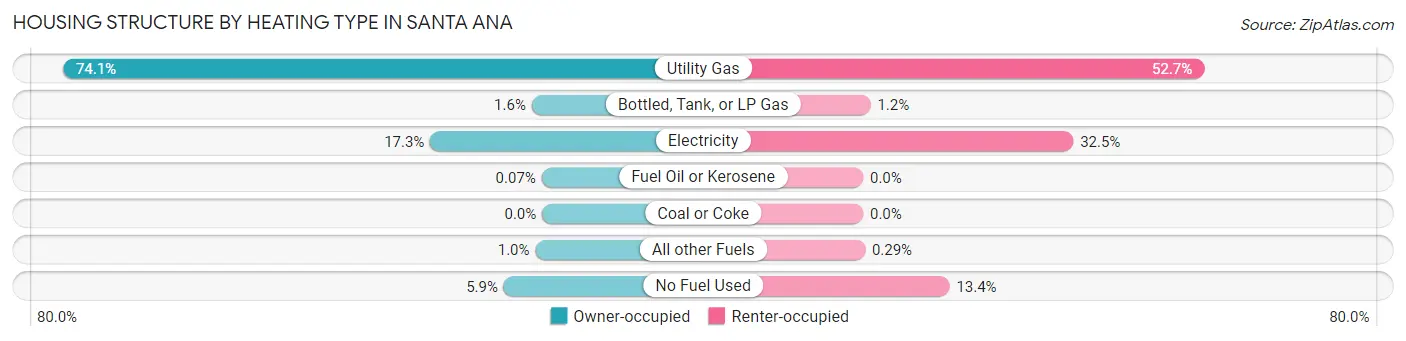
| Heating Type | Owner-occupied | Renter-occupied |
| Utility Gas | 25,738 (74.1%) | 22,561 (52.7%) |
| Bottled, Tank, or LP Gas | 557 (1.6%) | 494 (1.1%) |
| Electricity | 6,010 (17.3%) | 13,907 (32.5%) |
| Fuel Oil or Kerosene | 24 (0.1%) | 0 (0.0%) |
| Coal or Coke | 0 (0.0%) | 0 (0.0%) |
| All other Fuels | 362 (1.0%) | 124 (0.3%) |
| No Fuel Used | 2,058 (5.9%) | 5,718 (13.4%) |
| Total | 34,749 (100.0%) | 42,804 (100.0%) |
Household Vehicle Usage in Santa Ana
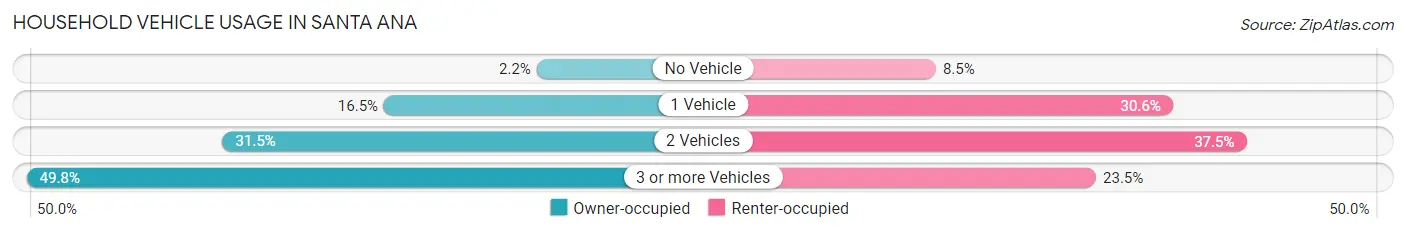
| Vehicles per Household | Owner-occupied | Renter-occupied |
| No Vehicle | 765 (2.2%) | 3,639 (8.5%) |
| 1 Vehicle | 5,720 (16.5%) | 13,095 (30.6%) |
| 2 Vehicles | 10,957 (31.5%) | 16,033 (37.5%) |
| 3 or more Vehicles | 17,307 (49.8%) | 10,037 (23.4%) |
| Total | 34,749 (100.0%) | 42,804 (100.0%) |
Real Estate & Mortgages in Santa Ana
Real Estate and Mortgage Overview in Santa Ana
| Characteristic | Without Mortgage | With Mortgage |
| Housing Units | 11,081 | 23,668 |
| Median Property Value | $584,400 | $641,500 |
| Median Household Income | $86,338 | $8,518 |
| Monthly Housing Costs | $586 | $6,517 |
| Real Estate Taxes | $2,660 | $442 |
Property Value by Mortgage Status in Santa Ana
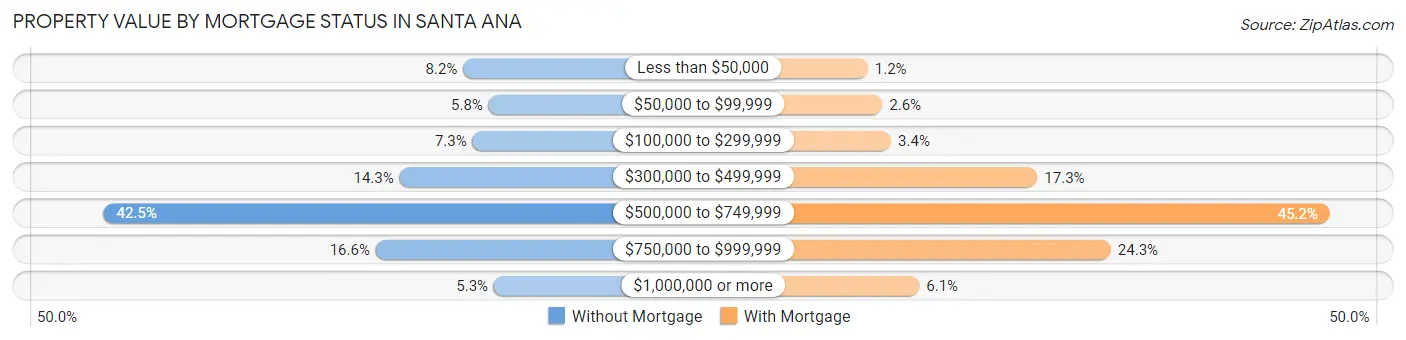
| Property Value | Without Mortgage | With Mortgage |
| Less than $50,000 | 912 (8.2%) | 278 (1.2%) |
| $50,000 to $99,999 | 643 (5.8%) | 603 (2.5%) |
| $100,000 to $299,999 | 813 (7.3%) | 803 (3.4%) |
| $300,000 to $499,999 | 1,584 (14.3%) | 4,100 (17.3%) |
| $500,000 to $749,999 | 4,707 (42.5%) | 10,689 (45.2%) |
| $750,000 to $999,999 | 1,835 (16.6%) | 5,755 (24.3%) |
| $1,000,000 or more | 587 (5.3%) | 1,440 (6.1%) |
| Total | 11,081 (100.0%) | 23,668 (100.0%) |
Household Income by Mortgage Status in Santa Ana
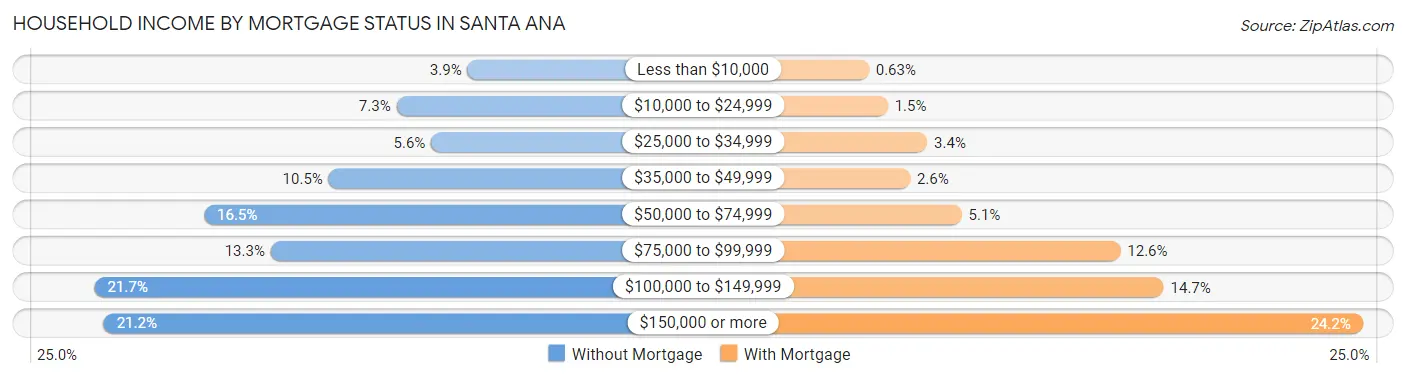
| Household Income | Without Mortgage | With Mortgage |
| Less than $10,000 | 433 (3.9%) | 150 (0.6%) |
| $10,000 to $24,999 | 808 (7.3%) | 362 (1.5%) |
| $25,000 to $34,999 | 625 (5.6%) | 806 (3.4%) |
| $35,000 to $49,999 | 1,166 (10.5%) | 614 (2.6%) |
| $50,000 to $74,999 | 1,823 (16.5%) | 1,196 (5.1%) |
| $75,000 to $99,999 | 1,472 (13.3%) | 2,985 (12.6%) |
| $100,000 to $149,999 | 2,401 (21.7%) | 3,472 (14.7%) |
| $150,000 or more | 2,353 (21.2%) | 5,715 (24.1%) |
| Total | 11,081 (100.0%) | 23,668 (100.0%) |
Property Value to Household Income Ratio in Santa Ana
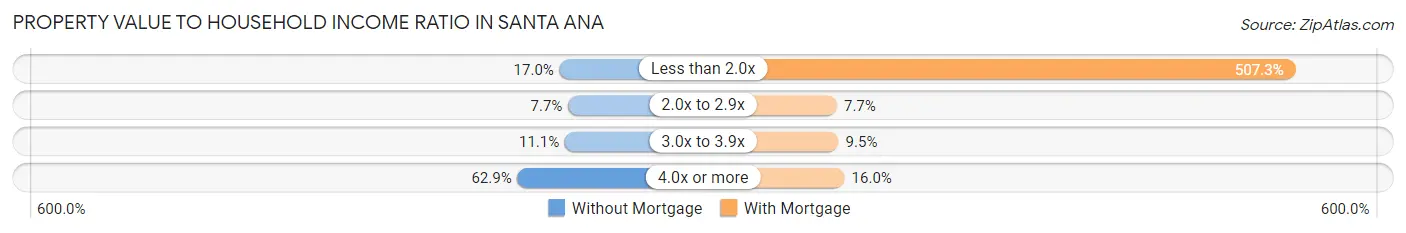
| Value-to-Income Ratio | Without Mortgage | With Mortgage |
| Less than 2.0x | 1,878 (17.0%) | 120,071 (507.3%) |
| 2.0x to 2.9x | 855 (7.7%) | 1,831 (7.7%) |
| 3.0x to 3.9x | 1,231 (11.1%) | 2,254 (9.5%) |
| 4.0x or more | 6,973 (62.9%) | 3,794 (16.0%) |
| Total | 11,081 (100.0%) | 23,668 (100.0%) |
Real Estate Taxes by Mortgage Status in Santa Ana
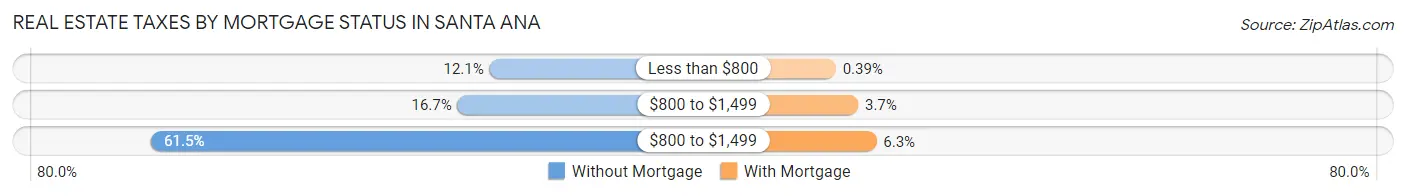
| Property Taxes | Without Mortgage | With Mortgage |
| Less than $800 | 1,336 (12.1%) | 92 (0.4%) |
| $800 to $1,499 | 1,855 (16.7%) | 864 (3.6%) |
| $800 to $1,499 | 6,815 (61.5%) | 1,499 (6.3%) |
| Total | 11,081 (100.0%) | 23,668 (100.0%) |
Health & Disability in Santa Ana
Health Insurance Coverage by Age in Santa Ana
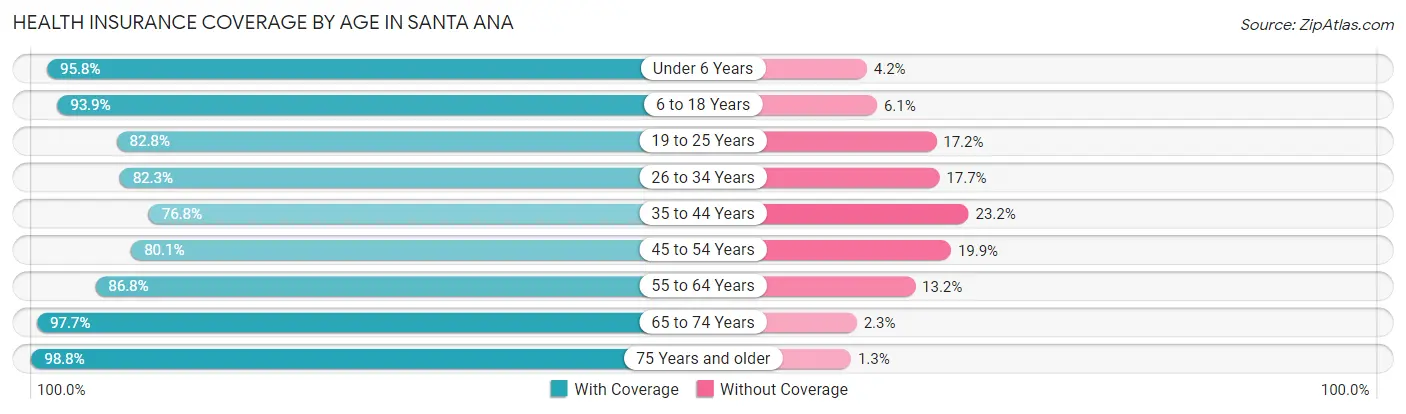
| Age Bracket | With Coverage | Without Coverage |
| Under 6 Years | 21,848 (95.8%) | 959 (4.2%) |
| 6 to 18 Years | 54,477 (93.9%) | 3,541 (6.1%) |
| 19 to 25 Years | 30,173 (82.8%) | 6,250 (17.2%) |
| 26 to 34 Years | 36,430 (82.3%) | 7,856 (17.7%) |
| 35 to 44 Years | 33,705 (76.8%) | 10,162 (23.2%) |
| 45 to 54 Years | 31,240 (80.1%) | 7,756 (19.9%) |
| 55 to 64 Years | 27,833 (86.8%) | 4,233 (13.2%) |
| 65 to 74 Years | 19,446 (97.7%) | 462 (2.3%) |
| 75 Years and older | 12,353 (98.8%) | 157 (1.3%) |
| Total | 267,505 (86.6%) | 41,376 (13.4%) |
Health Insurance Coverage by Citizenship Status in Santa Ana
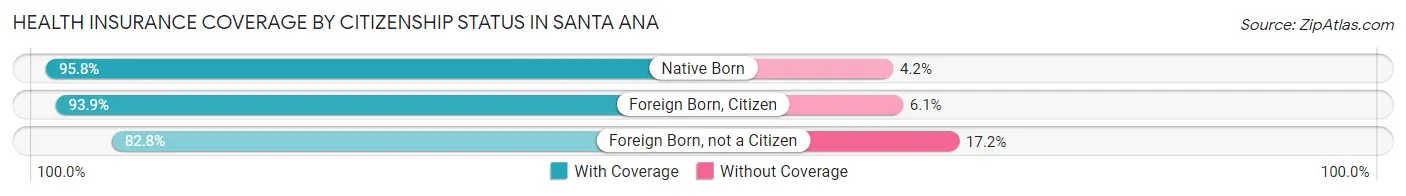
| Citizenship Status | With Coverage | Without Coverage |
| Native Born | 21,848 (95.8%) | 959 (4.2%) |
| Foreign Born, Citizen | 54,477 (93.9%) | 3,541 (6.1%) |
| Foreign Born, not a Citizen | 30,173 (82.8%) | 6,250 (17.2%) |
Health Insurance Coverage by Household Income in Santa Ana
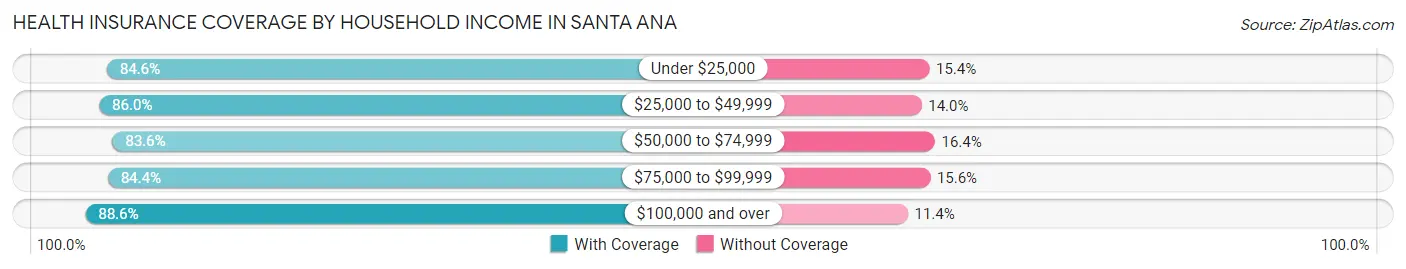
| Household Income | With Coverage | Without Coverage |
| Under $25,000 | 16,089 (84.6%) | 2,932 (15.4%) |
| $25,000 to $49,999 | 35,646 (86.0%) | 5,785 (14.0%) |
| $50,000 to $74,999 | 41,727 (83.6%) | 8,210 (16.4%) |
| $75,000 to $99,999 | 39,171 (84.4%) | 7,230 (15.6%) |
| $100,000 and over | 132,948 (88.6%) | 17,078 (11.4%) |
Public vs Private Health Insurance Coverage by Age in Santa Ana
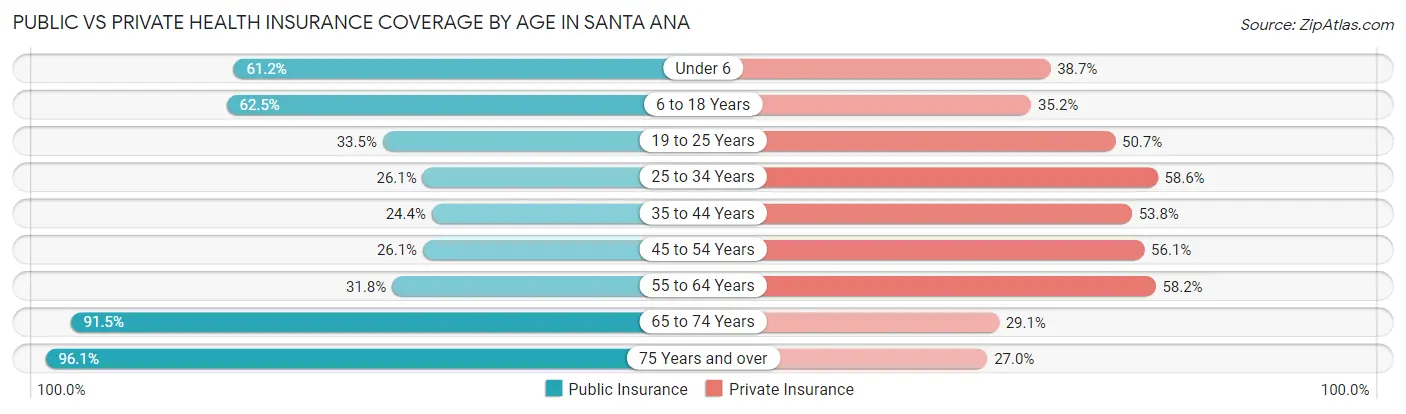
| Age Bracket | Public Insurance | Private Insurance |
| Under 6 | 13,965 (61.2%) | 8,821 (38.7%) |
| 6 to 18 Years | 36,278 (62.5%) | 20,391 (35.1%) |
| 19 to 25 Years | 12,211 (33.5%) | 18,473 (50.7%) |
| 25 to 34 Years | 11,574 (26.1%) | 25,946 (58.6%) |
| 35 to 44 Years | 10,717 (24.4%) | 23,606 (53.8%) |
| 45 to 54 Years | 10,161 (26.1%) | 21,884 (56.1%) |
| 55 to 64 Years | 10,193 (31.8%) | 18,670 (58.2%) |
| 65 to 74 Years | 18,206 (91.4%) | 5,798 (29.1%) |
| 75 Years and over | 12,024 (96.1%) | 3,376 (27.0%) |
| Total | 135,329 (43.8%) | 146,965 (47.6%) |
Disability Status by Sex by Age in Santa Ana
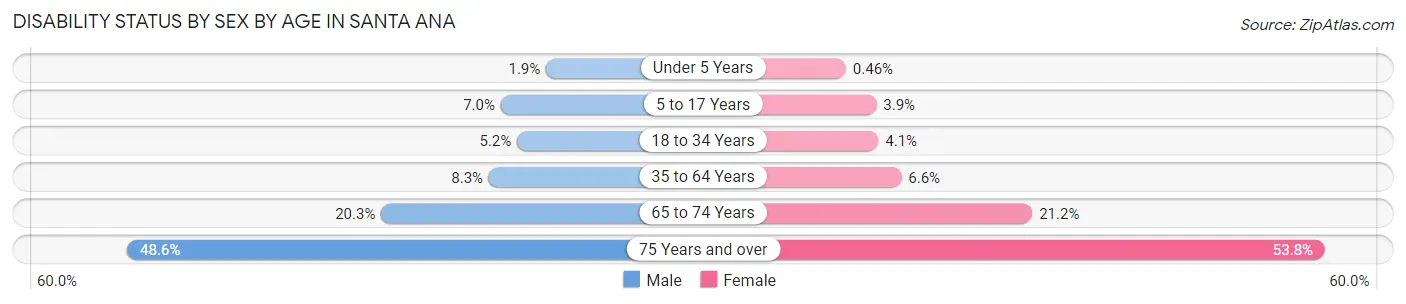
| Age Bracket | Male | Female |
| Under 5 Years | 180 (1.9%) | 41 (0.5%) |
| 5 to 17 Years | 2,060 (7.0%) | 1,042 (3.8%) |
| 18 to 34 Years | 2,373 (5.1%) | 1,645 (4.1%) |
| 35 to 64 Years | 4,946 (8.3%) | 3,663 (6.6%) |
| 65 to 74 Years | 1,896 (20.3%) | 2,240 (21.2%) |
| 75 Years and over | 2,399 (48.6%) | 4,074 (53.8%) |
Disability Class by Sex by Age in Santa Ana
Disability Class: Hearing Difficulty
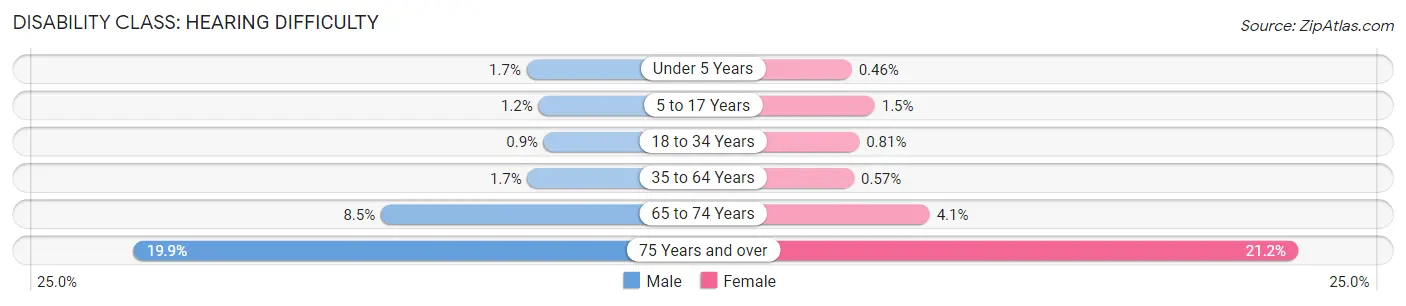
| Age Bracket | Male | Female |
| Under 5 Years | 159 (1.7%) | 41 (0.5%) |
| 5 to 17 Years | 341 (1.1%) | 415 (1.5%) |
| 18 to 34 Years | 415 (0.9%) | 327 (0.8%) |
| 35 to 64 Years | 988 (1.7%) | 315 (0.6%) |
| 65 to 74 Years | 791 (8.5%) | 431 (4.1%) |
| 75 Years and over | 984 (19.9%) | 1,602 (21.2%) |
Disability Class: Vision Difficulty
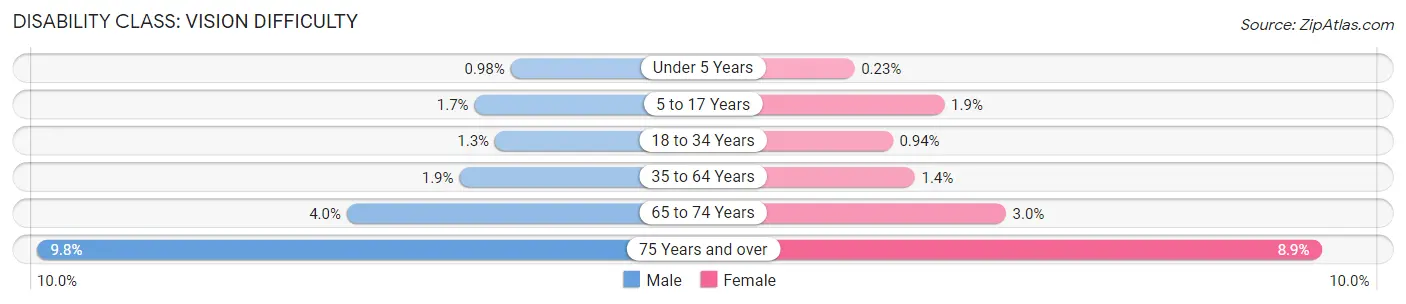
| Age Bracket | Male | Female |
| Under 5 Years | 92 (1.0%) | 21 (0.2%) |
| 5 to 17 Years | 487 (1.7%) | 514 (1.9%) |
| 18 to 34 Years | 586 (1.3%) | 381 (0.9%) |
| 35 to 64 Years | 1,150 (1.9%) | 745 (1.3%) |
| 65 to 74 Years | 376 (4.0%) | 321 (3.0%) |
| 75 Years and over | 482 (9.8%) | 674 (8.9%) |
Disability Class: Cognitive Difficulty
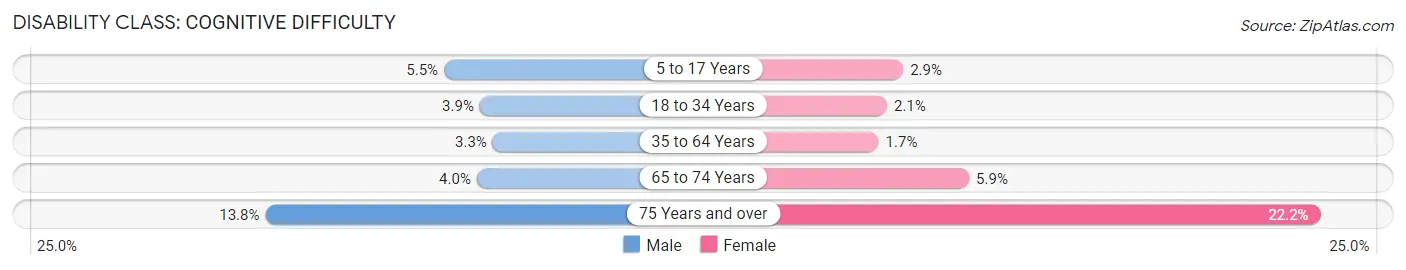
| Age Bracket | Male | Female |
| 5 to 17 Years | 1,639 (5.5%) | 771 (2.9%) |
| 18 to 34 Years | 1,788 (3.9%) | 849 (2.1%) |
| 35 to 64 Years | 1,959 (3.3%) | 945 (1.7%) |
| 65 to 74 Years | 376 (4.0%) | 624 (5.9%) |
| 75 Years and over | 683 (13.8%) | 1,682 (22.2%) |
Disability Class: Ambulatory Difficulty
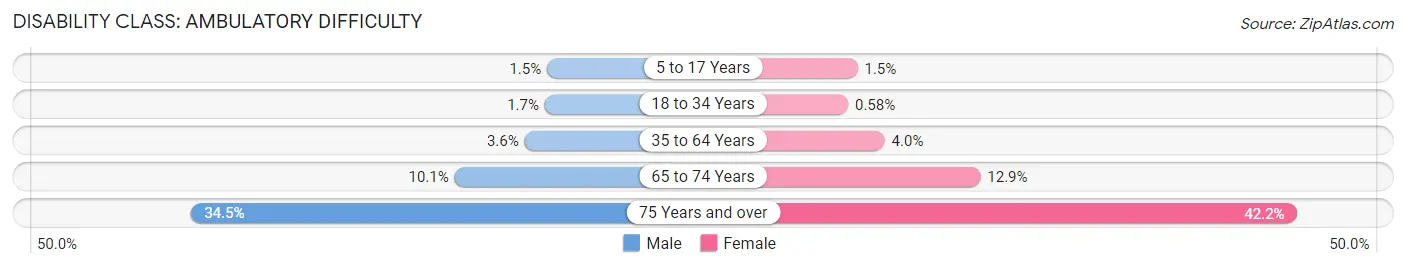
| Age Bracket | Male | Female |
| 5 to 17 Years | 447 (1.5%) | 395 (1.5%) |
| 18 to 34 Years | 795 (1.7%) | 236 (0.6%) |
| 35 to 64 Years | 2,148 (3.6%) | 2,200 (4.0%) |
| 65 to 74 Years | 944 (10.1%) | 1,358 (12.9%) |
| 75 Years and over | 1,705 (34.5%) | 3,195 (42.2%) |
Disability Class: Self-Care Difficulty
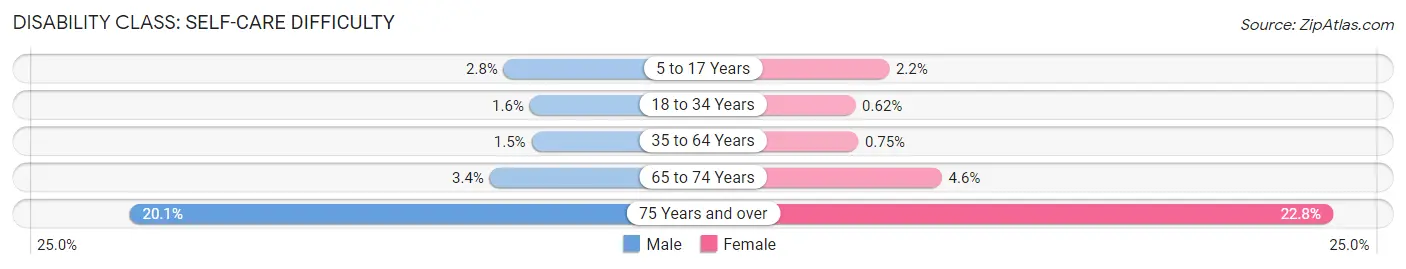
| Age Bracket | Male | Female |
| 5 to 17 Years | 819 (2.8%) | 594 (2.2%) |
| 18 to 34 Years | 719 (1.6%) | 250 (0.6%) |
| 35 to 64 Years | 882 (1.5%) | 412 (0.7%) |
| 65 to 74 Years | 320 (3.4%) | 489 (4.6%) |
| 75 Years and over | 994 (20.1%) | 1,725 (22.8%) |
Technology Access in Santa Ana
Computing Device Access in Santa Ana
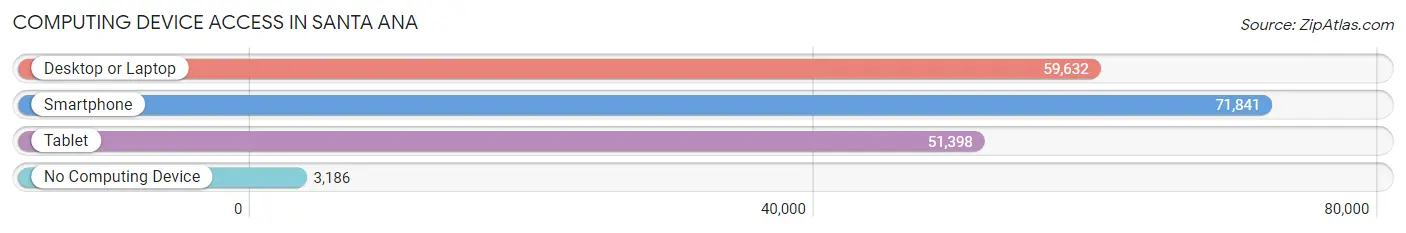
| Device Type | # Households | % Households |
| Desktop or Laptop | 59,632 | 76.9% |
| Smartphone | 71,841 | 92.6% |
| Tablet | 51,398 | 66.3% |
| No Computing Device | 3,186 | 4.1% |
| Total | 77,553 | 100.0% |
Internet Access in Santa Ana
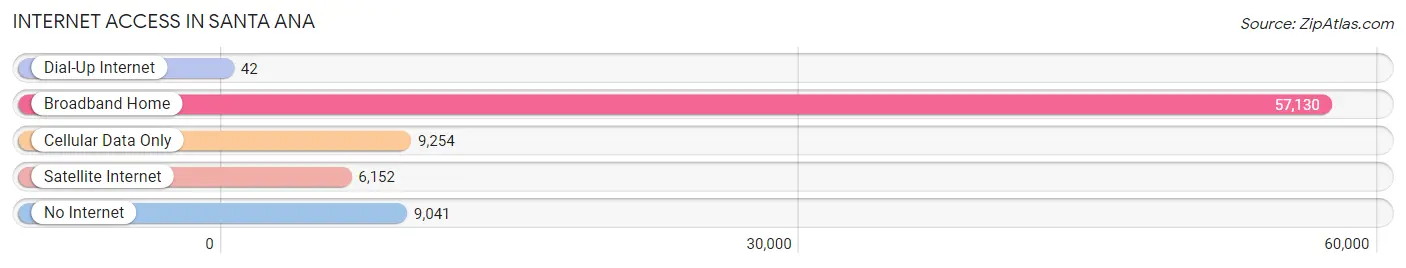
| Internet Type | # Households | % Households |
| Dial-Up Internet | 42 | 0.1% |
| Broadband Home | 57,130 | 73.7% |
| Cellular Data Only | 9,254 | 11.9% |
| Satellite Internet | 6,152 | 7.9% |
| No Internet | 9,041 | 11.7% |
| Total | 77,553 | 100.0% |
Santa Ana Summary
Santa Ana is a city located in Orange County, California. It is the county seat and second most populous city in the county, with a population of over 330,000. Santa Ana is located in the heart of Southern California, just south of Los Angeles and north of San Diego. It is part of the Greater Los Angeles Area and is the 57th most populous city in the United States.
History
Santa Ana was founded in 1869 by William H. Spurgeon, a rancher from Kentucky. The city was named after the Santa Ana River, which runs through the area. The city was incorporated in 1886 and has since grown to become the county seat of Orange County.
Santa Ana has a long and rich history. It was the site of the Battle of San Juan Capistrano in 1846, during the Mexican-American War. The city was also the site of the first Orange County Courthouse, which was built in 1889.
In the early 20th century, Santa Ana was a major center for the citrus industry. The city was also home to a large number of manufacturing plants, including the Santa Ana Army Air Base, which was built during World War II.
Geography
Santa Ana is located in the heart of Orange County, in the Santa Ana Valley. The city is bordered by the Santa Ana Mountains to the north, the San Gabriel Mountains to the east, and the Pacific Ocean to the south. The city covers an area of 27.2 square miles and has an elevation of 85 feet.
The climate in Santa Ana is Mediterranean, with warm, dry summers and mild, wet winters. The average temperature in the summer is around 75°F, while the average temperature in the winter is around 55°F.
Economy
Santa Ana is a major economic center in Orange County. The city is home to a number of large corporations, including Ingram Micro, First American Corporation, and Behr Paint. The city is also home to a number of government agencies, including the Orange County Sheriff's Department and the Orange County Fire Authority.
The city's economy is also supported by a number of small businesses, including restaurants, retail stores, and professional services. The city is also home to a number of educational institutions, including Santa Ana College and the University of California, Irvine.
Demographics
As of the 2010 census, Santa Ana had a population of over 330,000. The city is ethnically diverse, with a majority of the population being Hispanic or Latino (over 70%). The city also has a large Asian population (over 20%), as well as a significant African American population (over 10%).
The median household income in Santa Ana is $50,000, and the median home value is $400,000. The city has a high rate of poverty, with over 20% of the population living below the poverty line.
Conclusion
Santa Ana is a vibrant and diverse city located in the heart of Orange County, California. The city has a long and rich history, and is home to a number of large corporations and government agencies. The city is ethnically diverse, with a majority of the population being Hispanic or Latino. The city also has a strong economy, with a median household income of $50,000 and a median home value of $400,000. Santa Ana is a great place to live, work, and play.
Common Questions
What is Per Capita Income in Santa Ana?
Per Capita income in Santa Ana is $27,328.
What is the Median Family Income in Santa Ana?
Median Family Income in Santa Ana is $83,689.
What is the Median Household income in Santa Ana?
Median Household Income in Santa Ana is $84,210.
What is Income or Wage Gap in Santa Ana?
Income or Wage Gap in Santa Ana is 20.4%.
Women in Santa Ana earn 79.6 cents for every dollar earned by a man.
What is Family Income Deficit in Santa Ana?
Family Income Deficit in Santa Ana is $10,623.
Families that are below poverty line in Santa Ana earn $10,623 less on average than the poverty threshold level.
What is Inequality or Gini Index in Santa Ana?
Inequality or Gini Index in Santa Ana is 0.41.
What is the Total Population of Santa Ana?
Total Population of Santa Ana is 311,379.
What is the Total Male Population of Santa Ana?
Total Male Population of Santa Ana is 160,488.
What is the Total Female Population of Santa Ana?
Total Female Population of Santa Ana is 150,891.
What is the Ratio of Males per 100 Females in Santa Ana?
There are 106.36 Males per 100 Females in Santa Ana.
What is the Ratio of Females per 100 Males in Santa Ana?
There are 94.02 Females per 100 Males in Santa Ana.
What is the Median Population Age in Santa Ana?
Median Population Age in Santa Ana is 33.4 Years.
What is the Average Family Size in Santa Ana
Average Family Size in Santa Ana is 4.3 People.
What is the Average Household Size in Santa Ana
Average Household Size in Santa Ana is 4.0 People.
How Large is the Labor Force in Santa Ana?
There are 164,094 People in the Labor Forcein in Santa Ana.
What is the Percentage of People in the Labor Force in Santa Ana?
66.7% of People are in the Labor Force in Santa Ana.
What is the Unemployment Rate in Santa Ana?
Unemployment Rate in Santa Ana is 5.5%.