Paramount, CA Map & Demographics
Paramount Map
Paramount Overview
$23,277
PER CAPITA INCOME
$70,217
AVG FAMILY INCOME
$67,197
AVG HOUSEHOLD INCOME
22.1%
WAGE / INCOME GAP [ % ]
77.9¢/ $1
WAGE / INCOME GAP [ $ ]
$10,255
FAMILY INCOME DEFICIT
0.40
INEQUALITY / GINI INDEX
53,255
TOTAL POPULATION
26,543
MALE POPULATION
26,712
FEMALE POPULATION
99.37
MALES / 100 FEMALES
100.64
FEMALES / 100 MALES
31.9
MEDIAN AGE
4.0
AVG FAMILY SIZE
3.7
AVG HOUSEHOLD SIZE
26,716
LABOR FORCE [ PEOPLE ]
65.7%
PERCENT IN LABOR FORCE
5.3%
UNEMPLOYMENT RATE
Paramount Zip Codes
Income in Paramount
Income Overview in Paramount
Per Capita Income in Paramount is $23,277, while median incomes of families and households are $70,217 and $67,197 respectively.
| Characteristic | Number | Measure |
| Per Capita Income | 53,255 | $23,277 |
| Median Family Income | 11,711 | $70,217 |
| Mean Family Income | 11,711 | $86,420 |
| Median Household Income | 14,366 | $67,197 |
| Mean Household Income | 14,366 | $82,843 |
| Income Deficit | 11,711 | $10,255 |
| Wage / Income Gap (%) | 53,255 | 22.10% |
| Wage / Income Gap ($) | 53,255 | 77.90¢ per $1 |
| Gini / Inequality Index | 53,255 | 0.40 |
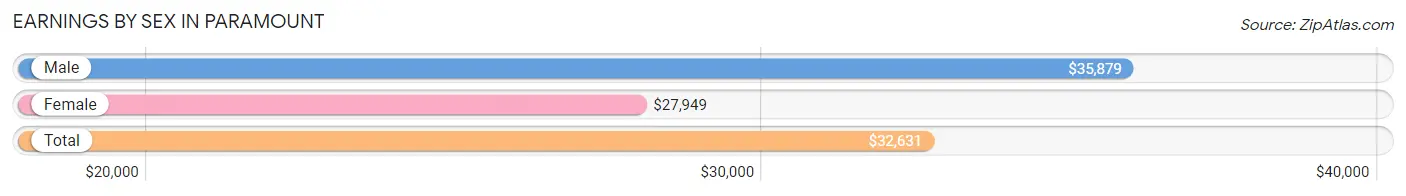
Earnings by Sex in Paramount
Average Earnings in Paramount are $32,631, $35,879 for men and $27,949 for women, a difference of 22.1%.
| Sex | Number | Average Earnings |
| Male | 14,753 (55.2%) | $35,879 |
| Female | 11,954 (44.8%) | $27,949 |
| Total | 26,707 (100.0%) | $32,631 |
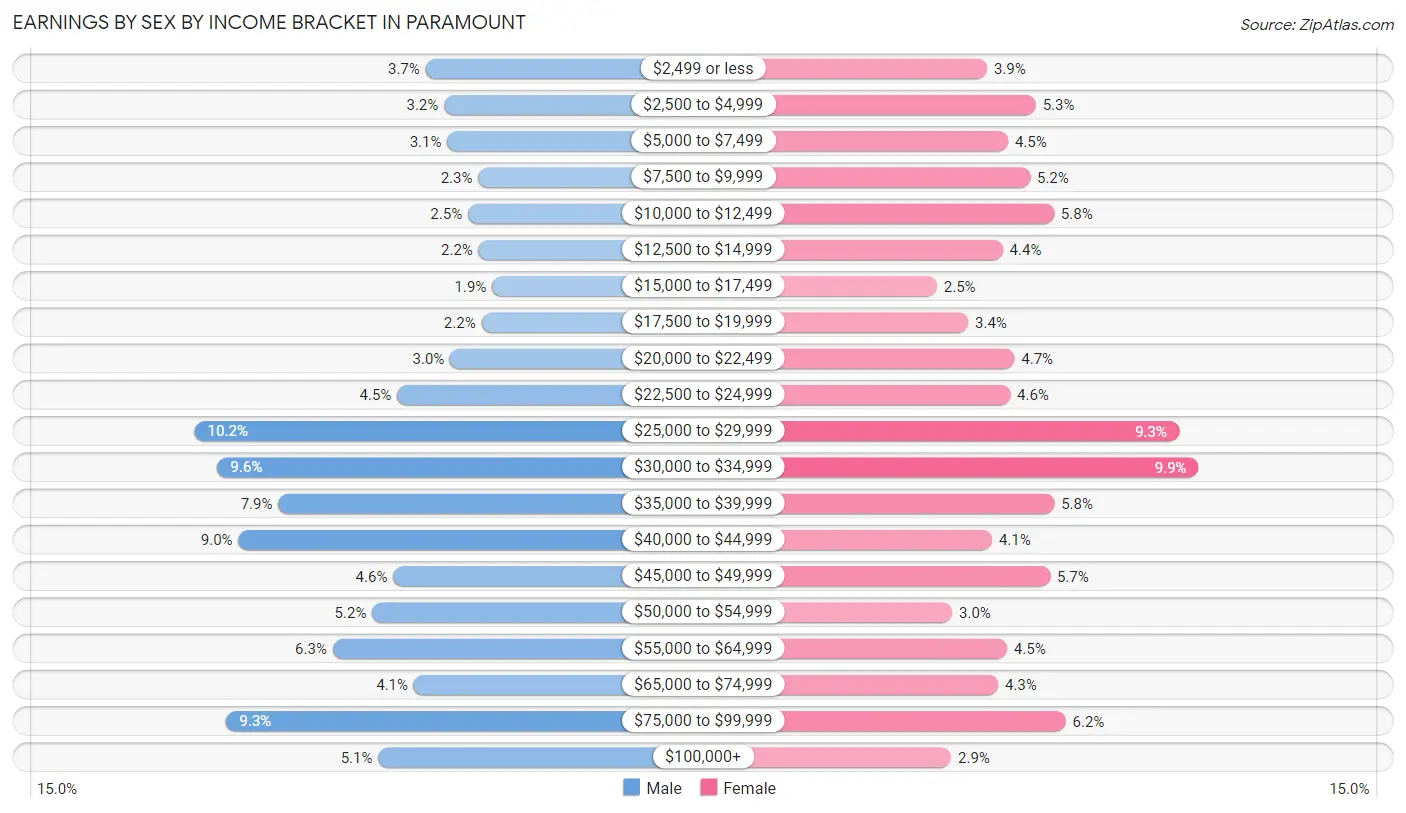
Earnings by Sex by Income Bracket in Paramount
The most common earnings brackets in Paramount are $25,000 to $29,999 for men (1,508 | 10.2%) and $30,000 to $34,999 for women (1,181 | 9.9%).
| Income | Male | Female |
| $2,499 or less | 550 (3.7%) | 471 (3.9%) |
| $2,500 to $4,999 | 474 (3.2%) | 635 (5.3%) |
| $5,000 to $7,499 | 460 (3.1%) | 542 (4.5%) |
| $7,500 to $9,999 | 332 (2.2%) | 616 (5.1%) |
| $10,000 to $12,499 | 375 (2.5%) | 696 (5.8%) |
| $12,500 to $14,999 | 330 (2.2%) | 523 (4.4%) |
| $15,000 to $17,499 | 275 (1.9%) | 302 (2.5%) |
| $17,500 to $19,999 | 319 (2.2%) | 408 (3.4%) |
| $20,000 to $22,499 | 448 (3.0%) | 563 (4.7%) |
| $22,500 to $24,999 | 669 (4.5%) | 549 (4.6%) |
| $25,000 to $29,999 | 1,508 (10.2%) | 1,115 (9.3%) |
| $30,000 to $34,999 | 1,413 (9.6%) | 1,181 (9.9%) |
| $35,000 to $39,999 | 1,161 (7.9%) | 697 (5.8%) |
| $40,000 to $44,999 | 1,326 (9.0%) | 488 (4.1%) |
| $45,000 to $49,999 | 684 (4.6%) | 683 (5.7%) |
| $50,000 to $54,999 | 772 (5.2%) | 354 (3.0%) |
| $55,000 to $64,999 | 935 (6.3%) | 538 (4.5%) |
| $65,000 to $74,999 | 599 (4.1%) | 508 (4.3%) |
| $75,000 to $99,999 | 1,377 (9.3%) | 735 (6.1%) |
| $100,000+ | 746 (5.1%) | 350 (2.9%) |
| Total | 14,753 (100.0%) | 11,954 (100.0%) |
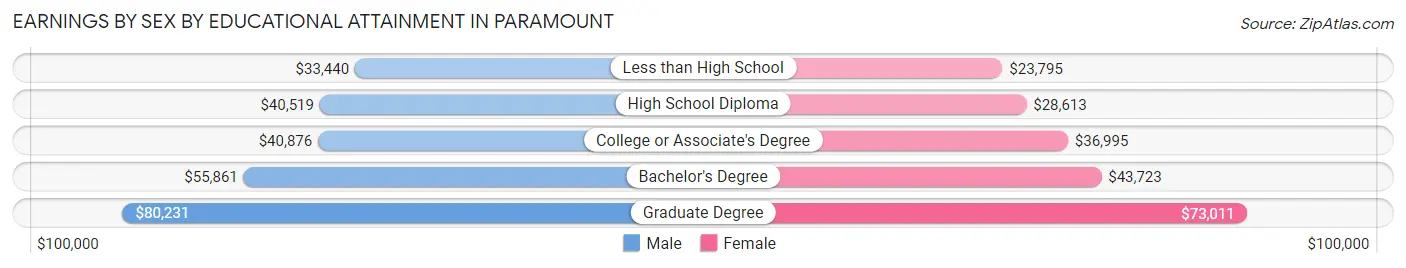
Earnings by Sex by Educational Attainment in Paramount
Average earnings in Paramount are $39,610 for men and $32,092 for women, a difference of 19.0%. Men with an educational attainment of graduate degree enjoy the highest average annual earnings of $80,231, while those with less than high school education earn the least with $33,440. Women with an educational attainment of graduate degree earn the most with the average annual earnings of $73,011, while those with less than high school education have the smallest earnings of $23,795.
| Educational Attainment | Male Income | Female Income |
| Less than High School | $33,440 | $23,795 |
| High School Diploma | $40,519 | $28,613 |
| College or Associate's Degree | $40,876 | $36,995 |
| Bachelor's Degree | $55,861 | $43,723 |
| Graduate Degree | $80,231 | $73,011 |
| Total | $39,610 | $32,092 |
Family Income in Paramount
Family Income Brackets in Paramount
According to the Paramount family income data, there are 2,354 families falling into the $50,000 to $74,999 income range, which is the most common income bracket and makes up 20.1% of all families. Conversely, the $10,000 to $14,999 income bracket is the least frequent group with only 234 families (2.0%) belonging to this category.
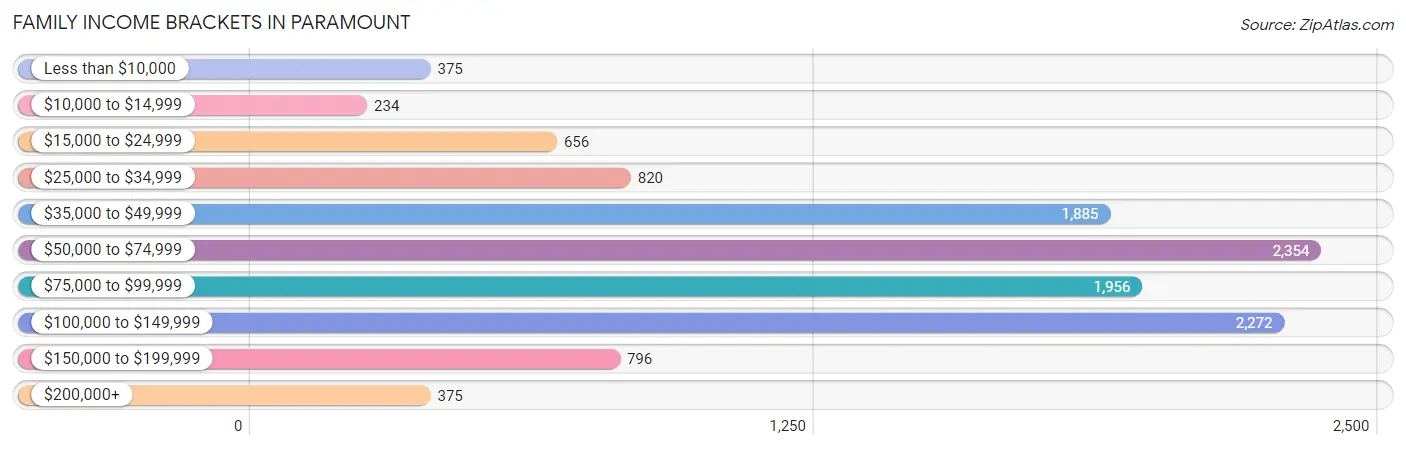
| Income Bracket | # Families | % Families |
| Less than $10,000 | 375 | 3.2% |
| $10,000 to $14,999 | 234 | 2.0% |
| $15,000 to $24,999 | 656 | 5.6% |
| $25,000 to $34,999 | 820 | 7.0% |
| $35,000 to $49,999 | 1,885 | 16.1% |
| $50,000 to $74,999 | 2,354 | 20.1% |
| $75,000 to $99,999 | 1,956 | 16.7% |
| $100,000 to $149,999 | 2,272 | 19.4% |
| $150,000 to $199,999 | 796 | 6.8% |
| $200,000+ | 375 | 3.2% |
Family Income by Famaliy Size in Paramount
7+ person families (618 | 5.3%) account for the highest median family income in Paramount with $137,292 per family, while 2-person families (2,582 | 22.1%) have the highest median income of $26,544 per family member.
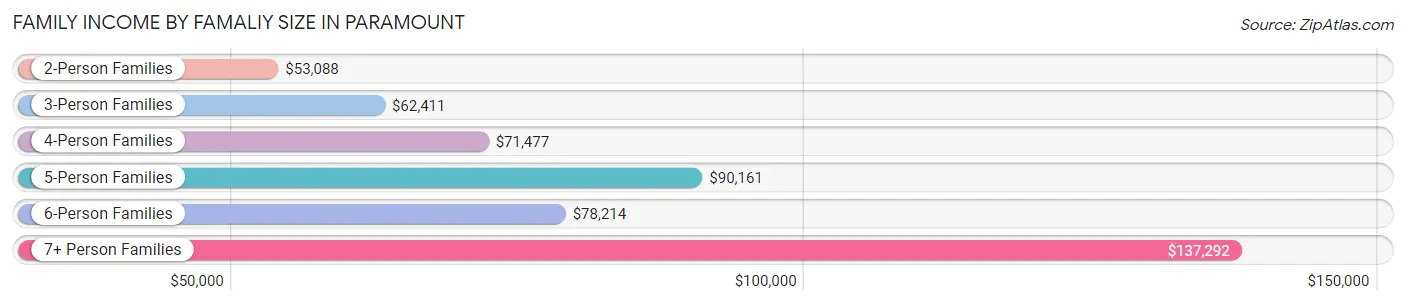
| Income Bracket | # Families | Median Income |
| 2-Person Families | 2,582 (22.1%) | $53,088 |
| 3-Person Families | 2,781 (23.7%) | $62,411 |
| 4-Person Families | 2,832 (24.2%) | $71,477 |
| 5-Person Families | 2,058 (17.6%) | $90,161 |
| 6-Person Families | 840 (7.2%) | $78,214 |
| 7+ Person Families | 618 (5.3%) | $137,292 |
| Total | 11,711 (100.0%) | $70,217 |
Family Income by Number of Earners in Paramount
The median family income in Paramount is $70,217, with families comprising 3+ earners (2,797) having the highest median family income of $108,895, while families with no earners (772) have the lowest median family income of $23,777, accounting for 23.9% and 6.6% of families, respectively.
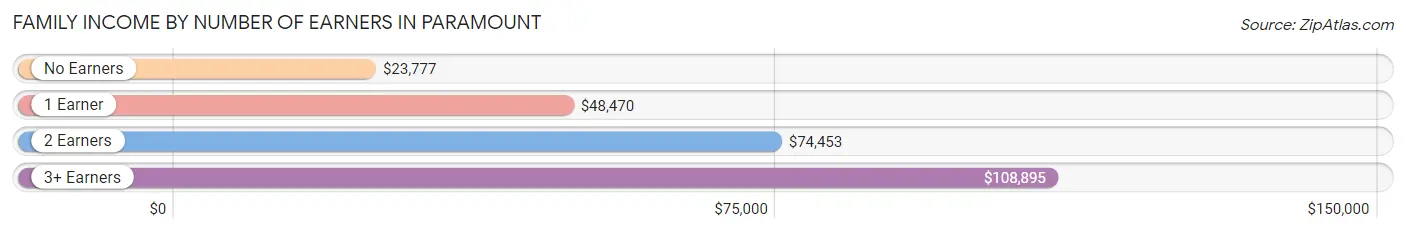
| Number of Earners | # Families | Median Income |
| No Earners | 772 (6.6%) | $23,777 |
| 1 Earner | 3,973 (33.9%) | $48,470 |
| 2 Earners | 4,169 (35.6%) | $74,453 |
| 3+ Earners | 2,797 (23.9%) | $108,895 |
| Total | 11,711 (100.0%) | $70,217 |
Household Income in Paramount
Household Income Brackets in Paramount
With 3,031 households falling in the category, the $50,000 to $74,999 income range is the most frequent in Paramount, accounting for 21.1% of all households. In contrast, only 460 households (3.2%) fall into the $200,000+ income bracket, making it the least populous group.
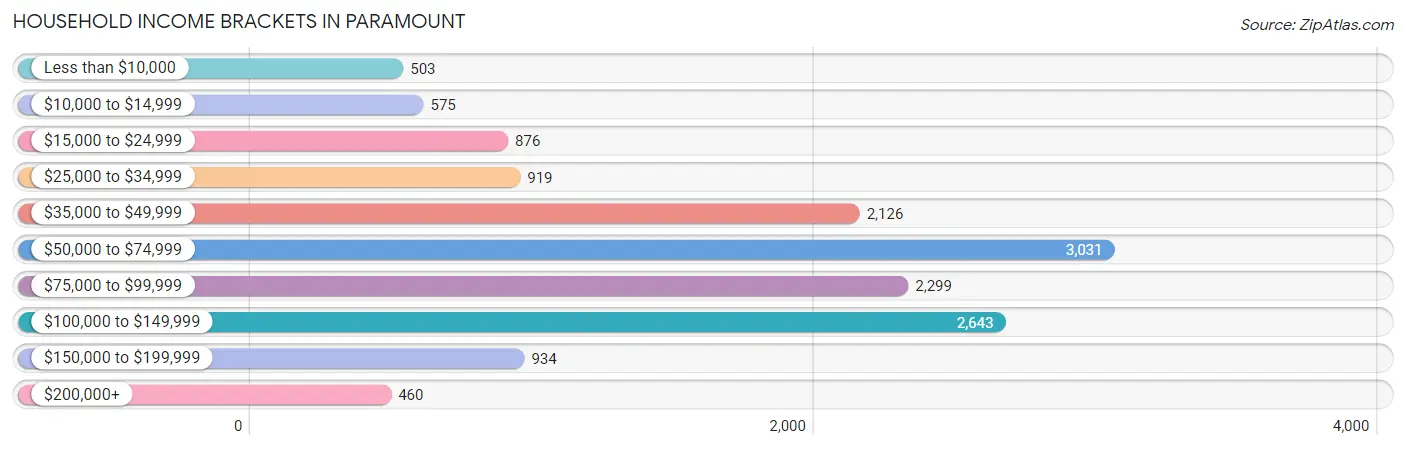
| Income Bracket | # Households | % Households |
| Less than $10,000 | 503 | 3.5% |
| $10,000 to $14,999 | 575 | 4.0% |
| $15,000 to $24,999 | 876 | 6.1% |
| $25,000 to $34,999 | 919 | 6.4% |
| $35,000 to $49,999 | 2,126 | 14.8% |
| $50,000 to $74,999 | 3,031 | 21.1% |
| $75,000 to $99,999 | 2,299 | 16.0% |
| $100,000 to $149,999 | 2,643 | 18.4% |
| $150,000 to $199,999 | 934 | 6.5% |
| $200,000+ | 460 | 3.2% |
Household Income by Householder Age in Paramount
The median household income in Paramount is $67,197, with the highest median household income of $72,661 found in the 45 to 64 years age bracket for the primary householder. A total of 6,191 households (43.1%) fall into this category. Meanwhile, the 65+ years age bracket for the primary householder has the lowest median household income of $56,157, with 2,318 households (16.1%) in this group.
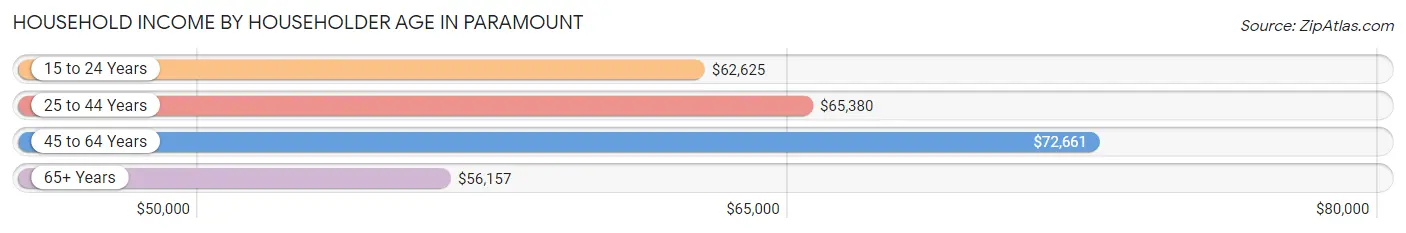
| Income Bracket | # Households | Median Income |
| 15 to 24 Years | 425 (3.0%) | $62,625 |
| 25 to 44 Years | 5,432 (37.8%) | $65,380 |
| 45 to 64 Years | 6,191 (43.1%) | $72,661 |
| 65+ Years | 2,318 (16.1%) | $56,157 |
| Total | 14,366 (100.0%) | $67,197 |
Poverty in Paramount
Income Below Poverty by Sex and Age in Paramount
With 11.5% poverty level for males and 15.2% for females among the residents of Paramount, under 5 year old males and 16 and 17 year old females are the most vulnerable to poverty, with 397 males (24.4%) and 167 females (24.1%) in their respective age groups living below the poverty level.
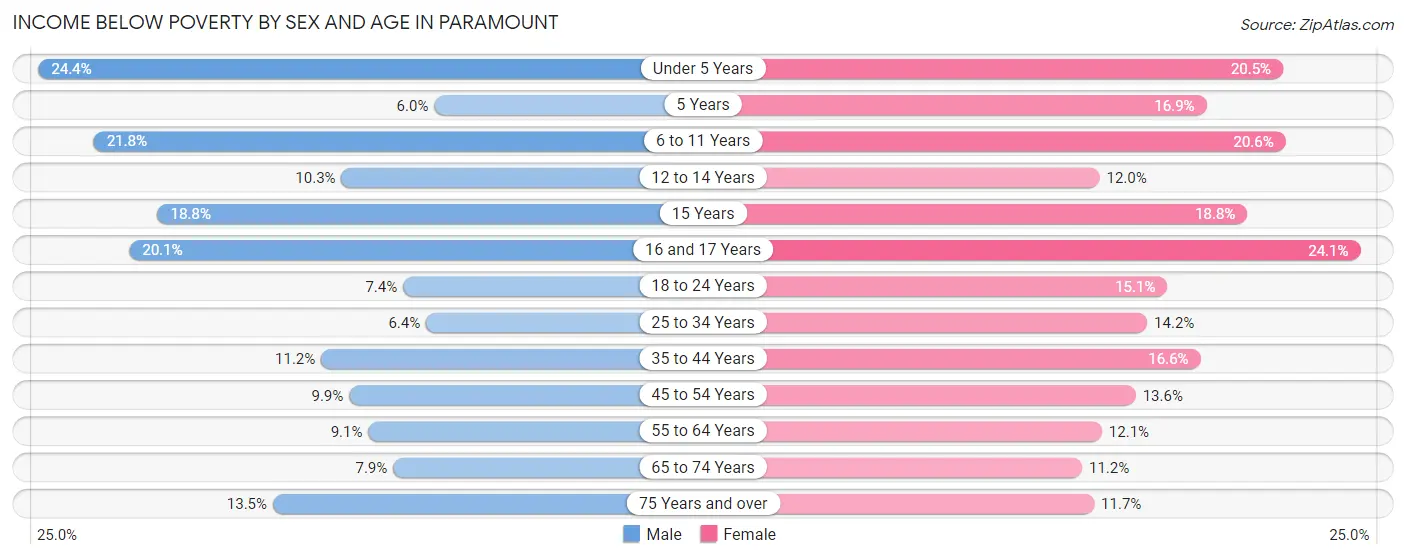
| Age Bracket | Male | Female |
| Under 5 Years | 397 (24.4%) | 307 (20.5%) |
| 5 Years | 19 (6.0%) | 79 (16.9%) |
| 6 to 11 Years | 473 (21.8%) | 497 (20.6%) |
| 12 to 14 Years | 179 (10.3%) | 160 (12.0%) |
| 15 Years | 87 (18.8%) | 57 (18.8%) |
| 16 and 17 Years | 199 (20.1%) | 167 (24.1%) |
| 18 to 24 Years | 227 (7.4%) | 456 (15.1%) |
| 25 to 34 Years | 287 (6.4%) | 595 (14.2%) |
| 35 to 44 Years | 342 (11.2%) | 590 (16.6%) |
| 45 to 54 Years | 399 (9.9%) | 492 (13.6%) |
| 55 to 64 Years | 199 (9.0%) | 343 (12.1%) |
| 65 to 74 Years | 120 (7.9%) | 164 (11.2%) |
| 75 Years and over | 84 (13.5%) | 119 (11.7%) |
| Total | 3,012 (11.5%) | 4,026 (15.2%) |
Income Above Poverty by Sex and Age in Paramount
According to the poverty statistics in Paramount, males aged 5 years and females aged 65 to 74 years are the age groups that are most secure financially, with 94.0% of males and 88.8% of females in these age groups living above the poverty line.
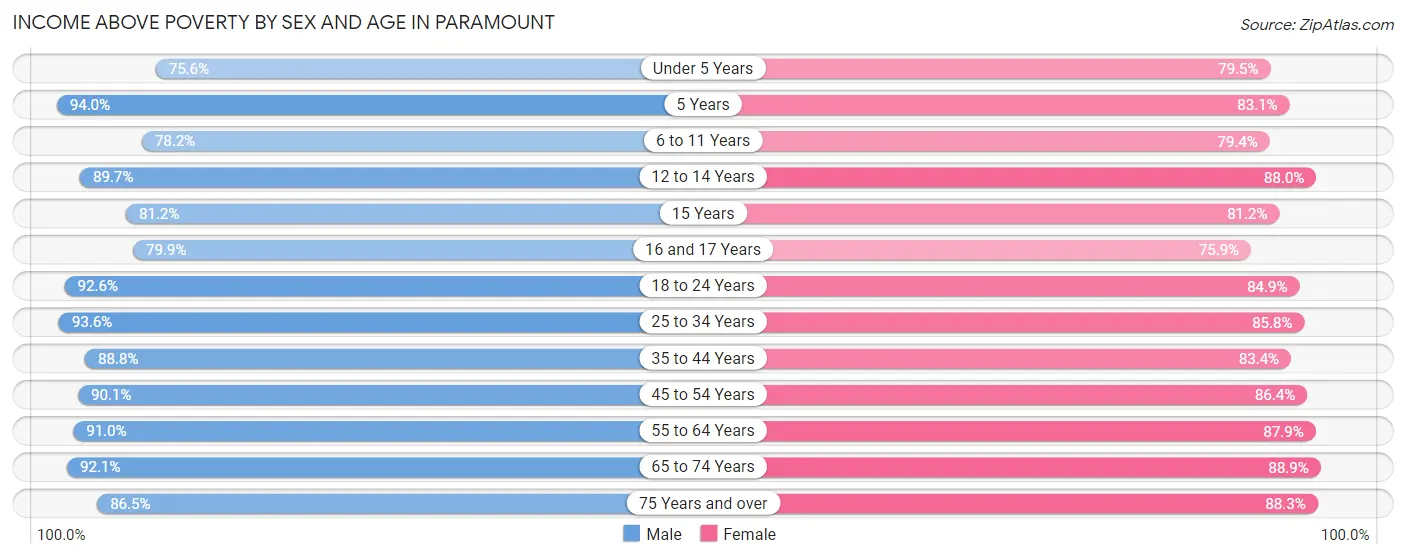
| Age Bracket | Male | Female |
| Under 5 Years | 1,233 (75.6%) | 1,193 (79.5%) |
| 5 Years | 298 (94.0%) | 388 (83.1%) |
| 6 to 11 Years | 1,698 (78.2%) | 1,917 (79.4%) |
| 12 to 14 Years | 1,559 (89.7%) | 1,178 (88.0%) |
| 15 Years | 375 (81.2%) | 246 (81.2%) |
| 16 and 17 Years | 789 (79.9%) | 527 (75.9%) |
| 18 to 24 Years | 2,824 (92.6%) | 2,563 (84.9%) |
| 25 to 34 Years | 4,220 (93.6%) | 3,603 (85.8%) |
| 35 to 44 Years | 2,700 (88.8%) | 2,956 (83.4%) |
| 45 to 54 Years | 3,616 (90.1%) | 3,116 (86.4%) |
| 55 to 64 Years | 1,999 (90.9%) | 2,499 (87.9%) |
| 65 to 74 Years | 1,399 (92.1%) | 1,307 (88.8%) |
| 75 Years and over | 539 (86.5%) | 897 (88.3%) |
| Total | 23,249 (88.5%) | 22,390 (84.8%) |
Income Below Poverty Among Married-Couple Families in Paramount
The poverty statistics for married-couple families in Paramount show that 7.8% or 517 of the total 6,647 families live below the poverty line. Families with 3 or 4 children have the highest poverty rate of 17.9%, comprising of 176 families. On the other hand, families with 5 or more children have the lowest poverty rate of 0.0%, which includes 0 families.
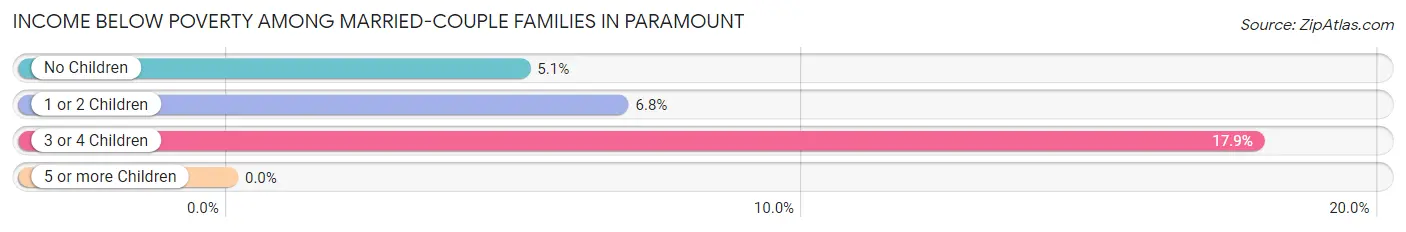
| Children | Above Poverty | Below Poverty |
| No Children | 2,348 (94.9%) | 126 (5.1%) |
| 1 or 2 Children | 2,947 (93.2%) | 215 (6.8%) |
| 3 or 4 Children | 809 (82.1%) | 176 (17.9%) |
| 5 or more Children | 26 (100.0%) | 0 (0.0%) |
| Total | 6,130 (92.2%) | 517 (7.8%) |
Income Below Poverty Among Single-Parent Households in Paramount
According to the poverty data in Paramount, 3.8% or 62 single-father households and 22.5% or 778 single-mother households are living below the poverty line. Among single-father households, those with 3 or 4 children have the highest poverty rate, with 23 households (25.3%) experiencing poverty. Likewise, among single-mother households, those with 5 or more children have the highest poverty rate, with 18 households (45.0%) falling below the poverty line.
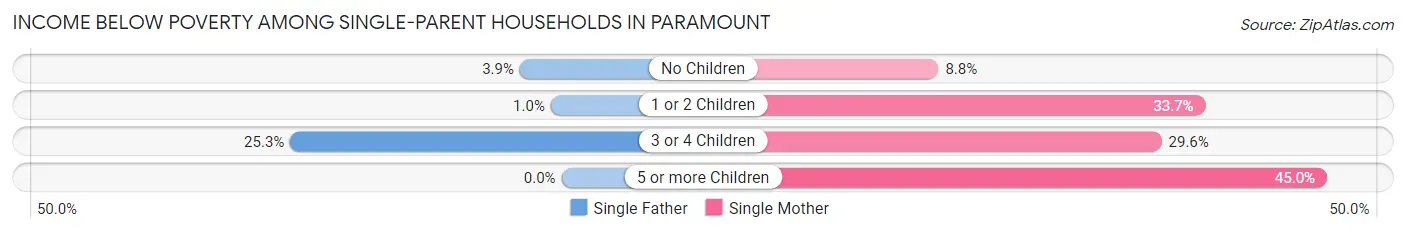
| Children | Single Father | Single Mother |
| No Children | 32 (3.9%) | 132 (8.8%) |
| 1 or 2 Children | 7 (1.0%) | 498 (33.7%) |
| 3 or 4 Children | 23 (25.3%) | 130 (29.6%) |
| 5 or more Children | 0 (0.0%) | 18 (45.0%) |
| Total | 62 (3.8%) | 778 (22.5%) |
Income Below Poverty Among Married-Couple vs Single-Parent Households in Paramount
The poverty data for Paramount shows that 517 of the married-couple family households (7.8%) and 840 of the single-parent households (16.6%) are living below the poverty level. Within the married-couple family households, those with 3 or 4 children have the highest poverty rate, with 176 households (17.9%) falling below the poverty line. Among the single-parent households, those with 5 or more children have the highest poverty rate, with 18 household (45.0%) living below poverty.
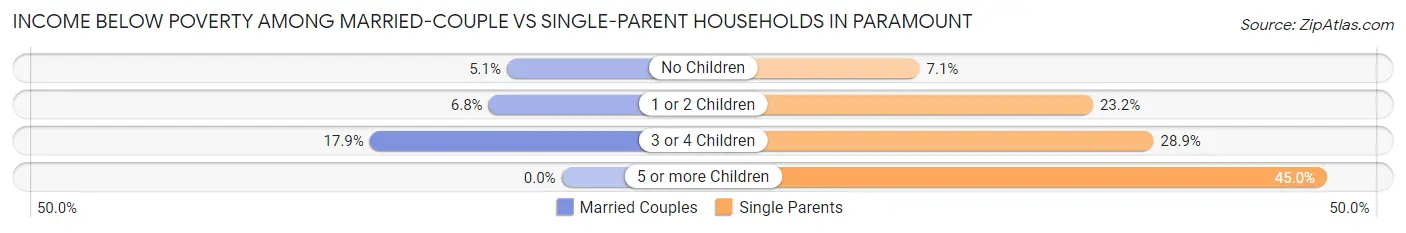
| Children | Married-Couple Families | Single-Parent Households |
| No Children | 126 (5.1%) | 164 (7.1%) |
| 1 or 2 Children | 215 (6.8%) | 505 (23.2%) |
| 3 or 4 Children | 176 (17.9%) | 153 (28.9%) |
| 5 or more Children | 0 (0.0%) | 18 (45.0%) |
| Total | 517 (7.8%) | 840 (16.6%) |
Race in Paramount
The most populous races in Paramount are Hispanic or Latino (43,298 | 81.3%), Some other Race (23,324 | 43.8%), and Two or more Races (11,103 | 20.8%).
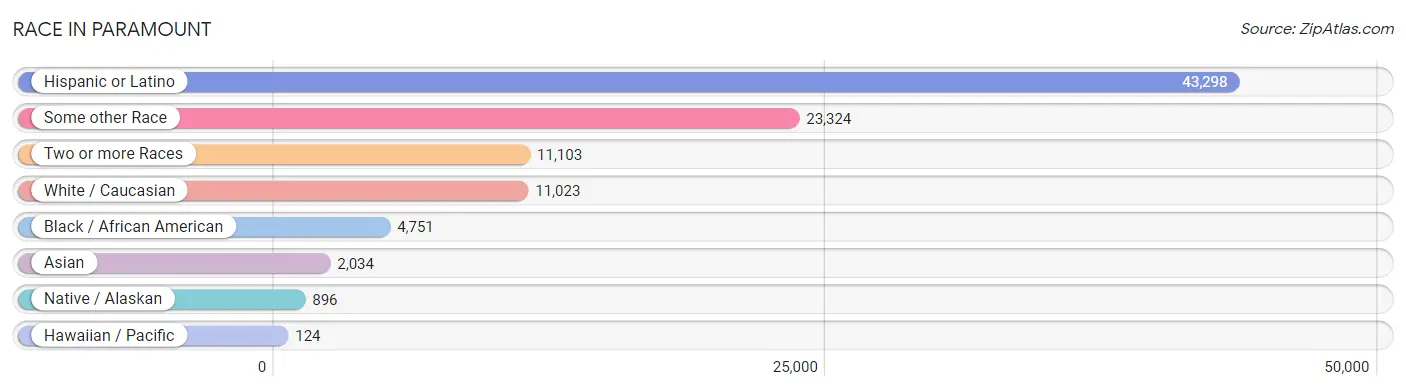
| Race | # Population | % Population |
| Asian | 2,034 | 3.8% |
| Black / African American | 4,751 | 8.9% |
| Hawaiian / Pacific | 124 | 0.2% |
| Hispanic or Latino | 43,298 | 81.3% |
| Native / Alaskan | 896 | 1.7% |
| White / Caucasian | 11,023 | 20.7% |
| Two or more Races | 11,103 | 20.8% |
| Some other Race | 23,324 | 43.8% |
| Total | 53,255 | 100.0% |
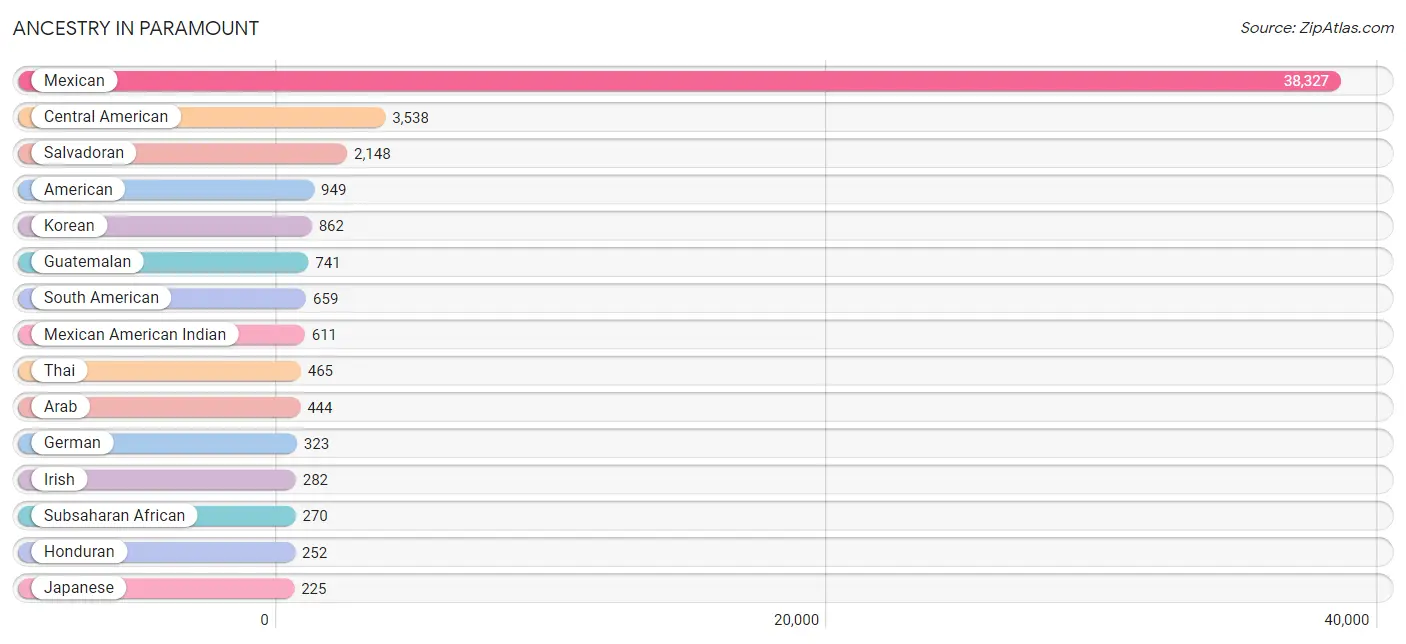
Ancestry in Paramount
The most populous ancestries reported in Paramount are Mexican (38,327 | 72.0%), Central American (3,538 | 6.6%), Salvadoran (2,148 | 4.0%), American (949 | 1.8%), and Korean (862 | 1.6%), together accounting for 86.0% of all Paramount residents.
| Ancestry | # Population | % Population |
| African | 32 | 0.1% |
| American | 949 | 1.8% |
| Apache | 22 | 0.0% |
| Arab | 444 | 0.8% |
| Argentinean | 95 | 0.2% |
| Armenian | 14 | 0.0% |
| Austrian | 24 | 0.1% |
| Belizean | 37 | 0.1% |
| Bhutanese | 110 | 0.2% |
| Blackfeet | 6 | 0.0% |
| Brazilian | 5 | 0.0% |
| Burmese | 218 | 0.4% |
| Cambodian | 18 | 0.0% |
| Central American | 3,538 | 6.6% |
| Central American Indian | 213 | 0.4% |
| Cherokee | 24 | 0.1% |
| Chilean | 78 | 0.2% |
| Choctaw | 27 | 0.1% |
| Colombian | 197 | 0.4% |
| Costa Rican | 189 | 0.4% |
| Croatian | 5 | 0.0% |
| Cuban | 91 | 0.2% |
| Czechoslovakian | 8 | 0.0% |
| Dominican | 9 | 0.0% |
| Dutch | 45 | 0.1% |
| Ecuadorian | 29 | 0.1% |
| Egyptian | 117 | 0.2% |
| English | 129 | 0.2% |
| Estonian | 29 | 0.1% |
| European | 53 | 0.1% |
| Finnish | 6 | 0.0% |
| French | 106 | 0.2% |
| French Canadian | 1 | 0.0% |
| German | 323 | 0.6% |
| Ghanaian | 42 | 0.1% |
| Guatemalan | 741 | 1.4% |
| Honduran | 252 | 0.5% |
| Hungarian | 15 | 0.0% |
| Indian (Asian) | 183 | 0.3% |
| Iranian | 6 | 0.0% |
| Irish | 282 | 0.5% |
| Iroquois | 115 | 0.2% |
| Italian | 179 | 0.3% |
| Japanese | 225 | 0.4% |
| Korean | 862 | 1.6% |
| Lebanese | 17 | 0.0% |
| Mexican | 38,327 | 72.0% |
| Mexican American Indian | 611 | 1.1% |
| Moroccan | 24 | 0.1% |
| Native Hawaiian | 19 | 0.0% |
| Nicaraguan | 136 | 0.3% |
| Nigerian | 196 | 0.4% |
| Pakistani | 124 | 0.2% |
| Panamanian | 6 | 0.0% |
| Peruvian | 87 | 0.2% |
| Polish | 17 | 0.0% |
| Portuguese | 47 | 0.1% |
| Puerto Rican | 83 | 0.2% |
| Russian | 22 | 0.0% |
| Salvadoran | 2,148 | 4.0% |
| Samoan | 124 | 0.2% |
| Scandinavian | 15 | 0.0% |
| Scotch-Irish | 14 | 0.0% |
| Scottish | 15 | 0.0% |
| South American | 659 | 1.2% |
| Spaniard | 24 | 0.1% |
| Sri Lankan | 87 | 0.2% |
| Subsaharan African | 270 | 0.5% |
| Swedish | 29 | 0.1% |
| Swiss | 18 | 0.0% |
| Thai | 465 | 0.9% |
| Turkish | 12 | 0.0% |
| Venezuelan | 27 | 0.1% |
| Welsh | 7 | 0.0% | View All 74 Rows |
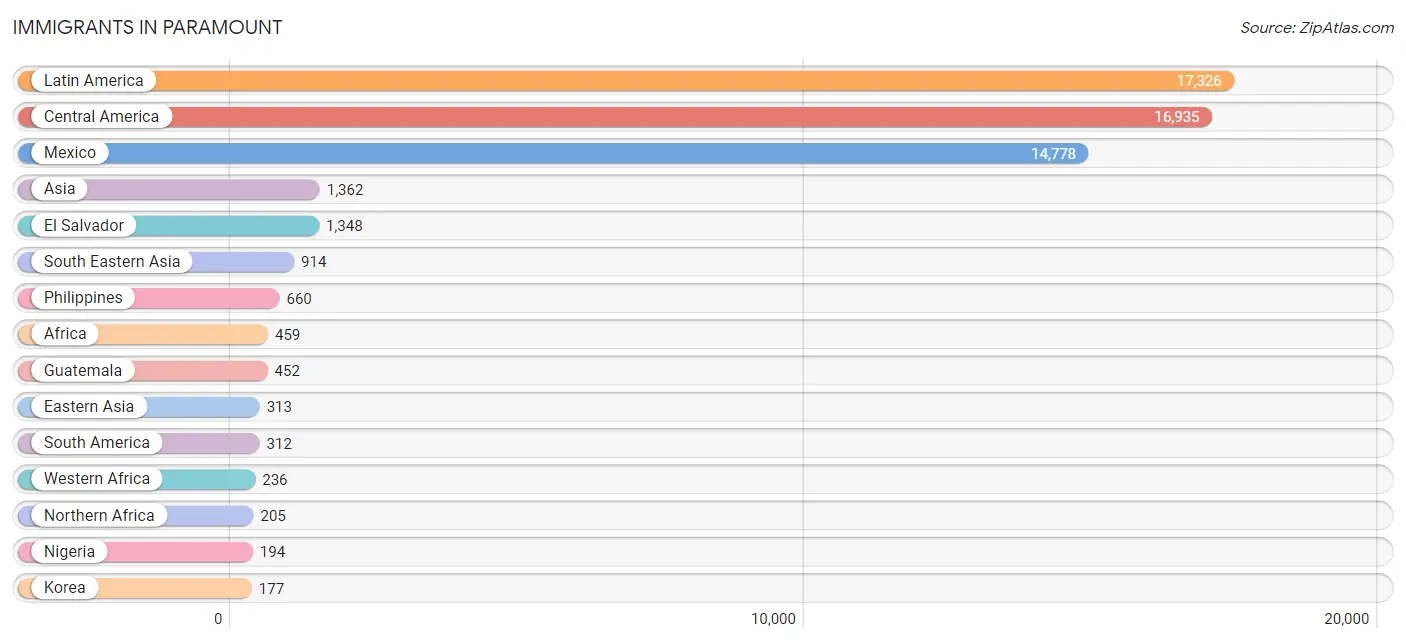
Immigrants in Paramount
The most numerous immigrant groups reported in Paramount came from Latin America (17,326 | 32.5%), Central America (16,935 | 31.8%), Mexico (14,778 | 27.8%), Asia (1,362 | 2.6%), and El Salvador (1,348 | 2.5%), together accounting for 97.2% of all Paramount residents.
| Immigration Origin | # Population | % Population |
| Africa | 459 | 0.9% |
| Argentina | 89 | 0.2% |
| Asia | 1,362 | 2.6% |
| Azores | 9 | 0.0% |
| Belize | 90 | 0.2% |
| Bolivia | 28 | 0.1% |
| Brazil | 3 | 0.0% |
| Cambodia | 57 | 0.1% |
| Canada | 16 | 0.0% |
| Caribbean | 79 | 0.2% |
| Central America | 16,935 | 31.8% |
| Chile | 19 | 0.0% |
| China | 64 | 0.1% |
| Colombia | 69 | 0.1% |
| Costa Rica | 81 | 0.2% |
| Cuba | 70 | 0.1% |
| Dominican Republic | 9 | 0.0% |
| Eastern Asia | 313 | 0.6% |
| Eastern Europe | 12 | 0.0% |
| Ecuador | 19 | 0.0% |
| Egypt | 107 | 0.2% |
| El Salvador | 1,348 | 2.5% |
| Europe | 65 | 0.1% |
| Germany | 8 | 0.0% |
| Ghana | 42 | 0.1% |
| Guatemala | 452 | 0.9% |
| Honduras | 163 | 0.3% |
| Hong Kong | 14 | 0.0% |
| India | 52 | 0.1% |
| Iran | 6 | 0.0% |
| Japan | 54 | 0.1% |
| Korea | 177 | 0.3% |
| Latin America | 17,326 | 32.5% |
| Lithuania | 12 | 0.0% |
| Mexico | 14,778 | 27.8% |
| Morocco | 24 | 0.1% |
| Netherlands | 7 | 0.0% |
| Nicaragua | 17 | 0.0% |
| Nigeria | 194 | 0.4% |
| Northern Africa | 205 | 0.4% |
| Northern Europe | 8 | 0.0% |
| Pakistan | 28 | 0.1% |
| Panama | 6 | 0.0% |
| Peru | 58 | 0.1% |
| Philippines | 660 | 1.2% |
| Portugal | 30 | 0.1% |
| South America | 312 | 0.6% |
| South Central Asia | 94 | 0.2% |
| South Eastern Asia | 914 | 1.7% |
| Southern Europe | 30 | 0.1% |
| Taiwan | 6 | 0.0% |
| Thailand | 138 | 0.3% |
| Turkey | 12 | 0.0% |
| Venezuela | 27 | 0.1% |
| Vietnam | 59 | 0.1% |
| Western Africa | 236 | 0.4% |
| Western Asia | 12 | 0.0% |
| Western Europe | 15 | 0.0% | View All 58 Rows |
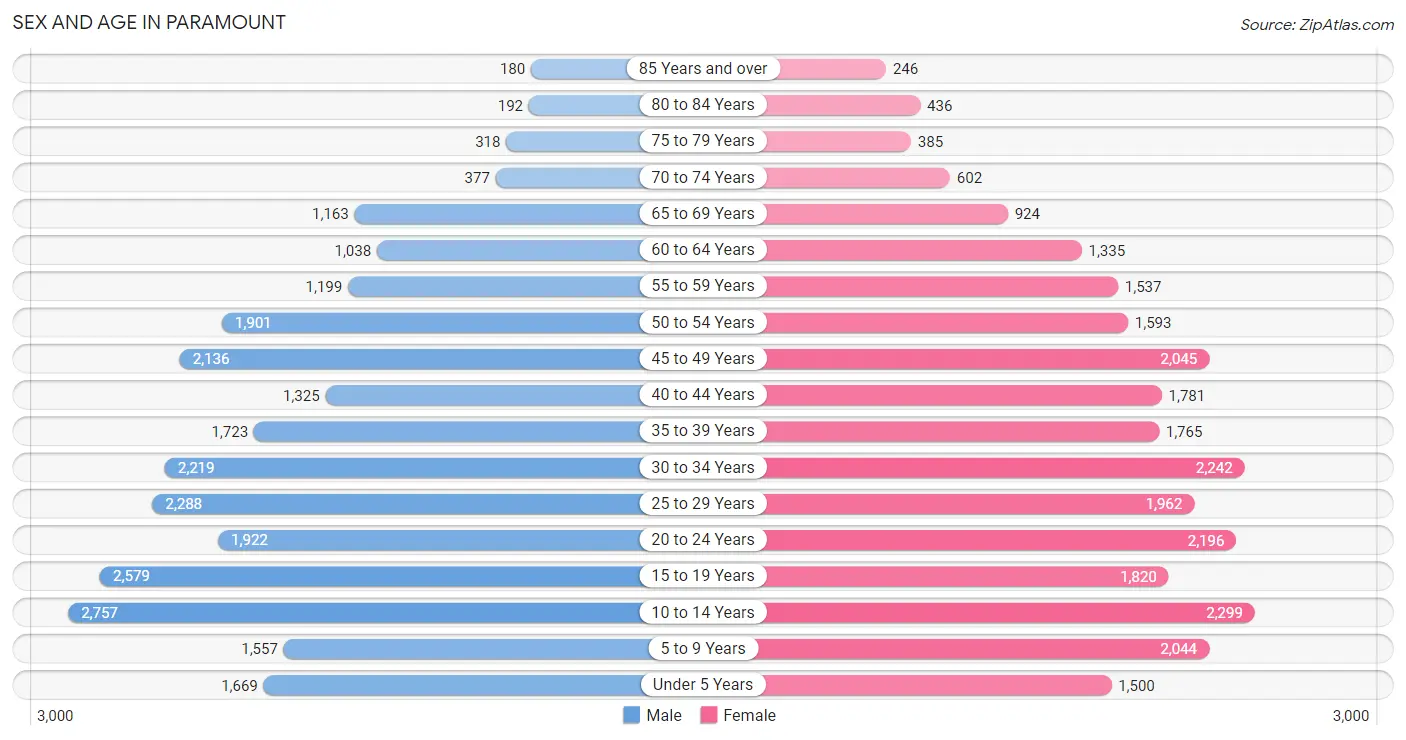
Sex and Age in Paramount
Sex and Age in Paramount
The most populous age groups in Paramount are 10 to 14 Years (2,757 | 10.4%) for men and 10 to 14 Years (2,299 | 8.6%) for women.
| Age Bracket | Male | Female |
| Under 5 Years | 1,669 (6.3%) | 1,500 (5.6%) |
| 5 to 9 Years | 1,557 (5.9%) | 2,044 (7.6%) |
| 10 to 14 Years | 2,757 (10.4%) | 2,299 (8.6%) |
| 15 to 19 Years | 2,579 (9.7%) | 1,820 (6.8%) |
| 20 to 24 Years | 1,922 (7.2%) | 2,196 (8.2%) |
| 25 to 29 Years | 2,288 (8.6%) | 1,962 (7.3%) |
| 30 to 34 Years | 2,219 (8.4%) | 2,242 (8.4%) |
| 35 to 39 Years | 1,723 (6.5%) | 1,765 (6.6%) |
| 40 to 44 Years | 1,325 (5.0%) | 1,781 (6.7%) |
| 45 to 49 Years | 2,136 (8.1%) | 2,045 (7.7%) |
| 50 to 54 Years | 1,901 (7.2%) | 1,593 (6.0%) |
| 55 to 59 Years | 1,199 (4.5%) | 1,537 (5.8%) |
| 60 to 64 Years | 1,038 (3.9%) | 1,335 (5.0%) |
| 65 to 69 Years | 1,163 (4.4%) | 924 (3.5%) |
| 70 to 74 Years | 377 (1.4%) | 602 (2.2%) |
| 75 to 79 Years | 318 (1.2%) | 385 (1.4%) |
| 80 to 84 Years | 192 (0.7%) | 436 (1.6%) |
| 85 Years and over | 180 (0.7%) | 246 (0.9%) |
| Total | 26,543 (100.0%) | 26,712 (100.0%) |
Families and Households in Paramount
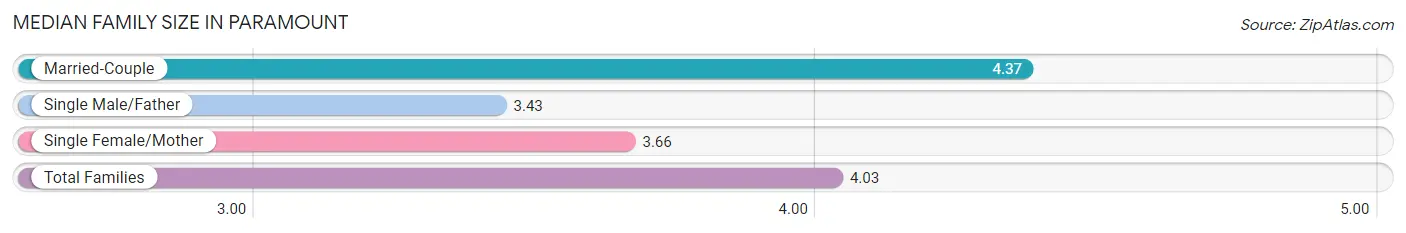
Median Family Size in Paramount
The median family size in Paramount is 4.03 persons per family, with married-couple families (6,647 | 56.8%) accounting for the largest median family size of 4.37 persons per family. On the other hand, single male/father families (1,612 | 13.8%) represent the smallest median family size with 3.43 persons per family.
| Family Type | # Families | Family Size |
| Married-Couple | 6,647 (56.8%) | 4.37 |
| Single Male/Father | 1,612 (13.8%) | 3.43 |
| Single Female/Mother | 3,452 (29.5%) | 3.66 |
| Total Families | 11,711 (100.0%) | 4.03 |
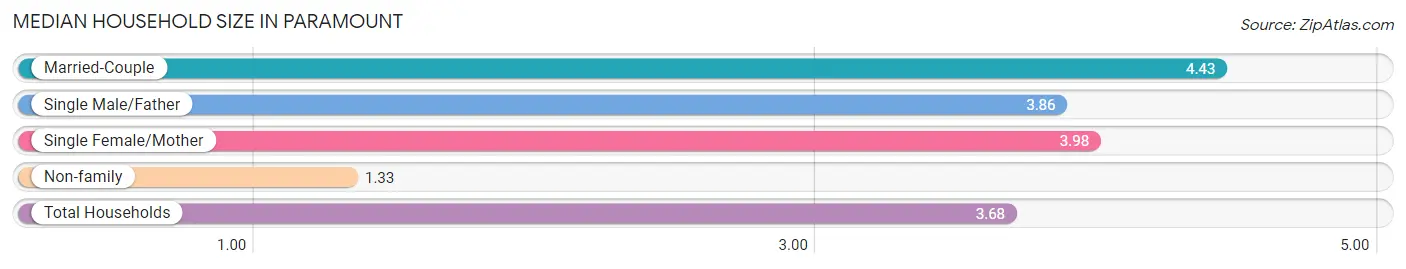
Median Household Size in Paramount
The median household size in Paramount is 3.68 persons per household, with married-couple households (6,647 | 46.3%) accounting for the largest median household size of 4.43 persons per household. non-family households (2,655 | 18.5%) represent the smallest median household size with 1.33 persons per household.
| Household Type | # Households | Household Size |
| Married-Couple | 6,647 (46.3%) | 4.43 |
| Single Male/Father | 1,612 (11.2%) | 3.86 |
| Single Female/Mother | 3,452 (24.0%) | 3.98 |
| Non-family | 2,655 (18.5%) | 1.33 |
| Total Households | 14,366 (100.0%) | 3.68 |
Household Size by Marriage Status in Paramount
Out of a total of 14,366 households in Paramount, 11,711 (81.5%) are family households, while 2,655 (18.5%) are nonfamily households. The most numerous type of family households are 4-person households, comprising 3,150, and the most common type of nonfamily households are 1-person households, comprising 2,028.
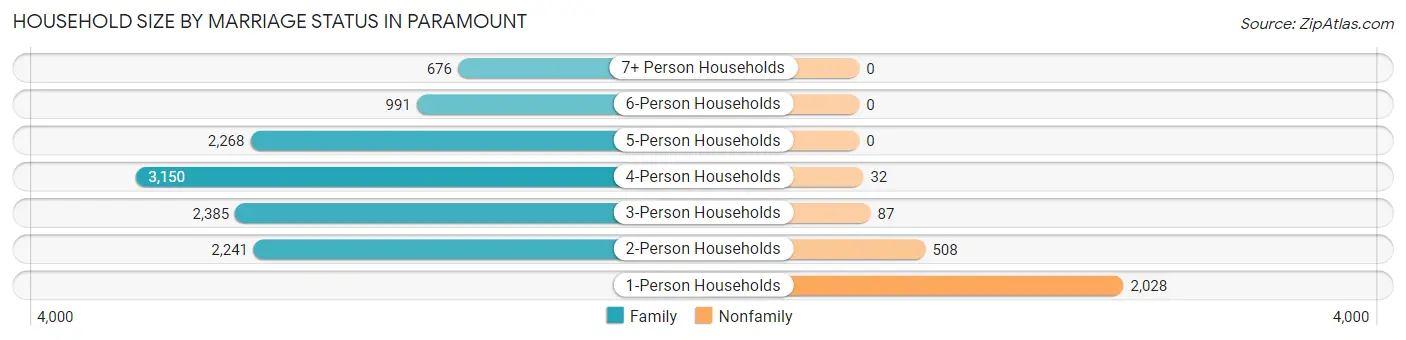
| Household Size | Family Households | Nonfamily Households |
| 1-Person Households | - | 2,028 (14.1%) |
| 2-Person Households | 2,241 (15.6%) | 508 (3.5%) |
| 3-Person Households | 2,385 (16.6%) | 87 (0.6%) |
| 4-Person Households | 3,150 (21.9%) | 32 (0.2%) |
| 5-Person Households | 2,268 (15.8%) | 0 (0.0%) |
| 6-Person Households | 991 (6.9%) | 0 (0.0%) |
| 7+ Person Households | 676 (4.7%) | 0 (0.0%) |
| Total | 11,711 (81.5%) | 2,655 (18.5%) |
Female Fertility in Paramount
Fertility by Age in Paramount
Average fertility rate in Paramount is 32.0 births per 1,000 women. Women in the age bracket of 20 to 34 years have the highest fertility rate with 53.0 births per 1,000 women. Women in the age bracket of 20 to 34 years acount for 75.8% of all women with births.
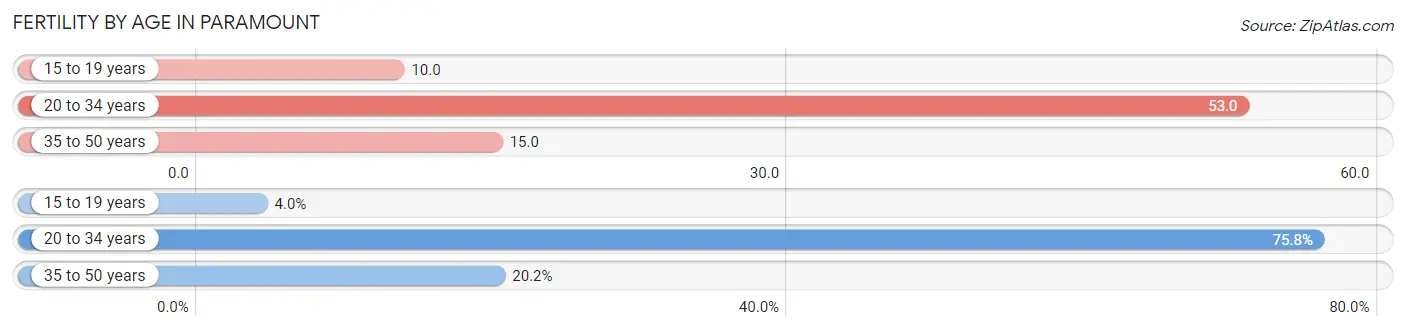
| Age Bracket | Women with Births | Births / 1,000 Women |
| 15 to 19 years | 18 (4.0%) | 10.0 |
| 20 to 34 years | 338 (75.8%) | 53.0 |
| 35 to 50 years | 90 (20.2%) | 15.0 |
| Total | 446 (100.0%) | 32.0 |
Fertility by Age by Marriage Status in Paramount
42.4% of women with births (446) in Paramount are married. The highest percentage of unmarried women with births falls into 15 to 19 years age bracket with 100.0% of them unmarried at the time of birth, while the lowest percentage of unmarried women with births belong to 20 to 34 years age bracket with 51.2% of them unmarried.
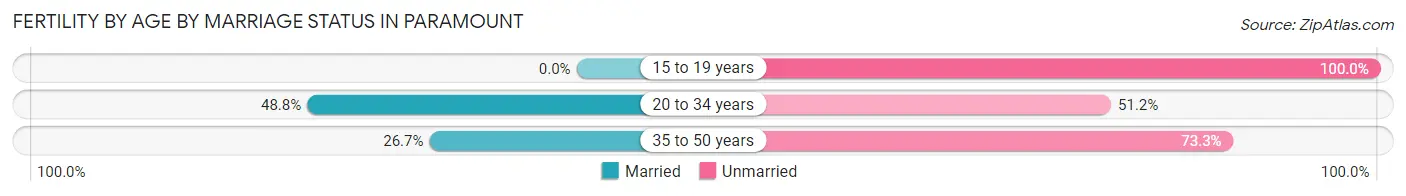
| Age Bracket | Married | Unmarried |
| 15 to 19 years | 0 (0.0%) | 18 (100.0%) |
| 20 to 34 years | 165 (48.8%) | 173 (51.2%) |
| 35 to 50 years | 24 (26.7%) | 66 (73.3%) |
| Total | 189 (42.4%) | 257 (57.6%) |
Fertility by Education in Paramount
Average fertility rate in Paramount is 32.0 births per 1,000 women. Women with the education attainment of graduate degree have the highest fertility rate of 39.0 births per 1,000 women, while women with the education attainment of less than high school have the lowest fertility at 19.0 births per 1,000 women. Women with the education attainment of college or associate's degree represent 37.0% of all women with births.
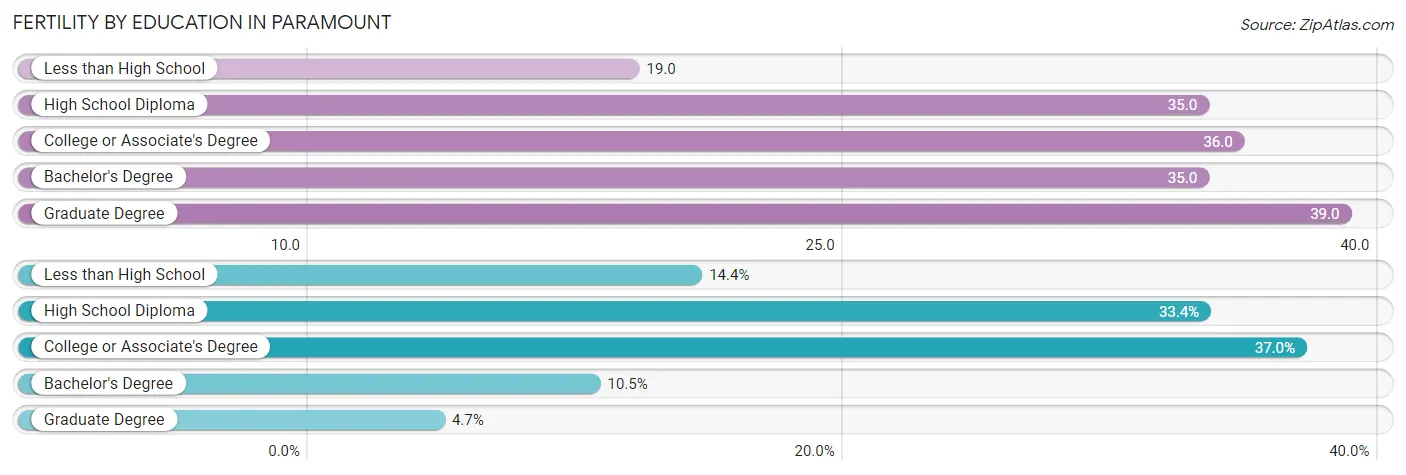
| Educational Attainment | Women with Births | Births / 1,000 Women |
| Less than High School | 64 (14.3%) | 19.0 |
| High School Diploma | 149 (33.4%) | 35.0 |
| College or Associate's Degree | 165 (37.0%) | 36.0 |
| Bachelor's Degree | 47 (10.5%) | 35.0 |
| Graduate Degree | 21 (4.7%) | 39.0 |
| Total | 446 (100.0%) | 32.0 |
Fertility by Education by Marriage Status in Paramount
57.6% of women with births in Paramount are unmarried. Women with the educational attainment of bachelor's degree are most likely to be married with 78.7% of them married at childbirth, while women with the educational attainment of less than high school are least likely to be married with 71.9% of them unmarried at childbirth.
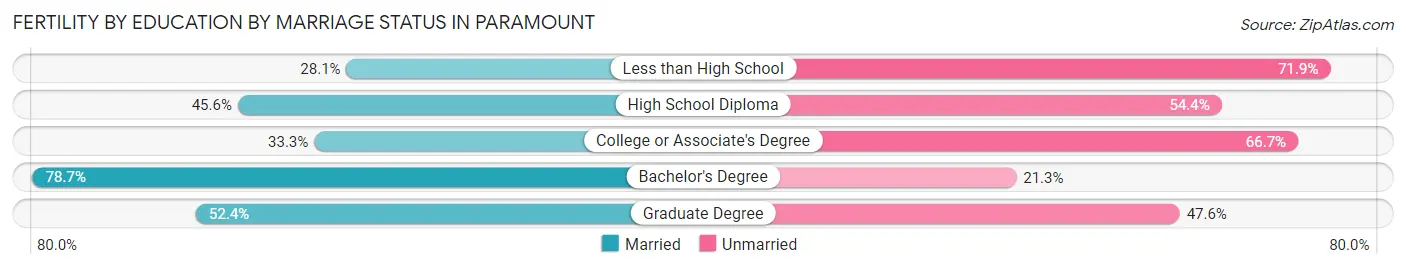
| Educational Attainment | Married | Unmarried |
| Less than High School | 18 (28.1%) | 46 (71.9%) |
| High School Diploma | 68 (45.6%) | 81 (54.4%) |
| College or Associate's Degree | 55 (33.3%) | 110 (66.7%) |
| Bachelor's Degree | 37 (78.7%) | 10 (21.3%) |
| Graduate Degree | 11 (52.4%) | 10 (47.6%) |
| Total | 189 (42.4%) | 257 (57.6%) |
Employment Characteristics in Paramount
Employment by Class of Employer in Paramount
Among the 24,371 employed individuals in Paramount, private company employees (18,375 | 75.4%), local government employees (2,008 | 8.2%), and self-employed (not incorporated) (1,515 | 6.2%) make up the most common classes of employment.
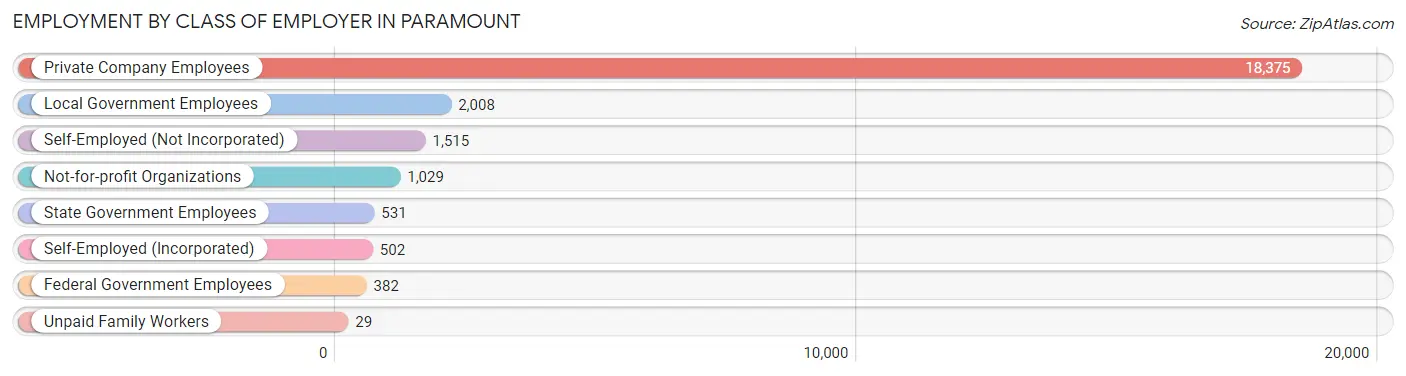
| Employer Class | # Employees | % Employees |
| Private Company Employees | 18,375 | 75.4% |
| Self-Employed (Incorporated) | 502 | 2.1% |
| Self-Employed (Not Incorporated) | 1,515 | 6.2% |
| Not-for-profit Organizations | 1,029 | 4.2% |
| Local Government Employees | 2,008 | 8.2% |
| State Government Employees | 531 | 2.2% |
| Federal Government Employees | 382 | 1.6% |
| Unpaid Family Workers | 29 | 0.1% |
| Total | 24,371 | 100.0% |
Employment Status by Age in Paramount
According to the labor force statistics for Paramount, out of the total population over 16 years of age (40,664), 65.7% or 26,716 individuals are in the labor force, with 5.3% or 1,416 of them unemployed. The age group with the highest labor force participation rate is 25 to 29 years, with 83.9% or 3,566 individuals in the labor force. Within the labor force, the 16 to 19 years age range has the highest percentage of unemployed individuals, with 18.5% or 227 of them being unemployed.
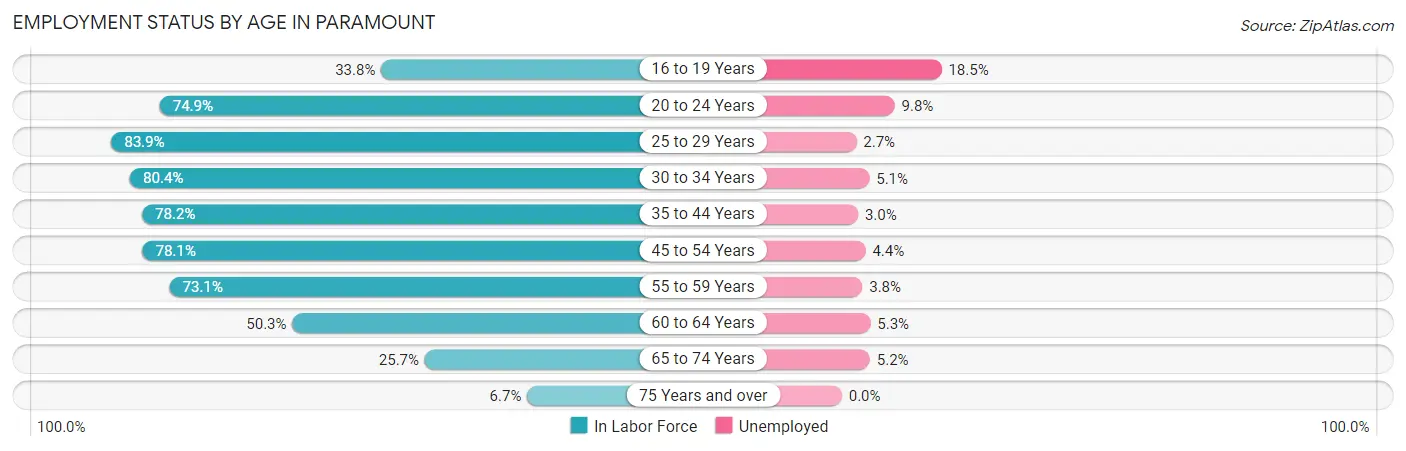
| Age Bracket | In Labor Force | Unemployed |
| 16 to 19 Years | 1,228 (33.8%) | 227 (18.5%) |
| 20 to 24 Years | 3,084 (74.9%) | 302 (9.8%) |
| 25 to 29 Years | 3,566 (83.9%) | 96 (2.7%) |
| 30 to 34 Years | 3,587 (80.4%) | 183 (5.1%) |
| 35 to 44 Years | 5,157 (78.2%) | 155 (3.0%) |
| 45 to 54 Years | 5,994 (78.1%) | 264 (4.4%) |
| 55 to 59 Years | 2,000 (73.1%) | 76 (3.8%) |
| 60 to 64 Years | 1,194 (50.3%) | 63 (5.3%) |
| 65 to 74 Years | 788 (25.7%) | 41 (5.2%) |
| 75 Years and over | 118 (6.7%) | 0 (0.0%) |
| Total | 26,716 (65.7%) | 1,416 (5.3%) |
Employment Status by Educational Attainment in Paramount
According to labor force statistics for Paramount, 76.5% of individuals (21,488) out of the total population between 25 and 64 years of age (28,089) are in the labor force, with 3.9% or 838 of them being unemployed. The group with the highest labor force participation rate are those with the educational attainment of bachelor's degree or higher, with 88.0% or 3,301 individuals in the labor force. Within the labor force, individuals with high school diploma education have the highest percentage of unemployment, with 4.5% or 278 of them being unemployed.
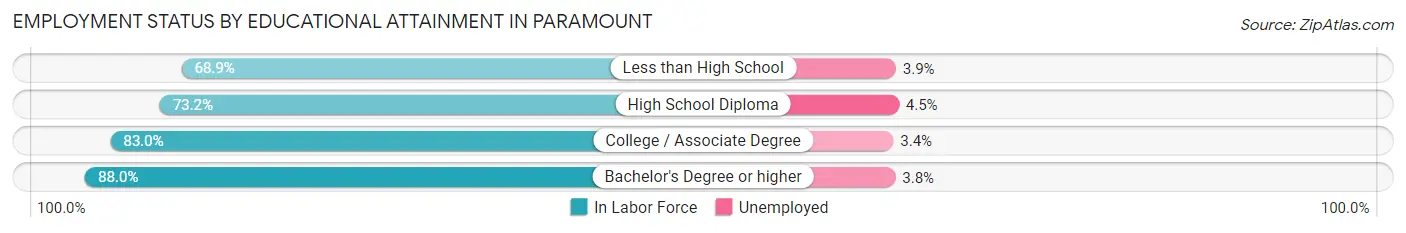
| Educational Attainment | In Labor Force | Unemployed |
| Less than High School | 5,781 (68.9%) | 327 (3.9%) |
| High School Diploma | 6,185 (73.2%) | 380 (4.5%) |
| College / Associate Degree | 6,223 (83.0%) | 255 (3.4%) |
| Bachelor's Degree or higher | 3,301 (88.0%) | 143 (3.8%) |
| Total | 21,488 (76.5%) | 1,095 (3.9%) |
Employment Occupations by Sex in Paramount
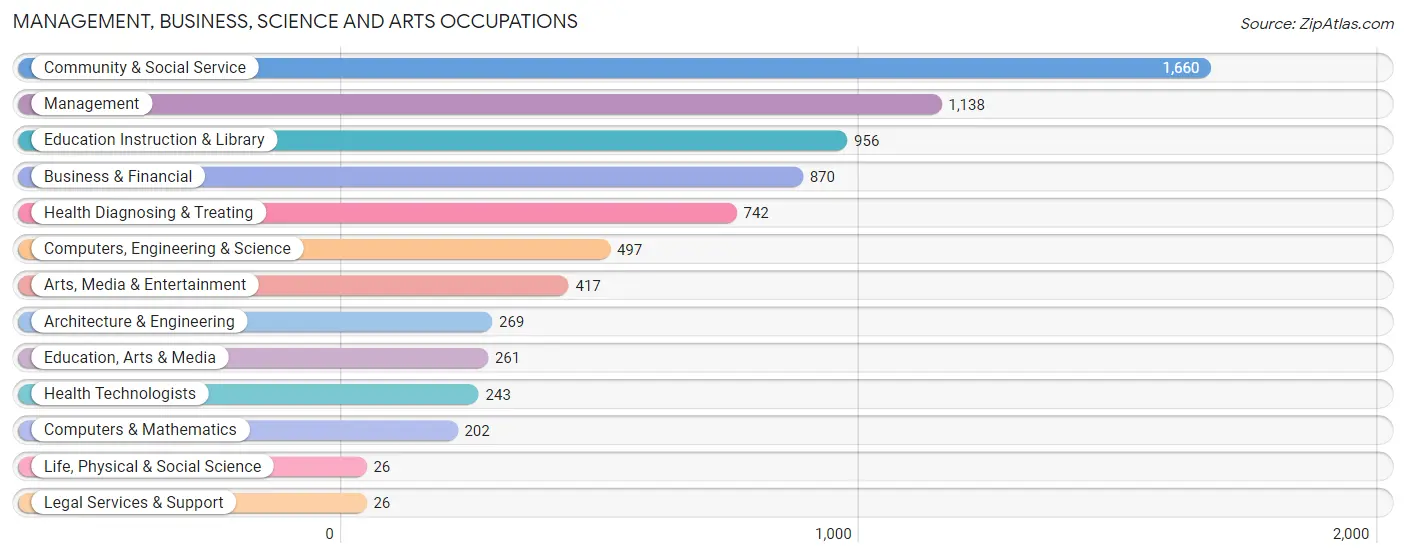
Management, Business, Science and Arts Occupations
The most common Management, Business, Science and Arts occupations in Paramount are Community & Social Service (1,660 | 6.6%), Management (1,138 | 4.5%), Education Instruction & Library (956 | 3.8%), Business & Financial (870 | 3.4%), and Health Diagnosing & Treating (742 | 2.9%).
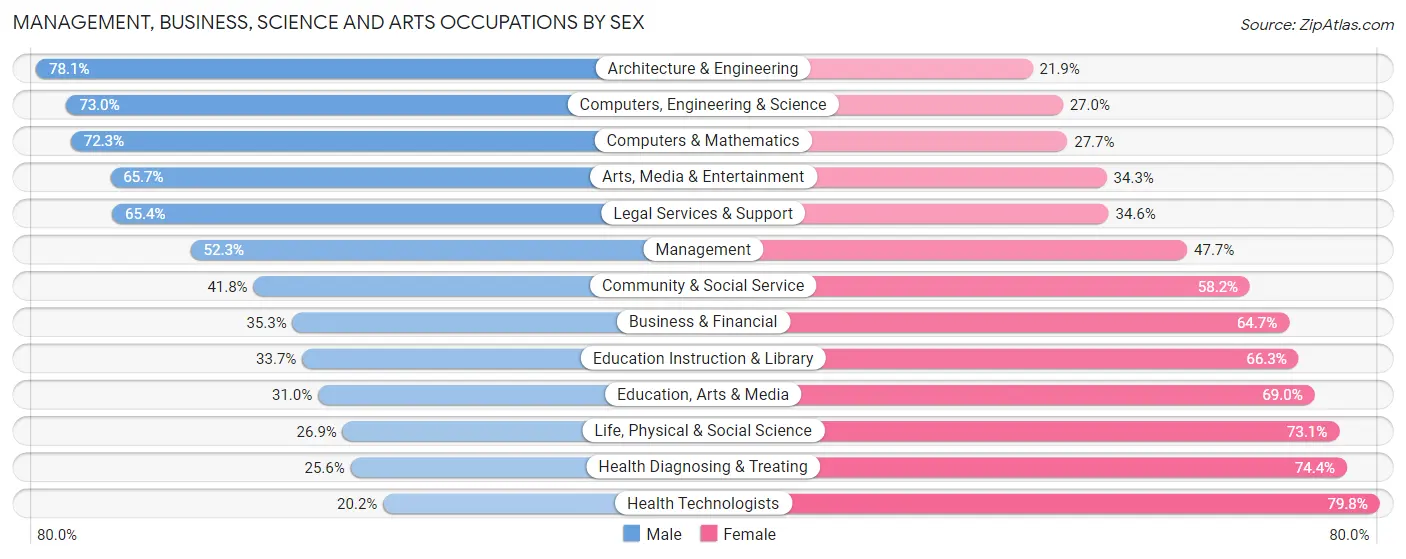
Management, Business, Science and Arts Occupations by Sex
Within the Management, Business, Science and Arts occupations in Paramount, the most male-oriented occupations are Architecture & Engineering (78.1%), Computers, Engineering & Science (73.0%), and Computers & Mathematics (72.3%), while the most female-oriented occupations are Health Technologists (79.8%), Health Diagnosing & Treating (74.4%), and Life, Physical & Social Science (73.1%).
| Occupation | Male | Female |
| Management | 595 (52.3%) | 543 (47.7%) |
| Business & Financial | 307 (35.3%) | 563 (64.7%) |
| Computers, Engineering & Science | 363 (73.0%) | 134 (27.0%) |
| Computers & Mathematics | 146 (72.3%) | 56 (27.7%) |
| Architecture & Engineering | 210 (78.1%) | 59 (21.9%) |
| Life, Physical & Social Science | 7 (26.9%) | 19 (73.1%) |
| Community & Social Service | 694 (41.8%) | 966 (58.2%) |
| Education, Arts & Media | 81 (31.0%) | 180 (69.0%) |
| Legal Services & Support | 17 (65.4%) | 9 (34.6%) |
| Education Instruction & Library | 322 (33.7%) | 634 (66.3%) |
| Arts, Media & Entertainment | 274 (65.7%) | 143 (34.3%) |
| Health Diagnosing & Treating | 190 (25.6%) | 552 (74.4%) |
| Health Technologists | 49 (20.2%) | 194 (79.8%) |
| Total (Category) | 2,149 (43.8%) | 2,758 (56.2%) |
| Total (Overall) | 14,066 (55.6%) | 11,216 (44.4%) |
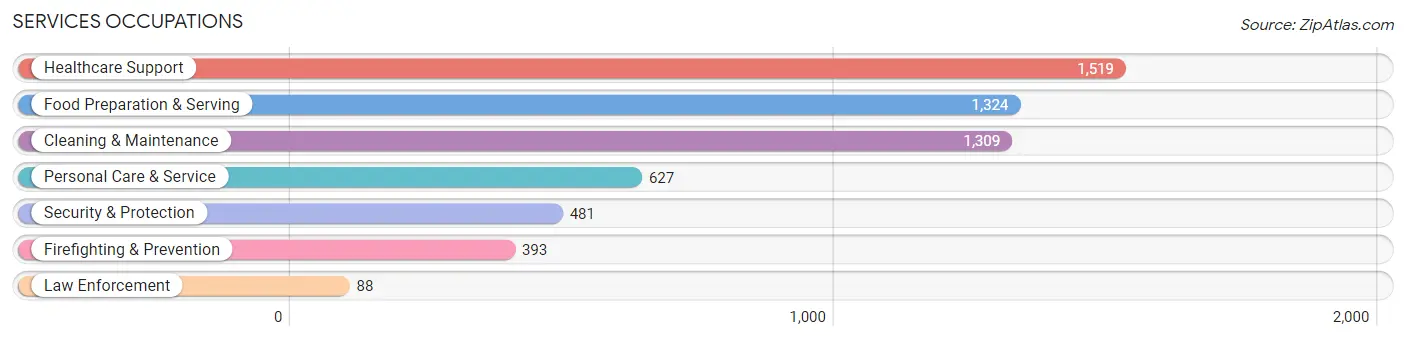
Services Occupations
The most common Services occupations in Paramount are Healthcare Support (1,519 | 6.0%), Food Preparation & Serving (1,324 | 5.2%), Cleaning & Maintenance (1,309 | 5.2%), Personal Care & Service (627 | 2.5%), and Security & Protection (481 | 1.9%).
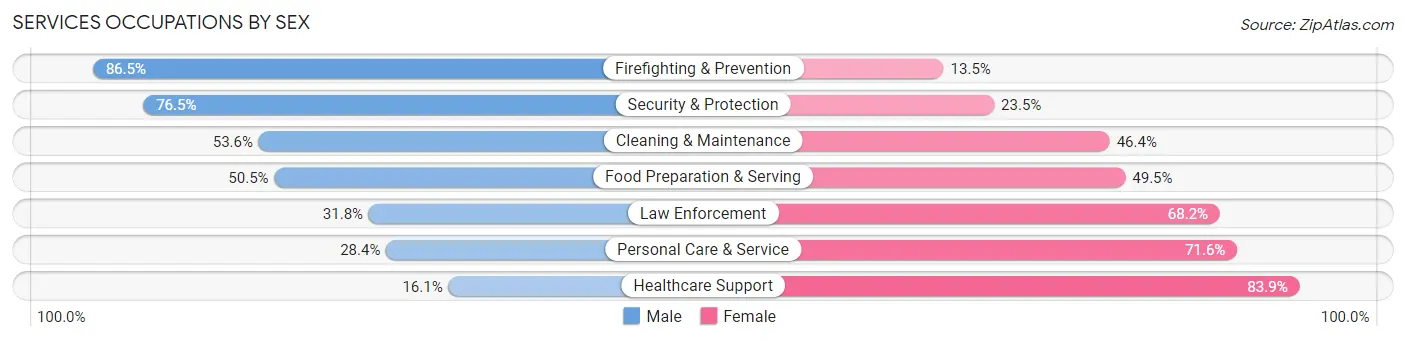
Services Occupations by Sex
Within the Services occupations in Paramount, the most male-oriented occupations are Firefighting & Prevention (86.5%), Security & Protection (76.5%), and Cleaning & Maintenance (53.6%), while the most female-oriented occupations are Healthcare Support (83.9%), Personal Care & Service (71.6%), and Law Enforcement (68.2%).
| Occupation | Male | Female |
| Healthcare Support | 244 (16.1%) | 1,275 (83.9%) |
| Security & Protection | 368 (76.5%) | 113 (23.5%) |
| Firefighting & Prevention | 340 (86.5%) | 53 (13.5%) |
| Law Enforcement | 28 (31.8%) | 60 (68.2%) |
| Food Preparation & Serving | 669 (50.5%) | 655 (49.5%) |
| Cleaning & Maintenance | 702 (53.6%) | 607 (46.4%) |
| Personal Care & Service | 178 (28.4%) | 449 (71.6%) |
| Total (Category) | 2,161 (41.1%) | 3,099 (58.9%) |
| Total (Overall) | 14,066 (55.6%) | 11,216 (44.4%) |
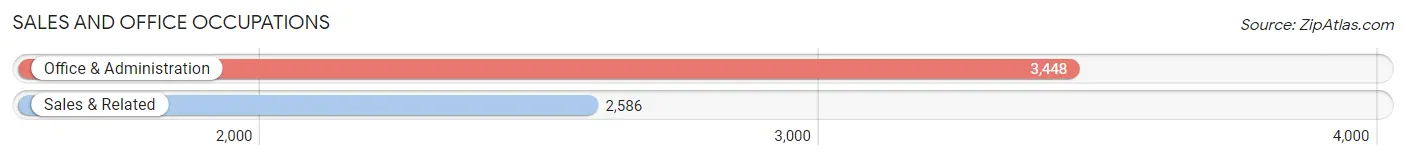
Sales and Office Occupations
The most common Sales and Office occupations in Paramount are Office & Administration (3,448 | 13.6%), and Sales & Related (2,586 | 10.2%).
Sales and Office Occupations by Sex
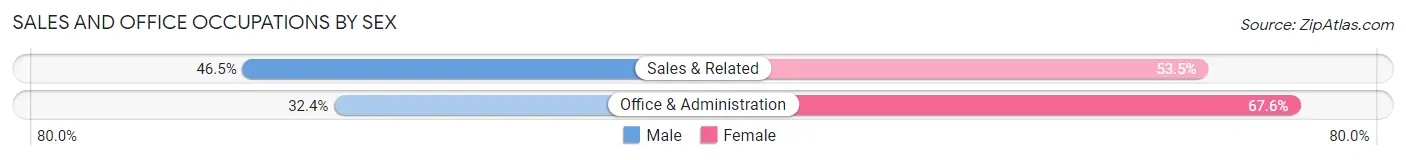
| Occupation | Male | Female |
| Sales & Related | 1,202 (46.5%) | 1,384 (53.5%) |
| Office & Administration | 1,116 (32.4%) | 2,332 (67.6%) |
| Total (Category) | 2,318 (38.4%) | 3,716 (61.6%) |
| Total (Overall) | 14,066 (55.6%) | 11,216 (44.4%) |
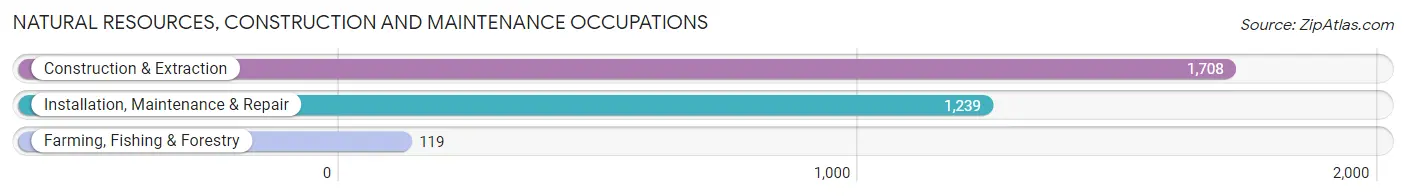
Natural Resources, Construction and Maintenance Occupations
The most common Natural Resources, Construction and Maintenance occupations in Paramount are Construction & Extraction (1,708 | 6.8%), Installation, Maintenance & Repair (1,239 | 4.9%), and Farming, Fishing & Forestry (119 | 0.5%).
Natural Resources, Construction and Maintenance Occupations by Sex
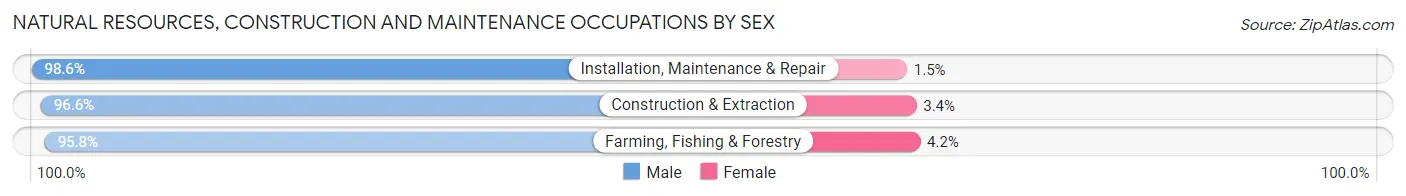
| Occupation | Male | Female |
| Farming, Fishing & Forestry | 114 (95.8%) | 5 (4.2%) |
| Construction & Extraction | 1,650 (96.6%) | 58 (3.4%) |
| Installation, Maintenance & Repair | 1,221 (98.6%) | 18 (1.5%) |
| Total (Category) | 2,985 (97.4%) | 81 (2.6%) |
| Total (Overall) | 14,066 (55.6%) | 11,216 (44.4%) |
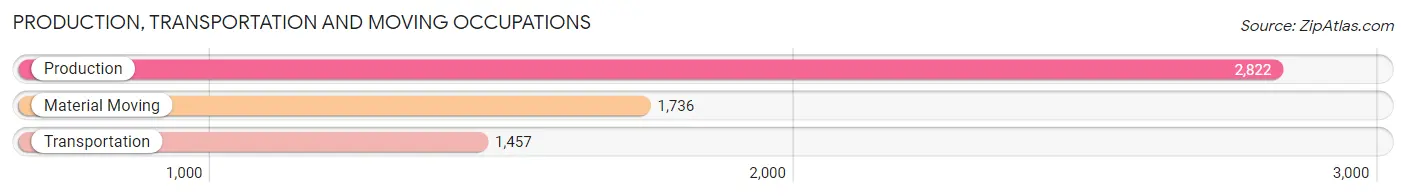
Production, Transportation and Moving Occupations
The most common Production, Transportation and Moving occupations in Paramount are Production (2,822 | 11.2%), Material Moving (1,736 | 6.9%), and Transportation (1,457 | 5.8%).
Production, Transportation and Moving Occupations by Sex
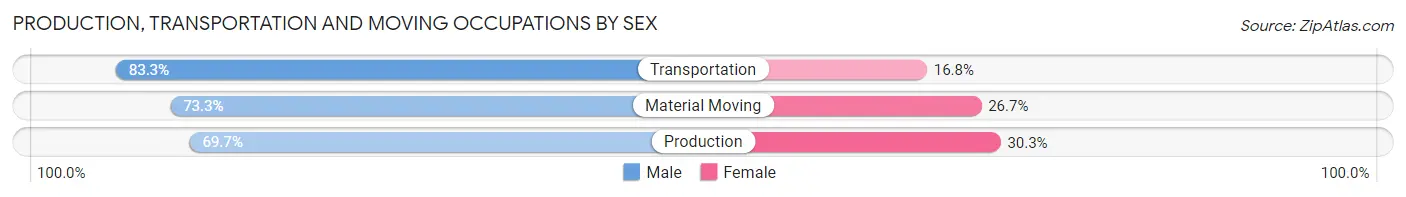
| Occupation | Male | Female |
| Production | 1,968 (69.7%) | 854 (30.3%) |
| Transportation | 1,213 (83.3%) | 244 (16.8%) |
| Material Moving | 1,272 (73.3%) | 464 (26.7%) |
| Total (Category) | 4,453 (74.0%) | 1,562 (26.0%) |
| Total (Overall) | 14,066 (55.6%) | 11,216 (44.4%) |
Employment Industries by Sex in Paramount
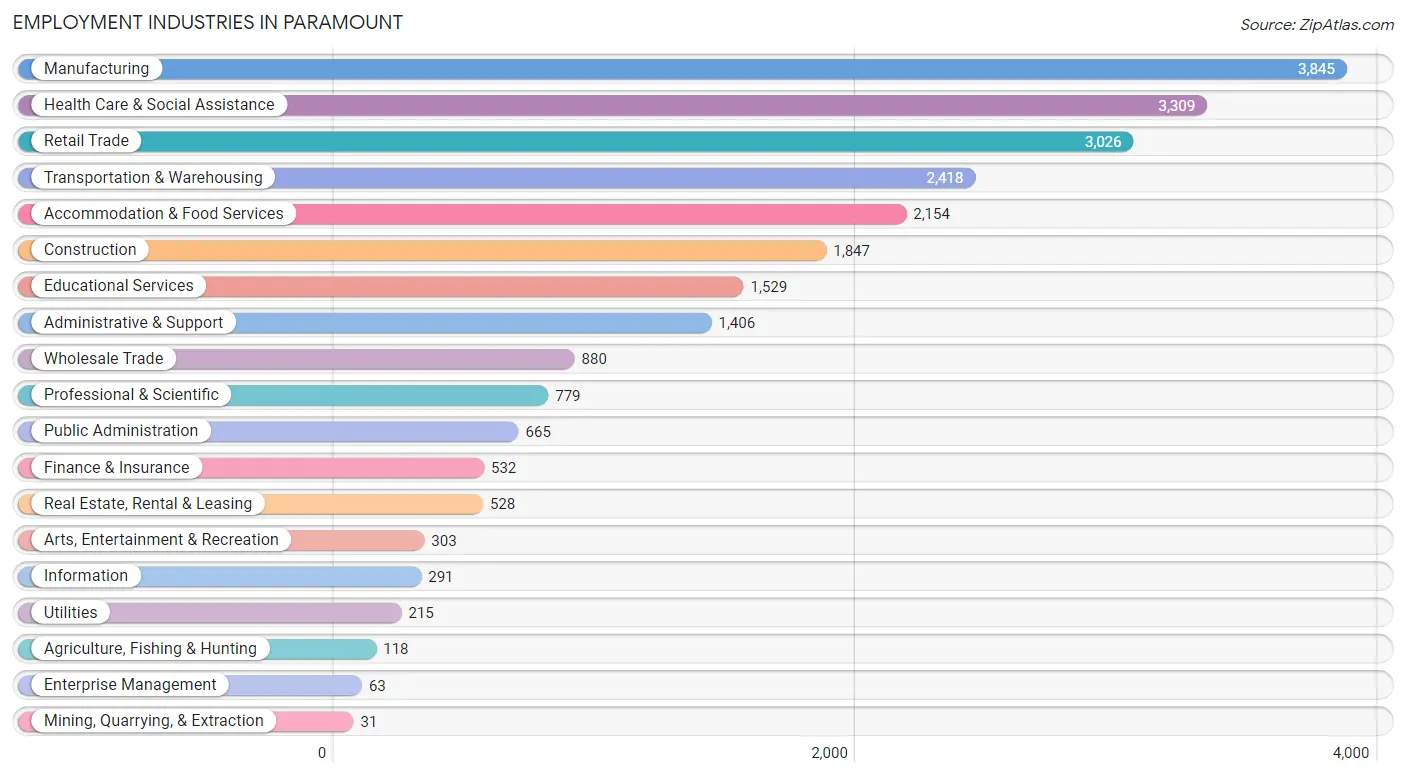
Employment Industries in Paramount
The major employment industries in Paramount include Manufacturing (3,845 | 15.2%), Health Care & Social Assistance (3,309 | 13.1%), Retail Trade (3,026 | 12.0%), Transportation & Warehousing (2,418 | 9.6%), and Accommodation & Food Services (2,154 | 8.5%).
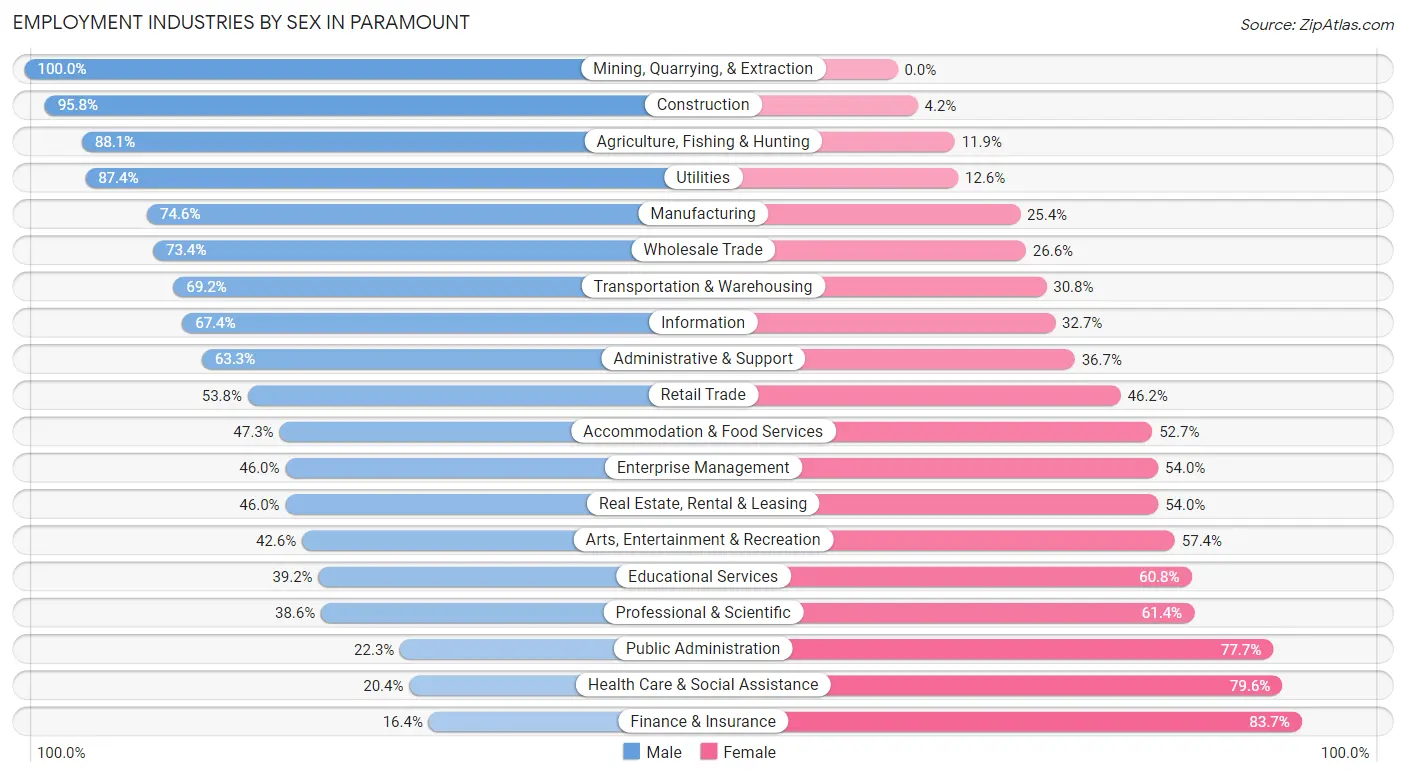
Employment Industries by Sex in Paramount
The Paramount industries that see more men than women are Mining, Quarrying, & Extraction (100.0%), Construction (95.8%), and Agriculture, Fishing & Hunting (88.1%), whereas the industries that tend to have a higher number of women are Finance & Insurance (83.7%), Health Care & Social Assistance (79.6%), and Public Administration (77.7%).
| Industry | Male | Female |
| Agriculture, Fishing & Hunting | 104 (88.1%) | 14 (11.9%) |
| Mining, Quarrying, & Extraction | 31 (100.0%) | 0 (0.0%) |
| Construction | 1,770 (95.8%) | 77 (4.2%) |
| Manufacturing | 2,870 (74.6%) | 975 (25.4%) |
| Wholesale Trade | 646 (73.4%) | 234 (26.6%) |
| Retail Trade | 1,628 (53.8%) | 1,398 (46.2%) |
| Transportation & Warehousing | 1,673 (69.2%) | 745 (30.8%) |
| Utilities | 188 (87.4%) | 27 (12.6%) |
| Information | 196 (67.3%) | 95 (32.7%) |
| Finance & Insurance | 87 (16.4%) | 445 (83.7%) |
| Real Estate, Rental & Leasing | 243 (46.0%) | 285 (54.0%) |
| Professional & Scientific | 301 (38.6%) | 478 (61.4%) |
| Enterprise Management | 29 (46.0%) | 34 (54.0%) |
| Administrative & Support | 890 (63.3%) | 516 (36.7%) |
| Educational Services | 599 (39.2%) | 930 (60.8%) |
| Health Care & Social Assistance | 674 (20.4%) | 2,635 (79.6%) |
| Arts, Entertainment & Recreation | 129 (42.6%) | 174 (57.4%) |
| Accommodation & Food Services | 1,018 (47.3%) | 1,136 (52.7%) |
| Public Administration | 148 (22.3%) | 517 (77.7%) |
| Total | 14,066 (55.6%) | 11,216 (44.4%) |
Education in Paramount
School Enrollment in Paramount
The most common levels of schooling among the 15,931 students in Paramount are middle school (3,768 | 23.6%), college / undergraduate (3,725 | 23.4%), and high school (3,623 | 22.7%).
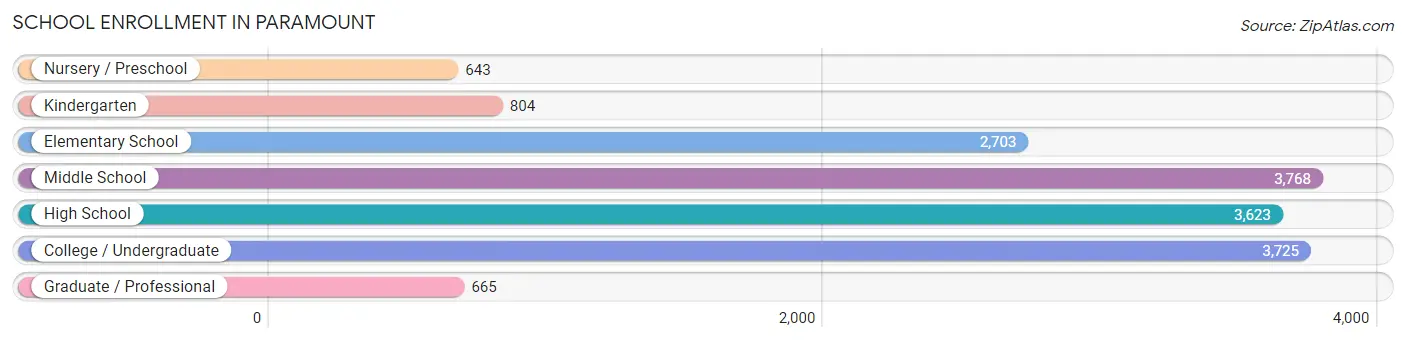
| School Level | # Students | % Students |
| Nursery / Preschool | 643 | 4.0% |
| Kindergarten | 804 | 5.1% |
| Elementary School | 2,703 | 17.0% |
| Middle School | 3,768 | 23.6% |
| High School | 3,623 | 22.7% |
| College / Undergraduate | 3,725 | 23.4% |
| Graduate / Professional | 665 | 4.2% |
| Total | 15,931 | 100.0% |
School Enrollment by Age by Funding Source in Paramount
Out of a total of 15,931 students who are enrolled in schools in Paramount, 1,259 (7.9%) attend a private institution, while the remaining 14,672 (92.1%) are enrolled in public schools. The age group of 35 years and over has the highest likelihood of being enrolled in private schools, with 308 (44.4% in the age bracket) enrolled. Conversely, the age group of 10 to 14 year olds has the lowest likelihood of being enrolled in a private school, with 4,693 (97.2% in the age bracket) attending a public institution.
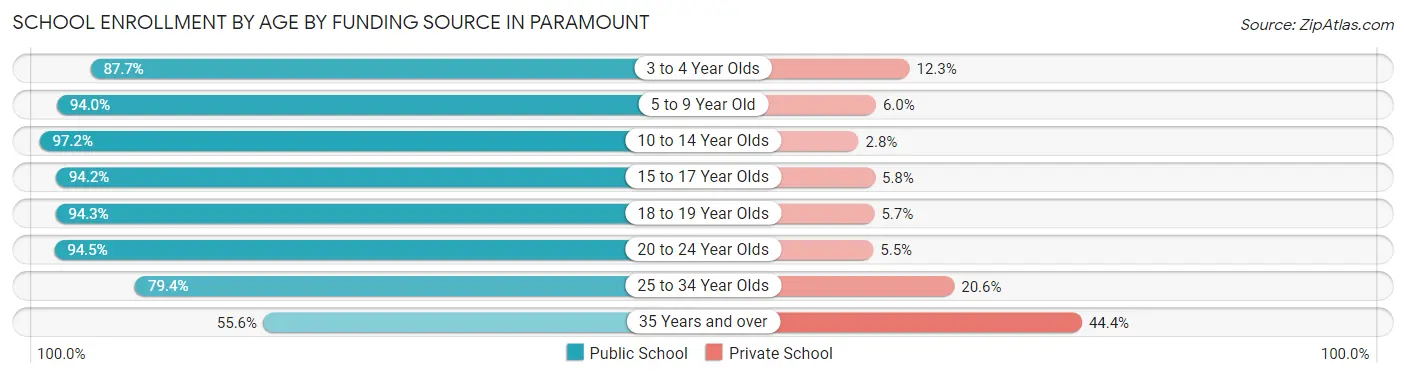
| Age Bracket | Public School | Private School |
| 3 to 4 Year Olds | 522 (87.7%) | 73 (12.3%) |
| 5 to 9 Year Old | 3,096 (94.0%) | 198 (6.0%) |
| 10 to 14 Year Olds | 4,693 (97.2%) | 134 (2.8%) |
| 15 to 17 Year Olds | 2,177 (94.2%) | 135 (5.8%) |
| 18 to 19 Year Olds | 1,215 (94.3%) | 74 (5.7%) |
| 20 to 24 Year Olds | 1,690 (94.5%) | 99 (5.5%) |
| 25 to 34 Year Olds | 898 (79.4%) | 233 (20.6%) |
| 35 Years and over | 386 (55.6%) | 308 (44.4%) |
| Total | 14,672 (92.1%) | 1,259 (7.9%) |
Educational Attainment by Field of Study in Paramount
Business (1,033 | 22.4%), arts & humanities (600 | 13.0%), science & technology (468 | 10.2%), education (441 | 9.6%), and social sciences (388 | 8.4%) are the most common fields of study among 4,603 individuals in Paramount who have obtained a bachelor's degree or higher.
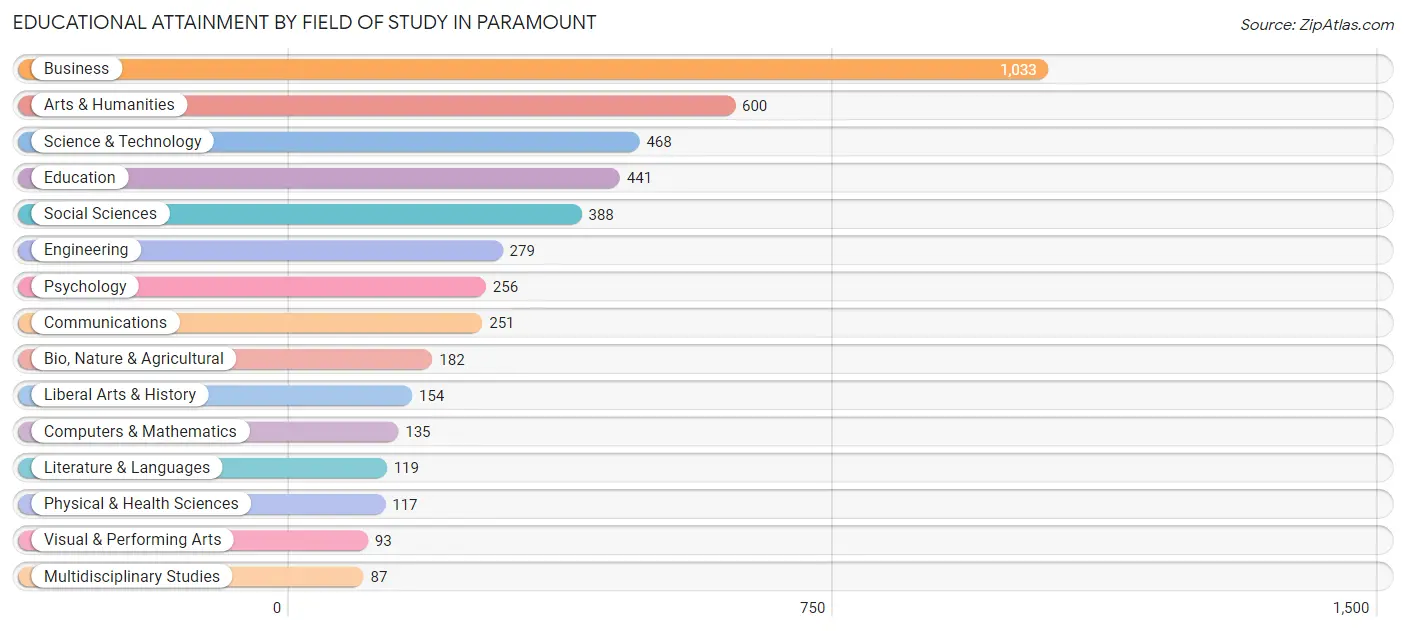
| Field of Study | # Graduates | % Graduates |
| Computers & Mathematics | 135 | 2.9% |
| Bio, Nature & Agricultural | 182 | 4.0% |
| Physical & Health Sciences | 117 | 2.5% |
| Psychology | 256 | 5.6% |
| Social Sciences | 388 | 8.4% |
| Engineering | 279 | 6.1% |
| Multidisciplinary Studies | 87 | 1.9% |
| Science & Technology | 468 | 10.2% |
| Business | 1,033 | 22.4% |
| Education | 441 | 9.6% |
| Literature & Languages | 119 | 2.6% |
| Liberal Arts & History | 154 | 3.4% |
| Visual & Performing Arts | 93 | 2.0% |
| Communications | 251 | 5.4% |
| Arts & Humanities | 600 | 13.0% |
| Total | 4,603 | 100.0% |
Transportation & Commute in Paramount
Vehicle Availability by Sex in Paramount
The most prevalent vehicle ownership categories in Paramount are males with 2 vehicles (4,824, accounting for 35.4%) and females with 2 vehicles (3,803, making up 45.0%).
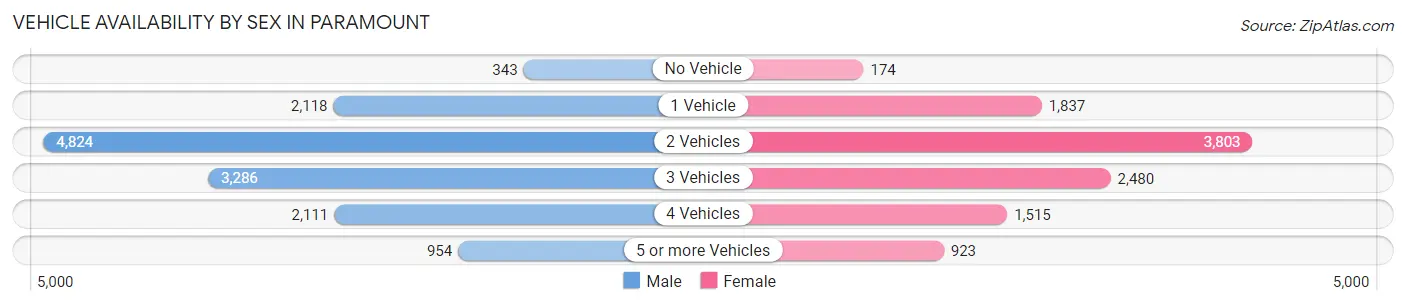
| Vehicles Available | Male | Female |
| No Vehicle | 343 (2.5%) | 174 (1.6%) |
| 1 Vehicle | 2,118 (15.5%) | 1,837 (17.1%) |
| 2 Vehicles | 4,824 (35.4%) | 3,803 (35.4%) |
| 3 Vehicles | 3,286 (24.1%) | 2,480 (23.1%) |
| 4 Vehicles | 2,111 (15.5%) | 1,515 (14.1%) |
| 5 or more Vehicles | 954 (7.0%) | 923 (8.6%) |
| Total | 13,636 (100.0%) | 10,732 (100.0%) |
Commute Time in Paramount
The most frequently occuring commute durations in Paramount are 30 to 34 minutes (5,282 commuters, 22.9%), 20 to 24 minutes (3,678 commuters, 16.0%), and 15 to 19 minutes (3,239 commuters, 14.1%).
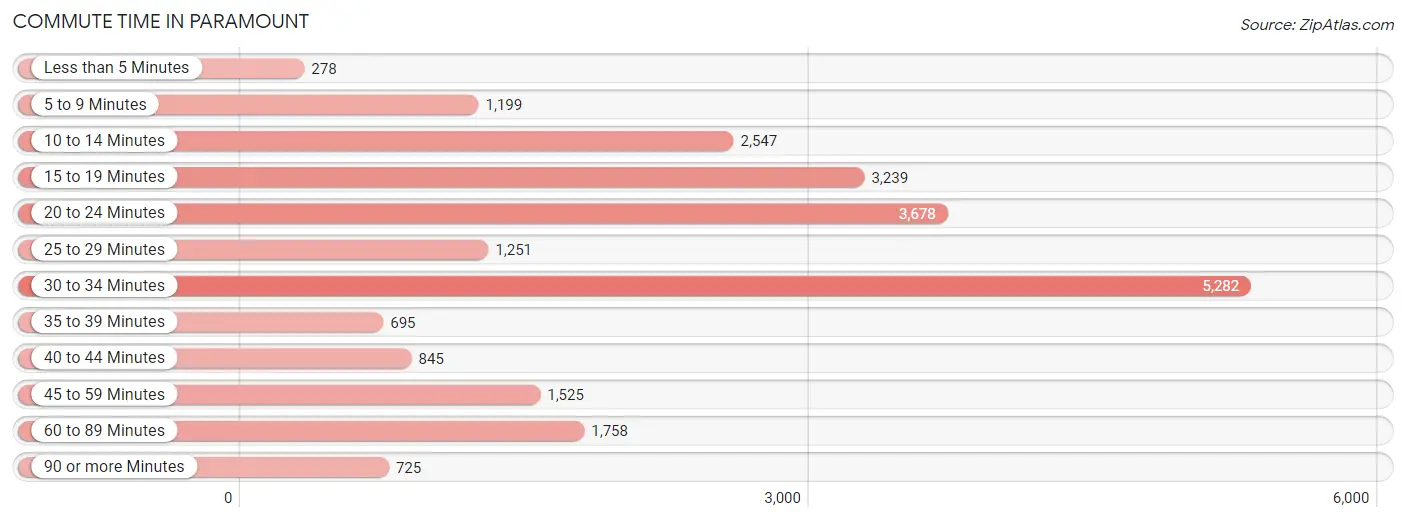
| Commute Time | # Commuters | % Commuters |
| Less than 5 Minutes | 278 | 1.2% |
| 5 to 9 Minutes | 1,199 | 5.2% |
| 10 to 14 Minutes | 2,547 | 11.1% |
| 15 to 19 Minutes | 3,239 | 14.1% |
| 20 to 24 Minutes | 3,678 | 16.0% |
| 25 to 29 Minutes | 1,251 | 5.4% |
| 30 to 34 Minutes | 5,282 | 22.9% |
| 35 to 39 Minutes | 695 | 3.0% |
| 40 to 44 Minutes | 845 | 3.7% |
| 45 to 59 Minutes | 1,525 | 6.6% |
| 60 to 89 Minutes | 1,758 | 7.6% |
| 90 or more Minutes | 725 | 3.2% |
Commute Time by Sex in Paramount
The most common commute times in Paramount are 30 to 34 minutes (3,166 commuters, 24.0%) for males and 30 to 34 minutes (2,116 commuters, 21.5%) for females.
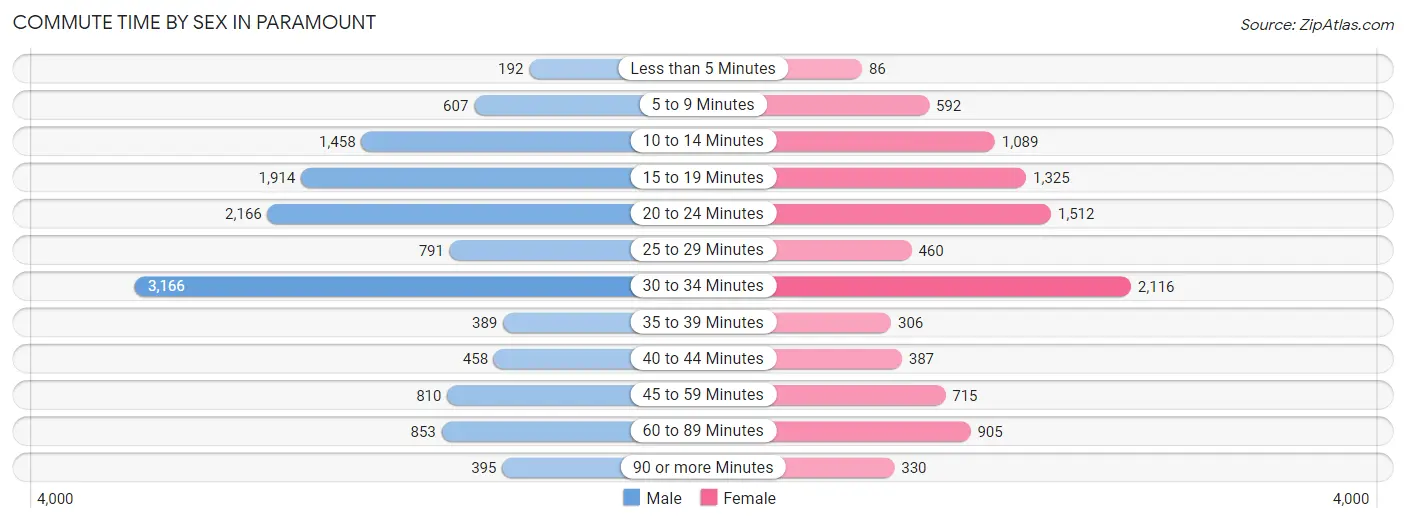
| Commute Time | Male | Female |
| Less than 5 Minutes | 192 (1.5%) | 86 (0.9%) |
| 5 to 9 Minutes | 607 (4.6%) | 592 (6.0%) |
| 10 to 14 Minutes | 1,458 (11.1%) | 1,089 (11.1%) |
| 15 to 19 Minutes | 1,914 (14.5%) | 1,325 (13.5%) |
| 20 to 24 Minutes | 2,166 (16.4%) | 1,512 (15.4%) |
| 25 to 29 Minutes | 791 (6.0%) | 460 (4.7%) |
| 30 to 34 Minutes | 3,166 (24.0%) | 2,116 (21.5%) |
| 35 to 39 Minutes | 389 (2.9%) | 306 (3.1%) |
| 40 to 44 Minutes | 458 (3.5%) | 387 (3.9%) |
| 45 to 59 Minutes | 810 (6.1%) | 715 (7.3%) |
| 60 to 89 Minutes | 853 (6.5%) | 905 (9.2%) |
| 90 or more Minutes | 395 (3.0%) | 330 (3.4%) |
Time of Departure to Work by Sex in Paramount
The most frequent times of departure to work in Paramount are 12:00 AM to 4:59 AM (1,991, 15.1%) for males and 7:00 AM to 7:29 AM (1,339, 13.6%) for females.
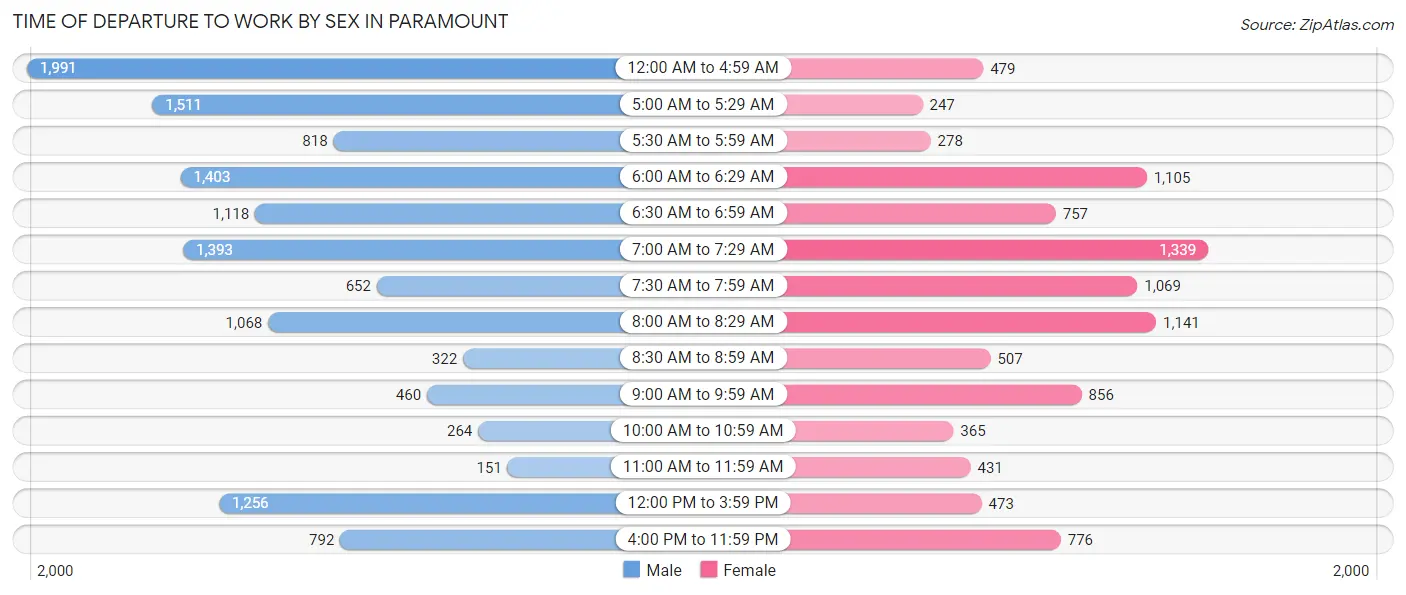
| Time of Departure | Male | Female |
| 12:00 AM to 4:59 AM | 1,991 (15.1%) | 479 (4.9%) |
| 5:00 AM to 5:29 AM | 1,511 (11.5%) | 247 (2.5%) |
| 5:30 AM to 5:59 AM | 818 (6.2%) | 278 (2.8%) |
| 6:00 AM to 6:29 AM | 1,403 (10.6%) | 1,105 (11.3%) |
| 6:30 AM to 6:59 AM | 1,118 (8.5%) | 757 (7.7%) |
| 7:00 AM to 7:29 AM | 1,393 (10.5%) | 1,339 (13.6%) |
| 7:30 AM to 7:59 AM | 652 (4.9%) | 1,069 (10.9%) |
| 8:00 AM to 8:29 AM | 1,068 (8.1%) | 1,141 (11.6%) |
| 8:30 AM to 8:59 AM | 322 (2.4%) | 507 (5.2%) |
| 9:00 AM to 9:59 AM | 460 (3.5%) | 856 (8.7%) |
| 10:00 AM to 10:59 AM | 264 (2.0%) | 365 (3.7%) |
| 11:00 AM to 11:59 AM | 151 (1.1%) | 431 (4.4%) |
| 12:00 PM to 3:59 PM | 1,256 (9.5%) | 473 (4.8%) |
| 4:00 PM to 11:59 PM | 792 (6.0%) | 776 (7.9%) |
| Total | 13,199 (100.0%) | 9,823 (100.0%) |
Housing Occupancy in Paramount
Occupancy by Ownership in Paramount
Of the total 14,366 dwellings in Paramount, owner-occupied units account for 5,837 (40.6%), while renter-occupied units make up 8,529 (59.4%).
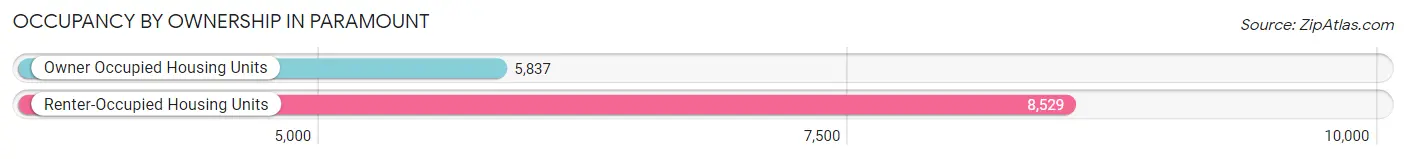
| Occupancy | # Housing Units | % Housing Units |
| Owner Occupied Housing Units | 5,837 | 40.6% |
| Renter-Occupied Housing Units | 8,529 | 59.4% |
| Total Occupied Housing Units | 14,366 | 100.0% |
Occupancy by Household Size in Paramount
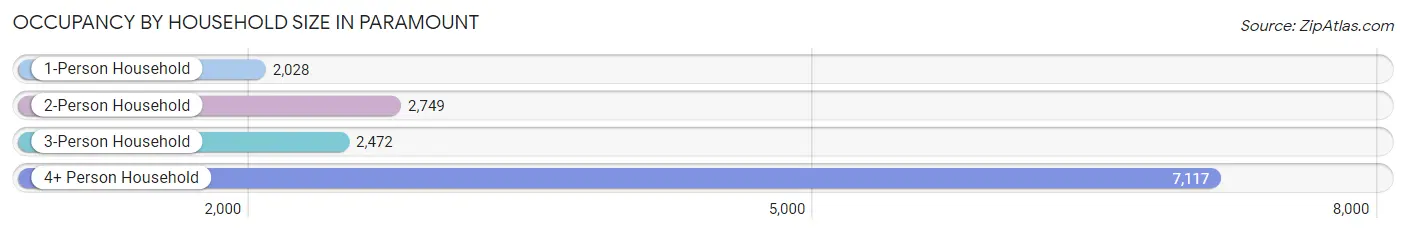
| Household Size | # Housing Units | % Housing Units |
| 1-Person Household | 2,028 | 14.1% |
| 2-Person Household | 2,749 | 19.1% |
| 3-Person Household | 2,472 | 17.2% |
| 4+ Person Household | 7,117 | 49.5% |
| Total Housing Units | 14,366 | 100.0% |
Occupancy by Ownership by Household Size in Paramount
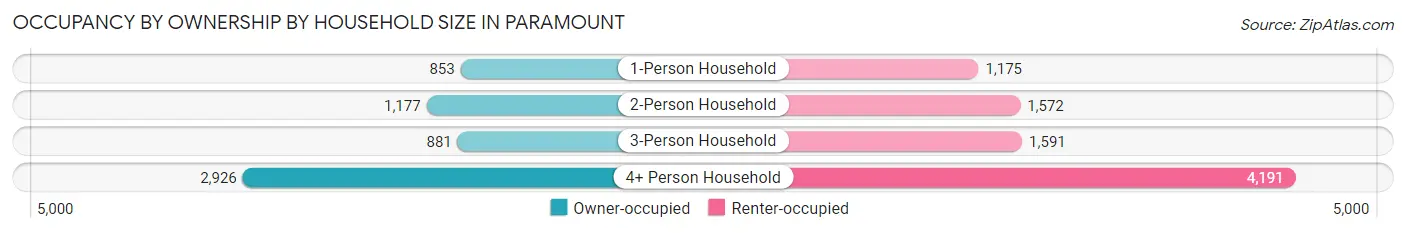
| Household Size | Owner-occupied | Renter-occupied |
| 1-Person Household | 853 (42.1%) | 1,175 (57.9%) |
| 2-Person Household | 1,177 (42.8%) | 1,572 (57.2%) |
| 3-Person Household | 881 (35.6%) | 1,591 (64.4%) |
| 4+ Person Household | 2,926 (41.1%) | 4,191 (58.9%) |
| Total Housing Units | 5,837 (40.6%) | 8,529 (59.4%) |
Occupancy by Educational Attainment in Paramount
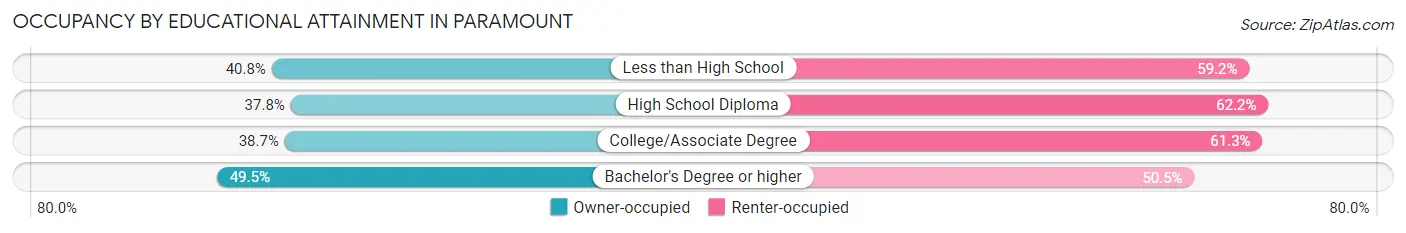
| Household Size | Owner-occupied | Renter-occupied |
| Less than High School | 1,857 (40.8%) | 2,693 (59.2%) |
| High School Diploma | 1,409 (37.8%) | 2,319 (62.2%) |
| College/Associate Degree | 1,594 (38.7%) | 2,521 (61.3%) |
| Bachelor's Degree or higher | 977 (49.5%) | 996 (50.5%) |
Occupancy by Age of Householder in Paramount
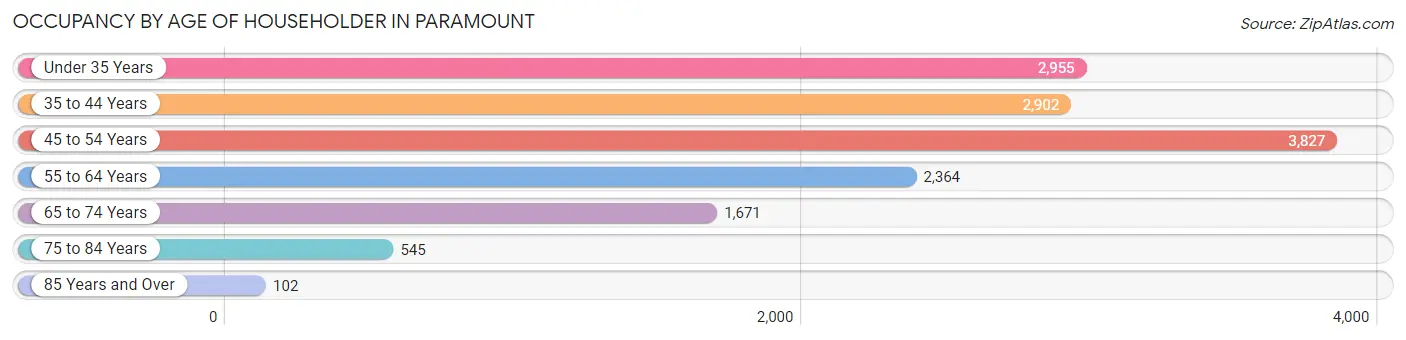
| Age Bracket | # Households | % Households |
| Under 35 Years | 2,955 | 20.6% |
| 35 to 44 Years | 2,902 | 20.2% |
| 45 to 54 Years | 3,827 | 26.6% |
| 55 to 64 Years | 2,364 | 16.5% |
| 65 to 74 Years | 1,671 | 11.6% |
| 75 to 84 Years | 545 | 3.8% |
| 85 Years and Over | 102 | 0.7% |
| Total | 14,366 | 100.0% |
Housing Finances in Paramount
Median Income by Occupancy in Paramount
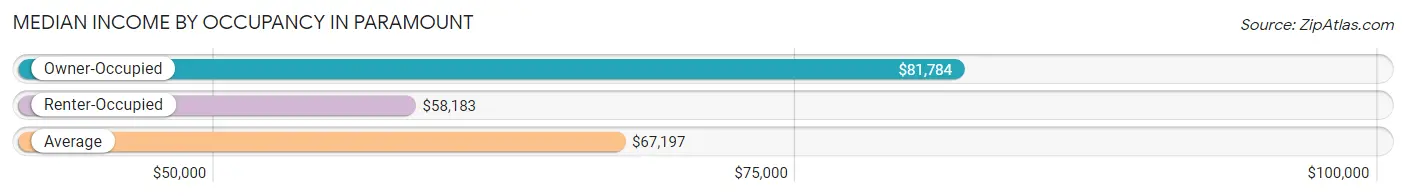
| Occupancy Type | # Households | Median Income |
| Owner-Occupied | 5,837 (40.6%) | $81,784 |
| Renter-Occupied | 8,529 (59.4%) | $58,183 |
| Average | 14,366 (100.0%) | $67,197 |
Occupancy by Householder Income Bracket in Paramount
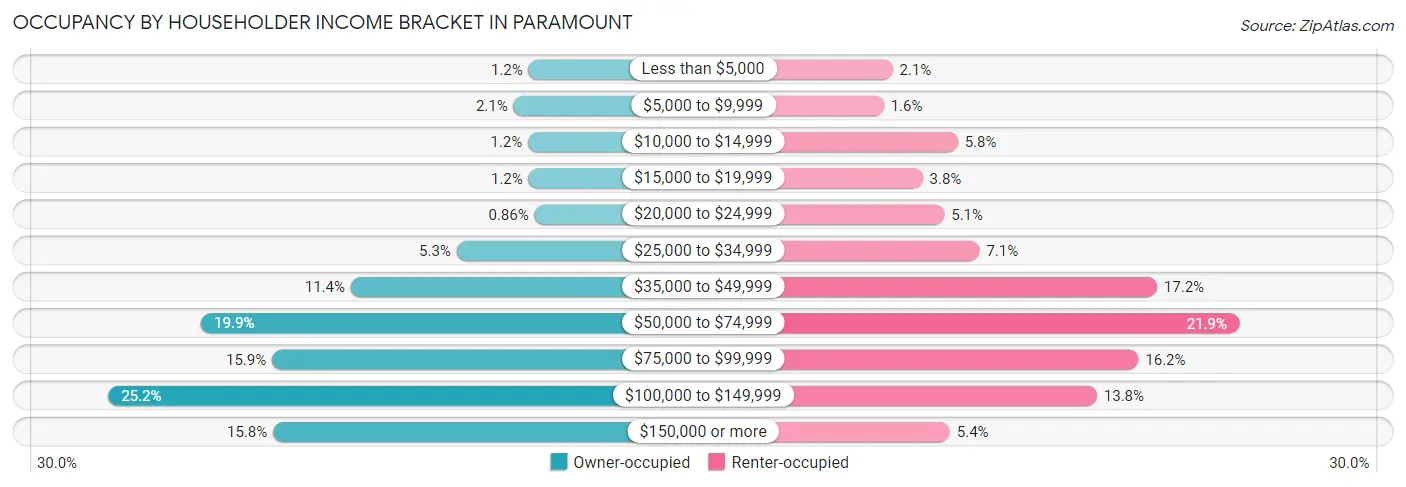
| Income Bracket | Owner-occupied | Renter-occupied |
| Less than $5,000 | 70 (1.2%) | 180 (2.1%) |
| $5,000 to $9,999 | 120 (2.1%) | 137 (1.6%) |
| $10,000 to $14,999 | 72 (1.2%) | 498 (5.8%) |
| $15,000 to $19,999 | 70 (1.2%) | 327 (3.8%) |
| $20,000 to $24,999 | 50 (0.9%) | 432 (5.1%) |
| $25,000 to $34,999 | 310 (5.3%) | 604 (7.1%) |
| $35,000 to $49,999 | 663 (11.4%) | 1,469 (17.2%) |
| $50,000 to $74,999 | 1,162 (19.9%) | 1,868 (21.9%) |
| $75,000 to $99,999 | 926 (15.9%) | 1,378 (16.2%) |
| $100,000 to $149,999 | 1,472 (25.2%) | 1,176 (13.8%) |
| $150,000 or more | 922 (15.8%) | 460 (5.4%) |
| Total | 5,837 (100.0%) | 8,529 (100.0%) |
Monthly Housing Cost Tiers in Paramount
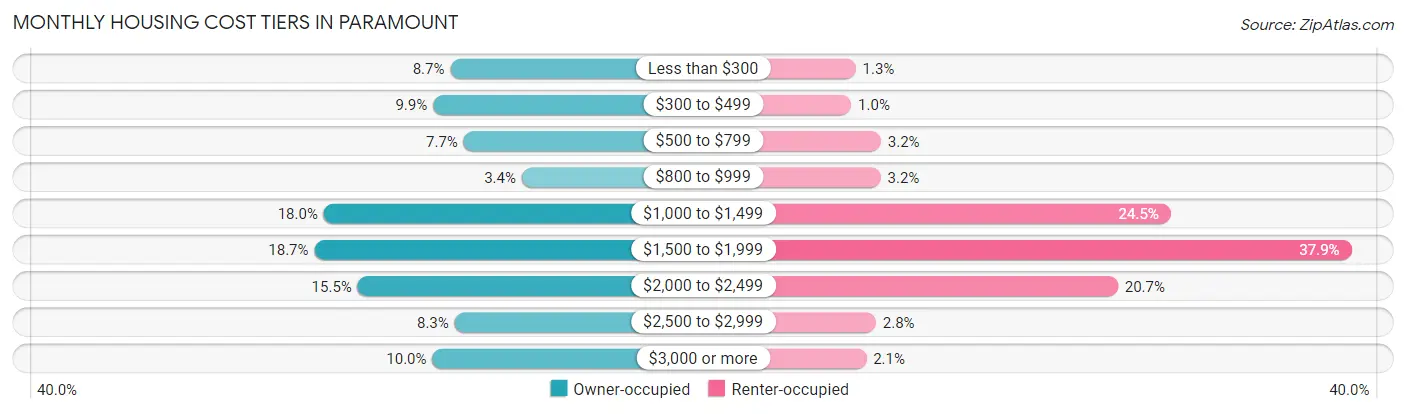
| Monthly Cost | Owner-occupied | Renter-occupied |
| Less than $300 | 505 (8.6%) | 114 (1.3%) |
| $300 to $499 | 579 (9.9%) | 86 (1.0%) |
| $500 to $799 | 447 (7.7%) | 273 (3.2%) |
| $800 to $999 | 197 (3.4%) | 271 (3.2%) |
| $1,000 to $1,499 | 1,049 (18.0%) | 2,093 (24.5%) |
| $1,500 to $1,999 | 1,089 (18.7%) | 3,228 (37.9%) |
| $2,000 to $2,499 | 903 (15.5%) | 1,761 (20.6%) |
| $2,500 to $2,999 | 486 (8.3%) | 241 (2.8%) |
| $3,000 or more | 582 (10.0%) | 181 (2.1%) |
| Total | 5,837 (100.0%) | 8,529 (100.0%) |
Physical Housing Characteristics in Paramount
Housing Structures in Paramount
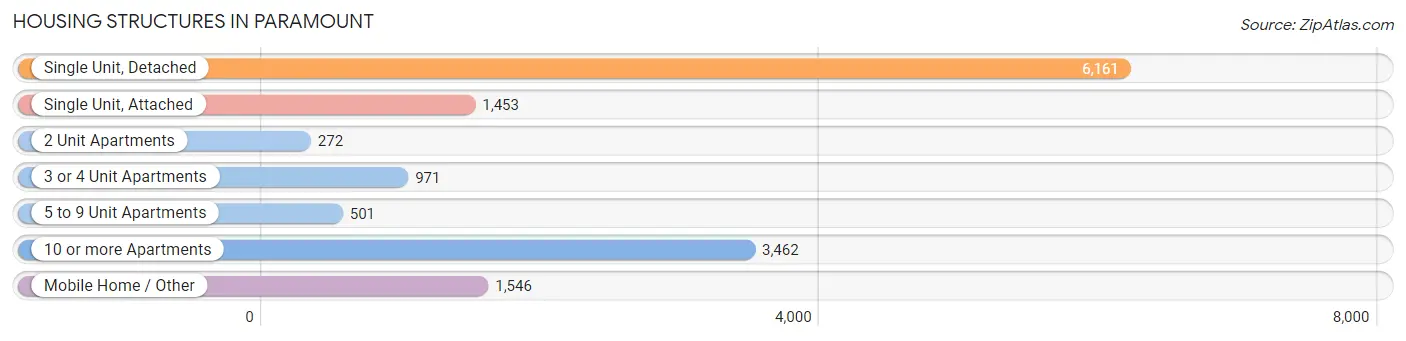
| Structure Type | # Housing Units | % Housing Units |
| Single Unit, Detached | 6,161 | 42.9% |
| Single Unit, Attached | 1,453 | 10.1% |
| 2 Unit Apartments | 272 | 1.9% |
| 3 or 4 Unit Apartments | 971 | 6.8% |
| 5 to 9 Unit Apartments | 501 | 3.5% |
| 10 or more Apartments | 3,462 | 24.1% |
| Mobile Home / Other | 1,546 | 10.8% |
| Total | 14,366 | 100.0% |
Housing Structures by Occupancy in Paramount
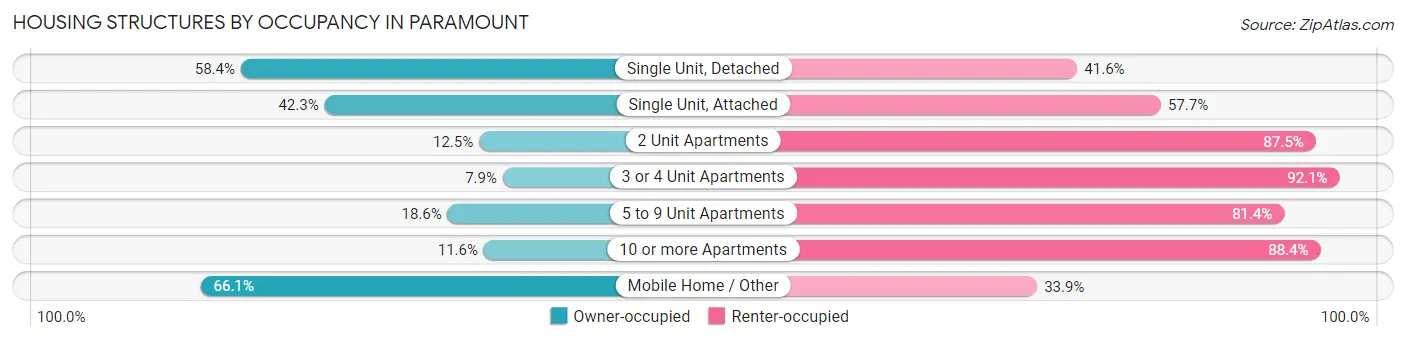
| Structure Type | Owner-occupied | Renter-occupied |
| Single Unit, Detached | 3,596 (58.4%) | 2,565 (41.6%) |
| Single Unit, Attached | 614 (42.3%) | 839 (57.7%) |
| 2 Unit Apartments | 34 (12.5%) | 238 (87.5%) |
| 3 or 4 Unit Apartments | 77 (7.9%) | 894 (92.1%) |
| 5 to 9 Unit Apartments | 93 (18.6%) | 408 (81.4%) |
| 10 or more Apartments | 401 (11.6%) | 3,061 (88.4%) |
| Mobile Home / Other | 1,022 (66.1%) | 524 (33.9%) |
| Total | 5,837 (40.6%) | 8,529 (59.4%) |
Housing Structures by Number of Rooms in Paramount
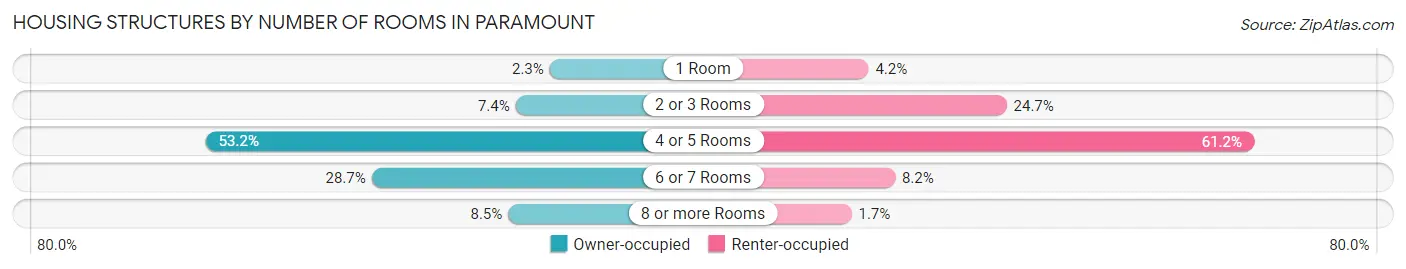
| Number of Rooms | Owner-occupied | Renter-occupied |
| 1 Room | 135 (2.3%) | 360 (4.2%) |
| 2 or 3 Rooms | 429 (7.3%) | 2,104 (24.7%) |
| 4 or 5 Rooms | 3,107 (53.2%) | 5,223 (61.2%) |
| 6 or 7 Rooms | 1,673 (28.7%) | 695 (8.2%) |
| 8 or more Rooms | 493 (8.5%) | 147 (1.7%) |
| Total | 5,837 (100.0%) | 8,529 (100.0%) |
Housing Structure by Heating Type in Paramount
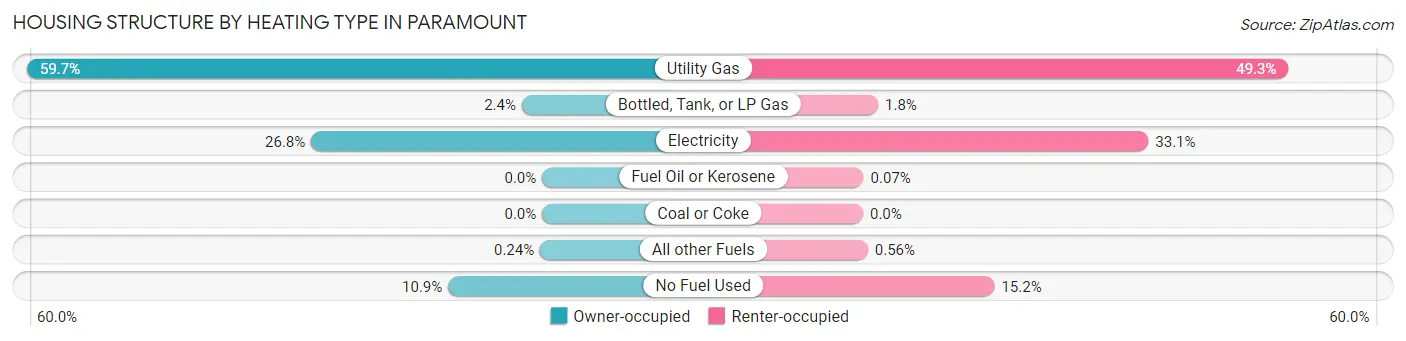
| Heating Type | Owner-occupied | Renter-occupied |
| Utility Gas | 3,487 (59.7%) | 4,205 (49.3%) |
| Bottled, Tank, or LP Gas | 137 (2.4%) | 149 (1.8%) |
| Electricity | 1,563 (26.8%) | 2,821 (33.1%) |
| Fuel Oil or Kerosene | 0 (0.0%) | 6 (0.1%) |
| Coal or Coke | 0 (0.0%) | 0 (0.0%) |
| All other Fuels | 14 (0.2%) | 48 (0.6%) |
| No Fuel Used | 636 (10.9%) | 1,300 (15.2%) |
| Total | 5,837 (100.0%) | 8,529 (100.0%) |
Household Vehicle Usage in Paramount

| Vehicles per Household | Owner-occupied | Renter-occupied |
| No Vehicle | 148 (2.5%) | 485 (5.7%) |
| 1 Vehicle | 1,074 (18.4%) | 2,785 (32.7%) |
| 2 Vehicles | 2,264 (38.8%) | 3,197 (37.5%) |
| 3 or more Vehicles | 2,351 (40.3%) | 2,062 (24.2%) |
| Total | 5,837 (100.0%) | 8,529 (100.0%) |
Real Estate & Mortgages in Paramount
Real Estate and Mortgage Overview in Paramount
| Characteristic | Without Mortgage | With Mortgage |
| Housing Units | 2,131 | 3,706 |
| Median Property Value | $311,400 | $533,000 |
| Median Household Income | $71,525 | $692 |
| Monthly Housing Costs | $500 | $571 |
| Real Estate Taxes | $1,744 | $55 |
Property Value by Mortgage Status in Paramount
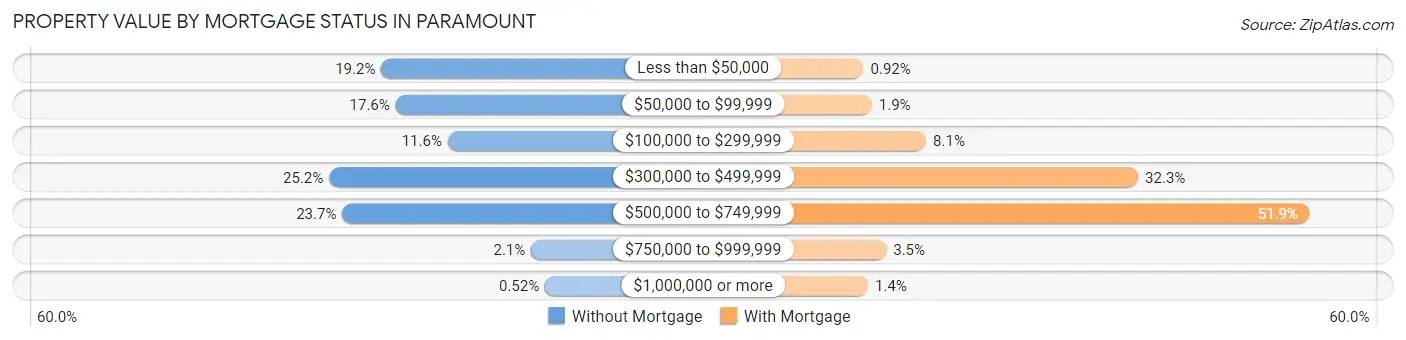
| Property Value | Without Mortgage | With Mortgage |
| Less than $50,000 | 410 (19.2%) | 34 (0.9%) |
| $50,000 to $99,999 | 375 (17.6%) | 69 (1.9%) |
| $100,000 to $299,999 | 248 (11.6%) | 299 (8.1%) |
| $300,000 to $499,999 | 537 (25.2%) | 1,197 (32.3%) |
| $500,000 to $749,999 | 505 (23.7%) | 1,924 (51.9%) |
| $750,000 to $999,999 | 45 (2.1%) | 130 (3.5%) |
| $1,000,000 or more | 11 (0.5%) | 53 (1.4%) |
| Total | 2,131 (100.0%) | 3,706 (100.0%) |
Household Income by Mortgage Status in Paramount
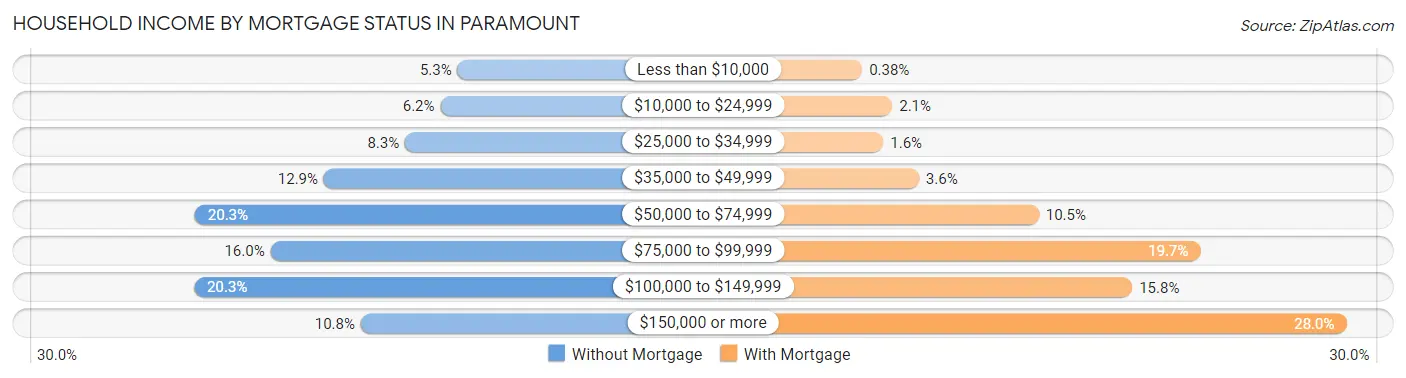
| Household Income | Without Mortgage | With Mortgage |
| Less than $10,000 | 112 (5.3%) | 14 (0.4%) |
| $10,000 to $24,999 | 133 (6.2%) | 78 (2.1%) |
| $25,000 to $34,999 | 176 (8.3%) | 59 (1.6%) |
| $35,000 to $49,999 | 275 (12.9%) | 134 (3.6%) |
| $50,000 to $74,999 | 432 (20.3%) | 388 (10.5%) |
| $75,000 to $99,999 | 340 (16.0%) | 730 (19.7%) |
| $100,000 to $149,999 | 433 (20.3%) | 586 (15.8%) |
| $150,000 or more | 230 (10.8%) | 1,039 (28.0%) |
| Total | 2,131 (100.0%) | 3,706 (100.0%) |
Property Value to Household Income Ratio in Paramount
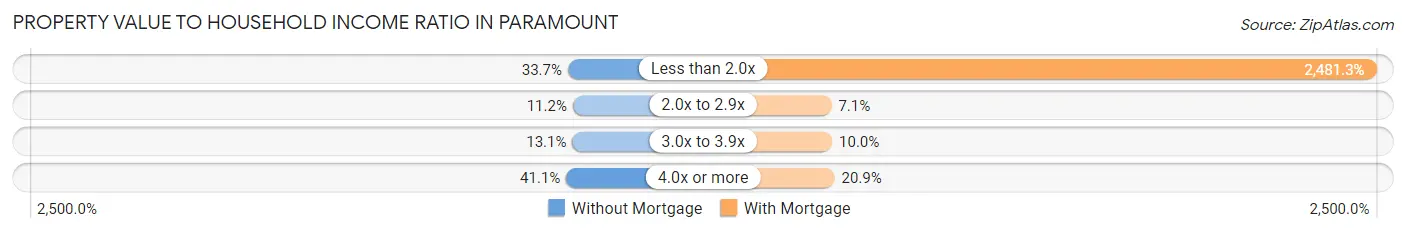
| Value-to-Income Ratio | Without Mortgage | With Mortgage |
| Less than 2.0x | 717 (33.7%) | 91,955 (2,481.2%) |
| 2.0x to 2.9x | 239 (11.2%) | 263 (7.1%) |
| 3.0x to 3.9x | 280 (13.1%) | 371 (10.0%) |
| 4.0x or more | 876 (41.1%) | 776 (20.9%) |
| Total | 2,131 (100.0%) | 3,706 (100.0%) |
Real Estate Taxes by Mortgage Status in Paramount
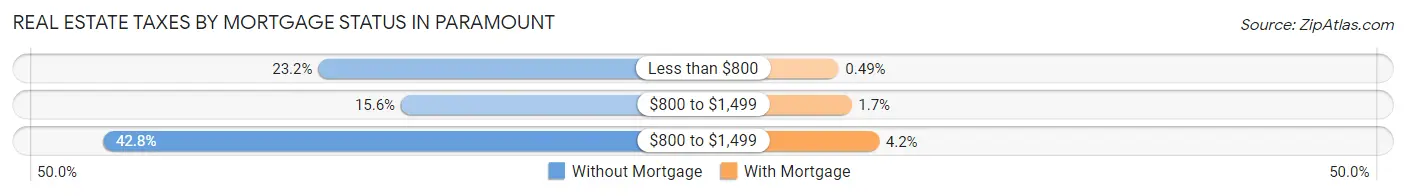
| Property Taxes | Without Mortgage | With Mortgage |
| Less than $800 | 494 (23.2%) | 18 (0.5%) |
| $800 to $1,499 | 333 (15.6%) | 62 (1.7%) |
| $800 to $1,499 | 913 (42.8%) | 155 (4.2%) |
| Total | 2,131 (100.0%) | 3,706 (100.0%) |
Health & Disability in Paramount
Health Insurance Coverage by Age in Paramount
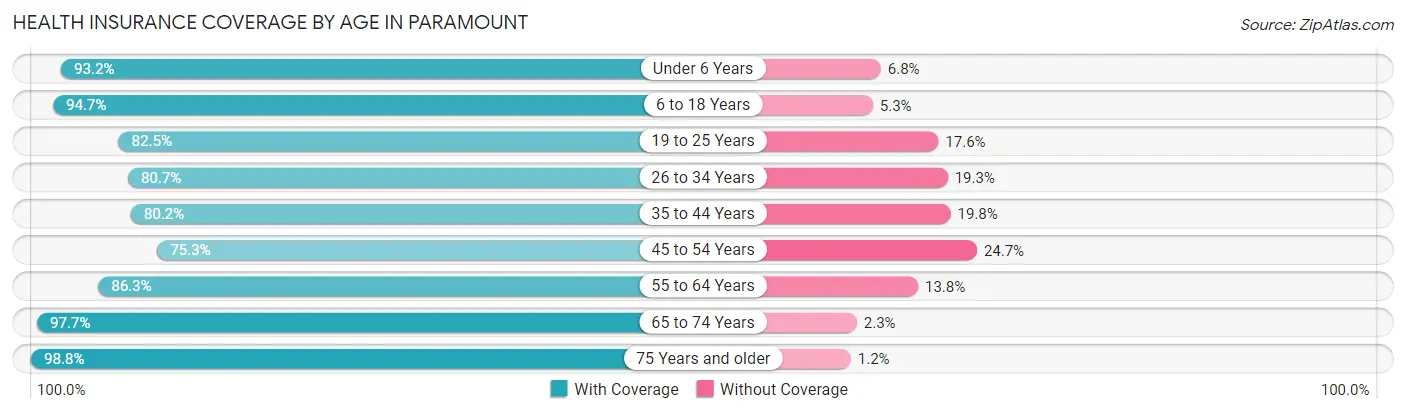
| Age Bracket | With Coverage | Without Coverage |
| Under 6 Years | 3,716 (93.2%) | 272 (6.8%) |
| 6 to 18 Years | 10,766 (94.7%) | 605 (5.3%) |
| 19 to 25 Years | 5,023 (82.5%) | 1,069 (17.5%) |
| 26 to 34 Years | 6,110 (80.7%) | 1,459 (19.3%) |
| 35 to 44 Years | 5,282 (80.2%) | 1,306 (19.8%) |
| 45 to 54 Years | 5,737 (75.3%) | 1,886 (24.7%) |
| 55 to 64 Years | 4,347 (86.3%) | 693 (13.8%) |
| 65 to 74 Years | 2,920 (97.7%) | 70 (2.3%) |
| 75 Years and older | 1,619 (98.8%) | 20 (1.2%) |
| Total | 45,520 (86.1%) | 7,380 (14.0%) |
Health Insurance Coverage by Citizenship Status in Paramount
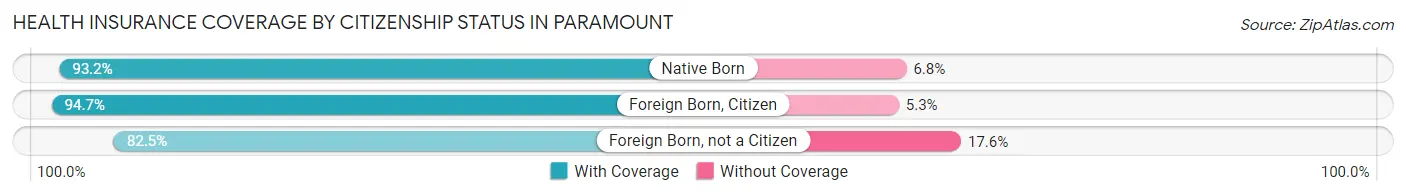
| Citizenship Status | With Coverage | Without Coverage |
| Native Born | 3,716 (93.2%) | 272 (6.8%) |
| Foreign Born, Citizen | 10,766 (94.7%) | 605 (5.3%) |
| Foreign Born, not a Citizen | 5,023 (82.5%) | 1,069 (17.5%) |
Health Insurance Coverage by Household Income in Paramount
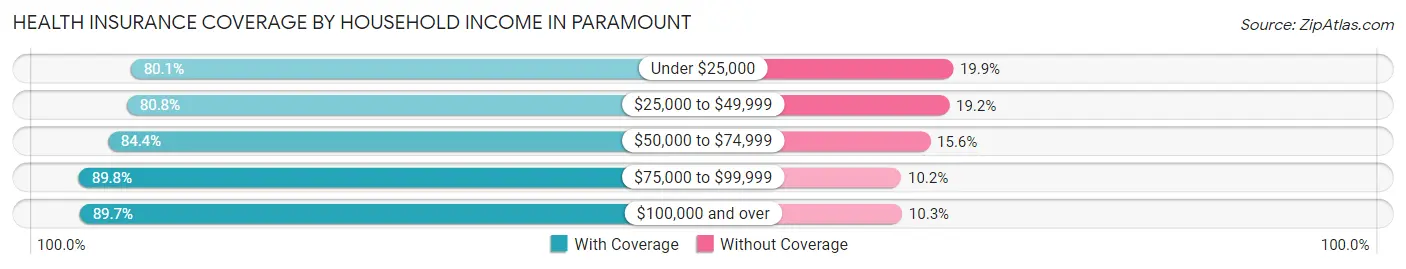
| Household Income | With Coverage | Without Coverage |
| Under $25,000 | 3,646 (80.1%) | 905 (19.9%) |
| $25,000 to $49,999 | 8,555 (80.8%) | 2,027 (19.2%) |
| $50,000 to $74,999 | 8,914 (84.4%) | 1,649 (15.6%) |
| $75,000 to $99,999 | 7,923 (89.8%) | 896 (10.2%) |
| $100,000 and over | 16,464 (89.7%) | 1,896 (10.3%) |
Public vs Private Health Insurance Coverage by Age in Paramount
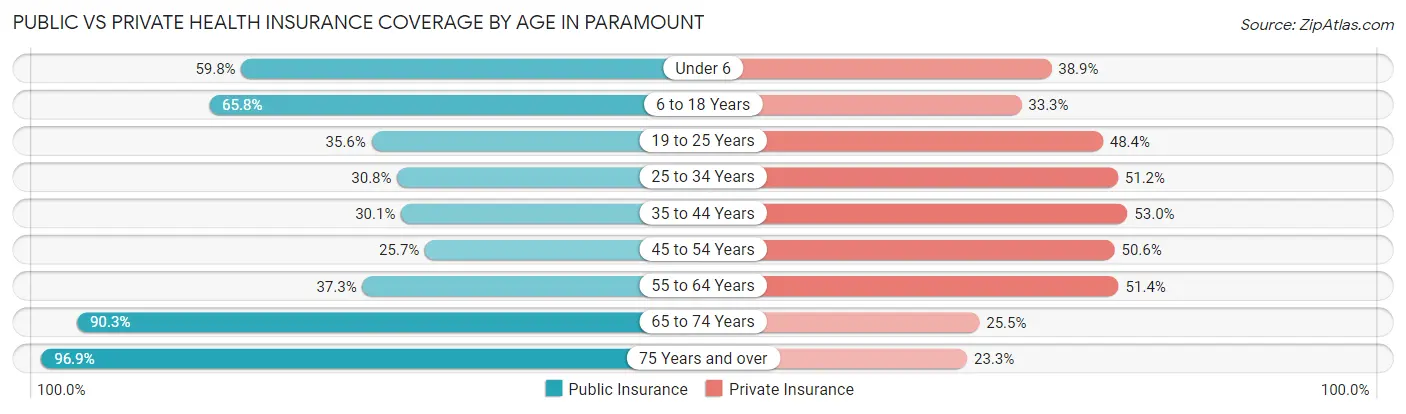
| Age Bracket | Public Insurance | Private Insurance |
| Under 6 | 2,383 (59.8%) | 1,551 (38.9%) |
| 6 to 18 Years | 7,478 (65.8%) | 3,790 (33.3%) |
| 19 to 25 Years | 2,168 (35.6%) | 2,951 (48.4%) |
| 25 to 34 Years | 2,332 (30.8%) | 3,878 (51.2%) |
| 35 to 44 Years | 1,982 (30.1%) | 3,492 (53.0%) |
| 45 to 54 Years | 1,955 (25.7%) | 3,859 (50.6%) |
| 55 to 64 Years | 1,879 (37.3%) | 2,590 (51.4%) |
| 65 to 74 Years | 2,699 (90.3%) | 763 (25.5%) |
| 75 Years and over | 1,588 (96.9%) | 381 (23.3%) |
| Total | 24,464 (46.3%) | 23,255 (44.0%) |
Disability Status by Sex by Age in Paramount
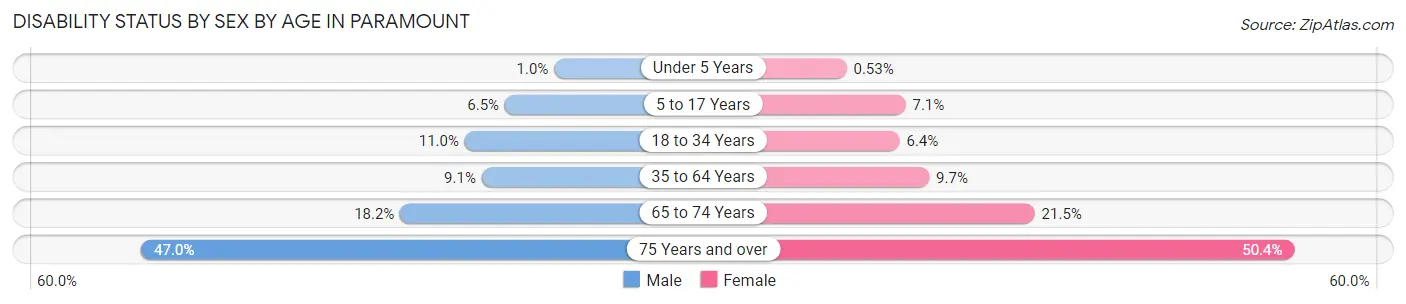
| Age Bracket | Male | Female |
| Under 5 Years | 17 (1.0%) | 8 (0.5%) |
| 5 to 17 Years | 375 (6.5%) | 379 (7.1%) |
| 18 to 34 Years | 827 (11.0%) | 464 (6.4%) |
| 35 to 64 Years | 841 (9.1%) | 973 (9.7%) |
| 65 to 74 Years | 276 (18.2%) | 316 (21.5%) |
| 75 Years and over | 293 (47.0%) | 512 (50.4%) |
Disability Class by Sex by Age in Paramount
Disability Class: Hearing Difficulty
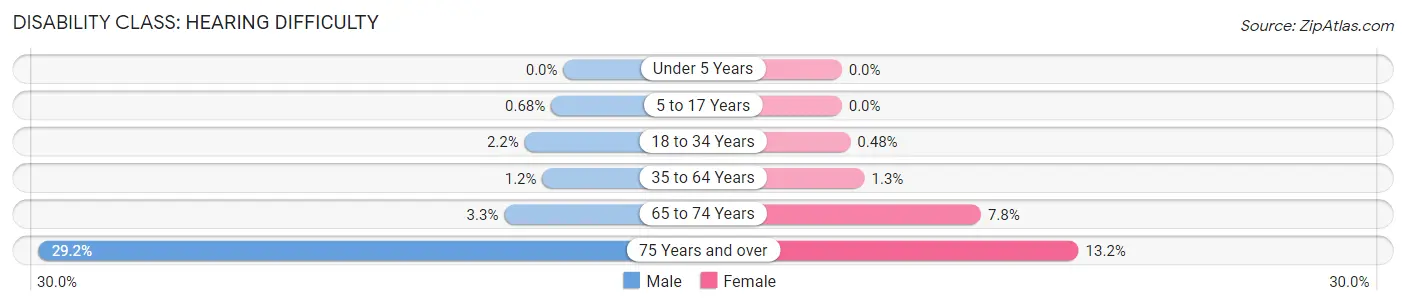
| Age Bracket | Male | Female |
| Under 5 Years | 0 (0.0%) | 0 (0.0%) |
| 5 to 17 Years | 39 (0.7%) | 0 (0.0%) |
| 18 to 34 Years | 163 (2.2%) | 35 (0.5%) |
| 35 to 64 Years | 108 (1.2%) | 127 (1.3%) |
| 65 to 74 Years | 50 (3.3%) | 114 (7.7%) |
| 75 Years and over | 182 (29.2%) | 134 (13.2%) |
Disability Class: Vision Difficulty
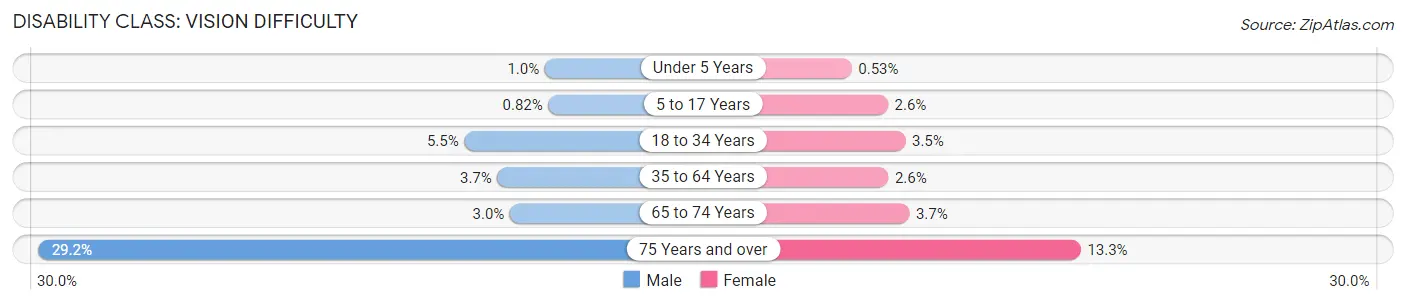
| Age Bracket | Male | Female |
| Under 5 Years | 17 (1.0%) | 8 (0.5%) |
| 5 to 17 Years | 47 (0.8%) | 136 (2.5%) |
| 18 to 34 Years | 414 (5.5%) | 254 (3.5%) |
| 35 to 64 Years | 339 (3.7%) | 257 (2.6%) |
| 65 to 74 Years | 45 (3.0%) | 55 (3.7%) |
| 75 Years and over | 182 (29.2%) | 135 (13.3%) |
Disability Class: Cognitive Difficulty
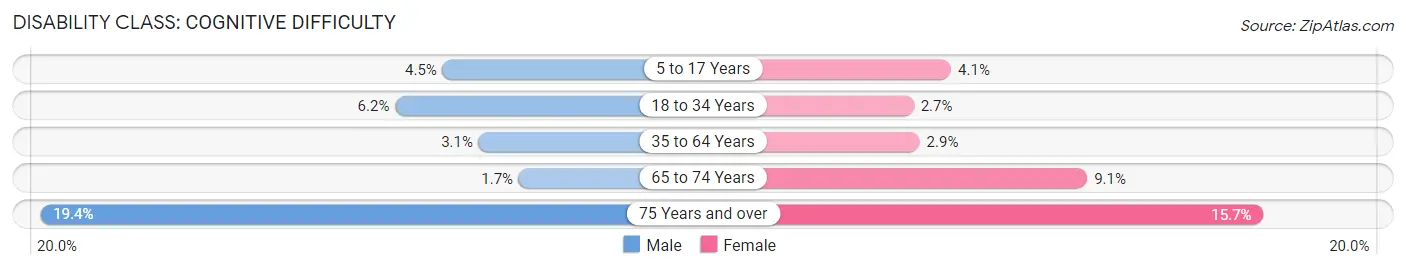
| Age Bracket | Male | Female |
| 5 to 17 Years | 258 (4.5%) | 217 (4.1%) |
| 18 to 34 Years | 470 (6.2%) | 193 (2.7%) |
| 35 to 64 Years | 291 (3.1%) | 289 (2.9%) |
| 65 to 74 Years | 25 (1.7%) | 134 (9.1%) |
| 75 Years and over | 121 (19.4%) | 159 (15.7%) |
Disability Class: Ambulatory Difficulty
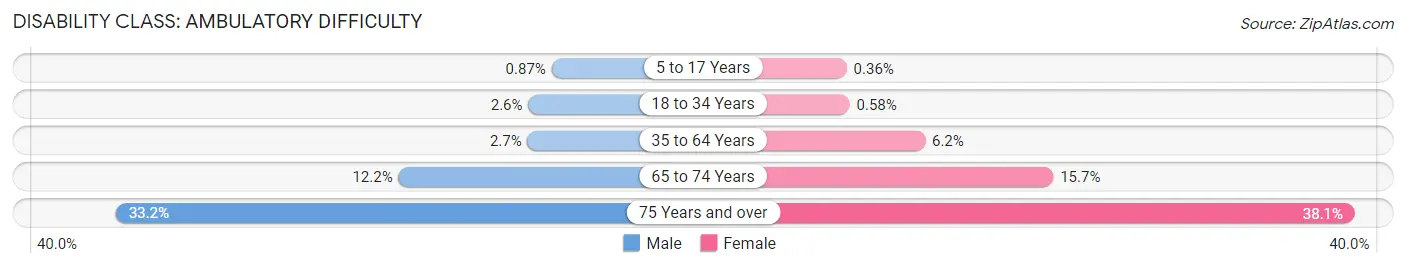
| Age Bracket | Male | Female |
| 5 to 17 Years | 50 (0.9%) | 19 (0.4%) |
| 18 to 34 Years | 196 (2.6%) | 42 (0.6%) |
| 35 to 64 Years | 246 (2.7%) | 618 (6.2%) |
| 65 to 74 Years | 186 (12.2%) | 231 (15.7%) |
| 75 Years and over | 207 (33.2%) | 387 (38.1%) |
Disability Class: Self-Care Difficulty
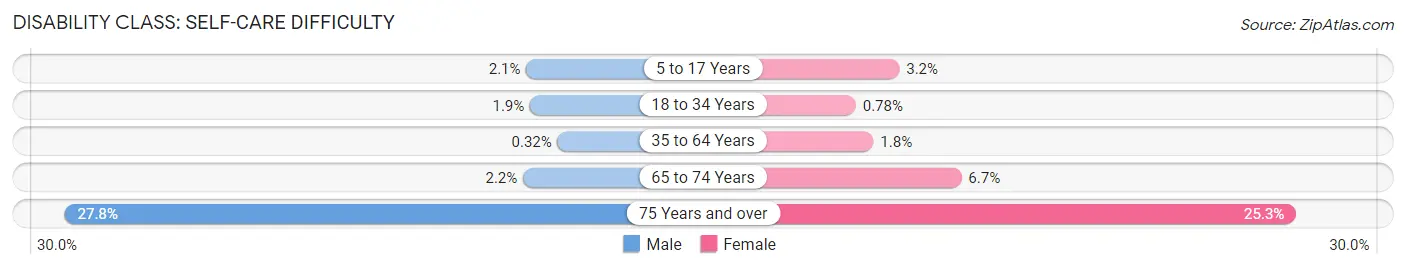
| Age Bracket | Male | Female |
| 5 to 17 Years | 119 (2.1%) | 171 (3.2%) |
| 18 to 34 Years | 139 (1.8%) | 56 (0.8%) |
| 35 to 64 Years | 30 (0.3%) | 176 (1.8%) |
| 65 to 74 Years | 34 (2.2%) | 98 (6.7%) |
| 75 Years and over | 173 (27.8%) | 257 (25.3%) |
Technology Access in Paramount
Computing Device Access in Paramount
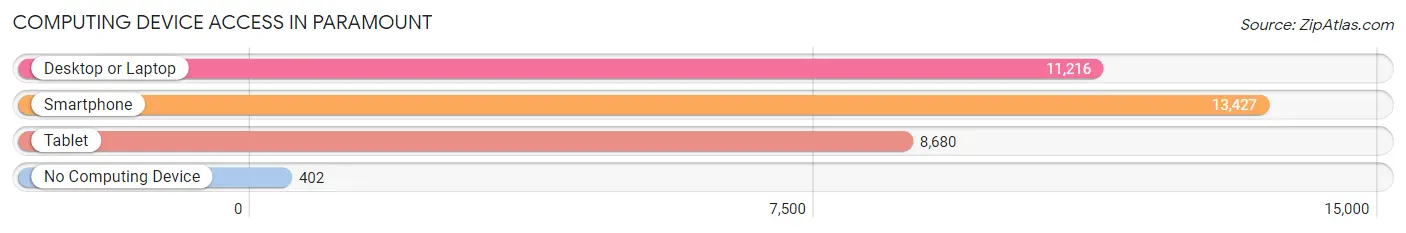
| Device Type | # Households | % Households |
| Desktop or Laptop | 11,216 | 78.1% |
| Smartphone | 13,427 | 93.5% |
| Tablet | 8,680 | 60.4% |
| No Computing Device | 402 | 2.8% |
| Total | 14,366 | 100.0% |
Internet Access in Paramount
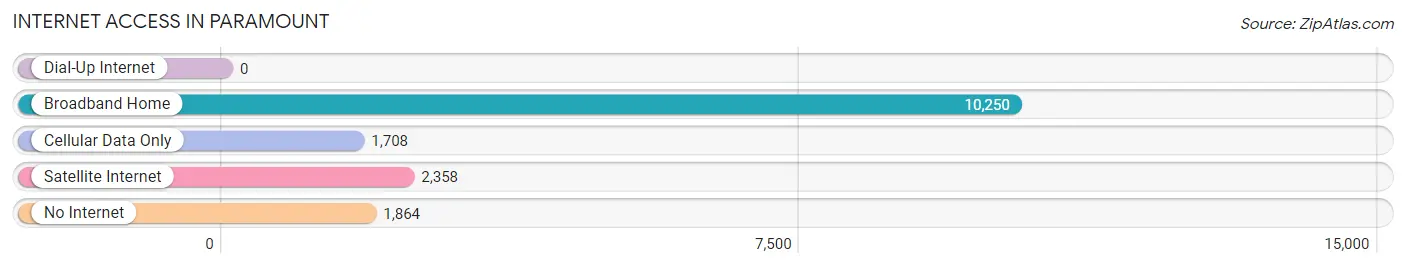
| Internet Type | # Households | % Households |
| Dial-Up Internet | 0 | 0.0% |
| Broadband Home | 10,250 | 71.4% |
| Cellular Data Only | 1,708 | 11.9% |
| Satellite Internet | 2,358 | 16.4% |
| No Internet | 1,864 | 13.0% |
| Total | 14,366 | 100.0% |
Paramount Summary
Paramount is a city located in Los Angeles County, California, United States. The population was 54,098 at the 2010 census, up from 53,155 at the 2000 census. Paramount is part of the Greater Los Angeles Area and is bordered by the cities of Downey, South Gate, Lynwood, and Compton.
History
Paramount was founded in the late 19th century by settlers from the Midwest. The city was named after Paramount Boulevard, which was the main thoroughfare in the area. The city was incorporated in 1957 and has since grown to become one of the largest cities in Los Angeles County.
Geography
Paramount is located at 33°53′N 118°9′W (33.88, -118.15). According to the United States Census Bureau, the city has a total area of 5.2 square miles (13.4 km2), all of it land.
Economy
Paramount is home to a variety of businesses, including manufacturing, retail, and service industries. The city is also home to Paramount Studios, one of the oldest and most successful movie studios in the world. The studio has been in operation since 1912 and is responsible for producing some of the most iconic films in history, including The Godfather, The Ten Commandments, and The Wizard of Oz.
Demographics
As of the 2010 census, there were 54,098 people, 15,845 households, and 12,845 families residing in the city. The population density was 10,400.7 people per square mile (4,019.2/km2). There were 16,845 housing units at an average density of 3,231.3 per square mile (1,245.2/km2). The racial makeup of the city was 44.2% White, 4.2% African American, 1.2% Native American, 2.2% Asian, 0.2% Pacific Islander, 45.2% from other races, and 3.0% from two or more races. Hispanic or Latino of any race were 81.2% of the population.
There were 15,845 households, out of which 46.2% had children under the age of 18 living with them, 51.2% were married couples living together, 19.2% had a female householder with no husband present, and 22.2% were non-families. 17.3% of all households were made up of individuals, and 6.2% had someone living alone who was 65 years of age or older. The average household size was 3.38 and the average family size was 3.81.
In the city, the population was spread out, with 33.2% under the age of 18, 10.7% from 18 to 24, 30.2% from 25 to 44, 17.7% from 45 to 64, and 8.2% who were 65 years of age or older. The median age was 29 years. For every 100 females, there were 97.2 males. For every 100 females age 18 and over, there were 94.2 males.
The median income for a household in the city was $35,945, and the median income for a family was $38,945. Males had a median income of $30,945 versus $25,945 for females. The per capita income for the city was $13,945. About 16.2% of families and 18.7% of the population were below the poverty line, including 25.2% of those under age 18 and 11.2% of those age 65 or over.
Common Questions
What is Per Capita Income in Paramount?
Per Capita income in Paramount is $23,277.
What is the Median Family Income in Paramount?
Median Family Income in Paramount is $70,217.
What is the Median Household income in Paramount?
Median Household Income in Paramount is $67,197.
What is Income or Wage Gap in Paramount?
Income or Wage Gap in Paramount is 22.1%.
Women in Paramount earn 77.9 cents for every dollar earned by a man.
What is Family Income Deficit in Paramount?
Family Income Deficit in Paramount is $10,255.
Families that are below poverty line in Paramount earn $10,255 less on average than the poverty threshold level.
What is Inequality or Gini Index in Paramount?
Inequality or Gini Index in Paramount is 0.40.
What is the Total Population of Paramount?
Total Population of Paramount is 53,255.
What is the Total Male Population of Paramount?
Total Male Population of Paramount is 26,543.
What is the Total Female Population of Paramount?
Total Female Population of Paramount is 26,712.
What is the Ratio of Males per 100 Females in Paramount?
There are 99.37 Males per 100 Females in Paramount.
What is the Ratio of Females per 100 Males in Paramount?
There are 100.64 Females per 100 Males in Paramount.
What is the Median Population Age in Paramount?
Median Population Age in Paramount is 31.9 Years.
What is the Average Family Size in Paramount
Average Family Size in Paramount is 4.0 People.
What is the Average Household Size in Paramount
Average Household Size in Paramount is 3.7 People.
How Large is the Labor Force in Paramount?
There are 26,716 People in the Labor Forcein in Paramount.
What is the Percentage of People in the Labor Force in Paramount?
65.7% of People are in the Labor Force in Paramount.
What is the Unemployment Rate in Paramount?
Unemployment Rate in Paramount is 5.3%.